fill ill id ifi 11111 fill 1111
TRANSCRIPT
UPPER AND CHARACTERIS
PERPUSTAKAAN UMP
fill Ill ID Ifi 11111 fill 1111 0000073658
)-CHEMICAL , A BASELINE
i) I Vu i
MOHD AZIM BIN ABDUL HALIM
Report submitted in partial fulfilment of the requirements for the award of Bachelor of Applied Science (Honours) in
Industrial Chemistry
£: ••1 '-4.i \
Faculty of Industrial Science & Technology UNIVERSITI MALAYSIA PAHANG
2012
V
ABSTRACT
A study is carried out on physico-chemical characteristics, anions and heavy metal concentration in several upper and lower sites of Pahang River. Jelai River, Tembeling River, Temerloh, Kampung Belimbing, Kampung Temai and Pekan were chosen as the sampling site. Sampling activities is done once in two weeks for three months period. The physical and chemical characteristics analyses includes six water parameters including pH, biochemical oxygen demand (BOD), chemical oxygen demand (COD), total suspended solids (TSS), ammoniacal nitrogen and dissolved oxygen (DO). Common heavy metals such as lead, copper and cadmium are determined spectroscopically. Six anions are used as standard including fluoride, chloride, bromide, nitrate, phosphate and sulphate to determine the presence of anions in the samples. Phosphate is the only anion which is not detected in all the samples. In heavy metals analysis, only copper. is detected in the samples while cadmium and lead are not detected. The yalues of BOD and COD are increasing due to increasing demand of oxygen as the river flows to the lower part before discharging to the sea. Tembeling River shows the lowest value of TSS as the river is less turbid than other five rivers. DO in all water samples are decreasing due to decreasing of oxygen solubility in the lower parts of Pahang River.
vi
ABSTRAK
Satu kajian telah dilakukan berkaitan ciri-ciri fiziko-kimia, anion dan kepekatan logam berat di beberapa tempat di hulu clan hilir Sungai Pahang. Sungai Jelai, Sungai Tembeling, Temerloh, Kampung Belimbing, Kampung Temai dan Pekan telah dipilih sebagai lokasi pensampelan. Aktiviti pensampelan telah dilakukan sekali dalam dua minggu berterusan selama tiga bulan. Analisis ciri-ciri fizikal dan kimia termasuk enam parameter air iaitu pH, BOD, COD, jumlah pepejal terampai (TSS), NH3-N dan oksigen terlarut. Logam berat termasuk kuprum, plumbum dan kadmium ditentukan melalui spektroskopi. Enam standard anion seperti fluoride, kiorida, bromida, nitrat, fosfat clan sulfat telah digunakan untuk menentukan kehadiran anion dalam sampel air. Fosfat merupakan satu-satunya anion yang tidak dikesan dalam semua sampel air. Dalam analisis logam berat, hanya kuprum dikesan terdapat dalam sampel air manakala plumbum dan kadmium tidak dikesan. Nilai BOD dan COD bertambah kerana kehendak oksigen juga bertambah semasa sungai mengalir ke hilir sungai sebelum dilepaskan ke laut. Sungai Tembeling menunjukkan jumlah TSS yang paling sedikit kerana sungai mi kurang keruh berbanding lima sungai yang lain. Berlaku pengurangan DO dalam semua sampel air kerana berkurangnya larutan oksigen di hilir Sungai Pahang.
VII
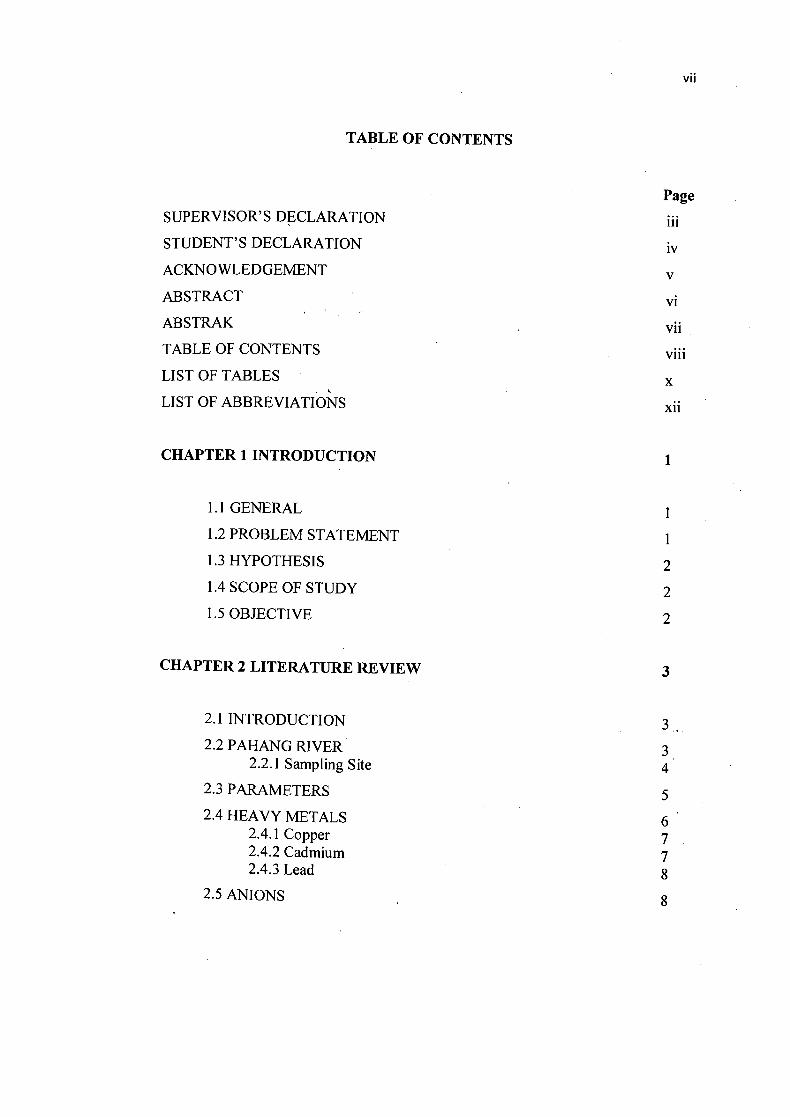
TABLE OF CONTENTS
Page SUPERVISOR'S DECLARATION
STUDENT'S DECLARATION iv ACKNOWLEDGEMENT
ABSTRACT
ABSTRAK
TABLE OF CONTENTS
LIST OF TABLES
LIST OF ABBREVIATIONS xii
CHAPTER 1 INTRODUCTION 1
1.1 GENERAL
1.2 PROBLEM STATEMENT 1 1.3 HYPOTHESIS 2 1.4 SCOPE OF STUDY 2 1.5 OBJECTIVE 2
CHAPTER 2 LITERATURE REVIEW 3
2.1 INTRODUCTION 3.. 2.2 PAHANG RIVER
2.2.1 Sampling Site 4 2.3 PARAMETERS 5 2.4 HEAVY METALS 6
2.4.1 Copper 7 2.4.2 Cadmium 7 2.4.3 Lead 8
2.5 ANIONS . 8
VIII
CHAPTER 3 METHODOLOGY 9
3.1 EXPERIMENTAL DESIGN 9 3. 1.1 Experimental Variables/Parameters 9 3.1.2 Sampling Design & Methods 10 3.1.3 'Data Collection (Measurement) Methods 10 3.1.4 Data Evaluation & Analysis Methods 11 3.1.5 Research Plan 11
i. Flow Sheet 11 ii. Resources deployment 12
3.2 EQUIPMENTS &INSTRUMENTS 12
3.3 MATERIALS 12
3.4 PROCEDURES 13
CHAPTER 4 RESULTS AND DISCUSSIONS 16
4.1 ANIONS 16
4.1.1 Fluoride 16 4.1.2 Chloride 18 4.1.3 Bromide 19 4.1.4 Nitrate 21 4.1.5 Phosphate 22 4.1.6 Sulphate 24
4.2 HEAVY METALS 25
4.2.1 Copper 25 4.2.2 Cadmium 27 4.2.3 Lead 28
4.3 PHYSICO-CHEMICAL CHARACTERISTICS 30
4.4 DISCUSSIONS 32
CHAPTER 5 CONCLUSION 35
REFERENCES 36
APPENDICES 38
LIST OF TABLES
Table No. Page
3.1 Parameters and Measurement 12 4.1 Concentration (ppm) vs Peak Area (mV s') of Fluoride Ion 16 4.2 Fluoride concentration in sample 17 4.3 Concentration (ppm) vs Peak Area (mV s 1 ) of Chloride Ion 18 4.4 Chloride concentration in sample 19 4.5 Concentration (ppm) vs Peak Area (mV s) of Bromide Ion 19 4.6 Bromide concentration in sample 20 4.7 Concentration (ppm) vs Peak Area (mV s') of Nitrate Ion 21 4.8 Nitrate concentration in sample 22 4.9 Concentration (ppm) vs Peak Area (mV s) of Phosphate Ion 22 4.10 Phosphate concentration in sample 23 4.11 Concentration (ppm) vs Peak Area (mV s) of Sulphate Ion 24 4.12 Sulphate concentration in sample 25 4.13 Copper (Cu) Concentration (ppm) vs Absorbance. Experimental
Conditions: Wavelength 324.8 nm; Acetylene - Air Mixture Flow Rate 4 liters/minute (Acetylene) 26
4.14 Copper concentrations in sample 27 4.15 Cadmium (Cd) Concentration (ppm) vs Absorbance. Experimental
Conditions: Wavelength 228.8 nm; Acetylene - Air Mixture Flow Rate 4 liters/minute (Acetylene) 27
4.16 Cadmium concentration in sample (ppm) 28 4.17 Lead (Pb) Concentration (ppm) vs Absorbance. Experimental
Conditions: Wavelength 283.3 nm; Acetylene - Air Mixture Flow Rate 4 liters/minute (Acetylene) 29
4.18 Lead concentration in sample 30 4.19 Raw Data of physico-chemical characteristics 31
Ix
LIST OF FIGURES
Figure No. Page 4.1 Calibration Curve for Fluoride. Experimental Conditions:
Anion Column Metrosep Dual 3 (6.1006.120); Eluent 100 m H2SO4 solution; Flow Rate 0.80 mL min'; Temp. 22.0 °C; P 4.6 MPa 17
4.2 Calibration Curve for Chloride. Experimental Conditions: Anion Column Metrosep Dual 3 (6.1006.120); Eluent 100 mM H2SO4 solution; Flow Rate 0.80 mL min'; Temp. 22.0 °C; P 4.6 MPa 18
4.3 Calibration Curve for Bromide. Experimental Conditions: Anion Column Metrosep Dual 3 (6.1006.120); Eluent 100 m H2SO4 solution; Flow Rate 0.80 mL min'; Temp. 22.0 °C; P 4.6 MPa 20
4.4 Calibration Curve for Nitrate. Experimental Conditions: Anion Column Metrosep Dual 3 (6.1006.120); Eluent 100 m H2SO4 solution; Flow Rate 0.80 mL min'; Temp. 22.0 °C; P 4.6 MPa 21
4.5 Calibration Curve for Phosphate. Experimental Conditions: Anion Column Metrosep Dual 3 (6.1006.120); Eluent 100 mM H2SO4 solution; Flow Rate 0.80 mL min'; Temp. 22.0 °C; P 4.6 MPa 23
4.6 Calibration Curve for Sulphate. Experimental Conditions: Anion Column Metrosep Dual 3 (6.1006.120); Eluent 100 mM H2SO4 solution; Flow Rate 0.80 mL min'; Temp. 22.0 °C; P 4.6 MPa 24
4.7 Calibration curve for copper 26 4.8 Calibration curve for Cadmium 28 4.9 Calibration curve of Lead 29 4.10 Pahang River and Sampling Site 32
X
LIST OF ABBREVIATIONS & SYMBOLS
AAS Atomic Absorption Spectroscopy BOD Biochemical Oxygen Demand Interim COD Chemical Oxygen Demand DO Dissolved Oxygen GC-MS Gas Chromatography Mass Spectrometry IEC Ion Exchange Chromatography INWQS National Water Quality Standards for Malaysia ND Not detected TDS Total Dissolved Solids SS Suspended Solids TSS Total Suspended Solids UV-Vis Ultraviolet-Visible Spectroscopy WQI Water Quality Index
Xi
CHAPTER 1
INTRODUCTION
1.1 GENERAL
Surface water resources have played an important function throughout the
history of human civilization. About one third of drinking water requirement of the
world is obtained from surfaces sources like rivers, canals and lakes (Das and
Acharya, 2003). Nevertheless, these sources seem to have been used for the
discharge of industrial, agricultural and domestic wastes.
Pahang River, with the length of 459 km, it is the longest river on the Malay
Peninsula. The river begins at the confluence of Jelai and Tembeling rivers on the
Titiwangsa Mountains and drains into the South China Sea. Like any other parts in
the world, Pahang River has played an important function for the people who live
around it. Nowadays, Pahang River seems to have been used for the discharge of
domestic and agricultural wastes.
1.2 PROBLEM STATEMENT
Over the past five decades, rapid development and conversions of forest land
into urban land around Pahang River have led to water related problems such as solid
wastes problems and degradation of water quality. As far as Pahang River is
concerned, no researches have been done in determining physico -chemical
characteristics, anions and heavy metals analysis of this river so far. In addition,
industrial and agriculture is developing especially at Pekan which is the lower river
of Pahang River. Domestic wastes may also contain in the water sample due to /
1
2
dependence of people along Pahang River. These activities may resulting heavy
metals contains in the water samples.
1.3 HYPOTHESIS
Based on physico-chemical characteristics, upper parts of Pahang River are
suitable for water conservation while the. lower parts of Pahang River needed
conventional treatment. At the end of this proposal, it is expected that water samples
from lower river of Pahang river will contain higher heavy metal compare from
water samples from upper river. Anions will also present in water samples caused by
natural occurrence and anthropogenic sources.
1.4 SCOPE OF STUDY
Along the 459 km river length, we choose six water sampling sites for the
physical and chemical analysis, heavy metals and anions analysis from upper and
lower river of Pahang river. In this project, the different parts of the river will be
studied by means of measuring their physico-chemical characteristics. The overall
results of six separate tests can be used to determine if a particular stretch of river is
healthy. The WQI consists of six tests including pH, dissolved oxygen, biochemical
oxygen demand (BOD), chemical oxygen demand (COD), ammoniacal nitrogen and
total suspended solids (TSS). The six resulting values are then added to arrive at an
overall WQI. The highest score a body of water can achieve is 100.
1.5 OBJECTIVE
The objectives of this proposal are:
1. To study the physico-chemical characteristics of Pahang river.
2. To detect water quality changes in river water quality.
CHAPTER 2
LITERATURE REVIEW
2.1 INTRODUCTION
Water is the basic element of life; without it life would not exist. It is second
most important resource for man, and yet it is taken for granted because water is
everywhere and it flows freely when we turn on the tap. The usage of water increases
as population grows until the demand sometimes overshoots the supply or
availability (Kailasan, K,"2006).
Although the quantity of water on Earth is same all the time (same as
in dinosaur age, 60 million year ago), the quality of water that is available has
drastically changed. Every time we use water, we affect it in some way. Every
watershed is affected by what takes place on the land. Once used, water flows out as
quickly as it comes - down the drain and into our rivers. The gunk and grease that is
flushed down into the drain unthinkingly every day will ultimately find their way to a
nearby river. In other words, we are poisoning, the very resource that gives us life.
Therefore acquiring knowledge on ecosystem #especially river basin will ensure
efficient and effective management of rivers and water (Kailasan, K, 2006).
2.2 PAHANG RIVER
The Pahang River is located in the eastern part of Peninsular Malaysia. The
maximum length and breadth of the catchment are 205 km and 236 km respectively.
The river is about 440 km long and drains an area of 29300 km 2 of which 27000 km
lies within Pahang and 2300 km 2 is located in Negeri Sembilan. It is divided into the
3
4
Jelai and Tembeling rivers which meet at the confluence near Kuala Tembeling at
about 304 km from the river mouth in the central north. Jelai River originates from
the Central Mountain Range while Tembeling River has its origin at the Besar
Mountain Range. The Pahang River system begins to flow in the south east and south
directions from the north passing along such major towns as Kuala Lipis, Jerantut
and Temerloh, finally turning eastward at Mengkarak in the central south flowing
through Pekan town near the coast before discharging into the South China Sea.
The main highland areas situated within the basin are the Central Mountain
Range along its western side and the East Coast Range in the north-east between
Kuantan River and Tembeling River. These uplands areas are highly dissected and
generally range from 1000 m to 1500m in the elevation with some peaks reaching
more than 2000 m. The topography is less rugged towards the main drainage lines in
the central part of the basin, where most of the land is below an elevation of 75 in
and consists of low hills. The mountains areas are covered with virgin jungle while
rubber, oil palm and some paddy are planted in the undulating terrains and lowlands.
The eastern coastal plain is 30 to 40 km wide in the vicinity of the Pahang River. The
coastal plain is flat and mostly swampy. Granite is found in the mountainous terrains
in the east and west. The granitic soil in this region consists of fine to coarse sand
and clay. Its depth seldom exceeds about half a metre except in areas where intense
weathering has taken place and soil layer can be as deep as 9 m. In the central
portion of the catchment lies a wide valley where quartize, shist, shale stone and
limestone are the predominant rock types. This area, especially along the largest
rivers such as Pahang River and Tembeling River is mainly covered with alluvium
which varies from less than Im to more than 18m in depth.
2.2.1 Sampling Site
As far as the sampling site is concerned, six sampling point was chosed
including Jelai River, Tembeling River, Temerloh, Kampung Belimbing, Kampung
Temai and finally in Pekan.
5
2.3 PARAMETERS
Water quality index (WQI) is a standard index to compare rivers and lakes in
various parts of the country. WQI is one of the most widely used of all existing water
quality procedures. The overall tests can be used to determine if a particular stretch
of river is healthy. The WQI consist of six test including dissolved oxygen, pH,
biochemical oxygen demand (BOD), chemical oxygen demand (COD), ammoniacal
nitrogen and total suspended solids (TSS).
Dissolved oxygen or oxygen saturation in the environment generally refers to
the amount of oxygen dissolved in the soil or bodies of water. Insufficient oxygen
may occur in bodies of water such as ponds and rivers, tending to suppress the
presence of aerobic organisms such as fish. Deoxygenation increases the relative
population of anaerobic organisms such as plants and some bacteria, resulting in fish
kills and other adverse events.
pH is a measure of the acidity or basicity of an aqueous solution. Pure water
is said to be neutral, with a pH close to 7.0 at 25°C. Solutions with a pH less than 7
are said to be acidic and solutions with a pH greater than 7 are basic or alkaline.
Biochemical oxygen demand (BOD) is a chemical procedure for determining
the amount of dissolved oxygen needed by aerobic biological organisms in a body of
water to break down organic material present in a given water sample at certain
temperature over a specific time period.
Total suspended solids (TSS) and total dissolved solids (TDS) correspond to
non-filterable and filterable residue respectively. Suspended matter consists of silt,
clay, fine particles of organic and inorganic matter, soluble organic compounds,
plankton and other microscopic organisms. Therefore, turbidity and transparency
change seasonally according to biological activity in the water and heavy rainfall
(Maitland, 1978). TSS prevents the penetration of sunlight into the water column and
has a negative effect on the primary production of phytoplankton (Liu, 2005).
6
Ammofliacal nitrogen (NH 3 N), is a measure for the amount of ammonia, a
toxic pollutant often found in landfill leachate (Aziz, H. A., 2004) and in waste
products such as sewage, liquid manure and other liquid organic waste products
(Manios, T, et at, 2002).
Conductivity of the lakes generally is lower during the rainy seasons than dry
season. It is due a dilution by rain and less evaporation during the rainy season,
especially in lakes with short retention time (Zinabu, 2002).
Electrical conductivity (EC) is the measure of the ability of a solution to
conduct an electric current. EC relates to total amount of dissolved ions in the water
and has positive correlation with trophic gradient and phytoplankton abundance
(Diaz et al., 2007). Sources of pollutants such as wastewater from sewage treatment
plants, agricultural runoff and urban runoff increase ions in water, which leads to an
increase of EC (Khan, N, 1990a). EC increases also during thermal stratification in
hypolimnion due to an increase of decomposition.
2.4 HEAVY METALS
Natural water contaminant is a worldwide distributed problem which
deserves large attention not only due to its environmental hazardous effects but also
for the risks to the human health as well as the economical damages it produces.
Between the wide diversity of pollutants affecting water resources heavy metals
receive particular concern considering their. strong toxicity even at low
concentrations.
A heavy metal is a member of a loosely-defined subset of elements that
exhibit metallic properties. Occurrence of heavy metal in water bodies can happen in
two ways which is natural origin and anthropogenic. Natural occurrence of heavy
metals in water bodies may be caused by the eroded minerals within sediments,
leaching of ore deposits and volcanism extruded products. Iron, aluminium and tin
are the examples of heavy metals which are caused by natural occurrence.
2.4.1 Copper
Copper is natural element which is widely distributed in soils, rocks and in
rivers and the sea. People are most familiar with copper in its pure form as a reddish-
brown metal, but in nature copper usually exists combined with other chemical
elements in the form of copper compounds. Copper occurs naturally in all water
sources and is therefore present in drinking water, so anybody using water for
drinking, cooking, washing, bathing or going to the toilet, flushes water containing
copper into the river. Copper is likely caused by industrial activities. Businesses such
as textile printing works may discharge process waste containing copper directly into
the river (Water UK, 2001).
2.4.2 Cadmium
Cadmium is a rare natural element which is widely distributed in the earth's
crust in very small amounts. In its pure form, cadmium is a soft, bluish-white metal,
but cadmium always exists in nature combined- with other chemical elements in a
range of chemical compounds. Cadmium is caused by domestic water supply and
waste, industrial activities and runoff. Cadmium is always present in zinc metal as an
impurity, so corrosion of zinc galvanised tanks used in water systems will also add
trace amounts of cadmium to the water supply.
Cadmium occurs in very small quantities in many foods and so is present in
all human wastes which are flushed down the toilet. Trace amounts of cadmium are
present in detergents, bleach and toiletries •such : as shampoo, waste, water from
washing and bathing may therefore contain minute amounts of cadmium when it is
flushed away. Cadmium compounds used in electroplating or dyeing and printing
textiles may be discharged to the river by manufacturing companies. Particles of dust
accumulating on roads and pavements may contain traces of cadmium derived from
tyres, vehicle lubricants and exhaust fumes and from burning coal. These properties
will be washed down the drains when it rains.
8
2.4.3 Lead
Lead is a natural element which is widely distributed in soils, rocks and in
rivers and the sea. People are most familiar with lead as a dull grey metal used in
water pipes and for'roofing, but in nature lead usually exists combined with other
chemical elements in the form of lead compounds. In industrial activities, any
businesses using lead solders, working lead sheet or handling lead-acid batteries may
allow particles containing lead or battery acid containing lead to get into the rivers.
Lead pipes in older houses may leach small amounts of lead into the water supply
and be flushed down into rivers.
2.5 ANIONS
Six anions had been chosen in this research including fluoride, chloride,
bromide, nitrate, phosphate and sulphate. Anions in water samples are caused by
natural occurrence and human interference. Natural occurrence is caused from
interactions between water and rocks. The location of the river also can contribute to
the presence of anions in water samples. Chloride, as an example, contains the
highest concentration when the river is near to the sea.
Anthropogenic sources also can contribute to the presence of anions in water
samples. Fertilizers runoff, domestic and industrial wastes are the main sources of
anthropogenic. Bromide which is in fertilizers will flow with the rainfall into the
river. Phosphate and sulphate are coming from detergents which are consumed by the
people around the river. Meanwhile for industries, they use high volume of sulphate
as sulphate is the most used in chemical, sulphuric acid is one of them.
CHAPTER 3
METHODOLOGY
3.1 EXPERIMENTAL DESIGN
The scope of environmental samplingcan be illustrated by a sample's life
with the following seven consecutive steps (Popek, 2003). Since these steps are
irreversible, a mistake can be detrimental. These seven steps of a sample's life are as
follows:
I. a sample is planned (conceived)
2. a sampling is identified
3. the sample collected (born)
4. the sample is transferred to the laboratory
5. the sample is analyzed
6. the sample expires and is discarded
7. the sample reincarnates as a chemical data point
3.1.1 Experimental Variables/Parameters
There are several parameters involved in this research including five water
parameters of WQI which are pH value, dissolved oxygen (DO), biochemical oxygen
demand (BOD) and total suspended solids. Chemical oxygen demand (COD) will
also be measured in the analysis. Besides that, heavy metals and anions are also
determined in the analysis.
9
10
3.1.2 Sampling Design & Methods
Samples were collected from upper and lower river along the Pahang River.
Six locations are identified as the sampling site for the physical and chemical
characteristic analysis. After the samples are collected, they were brought to the
laboratory to be analyzed.
Samples that are not analyzed immediately must be protected from addition
of contaminants, loss of determinants by sorption or other means, and any other
unintended changes that affect the concentrations of determinants of interest. For this
purpose, sample bottles should be chosen for long-term storage with no or as few
changes to sample composition as possible. This is called sample pre-treatment.
Three approaches which are refrigeration, use of proper sample container and
addition of preserving chemicals are generally used to minimize such changes.
3.1.3 Data Collection (Measurement) Methods
For most types of analyses, samples must be transformed into a form that can
be introduced into the analytical instrument, as only a few laboratory instruments can
analyze soil and water directly. Depending on the type of analysis, this
transformation may be achieved using one of the following preparation techniques:
I. Leaching of organic and inorganic compounds from soil, sediment or sludge
with a buffered acidic solution
2. Digestion of soil and water for metal analysis
3. Extraction of organic compounds from soil and water with organic solvents
4. Dilution of concentrated waste products with organic solvents
5. Concentration of volatile organic compounds by the purge and trap technique 6. Distillations and digestion as part of inorganic analyses
11
3.1.4 Data Evaluation & Analysis Methods
From five parameters of WQI, pH and dissolved oxygen were analyzed on
site while other four parameters, anions and heavy metals were done in laboratory.
Analysis will be done for both upper and lower river samples in scope of WQI,
heavy metals and anions analysis. The results for both upper and lower river then are
compared using statistics such as minimum maximum and t test.
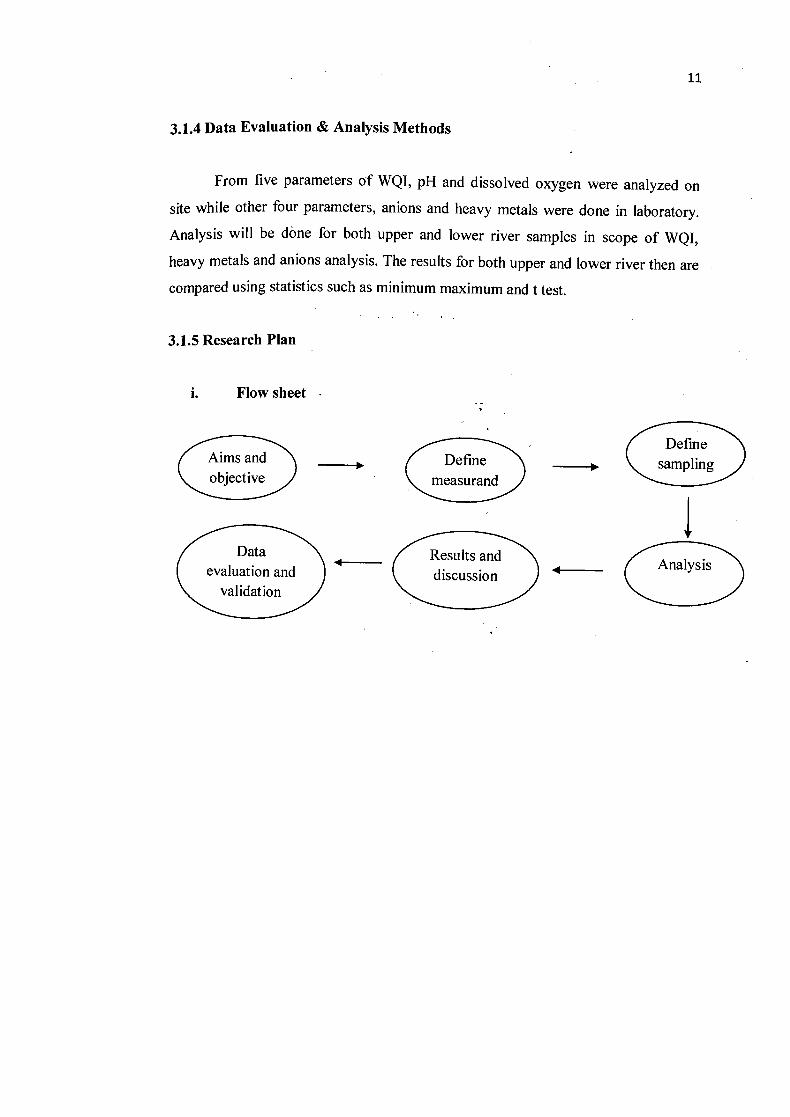
3.1.5 Research Plan
i. Flow sheet
Define
Aims and 0 Define objective measurandctiv
sampling
Data Results and discussion
Analysis evaluation and ) validon
12
ii. Resources Deployment
Once the samples is analyzed, a meeting were arranged with others students
to compare the results obtained by them.
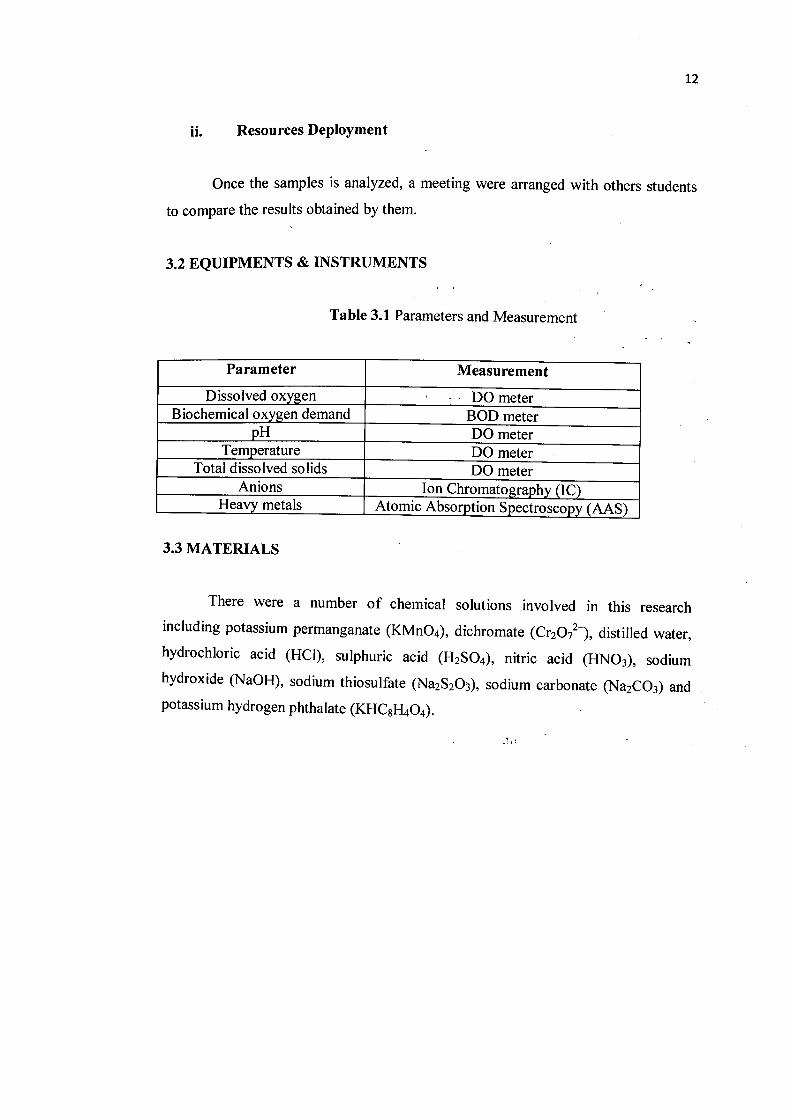
3.2 EQUIPMENTS & INSTRUMENTS
Table 3.1 Parameters and Measurement
Parameter Measurement
Dissolved oxygen DO meter Biochemical oxygen demand BOD meter
pH DO meter Temperature DO meter
Total dissolved solids DO meter Anions Ion Chromatography (IC)
Heavy metals Atomic Absorption Spectroscopy (AAS)
3.3 MATERIALS
There were a number of chemical solutions involved in this research
including potassium permanganate (KMn0 4), dichromate (Cr2072 ), distilled water, hydrochloric acid (HCI), sulphuric acid (H 2 SO4), nitric acid (HNO 3), sodium hydroxide (NaOH), sodium thiosulfate (Na 2 S203), sodium carbonate (Na2CO3) and potassium hydrogen phthalate (KHC8H404).
13
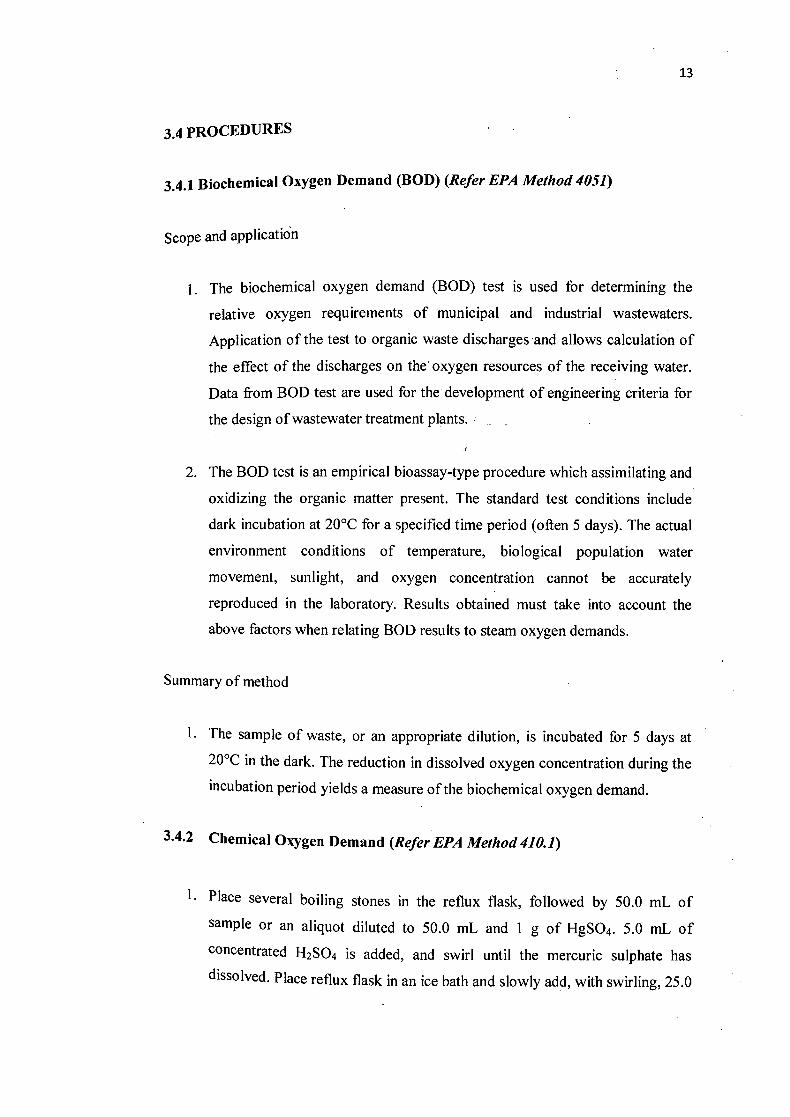
3.4 PROCEDURES
3.4.1 Biochemical Oxygen Demand (BOD) (Refer EPA Method 4051)
Scope and application
I. The biochemical oxygen demand (BOD) test is used for determining the
relative oxygen requirements of municipal and industrial wastewaters.
Application of the test to organic waste discharges and allows calculation of
the effect of the discharges on the oxygen resources of the receiving water.
Data from BOD test are used for the development of engineering criteria for
the design of wastewater treatment plants. -
2. The BOD test is an empirical bioassay-type procedure which assimilating and
oxidizing the organic matter present. The standard test conditions include
dark incubation at 20°C for a specified time period (often 5 days). The actual
environment conditions of temperature, biological population water
movement, sunlight, and oxygen concentration cannot be accurately
reproduced in the laboratory. Results obtained must take into account the
above factors when relating BOD results to steam oxygen demands.
Summary of method
I. The sample of waste, or an appropriate dilution, is incubated for 5 days at
20°C in the dark. The reduction in dissolved oxygen concentration during the
incubation period yields a measure of the biochemical oxygen demand.
3.4.2 Chemical Oxygen Demand (Refer EPA Method 410.1)
I. Place several boiling stones in the reflux flask, followed by 50.0 mL of
sample or an aliquot diluted to 50.0 nil and 1 g of HgSO 4. 5.0 mL of Concentrated H2SO4 is added, and swirl until the mercuric sulphate has
dissolved. Place reflux flask in an ice bath and slowly add, with swirling, 25.0
14
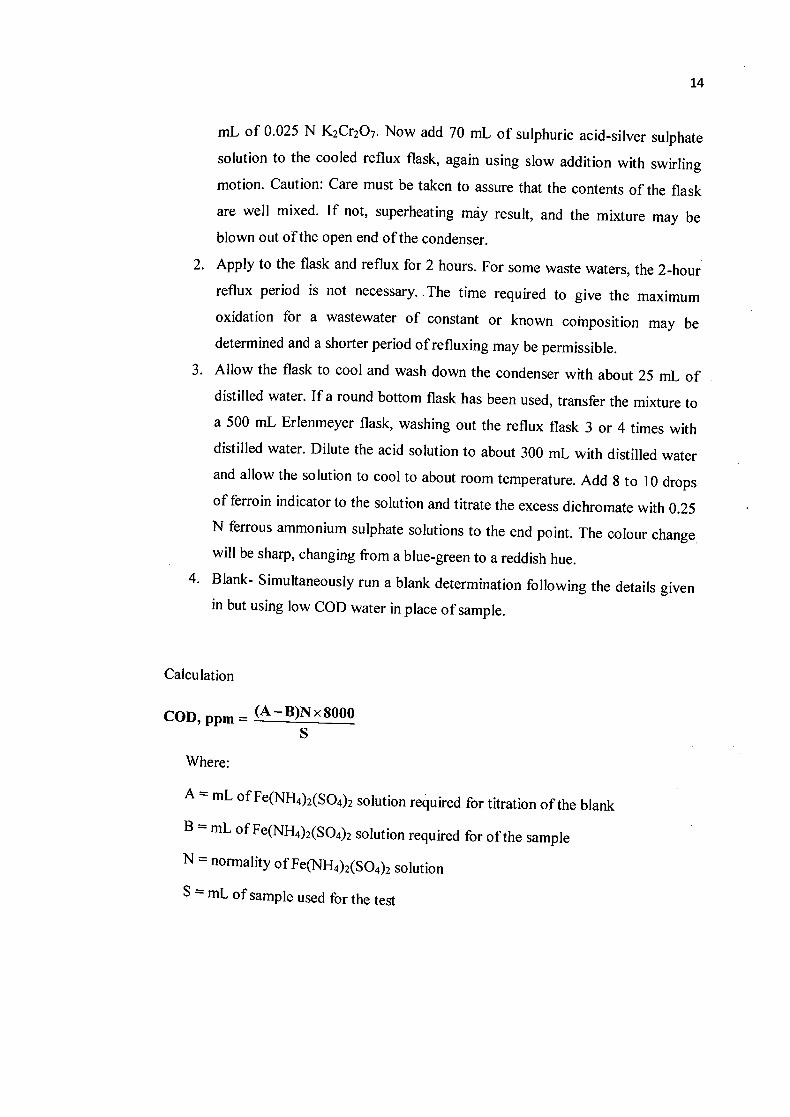
mL of 0.025 N K2Cr2O7. Now add 70 mL of sulphuric acid-silver sulphate
solution to the cooled reflux flask, again using slow addition with swirling
motion. Caution: Care must be taken to assure that the contents of the flask
are well mixed. If not, superheating may result, and the mixture may be
blown out of the open end of the condenser.
2. Apply to the flask and reflux for 2 hours. For some waste waters, the 2-hour
reflux period is not necessary. The time required to give the maximum
oxidation for a wastewater of constant or known cohiposition may be
determined and a shorter period of refluxing may be permissible.
3. Allow the flask to cool and wash down the condenser with about 25 mL of
distilled water. If a round bottom flask has been used, transfer the mixture to
a 500 mL Erlenmeyer flask, washing out the reflux flask 3 or 4 times with
distilled water. Dilute the acid solution to about 300 mL with distilled water
and allow the solution to cool to about room temperature. Add 8 to 10 drops
of ferroin indicator to the solution and titrate the excess dichromate with 0.25
N ferrous ammonium sulphate solutions to the end point. The colour change
will be sharp, changing from a blue-green to a reddish hue.
4. Blank- Simultaneously run a blank determination following the details given
in but using low COD water in place of sample.
Calculation
COD, ppm = (A—B)Nx8000
S
Where:
A mL of Fe(NH4)2(5O4)2 solution required for titration of the blank
B = mL of Fe(NJ-4)2(SO4)2 solution required for of the sample
N normality of Fe(NH4)2(5O4)2 solution
S mL of sample used for the test
15
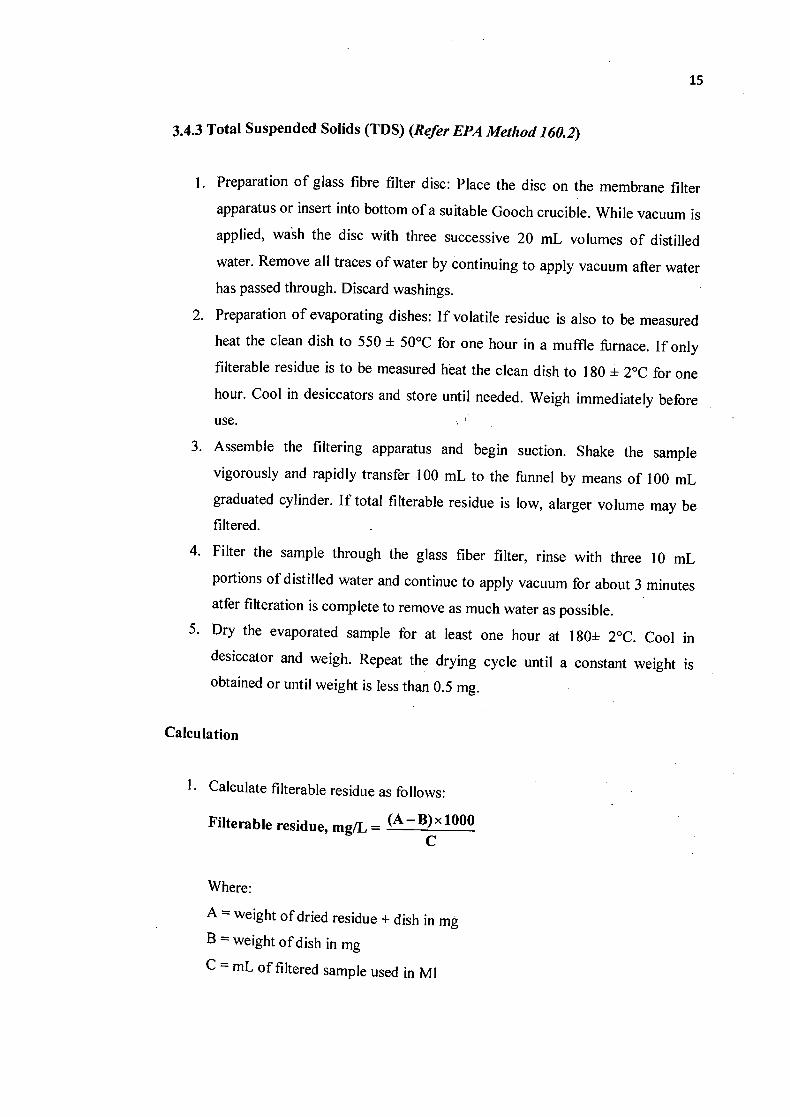
3.4.3 Total Suspended Solids (TDS) (Refer EPA Method 160.2)
1. Preparation of glass fibre filter disc: Place the disc on the membrane filter
apparatus or insert into bottom of a suitable Gooch crucible. While vacuum is
applied, wash the disc with three successive 20 mL volumes of distilled
water. Remove all traces of water by continuing to apply vacuum after water
has passed through. Discard washings.
2. Preparation of evaporating dishes: If volatile residue is also to be measured
heat the clean dish to 550 ± 50°C for one hour in a muffle furnace. If only
filterable residue is to be measured heat the clean dish to 180 ± 2°C for one
hour. Cool in desiccators and store until needed. Weigh immediately before
use.
3. Assemble the filtering apparatus and begin suction. Shake the sample
vigorously and rapidly transfer 100 mL to the funnel by means of 100 mL
graduated cylinder. If total filterable residue is low, alarger volume may be
filtered. -
4. Filter the sample through the glass fiber filter, rinse with three 10 mL
portions of distilled water and continue to apply vacuum for about 3 minutes
atfer filteration is complete to remove as much water as possible. 5. Dry the evaporated sample for at least one hour at 180± 2°C. Cool in
desiccator and weigh. Repeat the drying cycle until a constant weight is
obtained or until weight is less than 0.5 mg.
Calculation
1. Calculate filterable residue as follows:
Filterable residue, mg/1L = 1000 C
Where:
A weight of dried residue + dish in mg
B weight of dish in mg
C = mL of filtered sample used in Ml
CHAPTER 4
RESULTS AND DISCUSSIONS
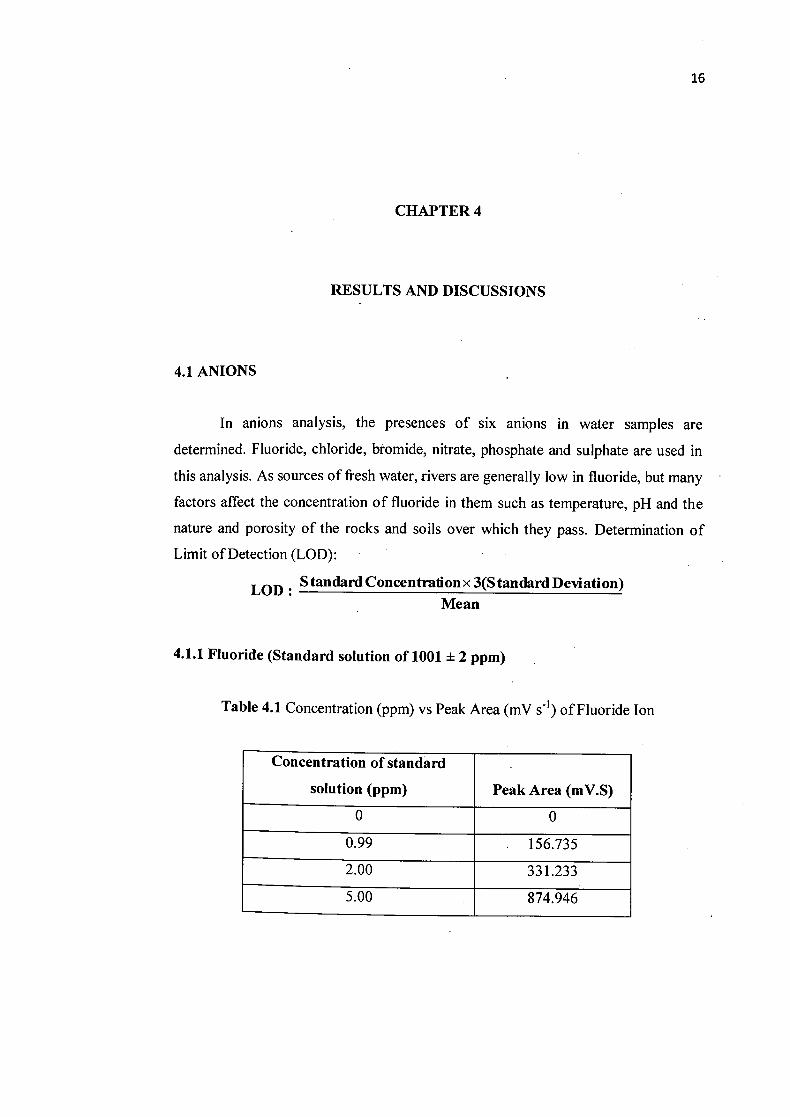
4.1 ANIONS
In anions analysis, the presences of six anions in water samples are
determined. Fluoride, chloride, bromide, nitrate, phosphate and sulphate are used in
this analysis. As sources of fresh water, rivers are generally low in fluoride, but many
factors affect the concentration of fluoride in them such as temperature, pH and the
nature and porosity of the rocks and soils over which they pass. Determination of
Limit of Detection (LOD):
LOD• Standard Concentration x 3(S tandard Deviation) Mean
4.1.1 Fluoride (Standard solution of 1001 ± 2 ppm)
Table 4.1 Concentration (ppm) vs Peak Area (mV s') of Fluoride Ion
Concentration of standard
solution (PPM) Peak Area (mV.S)
0 0
0.99 156.735
2.00 331.233
5.00 874.946
16