filip cosmanescu - academic commons
TRANSCRIPT

Structural and biophysical studies of the Drosophila melanogaster Dpr and DIP families
Filip Cosmanescu
Submitted in partial fulfillment of the
requirements for the degree of
Doctor of Philosophy under the Executive Committee
of the Graduate School of Arts and Sciences
COLUMBIA UNIVERSITY
2018

© 2018
Filip Cosmanescu
All rights reserved
ABSTRACT
Structural and biophysical studies of the Drosophila melanogaster Dpr and DIP families
Filip Cosmanescu
How neurons choose appropriate synaptic partners to form functional neural circuits is
not well understood. Two subfamilies of Drosophila immunoglobulin superfamily (IgSF) cell
surface proteins, Dprs (defective proboscis response) and DIPs (Dpr interacting proteins) are
broadly expressed in the nervous system and involved in the development of neural circuits. A
qualitative interactome developed from high-throughput experiments has shown that each DIP
interacts with a unique set of Dpr proteins. Neurons with distinct synaptic specificities express
distinct combinations of Dprs, while a subset of their synaptic partners express the
complementary DIPs. These findings are consistent with the idea that the specificity of
interactions between Dprs and DIPs help to define the synaptic connectivity of the neurons in
which they are expressed. Thus, it is essential to fully understand interactions between members
of these two protein families.
Using surface plasmon resonance (SPR), we have generated a quantitative Dpr and DIP
interactome, which contained several novel features. We determined the binding affinities of the
majority of Dpr-DIP interactions, revealing binding groups that span a range of affinities and
reflect DIP and Dpr phylogeny. Crystal structures of Dpr-DIP heterocomplexes were determined
and used to design site-specific mutants that, along with SPR experiments, reveal the major
determinants of Dpr-DIP binding specificity.
Using analytical ultracentrifugation (AUC), we show that some Dpr and DIP family
members form homophilic dimers as well. Multiple crystal structures of DIP homodimers reveal
the molecular determinants of homophilic binding and structure-guided mutants along with AUC

experiments further validated their mechanism of interaction. The existence of DIP and Dpr
homodimers suggests the possibility of still-unknown mechanisms of Dprs and DIPs in neural
circuit formation.
Based on information derived from our crystal structures and biophysical experiments,
we designed, produced, and tested Dpr and DIP proteins with altered binding properties. Many
of the structural and biophysical studies described in this thesis were undertaken to produce tools
to probe Dpr and DIP function in an in vivo setting. Parallel studies utilizing many of the mutant
proteins described here (and other reagents that are not described here) are underway in the
Zipursky lab, and are not described herein.

i
TABLE OF CONTENTS
LIST OF FIGURES ........................................................................................................................ v
LIST OF TABLES ........................................................................................................................ vii
ACKNOWLEDGMENTS ........................................................................................................... viii
Chapter 1: Introduction .................................................................................................................. 1
1.1: The variety of neural cell surface proteins ............................................................... 2
1.2 Drosophila Extracellular interactome ....................................................................... 6
1.3 Dprs and DIPs ........................................................................................................... 9
1.4 Dpr/DIP expression in the Drosophila visual system ............................................. 12
1.5 Dpr/DIP function in the visual system .................................................................... 14
1.6 Dprs and DIPs in the musculoskeletal system ........................................................ 16
1.7 Aims of this work.................................................................................................... 18
Chapter 2: Materials and Methods .............................................................................................. 20
2.1 Plasmid construction ............................................................................................... 21
2.2 HEK293 and S2 cell transfection ............................................................................ 22
2.2 Protein purification ................................................................................................. 23
2.3 Surface Plasmon Resonance (SPR) binding experiments ....................................... 24
2.3 Analytical Ultracentrifugation (AUC) sedimentation equilibrium ......................... 26
2.4 SEC-MALS ............................................................................................................. 27
2.5 Crystallization ......................................................................................................... 28

ii
2.6 Data collection and processing ............................................................................... 29
Chapter 3: Construct design and protein production ................................................................... 31
3.1 Construct design...................................................................................................... 32
3.2 Expression results ................................................................................................... 34
Chapter 4: Quantitative interactome reveals new interactions and binding affinities ................. 37
4.1 Drawbacks of previous Dpr-DIP interaction studies .............................................. 38
4.2 Surface plasmon resonance ..................................................................................... 39
4.3 Initial SPR experiments to determine coupling method ......................................... 44
4.4 Technical issues of a large scale SPR experiment .................................................. 49
4.5 Heterophilic Dpr-DIP binding affinities ................................................................. 51
4.5.1 DIP-α/β/γ subgroup .......................................................................................... 56
4.5.2 DIP-ε/ζ Subgroup ............................................................................................. 56
4.5.3 DIP-η/θ/ι Subgroup .......................................................................................... 57
4.6 Dpr/DIP interactions correlate to phylogeny .......................................................... 58
Chapter 5: Structures of Dpr-DIP heterophilic complexes .......................................................... 61
5.1 Full ectodomain structural information .................................................................. 62
5.1.1 Dpr4/DIP-η Crystallization .............................................................................. 62
5.1.2 Dpr2/DIP-θ Crystallization .............................................................................. 63
5.2 The Dpr4/DIP-η & Dpr2/DIP-θ Complex .............................................................. 66
5.3 Potential Cis interfaces ........................................................................................... 73

iii
Chapter 6: Binding Specificity of the Dpr-DIP Heterophilic interface ...................................... 79
6.1 Identifying residues important to specificity .......................................................... 80
6.1.1 Specificity Residues SI1-3 and SR1-4 .................................................................. 83
6.1.2 Specificity Residues SI4 and SR5 ...................................................................... 87
6.1.3 Specificity Residues SI5-6 and SR6-7 .................................................................. 87
6.2 Comparisons of SR and SI residues in crystal structures ......................................... 88
6.3 Swapping specificity of Dpr4 and Dpr6 ................................................................. 91
Chapter 7: Homophilic Interactions in Dprs and DIPs ................................................................ 95
7.1 Analytical ultracentrifugation ................................................................................. 96
7.2 AUC reveals Dpr and DIP homodimers ................................................................. 99
7.3 Crystallization of DIP-α and DIP-θ crystal structures .......................................... 103
7.3.1 DIP-α Crystallization ..................................................................................... 103
7.3.2 DIP-θ crystallization ...................................................................................... 106
7.4 Homophilic interface of DIP-α & DIP-θ .............................................................. 106
7.5 Targeted point mutations confirm homophilic interface ...................................... 113
Chapter 8: Probing heterophilic and homophilic contributions in vivo ..................................... 115
8.1 The need for interaction-specific mutations ......................................................... 116
8.2 Designing and testing of DIP-α interaction specific mutations ............................ 116
8.3 Disrupting DIP-α heterophilic/homophilic and heterophilic interactions only .... 120
8.4 Mutations designed to disrupt only DIP-α homophilic interactions ..................... 121

iv
8.5 Mutations that can alter Dpr10 binding in vivo .................................................... 126
8.6 Mutants selected for in vivo experiments .............................................................. 127
Chapter 9: Nectin chimeras, a gain of function in vivo experiment .......................................... 129
9.1 Interrogating Dpr-DIP interactions through gain-of-function experiments .......... 130
9.2 Design and Expression of Dpr/DIP- Nectin chimeras .......................................... 132
9.3 SPR confirms Heterophilic binding of Nectin chimeras....................................... 134
9.4 Nectin-Chimera in vivo experiment ...................................................................... 135
Chapter 10: Discussion .............................................................................................................. 139
10.1 Updated and quantitative Dpr-DIP interactome ................................................. 140
10.2 Novel heterophilic structures and interactome reveal specificity determinants . 144
10.3 Novel Dpr and DIP Homophilic interactions ...................................................... 146
10.4 Crystal structure reveals potential cis interface .................................................. 149
10.5 Structure directed mutations and chimeras help investigate in vivo function ..... 150
10.6 Dpr/DIP interactions in synaptic targeting ......................................................... 151
10.7 Future Directions ................................................................................................ 153
REFERENCES ........................................................................................................................... 157

v
LIST OF FIGURES
Figure 1: Cell surface proteins and their interactions ..................................................................... 5
Figure 2: Extracellular Interactome Assay ..................................................................................... 7
Figure 3: Dpr-DIP Interactome ....................................................................................................... 8
Figure 4: Dpr and DIP family domain topologies. ....................................................................... 10
Figure 5: Dpr6/DIP-α Crystal Structure ........................................................................................ 11
Figure 6: Drosophila visual system .............................................................................................. 13
Figure 7: Cell Death Seen in Dpr and DIP mutants ..................................................................... 15
Figure 8: Synaptic Bouton NMJ phenotype.................................................................................. 17
Figure 9: Example binding responses and binding isotherm ........................................................ 42
Supp. Figure 1: Binding affinity determination at different maximum saturation levels ............. 43
Figure 10: Initial SPR experiments ............................................................................................... 46
Figure 11: Non-specific binding of Dpr Analytes ........................................................................ 48
Figure 12: Variability of SPR experiments performed ................................................................. 50
Figure 13: SPR sensorgrams of Dpr-DIP interactions .................................................................. 52
Figure 14: Fitted binding isotherms of Dpr-DIP interactions ....................................................... 53
Figure 15: Updated Quantitative Interactome ............................................................................... 54
Figure 16: Dpr Phylogenetic Tree................................................................................................. 59
Figure 17: DIP Phylogenetic Tree ................................................................................................ 60
Figure 18: Crystals of Dpr2/DIP-θ and Dpr4/DIP-η..................................................................... 64
Figure 19: Overall crystal structures of Dpr/DIP heterocomplexes.............................................. 67
Figure 20: Detailed view of Dpr4/DIP-η Interface. ...................................................................... 68
Figure 21: D1-D1 Superposition of Dpr/DIP heterophilic complexes ......................................... 70
Figure 22: Linker Region of Dpr2 and Dpr4 ................................................................................ 72
Figure 23: Potential Cis Interface of Dpr4/DIP-η ......................................................................... 74
Figure 24: Dpr4/DIP-η Zipper arrangement ................................................................................. 76
Figure 25: Dpr2/DIP-θ Crystal contact ......................................................................................... 78
Figure 26: Pairwise percent identity of Dpr and DIP D1 domains ............................................... 81
Figure 27: Dpr and DIP D1 alignments ........................................................................................ 82
Figure 28: DIP Interface alignment .............................................................................................. 84

vi
Figure 29: Dpr interface alignment ............................................................................................... 85
Figure 30: Binding Specificity Regions ........................................................................................ 86
Figure 31: Main interfacial specificity region with two overlaid complexes ............................... 90
Figure 32: SPR analysis of Dpr4 and Dpr6 specificity swaps. ..................................................... 94
Supp. Figure 2: Sample AUC Data of SV and SE experiments ................................................... 98
Figure 33: Sedimentation equilibrium AUC analysis ................................................................. 102
Figure 34: Crystals of DIP-α and DIP-θ ..................................................................................... 104
Figure 35: Overall crystal structures of DIP homodimers .......................................................... 107
Figure 36: Detailed view of DIP-α Homodimer ......................................................................... 108
Figure 37: Comparison of DIP-α and DIP-θ homodomers ......................................................... 111
Figure 38: DIP-α select homophilic disruption ........................................................................... 123
Figure 39: AUC and SEC-MALS of DIP-α A39K mutant ......................................................... 124
Figure 40: SPR Binding curves for DIP-α mutants .................................................................... 125
Figure 41: Nectin-chimeras ......................................................................................................... 131
Figure 42: Nec1-α Expression mutant ........................................................................................ 133
Figure 43: SPR analysis of Nec1-DIPα and Nec3-Dpr10 chimeras ........................................... 137
Figure 44: SPR analysis of Nec3-DIPα and Nec1-Dpr10D chimeras ........................................ 138
Figure 45: Role of Dpr-DIP specificity in synaptic targeting ..................................................... 153

vii
LIST OF TABLES
Methods Table 1: RPM speeds used for AUC experiments ........................................................ 27
Table 1: Summary of Dpr & DIP Protein Constructs .................................................................. 33
Table 2: Theoretical and MALDI determined Mol.Weights of Dpr and DIP constructs ............ 36
Table 3: Published Heterophilic affinities of Dpr-DIP interactions ............................................ 44
Table 4: Results from initial amine-coupled SPR experiments ................................................... 47
Table 5: Calculated KDs of Dpr-DIP interactions ........................................................................ 55
Table 6: Dpr4/DIP-η and Dpr2/DIP-θ Crystallographic Data and Refinement Statistics ........... 65
Table 7: Dpr4/DIP-η hydrogen bonds ......................................................................................... 69
Table 8: Additional Hydrogen Bonds seen in Dpr2/DIP-θ .......................................................... 69
Table 9: Dpr4 D2 / DIP-η D3 interface hydrogen bonds ............................................................. 75
Table 10: Dpr and DIP AUC Results ......................................................................................... 101
Table 11: DIP-α and DIP-θ Homodimer Crystallographic Data and Refinement Statistics ...... 105
Table 12: DIP-α homodimer hydrogen bonds ........................................................................... 109
Table 13: DIP-θ Homodimer hydrogen bonds ........................................................................... 112
Table 14: D1-D1 Complex superposition RMSD (Å) ............................................................... 112
Table 15: AUC results of DIP-α mutants ................................................................................... 114
Table 16: Summary of KDs of DIP-α Interaction Mutants ........................................................ 119
Table 17: Dpr10 mutant binding affinities ................................................................................. 127

viii
ACKNOWLEDGMENTS
There are many people I would like to thank who without their help and support this
thesis would not be possible.
I will always be grateful to my advisor Larry Shapiro, who a little more than 8 years ago
took a chance on me and hired me as a technician to work in his lab (I hope he doesn’t regret this
decision). Even though my doctoral studies have taken a bit of a winding road, Larry has always
guided me and is always available to talk and discuss what the right approach is.
I’d like to thank Barry Honig, for the excellent and insightful direction during my time at
Columbia, and whose feedback and suggestions helped get this project to where it is today. His
insistence on lab meetings gave me an opportunity to present my work, which while I many
times dreaded, developed communication skills that will serve me not only in my career, but life
as well. His help in sharpening these skills and insistence on excellence is one of the most
valuable takeaways from my doctoral studies.
Oliver Hobert, who was my co-advisor on my first project, taught me how to think and do
experiments in a field outside structural biology, helping round my skills as a scientist. Wayne
Hendrickson, who as one of my original thesis committee members provided excellent direction,
and proposed interesting questions and unique ideas during my committee meetings.
And I wouldn’t be presenting this work if it wasn’t for Lawrence Zipursky, who brought
the Shapiro lab onto the Dpr/DIP project and has been an outstanding collaborator. I’d like to
thank Liming Tan, Shuwa Xu and Qi Xiao and other members of his lab who have helped design
and perform experiments and have been extremely helpful in discussing results and their
interpretations with me, even though it is difficult with our labs being so far away.
The work detailed in this dissertation was only accomplished because of many people
working together in the Honig-Shapiro lab. Phinikoula Katsamba who performed all the SPR

ix
experiments and taught me how to correctly pronounce greek letters. Goran Ahlsen who
performed all the AUC and SEC-MALS experiments. Alina Sergeeva who has worked on this
project with me from the beginning, designing experiments, bringing new insights, analysis, and
ideas to explore. Saurabh Patel who produced all of our S2 proteins without which the scope of
this project would be limited, and Josh Brewer who helped clone and produce vast amounts of
proteins and whose youthful excitement reminds me why science can be so rewarding.
The rest of the Honig-Shapiro lab has been crucial to my development as both a scientist
and a person. Fabiana Bahna took me under her wing when I was a technician and has given me
wise advice in both life and science. Oliver Harrison and Julia Brasch, who never seem annoyed
even though I’ve peppered them with questions every day for the last 6 years about protein
purification and X-ray crystallography. Kerry Goodman and Jared Sampson who have helped
broaden my skills as a crystallographer. Seetha Mannepalli who is always willing to talk about
experiments and provide a helping hand. Gil Dionne who replaced me as the youngest graduate
student in the lab, providing me with additional motivation to graduate. Katie Rosa, without who
we would not have a functional lab and all the other Honig-Shapiro lab members past and
present whose support and feedback have helped with the completion of this work.
I’d also like to thank Lalanti Venkatasubramanian, who has helped me better understand
Dpr/DIP function in motor neurons, and has always been available to discuss interpretation of
genetic results. And past and present members of the Hobert lab who helped contribute to an
amazing environment that not only broadened my understandings of genetics but helped develop
the analytical skills necessary to be a good scientist.

x
And I’d like to thank my family and friends who have supported me over the many years
of my doctoral studies, and made me into the person I am today. And most importantly, my wife
Maria, whose support and patience has been unwavering.

1
Chapter 1:
Introduction

2
1.1: The variety of neural cell surface proteins
The nervous system is incredibly complex, consisting of huge numbers of neurons and
connections. How specific neuronal connections are determined is one of the most tantalizing
questions of neurobiology. It has long been hypothesized that in order to derive this specificity,
neurons must contain unique markers, even at the level of an individual neuron, in order to
encode the specificity necessary for the complex neural circuit formation seen in animals (Sperry
1963).
Decades of research have identified a wide array of extracellular proteins, spread across
multiple families, which engage in distinct types of molecular interactions that help pattern these
neuronal connections. The biophysics underlying the diverse methods of interaction seen in cell
surface proteins help shape their functional roles. Calcium-dependent adhesion molecules such
as cadherins, as well as multiple cell adhesion members of the immunoglobulin superfamily
(IgSF), have been shown to engage in homophilic and intra-family heterophilic interactions that
play roles in neural layer and synaptic specificity as well as other functions (Togashi, Miyoshi et
al. 2006, Yamagata and Sanes 2008, Williams, Wilke et al. 2011, Duan, Krishnaswamy et al.
2014).
One such member of the IgSF are nectins, a four member family whose extracellular
region contain three tandem IG domains followed by a transmembrane region and a cytoplasmic
domain that can bind afadin (Figure 1a) (Harrison, Vendome et al. 2012). Nectins have been
shown to engage in cell adhesion in a variety of tissue types, including neural tissue, and
heterophilic trans interactions within the family have been shown to play roles in axon
pathfinding and synapse formation (Okabe, Shimizu et al. 2004, Togashi, Miyoshi et al. 2006).
Crystal structures of the nectin family have shown that complexes form through a conserved

3
interaction along the FGCC'C'' face of the membrane distal domain, which can engage in both
heterophilic and a weaker homophilic interaction (Harrison, Vendome et al. 2012).
Classical cadherins are a family of cell adhesion proteins that have many roles in
morphogenetic processes across a variety of cell types including nervous system development
and synapse formation (Williams, Wilke et al. 2011, Brasch, Harrison et al. 2012, Basu, Duan et
al. 2017). One of its subfamilies, type-II classical cadherins, consists of 13 members, all of which
have 5-tandem extracellular cadherin (EC) domains followed by a transmembrane region and an
intracellular domain that is linked to the actin cytoskeleton (reviewed in Brasch, Harrison et al.
2012). Within the type-II family, members engage in specific heterophilic interactions that can
be organized into distinct specificity groups. Proteins of these groups interact strongly with each
other and weakly or not at all with members from other specificity groups (Manuscript in
preparation). Type-II cadherins, like other classical cadherins, interact through a “strand-swap”
mechanism where the N-terminal region of the A strand of the membrane distal EC1 swaps with
same strand of the EC1 of the interacting protomer (Figure 1b). In type-II cadherins, two
conserved tryptophans on the A strand bury themselves into the hydrophobic pocket of the
opposing protomer to help complete this interaction (Patel, Ciatto et al. 2006).
Large families of alternatively spliced proteins have been shown to provide some of the
diversity necessary to pattern synaptic connections. Drosophila Dscam1 proteins, another
member of the IgSF, mediate self-avoidance among neurons (Hattori, Millard et al. 2008).
Dscam1 isoforms each consist of 10 tandem IG domains, followed by 6 fibronectin type-III
(FnIII) domains, a transmembrane region and a cytoplasmic domain. Regions of 3 of the IG
domains are alternatively spliced allowing for 19,008 unique ectodomains. These isoforms
engage in only homophilic interactions and form S-shaped dimers, where 80% of the buried

4
surface area is along these variable regions (Figure 1c). Each neuron was found to express a
unique subset of the possible 19,008 ectodomains and homophilic interactions between like-
isoforms on branching neurites result in repulsion and self-avoidance, preventing neurons from
forming connections with themselves.
In vertebrates, the clustered protocadherin family (Pcdh) performs a similar self-
avoidance function through the use of homophilic interactions, however their mode of interaction
is significantly different than Dscam (reviewed in Rubinstein, Goodman et al. 2017). Unlike the
large diversity seen in Dscam there are only 50-60 isoforms of Pcdh, each having six tandem EC
domains, a transmembrane and an intracellular region. The membrane distal 4 EC domains of
opposing protomers have been shown to interact in a head-to-tail homophilic orientation in trans
while the membrane proximal EC5 and EC6 of neighboring protomers engage in a promiscuous
cis interaction (Figure 1d). The key to providing single-cell identity with so few isoforms could
lie in the interplay between the trans and cis interactions. The combination of the two
interactions form the basis of a model where a lattice of molecules engaged in both trans and cis
can only form between neurites that express matching sets of Pcdh, which could then initiate the
cell avoidance response.
The molecules discussed are just a small subset of the proteins which play roles in
nervous system development and highlight the diversity of protein-protein interactions necessary
for correct neural circuit formation. In order to begin to uncover general synaptic specificity
mechanisms, extensive knowledge of the interactions between cell surface proteins is necessary.
Identifying these interactions can be challenging due to the vast repertoire of proteins and low
affinity interactions.

5
Figure 1: Cell surface proteins and their interactions. (a) Ribbon representation of the Nectin1-Nectin1 homodimer with expanded
view of D1-D1 interaction. Adapted from (Harrison, Vendome et al. 2012) (b) Ribbon representation of a classical cadherin trans
interaction, with an expanded view of the type-II cadherin strand swapped interface. Adapted from (Brasch, Harrison et al. 2012). (c)
Domain arrangements of Drosophila Dscam as a monomers and as a homodimer. Adapted from (Hattori, Millard et al. 2008). (d)
Representative crystal structure of Pcdhα7 with a schematic of the zipper like lattice that can form between apposing membranes.
Adapted from (Rubinstein, Goodman et al. 2017) and (Goodman, Rubinstein et al. 2017)

6
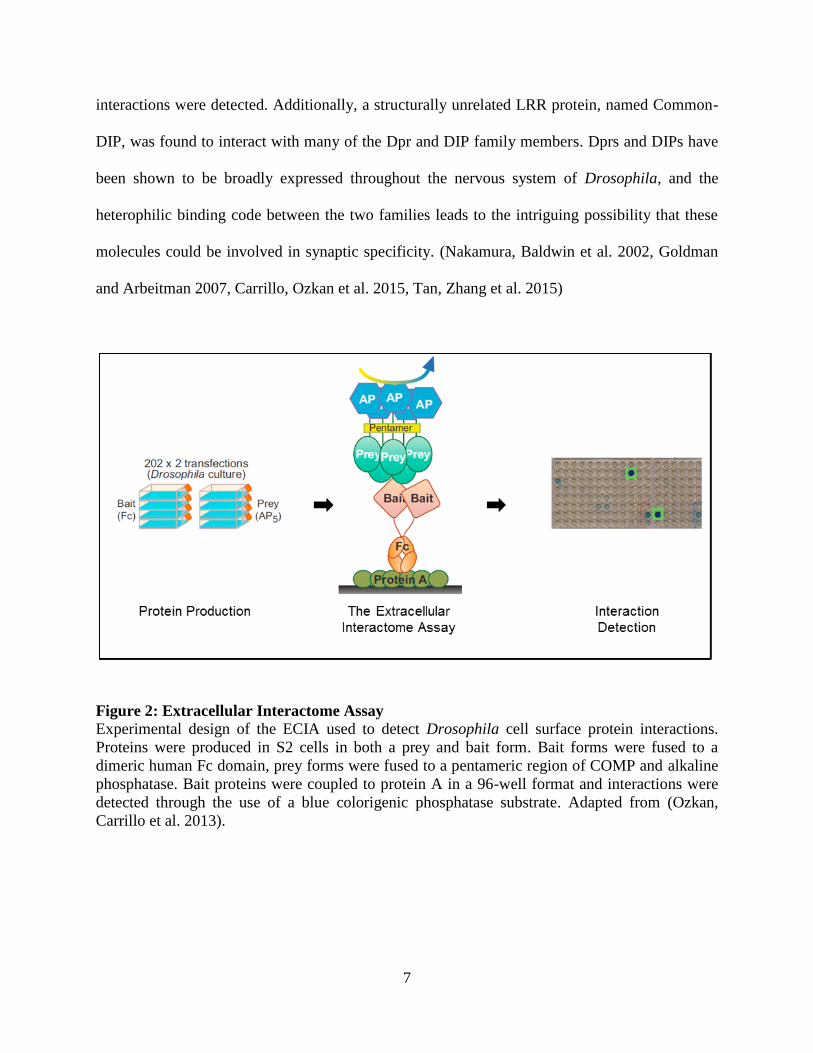
1.2 Drosophila Extracellular interactome
In an exciting advancement in the field, Ӧzkan and colleagues developed and
implemented a high-throughput extracellular interactome assay (ECIA) that examined the
pairwise interactions of 202 Drosophila cell-surface proteins belonging to IgSF, FnIII and
leucine-rich-repeat (LRR) families (Figure 2) (Ozkan, Carrillo et al. 2013). Both homophilic and
heterophilic interactions were tested, totaling 20,503 unique interactions interrogated.
For each protein tested, two constructs were made: a bait form which was fused to a
human dimeric FC domain, and a prey form which was fused to a pentameric helical region of
rat cartilage oligomeric matric protein (COMP) and alkaline phosphatase. By way of their FC
domain, bait proteins were immobilized to a protein-A coated surface and binding of
oligomerized prey protein to bait was visualized using a colorigenic phosphatase substrate
(Figure 2). Statistical analysis of intensities observed was used to determine interactions.
Oligomerization of prey molecules allowed for the ability to enhance detection of low affinity
interactions and the assay used only conditioned media with no purification steps in order to
facilitate high-throughput experiments.
This assay detected 86 unique heterophilic and 20 unique homophilic interactions among
members tested. One of its most significant findings was the discovery of an interaction network
between two closely related IgSF families of proteins, Dprs (Defective in proboscis response)
and a newly classified family named DIPs (Dpr interacting proteins). Follow-up experiments
with optimized forms of poorly expressed proteins identified a few more interactions between
the two families to create the interactome seen in Figure 3 (Carrillo, Ozkan et al. 2015). With the
exception of the two DIPs with no known interaction (CG31814 and CG40378), each DIP
interacts with a unique set of Dpr proteins. No homophilic interactions and only a few Dpr-Dpr
7
interactions were detected. Additionally, a structurally unrelated LRR protein, named Common-
DIP, was found to interact with many of the Dpr and DIP family members. Dprs and DIPs have
been shown to be broadly expressed throughout the nervous system of Drosophila, and the
heterophilic binding code between the two families leads to the intriguing possibility that these
molecules could be involved in synaptic specificity. (Nakamura, Baldwin et al. 2002, Goldman
and Arbeitman 2007, Carrillo, Ozkan et al. 2015, Tan, Zhang et al. 2015)
Figure 2: Extracellular Interactome Assay
Experimental design of the ECIA used to detect Drosophila cell surface protein interactions.
Proteins were produced in S2 cells in both a prey and bait form. Bait forms were fused to a
dimeric human Fc domain, prey forms were fused to a pentameric region of COMP and alkaline
phosphatase. Bait proteins were coupled to protein A in a 96-well format and interactions were
detected through the use of a blue colorigenic phosphatase substrate. Adapted from (Ozkan,
Carrillo et al. 2013).

8
Figure 3: Dpr-DIP Interactome
Dpr and DIP interactions detected in the ECIA assay. Dprs are in orange boxes and DIPs are in blue ovals with connected lines
indicated detected interactions. The green circles denote proteins that also interact with the LRR protein Common-DIP. Some Dprs are
grouped, indicating that they have the same DIP binding partner(s).

9
1.3 Dprs and DIPs
The Dpr family was first characterized by the discovery that flies homozygous mutant for
dpr1 displayed a reduction in the salt aversion response (Nakamura, Baldwin et al. 2002).
Closely related members to Dpr1 were grouped into a family that consists of 21 cell-surface
proteins whose ectodomains consist of two tandem immunoglobulin (IG) domains (Figure 4a),
while the ectodomains of all 11 members of the DIP family consist of three tandem IG domains
(Figure 4b) (Ozkan, Carrillo et al. 2013). For both families, the C-terminal region is slightly
ambiguous. Most Dprs are predicted to have a transmembrane helix and an intracellular region;
however four Dprs (11, 12, 19, 21) are predicted to be GPI anchored. DIP C-terminal regions are
more difficult to predict, with some family members having long disordered regions C-terminal
to the 3rd IG domain. Transmembrane helices are predicted for a few DIPs while about half are
predicted to be GPI anchored.
Only limited quantitative biophysical analysis of the Dpr-DIP interaction has been
reported. Surface plasmon resonanance (SPR) experiments determined the equilibrium
dissociation constant (KD) of Dpr6/DIP-α binding to be .37μM and Dpr11/DIP-γ binding to be
4.0μM (Carrillo, Ozkan et al. 2015). The only structural information known of Dpr and DIP
molecules was uncovered in a crystal structure of a two-domain fragment of DIP-α and a one-
domain fragment of Dpr6 (Figure 5a) (Carrillo, Ozkan et al. 2015). The membrane distal IG
domains (D1) of these molecules engage in a complex, which is characterized by van der wals
interactions and a buried core of hydrophobic residues. Targeted mutagenesis of hydrophobic or
hydrogen bonding residues on either the Dpr or DIP side of the interface disrupted the
heterophilic interaction as measured by SPR (Carrillo, Ozkan et al. 2015).

10
Superposition of this interaction with other known IG D1-D1 complexes of cell adhesion
molecules, SYG1-SYG2 and Nectin2-Nectin-2, showed a strong resemblance in interaction
topology (Figure 5b) (Carrillo, Ozkan et al. 2015). The high degree of sequence similarity of Dpr
D1 and DIP D1 among their respective families, 44% and 53% respectively, and the
conservation of residues along the interfacial region, indicate that complex seen in Dpr6/DIP-α is
likely conserved among all Dpr-DIP interactions. With no charge pairs seen in the interface, the
molecular determinants of specificity are believed to be shape complementarity between the Dpr
and DIP interfacial surfaces.
Figure 4: Dpr and DIP family domain topologies.
(a) Dpr family members are characterized by having two extracellular IG domains.
Transmembrane regions are difficult to predict, with four Dprs predicted to being GPI anchored.
(b) DIP family members have three extracellular IG domains, and like Dprs have difficult to
predict transmembrane regions, with six DIPs predicted to be GPI anchored.

11
Figure 5: Dpr6/DIP-α Crystal Structure
(a) Crystal structure of the Dpr6/DIP-α complex, consisting of a two-domain DIP-α fragment and
one-domain Dpr6 fragment, shows a D1-D1 interaction (PDB ID:5EO9) (b) Superposition of the
Dpr6/DIP-α D1-D1 interaction with other IgSF complexes shows a high degree of interaction
similarity. Adapted from (Carrillo, Ozkan et al. 2015)

12
1.4 Dpr/DIP expression in the Drosophila visual system
The Drosophila compound eye consists of approximately 800 ommatidia, each having
eight photoreceptor cells, R1-R8 (reviewed in Morante and Desplan 2004). The cells important
for motion detection, R1-R6, project their axons to the first neuropil, the lamina. The remaining
two photoreceptors, R7 and R8, which are responsible for color vision, extend through the
lamina and form their synaptic connections in the second neuropil, the medulla. Within the
lamina, R1-R6 synapse with a lamina “cartridge” which consists ~13 cells. Five of these are
lamina monopolar cells L1-L5, which like R7 and R8, form synaptic connections in specific
layers of a medulla column (Figure 6a and 6b). The medulla is more complex, containing
projections of at least 50 different types of neurons (Figure 6c) (Fischbach and Dittrich 1989).
Decades of work have mapped out some of the myriad of connections formed in the medulla and
more recently, serial electron micrographs have provided the most detailed connectome of their
synaptic partners (Takemura, Bharioke et al. 2013). These micrographs not only identify the
synapses formed between multiple cell types, but reveal a high level of consistency of these
connections between medulla columns (Takemura, Xu et al. 2015).
RNA sequencing (RNA-Seq) experiments performed on cultured lamina and R7 and R8
neurons reveal that each neuron expresses a unique set of members of the Dpr family (Tan,
Zhang et al. 2015). Intriguingly, expression reporters found that at least six members of the DIP
family are expressed in a layer specific matter in medulla neurons (Figure 6d) (Carrillo, Ozkan et
al. 2015, Tan, Zhang et al. 2015). Cognate Dpr/DIP expression is seen for many of the synaptic
connections formed between lamina or R7/R8 neurons and medulla neurons. The differential
expression of Dprs and the medulla layer specific expression of DIPs points to the exciting
possibility that these molecules are involved with synaptic specificity.

13
Figure 6: Drosophila visual system
(a) An overview of the first two neuropils in the Drosophila visual system. R7-R8 from the
retina and L1-L5 from the lamina terminate their axons in specific layers of the medulla. (b)
Serial EM reconstruction of the axonal projections of L1-L5 and R7-R8 in a single column of the
medulla shows the clear layer specificity of neuronal synapses. Axon colors are the same as in
(a). (c) The medulla, lobula and lobula plate neuropils. Highlighted are three general classes of
medulla neurons that are synaptic partners of L1-L5 and R7-R8. (d) The layer specificity of
lamina and R7-R8 neurons in the medulla overlayed with the DIP expression patterns for those
layers. Adapted from (Tan, Zhang et al. 2015).

14
1.5 Dpr/DIP function in the visual system
While Dprs and DIPs are expressed throughout the visual system, their role is not
completely understood and is an active field of study. The most well characterized phenotype
seen across multiple synaptic partners is cell loss of medulla neurons, summarized in Figure 7
(Zipursky Lab Correspondence). Depending on the cell type, 15-40% fewer DIP-α expressing
neurons Dm1, Dm4 and Dm12 are seen in DIP-α null animals when compared to wildtype. The
phenotype is mirrored in animals mutant for both dpr6 and dpr10, proteins that have been shown
to interact with DIP-α and are expressed on synaptic partners of the affected medulla neurons.
Interestingly, this phenotype does not appear in single mutants for dpr6 or dpr10, suggesting a
functional redundancy of these genes. Similar reduction in cell numbers is seen in mutants for
another cognate Dpr/DIP pair as well, where animals mutant for dpr11 or DIP-γ have reduced
numbers of DIP-γ expressing yDm8 neurons (Zipursky Lab correspondence) (Carrillo, Ozkan et
al. 2015).
Apoptotic cell death of neurons is widely observed during Drosophila nervous system
development (reviewed in Pinto-Teixeira, Konstantinides et al. 2016). Further genetic analysis of
Dm4 cell numbers in DIP-α mutants has shown that the cell loss in mutant animals can be
prevented by inhibiting the apoptotic pathway, indicating that DIP-α is required for correct Dm4
cell numbers. In mosaic analysis (MARCM) experiments, which introduce a subset of medulla
neurons that are null for DIP-α in a wildtype background, the cell loss of Dm4 and Dm12 mutant
neurons is even more severe than in whole animal mutants. This leads to the possibility of a
competition of survival mechanism among neurons, which is influenced by DIP-α interactions
(Zipursky lab correspondence)

15
In addition to cell loss, other Dpr/DIP phenotypes in the visual system related to synaptic
targeting have been observed. Flies that are mutant for dpr11 or DIP-γ both show misshaped yR7
axon terminals, many of which extend into deeper medulla layers (Carrillo, Ozkan et al. 2015).
In a separate set of cells, preliminary results from DIP-α MARCM experiments find that some
mutant Dm12 neurons will mistarget their axons to a different layer of the medulla (Zipursky lab
correspondence). This exciting result indicates a potential role of Dpr/DIP interactions in
synaptic targeting, although the mechanism behind this mistargeting is still under intense study.
Figure 7: Cell Death Seen in Dpr and DIP mutants
Summary of the synaptic partners where the cell death phenotype is seen in the Drosophila
visual system of dpr and DIP mutants. dpr6 and dpr10 are expressed in L2, L3 and L5 neurons,
dpr11 in yR7, DIP-α in Dm1, Dm4, and Dm12 neurons, and DIP-γ in yDm8. Animals null for
either the DIP or cognate binding Dpr(s) (in the case of DIP-α, both dpr6 and dpr10 must be
null) will have fewer Dm cells than wildtype. No change is seen lamina or R7 neuron numbers.
Adapted from (Zipursky Lab correspondence)

16
1.6 Dprs and DIPs in the musculoskeletal system
Dpr/DIP function is not limited to the visual neuropils, and expression of family members
has been visualized throughout the nervous system (Nakamura, Baldwin et al. 2002, Carrillo,
Ozkan et al. 2015). Analysis of expression of dpr6, 10, 11 and DIP-α, -β, and –γ in the 3rd instar
larval ventral nerve chord reveals that each gene is expressed in a unique subset of motor and
interneurons (Carrillo, Ozkan et al. 2015). Extensive analysis by the Mann lab has shown that
Dprs and DIPs are differentially expressed in motor and sensory neurons, as well as muscles, in
the adult Drosophila leg (Mann lab correspondence). Additionally, the Mann lab has identified
two DIP-α expressing motor neurons that fail to reach their wildtype targets of dpr10 expressing
muscles in DIP-α null or dpr10 null animals. Characterization of this phenotype is still ongoing,
but it provides more evidence that Dpr-DIP interactions are involved in synaptic targeting.
Dpr11 and DIP-γ mutants also display morphogenetic defects in the synaptic terminals of
the neuromuscular junction (NMJ), where expression for both of these genes has been observed
in muscle and motor neurons (Carrillo, Ozkan et al. 2015). Animals mutant for dpr11 or DIP-γ
show an increase number of boutons at the NMJ when compared to wildtype (Figure 8). This
satellite bouton phenotype can be rescued by either pan-neuronal or muscle-specific expression
in both dpr11 and DIP-γ animals, leading to the possibility that either trans or cis Dpr11/DIP-γ
interactions are involved in NMJ development.

17
Figure 8: Synaptic Bouton NMJ phenotype
The left panel shows the synaptic terminals of a wildtype neuromuscular junction. The middle
and right panel show the NMJ synaptic terminals of dpr11 and DIP-γ mutant animals
respectively. These mutant terminals have additional clusters of small boutons known as
“satellite boutons”. Adapted from (Carrillo, Ozkan et al. 2015).

18
1.7 Aims of this work
The goal of this work is to characterize the biophysical interactions of Dprs and DIPs in
an effort to greater understand their roles in nervous system development. Currently, an
interaction map between Dpr and DIP members has been determined; however there is little
information about the relative affinities of these interactions or how they influence function in
vivo. The only atomic level structural information of these molecules is a heterophilic complex
determined from fragments of the ectodomains. Combined with the interactome, it remains
unclear how the atomic level Dpr/DIP interaction in this complex determines specificity among
family members. Additionally, no structural information is known about the membrane proximal
domains or their importance to function. The specific aims of this dissertational work are as
follows:
a) Determine the range of binding affinities seen in Dpr/DIP interactions. Using the
published interactome as a guide, we set out to measure the affinities of these interactions
using surface plasmon resonance (SPR) in order to provide a more thorough
understanding of Dpr/DIP interaction and discover how binding strength may impact
their functional role.
b) Determine crystal structures of full IG ectodomain Dpr/DIP complexes. Using X-ray
crystallography we wanted to uncover what similarities and differences exist between the
interfaces of Dpr/DIP heterophilic complexes as well as reveal any potential interactions
that may occur with the membrane proximal domain.
c) Map out the specificity determinants of Dpr/DIP interactions. Using information from
our SPR experiments and structural studies, we plan to highlight the molecular
interactions in Dprs and DIPs that help confer the specificity of their interactions.

19
d) Investigate the oligomeric state of Dpr and DIP family members. Many cell surface
proteins have been shown to engage in both heterophilic and homophilic interactions.
While no homophilic interactions were detected in the high throughput assay detailing
Dpr/DIP interactions, we set out to use more robust experimental techniques like
analytical ultracentrifugation (AUC), to determine Dpr and DIP oligomeric state and
follow up with the use of X-crystallography to reveal the atomic structure of any of these
interactions.
e) Design molecules that can be used to probe Dpr/DIP function in vivo. While all of our
experimental work is in vitro, we can use our extensive biophysical knowledge of the Dpr
and DIP family to design molecules that affect interactions in ways that can reveal the
role of these molecules in an in vivo context.

20
Chapter 2:
Materials and Methods

21
2.1 Plasmid construction
For protein produced in human embryonic kidney cells (HEK293F), complementary
DNA sequences encoding the extracellular regions listed were amplified and inserted into the
mammalian expression vector VRC-8400 between the NotI and BamHI sites: Dpr1 (Tyr30-
Glu261), Dpr4 (Glu32-Glu245), Dpr5 (Gln60-Glu290) Dpr6S (Trp70-Glu275), Dpr6L (Asp24-
Glu275), Dpr7 (Thr37-Glu269), Dpr8 (Thr39-Glu244), Dpr10DS (Trp50-Glu255), Dpr10DL
(Tyr19-Glu255), Dpr10A (Trp50-Glu301), Dpr11 (Leu114-Glu324), Dpr12C (Ser72-Asp285),
Dpr12D (Ser72-Asp280), Dpr13 (Phe171-Asp375), Dpr19 (Asp23-Glu305), Dpr20 (Arg262-
Glu486) and Dpr21 (Asp48-Asp253), DIP-α (Phe40-Pro34), DIP-β (Ile82-Glu408), DIP-γ
(Gly22-Lys358), DIP-ε (Glu50-Ser351), DIP-ζ (Glu111-Tyr412), DIP-η (Gln31-Pro338), DIP-θ
(Asp128-Pro423). Nectin chimeras used the human nectin-1 sequence (Gln31-Met143) or human
nectin-3 (Gly58-Leu167) sequence followed by either Dpr10D(Val155-Glu255), Dpr10A
(Asp95-Glu301), or DIP-α (Ile142-Pro341). All sequences were preceded by the signal sequence of
human Binding immunoglobulin protein BiP, (MKLSLVAAMLLLLSAARA), and the kozak
sequence (GCCACC). Constructs were followed by a c-terminal hexa-histidine tag.
For proteins produced in Schneider 2 cells (S2), complementary DNA sequences
encoding the extracellular regions listed were amplified and inserted into a modified Expres2
vector (Expres2ion biotechnologies) between EcoRI and NotI sites: Dpr2( Tyr103-Glu323) Dpr3
(Gln233-Glu481), Dpr14 (Ser25-Glu283), Dpr16 (Leu195-Glu451), Dpr17 (Ser402-Glu616),
Dpr18 (His214-Glu478), DIP-ι (Ser22-Ala325). Sequences were preceded by the signal sequence
of human Binding immunoglobulin protein BiP, a 2A skip peptide
(GGAAGCGGAGCTACTAACTTCAGCCTGCTGAAGCAGGCTGGAGACGTGGAGGAGA

22
ACCCTGGACCT), EGFP and a kozak sequence (GCCGCCACC). Sequences were followed by
an octa-histidine tag.
2.2 HEK293 and S2 cell transfection
For proteins produced in HEK293 cells, transfection-grade plasmid DNA was used to
transiently transfect HEK293 cells using Polyethyleneimmine (PEI). DNA was mixed with
dissolved PEI Max (Polysciences Inc) at a 1:2.5 concentration in OptiMem media (Life
technologies). Typically, an 800ml suspension culture of 293 cells in Freestyle 293 media (Life
technologies) at a cell density of .8-1.2 million/ml would be transfected using 50ml of OptiMem
with 250μg of DNA and 625μg of PEI, and 200 additional ml of Freestyle 293 media would be
added 4-24 hours post transfection. Suspension cultures were grown at 37°, 10% CO2 and
conditioned Freestyle 293 media was harvested 6 days post transfection.
For proteins produced in S2 cells, 3ml cultures of S2 cells in non shaking 6 well plates
were transfected at 2mil/ml in EX-CELL 420 Serum-Free Medium (Sigma-Aldrich). 30ul of
ExpreS2 5xTR (Expres2ion biotechnologies) was mixed with 7.5ug of transfection-grade
plasmid DNA and added to the cultures. 2 hours post transfection, 600ul of heat inactivated fetal
bovine serum (FBS) (Life technologies) was added. 24 to 48hr days post transfection, zeocin was
added at a concentration of 2mg/ml to begin stable line selection. 2-3 days post transfection,
supernatant was changed and replaced with media containing 10% FBS and zeocin. For 2 weeks
following, media was either replaced or cell cultures were split in half by dilution everyday
depending on cell density. GFP expression was used to monitor and select successful
transfectants.

23
After the 2 week selection, cells were expanded to a T25 culture flask, and after reaching
confluency were then expanded to a T75 culture flask. Once confluency was reached in a T75,
antibiotic selection was complete and cells were centrifuged at 300g and resuspended in
Excell420 media with 10% serum at a cell density of 8million/ml into a 125ml shake flask.
Cultures were continually expanded while maintaining a cell density of 8-40mil/ml. Before final
expansion to a 1L culture at 8mil/ml, cells were centrifuged at 300g and resuspended in serum-
free Excell420 media. Cultures were grown for 5-6 days before harvesting media.
2.2 Protein purification
Conditioned media was equilibrated to 500mM NaCl, 10mM Tris-HCl pH 8.0, 3mM
CaCl2 and 5mM Imidazole pH 8.0 (or 20mM Imidazole for S2 conditioned media) and incubated
with Ni2+ charged IMAC Sepharose 6 Fast Flow resin (GE Healthcare) for 1 hour at 25°. Resin
was washed with at least 20 column volumes of 10mM Imidazole for HEK293produced proteins
and 20-50mM Imidazole for S2 produced proteins before proteins were eluted with 90mm
Imidazole. Gel electrophoresis with NuPage 4-12% Bis-TRIS gels (Life Technologies) was used
to detect which elutions contained desired protein.
Further purification by size-exclusion chromatography was performed using a Superdex
200 column (GE Healthcare) on an AKTA pure fast protein liquid chromatography system (GE
Healthcare). Final buffer concentration of most proteins was 150mM NaCl and 10mM Bis-TRIS
pH 6.0-6.6. In some cases, salt concentration was increased to 300mM or 500mM due to
solubility issues. DIP-η was purified in 150mM NaCl, 10mM Tris-HCl pH8.0. UV absorbance at
280nm was used to determine protein concentration and verification of purity was determined by
gel electrophoresis. Accurate molecular weights were determined through MALDI-TOF mass

24
spectrometry at the Proteomics Shared Resource facility at Columbia University. If possible,
proteins were concentrated to ~10mg/ml. Proteins were flash frozen in liquid nitrogen for long-
term storage.
2.3 Surface Plasmon Resonance (SPR) binding experiments
SPR binding assays were performed using a Biacore T100 biosensor equipped with a
Series S CM4 sensor chip. All proteins tested (DIPs, Dprs and Nectin chimeras) were
immobilized over independent flow cells using amine-coupling chemistry in HBS pH 7.4 (10mM
HEPES, 150mM NaCl) buffer at 25°C using a flow rate of 20 μL/min. DIP-η, which was
originally stored in a TRIS pH 8.0 buffer, was desalted into a buffer of 10mM Bis-TRIS, pH 6.6,
150 mM NaCl using the Zeba spin desalting columns (Thermo Scientific) prior to
immobilization. Dextran surfaces were activated for 7 minutes using equal volumes of 0.1M
NHS(N-Hydroxysuccinimide) and 0.4MEDC(1-Ethyl-3-(3-dimethylaminopropyl)carbodiimide).
Each protein of interest was immobilized at ~30μg/mL in 10 mM sodium acetate, pH 5.5 until
the desired immobilization level was achieved. The immobilized surface was blocked using a 4-
minute injection of 1.0 M ethanolamine, pH 8.5. Typical immobilization levels ranged between
700-900 RU. During the initial binding tests, an unmodified surface was used as a reference
surface to remove bulk refractive index shifts. Dprs showed nonspecific binding to the negatively
charged carboxyl groups of the unmodified dextran layer resulting in concentration-dependent
negative signals. To overcome this issue, BSA was immobilized over the reference surface using
the same amine-coupling protocol with the exception of using 50 μg/mL BSA in 10 mM sodium
acetate, pH 4.25 for 3 minutes. Subsequent experiments did not show signs of nonspecific
interactions.

25
Binding analysis was performed at 25°C in a running buffer of 10 mM Tris-HCl, pH 7.2,
150mM NaCl, 1mM EDTA, 1 mg/mL BSA and 0.01% (v/v) Tween-20. Analytes were prepared
in running buffer using a three-fold dilution series at the concentrations listed in text or figures,
with each concentration tested in duplicate. During a binding cycle, the association phase
between each analyte and the immobilized molecule was monitored for 40 seconds followed by
120-second dissociation phase, each at 50 μL/min. At the end of the dissociation phase the signal
returned back to baseline thus eliminating the need for a regeneration step. The last step was a
buffer wash injection at 100 μL/min for 60 seconds. The analyte was replaced by buffer every 2
or 3 binding cycles to double-reference the binding signals by removing systematic noise and
instrument drift. The responses between 35 and 39 seconds, at which point the binding reactions
achieve equilibrium as observed by the flat binding responses, were plotted against the
concentration of analyte. The data was fit to 1:1 interaction model and the KD was calculated as
the analyte concentration that would yield 0.5 Rmax (Cooper 2009). The data was processed using
Scrubber 2.0 (BioLogic Software).
For the SPR binding interactome, Dpr analytes were tested over three different chips
immobilized with DIP-α, -β and -γ (chip1), DIP-γ, -ε and -ζ (chip 2) and DIP-η, -θ and -ι (chip
3). All analytes were prepared in running buffer at 81-0.012 μM using a three-fold dilution series
with each concentration tested in duplicate. For these experiments, the association phase was
monitored for 30 seconds, which was sufficient time for binding reactions to reach equilibrium,
followed by a 120-second dissociation phase at 50 μL/min. All other steps were performed as
previously described for other experiments.
To ensure that the binding activity of the immobilized DIPs is maintained over the time
course of the experiment (over 96 hrs), a Dpr that was tested at the beginning of the experiment
26
was also repeated at the end of the experiment. For this purpose Dpr-6L was used for DIP-α, -β
and -γ, Dpr13 for DIP -γ, -ε and -ζ and Dpr4 for DIP-η, -θ and -ι. The responses between 25 and
29 seconds were plotted against the Dpr concentration and fit to an 1:1 interaction model to
calculate the KD. The binding reaction for each Dpr/DIP interaction was fitted to an independent
Rmax.
Signals for the Dpr concentration of 81μM were removed from the analysis of
interactions with KDs lower than 4μM (Dprs 10A, Dpr10D and Dpr6 binding over DIP-α and
Dpr17 binding over DIP-γ) since these contributed to nonspecific signals. Concentrations of 27
and 81μM for each Dpr8 and Dpr21 over DIP-β were also removed since the homophilic
interactions become predominant at such higher concentrations.
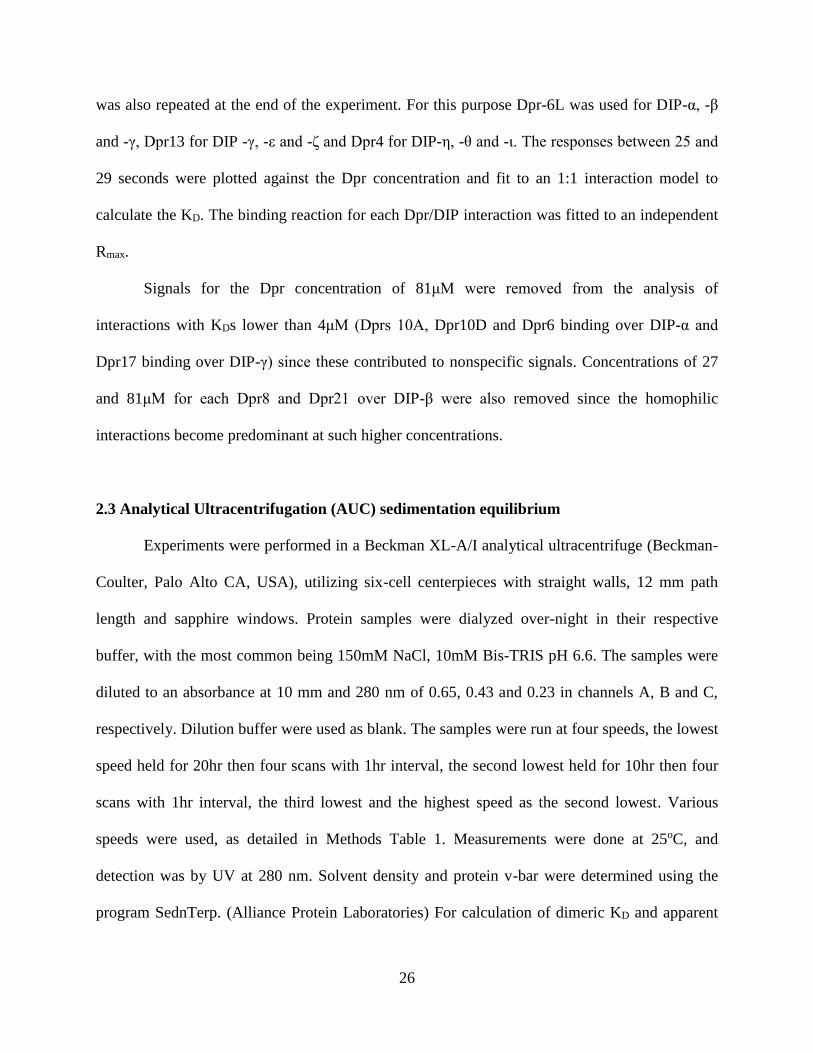
2.3 Analytical Ultracentrifugation (AUC) sedimentation equilibrium
Experiments were performed in a Beckman XL-A/I analytical ultracentrifuge (Beckman-
Coulter, Palo Alto CA, USA), utilizing six-cell centerpieces with straight walls, 12 mm path
length and sapphire windows. Protein samples were dialyzed over-night in their respective
buffer, with the most common being 150mM NaCl, 10mM Bis-TRIS pH 6.6. The samples were
diluted to an absorbance at 10 mm and 280 nm of 0.65, 0.43 and 0.23 in channels A, B and C,
respectively. Dilution buffer were used as blank. The samples were run at four speeds, the lowest
speed held for 20hr then four scans with 1hr interval, the second lowest held for 10hr then four
scans with 1hr interval, the third lowest and the highest speed as the second lowest. Various
speeds were used, as detailed in Methods Table 1. Measurements were done at 25oC, and
detection was by UV at 280 nm. Solvent density and protein v-bar were determined using the
program SednTerp. (Alliance Protein Laboratories) For calculation of dimeric KD and apparent

27
molecular weight, all useful data were used in a global fit, using the program HeteroAnalysis,
obtained from University of Connecticut. (www.biotech.uconn.edu/auf).
Methods Table 1: RPM speeds used for AUC experiments
15000, 19000, 23000, 27000 rpm
Dpr 1 Dpr 12 DIP-α I83D
Dpr 2 Dpr 13 DIP-α I86D
Dpr 3 Dpr 16 DIP-α L76K
Dpr 5 Dpr 17 DIP-α I91A
Dpr 7 Dpr 20 DIP-η
Dpr 8 Dpr 21 DIP-θ
Dpr 11 DIP-α WT DIP-ζ
13000, 17000, 21000, 25000 rpm
Dpr4
Dpr6L
Dpr10DL
15000, 18000, 21000, 24000 rpm
DIP-γ
DIP-θ
Dpr 19
2.4 SEC-MALS
Size exclusion chromatography with multi-angle static light scattering (SEC-MALS)
experiments was performed using an AKTA FPLC system with a Superdex 200 Increase 10/300
GL column (GE Healthcare). Proteins were flowed in a buffer of 150mM NaCl, 10mM Bis-
TRIS, pH6.0 and a flow of 0.5 mL/min. Injection volume was 100 μL, sample concentrations
were 81μM for DIP-α wildtype and 27 μM for DIP-α A39K. UV data at 280 nm was collected
with the AKTA UV detector, differential refractive index with a Wyatt Optilab TRex detector

28
and scattering data with a Wyatt DAWN Heleos-II detector (Wyatt Technology). Molecular
weights were calculated using the software Astra 6.1 (Wyatt Technologies), and calculation was
done using a regular Zimm-plot.
2.5 Crystallization
Sparse matrix screening was performed in sitting drop assays at 22°. For crystallization
of complexes, a 1:1 volume ratio of Dpr and DIP purified protein samples was mixed and
incubated on ice for at least 30 minutes before trays were set up. For Dpr4/DIP-η crystals, the 1:1
volume ratio was of: 11mg/ml (449μM) Dpr4 with 12mg/ml (332μM) DIP-η and for Dpr2/DIP-θ
crystals, 9.5mg/ml (371μM) of Dpr2 with 12.8mg/ml (377μM) of DIP-θ. DIP-θ was crystallized
at 12.8mg/ml concentration and DIP-α at an 8.8mg/ml concentration. 96 well sitting drop assays
were set up using a Mosquito robotic crystallization system (TTP lab tech) with 200nl drop
volumes consisting of 100nl protein mix and 100nl screening condition. Crystallization drops
were incubated and imaged using an automated Rock Imager (Fromulatrix).
Successful hits were further optimized in 24 well plates using a vapor diffusion method
with 1-2μl hanging drops at 22°. Protein mix to mother liquor ratios of 1:1, 2:1, and 1:2 ratios
mix was tested during optimization with a 2:1 ratio usually producing better crystals. Dpr4/DIP-
η crystallized in conditions from the Morpheus screen (Molecular Dimensions) and the condition
that produced diffracting crystals was: 28% Edo_p8k, .1M Morpheus Buffer 2 ph7.5, and 10%
Morpheus Carboxylic Acid mix. Edo_p8k is 40% v/v Ethylene glycol and 20% w/v PEG 4000,
Morpheus buffer 2 consists of Sodium HEPES and MOPS and Morpheus Carboxylic acids mix
is: 0.2M Sodium formate, 0.2M Ammonium acetate, 0.2M Sodium citrate tribasic dehydrate,
0.2M Sodium potassium tartrate tetrahydrate, 0.2M Sodium oxamate. Dpr2/DIP-θ crystals were

29
grown in 18% Peg 3,350, .2M TriNH4 Citrate pH 6.5. DIP-α crystals were grown in 2% PEG
3,350, 17% Tascimate pH7.0, .1M Hepes pH7.0. DIP-θ crystals were grown in 12% Peg 4,000,
.3M AmSO4, .08M NaAcetate pH4.6.
Crystals were harvested using nylon loops of various sizes mounted to metal bases
(Hampton Research) and were transferred and immersed to a cryoprotectant before being flash
frozed in liquid nitrogen for long term storage and data collection. Cryoprotectants consisted of
the crystallization condition with an additional 15% (2R,3R)-2,3-Butanediol for Dpr2/DIP-θ or
additional 30% glycerol for DIP-α and DIP-θ crystals. No additional cryoprotectant was used for
Dpr4/DIP-η since its condition already contained sufficient ethylene glycol.
2.6 Data collection and processing
X-ray diffraction data was collected at 100K from single crystals at Northeastern
Collaborative Access Team (NE-CAT) beamlines 24ID-C and 24ID-E at the Advanced Photon
Source, Argonne National Laboratory. All datasets were processed using XDS (Kabsch 2010)
and Aimless (Evans and Murshudov 2013) as part of the CCP4 suite (Winn, Ballard et al. 2011).
All structures were solved by molecular replacement using PHASER (McCoy, Grosse-
Kunstleve et al. 2007) in the Phenix suite (Adams, Afonine et al. 2010). For the Dpr4/DIP-η
structure, Dpr6 and DIP-α domains from (5EO9) was used as a model for Dpr4 D1 and DIP-η
D1-D2. An ensemble of models including SIRP alpha (4CMM) and Sdk1EC4 (5K6U) was used
to model DIP-η D3 and Dpr4D2. DIP-α was solved using domains from (5EO9) and its D3
domain was modelled with DIP-η D3. Dpr2/DIP-θ and DIP-θ structures were solved using
models derived from the Dpr4/DIP-η structure. Structures were refined by iterative rounds of
model building in Coot (Emsley, Lohkamp et al. 2010), automated refinement using

30
phenix.refine (Afonine, Grosse-Kunstleve et al. 2012) and finalized with PDB-REDO (Joosten,
Long et al. 2014).

31
Chapter 3:
Construct design and protein production

32
3.1 Construct design
Previous work that determined the Dpr-DIP interactome used the full extracellular
regions of both Dpr and DIP for their studies (Ozkan, Carrillo et al. 2013). Subsequent work
using fragments of the ectodomain showed that the binding interface between Dpr6 and DIP-α is
in the membrane distal IG domain of each molecule (Carrillo, Ozkan et al. 2015). Cell surface
proteins can engage in multiple interactions along their ectodomains, many times in both trans
and cis (Harrison, Jin et al. 2011, Goodman, Rubinstein et al. 2017). To account for all possible
interactions between IG domains, we chose to work with soluble proteins that included the
complete IG ectodomain region of Dprs and DIPs. In order to be more amenable to
crystallization, these molecules did not contain the variable length linker regions between the
membrane proximal IG domain and transmembrane region of Dprs and DIPs.
In order to rapidly produce large quantities of soluble glycosylated protein for
quantitative experiments, we expressed our molecules in a Human embryonic kidney 293
(HEK293) suspension cell system (see materials and methods). In our mammalian expression
system, using the native Drosophila signal peptide of each Dpr/DIP would likely lead to
misexpression and low yield. Unfortunately, it proved difficult to predict where the native signal
peptide of each protein terminated. When identifying signal peptides for the initial interactome
studies, this was addressed by using the prediction programs SignalP3.0 and Phobius as well as
comparisons to orthologous genes in other arthropods (Ozkan, Carrillo et al. 2013).
Some of these predictions allowed for long disordered regions of amino acids between
the end of the signal peptide and the beginning of D1. These long N-terminal regions could have
an effect on binding, however it is unknown whether they are present in vivo. When designing
the n-terminus of our molecules, we used either a prediction from SignalP4.1, the n-terminus

33
used in the previous interactome study or a construct with an additional 2-3 amino acids n-
terminal of D1. The n-terminus length for each molecule used in this study can be seen in Table
1. To test if the predicted long disordered regions do have an effect on binding, two molecules
with long n-termini, constructs Dpr6L and Dpr10DL, were made to test alongside their shorter
constructs, Dpr6S and Dpr10DS. Additionally, alternate isoforms of Dpr10 and Dpr12 were
included in SPR binding experiments. Dpr10A has a 47 amino acid linker between IG domains
compared to just one amino acid in Dpr10D. The difference between the Dpr12C and Dpr12D
isoform is more subtle, where Dpr12C has an additional five residues in the BC Loop.
Table 1: Summary of Dpr & DIP Protein Constructs
Protein
# of Amino Acids Before IG D1
Construct SignalP 4.1
Cell Expression System
Dprs
Dpr1 23 23 HEK 293F Cells
Dpr2 3 N/A Drosophila S2
Dpr3 3 N/A Drosophila S2
Dpr4 13 13 HEK 293F Cells
Dpr5 30 30 HEK 293F Cells
Dpr6S 3 49 HEK 293F Cells
Dpr6L 49 49 HEK 293F Cells
Dpr7 14 N/A HEK 293F Cells
Dpr8 3 20 HEK 293F Cells
Dpr10A/D 3 34 HEK 293F Cells
Dpr10DL 34 34 HEK 293F Cells
Dpr11 3 N/A HEK 293F Cells
Dpr12C/D 3 40 HEK 293F Cells
Dpr13 3 N/A HEK 293F Cells
Dpr14 49 50 Drosophila S2
Dpr16 3 N/A Drosophila S2
Dpr17 3 N/A Drosophila S2
Dpr18 3 N/A Drosophila S2
34
Dpr19 17 17 HEK 293F Cells
Dpr20 3 N/A HEK 293F Cells
Dpr21 3 29 HEK 293F Cells
DIPs
DIP-α 2 2 HEK 293F Cells
DIP-β 16 N/A HEK 293F Cells
DIP-ε 2 27 HEK 293F Cells
DIP-γ 17 17 HEK 293F Cells
DIP-η 12 12 HEK 293F Cells
DIP-ι 9 25 Drosophila S2
DIP-θ 2 N/A HEK 293F Cells
DIP-ζ 2 90 HEK 293F Cells
3.2 Expression results
We were able to produce the majority of Dpr and DIP proteins in HEK293F cells. For
many of the proteins that did not express in our mammalian system, we successfully generated
stable expressing lines of Drosophila Schneider 2 Cells (S2) (see material and methods). Table 1
indicates the expression system used for each protein we produced. Only two Dprs could not be
expressed in either system, Dpr9 and Dpr15. DIP-δ could be produced in both cell types,
however the protein was highly unstable and was unable to be used for any biophysical
experiments. DIP family members CG31814 and CG40378, which were not shown to bind to
any Dprs in the previously published interactome, were unable to be expressed in HEK293 cells
and were not tested in our S2 cell expression system.
Sequence analysis of Dprs and DIPs reveals multiple predicted glycosylation sites and gel
electrophoresis and matrix-assisted laser desorption/ionization (MALDI) mass spectrometry
revealed larger molecular weights than predicted for all constructs (Table 2). Gel electrophoresis
of EndoH treated Dpr and DIP proteins produced in glycosylation deficient HEK293 GNTI- cells

35
showed significant shifts to smaller molecular weights, indicating that much of the additional
molecular weight is from N-linked glycans. This result is expected since many cell surface
proteins are glycosylated and all of our molecules are expressed in eukaryotic expression
systems that contain the glycosylation machinery. Proper glycosylation is ideal, since
biophysical analysis of proteins that are not glycosylated can lead to the detection of multimer
associations that are not present in vivo (Brasch, Harrison et al. 2011).

36
Table 2: Theoretical and MALDI determined Mol.Weights of Dpr and DIP constructs
Protein
Theoretical
(Da)
MALDI
(Da)
Predicted Mol.
Wt of glycans
(Da)
Dprs
Dpr1 26,700 36,700 10,000
Dpr2 25,600 27,800 2,200
Dpr3 28,700 30,900 2,200
Dpr4 24,700 29,500 4,800
Dpr5 26,800 34,000 7,200
Dpr6S 24,000 30,400 6,400
Dpr7 26,900 33,300 6,400
Dpr8 23,600 29,200 5,600
Dpr10L 27,900 34,300 6,400
Dpr11 24,200 28,500 4,300
Dpr12 25,000 29,000 4,000
Dpr13 24,000 28,000 4,000
Dpr14 30,600 37,000 6,400
Dpr16 29,300 33,600 4,300
Dpr17 25,600 28,500 2,900
Dpr18 31,100 36,400 5,300
Dpr19 32,100 39,800 7,700
Dpr20 26,300 34,800 8,500
Dpr21 23,600 28,900 5,300
DIPs
DIP-α 34,500 36,400 1,900
DIP-β 37,900 39,000 1,100
DIP-γ 37,800 41,700 3,900
DIP-η 34,900 40,500 5,600
DIP-θ 34,100 44,000 9,900
DIP-ε 35,000 43,000 8,000
DIP-ζ 34,900 40,900 6,000
DIP-ι 35,500 N/A N/A

37
Chapter 4:
Quantitative interactome reveals new interactions and binding
affinities

38
4.1 Drawbacks of previous Dpr-DIP interaction studies
Dpr and DIP interactions were first discovered in a high-throughput assay used to analyze
interactions of 202 cell-surface Drosophila proteins belonging to the IgSF, FnIII or LRR families
(Ozkan, Carrillo et al. 2013). Each protein was secreted in S2 cells in two forms: a bait form
fused to a dimeric human FC domain, and a prey form fused to alkaline phosphatase.
Additionally, a pentameric helical region of rat cartilage oligomeric matrix protein (COMP) was
fused to the prey protein to allow pentamerization of the protein, increasing the avidity in an
effort to detect low affinity interactions. Bait proteins were bound to a protein A coated surface
in 96-well format and prey proteins were assayed, with a colorigenic phosphatase substrate used
to determine successful interactions. All interactions were assayed in both bait/prey orientations
and neither bait nor prey protein were purified from the S2 conditioned media.
While this assay is well suited for screening and determining interactions among large
families of proteins, it reveals no information about the binding affinities of these interactions.
More importantly, many of the experimental features optimized for high throughput screening
can introduce significant amounts of error: the proteins are not purified, have unknown
concentrations and are oligomerized. Each one of these factors can contribute to recording false
negatives or false positives (Bushell, Sollner et al. 2008). Additionally, by measuring binding
qualitatively, interpretation of the data can lead to ambiguous results. Some interactions only
appear in one orientation and the statistical normalization used to remove non-specific
interactions can remove true positives.

39
4.2 Surface plasmon resonance:
Surface Plasmon Resonance (SPR) is an optical phenomenon that occurs at the interface
between a metal (typically gold or silver) and a media of a different refractive index (Jason-
Moller, Murphy et al. 2006). In an SPR biosensor, a thin layer of gold lies between a glass prism
and a liquid solution phase. When incident light is focused on the back of the prism under
conditions of total internal reflection, an evanescent wave is transferred to the gold layer and the
gold/liquid interface. At a specific angle of incident light, the evanescent wave couples with
electrons in the gold layer and emits surface plasmons, causing the reflected light to reach a
minimum in intensity. This angle is known as the SPR angle, and the resonance that occurs is
highly sensitive to changes at the metal-liquid boundary. A change in mass resulting from two
interacting molecules forming a complex at this boundary, will alter the refractive index, causing
a shift in the SPR angle. These shifts are measured in response units (RU) where 1 RU
corresponds to a .0001° change in the SPR angle (Stenberg, Persson et al. 1991, Jason-Moller,
Murphy et al. 2006).
SPR is suited to studies of a wide range of systems, as small as metals or drug molecules
that bind to proteins, or even whole viral particles. Typically, one molecule, referred to as the
ligand is tethered to the dextran layer of the gold sensor chip. At this stage, the ligand is exposed
to an analyte, which is flowed over the surface in buffer. Any binding between ligand and
analyte can be detected in the SPR response, which is proportional to the mass of analyte binding
to the sensor chip surface.
A variety of surface coatings and immobilization methods can be used to best optimize
the experimental conditions. One commonly used surface for protein experiments is a dextran
layer covalently bound to an alkanethiol monolayer on the gold surface (Jason-Moller, Murphy

40
et al. 2006). This dextran can be modified in multiple ways, such as covalently linking
streptavidin, which can capture biotinylated molecules, or covalently linking NiCl2-activated
nitrilotriacetic acid (NTA) groups which can bind to His-tagged proteins (Jason-Moller, Murphy
et al. 2006). In the work presented in this thesis, proteins were immobilized directly to the
dextran surface using amine-coupling chemistry, resulting in proteins that are covalently linked
to the surface at primary amines: either their N-terminus or a surface exposed lysine side chain.
One of the most common uses of SPR is the determination of binding affinity constants
between molecules. In a 1:1 interaction under steady state conditions, the dissociation constant
(KD) between binding partners A and B is defined as 𝐾𝐷 = [𝐴][𝐵]
[𝐴𝐵]. In an SPR experiment, a
binding response can be measured when known concentrations of an analyte (A) are flowed over
a surface that has an immobilized binding partner (B). The fraction of bound sites of B is equal
to 𝑅
𝑅𝑚𝑎𝑥=
[𝐴𝐵]
[𝐵]+[𝐴𝐵], where R is the SPR binding response and Rmax is the binding response when
all of B binding sites are occupied. Combining these equations results in 𝑅 =𝑅𝑚𝑎𝑥[𝐴]
𝐾𝐷+[𝐴] , which can
model the isotherm generated from binding responses measured at a series of analyte
concentrations (A) as seen in Figure 9 (Rich and Myszka 2009).
In order to accurately calculate the KD of an interaction, a wide range of analyte
concentrations must be measured. Ideally, the range should cover concentrations that are at least
10-fold weaker and 10-fold stronger than the estimated KD. An appropriate dilution series within
this range can insure that enough data points are collected to accurately fit a binding isotherm
(Rich and Myszka 2009). An accurate Rmax is also necessary to correctly determine binding
affinities. The Rmax can be experimentally measured; however it is not always possible when
measuring low-affinity interactions or where high concentrations of analytes are not feasible.

41
Additionally, high concentrations of some analytes can introduce non-specific interactions that
affect the SPR response. While it is ideal to measure responses at concentrations that approach
saturation, previous studies have shown that high confidence KD values can still be determined
even if the Rmax is not reached (Supp Figure 1) (Rich and Myszka 2009).
When calculating the KD of a protein-protein interaction, it is crucial to know the
homophilic properties of the analyte. If the protein analyte has a homophilic interface that occurs
along a different binding site than the interaction probed in SPR, both monomers and multimers
can bind to the immobilized ligand. Since SPR responses are proportional to the mass binding to
surface ligands, this heterogeneity of the analyte mass would prevent the determination of an
accurate binding affinity. Analytes with a homophilic interaction competing for the same binding
site will also disrupt a 1:1 binding model. Homophilic interactions in the analyte make it
impossible to know accurately the concentration of the free unbound analyte available for
interaction with the protein immobilized on the surface. Using a 1:1 model will result in an
incorrect binding affinity except in cases where the homophilic interaction in solution is many
orders of magnitude weaker than the heterophilic interaction measured on the sensor chip
(Harrison, Vendome et al. 2012).

42
Figure 9: Example binding responses and binding isotherm Binding responses of a dilution series of an analyte are measured and are featured in the overlaid
sensorgrams on the left. These results are plotted against the concentration of analyte tested, and
a 1:1 interaction model is fit to calculate the Rmax, as seen on the right. The KD is defined as the
analyte concentration that would yield 50% of the Rmax .
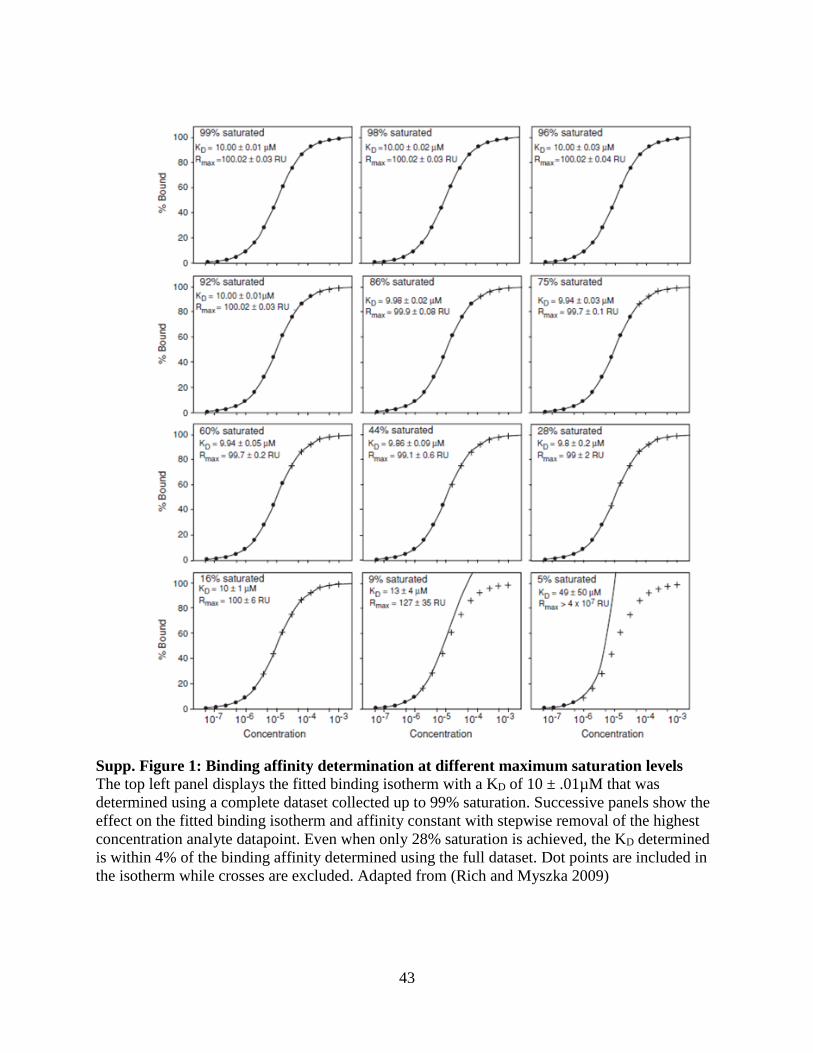
43
Supp. Figure 1: Binding affinity determination at different maximum saturation levels
The top left panel displays the fitted binding isotherm with a KD of 10 ± .01µM that was
determined using a complete dataset collected up to 99% saturation. Successive panels show the
effect on the fitted binding isotherm and affinity constant with stepwise removal of the highest
concentration analyte datapoint. Even when only 28% saturation is achieved, the KD determined
is within 4% of the binding affinity determined using the full dataset. Dot points are included in
the isotherm while crosses are excluded. Adapted from (Rich and Myszka 2009)
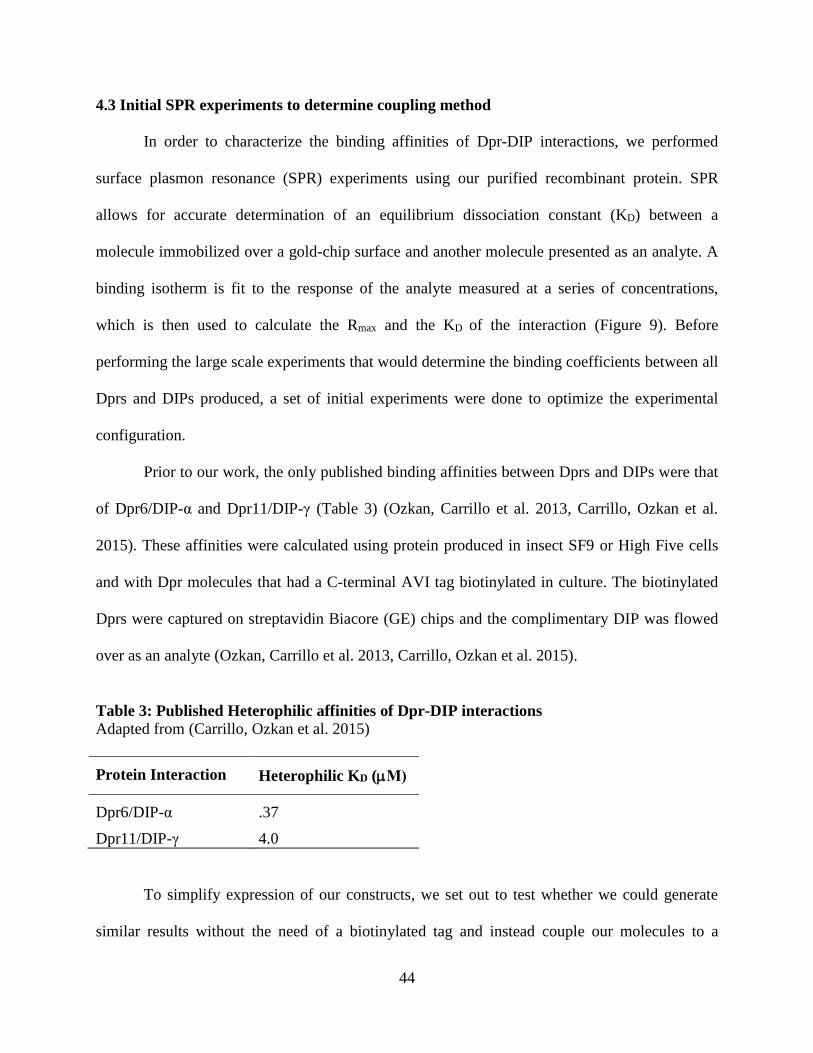
44
4.3 Initial SPR experiments to determine coupling method
In order to characterize the binding affinities of Dpr-DIP interactions, we performed
surface plasmon resonance (SPR) experiments using our purified recombinant protein. SPR
allows for accurate determination of an equilibrium dissociation constant (KD) between a
molecule immobilized over a gold-chip surface and another molecule presented as an analyte. A
binding isotherm is fit to the response of the analyte measured at a series of concentrations,
which is then used to calculate the Rmax and the KD of the interaction (Figure 9). Before
performing the large scale experiments that would determine the binding coefficients between all
Dprs and DIPs produced, a set of initial experiments were done to optimize the experimental
configuration.
Prior to our work, the only published binding affinities between Dprs and DIPs were that
of Dpr6/DIP-α and Dpr11/DIP-γ (Table 3) (Ozkan, Carrillo et al. 2013, Carrillo, Ozkan et al.
2015). These affinities were calculated using protein produced in insect SF9 or High Five cells
and with Dpr molecules that had a C-terminal AVI tag biotinylated in culture. The biotinylated
Dprs were captured on streptavidin Biacore (GE) chips and the complimentary DIP was flowed
over as an analyte (Ozkan, Carrillo et al. 2013, Carrillo, Ozkan et al. 2015).
Table 3: Published Heterophilic affinities of Dpr-DIP interactions Adapted from (Carrillo, Ozkan et al. 2015)
Protein Interaction Heterophilic KD (M)
Dpr6/DIP-α .37
Dpr11/DIP-γ 4.0
To simplify expression of our constructs, we set out to test whether we could generate
similar results without the need of a biotinylated tag and instead couple our molecules to a

45
dextran biacore chip using amine-coupling chemistry. This experimental setup has proven to be
successful in detecting heterophilic and homophilic interactions in sidekick proteins, a family of
IG neural cell adhesion molecules (Goodman, Yamagata et al. 2016). We performed preliminary
experiments in both orientations with a small set of Dprs and DIPs (Figure 10 and Table 4)
In the experimental configuration where DIPs were immobilized, Dprs were tested at 8
concentrations ranging from 9-.004M for Dpr6S and 27-.012M for both Dpr4 and Dpr6L
(Figure 10a). Using the Dpr as the analyte introduced a technical issue where many of the Dprs
showed increased non-specific binding to the unmodified reference cell (Figure 11). This non-
specific binding is likely caused by high amounts of glycosylation seen on the Dprs (Table 2 in
Chapter 3). In order to eliminate non-specific interactions, the reference surface was immobilized
with BSA and 1mg/ml of BSA was used in the running buffer for all experiments as well.
For SPR experiments performed in the reverse orientation where Dpr molecules are
immobilized, 8 concentrations ranging from 4.5-.006M for DIP-α, 27-.012M for DIP-θ and
54-.025M for DIP-η were tested (Figure 10b).

46
Figure 10: Initial SPR experiments SPR sensorgrams and fitted binding isotherms from experiments with amine-coupled molecules. The Y-
axis labeling denotes the immobilized molecule for that row and the X-axis denotes the analyte tested for
that column. The far right column shows the fitted binding isotherm with calculated KD and error of the fit
in (). (a) DIP molecules are immobilized and Dprs are flowed as analytes. (b) Reverse orientation where
Dpr molecules are immobilized and DIPs are flowed as analytes.

47
Table 4: Results from initial amine-coupled SPR experiments
Binding Pair Immobilized Analyte KD (M)
DIP-/Dpr6S DIP- Dpr6S 2.24(1)
Dpr6S DIP- 0.4781(7)
DIP-/Dpr6L DIP- Dpr6L 5.93(3)
Dpr6L DIP- 0.4161(7)
DIP-θ/Dpr4 DIP-θ Dpr4 10.46(5)
Dpr4 DIP-θ 7.66(8)
DIP-η/Dpr4 DIP-η Dpr4 42.7(1)
Dpr4 DIP-η 17.8(2)
The KD of binding between Dpr6S and DIP-α was 0.478M when Dpr6S was the
immobilized molecule, an almost identical KD to previously published data- confirming that
molecules immobilized with amine-coupling chemistry produce the same results as experiments
using biotinylated molecules immobilized to streptavidin. Interestingly, the reverse orientation
where the DIP is immobilized showed a weaker binding strength among all Dpr-DIP pairs tested.
We later determined through AUC experiments (discussed in Chapter 7) that many of the DIPs,
including DIP-α, -η and –θ form homodimers, while the majority of Dprs are monomeric. This
difference in oligomerization may be one factor that influences the discrepancy between the KDs
determined from our experiments performed in both orientations.
Additionally, our preliminary results indicate that having a longer amino acid region n-
terminal to D1 does not significantly impact binding. In experiments where the Dpr is
immobilized, we see a negligible difference in binding affinity of DIP-α between Dpr6S/Dpr6L,
and only a ~2-fold difference in binding affinity between these molecules and a DIP-α
48
immobilized surface. Even with a 46 residue longer n-terminal region, the differences in affinity
were minor, and we felt confident that our molecules would provide a biologically relevant KD,
even if the n-terminus was not identical to what was seen in vivo.
Ultimately, immobilizing the DIP molecule and flowing Dprs as analytes was chosen as
the orientation in which to perform the large scale heterophilic binding studies (Figure 10a). This
orientation was seen as more ideal since AUC experiments showed that at least 4 of the 7 DIPs
tested behaved as homodimers compared to only 3 of the 18 Dprs tested (discussed in Chapter
7). By coupling the molecules that are dimeric and flowing the molecules that are monomeric, a
more accurate KD can be determined since the competitive homophilic interactions that occur in
the mobile phase are removed.
Figure 11: Non-specific binding of Dpr Analytes
The left panel shows the effect on binding responses of nonspecific binding of Dpr analytes to
the dextran reference cell. The right panel shows the reduction of these effects when the
reference cell is immobilized with BSA.

49
4.4 Technical issues of a large scale SPR experiment
SPR was used to measure heterophilic binding between 8 of the 11 DIP molecules and 23
different Dpr molecules, which included 19 of the 21 Dprs as well as alternate isoforms of
Dpr10, Dpr12 and two additional long n-terminal forms of Dpr6 and Dpr10. Only 3 DIPs could
be coupled to a chip per experiment and were grouped based on similar binding partners in order
to more accurately compare affinities. These groups were DIP-α, -β, -γ, DIP-η, -θ, -ι and DIP-ε, -
ζ, -γ. DIP-γ was tested in duplicate, and affinities determined were replicated in both experiments
within experimental error. In all experiments, Dprs were flowed as analytes in a three-fold
dilution series ranging from 81-.012M (see Chapter 2 for more detail).
Due to the sheer number of analytes and concentrations being tested, only 5-6 analytes
could be tested in a 24-hour period. This resulted in each DIP being immobilized for 5 days in
order to measure affinities to all 23 Dpr constructs tested. Since our goal is to compare accurate
binding affinities within the Dpr family, it was necessary to confirm that any potential
degradation of the coupled DIP did not affect binding of analytes tested 3-5 days after the DIP
was immobilized. To control for this, we compared binding of an analyte on the first day post
coupling with binding measured four days post coupling. All DIPs tested showed similar binding
affinities to the control Dpr on the first and last day of experiments, thus providing evidence that
any protein degradation over the course of the experiment did not impact affinities (Figure 12).

50
Figure 12: Variability of SPR experiments performed
Each panel shows the calculated binding isotherms of a select Dpr with each of the immobilized
DIP surfaces used for the SPR interactome experiments. The calculated KD displayed in blue and
denoted by (B) is the result from the initial day (Beginning) of binding experiments. The
calculated KD displayed in red and denoted by (E) is the result from the last day of binding
experiments performed on that surface, 4 days post coupling (End). As can be observed, all
binding surfaces maintained their activity over the course of the multi-day experiments.
51
4.5 Heterophilic Dpr-DIP binding affinities
In all, accurate binding affinities less than 300M were determined for 42 of the potential
184 heterophilic interactions tested (Table 5 and Figures 13 and 14). When classifying what
constituted as a Dpr-DIP interaction pair, KDs determined to be above 300M were considered
as non-binding. The interactions are mapped out in Figure 15 in our updated “quantitative”
interactome. Greyed out in this figure are Dpr9, Dpr15 and DIP-δ, which we were unable to test
but are organized based on the findings of the ECIA (Ozkan, Carrillo et al. 2013).
Only small differences were seen in binding affinities between the two alternate isoforms
Dpr10DS and Dpr10AS, indicating the long linker region between D1 and D2 has no effect on
binding interactions. No significant binding affinity could be determined for either Dpr12
isoform; however this was not a surprise since none of the DIP proteins tested were shown to
bind to Dpr12 in a previous study (Ozkan, Carrillo et al. 2013). In order to more accurately
compare affinity differences of Dpr12 isoforms, DIP-δ and Common-DIP would be needed to be
included in an SPR study.
It was also seen that the long n-terminus form of Dpr6 and Dpr10 showed small
differences in binding affinities compared to their respective short n-terminus forms. Dpr6L,
which has an additional 46 residues n-terminal to D1 compared to Dpr6S, has binding affinities
that were two-fold weaker than its shorter construct. With KDs larger than 300M being our
threshold for interaction, this results in two fewer binding partners for Dpr6L: DIP-ε and DIP-ζ.
However, the Dpr6S affinities to these DIPs are fairly weak and already near the 300M
threshold. Dpr10D -L and -S constructs have a 31 n-terminal residue difference and our
experiments showed no significant difference in binding affinities. These results lead us to

52
believe that even though some of our constructs may not have the correct in vivo n-terminus
preceding D1, this region has minimal effects on the binding affinity.
Accurate binding coefficients could not be determined for Dpr2 to DIP-ι or DIP-η,
however it was clear from the responses that binding was occurring (6th and 8th row of Figure
13). Binding affinities could be calculated between Dpr2 and DIP-θ however, indicating that the
Dpr2 protein was functional.
Figure 13: SPR sensorgrams of Dpr-DIP interactions
SPR analysis of Dpr analytes binding over individual surfaces of DIP-α (top row), DIP -β, DIP -
γ, DIP-ε, DIP-ζ, DIP -η, DIP-θ, and DIP-ι (bottom row). Within a row, the Dpr responses are
organized left to right from strongest to weakest affinities, and profiles of analytes with >300μM
affinity to the immobilized surface are overlaid in the rightmost panel of each row. With the
exception of DIP-ε and DIP-ζ, which bind the same set, each DIP binds to a unique set of Dprs.

53
Figure 14: Fitted binding isotherms of Dpr-DIP interactions
Each panel shows the fitted binding isotherms of all Dpr analytes to an individual immobilized
DIP, which is labeled in the top left corner of the panel. Labeled curves are Dprs that have a
binding affinity stronger than 300μM to the immobilized DIP. In order to classify what was
considered an interaction, Dprs that occupied less than 20% of the DIP binding sites at the
highest concentration tested, 81μM, were not considered to interact.

54
Figure 15: Updated Quantitative Interactome
Dpr-DIP interactions as determined by SPR experiments. Color and dashes of line indicate the affinity strength of interactions. An
accurate binding affinity could not be determined for two Dpr2 interactions and they are denoted by dotted lines. Greyed out ovals
Dpr9, Dpr15 and DIP-δ, were not tested using SPR and their interactions are organized according to results from the ECIA (Carrillo,
Ozkan et al. 2015). From our results, three DIP subgroups emerge: DIP-α/β/γ, DIP-ε/ζ and DIP-η/θ/ι. With the exception of Dpr6, all
other Dprs interact with members of only one DIP subgroup. The DIP-α/β/γ subgroup engages in the strongest interactions, while the
DIP-η/θ/ι subgroup is characterized by many weak interactions. The DIP-ε/ζ subgroup is the only group where all DIPs engage the
same set of Dpr interactors and their affinities generally fall in between those seen for the other two subgroups.

55
Table 5: Calculated KDs of Dpr-DIP interactions (μM)
() Denotes error of fit
ND- not determined
DIP-α DIP-β DIP-γ DIP-ε DIP-ζ DIP-η DIP-θ DIP-ι
Dpr1 >500 >500 >1000 >500 >500 85.4(7) 208(4) 88.6(7)
Dpr2 >500 >500 >1000 >1000 >500 ND 76.6(5) ND
Dpr3 >500 >500 >1000 >500 >500 134(2) >500 71.1(6)
Dpr4 >1000 >1000 >1000 >1000 >500 77.7(5) 36.5(1) 35.8(1)
Dpr5 >500 >500 >1000 >500 >500 149(2) 119.4(9) 114(1)
Dpr7 >500 >500 >1000 >1000 >500 >500 >500 136(2)
Dpr12C >1000 >500 >1000 >1000 >500 >1000 >1000 >500
Dpr12D >1000 >500 >1000 >1000 >500 >1000 >1000 >1000
Dpr6S 2.064(8) 19.42(7) >1000 210(10) 151(4) >500 >500 > 400
Dpr6L 5.09(2) 39.3(2) >1000 >400 >300 >500 >500 >500
Dpr10DS 1.672(7) 54.9(6) >1000 >1000 >500 >1000 >1000 >1000
Dpr10A 1.340(5) 75(1) >1000 >500 >300 >1000 >1000 >1000
Dpr8 >500 1.522(6) >1000 >1000 >500 >1000 >1000 >500
Dpr21 >1000 1.83(1) >1000 >1000 >1000 >1000 >1000 >500
Dpr11 >500 94(1) 8.19(3) >1000 >500 >1000 >500 >400
Dpr16 >500 >500 10.38(3) >500 >300 >1000 >1000 >500
Dpr17 >400 111(2) 3.81(2) >500 >300 >1000 >1000 >300
Dpr13 >1000 >500 >1000 28.0(2) 31.9(2) >1000 >1000 >500
Dpr14 >500 >500 >1000 69.2(8) 106(2) >500 >500 > 300
Dpr18 >500 >500 >1000 21.2(1) 24.7(2) >500 >500 > 300
Dpr19 >300 >500 >1000 25.6(1) 47.3(3) >1000 >1000 >500
Dpr20 >500 >500 >500 31.5(2) 51.5(4) >300 >500 >400
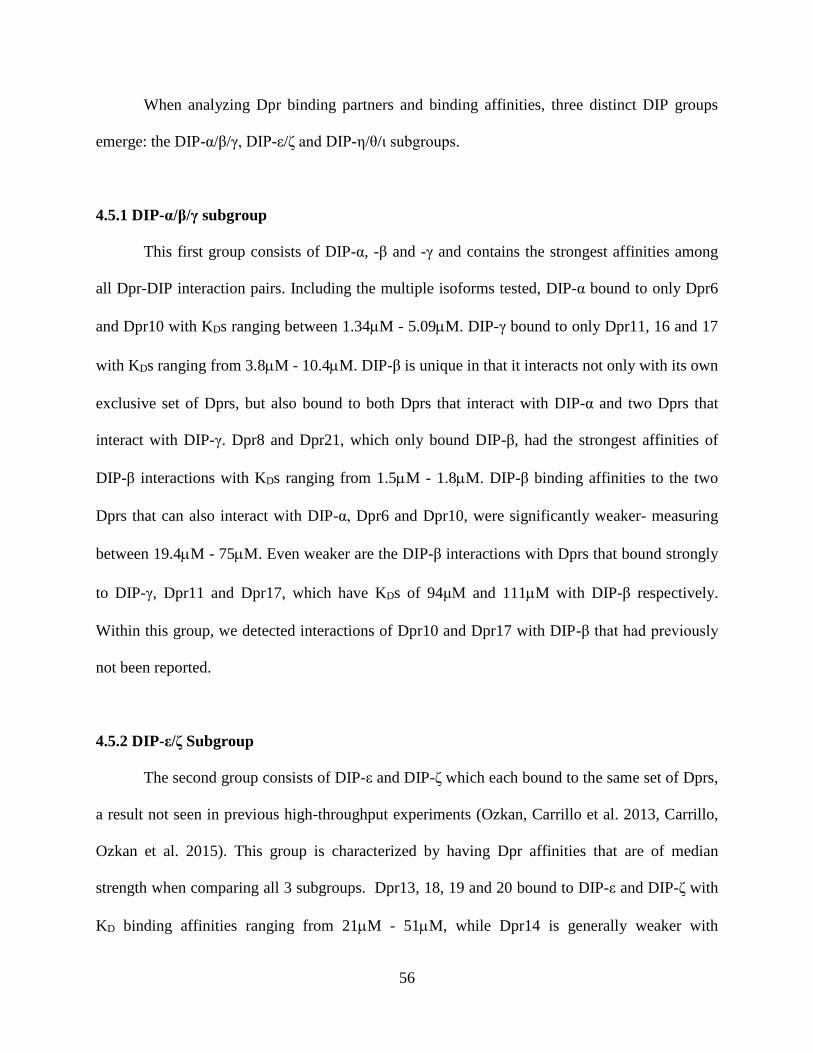
56
When analyzing Dpr binding partners and binding affinities, three distinct DIP groups
emerge: the DIP-α/β/γ, DIP-ε/ζ and DIP-η/θ/ι subgroups.
4.5.1 DIP-α/β/γ subgroup
This first group consists of DIP-α, -β and -γ and contains the strongest affinities among
all Dpr-DIP interaction pairs. Including the multiple isoforms tested, DIP-α bound to only Dpr6
and Dpr10 with KDs ranging between 1.34M - 5.09M. DIP-γ bound to only Dpr11, 16 and 17
with KDs ranging from 3.8M - 10.4M. DIP-β is unique in that it interacts not only with its own
exclusive set of Dprs, but also bound to both Dprs that interact with DIP-α and two Dprs that
interact with DIP-γ. Dpr8 and Dpr21, which only bound DIP-β, had the strongest affinities of
DIP-β interactions with KDs ranging from 1.5M - 1.8M. DIP-β binding affinities to the two
Dprs that can also interact with DIP-α, Dpr6 and Dpr10, were significantly weaker- measuring
between 19.4M - 75M. Even weaker are the DIP-β interactions with Dprs that bound strongly
to DIP-γ, Dpr11 and Dpr17, which have KDs of 94μM and 111M with DIP-β respectively.
Within this group, we detected interactions of Dpr10 and Dpr17 with DIP-β that had previously
not been reported.
4.5.2 DIP-ε/ζ Subgroup
The second group consists of DIP-ε and DIP-ζ which each bound to the same set of Dprs,
a result not seen in previous high-throughput experiments (Ozkan, Carrillo et al. 2013, Carrillo,
Ozkan et al. 2015). This group is characterized by having Dpr affinities that are of median
strength when comparing all 3 subgroups. Dpr13, 18, 19 and 20 bound to DIP-ε and DIP-ζ with
KD binding affinities ranging from 21M - 51M, while Dpr14 is generally weaker with

57
affinities ranging from 69M - 106M. Additionally, Dpr6S, which has a strong affinity to DIP-
α and DIP-β, has a weak affinity to DIP-ε and DIP-ζ with a KD of 151μM and 210M
respectively. The long n-terminal form, Dpr6L, had KD binding affinities greater than 300μM to
DIP-ε and DIP-ζ, which we classify as non-binding. Previous interaction studies showed that
Dpr18 was the only Dpr protein that did not interact with any DIP (Ozkan, Carrillo et al. 2013,
Carrillo, Ozkan et al. 2015). However, we determined that Dpr18 has the strongest binding
affinity among Dprs to DIP-ε and DIP-ζ with KDs of 21μM and 25M. We also failed to detect
meaningful affinities between DIP-ε and Dpr16 or Dpr17, and DIP-ζ with Dpr16, interactions
that had been determined by the ECIA (Ozkan, Carrillo et al. 2013).
4.5.3 DIP-η/θ/ι Subgroup
The final DIP group includes DIP-η, -θ, and -ι. Dpr-DIP interactions in this group are
significantly weaker than the interactions seen in the previously discussed groups with the
majority of calculated KDs ranging from 71M - 208M. Only Dpr4 had a stronger affinity, a KD
of ~36M between both DIP-ι and DIP-θ, but not DIP-η, which it bound with a 2-fold weaker
KD of ~78M. DIP-ι was the only DIP to bind to all Dpr members which interacted with this
subgroup: Dpr1, 2, 3, 4, 5, and 7. This result differs significantly from the ECIA, which only
observed DIP-ι interacting with Dpr1 (Ozkan, Carrillo et al. 2013). In a significant departure
from the results of the ECIA, our SPR experiments show that DIP-η shares the same binding
partners as DIP-ι with the exception of Dpr7, which we determined only interacts with DIP-ι.
And DIP-θ shares the same binding partners as DIP-η, with the exception of Dpr3.

58
4.6 Dpr/DIP interactions correlate to phylogeny
Previous work detailing the Dpr/DIP interactome showed a high correlation between
overall sequence similarity and the binding specificity of Dprs and DIPs (Ozkan, Carrillo et al.
2013). Dprs and DIPs that shared the same binding partners usually fell within the same branch
or closely related branches on a cladogram. Our SPR experiments found a few novel interactions
while failing to reproduce previously published ones and we set out to determine how our
updated interactome compared to the phylogeny of Dprs and DIPs.
Using the phylogeny.fr server (Dereeper, Guignon et al. 2008, Dereeper, Audic et al.
2010) a phylogentic tree was created for Dprs and DIPs using full ectodomain sequences. When
overlaying the primary binding specificities of Dprs, our updated interactome showed an even
stronger correlation to sequence similarity (Figure 16). Dprs neatly segregated into branches in
relation to their DIP binding specificity. Only Dpr3, which shows no binding affinity to DIP-θ, is
somewhat of an outlier since it resides on a branch with other Dprs that bind DIP-θ. Many of
these branches are closely related, such as Dprs that bind to DIP-α and DIP-β. Dprs that
primarily interact with DIP-ε and DIP-ζ show the most divergence, although their branches still
segregate from Dprs with other binding specificity’s. It should be noted that since we could not
produce Dpr9, Dpr15 or DIP-δ, we identified their binding specificity according to what had
been previously reported (Carrillo, Ozkan et al. 2015).
The three DIP groups we distinguished correlate to a DIP phylogenetic tree as well, with
DIP-ε/ζ, and DIP-η/θ/ι groups located on two separate and distinct branches. For the DIP-α/β/γ
subgroup, DIP-α and DIP-β share the same branch while DIP-γ is separate, but is more closely
related than members of the other DIP subgroups (Figure 17). Interestingly, the two DIPs that
showed no interactions in the ECIA, CG31814 and CG40378, are each on distinct branches.

59
Their sequence divergence may help explain why these DIP members don’t interact with any
Dprs, although more precise SPR experiments are necessary to determine whether this in fact is
true.
Figure 16: Dpr Phylogenetic Tree
Created using the full ectodomain sequences of Dprs. Primary binding specificity is highlighted
and labeled with colored circles. Dpr9, Dpr12 and Dpr15 specificity is labeled according to data
from (Ozkan, Carrillo et al. 2013, Carrillo, Ozkan et al. 2015). In general, Dprs segregate to
separate branches according to binding specificity. Dpr3 is a slight outlier since unlike its closely
related members, it does not interact with DIP-θ. Dprs that interact with DIP-ε and DIP-ζ are
more divergent than other groups and segregate to two separate branches.
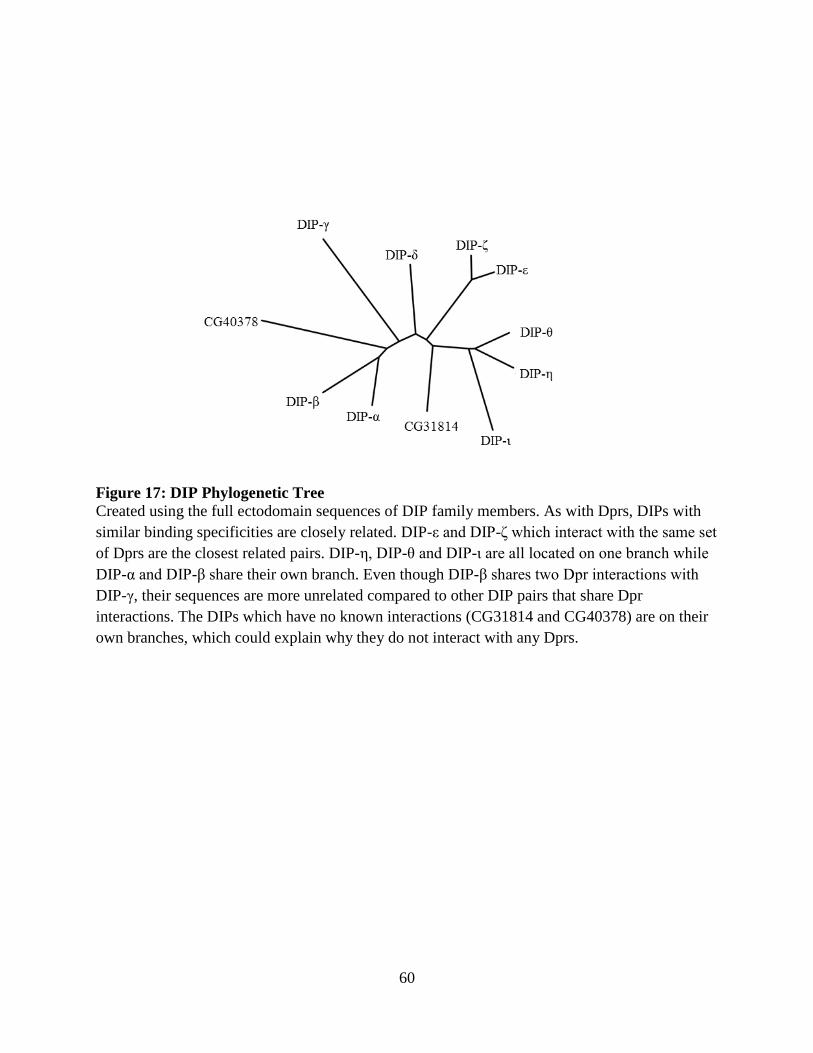
60
Figure 17: DIP Phylogenetic Tree
Created using the full ectodomain sequences of DIP family members. As with Dprs, DIPs with
similar binding specificities are closely related. DIP-ε and DIP-ζ which interact with the same set
of Dprs are the closest related pairs. DIP-η, DIP-θ and DIP-ι are all located on one branch while
DIP-α and DIP-β share their own branch. Even though DIP-β shares two Dpr interactions with
DIP-γ, their sequences are more unrelated compared to other DIP pairs that share Dpr
interactions. The DIPs which have no known interactions (CG31814 and CG40378) are on their
own branches, which could explain why they do not interact with any Dprs.

61
Chapter 5:
Structures of Dpr-DIP heterophilic complexes

62
5.1 Full ectodomain structural information
In order to fully understand the biophysical nature of Dpr-DIP interactions and to develop
the tools to manipulate and study these molecules in an in vivo context, atomic level detail of
their interaction must be determined. The only published crystal structure of a Dpr-DIP
heterophilic complex was that of a Dpr6 D1 fragment and a DIP-α D1-D2 fragment (Carrillo,
Ozkan et al. 2015). The structure revealed a pseudo symmetric complex between the D1 domains
of DIP-α and Dpr6 that falls along the CC’C”FG face of the immunoglobulin fold and is
dominated by hydrophobic interactions along the interface (Carrillo, Ozkan et al. 2015). The
adhesive interface was further validated by SPR experiments with targeted mutations that were
able to disrupt binding between the two protomers.
We set out to determine crystal structures of other Dpr-DIP heterophilic complexes in
order to help further characterize the molecular determinants of binding specificity among Dpr-
DIP interactions. We also hoped to uncover any additional interfaces that were not seen in the
previously published structure by crystallizing constructs that contained the entire IG
ectodomain.
5.1.1 Dpr4/DIP-η Crystallization
Two domain Dpr4 at 11.1mg/ml was mixed with three domain DIP-η at 12mg/ml in a 1:1
volume ratio and screened with sparse matrix screens in 96-well sitting drop format. Crystals
formed in multiple conditions, all of which contained PEG as its precipitant. Four of these
conditions were optimized further in hanging-drop 24-well format where it became clear that a
ratio of 2:1 protein concentration to mother liquor provided larger and more well-defined
crystals. Optimized crystals took on a clear rod-shape and were screened at the APS E Line

63
(Figure 18A). A 2.9Å dataset was collected from a crystal grown in a condition containing: 28%
Edo_p8k (Molecular Dimensions), .1M Morpheus Buffer 2 ph7.5 (Molecular Dimensions) and
10% Morpheus Carboxylic Acid mix (Molecular Dimensions).
Data processing of this dataset revealed unit cell dimensions of a=b=94.29Å, c=212.46Å,
where α=β=90° and γ=120°. The point group of the crystal was P321 and later determination
showed it to be in the P3121 space group. The structure was solved through molecular
replacement by using models from the Dpr6/DIP-α complex (pdb:5EO9), and an ensemble of
models including SIRP alpha (4CMM) and Sdk1EC4 (5K6U) which was used to model DIP-η
D3 and Dpr4 D2. Refinement statistics are summarized in Table 6.
5.1.2 Dpr2/DIP-θ Crystallization
Two domain Dpr2 at 9.5mg/ml was mixed with three domain DIP-θ at 12.8mg/ml in a
1:1 volume ratio and screened in sparse matrix screens in 96-well sitting drop format. Only one
condition returned crystals: 20% Peg 3,350, .2M Ammonium citrate tribasic pH7.0. These
crystals were small and spherical, and looked very similar to phase separation (Figure 18b).
Further optimization in 24-well format generated larger crystals where a distinct tear drop shape
could be seen (Figure 18b). As was seen with Dpr4/DIP-η crystals, using a ratio of 2:1 protein
concentration to mother liquor generated larger and more defined crystals. A dataset of 3Å was
collected at the APS C line from a crystal grown in 18% Peg 3,350, .2M TriNH4 Citrate pH 6.5,
and frozen in additional 15% (2R,3R)-2,3-Butanediol.
Data processing of this dataset revealed the crystal had a space group of P212121 with cell
dimensions a = 116.77Å, b= 120.91Å, c = 144.91Å and α=β=γ= 90°. The structure was solved

64
through molecular replacement by using the previously solved Dpr4/DIP-η structure and
refinement statistics can be seen in Table 6.
Figure 18: Crystals of Dpr2/DIP-θ and Dpr4/DIP-η.
Left images show sitting drop of initial sparse matrix screen hit, right images shows an optimized
crystal in nylon loop before data collection. (a) Crystals of Dpr4/DIP-η took the shape of long
rods which became clearly defined with sharp edges after optimization (b) Initial crystals of
Dpr2/DIP-θ resembled phase separation with a slight “tear drop” shape. Further optimization
produced larger crystals where a distinct oval shape could be seen.

65
Table 6: Dpr4/DIP-η and Dpr2/DIP-θ Crystallographic Data and Refinement Statistics
Dpr4/DIP-η Dpr2/DIP-θ
Data Collection
Space Group
P3221 P212121
Cell dimensions
a, b, c (Å)
94.29, 94.29, 212.46 116.77, 120.91, 144.91
α, β, γ (°)
90, 90, 120 90, 90, 90
Resolution (Å)
106.23-2.9 (3.08-2.9) 120.91-2.95 (3.06-2.95)
Rsym or Rmerge
.114 (.686) .121 (.715)
I|σ|
9.7 (1.6) 11.9 (2.4)
Completeness (%)
99.5 (99.6) 99.8 (99.7)
Redundancy
3.6 (3.6) 5.2 (5.0)
Refinement
Resolution (Å)
19.99-2.90 19.93-2.95
No. reflections
24738 43531
Rwork / Rfree
.24, .27 .20, .24
No. atoms
Protein
3990 8034
Ligand/Ion
303 521
Water
55 44
B-factors
Protein
72.67 55.79
Ligand/Ion
112.29 107.77
Water
54.11 44.41
R.m.s deviations
Bond lengths (Å)
0.003 0.018
Bond angles (°)
0.75 1.06
Ramachandran
Favored (%)
93 91
Allowed (%)
2.4 5.5
Outliers (%)
6 3.1

66
5.2 The Dpr4/DIP-η & Dpr2/DIP-θ Complex
The asymmetric unit of the Dpr4/DIP-η complex crystal contains one two domain
molecule of Dpr4 and a three domain molecule of DIP-η (Figure 19a). Within the asymmetric
unit, the D1 domain of Dpr4 interacts with the D1 domain of DIP-η along their CC’C”FG face of
the V-set immunoglobulin fold. The D1 domains are related to each other by a pseudo 2-fold
symmetry axis with one domain rotated relative to the other by ~140°. The interface has a buried
surface area of 1770Å2 and is dominated by van der Waals interactions, characterized by a
hydrophobic core in the center of the interface (Figure 20a). Hydrophobic side chains of residues
Ile80, Leu85, Ile87 and Tyr95 of Dpr4 are buried in the center of the interface and have more
than 90% of their accessible surface area buried, while neighboring Val90 has about 57% of its
accessible surface area buried. Directly apposed and intercalating between these residues are
DIP-η residues Ala75, Leu77, Ile84 and Ile87 which complete the hydrophobic core of the
interface. DIP-η Ala75, Leu77 and Ile84 are completely buried in the interface, while Ile87 and
additional hydrophobic residues, Ile92 and Met124, have about 70% of their accessible surface
area buried in the interface. In addition to the many buried hydrophobic residues, the interface
contains 18 hydrogen bonds (Table 7). Only one salt bridge is present in the interface, away from
the core and formed between Asp74 on the BC loop of Dpr4 and Lys94 on the C''D loop of DIP-
η.
The asymmetric unit of the Dpr2/DIP-θ complex crystal contains two molecules of Dpr2
and two molecules of DIP-θ, each in equivalent heterophilic complexes. One heterophilic
complex of the asymmetric unit is shown in Figure 19b. The interaction seen between D1-D1 of
Dpr2 and DIP-θ, including side chain identities, is almost identical as in the previously described
Dpr4/DIP-η complex and has a buried surface area of 1850Å2. Sequence alignments of the

67
interfacial residues shown Figure 20b highlight the similarity of the interface. Superposing the
interacting D1 domains of these two complexes gives a root mean square deviation (RMSD) of
0.489Å over 179 Cα atoms, indicating the close similarity between protomer arrangements in the
interface (Figure 21). Only five residues buried in the interface differ between Dpr2 and Dpr4,
and only one shared interfacial position differs between DIP-θ and DIP-η. The hydrophobic core,
salt bridge and the majority of hydrogen bonds are conserved between the two interfaces as seen
in Table 7 and Table 8.
Figure 19: Overall crystal structures of Dpr/DIP heterocomplexes. Ribbon representation of the full IG ectodomain of (a) Dpr4/DIP-η, and (b) Dpr2/DIP-θ. N-
linked glycans that were visible in electron density maps are represented as wheat colored
spheres. Dpr4 is in green, DIP-η in teal, Dpr2 in pink and DIP-θ in purple.
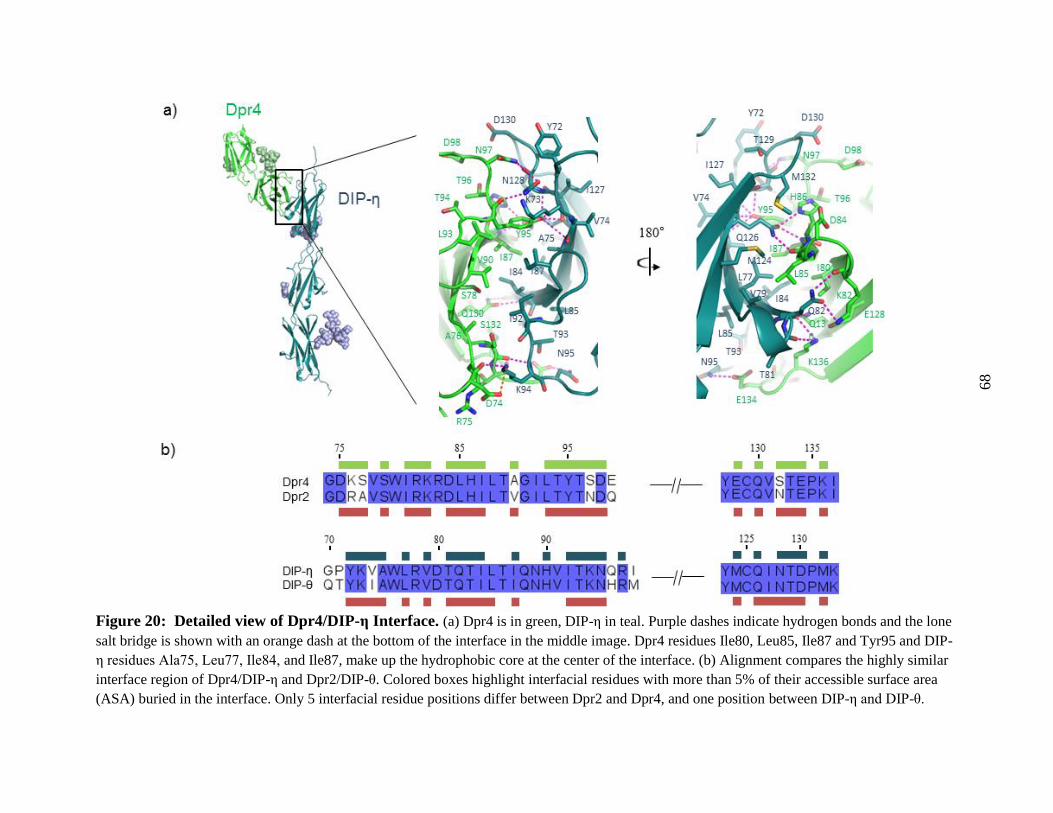
68
Figure 20: Detailed view of Dpr4/DIP-η Interface. (a) Dpr4 is in green, DIP-η in teal. Purple dashes indicate hydrogen bonds and the lone
salt bridge is shown with an orange dash at the bottom of the interface in the middle image. Dpr4 residues Ile80, Leu85, Ile87 and Tyr95 and DIP-
η residues Ala75, Leu77, Ile84, and Ile87, make up the hydrophobic core at the center of the interface. (b) Alignment compares the highly similar
interface region of Dpr4/DIP-η and Dpr2/DIP-θ. Colored boxes highlight interfacial residues with more than 5% of their accessible surface area
(ASA) buried in the interface. Only 5 interfacial residue positions differ between Dpr2 and Dpr4, and one position between DIP-η and DIP-θ.

69
Table 7: Dpr4/DIP-η hydrogen bonds
Table 8: Additional Hydrogen Bonds
seen in Dpr2/DIP-θ
Shaded Boxes in indicate conservation
*Denotes potential hydrogen bonds with distances between 3.5-3.7Å
The heterophilic interaction seen in these novel structures is remarkably similar to the
interaction seen in the previously determined Dpr6/DIP-α structure (Carrillo, Ozkan et al. 2015).
Superposition of the interacting D1-D1 domains of Dpr6/DIP-α to Dpr4/DIP-η has a RMSD of
0.655Å over 182 Cα atoms, and when superposed with Dpr2/DIP-θ, an RMSD of 0.582Å over
185 Cα atoms (Figure 21). The hydrophobicity of residues that make up the core of the interface
previously described are all conserved, while much of the hydrogen bonding network remains in
place. However, Dpr6/DIP-α is missing the conserved salt bridge present in Dpr2/DIP-θ and
Dpr4 DIP-η Type
Conserved
Dpr6/DIP-α
Conserved
Dpr2/DIP-θ
D74 K94 Main-Side
*
K82 Q82 Side-Side
K82 Q82 Main-Side
L85 Q126 Main-Side
H86 Q126 Side-Side
I87 Q126 Main-Side
Y95 K73 Side-Main
Y95 Q126 Side-Main
Y95 N128 Main-Side
Y95 N128 Side-Main
N97 N128 Side-Main
*
N97 N128 Side-Side*
Q130 I84 Side-Main
Q130 Q82 Side-Main
S132 K94 Main-Main
*
E134 N95 Side-Side
K136 T81 Side-Main
K136 Q82 Side-Main*
*
Dpr2 DIP-θ Type
Conserved
Dpr6/DIP-α
Y156 A162 Side-Main
N193 I179 Side-Main

70
Dpr4/DIP-η. A more detailed analysis of the differences between these complexes can be found
in Chapter 6 where analysis of the specificity determinants between the two complexes is
discussed.
Figure 21: D1-D1 Superposition of Dpr/DIP heterophilic complexes
Superpositions show that Dpr-DIP D1 interactions are highly similar and multiple complexes
share identical protomer arrangements. With the first color denoting the Dpr: Dpr6/DIP-α
(5EO9) is in gold and pink, Dpr2/DIP-θ is in red and purple, Dpr4/DIP-η is in green and teal.
RMSD values in Å from these superpositions are displayed, with the number in parenthesis
indicating the number of C-α residues aligned. There are 202-206 residues in a D1-D1 complex.

71
Visual inspection of the Dpr protomers reveals a significant bend in the interdomain
region of Dpr2 while Dpr4 is more elongated (Figure 22a). The angle between domains of Dpr2
is 83°, compared to the 38° angle between Dpr4 domains. This significant difference is possible
due to the longer inter-domain linker of Dpr2, which has five residues compared to the one
residue linker seen in Dpr4. When comparing inter-domain linkers among all Dprs, only a few
are longer than one residue with the exceptions being Dpr2 and Dpr3 which have five, Dpr7
which has nineteen, and an alternate isoform of Dpr10 (Dpr10A) which has a forty-seven amino
acid inter-domain linker (Figure 22b). Isoform D of Dpr10 has the more common one residue
linker and both isoforms of Dpr10 were tested in the SPR experiments previously discussed in
Chapter 4, where they shared nearly identical binding affinities to either DIP-α or DIP-β.
Excluding the alternate isoform of Dpr10, all of the longer linker regions are on closely related
Dprs that interact within the DIP-η/θ/ι group. Since the second domain is not involved in the D1-
D1 interactions seen in our crystal structures, it remains unclear what role these longer linkers
have in Dpr function and why only a select few members of the DIP-η/θ/ι group have them.

72
Figure 22: Linker Region of Dpr2 and Dpr4
(a) Dpr2 and Dpr4 are superposed with alignments along their D1 domains. This highlights the
significant bend that can be seen between D1 and D2 of Dpr2 which is not present in Dpr4. The
bend is possible due to a longer linker region of Dpr2. (b) Alignments of Dpr sequences show
that a linker region longer than one amino acid is only present in 4 of the Dprs: Dpr2, Dpr3,
Dpr7 and the alternate isoform Dpr10A

73
5.3 Potential Cis interfaces
Crystallizing molecules that contain the complete IG ectodomain allows for the
possibility to uncover additional interactions and interfaces that are not present in structures of
fragments. Cis interactions through alternate interfaces have been uncovered in many neural cell
adhesion molecules, such as n-cadherin and protocadherins (Harrison, Jin et al. 2011, Goodman,
Rubinstein et al. 2017) In addition to its trans-interface, protocadherins have a cis interaction that
occurs between the EC5 and membrane proximal EC6 domain of a neighboring molecule. We
set out to examine if any other crystal contacts seen in our complex structures could act as
potential cis interfaces.
When looking at interactions between asymmetric units in the Dpr4/DIP-η crystal
structure, a crystal contact can be seen between Dpr4 D2 and DIP-η D3 that buries 1266Å2
between the IG domains (Figure 23a). This interface is characterized by an inter-domain parallel
beta sheet that forms between the D strands of Dpr4 D2 and DIP-η D3, and a large glycan from
Asn291 of DIP-η that buries an additional ~450Å2 of mostly hydrophobic residues on Dpr4:
residues Phe181, Tyr183, Tyr185, and Val190 (Figure 23b). There are nine hydrogen bonds
formed between the two strands and all but three are main-main chain bonds (Table 9). In
addition to these hydrogen bonds, the interface also contains a salt bridge between residue
Glu204 on the DE loop of Dpr4 and Lys269 on the BC loop DIP-η.
Comparison of the cis interfacial region of the Dpr-DIP sequences do not reveal a high
degree of sequence similarity, even when organized in groups based on known SPR interactions.
However, since most of the hydrogen bonds present in the interface are main-main chain, side
chain conservation may not be as significant. The charged residues forming the salt bridge are
somewhat conserved, and assuming a promiscuous cis interaction that is not dependent on the

74
D1-D1 interaction, this electrostatic interaction could form in a little less than half of all possible
Dpr/DIP pairs. The glycosylated Asn291 of DIP-η whose glycan buries additional hydrophobic
residues on the Dpr protomer is only present in DIP-η.
Figure 23: Potential Cis Interface of Dpr4/DIP-η (a) Dpr4 with DIP-η (-X, -X+Y, -Z+1/3). Crystal contact shows Dpr4 D2 and DIP-η D3 interaction: Dpr4
in green with glycans as light green spheres, DIP-η is dark teal with glycans as blue-white spheres (b)
Left image shows the main region of the interface, and the interdomain parallel beta sheet that forms.
Hydrogen bonds are shown with purple dashes between the two side by side D strands of apposing
protomers. The lone salt bridge is shown with an orange dash near the top of the interface. A 90°
clockwise rotation along the y-axis reveals the Dpr4 side chains that are buried by the DIP-η Asn291
glycan.
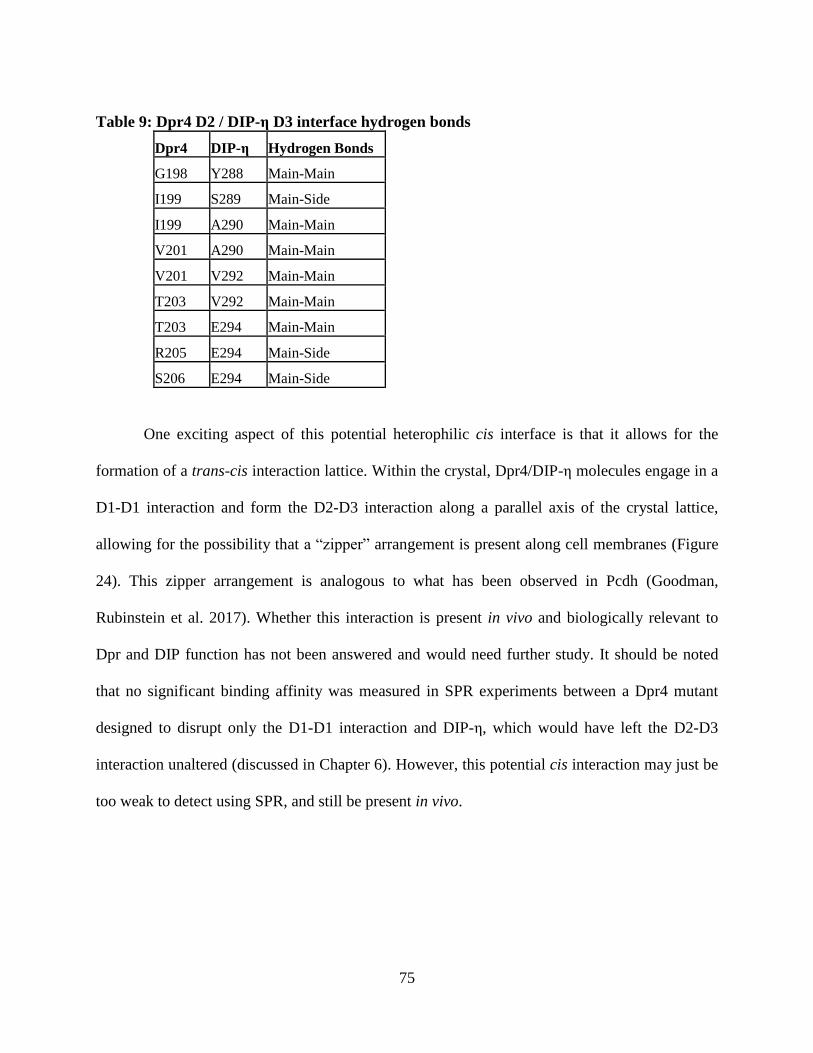
75
Table 9: Dpr4 D2 / DIP-η D3 interface hydrogen bonds
Dpr4 DIP-η Hydrogen Bonds G198 Y288 Main-Main I199 S289 Main-Side I199 A290 Main-Main V201 A290 Main-Main V201 V292 Main-Main T203 V292 Main-Main T203 E294 Main-Main R205 E294 Main-Side S206 E294 Main-Side
One exciting aspect of this potential heterophilic cis interface is that it allows for the
formation of a trans-cis interaction lattice. Within the crystal, Dpr4/DIP-η molecules engage in a
D1-D1 interaction and form the D2-D3 interaction along a parallel axis of the crystal lattice,
allowing for the possibility that a “zipper” arrangement is present along cell membranes (Figure
24). This zipper arrangement is analogous to what has been observed in Pcdh (Goodman,
Rubinstein et al. 2017). Whether this interaction is present in vivo and biologically relevant to
Dpr and DIP function has not been answered and would need further study. It should be noted
that no significant binding affinity was measured in SPR experiments between a Dpr4 mutant
designed to disrupt only the D1-D1 interaction and DIP-η, which would have left the D2-D3
interaction unaltered (discussed in Chapter 6). However, this potential cis interaction may just be
too weak to detect using SPR, and still be present in vivo.

76
Figure 24: Dpr4/DIP-η Zipper arrangement
Hypothetical arrangement of lattice seen in Dpr4/DIP-η crystal structure placed between two apposing cell membranes. Protomers can
simultaneously engage in trans D1-D1 interaction as well as Dpr4 D2 – DIP-η D3 interactions. This organization could extend along a
membrane, however there is no in vivo evidence to support this model. Dpr4 is in green and DIP-η is in blue.

77
The potential cis interaction seen in the Dpr4/DIP-η is not seen in the Dpr2/DIP-θ crystal.
Analyzing the crystal contacts of this structure does however reveal an interface that buries
2328Å2. This large interface is formed through interactions of D1 and D2 of Dpr2 with D2 and
D3 of DIP-θ (Figure 25). The interface has a few hydrophobic residues buried, but only one
hydrogen bond and two salt bridges. Most of the interface falls along the inter-domain region of
Dpr2 which crosses D2 of DIP-θ. Many of the interactions are the result of the large bend
between the Dpr2 domains which is only possible due to its five amino acid linker. This linker is
only present in Dpr2 and Dpr3, making it likely that if this Dpr-DIP interaction is present in vivo,
it could only occur with those Dprs. However, even for these two Dprs, this interaction is
unlikely to be a real cis interface and would require a significant bend of DIP-θ towards the
membrane since the two protomers interact in an almost perpendicular arrangement. Due to the
orientations of the protomers, a lattice of the cis and trans interaction cannot be formed between
two parallel membranes to form a “zipper” as seen in Dpr4/DIP-η. Unfortunately, investigating
whether this interaction is biologically relevant is difficult, since there is currently no clear
understanding of Dpr2 or DIP-θ function.

78
Figure 25: Dpr2/DIP-θ Crystal contact
Ribbon representation of contact between Dpr2 and DIP-θ (-X+ ½, -Y, Z+1/2). Dpr4 is in pink
and DIP-θ is in blue with their respective glycans represented as shaded spheres. The interface
falls along the inter-domain region of Dpr2 and the D2-D3 interdomain region of DIP-θ. In order
for this to be a cis interaction in vivo the DIP protomer would have to bend significantly towards,
and be almost parallel with the membrane. This interaction is only possible due to the bend in
Dpr2 domains, which could only occur in four other Dprs that have long D1-D2 interdomain
linkers.

79
Chapter 6:
Binding Specificity of the Dpr-DIP Heterophilic interface

80
6.1 Identifying residues important to specificity
As discussed in Chapter 4, we determined a quantitative network of binding interactions
between Dprs and DIPs. In Chapter 5, novel structures of Dpr4/DIP-η and Dpr2/DIP-θ revealed a
shared heterophilic interface with a previously solved complex from a different specificity group,
Dpr6/DIP-α. With the structural knowledge of the interface and an updated understanding of
interaction partners, we set out to determine the residues of the interfacial region that were most
crucial in coding the adhesive specificity in Dpr-DIP interactions.
The D1 domains of DIPs are highly conserved, as can be seen in the pairwise identities
shown in Figure 26a, and have an average sequence identity of 53%. Dprs are slightly more
variant but still highly conserved with an average D1 sequence identity of 44% (Figure 26b).
When comparing Dprs that bind the same DIPs, the conservation can be significantly higher. The
Dpr members of the DIP-η/θ/ι specificity group have an average D1 sequence identity of 58%.
However, the D1 domain sequence is more variant among Dprs that bind DIP-ε and DIP-ζ, with
only an average identity of 39%. Alignments of the Dpr D1 and DIP D1 show strong
conservation among family members (Figure 27). Taken together with the high similarity
between the three Dpr-DIP complex structures that have been determined, we believe that the
D1-D1 interface is likely conserved among Dpr-DIP heterophilic interactions, as was previously
predicted (Carrillo, Ozkan et al. 2015).
In order to determine the residues that would have the biggest impact on adhesive
specificity, D1 alignments were divided into subgroups defined by their primary binding partners
(Figure 28 and 29). Residues buried in the interface that showed high conservation within their
subgroup, but variation between groups, were analyzed further through visual inspection of the
interface. Using these alignments and structural analysis, multiple residues at specific positions

81
stood out as potential determinants of specificity. These selected Dpr residue positions are
referred to by SR (Dpr specificity residue) and DIP residue positions are referred to as SI (DIP
specificity residue).
Figure 26: Pairwise percent identity of Dpr and DIP D1 domains (a) Dpr D1 identities, with
shaded colored boxes highlighting the Dprs that share a DIP binding partner. With the exception
of Dprs that bind DIP-ε and DIP-ζ, Dprs that share the same primary DIP binding partner(s) have
D1 sequence similarities greater than 50%. (b) DIP pairwise identities with shaded boxes
denoting DIP pairs that bind more than one Dpr in common. With the exception of DIP-β and
DIP-γ which both bind Dpr11 and Dpr17, DIPs with similar binding partners share greater than
61% sequence identity in their first domain.

82
Figure 27: Dpr and DIP D1 alignments D1 of Dpr and DIP family with IG strand identity determined from crystal structures overlaid on top. Colors indicate conservation of
specific residue character. For both families, the D1 domain is highly conserved. (a) Dpr family D1 with breaks for Dpr16 and Dpr20.
(b) DIP family D1.
83
6.1.1 Specificity Residues SI1-3 and SR1-4
Regions of the interface where both apposing Dpr and DIP residues vary between
heterophilic binding groups encode the positions that likely have the largest impact on binding
specificity. Possibly the most crucial region to specificity surrounds the CC' loop of DIP D1,
which inserts between the CC' and FG loops of the Dpr protomer. Three consecutive residues
that begin on the DIP CC' loop and end at the first residue of the C' strand show a high sequence
variability between different DIPs, and their positions are labeled SI1, SI2, and SI3 (Figure 28).
Apposed of SI1-3 are four Dpr residue positions that show significant variability between the
specificity groups: SR1 and SR2 which are located on the CC' loop, and SR3 and SR4 located on the
FG loop (Figure 29). Looking at crystal structures of the Dpr/DIP complex, we can see that SI2 is
tightly intercalated between SR1 and SR2, while SI3 falls in between SR3 and SR4 (Figure 30c).
Among the DIPs that have similar Dpr binding partners, the SI1-3 identities are consistent (Figure
28). DIP-ε and DIP-ζ both have Gln-Ser-Ala, while DIP-η, -θ, and -ι have Thr-Gln-Thr. As can
be observed in the Dpr alignments in Figure 28, the residue types at these positions can vary
greatly among the specificity groups. For example, SR1 is a highly conserved positively charged
residue, except in Dprs which primarily interact with DIP-γ, where it is a hydrophobic Leu or
Met. The significant variability of residue types between specificity groups at this set of close
proximity positions indicate that this region has a high level of importance in determining
Dpr/DIP interactions.

84
Figure 28: DIP Interface alignment
DIPs are grouped based on similar binding specificity, with the CG31814 and CG40378 DIPs
that have no known interacting partners placed in the two bottom rows. Residues highlighted
show variability among DIPs with different Dpr binding specificity and their positions are
denoted SI1-SI6. SI1-3 make up the main specificity region and appose positions SR1-4 of their
cognate Dpr in complex. SI4 can form a salt bridge in most DIP-η/θ/ι and DIP-ε/ζ complexes
with Dpr SR5. SI5 forms a salt bridge with Dpr SR6 unique to Dpr/DIP-γ complexes. SI6 apposes
Dpr SR7. Shared interfacial positions determined from crystal structures as having more than 5%
of their accessible surface area buried are highlighted by shaded boxes

85
Figure 29: Dpr interface alignment
Residues highlighted show variability among Dprs with different DIP binding specificity but
conservation within their binding group. Their positions are denoted SR1-SR7. Binding specificity
is divided into 7 groups, with the DIP interacting partner(s) labeled to the left of the group. SR1-7
logos at the right of each group show how each DIP interacting group has a unique set of
conserved SR residues. SR1-4 appose DIP SI1-3. SR5 can interact in a salt bridge with SI4 or is many
times glycosylated. SR6 forms a salt bridge unique to DIP-γ complexes. SR7 interacts with SI6.
Shared interfacial positions determined from crystal structures as having more than 5% of their
accessible surface area buried are highlighted by shaded boxes, with the blue shaded box
highlighting the position that forms a salt bridge in DIP-γ complexes only. Dpr3 is included in
the DIP-η/θ/ι group although it does not bind DIP-θ.

86
Figure 30: Binding Specificity Regions. Three different interfacial regions that help confer binding specificity. All ribbon representations use
the Dpr4/DIP-η structure, with the Dpr in green and the DIP in purple. (a) Highlights the salt bridge that forms only between SI5 of a DIP-γ and SR6
of its cognate Dprs, with the corresponding residue identity overlaid on our Dpr4/DIP-η structure. (b) The loop interaction between SI6 and SR7. (c)
The main specificity region showing SI2 tightly intercalated between SR1 and SR2. SR3 points towards SI1 and SI3, while SR4 apposes SI3. On the left
is the SR5 – SI4 interaction, which is a salt bridge in Dpr4/DIP-η and many other Dpr-DIP complexes

87
6.1.2 Specificity Residues SI4 and SR5
At the interface between the BC loop of the Dpr and the C''D loop of DIP is another pair
of residues apposing each other that vary among the different heterophilic complexes, with
positions identified as SR5 and SI4 (Figure 30c). These residues have been observed to form a salt
bridge in the Dpr2/DIP-θ and Dpr4/DIP-η structures discussed earlier and are predicted to be
present in other complexes of the DIP-η/θ/ι binding group, with the exception of Dpr7. Instead,
Dpr7 has a glycosylated Asn at this position, and the absence of this salt bridge may be
indicative of why it can only bind DIP-ι, of which it has a binding KD of 136μM. In addition, this
salt bridge is also predicted to form in heterophilic complexes of DIP-ε or DIP-ζ with 3 of the 5
Dprs within their subgroup.
Within the DIP-α and DIP-β subgroups, Dpr members do not form a salt bridge at the SR5
position but instead have a conserved glycosylated Asn. As seen in the Dpr6/DIP-α crystal
structure, this glycan contacts the histidine at the SI4 position (Carrillo, Ozkan et al. 2015). Most
Dprs can either form salt bridges at this position with their cognate DIP or have glycans (Figure
29). However, within the DIP-γ subgroup, there is little conservation at the SR5 position,
indicating this position may not be a significant factor for determining specificity of DIP-γ
interactions.
6.1.3 Specificity Residues SI5-6 and SR6-7
Two additional regions of the Dpr/DIP heterophilic interface stand out as potential
regions that could behave as specificity determinants, especially with regards to Dpr/DIP-γ
interactions. Models of the Dpr11/DIP-γ heterophilic interface reveal a salt bridge that is unique
to these complexes. SR6, located on the C'C'' loop of Dpr D1 is a conserved Gly that is not buried
88
in the interface of any of the three complex structures that have been determined. However, in all
DIP-γ binding Dprs, an Asp is present at this position. This Asp directly apposes the SI5 position
on the DIP protomer, which is a positively charged Arg in only DIP-γ. A Dpr11/DIP-γ model
predicts a salt bridge of 3.2Å, which would likely form in all other detected Dpr/DIP-γ
complexes between positions SI5 and SR6, (Figure 30a).
Another conserved region that is likely to affect specificity surrounds a residue on the
C''D loop of the Dpr, labelled SR7, and the DIP residue apposing it, SI6, which is on the FG loop
of the DIP D1 domain. The DIP-η/θ/ι group as well as DIP-α and DIP-β, all have a negatively
charged Asp at the SI6 position while almost all of their cognate Dprs have a Ser or Thr at the SR7
position. However, most Dpr members of the DIP-γ group have a hydrophobic Ala at the SR7
position while the apposing residue SI6 on the DIP- γ surface is a Ser. DIP-ε and DIP-ζ also differ
in that they have a hydrophobic Val at the SI6 position and 3 of their complementary Dprs have a
Gly at SR7, instead of the more conserved Ser or Thr. It’s not entirely clear how the residue
interactions at these positions between Dpr/DIP pairs can influence specificity, and the
interactions fall along a loop region that is further away from the core of the interface compared
to the other previously discussed specificity positions. However, the conservation among
specificity groups indicate these positions may influence binding affinity.
6.2 Comparisons of SR and SI residues in crystal structures
Comparison between the Dpr6/DIP-α, Dpr4/DIP-η and Dpr2/DIP-θ crystal structures
further provide insight into the significance to specificity of the SR and SI positions identified.
Figure 31a shows an expanded view of the interface surrounding the CC' loop of Dpr4/DIP-η,
with residues from the DIP-α/Dpr6 complex superposed. Residue incompatibilities that would be

89
unfavorable for complex formation are observed when modeling the interface with mismatching
partners. Because Dpr4 contains a positively charged Lys at both the SR1 and SR2 positions,
binding to DIP-α would be predicted to be impaired since these two residues oppose the positive
Lys at the SI2 position of DIP-α. This would create a highly positive region that is not present in
the native Dpr6/DIP-α or Dpr4/DIP-η complex. The positively charged residue at the SR1
position is not unique to Dpr4 and is present in all but one member of the DIP-η/θ/ι binding
group as well as Dprs in the DIP-ε/ζ binding group. This electrostatic interaction may help
explain why members of these two distinct binding groups do not interact with either DIP-α or
DIP-β, which both have positively charged residues at the apposing SI2 position.
Adjacent to the SR1-SI2 positions, DIP-α buries its hydrophobic Ala82 (SI3) against the
hydrophobic Val164 (SR4) of Dpr6. Mismatching the complex disrupts this favorable
hydrophobic interaction by introducing either Dpr4 Lys136 or DIP-η Thr83. In another
significant difference, but acting over a longer distance of about ~6Å, the side chain of SR3
differs from being negatively charged Glu134 in Dpr4 to uncharged Gln162 in Dpr6, which
points toward the SI2 and SI3 positions. With the SR1,3,4 and SI1-3 positions all within close
proximity of each other, differences in residue type among these six positions could have
significant additive effects in altering the underlying thermodynamics of binding. The five
differences seen in this region between the Dpr4/DIP-η and Dpr6/DIP-α complexes help explain
why Dpr4 and its related family members do not bind DIP-α and why Dpr6 and Dpr10 do not
bind DIP-η, -θ, or -ι.
The other clear residue mismatch that can be observed when overlaying Dpr4/DIP-η and
Dpr6/DIP-α that is likely to affect binding can be seen at positions SR5 and SI4. The salt bridge
that forms between Dpr4/DIP-η cannot form in a mismatched complex, thus removing a strong
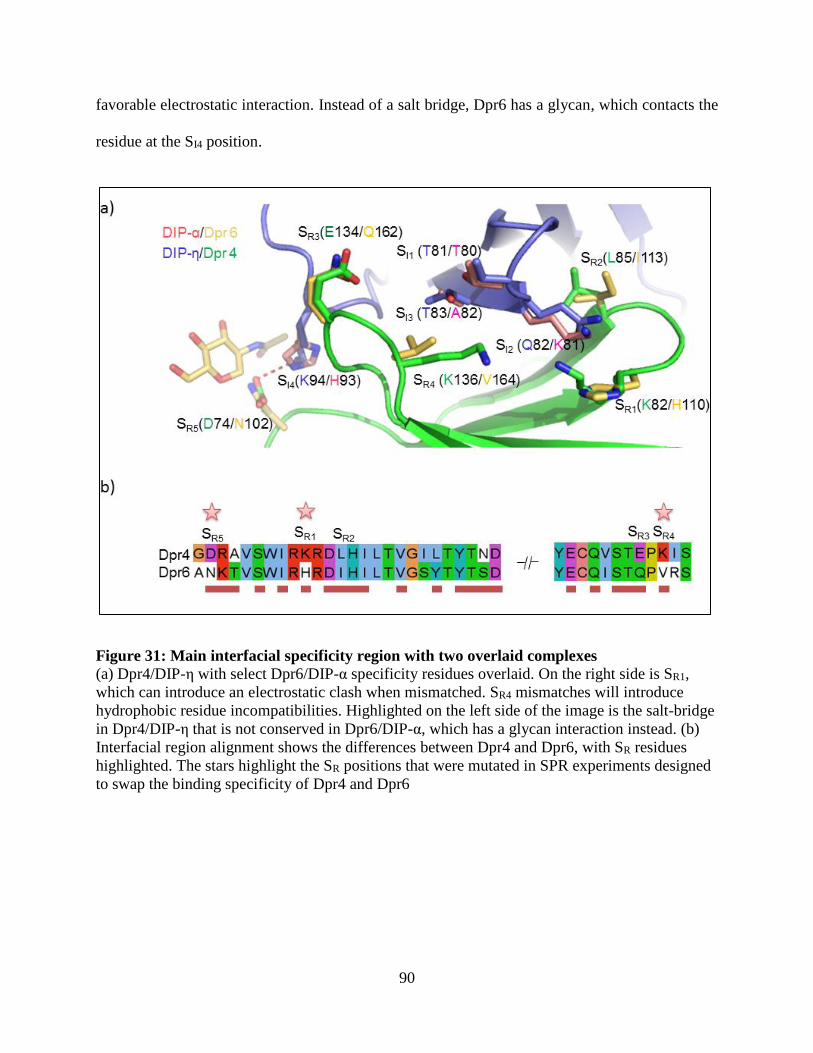
90
favorable electrostatic interaction. Instead of a salt bridge, Dpr6 has a glycan, which contacts the
residue at the SI4 position.
Figure 31: Main interfacial specificity region with two overlaid complexes
(a) Dpr4/DIP-η with select Dpr6/DIP-α specificity residues overlaid. On the right side is SR1,
which can introduce an electrostatic clash when mismatched. SR4 mismatches will introduce
hydrophobic residue incompatibilities. Highlighted on the left side of the image is the salt-bridge
in Dpr4/DIP-η that is not conserved in Dpr6/DIP-α, which has a glycan interaction instead. (b)
Interfacial region alignment shows the differences between Dpr4 and Dpr6, with SR residues
highlighted. The stars highlight the SR positions that were mutated in SPR experiments designed
to swap the binding specificity of Dpr4 and Dpr6

91
6.3 Swapping specificity of Dpr4 and Dpr6
We set out to test whether it was possible to change the adhesive specificity of a Dpr by
mutating only a few key residues we believed to be important in coding specificity. Measuring a
“swapping” of binding affinities of a Dpr between two DIP subgroups in SPR experiments would
provide strong experimental evidence supporting our specificity determinant predictions.
We chose to modify Dpr4 and Dpr6 since they are members of two distinct binding
groups with no shared interactions, and structural data of both of their complexes was available.
Proteins were made that mutated the SR1, SR4, and SR5 positions of Dpr4 to Dpr6 and vice-versa
(Figure 31b). In order to get information on the additive impact of each mutation and to try and
determine the minimum number of residues that needed to be mutated in order to change binding
specificity, we tested 3 different mutants for each Dpr. The first had a single mutation at the SR1
position, which we believed had the strongest impact on binding specificity between these pairs,
since it introduces or removes a strong electrostatic clash. Our second mutant contained two
mutations, one at the SR1 position and the other at the spatially neighboring residue at the SR4
position. This mutation would introduce or remove Lys at both the SR1 and SR4 positions,
significantly altering the electrostatic charge of the surface. The third mutant had three
mutations, the two previously described as well as a mutation at the SR5 position, which affects
the presence of a salt bridge or a glycan.
SPR experiments were performed that determined the binding affinities of the Dpr4 and
Dpr6 specificity mutants to DIP-α, -η and –θ, and all were immobilized on the same SPR chip
which allowed for accurate comparisons of KD affinities (Figure 32). Dpr responses were
measured at 8 concentrations ranging from 81-0.037μM for mutants, 27-0.037μM for wildtype
Dpr4 and 9-0.004μM for wildtype Dpr6.

92
Specificity mutant Dpr4 K82H, which mutated the SR1 position to the residue identity of
DIP-α interacting Dprs by removing one of positively charged lysines from the interface, showed
a slight increase in binding response to DIP-α, however any calculated KD would be well under
400μM. It also showed a marginal increase in binding to DIP-η and DIP-θ.
Dpr4 K82H K136V, a double mutant that changed the SR1 and SR4 positions of Dpr4 and
removed both positively charged lysines from the targeted interface region while introducing a
hydrophobic residue that is favorable only for a DIP-α interaction, disrupted binding to DIP-η
and DIP-θ by at least 4-fold, and established binding to DIP-α with a KD of 74.6μM. This
remarkable result shows that we were able to swap the binding specificity of a Dpr by only
mutating two specificity residues.
Dpr4 K51H K105V D43N, which adds a mutation at the SR5 position that disrupts the
Dpr4/DIP-η and DIP-θ salt bridge, further weakened binding to DIP-η and DIP-θ, but
surprisingly lowered the affinity to DIP-α with a binding KD of 124.2μM. It should be noted that
this newly introduced Asn is not glycosylated as it is in Dpr6 or Dpr10 because the n-
glycosylation motif is not present in Dpr4. This glycan has been shown to contact the DIP
protomer in the Dpr6/DIP-α crystal structure and is absent in our mutant (Carrillo, Ozkan et al.
2015). This absent glycan interaction may be the reason why we saw a decrease in affinity to
DIP-α, even though the residue identity between Dpr4 and Dpr6 had been swapped
A similar result was seen when measuring affinities of the Dpr6 specificity mutants,
however unlike the Dpr4 specificity mutants, it required all three mutations to introduce the new
desired binding interaction. The SR1 mutant Dpr6 H110K, which introduced an electrostatic
repulsion in the Dpr6/DIP-α complex, decreased binding by 25-fold to DIP-α, but had little effect
on increasing binding to DIP-η or DIP-θ. Dpr6 H110K V164K, the SR1 and SR4 double mutant

93
which further increased the electrostatic repulsion and removed a favorable hydrophobic
interaction in the Dpr6/DIP-α complex, abolished binding to DIP-α. However, even with
swapping the residue identities at both the SR1 and SR4 positions to that of Dpr4, there was still
no significant binding of this Dpr6 mutant to DIP-η or DIP-θ. Only Dpr6 H110K V164K
N102D, which introduced an additional mutation at the SR5 position that removed the
glycosylated Asn and allowed for a potential salt bridge to form with DIP-η or DIP-θ, did we see
binding to DIP-η and DIP-θ with KDs of 119.4μM and 72μM respectively.

94
Figure 32: SPR analysis of Dpr4 and Dpr6 specificity swaps. (a) Dpr4 WT and SR mutants. Single SR mutants show increase in affinity to DIP-
α, -η and –θ. Double SR mutant abolishes binding to DIP-η and DIP-θ while establishing binding to DIP-α. (b) Analysis of Dpr6 WT and SR
mutants. Each successive SR mutation decreases binding to DIP-α while increasing the affinity to DIP-η and DIP-θ. Double SR mutations abolish
binding to DIP-α while triple SR mutations are needed to establish binding to DIP-η and DIP-θ. Y-axis denotes protein immobilized to SPR chip,
X-axis denotes the Dpr protein flowed over as an analyte for that column. Labels indicate which SR position(s) were mutated. KD of interactions
are written above the corresponding sensorgram with error of the fit written in (). Right column shows fitted binding isotherms to the
corresponding row. KDs that were too weak to be calculated given the concentrations tested were given as a lower limit

95
Chapter 7:
Homophilic Interactions in Dprs and DIPs

96
7.1 Analytical ultracentrifugation
Analytical ultracentrifugation (AUC) is a powerful technique that allows for
characterization of macromolecules in their native state in solution. AUC experiments allow for
the determination of the molecular weight, stoichiometry, dissociation constants, and the
hydrodynamic properties of a macromolecule. By placing the sample under a high centrifugal
force, the mass of the sample molecules will redistribute according to opposing buoyant and
diffusion forces (Cole, Lary et al. 2008). The concentration of the sample can be measured in
real-time through the use of absorbance or interference detection. There are two main types of
AUC experiments that can be performed: sedimentation velocity (SV) and sedimentation
equilibrium (SE).
In a SV experiment, high centrifugal speeds deplete the concentration of protein
molecules at the meniscus formed at the air/solution interface, introducing a concentration
boundary. Over the course of the experiment, the rate at which this boundary travels to the
bottom of the centrifuge cell is recorded (Supp Figure 2A). The sedimentation of a protein in a
velocity AUC experiment can be modelled by the Lamm equation: 𝜕𝑐
𝜕𝑡= 𝐷 |
𝜕2𝑐
𝜕𝑟2 +1
𝑟
𝜕𝑐
𝜕𝑟| −
𝑠𝜔2 |𝑟𝜕𝑐
𝜕𝑟+ 2𝑐| where c is the weight concentration of a protein, t is time, ω is rotor speed, r is
the distance from center of the rotor, D is the translation diffusion coefficient and s is the
sedimentation coefficient. When analyzing data from a sedimentation velocity experiment,
diffusion and sedimentation coefficients can be determined and are used to identify the molar
mass, M, of the molecule through the Svedberg equation: 𝑠 = 𝑀𝐷(1−�̅�𝜌)
𝑅𝑇 where T is temperature,
R is the gas constant, v is partial specific volume and 𝜌 is density of the solvent (Lebowitz,
Lewis et al. 2002, Cole, Lary et al. 2008). The determination of the mass of the protein in a SV
experiment can reveal the oligomeric state of a protein as well as dissociation constants. An

97
advantage of SV experiments is that they are relatively short when compared to a SE experiment
(hours vs. days) and can be used to analyze proteins that may be unstable over time. However,
more accurate equilibrium dissociation constants can be determined in SE experiments since they
remove hydrodynamic effects (Cole, Lary et al. 2008). These experiments are run at lower
speeds over much longer times until an equilibrium concentration gradient of a protein forms in
the cell (Supp Figure 2B). If a protein exists in multiple oligomerization states, the difference in
mass of these states will be reflected in the concentration gradient of the cell. For a self-
associating species, the concentration distribution can be modeled by: 𝑎(𝑟) =
∑ 𝑛휀1𝑑𝐾𝑛𝑛 (𝑐1,0)𝑛𝑒𝑥𝑝 [𝑛𝑀1(1−�̅�𝜌)𝜔2
2𝑅𝑇(𝑟2 − 𝑟0
2)] + 𝛿 with K1 = 1, where a(r) is the measured
signal as a function of radial position r and is equal to the summation of all species n where 휀1 is
the extinction coefficient of the monomer, d is the optical path length, Kn is the association
constant of the n-mer, c1,0 is the molar concentration of the monomer at a reference position r0
and 𝛿 is a baseline offset compensating for differences in nonsedimenting absorbing solutes
between sample and reference cells (Lebowitz, Lewis et al. 2002). By fitting data obtained from
the SE experiments to the model, determination of the KD as well as the oligomeric states of the
molecule (dimer, trimer, tetramer etc.) can be obtained.

98
Supp. Figure 2: Sample AUC Data of SV and SE experiments (Adapted from (Cole, Lary et al. 2008))
(a) Hypothetical data from an SV experiment. Displays the scans taken every 20 minutes (starting with the leftmost scan) of a
protein run at 50,000 RPM that is 50kDa and has a sedimentation coefficient of 4 svedbergs. Successive scans show the
movement of the concentration boundary away from the center of the rotor over time.
(b) Hypothetical data from an SE experiment. Displays scans performed at four different centrifuge speeds and the resulting
concentration gradient at these speeds. These concentration gradients can reveal the oligomeric state and the equilibrium
dissociation constant of a multimer.
99
7.2 AUC reveals Dpr and DIP homodimers
Many cell adhesion molecules, including members of the IgSF, engage in both and
heterophilic and homophilic interactions that can play important functional roles. (Brasch,
Harrison et al. 2012, Harrison, Vendome et al. 2012, Goodman, Yamagata et al. 2016). While no
homophilic interactions within the Dpr and DIP families were detected in the high-throughput
experiments that determined the original Dpr-DIP interactome, we wanted to determine the
accurate oligomeric states of all members of both families. This information is not only
important for a better understanding of the function of these molecules, but can be crucial in
helping determine accurate binding affinities between molecules when analyzing results from
SPR experiments since multimeric analytes can invalidate the 1:1 interaction model used to
calculate the KD.
We performed sedimentation equilibrium AUC experiments on all members of the Dpr
and DIP families for which we were able to produce adequate amounts of protein. AUC allows
for accurate determination of not only the oligomeric state, but its associated KD as well. The
results from these experiments are summarized in Table 10 and two sample profiles are shown in
Figure 33.
Surprisingly, we discovered many novel homodimers that were not seen in the original
interactome. We found that at least four of the DIPs formed homodimers and were able to
calculate the KD of homodimerization for three of these molecules, all of which fell within a
range of 10-24μM. While all of the DIP homophilic KDs measured were similar in strength, their
relative strength when compared to their heterophilic KDs varied. In the case of DIP-α, its
homophilic interaction, which has a KD of 24μM, is about 10-fold weaker than its heterophilic
binding with Dpr6 and Dpr10, which have KDs of ~2μM. DIP-η has the reverse property in that

100
its homophilic KD of 10.4μM is stronger than its heterophilic interactions which have KDs
ranging from 35.8 μM - 208μM. DIP-ζ, which has a homophilic KD of 22μM, falls into a
separate category, its homophilic affinity is equivalent to the KDs with its strongest heterophilic
Dpr partners, Dpr13 and Dpr18, which bind with KDs of 31.9 μM and 21.7μM respectively.
In addition to discovering that many of the DIPs homodimerize, AUC experiments
determined that Dpr8, Dpr12 and Dpr21 form homodimers as well. These homophilic
interactions are about 2-fold weaker than those seen in DIPs. Interestingly, Dpr8 and Dpr21 are
members of the same binding group and only bind DIP-β. Their heterophilic interactions are
some of the strongest measured between Dprs and DIPs, with binding KDs of 1.52μM for Dpr8
and 1.8μM for Dpr21, which makes their homophilic interaction about 25-45 fold weaker in
comparison. It should be noted that due to the presence of the Dpr homophilic interaction, we
removed the two highest concentrations tested in our SPR interactome experiments from our
affinity calculations and used data only from a 3-fold dilution of 6 concentrations ranging from
9-.012μM, which fit well to our 1:1 interaction model.
The other Dpr homodimer, Dpr12, is a unique member of its family since it is the sole
binding partner of DIP-δ (Ozkan, Carrillo et al. 2013). Unfortunately, we were unable to produce
DIP-δ at a high enough purity for SPR experiments, so it remains unclear how the Dpr12
homophilic KD compares to its heterophilic KD with DIP- δ.

101
Table 10: Dpr and DIP AUC Results
Protein Oligomeric State KD (μM)
DIPs
DIP-α Dimer 24 ± 1.1
DIP-β Monomer n/a
DIP-γ Monomer n/a
DIP-ε Precipitation Issues n/a
DIP-ζ Dimer 22 ± 2.1
DIP-η Dimer 10 ± 1.3
DIP-θ Dimer, but
precipitation issues n/a
Protein Oligomeric State KD
(μM)
Dprs
Dpr1 Monomer n/a Dpr2 Monomer n/a Dpr3 Monomer n/a Dpr4 Monomer n/a Dpr5 Monomer n/a Dpr6S Monomer n/a Dpr7 Precipitation Issues n/a Dpr8 Dimer 64 ± 4.9 Dpr10DL Monomer n/a Dpr11 Monomer n/a Dpr12C Dimer 45 ± 3.3 Dpr13 Monomer n/a Dpr16 Monomer n/a Dpr17 Monomer n/a Dpr18 Precipitation Issues n/a Dpr19 Monomer n/a Dpr20 Monomer n/a Dpr21 Dimer 49 ± 4.0

102
Figure 33: Sedimentation equilibrium AUC analysis. Curves showing the data fit to a dimer
model, with residuals shown on the bottom. (a) DIP-η and (b) Dpr21 both form homodimers in
solution.

103
7.3 Crystallization of DIP-α and DIP-θ crystal structures
With the discovery that many of the DIPs can form homodimers, we wanted to uncover
the architecture of these homodimers. Many cell surface proteins such as classical cadherins,
nectins and sidekicks form homodimers along the same interface as their heterophilic
interactions (Brasch, Harrison et al. 2012, Harrison, Vendome et al. 2012, Goodman, Yamagata
et al. 2016). Cell surface proteins can also have multiple homophilic interfaces, as seen in
protocadherins, whose EC1-4 membrane distal domains interact homophilically in trans while its
EC5-6 can interact homophically in cis (Goodman, Rubinstein et al. 2017, Rubinstein, Goodman
et al. 2017). In order to uncover the nature of the homodimers formed in DIPs, we set out to
determine the molecular structure of these homophilic interfaces using X-ray crystallography.
7.3.1 DIP-α Crystallization
Three domain DIP-α at 8.8mg/ml was screened in 96-well sitting drop format and
showed an unusually high propensity to crystallize, forming crystals in many conditions with a
variety of salt and PEG precipitants. In most of these conditions, crystals took a “crescent moon”
shape while others were rock-like with many sharp and uneven edges (Figure 34a). Four of these
conditions were optimized further in hanging-drop 24-well format and multiple crystals from two
different conditions were screened at the APS E-Line. A 2.9Å dataset was collected from a
crystal grown in a condition containing: 2% PEG 3,350, 17% Tascimate pH7.0, .1M Hepes
pH7.0 and was flash frozen in an additional 30% glycerol.
Data processing of this dataset revealed unit cell dimensions of a=b=104.578Å
c=102.195Å, where α=β=90° and γ=120°. The space group of the crystal was determined to be
P321. A D1D2 domain fragment of DIP-α had already been solved (5EO9), so solution through

104
molecular replacement was trivial. The unsolved D3 domain was modeled with the previously
solved DIP-η D3 from the Dpr4/DIP-η structure. Refinement statistics are available in Table 11.
Figure 34: Crystals of DIP-α and DIP-θ. Optimized crystals in nylon loop before data
collection, with crystallization condition underneath. (a) DIP-α crystal at the right of the loop
shows the “crescent moon” shape common among DIP-α crystals (b) DIP-θ crystals formed wide
long rods.
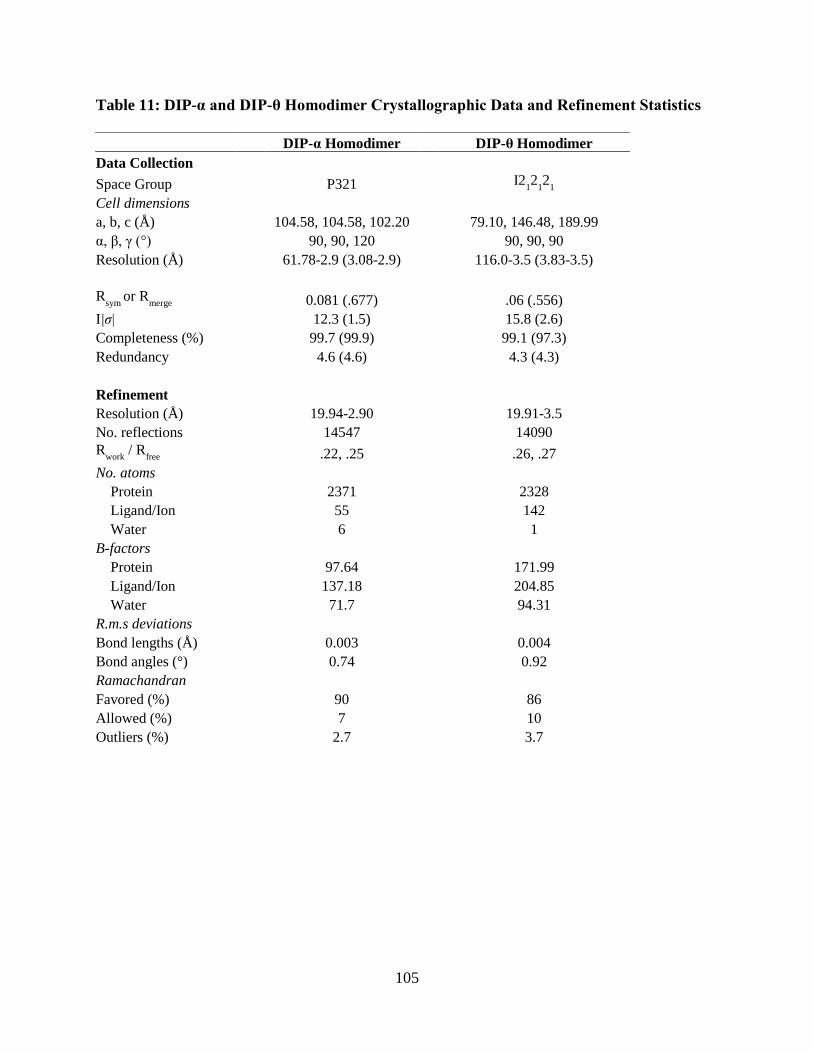
105
Table 11: DIP-α and DIP-θ Homodimer Crystallographic Data and Refinement Statistics
DIP-α Homodimer
DIP-θ Homodimer
Data Collection Space Group
P321
I212
12
1
Cell dimensions a, b, c (Å)
104.58, 104.58, 102.20
79.10, 146.48, 189.99 α, β, γ (°)
90, 90, 120
90, 90, 90
Resolution (Å)
61.78-2.9 (3.08-2.9)
116.0-3.5 (3.83-3.5)
Rsym
or Rmerge
0.081 (.677)
.06 (.556) I|σ|
12.3 (1.5)
15.8 (2.6)
Completeness (%)
99.7 (99.9)
99.1 (97.3) Redundancy
4.6 (4.6)
4.3 (4.3)
Refinement Resolution (Å)
19.94-2.90
19.91-3.5 No. reflections
14547
14090
Rwork
/ Rfree
.22, .25
.26, .27 No. atoms
Protein
2371
2328 Ligand/Ion
55
142
Water
6
1 B-factors
Protein
97.64
171.99 Ligand/Ion
137.18
204.85
Water
71.7
94.31 R.m.s deviations
Bond lengths (Å)
0.003
0.004 Bond angles (°)
0.74
0.92
Ramachandran Favored (%)
90
86 Allowed (%)
7
10
Outliers (%)
2.7
3.7

106
7.3.2 DIP-θ crystallization
Sparse matrix screening for potential crystals of Dpr4/DIP-θ and Dpr5/DIP-θ complexes
led to crystals that were later determined to only contain DIP-θ within their asymmetric unit.
These crystals were all rod-shaped and formed in multiple conditions with either low or medium
molecular weight PEGs. Optimizing the conditions using only three domain DIP-θ at 12.8mg/ml
resulted in larger more well-defined crystals (Figure 34b). Crystals were screened at the APS C-
Line and a 3.5Å dataset was collected from a crystal grown in a condition containing: 12% PEG
4,000, .3M AmSO4, .08M NaAcetate pH4.6, 20% glycerol and was flash frozen in a
cryoprotectant containing 30% glycerol.
Data processing of this dataset revealed unit cell dimensions of a=79.103Å, b=146.476Å
and c=189.992Å, where α=β=γ=90°. The space group of the crystal was determined to be
I212121. The DIP-η coordinates from the previously discussed Dpr4/DIP-η structure was used to
solve the structure through molecular replacement. Refinement statistics are available in Table
11.
7.4 Homophilic interface of DIP-α & DIP-θ
The asymmetric unit of the DIP-α crystal contains only one 3 domain molecule of DIP-α.
One of the crystal contacts is an interaction between D1 domains along their CC'C''FG face of
the V-set immunoglobulin fold (Figure35a and 36). The orientation of the D1 domains is nearly
identical to what is seen in the heterophilic Dpr6/DIP-α complex but with a DIP-α D1 domain
replacing the Dpr6 D1 domain. Superposition of the two D1-D1 interactions reveals an RMSD of
.685Å over 167 Cα atoms. The interface has a buried surface area of 1723Å2 and like the
previously discussed heterophilic complexes, is dominated by hydrophobic van der Waals

107
interactions. The hydrophobic core of the interface is preserved with Leu76, Ile83, Ile86 and
Ile91 of DIP-α replacing Ile108, Ile115, Val118, Tyr123 of Dpr6 in the interface. The
homodimer interface also contains additional hydrophobic side chains buried near the core, with
Ala82 and Met123 replacing His114 and Glu156 of Dpr6.
Figure 35: Overall crystal structures of DIP homodimers. Ribbon representation of (a) DIP-
α, and (b) DIP-θ homodimers. N-linked glycans that were visible in electron density maps are
represented as spheres. Both depicted homodimers form between symmetry related protomers in
the crystal lattice.
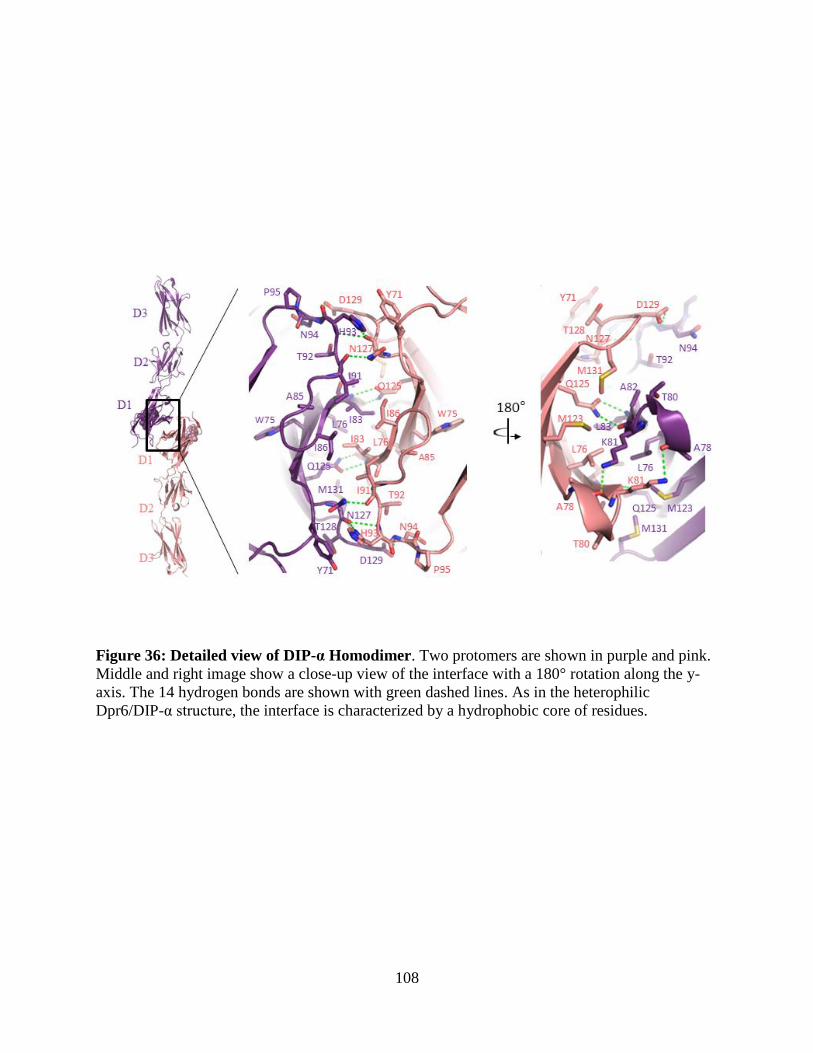
108
Figure 36: Detailed view of DIP-α Homodimer. Two protomers are shown in purple and pink.
Middle and right image show a close-up view of the interface with a 180° rotation along the y-
axis. The 14 hydrogen bonds are shown with green dashed lines. As in the heterophilic
Dpr6/DIP-α structure, the interface is characterized by a hydrophobic core of residues.
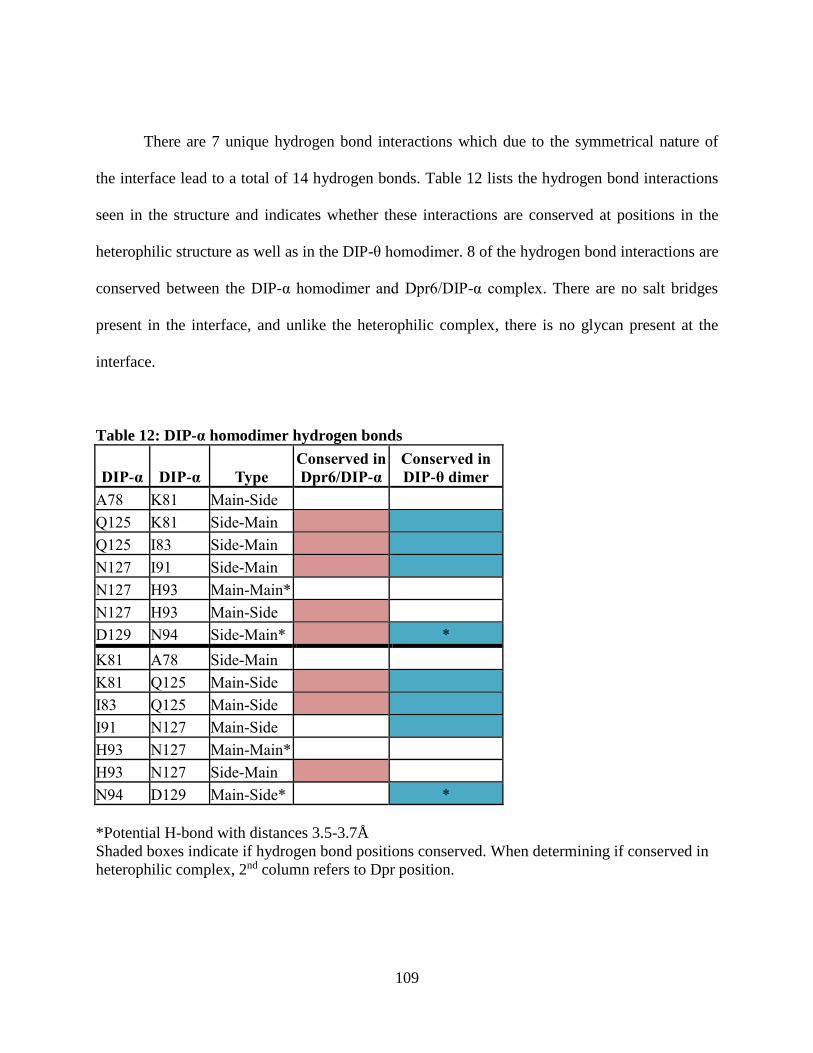
109
There are 7 unique hydrogen bond interactions which due to the symmetrical nature of
the interface lead to a total of 14 hydrogen bonds. Table 12 lists the hydrogen bond interactions
seen in the structure and indicates whether these interactions are conserved at positions in the
heterophilic structure as well as in the DIP-θ homodimer. 8 of the hydrogen bond interactions are
conserved between the DIP-α homodimer and Dpr6/DIP-α complex. There are no salt bridges
present in the interface, and unlike the heterophilic complex, there is no glycan present at the
interface.
Table 12: DIP-α homodimer hydrogen bonds
DIP-α DIP-α Type Conserved in
Dpr6/DIP-α Conserved in DIP-θ dimer
A78 K81 Main-Side Q125 K81 Side-Main
Q125 I83 Side-Main N127 I91 Side-Main N127 H93 Main-Main*
N127 H93 Main-Side D129 N94 Side-Main* *
K81 A78 Side-Main K81 Q125 Main-Side
I83 Q125 Main-Side I91 N127 Main-Side
H93 N127 Main-Main* H93 N127 Side-Main
N94 D129 Main-Side*
*
*Potential H-bond with distances 3.5-3.7Å
Shaded boxes indicate if hydrogen bond positions conserved. When determining if conserved in
heterophilic complex, 2nd column refers to Dpr position.

110
As in the DIP-α crystal, the DIP-θ crystal contains only one protomer in its asymmetric
unit, which interacts with a symmetry mate to form an equivalent homodimer as seen in DIP-α
(Figure 35b and 37a). As can be seen in the alignment in Figure 36b, the residue identities in the
interface are mostly conserved. Residues were identified as interfacial if more than 5% of their
accessible surface area was buried in the complex as determined by PISA (Krissinel and Henrick
2007). A few differences exist between the two homodimers in terms of which residues are
denoted as being interfacial: Lys160, His177 and Val178 of DIP-θ and Trp75, Ala85 and Pro95
of DIP-α are all at positions that are considered interfacial only for their own dimeric structure.
However, with the exception of DIP-θ Lys160 and His177 which have side chains buried in the
interface, the other interfacial residue differences each bury less that 5Å2, making their
contributions minimal.
The hydrophobic core of the DIP-θ interface remains intact, with DIP-θ sharing the same
hydrophobic residue identity as all four core positions in DIP-α (Figure 37b). The DIP-θ
homodimer has 10 hydrogen bonds, 4 less than the DIP-α dimer, but much of the hydrogen bond
network is conserved, with 8 of the hydrogen bonds conserved in DIP-α and 6 of these conserved
in the Dpr2/DIP-θ heterophilic complex (Table 13). Unlike its heterophilic complex, no salt
bridges exist in the DIP-θ homophilic D1-D1 interaction.
Like the DIP-α homodimer, the DIP-θ D1-D1 interaction aligns very well to its
heterophilic complex, with a superposition resulting in an RMSD of 0.644Å over 173Cα atoms
(Table 14). A close similarity is also seen with the DIP-α homodimer, which has an RMSD of
0.791Å over 188Cα atoms.

111
Figure 37: Comparison of DIP-α and DIP-θ homodomers. (a) D1-D1 superposition shows an
identical interaction topology. DIP-α in purple, DIP-θ in teal (b) Alignment of interfacial region
with colored boxes over residues that have at least 5% of their accessible surface area buried in
their respective homodimer. The red arrows highlight the hydrophobic residues whose side
chains make up the hydrophobic core, all of which are conserved between the two dimers.

112
Table 13: DIP-θ Homodimer hydrogen bonds
*Potential H-bond with distances 3.5-3.7Å
Shaded boxes indicate if hydrogen bond positions conserved. When determining if conserved in
Heterophilic complex, 2nd column refers to Dpr position.
Table 14: D1-D1 Complex superposition RMSD (Å)
(#) Cα atoms aligned out of a possible 202-206
DIP-θ DIP-θ Type Conserved in
Dpr2/DIP-θ Conserved in
DIP-α dimer Q213 Q169 Side-Main Q213 I171 Side-Main N215 I179 Side-Main D217 N182 Side-Side
D217 N182 Side-Main*
Q169 Q213 Main-Side I171 Q213 Main-Side I179 N215 Main-Side N182 D217 Side-Side
N182 D217 Main-Side*
Dpr6/DIP-α Dpr2/DIP-θ Dpr4/DIP-η
DIP-θ
Homodimer DIP-α Homodimer 0.685 (167) 0.963 (154) 0.904 (170) 0.791 (188) DIP-θ Homodimer 0.794 (181) 0.644 (173) 0.612 (171)
113
7.5 Targeted point mutations confirm homophilic interface
The homophilic interface seen in both DIP-α and DIP-θ crystal structures is the only
crystal contact shared between these two crystals. A shared interface that is present in multiple
crystal forms is a strong indicator that the interface is not a crystal artifact but an accurate
representation of the molecular interaction. To provide further experimental evidence that these
molecules form homodimers along this interface, we set out measure whether the homophilic
interaction is abolished by point mutations in the D1-D1 interface.
Introducing an unpaired charged residue into an interface has been shown to be an
effective method in abolishing protomer interactions (Harrison, Vendome et al. 2012,
Rubinstein, Thu et al. 2015). DIP-α Ile83 and Ile86 are both located in the core of the interface
and are surrounded by uncharged hydrophobic residues. Additionally, both residues are close to
the symmetrical center of the homodimer and thus appose themselves. Mutating one of these
positions to a charged residue would not only bury a charge in a hydrophobic region but would
also cause two like-charged residues to appose each other in a homodimer, creating an even more
unfavorable interaction.
Homophilic binding of DIP-α I83D and DIP-α I86D was tested in sedimentation
equilibrium AUC experiments (Table 15). AUC revealed that both single mutants behaved as
monomers with an apparent molecular weight of 36,570Da for DIP-α I83D and 36,974Da for
DIP-α I86D. These molecular weights are nearly identical to the MALDI determined molecular
weight for our wildtype DIP-α construct which is ~36,400Da. This provides a strong contrast to
wildtype DIP-α which has calculated KD of 24μM in AUC experiments. Abolishment of the
homodimer by targeted mutations provides additional experimental evidence that the interface
seen in the crystal is in fact the method of homophilic interaction.

114
Table 15: AUC results of DIP-α mutants
Protein Multimer State KD
DIP-α WT Dimer 24μM
DIP-α I83D Monomer n/a
DIP-α I86D Monomer n/a

115
Chapter 8:
Probing heterophilic and homophilic contributions in vivo
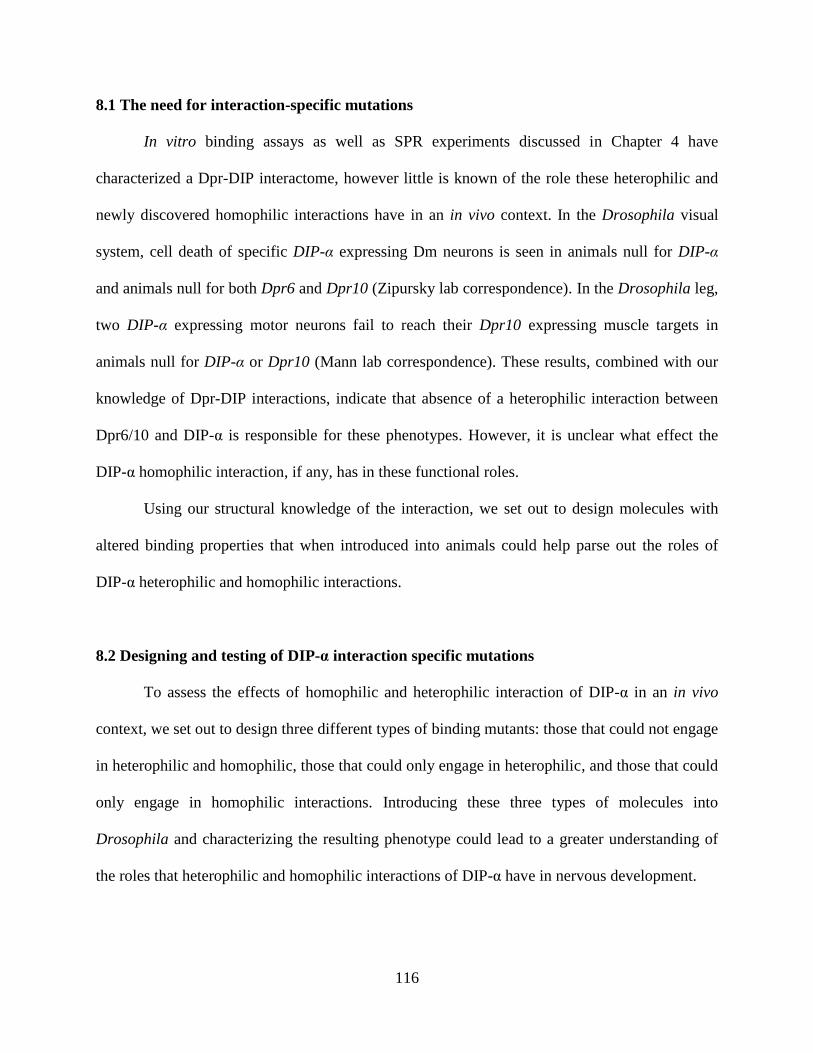
116
8.1 The need for interaction-specific mutations
In vitro binding assays as well as SPR experiments discussed in Chapter 4 have
characterized a Dpr-DIP interactome, however little is known of the role these heterophilic and
newly discovered homophilic interactions have in an in vivo context. In the Drosophila visual
system, cell death of specific DIP-α expressing Dm neurons is seen in animals null for DIP-α
and animals null for both Dpr6 and Dpr10 (Zipursky lab correspondence). In the Drosophila leg,
two DIP-α expressing motor neurons fail to reach their Dpr10 expressing muscle targets in
animals null for DIP-α or Dpr10 (Mann lab correspondence). These results, combined with our
knowledge of Dpr-DIP interactions, indicate that absence of a heterophilic interaction between
Dpr6/10 and DIP-α is responsible for these phenotypes. However, it is unclear what effect the
DIP-α homophilic interaction, if any, has in these functional roles.
Using our structural knowledge of the interaction, we set out to design molecules with
altered binding properties that when introduced into animals could help parse out the roles of
DIP-α heterophilic and homophilic interactions.
8.2 Designing and testing of DIP-α interaction specific mutations
To assess the effects of homophilic and heterophilic interaction of DIP-α in an in vivo
context, we set out to design three different types of binding mutants: those that could not engage
in heterophilic and homophilic, those that could only engage in heterophilic, and those that could
only engage in homophilic interactions. Introducing these three types of molecules into
Drosophila and characterizing the resulting phenotype could lead to a greater understanding of
the roles that heterophilic and homophilic interactions of DIP-α have in nervous development.

117
Since both interactions are occurring along a shared interface, designing mutations that
disrupt only one interaction while keeping the other intact is challenging. The first method used
in designing interaction specific mutants involved visual inspection and comparison of the
Dpr6/DIP-α heterophilic and DIP-α homophilic interface from the previously solved crystal
structures. Mutations at residue positions that could introduce electrostatic or steric clashes that
were predicted to negatively affect only one of the interactions were designed.
In an alternate method to solely disrupting heterophilic interactions, some of the SI
positions of DIP-α believed to be involved in Dpr binding specificity were mutated to the
identities of those in DIP-θ. As seen by AUC and in the previously discussed crystal structures,
DIP-θ engages in heterophilic and homophilic interactions along the same interface as DIP-α.
However, these two DIPs do not share any heterophilic Dpr partners in common. By mutating
the residues involved in Dpr binding specificity, it was hypothesized that the heterophilic
interactions to Dpr6 and 10 could be weakened, while the homophilic interaction would remain
intact. When changing residues involved in specificity determination to the identity seen in
DIP-θ, we felt it was also important to test whether or not these changes introduced novel
heterophilic interactions between DIP-α and Dprs that bind DIP-θ. If new heterophilic
interactions are introduced, using the mutant in vivo becomes problematic since it will be
difficult to determine if the underlying cause of a phenotype is due to the absence of the native
heterophilic interaction or the introduction of new non-wildtype interactions.
And finally, FoldX, a program that uses an energy function to calculate the free energy of
a protein complex (Schymkowitz, Borg et al. 2005) was used to design mutations that selectively
disrupted either heterophilic or homophilic interactions. FoldX position scan, which mutates a
selected residue to the 20 amino acids and carries out free energy calculations for each single

118
mutant protein, was performed at 33 interfacial positions in DIP-α. The difference in free energy
between the mutated and wildtype complex, ΔΔG, was calculated for each mutant in both
heterophilic and homophilic complexes. Mutations that have positive ΔΔG values for one type of
interaction while simultaneously having zero or negative ΔΔG for the other were thought to be
good candidates for experimental testing.
The DIP-α mutants predicted to abolish both or only a select interaction were produced in
HEK293 cells and had their binding affinity to Dpr6 and Dpr10 tested in SPR. Multimer states
and any associated KD were determined in AUC. Depending on initial results and the desired
impact of the mutation, not all mutants were tested with both SPR and AUC. The results of these
experiments are summarized in Table 16.

119
Table 16: Summary of KDs of DIP-α Interaction Mutants
Dpr concentrations tested were 3-fold dilutions series of 9-0.0041μM for Dpr6 and 27-0.0041μM
for Dpr10D, except for A78K+N94D which used 9-0.0041μM. For mutants tested for binding to
Dpr4, 27-0.037 μM concentrations were used for G74A, K81Q+A82T, K81Q+S133D, and a 81-
.037μM range was used for K81Q and A82T. No Dpr4 binding was measured for any DIP-α
mutant tested.

120
8.3 Disrupting DIP-α heterophilic/homophilic and heterophilic interactions only
As expected, disrupting both heterophilic Dpr/DIP-α interactions and DIP-α
homodimerization proved simple. DIP-α I83D and DIP-α I86D, discussed previously in section
7.4, achieved the desired effect of disrupting both homophilic and heterophilic interactions by
burying an unpaired charge into the hydrophobic core of the protein. This result was expected,
since both heterophilic and homophilic interactions have the same hydrophobic core in their
interface.
However, selectively disrupting the DIP-α heterophilic interactions proved difficult. The
initial strategy that provided some success was mutating the SI2 and SI3 residues, which are
believed to be important to heterophilic specificity (discussed in Chapter 6). DIP-α K81Q,
mutates SI2 to the residue conserved in DIP-η, -θ and -ι. This mutant has a homophilic KD of
19.6μM, almost identical to what is seen in wildtype DIP-α which has a KD of 24.0μM. The
mutation also has the desired effect of weakening heterophilic binding to Dpr6 and Dpr10 by
about 10-fold compared to wildtype, resulting in KDs of 18.0μM and 22.8μM respectively. In
order confirm that the SI2 mutation did not significantly increase the binding affinity to DIP-θ
binding Dprs, we tested to see if Dpr4, which has the strongest measured affinity to DIP-θ, could
bind this DIP-α mutant. No binding of Dpr4 to the DIP-α K81Q mutant was detected.
We felt the reduction of the heterophilic KD seen in DIP-α K81Q was not significant
enough for in vivo studies and set out to introduce additional mutations to try and completely
abolish this interaction. Unfortunately, DIP-α K81Q A82T, which converts both specificity
residues SI2 and SI3 to that of the DIP-η, -θ and -ι group, gave a negative binding signal in SPR
experiments, indicating that the protein was not well-behaved. We then turned to FoldX, which
predicted that additional S133D or G74S mutations would destabilize the heterophilic and

121
stabilize the homophilic interaction. DIP-α K81Q S133D weakened the heterophilic KD to Dpr6
and Dpr10 to 26.2μM and 39.1μM respectively, only a slight increase compared to the K81Q
single mutant. This mutation also had the undesired effect of weakening the homophilic
interaction by about 3-fold compared to wildtype to a KD of 64μM. DIP-α K81Q G74S fared
better and is our most ideal mutant tested, with heterophilic KDs of 101μM and 68μM to Dpr6
and Dpr10 respectively. However, this mutant had a homophilic KD of 46μM, about 2-fold
weaker than wildtype.
8.4 Mutations designed to disrupt only DIP-α homophilic interactions
Two designed mutations were successful in selectively disrupting homodimer formation.
The first, DIP-α A78K, introduces a lysine on the CC’ loop of D1 (Figure 38a). In a homophilic
complex, the newly introduced Lys78 would be directly opposed to Lys81 of the binding
protomer. Due to the symmetrical nature of the homodimer, the A78K mutation would introduce
electrostatic repulsion of four positively charged lysine residues buried next to each other. In
contrast, the Dpr6 or Dpr10 heterophilic complex would not have such a significant electrostatic
clash. Instead, the new Lys apposes Ile113 of Dpr6 (Figure 38a). Results from AUC experiments
show that this mutation successfully disrupts homodimer formation, with the mutant behaving as
a monomer in solution (Figure39a). Unfortunately, it has the undesired effect of increasing DIP-
α heterophilic affinities by more than 5-fold over wildtype, with DIP-α A78K having KDs of
0.460μM and 0.281 μM to Dpr6 and Dpr10 respectively (Figure 40a).
Further confirmation that the DIP-α A78K mutant disrupted homodimer formation was
obtained through the use of Multi-Angle Light Scattering (MALS) measurements following the
passage of a sample over a size exclusion column (SEC), which can determine the average

122
molecular weight of a species separated by SEC. The molecular weight of the DIP-α monomer
was determined by MALDI Mass Spec to be ~36,400Da. 100ul of purified 81μM DIP-α wildtype
was run over a Superdex 200 increase (GE Healthcare) followed by a Wyatt Optilab TRex
detector and Wyatt DAWN Heleos-II detector. Analysis of the peak revealed a molecular weight
of ~49,000Da (Figure 39b), significantly higher than the MALDI determined molecular weight,
indicating that DIP-α WT exists in a monomer-dimer equilibrium. For DIP-α A78K, 100ul at
27μM was analyzed and a molecular weight of ~35,000Da was determined (Figure 39c), which
is the molecular weight of the monomer. This confirms our AUC result for this mutant.
However, while the concentration of the mutant analyzed in SEC-MALS is slightly greater than
the wildtype KD, a more accurate experiment would be to test the mutant at higher concentrations
in order to confirm that no low affinity homodimerization was missed.
A second mutant, which was designed through the use of FoldX calculations, DIP-α
N94D, was also able to selectively disrupt homodimer formation in a similar fashion. In a
homophilic complex, Asn94 directly apposes Asp129 (Figure 38b). Introducing Asp94 would
bring two negatively charged residues close together in a homodimer. In a heterophilic complex,
DIP-α Asp94 would appose Gln162 of Dpr6 or Dpr10 and would likely have a minimal effect on
binding affinity. Additionally, due to the symmetrical nature of the homodimer, this mutation
introduces an electrostatic repulsion on both the top and bottom of the interface, creating like-
charge clashes on opposite ends of the complex. SPR experiments using a DIP-α N94D mutant
showed only a slight strengthening in heterophilic binding affinities compared to wildtype, with
KDs of 1.04μM to Dpr6 and 1.41μM to Dpr10 (Figure 40b), while AUC experiments showed a
very weak homophilic KD of 390μM. It should be noted that the sedimentation equilibrium
experiment determined a KD/KI ≈ 1 for this mutant, which makes it difficult to distinguish

123
whether DIP-α N94D is actually a very weak homodimer or is just prone to non-specific
aggregation.
Figure 38: DIP-α select homophilic disruption. Close-up views of specific regions of the D1-
D1 interface with DIP-α in teal and pink, and Dpr6 residues overlaid in gold. (A) Region where
A78 opposes K81. An A78K mutation would bury four lysines against each other in a
homodimer, creating an electrostatic repulsion (B) Region surrounding N94, highlighting the
opposing D129 in a DIP-α homodimer. An N94D mutation would introduce an electrostatic
repulsion in a homodimer only.

124
Figure 39: AUC and SEC-MALS of DIP-α A39K mutant. (a) Overlaid AUC profiles of DIP-α WT and A78K mutant with
residuals below. Dimer model fits well for DIP-α which has a KD of homodimerization of 24μM. Monomer model fits to DIP-α A78K.
DIP-α WT data in blue, DIP-α A78K data in red. (b) SEC-MALS UV profile for DIP-α WT showing the right tail indicative of a
homodimer. The right image highlights the region of peak used for molecular weight calculation. DIP-α has a molecular weight of
49kDa. (b)SEC-MALS results show that the DIP-α A39K mutant has a molecular weight of 35kDa, which is the size of a monomer as
determined by MALDI mass spec.

125
Figure 40: SPR Binding curves for DIP-α mutants. Left column has fitted data for binding to
Dpr6, right column data for binding to Dpr10D. Red and green curves are mutants, purple curves
are DIP-α WT results from neighboring surface. (a) A78K mutant binds Dpr6 and Dpr10 ~5 or
7-fold stronger than wildtype, while I86D shows no binding. (b) N94D shows very similar
affinities compared to wildtype, and is a very weak dimer in AUC. (c) A78K N94D behaves
similarly to the A78K mutation.

126
8.5 Mutations that can alter Dpr10 binding in vivo
The previous sections have detailed extensive work in developing mutations that can alter
DIP-α heterophilic and homophilic binding in vivo, but we are also interested in altering binding
affinities through mutations on the Dpr as well. Cell death of specific medulla neurons is seen in
DIP-α null animals as well animals null for both Dpr6 and Dpr10 (Zipursky Lab
correspondence). Abolishing heterophilic binding by targeting the Dpr in vivo can provide a
complementary result to experiments with the DIP-α mutants discussed in the previous sections
and could provide strong evidence that heterophilic D1-D1 interaction between DIP-α and Dpr6
or Dpr10 is involved in preventing cell death from occurring.
Since Dpr6 and Dpr10 seem to behave in a functionally redundant manner with regards to
cell death, our collaborators designed experiments to be performed with mutant dpr10 in a dpr6
null background. Previous work which determined the Dpr6/DIP-α crystal structure had already
demonstrated Dpr6 mutations that could abolish or significantly weaken binding to DIP-α in SPR
experiments (Carrillo, Ozkan et al. 2015). Using FoldX, we designed 3 single mutations in
Dpr10 that were predicted to disrupt binding to DIP-α: I95D, Y103D and Q138D. These
mutations are at the same positions as previously tested Dpr6 mutants that were shown to disrupt
the interaction to DIP-α (Carrillo, Ozkan et al. 2015), and bury unpaired charges near
hydrophobic residues in the interface.
Dpr10 I95D could not be expressed in HEK293 cells, however sufficient quantities of
Dpr10 Y103D and Dpr10 Q138D were produced for biophysical experiments. SPR was used to
measure binding affinities and showed that Dpr10Y103D completely abolished binding to DIP-α
while Dpr10 Q138D weakened binding by only about 10-fold compared to wildtype, with a KD
of 19.3μM (Table 17).

127
Table 17: Dpr10 mutant binding affinities
Protein KD to DIP-α (μM)
Dpr10 1.82±.02
Dpr10 Y103D No binding
Dpr10 Q138D 19.3±.6
Determined from experiment with analyte concentrations from 3-fold dilution series of 27-
.004μM
8.6 Mutants selected for in vivo experiments
Without satisfactory results in selectively disrupting heterophilic interactions, only three
mutants have been introduced into Drosophila through the use of CRISPR/Cas9 technology for
further characterization. DIP-α I83D was selected as the mutant to analyze effects of abolishing
both heterophilic and homophilic interactions and Dpr10 Y103D was selected as the mutation to
abolish Dpr10 interactions. Liposome aggregation experiments, which proved later to be
unreliable, showed no decrease in homophilic aggregation of either single mutant DIP-α A78K
or N95D (Zipursky Lab correspondence). With the possibility that the combinatorial effect may
be greater, DIP-α A78K N94D was introduced into Drosophila through CRISPR/Cas9 in order to
assess what phenotypic effects selective abolishment of the homophilic interface would cause.
This double mutant has since been tested in SPR, and like the A78K single mutant, showed a
similar 5-fold increase in heterophilic binding to Dpr6 and Dpr10 over wildtype (Figure 40c).
AUC experiments to confirm homodimer disruption are planned, but since both single mutants
behaved as monomers and the mutant residues are in different regions of the interface, it is likely
that the double mutant is also monomeric.

128
As of the preparation of this manuscript, DIP-α A78K N94D has not been analyzed.
However, preliminary results show that the knock-ins of DIP-α I83D and Dpr10Y103D display
the same cell death phenotype with similar penetrance to their corresponding null mutants. These
exciting results, achieved with single point mutations at the interface, provide evidence that the
heterophilic D1-D1 interaction between DIP-α and Dpr10 is crucial for Dm4 cell survival.

129
Chapter 9:
Nectin chimeras, a gain of function in vivo experiment

130
9.1 Interrogating Dpr-DIP interactions through gain-of-function experiments
In addition to showing the importance of DIP-α/Dpr heterophilic interactions in vivo
through the use of destructive mutations, we designed complementary experiments that could
show their importance through gain of function experiments. Our goal was to introduce a mutant
DIP-α protein in vivo whose D1 domain could not recognize other native Drosophila proteins,
and rescue this animal by introducing a mutant Dpr10 that could only bind to our mutant DIP-α.
The hypothesis behind this experiment is that the mutant phenotype seen in DIP-α can be rescued
by solely reestablishing a heterophilic interaction between DIP-α and Dpr10 through the use of a
unique D1 interface.
To accomplish this, we designed an experiment that would use chimera versions of DIP-α
and Dpr10: replacing only their D1 binding domains with those of human Nectin-1 (Nec1) and
Nectin-3 (Nec3) (Figure 41a and 41b). Nec1 and Nec3 are cell-surface IG proteins that have
been shown to be involved in cell-cell adhesion in a variety of both neural and endothelial tissue
(reviewed in Samanta and Almo 2015). Similar to DIP molecules, Nec1 and Nec3 extracellular
regions consist of three tandem IG domains that engage in both heterophilic and homophilic
interactions through their membrane distal domain (Harrison, Vendome et al. 2012). The
interface used in both homophilic and heterophilic interactions between Nec1 and Nec3 occur
along the same region, the CC'C''FG face of D1. As shown after the determination of the initial
Dpr-DIP crystal structure, the nectin homodimer has a similar but distinct interaction topology
when compared to Dpr-DIP complexes (Carrillo, Ozkan et al. 2015). This can be seen in Figure
41c, which shows an overlay of the Nec1 homodimer and the Dpr6/DIP-α complex.

131
Figure 41: Nectin-chimeras. Overall construct design of the (a) Nec1-α and Nec3-Dpr10
complementary set and (b) Nec3-α and Nec1-Dpr10 complementary set of chimera molecules.
The (a) pair is more ideal because Nec1 shares similar homophilic properties to DIP- α. (c)
Superposition of D1-D1 complexes of Dpr6/DIP-α and Nec1/Nec1 homodimer reveal similar
interaction topology, but distinct interfaces. Nec1 is purple and dark teal, Dpr6 is gold and DIP-α
is pink. PDB ID: 5EO9 and 4FMF were used.
.

132
We felt Nec1 and Nec3 were excellent candidates to mimic native Dpr10 and DIP-α
heterophilic binding since their D1-D1 interactions were similar to DIP-Dpr, but distinct enough
that we believed it would not introduce additional non-native interactions. Before our
collaborators could undertake the laborious process of introducing these chimeras into flies, we
needed to demonstrate through in vitro biophysical experiments that these chimeras behaved and
functioned as desired.
9.2 Design and Expression of Dpr/DIP- Nectin chimeras
Using Nec1 and Nec3, we explored two potential chimera designs: replacing D1 and
creating a Nec1-DIPα and a Nec3-Dpr10 chimera or the reverse, a Nec3-DIPα paired with a
Nec1-Dpr10 chimera. The first combination is more ideal since it closely mirrors the homophilic
properties of the native Dpr/DIP proteins. Human Nec1 has been shown by AUC to behave as a
homodimer and has a KD of 17.5μM (Harrison, Vendome et al. 2012), almost identical to the
homophilic KD of 24μM seen in DIP-α. Unfortunately, human Nec3 is not monomeric like Dpr10
and is weakly dimeric with an affinity of 228μM (Harrison, Vendome et al. 2012). While not the
perfect substitute for Dpr10 due to its weak homophilic properties, Nec3 makes a better
substitute than Nec1. Since solubility and behavior of chimera proteins can be unpredictable,
both chimera combinations were designed.
Chimera constructs were designed through the use of alignments and visual inspection of
the known structures, which proved simple due to their similarity. Chimeras of DIP-α containing
native D2-D3 with D1 of Nec1 or Nec3 and chimeras of Dpr10 containing native D2 with D1 of
Nec1 or Nec3 were expressed and produced. Additional chimeras of Dpr10 were made to include
alternate isoform A that contains the 47 amino acid linker region between D1 and D2 (Nec3-

133
Dpr10A) as well as a chimera that included the 34 amino acid region n-terminal of native Dpr10
D1 (Nec3-Dpr10DL).
Nec1-DIPα was the only chimera construct that could not express in HEK293 cells.
Visual inspection of a model of the chimera revealed that the native D1-D2 salt bridge formed
between Glu119 and Lys178 of Nec1 is not established in a Nec1-DIPα chimera (Figure 42a).
FoldX predictions showed that reforming this salt bridge at the equivalent position in D2 of DIP-
α through the Y172K mutation would increase the thermodynamic stability of the molecule. We
introduced this mutation, as well as an additional mutation, Nec1-DIPα L116E, which was also
predicted by FoldX to stabilize the molecule. Both the Y172K single mutation and L116E
Y172K double mutations were able to rescue recombinant protein expression of Nec1-DIPα,
with both mutations providing the greater increase in yield (Figure 42b).
Figure 42: Nec1-α Expression mutant. (a) Superposition highlighting D1-D2 inter-domain
region of Nec1 and DIP-α. Nec1 WT has a salt bridge between E119 of D1 and K178 of D2. In
order to recreate this salt bridge in a Nec1-α chimera, we mutated Y172 of DIP-α. Additionally,
FoldX predictions indicated that mutating Nec1 Leu116 to a charged Glu would stabilize the
molecule. (b) Gel showing the resulting expression of the Nec1-α chimera mutants

134
9.3 SPR confirms Heterophilic binding of Nectin chimeras
Before introducing these chimeras in vivo, it was crucial to show that a Nec1 chimera
could bind to its complementary Nec3 chimera successfully in vitro. SPR experiments were
performed to assess the binding properties of the two different sets of nectin-chimera molecules.
It should be noted that due to the homophilic nature of both Nec1 and Nec3, we cannot
accurately calculate the KD of heterophilic interactions and thus can only qualitatively determine
binding by analyzing SPR response curves.
In the first set of experiments, DIP-α, Nec1-DIPα Y172K and Nec3-Dpr10D were
immobilized to a dextran chip through amine-coupling chemistry and the binding signal between
wildtype and chimera proteins was measured (Figure 43). Wildtype DIP-α, Dpr6 and Dpr10D
showed no binding to either Nec1-DIPα Y172K or Nec3-Dpr10D. A strong binding signal was
seen between Nec1-DIPα Y172K and Nec3-Dpr10D in both experimental orientations,
indicating that our chimeras were successful in binding to each other. Nec1-DIPα L116E Y172K
was not coupled to the chip, but showed a similar binding response to Nec3-Dpr10D when
flowed as an analyte, confirming that the Nec1-DIPα single and double mutants behave the
same. There was little difference in the binding signals of Nec3-Dpr10DL and Nec3-Dpr10D to
Nec1-DIPα, showing that the extra 34 n-terminal residues before D1 have little impact on
chimera binding, which is expected since we did not see an effect of these residues on native
Dpr10/DIP interactions.
Nec3-Dpr10A also bound to the Nec1-DIPα chimera, but unexpectedly bound to
wildtype DIP-α as well. This result should not affect our in vivo experiments because DIP-α
wildtype will not be present in animals, since the chimera will be knocked-in by CRISPR/Cas9.
Nec3-Dpr10A will also not be present because Nec3Dpr10D will be introduced as a transgene.

135
Additionally, RNA-seq analysis performed by the Zipursky lab did not find detectable amounts
of the Dpr10A mRNA in any of the lamina cells, indicating it may not even be expressed
(Correspondence).
The homophilic properties of Nec1 and Nec3 were maintained in the chimeras, with a
strong homophilic binding signal seen with Nec1-DIPα Y172K and a weaker, but measurable
signal for Nec3-Dpr10D. However, it is unclear whether the homophilic KDs of the these
interactions vary significantly from wildtype Nec1 or Nec3.
The reverse set of nectin chimeras were also tested in SPR experiments. DIP-α, Nec3-
DIPα and Nec1-Dpr10D were immobilized to a dextran chip by amine-coupled chemistry and
showed no binding to wildtype Dpr6, Dpr10D or DIP-α presented as analytes (Figure 44). A
strong binding signal was seen between Nec3-DIPα and Nec1-Dpr10D in both experimental
orientations. As was seen in the previous set of nectin chimeras, both nectin chimeras maintain
their respective homophilic properties as well.
9.4 Nectin-Chimera in vivo experiment
With the success of both chimera combinations in vitro, Nec1-DIPα Y172K and Nec3-
Dpr10 were chosen to be used for in vivo experiments since their homophilic properties more
closely align with wildtype DIP-α and Dpr10. The experimental design of the in vivo experiment
is as such: Nec1-DIPα Y172K is introduced into the animal through CRIPSR/Cas9 and after
assessing for the presence of the mutant phenotype, Nec3-Dpr10 is introduced as a transgene
where rescue is then assessed.
As of the preparation of this manuscript, knock-in animals of Nec1-DIPα Y172K have
been generated and preliminary results show that these animals display the Dm4 cell-death

136
phenotype seen in DIP-α null animals. However, the follow up rescue experiments with Nec3-
Dpr10 have not been completed yet.
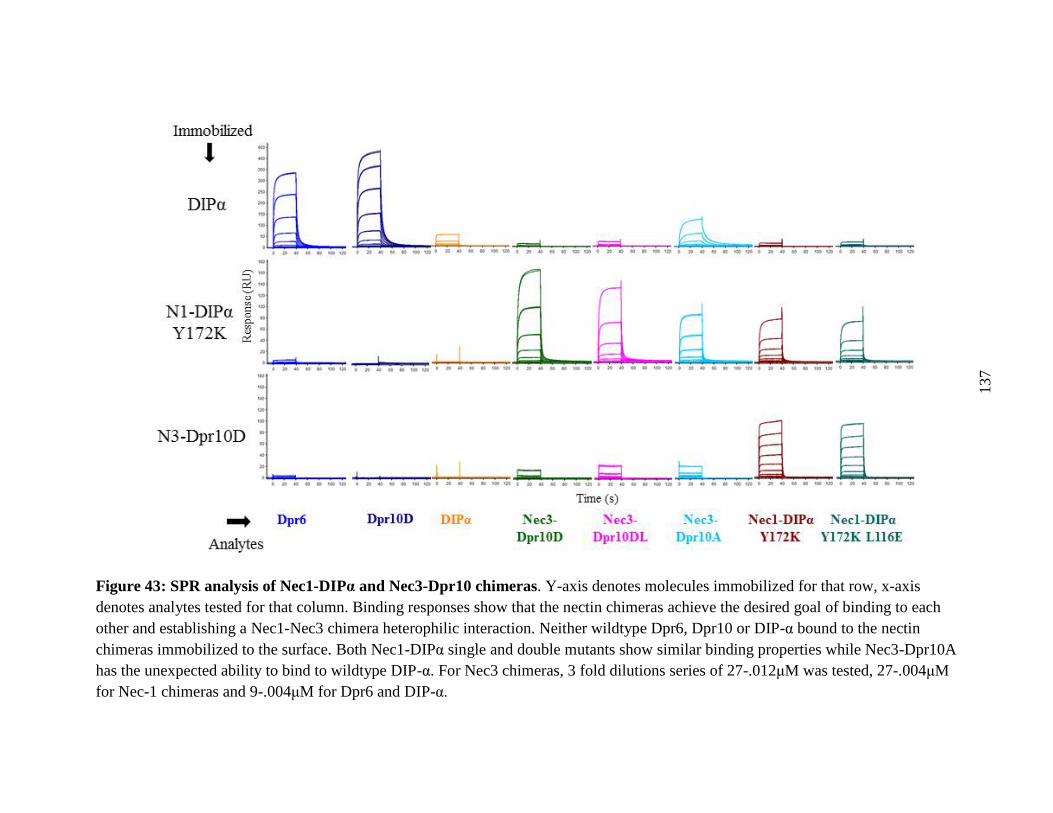
137
Figure 43: SPR analysis of Nec1-DIPα and Nec3-Dpr10 chimeras. Y-axis denotes molecules immobilized for that row, x-axis
denotes analytes tested for that column. Binding responses show that the nectin chimeras achieve the desired goal of binding to each
other and establishing a Nec1-Nec3 chimera heterophilic interaction. Neither wildtype Dpr6, Dpr10 or DIP-α bound to the nectin
chimeras immobilized to the surface. Both Nec1-DIPα single and double mutants show similar binding properties while Nec3-Dpr10A
has the unexpected ability to bind to wildtype DIP-α. For Nec3 chimeras, 3 fold dilutions series of 27-.012μM was tested, 27-.004μM
for Nec-1 chimeras and 9-.004μM for Dpr6 and DIP-α.
138
Figure 44: SPR analysis of Nec3-DIPα and Nec1-Dpr10D chimeras. Y-axis denotes molecules immobilized for that row, X-axis
denotes analytes tested for that column. Binding responses show that the alternate nectin chimeras achieve the desired goal of binding
to each other and establishing a Nec1-Nec3 chimera heterophilic interaction. Neither wildtype Dpr6, Dpr10D or DIP-α bind to the
nectin chimeras immobilized to the surface. For nectin chimeras, 3-fold dilutions series of 27-.012μM were tested, and 9-.004μM for
Dpr6 and DIP-α

139
Chapter 10:
Discussion

140
10.1 Updated and quantitative Dpr-DIP interactome
Previous work determined a set of Dpr-DIP interactions through the use of qualitatitive
high-throughput experiments (Ozkan, Carrillo et al. 2013, Carrillo, Ozkan et al. 2015). SPR
experiments had determined the heterophilic KD for only two of these interacting Dpr-DIP pairs,
Dpr6/DIP-α and Dpr11/DIP-γ (Carrillo, Ozkan et al. 2015). With over 30 determined Dpr-DIP
interactions, we set out to measure the KD of these heterophilic interactions in order to determine
the range of affinities they fall under and how this may relate to their biological role.
In an effort to characterize Dpr-DIP binding in more quantitative detail, we used SPR to
probe more than 180 possible Dpr-DIP interactions and discovered 11 novel interactions not
previously detected: two with DIP-β (Dpr10 and Dpr17), one with DIP-ε (Dpr18), two with DIP-
ζ (Dpr14 and Dpr18), five with DIP-ι (Dpr2-5 and Dpr7) and one with DIP-η (Dpr5).
Additionally, we were unable to detect affinities stronger than 300μM for 4 interactions
previously proposed. We did not detect significant binding affinities between DIP-ε and Dpr16
or Dpr17, DIP-ζ and Dpr16, or DIP-θ and Dpr3.
Discovering novel interactions while failing to see interactions detected in the initial
high-throughput screening experiment was not surprising. The ECIA used conditioned media
instead of purified protein, and tested interactions with molecules that were pentamerized
(Ozkan, Carrillo et al. 2013). Increasing the avidity of molecules through pentamerization can
lead to a higher false positive rate (Bushell, Sollner et al. 2008). Using conditioned media instead
of purified protein can exacerbate the problem since concentrations are only roughly known and
make calibrating the screening more difficult. Too much protein can lead to false positives, while
too little will lead to false negatives (Bushell, Sollner et al. 2008). The statistical analysis of the
results, which is optimized to reduce false positives, can also introduce uncertainty by removing

141
true positives. Many of the novel interactions attributed to Dpr14, Dpr18 and DIP-ι that we were
able to uncover have detectable signals in the previously published assays, but are not included
after statistical analysis (Ozkan, Carrillo et al. 2013, Carrillo, Ozkan et al. 2015).
Many of the differences we see between previously published work and our SPR
experiments are supported by structural evidence and sequence conservation. Comparisons of the
closely related Dpr6 and Dpr10 show only two differing interfacial residues: Ser106 and Ser125
in Dpr6 are an Ala and Thr in Dpr10. In the previous interactome, Dpr10 was shown to only bind
to DIP-α, while Dpr6 interacted with DIP-α, -β, -ε and -ζ. Our experiments show Dpr10 can also
bind to DIP-β, but we do not detect any binding with affinities stronger than 500μM to DIP-ε or
DIP-ζ. However, the affinities we measured between Dpr6 and DIP-ε or DIP-ζ are weak
interactions ranging from 151μM - 210μM, which provide greater context in the difference
between Dpr6 and Dpr10 interactions.
Unlike the previous interactome, our results show that DIP-ε and DIP-ζ share the same
set of Dpr binding partners. When comparing the likely interfacial residues of these two DIPs,
which are determined from analysis of our crystal structures as well as those previously
published (Carrillo, Ozkan et al. 2015), we see no differences in residue identity, which helps
provide a basis for our results. In a similar fashion, DIP-η, -θ and -ι also show highly similar
interfacial residue identity with only subtle differences, making the new interactions we see with
DIP-ι unsurprising. Dpr7, which we only see bind to DIP-ι weakly, is unable to form a conserved
salt bridge uncovered in the Dpr2/DIP-θ and Dpr4/DIP-η crystal structures, which may explain
why we see no binding to either DIP-η or DIP-θ.
The interaction between Dpr18 and DIP-ε and DIP-ζ is one of our more surprising
results. Dpr18 was believed to be the only “orphan” Dpr, incapable of binding to any DIP due to

142
differences in conserved interfacial residues (Carrillo, Ozkan et al. 2015, Zinn and Ozkan 2017).
While Dpr18 is unique in that it is the only Dpr with Met at two highly conserved interfacial
positions, which are a Ser and Glu in all but one other Dpr, it shares many of the same interfacial
residues as other DIP-ε and DIP-ζ binding Dprs. FoldX analysis predicts that the Met at this
position would not significantly alter the ΔG of DIP-ε or DIP-ζ complex formation.
However, one result from our analysis that is difficult to reconcile is that we do not see
binding of Dpr3 to DIP-θ, even though its interaction interfacial residues are identical to Dpr2,
which has a binding KD of 76.6μM with DIP-θ, and Dpr3 can bind to both DIP-η and DIP-ι.
Further analysis is needed in order to resolve the binding differences seen between Dpr2 and
Dpr3.
The updated specificity of Dpr/DIP interactions seen in our quantitative interactome
shows a strong correlation to the Dpr phylogenetic tree, with Dprs neatly segregating into
branches that can be identified based on their primary DIP binding properties. This type of
relationship where closely related members share adhesive specificity is not unique to Dprs/DIPs
and has been seen in a structurally unrelated family of cell-adhesion molecules, the type-2
cadherins (Type-II manuscript in preparation). Type-2 cadherins mediate calcium-dependent
adhesion and have been shown to play a role in synapse formation and organization in
vertebrates (Williams, Wilke et al. 2011, Duan, Krishnaswamy et al. 2014, Basu, Duan et al.
2017). While the domains and chemistry of interactions share little in common, type-2 cadherins,
like Dprs and DIPs, also engage in both heterophilic and homophilic interactions through their
membrane distal adhesive domain (Patel, Ciatto et al. 2006) (Type II manuscript in preparation).
Closely related proteins that share the same binding properties indicate that gene
duplication events may have occurred and introduced functional redundancy. Much of our

143
biophysical evidence supports this possibility. Dprs with matching binding specificity also share
similar affinity to their respective DIP molecule(s). Genetic evidence also shows functional
redundancy; cell death of Dm4 neurons, which express DIP-α, is observed in the Drosophila
medulla of animals null for both dpr6 and dpr10, but not null for only one (Zipursky lab
correspondence). However, different expression patterns have been observed for dpr6 and dpr10
in the Drosophila musculoskeletal system, with dpr10 being the sole Dpr expressed in leg
muscles (Mann lab correspondence). Additionally, DIP-α expressing motors neurons fail to reach
their target in dpr10 null animals but do not display this phenotype in dpr6 null animals. It is
likely that Dprs and DIPs play a variety of roles throughout the Drosophila nervous system,
where some of these roles are maintained by functionally redundant Dprs, while others by a
single Dpr.
We determined that Dpr/DIP interactions fall under a wide range of affinities and
classified them into three DIP groups according to their general affinity strength. The DIP-α/β/γ
group has the strongest affinities with most of the measured Dpr interactions having binding KDs
of ~1.5μM - 10μM. The affinities seen in the DIP-ε/ζ group were about 10-fold weaker with KDs
ranging from ~20μM - 100μM, and the final group, DIP-η/θ/ι was more widely dispersed and
had affinities that were generally weaker with KDs ranging from ~30μM - 200μM. These clear
differences in binding affinities hint at the possibility of distinct functional roles for these DIP
molecules, as well as a potential for competitive interplay in synaptic organizational roles. It
should be noted that the current understanding of Dpr and DIP function is still in the initial
stages, with most of the genetic phenotypes observed in Dpr6,10/DIP-α and Dpr11/DIP-γ
mutants (Carrillo, Ozkan et al. 2015, Tan, Zhang et al. 2015). These Dpr-DIP interactions are
some of the strongest measured within the entire Dpr-DIP family, and it could be that the low

144
affinity Dpr-DIP interactions have more subtle biological roles that are difficult to detect.
Phenotypes may also be difficult to detect due to functional redundancy of Dpr and DIP
members.
10.2 Novel heterophilic structures and interactome reveal specificity determinants
Previous structural studies had determined the crystal structure of Dpr6 and DIP-α
fragments engaging in a heterophilic complex and proposed that shape complementarity between
interfaces was the driving factor behind binding specificity (Carrillo, Ozkan et al. 2015). We
solved novel crystal structures of the full IG ectodomains of two other Dpr/DIP heterophilic
complexes and confirm that the heterophilic D1-D1 interaction seen in the previously published
structure is conserved among Dpr-DIP complexes with only small variations in the hydrogen
bond network of the interface. Our two new structures revealed a novel electrostatic interaction:
a salt bridge which is predicted to be conserved in Dpr/DIP-η-θ-ι and some Dpr/DIP-ε-ζ
complexes. This conserved interaction provided evidence that it is not only shape
complementarity that determines binding specificity among Dpr/DIP pairs, but electrostatic
interactions as well.
With our new heterophilic structures and an updated SPR determined interactome, we
were able to identify the specificity determinants of Dpr/DIP interactions. Grouping Dprs and
DIPs based on binding specificity and comparing the conserved interfacial residues between
groups revealed a set of positions that were likely to be key contributors to specificity. The high
conservation of these SR and SI residues only became apparent when incorporating results from
our SPR experiments, and could not have been identified using the previously published
interactome (Ozkan, Carrillo et al. 2013, Carrillo, Ozkan et al. 2015). Being able to distinguish

145
weak interactions, like those between Dpr6 and DIP-ε and DIP-ζ, was also important in correctly
grouping Dprs by binding specificity. Our newly solved structures helped identify the structural
importance for some of these positions, such as the conserved salt bridge seen in Dpr/DIP-η-θ-ι
complexes.
Structural analysis of these SR and SI positions reveal a central specificity region located
adjacent to the hydrophobic core of the interface, where the SI1-3 positions on CC' loop and C'
strand of the DIP protomer inserts between the CC' and FG loops of the Dpr protomer. The DIP
residue at the SI2 position intercalates between Dpr residues at the SR1 and SR2 positions while the
neighboring DIP residues at SI2 and SI3 positions directly appose the SR3 and SR4 positions on the
FG loop of the Dpr protomer. The close proximity and interplay of multiple SR and SI positions
likely make this region crucial in specificity determination.
Analysis of conservation and residue identity within this main specificity region as well
as secondary regions, hint that the relative importance of certain specificity positions identified
varies between the DIP binding groups. For example, the salt bridge formed between SR5 and SI4
residues is conserved in all Dpr/DIP-η-θ D1-D1 interactions, but is only conserved in half of
Dpr/DIP-ε-ζ complexes. Additionally, there is no conservation at this residue position among
Dprs that bind DIP-γ, indicating that the SR5 – SI4 interaction may not play a significant role as a
specificity determinant for DIP-γ. Offsetting this, all Dpr/DIP-γ complexes are predicted to have
a unique salt bridge between SR6-SI5 positions, where the SR6 position is a conserved Gly in all
but two Dprs that do not bind DIP-γ. This would indicate that the SR6-SI5 positions may play a
more significant role within DIP-γ interactions compared to other groups.
We confirmed the importance of a select few of these specificity residues through
targeted mutagenesis and were able to “swap” the specificity between Dpr4 and Dpr6 by
146
mutating only two or three residues in the interface. Three successive mutations at SR positions
in Dpr6 had additive effects in weakening the affinity to DIP-α while increasing the affinity to
DIP-η and DIP-θ. A similar result was seen in parallel experiments with Dpr4 mutants. Mutating
both SR1 and SR4 in Dpr4 was able to swap specificity, with this mutant now able to bind DIP-α
while only having weak associations with DIP-η and DIP-θ. The introduction of an additional
mutation at the SR5 position, which removed a native salt bridge in DIP-η and DIP-θ complexes,
but failed to reproduce the glycosylation seen in a Dpr6/DIP-α complex (Carrillo, Ozkan et al.
2015), further weakened binding to DIP-η and DIP-θ, but negatively impacted binding to DIP-α
as well. It is likely that the weaker affinity to DIP-α is due to the missing glycan, but more
experiments are necessary to accurately determine if this is the case.
While we were able to swap specificity between Dpr4 and Dpr6 with only a few
mutations, the resulting binding affinities did not always match wildtype interactions. Our
highest affinity Dpr6 mutant bound to DIP-η and DIP-θ with a 2-fold weaker affinity than that of
wildtype Dpr4, however it was within the affinity range of other Dpr/DIP-η-θ interactions. Our
strongest Dpr4 specificity mutant was still 35-fold weaker in binding to DIP-α than either Dpr6
or Dpr10. Additional mutations of other SR positions as well as the introduction of the previously
mentioned glycan would likely bring the value of the mutant KD closer to wildtype, and confirm
the other positions importance to specificity.
10.3 Novel Dpr and DIP Homophilic interactions
During our extensive biophysical analysis of the Dpr and DIP family, we identified the
oligomerization state for all but 4 Dprs and 3 DIP family members. AUC experiments
determined that 3 Dprs and 4 DIPs behaved as homodimers. These homophilic interactions had
147
not been previously detected, even though they were assayed in the high throughput experiments
that determined the published Dpr-DIP interactome (Ozkan, Carrillo et al. 2013). It is likely that
these homophilic interactions were missed due to mismatches between the oligomerization state
of bait and prey molecules in the ECIA as well as higher avidity prey-prey associations in the
mobile phase preventing binding to bait molecules (Wojtowicz, Wu et al. 2007, Bushell, Sollner
et al. 2008).
We were able to solve crystal structures of two DIP homodimers, DIP-α and DIP-θ, and
found that these DIPs engage in homophilic interactions along the same interface as their
heterophilic interactions with Dprs. Cell surface proteins using a shared interface for homophilic
and heterophilic interactions is not unique to DIPs and is seen in classical cadherins as well as
nectins and sidekicks (Katsamba, Carroll et al. 2009, Narita, Yamamoto et al. 2011, Goodman,
Yamagata et al. 2016). In the case of DIPs, the difference between the KD for homophilic and
heterophilic interactions varies depending on the molecule. DIP-α has a weaker homophilic
interaction compared to its heterophilic interactions, while DIP-η has the reverse interaction
properties. The DIP-ζ homodimer KD is equivalent to the KD of its strongest heterophilic
interactions. These results indicate that the interplay and any competition between heterophilic
and homophilic interactions will vary among the different DIPs and could pertain to the different
functional roles that DIP family members may have. One possibility for DIP-α, based on
mistargeting phenotypes that have been observed, is that weaker DIP homophilic interactions
could keep DIP-α expressing axons, such as those bundled in the ventral nerve chord, bound
together until the higher affinity Dpr expressing target is reached.
In order to help answer what role in vivo these homophilic interactions play, we designed
two mutations and showed through biophysical experiments that they selectively disrupted only
148
the homophilic interaction in DIP-α. These mutants are a valuable tool for analyzing the
homophilic contribution of DIP-α in an in vivo context. As of the preparation of this thesis,
knock-ins of these DIP-α mutations have been introduced into Drosophila, however analysis of
these animals is still ongoing.
From our studies, we determined that only a few Dprs form homodimers: Dpr8, Dpr12,
and Dpr21. Dpr12 is the sole Dpr that has been shown to interact with DIP-δ, and Dpr8 and
Dpr21 are 2 of the 3 Dprs that only bind DIP-β. These Dprs have homophilic KDs ranging from
45μM - 65μM. We were unable to produce the third member of the DIP-β subgroup, Dpr9, and
while its homophilic properties have not been experimentally determined, its close sequence
identity with Dpr8 and Dpr21 may indicate that it forms homodimers as well. The strength of
heterophilic interactions between Dpr12 and DIP-δ is unknown because we were unable to
produce soluble DIP-δ, but for Dpr8 and Dpr21 the homophilic interaction is 25 to 45-fold
weaker than their respective heterophilic interactions. With no known phenotype for any of the
Dprs that can form homodimers, it remains unclear what additional competition role these
homophilic Dpr interactions have, and if there is a significance that the members fall only within
two distinct DIP specificity groups.
Whether these Dpr homodimers use the same interface as seen in heterophilic interactions
has not been tested. In the final stages of preparation of this thesis, a crystal structure of Dpr8
was solved. This unrefined structure shows a twisted D1-D1 interaction that does not completely
overlap with the previously determined Dpr-DIP or DIP-DIP complex structures. Experiments to
determine whether the new interface seen in this crystal structure is the interface behind
homodimerization, or just a crystal artifact, are currently underway.

149
10.4 Crystal structure reveals potential cis interface
Examination of the four novel crystal structures determined in this dissertation reveals
only one shared interface among all four complexes, the D1-D1 interaction along the CC'C''FG
face. However, the Dpr4/DIP-η crystal reveals one intriguing additional heterophilic interaction
that could potentially form in cis between the membrane proximal domains of Dpr4 and DIP-η.
The central characteristic of this interaction is the inter-domain beta sheet formed between the
two parallel D strands of Dpr4 D2 and DIP-η D3. Within the crystal structure, a lattice forms
between molecules that engage in both the Dpr4/DIP-η D1-D1 interactions and the Dpr4/DIP-η
D2-D3 interactions. While the domain interactions are different, this result is analogous to what
has been seen in protocadherins, where crystal structures reveal a lattice of molecules whose four
membrane distal cadherin domains engage in trans interactions while their two membrane
proximal domains interact in cis (Goodman, Rubinstein et al. 2017). This lattice forms the basis
of the “zipper” model, where large assemblies of molecules can be formed between membranes
through trans and cis homodimer interactions which initiate a self-avoidance signal. Dprs/DIPs
do not have roles in self avoidance, but it is possible a zipper like assembly of Dpr and DIP
interactions, or just a clustering of molecules resulting from cis interactions, could play a role as
a signaling mechanism between synaptic partners.
Whether the cis interaction seen between Dpr4/DIP-η is relevant, or just a crystal contact,
has not yet been determined. A Dpr4 triple SR mutant, which only targets the D1-D1 interface
and would not affect the interactions in the membrane proximal domains, does not show a
measurable affinity below 600μM to DIP-η in SPR experiments. The ideal way to interrogate the
importance and existence of this interaction would be to design targeted mutations that could be

150
tested in vivo. Unfortunately, there are currently no known phenotypes associated with Dpr4 or
DIP-η.
10.5 Structure directed mutations and chimeras help investigate in vivo function
In order to provide tools that could be used to study Dpr-DIP function in vivo we
designed and experimentally validated mutations that either disrupted both DIP-α homophilic
and heterophilic Dpr6 and Dpr10 interactions (DIP-α I83D) or only DIP-α homodimerization
(DIP-α A78K and DIP-α N94D). We also designed and tested, Dpr10Y103D, a point mutant that
disrupts heterophilic interaction with DIP-α. Preliminary genetic experiments with CRIPR/Cas9
generated knock-ins of DIP-α I83D animals reveal a ~50% reduction in medulla Dm4 cells, a
similar result to null DIP-α animals (Zipursky Lab correspondence). A similar reduction is seen
in animals null for dpr6 that have dpr10 Y103D knocked in. Taken together these two results
provide the strongest evidence to date that a heterophilic D1-D1 interaction between DIP-α and
Dpr10 is necessary to insure wildtype Dm4 cell numbers. Further characterization of these
mutations is still necessary, as well as the characterization of DIP-α A78K N94D, a mutant
expressing a DIP-α protein that selectively disrupts the homophilic interaction of DIP-α.
In order to further highlight the role of the Dpr10/DIP-α heterophilic interaction, we
replaced the interacting D1 domains of DIP-α and Dpr10 molecules with the interacting domains
of human Nec1 and Nec3, and validated with SPR experiments that these new molecules engage
in a nectin D1-D1 heterophilic interaction. Preliminary genetic experiments have shown that
Nec1-DIPα animals have similar Dm4 cell loss as a DIP-α null, an unsurprising result since this
molecule is unable to interact with Dpr10. This mutant may also be able to reveal the importance
of the DIP-α homophilic interaction, since Nec1-DIPα forms homodimers with a similar KD

151
affinity as wildtype DIP-α. More analysis needs to be completed, but if there is not a significant
difference in Dm4 cell numbers between a DIP-α I83D animal which cannot engage in any DIP-
α heterophilic or homophilic interaction and a Nec1-α animal which can only engage in
homophilic interactions, than it is likely that the DIP-α homophilic interaction does not play a
role in Dm4 survival.
As of preparation of this thesis, experiments are underway to rescue a Nec1-DIPα animal
with a Nec3-Dpr10 transgene. Rescue of the mutant phenotype with this transgene would
provide the clearest evidence to date that the heterophilic D1-D1 interaction of Dpr10 and DIP-α
is needed to maintain Dm4 cell numbers and proper L3-Dm4 synaptic organization.
10.6 Dpr/DIP interactions in synaptic targeting
Our work has extensively characterized Dpr and DIP heterophilic interactions, providing
a foundation for future experiments designed to decipher their function. The importance of Dpr-
DIP affinity in synapse formation could be assessed by introducing mutants into animals that
weaken but do not abolish Dpr-DIP binding, such as Dpr6 H110K which has a ~25 fold weaker
affinity compared to wildtype. Assuming the expression level is similar to wildtype, we could
potentially see a less severe cell death phenotype. Or, we may find that this mutant is as severe as
a null, indicating that a strong affinity to DIP-α is necessary for maintaining Dm4 cell survival.
With our understanding of the interface, this experiment can be expanded upon with additional
mutants designed to exhibit a range of heterophilic affinities, allowing for greater
characterization of the relation of affinity to cell death and targeting. Understanding the role of
affinity in Dpr-DIP function may help explain why such a range of affinities exist in Dpr-DIP
interactions.

152
Differential expression of Dprs in lamina neurons, layer specific expression of DIPs in
the medulla and mistargeting of Dm12 neurons mutant for DIP-α all indicate that Dpr-DIP
interactions could be involved in layer specific synaptic targeting. This function can be further
interrogated by designing molecules that disrupt native Dpr-DIP specificity. For example, if we
introduce a chimera that replaces D1 of DIP-γ with that of DIP-α, we may see DIP-γ/α chimera
expressing Dm8 neurons mistarget to the M3 layer and synapse with L3 neurons expressing DIP
α cognate Dprs 6 and 10 (Figure 45). A complementary experiment replacing D1 of Dpr6 with
D1 of Dpr11 could share the same phenotype, strengthening the evidence that a Dpr-DIP
heterophilic interaction influences axon targeting.
Both DIP-α and DIP-γ have affinities stronger than 10μM with their cognate Dprs and
chimeras swapping D1 of these molecules change specificity without significantly altering
affinity. Our SPR experiments revealed that DIPs from two other subgroups engage in
interactions that have binding affinities ranging from 30-200μM, significantly weaker than those
seen in DIP-α and DIP-γ. Assuming that chimeras swapping the specificity of DIP-α and DIP-γ
introduces axon mistargeting, it would be interesting to observe what effect would occur when a
DIP-α chimera swapped with D1 of DIP-η or DIP-θ is introduced, which would change both
specificity and lower the affinity to a cognate Dpr from 15-100 fold. Would Dm4 medulla
neurons that target Dpr6/10 in the M3 layer instead mistarget to the M2 or M4 layer where DIP-θ
or DIP-η expressing medulla neurons form synapses? Since there are no known phenotypes for
DIP-η or DIP-θ and the heterophilic affinities are significantly weaker than those of DIP-α, it is
not entirely clear if DIPs that engage Dprs with weaker affinities have the same roles in
targeting. A mistargeted neuron expressing a chimera with the D1 of DIP-η or DIP-θ would
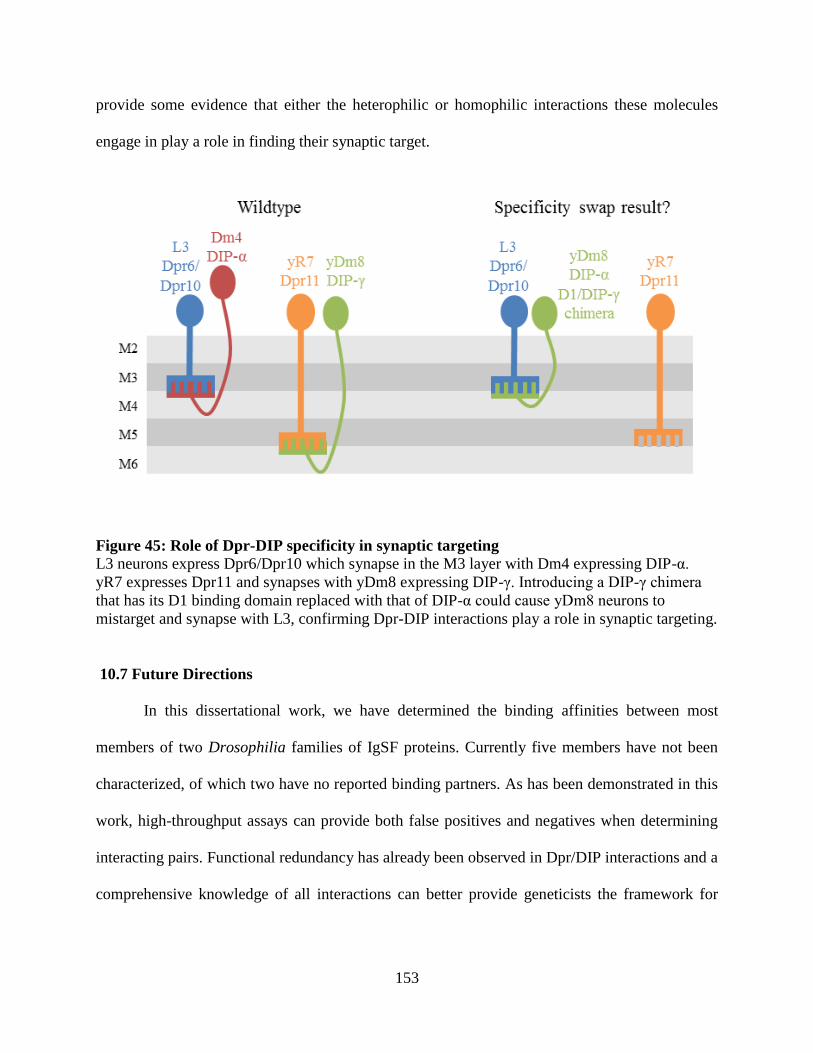
153
provide some evidence that either the heterophilic or homophilic interactions these molecules
engage in play a role in finding their synaptic target.
Figure 45: Role of Dpr-DIP specificity in synaptic targeting
L3 neurons express Dpr6/Dpr10 which synapse in the M3 layer with Dm4 expressing DIP-α.
yR7 expresses Dpr11 and synapses with yDm8 expressing DIP-γ. Introducing a DIP-γ chimera
that has its D1 binding domain replaced with that of DIP-α could cause yDm8 neurons to
mistarget and synapse with L3, confirming Dpr-DIP interactions play a role in synaptic targeting.
10.7 Future Directions
In this dissertational work, we have determined the binding affinities between most
members of two Drosophilia families of IgSF proteins. Currently five members have not been
characterized, of which two have no reported binding partners. As has been demonstrated in this
work, high-throughput assays can provide both false positives and negatives when determining
interacting pairs. Functional redundancy has already been observed in Dpr/DIP interactions and a
comprehensive knowledge of all interactions can better provide geneticists the framework for

154
analyzing Dpr/DIP function in vivo. Efforts are already underway to produce these molecules
and more accurately determine their interacting partners and binding affinities.
The original high-throughput experiments that determined the Dpr-DIP interactome also
uncovered a few Dpr-Dpr interactions. While our experiments have focused on calculating the
binding affinities between Dprs and DIPs, these Dpr-Dpr interactions should not be overlooked.
If their affinities are stronger than their corresponding Dpr-DIP interactions, they may even play
a more significant role in vivo. While more challenging than the experiment performed in this
doctoral work due to the larger Dpr family, a similar large scale SPR experiment aimed at
determining the KDs between all Dpr-Dpr interactions could be undertaken and may uncover
additional interactions between Dpr members not seen in previous high-throughput experiments.
Since Dprs have been observed to be expressed in both medulla and lamina neurons, (Zipursky
lab correspondence), Dpr-Dpr interactions may also play a role in synaptic specificity.
The discovery that many DIPs form homodimers, a result not seen in high throughput
experiments, introduces another set of interactions that may have been overlooked. Many DIP
family members that have been shown to homodimerize have interfacial regions that are nearly
identical within their subgroup. This could allow for heterophilic DIP-DIP interactions that
closely model the homophilic interaction. Determining whether these interactions occur and how
they could relate to function is another potential avenue to explore.
In addition to discovering that DIP molecules homodimerize, we also uncovered that a
few Dpr molecules can form homodimers as well. Preliminary evidence indicates that this
homodimerization occurs along a different interface, and validation of this result is currently
underway. With the identification of a novel homophilic interface that is distinct from the
heterophilic interface, it may be possible to develop mutations that selectively disrupt the Dpr

155
homophilic or heterophilic interaction. Targeted mutagenesis in conjunction with in vivo
experiments could help determine what role Dpr homophilic interactions have in nervous system
development.
Through the use of X-ray crystallography, we were able to determine the macromolecular
structure of the entire Dpr/DIP IG ectodomain complex. In addition to confirming that Dpr/DIP
D1-D1 interactions among different family members occur along a shared interface, it provided
tantalizing clues as to the possibility of a cis interaction. If this interaction were to be seen in
additional crystal structures, the likelihood of its presence in vivo increases. Additional
biophysical methods, such as Cryo-electron microscopy, may be better suited for visualizing and
identifying the presence of any lattice structure that could form along membranes. Ultimately, in
vivo genetic experiments targeting the interaction could reveal and provide a better framework as
to its role in function.
From results gained from our SPR experiments and our updated interactome, as well as
novel Dpr-DIP complex structures, we were able to identify specific residue positions and
interfacial regions that behave as specificity determinants for Dpr-DIP interactions. However, we
have experimentally validated the importance of only 3 of these positions in two subfamilies of
Dpr-DIP interactions. A more comprehensive and extensive set of experiments would be needed
in order to fully characterize and validate the importance of the other specificity positions and
how they relate to their Dpr-DIP specificity. This analysis could identify the framework of the
biophysical interactions that are able to encode specificity among a large and closely related
family of proteins
The determination of binding affinities across the Dpr and DIP families revealed a wide
range of KDs from under 2μM to over 200μM. Determining the role that affinity strength has in

156
vivo and how it relates to Dpr-DIP function is one of the exciting questions that we are now in a
position to answer. With the extensive knowledge we have gained of the interface and its
specificity determinants, we have already designed mutants that can weaken or strengthen the
heterophilic Dpr-DIP interaction as well as swap specificities between Dprs. Examining how
stronger or weaker interactions can affect cell morphology and synaptic connections in
Drosophila will help clarify Dprs and DIPs roles in synaptic organization and may help answer
the question as to why DIPs display distinct ranges of affinity strengths to their Dpr interactors.
Additionally, in vivo experiments with mutations that swap the specificity of a Dpr or DIP could
result in targeting defects, which would highlight the role that Dpr-DIP interactions play in
synaptic specificity.

157
REFERENCES
Adams, P. D., P. V. Afonine, G. Bunkoczi, V. B. Chen, I. W. Davis, N. Echols, J. J. Headd, L.
W. Hung, G. J. Kapral, R. W. Grosse-Kunstleve, A. J. McCoy, N. W. Moriarty, R. Oeffner, R. J.
Read, D. C. Richardson, J. S. Richardson, T. C. Terwilliger and P. H. Zwart (2010). "PHENIX: a
comprehensive Python-based system for macromolecular structure solution." Acta Crystallogr D
Biol Crystallogr 66(Pt 2): 213-221.
Afonine, P. V., R. W. Grosse-Kunstleve, N. Echols, J. J. Headd, N. W. Moriarty, M.
Mustyakimov, T. C. Terwilliger, A. Urzhumtsev, P. H. Zwart and P. D. Adams (2012). "Towards
automated crystallographic structure refinement with phenix.refine." Acta Crystallogr D Biol
Crystallogr 68(Pt 4): 352-367.
Basu, R., X. Duan, M. R. Taylor, E. A. Martin, S. Muralidhar, Y. Wang, L. Gangi-Wellman, S.
C. Das, M. Yamagata, P. J. West, J. R. Sanes and M. E. Williams (2017). "Heterophilic Type II
Cadherins Are Required for High-Magnitude Synaptic Potentiation in the Hippocampus."
Neuron 96(1): 160-176 e168.
Brasch, J., O. J. Harrison, G. Ahlsen, S. M. Carnally, R. M. Henderson, B. Honig and L. Shapiro
(2011). "Structure and binding mechanism of vascular endothelial cadherin: a divergent classical
cadherin." J Mol Biol 408(1): 57-73.
Brasch, J., O. J. Harrison, B. Honig and L. Shapiro (2012). "Thinking outside the cell: how
cadherins drive adhesion." Trends Cell Biol 22(6): 299-310.
Bushell, K. M., C. Sollner, B. Schuster-Boeckler, A. Bateman and G. J. Wright (2008). "Large-
scale screening for novel low-affinity extracellular protein interactions." Genome Res 18(4):
622-630.
Carrillo, R. A., E. Ozkan, K. P. Menon, S. Nagarkar-Jaiswal, P. T. Lee, M. Jeon, M. E.
Birnbaum, H. J. Bellen, K. C. Garcia and K. Zinn (2015). "Control of Synaptic Connectivity by a
Network of Drosophila IgSF Cell Surface Proteins." Cell 163(7): 1770-1782.
Cole, J. L., J. W. Lary, P. M. T and T. M. Laue (2008). "Analytical ultracentrifugation:
sedimentation velocity and sedimentation equilibrium." Methods Cell Biol 84: 143-179.
Cooper, M. A. (2009). Label-free biosensors : techniques and applications. Cambridge ; New
York, Cambridge University Press.
Dereeper, A., S. Audic, J. M. Claverie and G. Blanc (2010). "BLAST-EXPLORER helps you
building datasets for phylogenetic analysis." BMC Evol Biol 10: 8.
Dereeper, A., V. Guignon, G. Blanc, S. Audic, S. Buffet, F. Chevenet, J. F. Dufayard, S.
Guindon, V. Lefort, M. Lescot, J. M. Claverie and O. Gascuel (2008). "Phylogeny.fr: robust
phylogenetic analysis for the non-specialist." Nucleic Acids Res 36(Web Server issue): W465-
469.

158
Duan, X., A. Krishnaswamy, I. De la Huerta and J. R. Sanes (2014). "Type II cadherins guide
assembly of a direction-selective retinal circuit." Cell 158(4): 793-807.
Emsley, P., B. Lohkamp, W. G. Scott and K. Cowtan (2010). "Features and development of
Coot." Acta Crystallogr D Biol Crystallogr 66(Pt 4): 486-501.
Evans, P. R. and G. N. Murshudov (2013). "How good are my data and what is the resolution?"
Acta Crystallogr D Biol Crystallogr 69(Pt 7): 1204-1214.
Fischbach, K. F. and A. P. M. Dittrich (1989). "The Optic Lobe of Drosophila-Melanogaster .1.
A Golgi Analysis of Wild-Type Structure." Cell and Tissue Research 258(3): 441-475.
Goldman, T. D. and M. N. Arbeitman (2007). "Genomic and functional studies of Drosophila
sex hierarchy regulated gene expression in adult head and nervous system tissues." PLoS Genet
3(11): e216.
Goodman, K. M., R. Rubinstein, H. Dan, F. Bahna, S. Mannepalli, G. Ahlsen, C. Aye Thu, R. V.
Sampogna, T. Maniatis, B. Honig and L. Shapiro (2017). "Protocadherin cis-dimer architecture
and recognition unit diversity." Proc Natl Acad Sci U S A 114(46): E9829-E9837.
Goodman, K. M., M. Yamagata, X. Jin, S. Mannepalli, P. S. Katsamba, G. Ahlsen, A. P.
Sergeeva, B. Honig, J. R. Sanes and L. Shapiro (2016). "Molecular basis of sidekick-mediated
cell-cell adhesion and specificity." Elife 5.
Harrison, O. J., X. Jin, S. Hong, F. Bahna, G. Ahlsen, J. Brasch, Y. Wu, J. Vendome, K.
Felsovalyi, C. M. Hampton, R. B. Troyanovsky, A. Ben-Shaul, J. Frank, S. M. Troyanovsky, L.
Shapiro and B. Honig (2011). "The extracellular architecture of adherens junctions revealed by
crystal structures of type I cadherins." Structure 19(2): 244-256.
Harrison, O. J., J. Vendome, J. Brasch, X. Jin, S. Hong, P. S. Katsamba, G. Ahlsen, R. B.
Troyanovsky, S. M. Troyanovsky, B. Honig and L. Shapiro (2012). "Nectin ectodomain
structures reveal a canonical adhesive interface." Nat Struct Mol Biol 19(9): 906-915.
Hattori, D., S. S. Millard, W. M. Wojtowicz and S. L. Zipursky (2008). "Dscam-mediated cell
recognition regulates neural circuit formation." Annu Rev Cell Dev Biol 24: 597-620.
Jason-Moller, L., M. Murphy and J. Bruno (2006). "Overview of Biacore systems and their
applications." Curr Protoc Protein Sci Chapter 19: Unit 19 13.
Joosten, R. P., F. Long, G. N. Murshudov and A. Perrakis (2014). "The PDB_REDO server for
macromolecular structure model optimization." IUCrJ 1(Pt 4): 213-220.
Kabsch, W. (2010). "Xds." Acta Crystallogr D Biol Crystallogr 66(Pt 2): 125-132.
Katsamba, P., K. Carroll, G. Ahlsen, F. Bahna, J. Vendome, S. Posy, M. Rajebhosale, S. Price,
T. M. Jessell, A. Ben-Shaul, L. Shapiro and B. H. Honig (2009). "Linking molecular affinity and
cellular specificity in cadherin-mediated adhesion." Proc Natl Acad Sci U S A 106(28): 11594-
11599.

159
Krissinel, E. and K. Henrick (2007). "Inference of macromolecular assemblies from crystalline
state." J Mol Biol 372(3): 774-797.
Lebowitz, J., M. S. Lewis and P. Schuck (2002). "Modern analytical ultracentrifugation in
protein science: a tutorial review." Protein Sci 11(9): 2067-2079.
McCoy, A. J., R. W. Grosse-Kunstleve, P. D. Adams, M. D. Winn, L. C. Storoni and R. J. Read
(2007). "Phaser crystallographic software." J Appl Crystallogr 40(Pt 4): 658-674.
Morante, J. and C. Desplan (2004). "Building a projection map for photoreceptor neurons in the
Drosophila optic lobes." Semin Cell Dev Biol 15(1): 137-143.
Nakamura, M., D. Baldwin, S. Hannaford, J. Palka and C. Montell (2002). "Defective proboscis
extension response (DPR), a member of the Ig superfamily required for the gustatory response to
salt." J Neurosci 22(9): 3463-3472.
Narita, H., Y. Yamamoto, M. Suzuki, N. Miyazaki, A. Yoshida, K. Kawai, K. Iwasaki, A.
Nakagawa, Y. Takai and T. Sakisaka (2011). "Crystal Structure of the cis-Dimer of Nectin-1:
implications for the architecture of cell-cell junctions." J Biol Chem 286(14): 12659-12669.
Okabe, N., K. Shimizu, K. Ozaki-Kuroda, H. Nakanishi, K. Morimoto, M. Takeuchi, H.
Katsumaru, F. Murakami and Y. Takai (2004). "Contacts between the commissural axons and
the floor plate cells are mediated by nectins." Dev Biol 273(2): 244-256.
Ozkan, E., R. A. Carrillo, C. L. Eastman, R. Weiszmann, D. Waghray, K. G. Johnson, K. Zinn,
S. E. Celniker and K. C. Garcia (2013). "An extracellular interactome of immunoglobulin and
LRR proteins reveals receptor-ligand networks." Cell 154(1): 228-239.
Patel, S. D., C. Ciatto, C. P. Chen, F. Bahna, M. Rajebhosale, N. Arkus, I. Schieren, T. M.
Jessell, B. Honig, S. R. Price and L. Shapiro (2006). "Type II cadherin ectodomain structures:
implications for classical cadherin specificity." Cell 124(6): 1255-1268.
Pinto-Teixeira, F., N. Konstantinides and C. Desplan (2016). "Programmed cell death acts at
different stages of Drosophila neurodevelopment to shape the central nervous system." FEBS
Lett 590(15): 2435-2453.
Rich, R. L. and D. G. Myszka (2009). "Extracting affinity constants from biosensor binding
responses." Label-Free Biosensors: Techniques and Applications: 48-84.
Rubinstein, R., K. M. Goodman, T. Maniatis, L. Shapiro and B. Honig (2017). "Structural
origins of clustered protocadherin-mediated neuronal barcoding." Semin Cell Dev Biol 69: 140-
150.
Rubinstein, R., C. A. Thu, K. M. Goodman, H. N. Wolcott, F. Bahna, S. Mannepalli, G. Ahlsen,
M. Chevee, A. Halim, H. Clausen, T. Maniatis, L. Shapiro and B. Honig (2015). "Molecular
logic of neuronal self-recognition through protocadherin domain interactions." Cell 163(3): 629-
642.
160
Samanta, D. and S. C. Almo (2015). "Nectin family of cell-adhesion molecules: structural and
molecular aspects of function and specificity." Cell Mol Life Sci 72(4): 645-658.
Schymkowitz, J., J. Borg, F. Stricher, R. Nys, F. Rousseau and L. Serrano (2005). "The FoldX
web server: an online force field." Nucleic Acids Res 33(Web Server issue): W382-388.
Sperry, R. W. (1963). "Chemoaffinity in the Orderly Growth of Nerve Fiber Patterns and
Connections." Proc Natl Acad Sci U S A 50: 703-710.
Stenberg, E., B. Persson, H. Roos and C. Urbaniczky (1991). "Quantitative-Determination of
Surface Concentration of Protein with Surface-Plasmon Resonance Using Radiolabeled
Proteins." Journal of Colloid and Interface Science 143(2): 513-526.
Takemura, S. Y., A. Bharioke, Z. Lu, A. Nern, S. Vitaladevuni, P. K. Rivlin, W. T. Katz, D. J.
Olbris, S. M. Plaza, P. Winston, T. Zhao, J. A. Horne, R. D. Fetter, S. Takemura, K. Blazek, L.
A. Chang, O. Ogundeyi, M. A. Saunders, V. Shapiro, C. Sigmund, G. M. Rubin, L. K. Scheffer,
I. A. Meinertzhagen and D. B. Chklovskii (2013). "A visual motion detection circuit suggested
by Drosophila connectomics." Nature 500(7461): 175-181.
Takemura, S. Y., C. S. Xu, Z. Lu, P. K. Rivlin, T. Parag, D. J. Olbris, S. Plaza, T. Zhao, W. T.
Katz, L. Umayam, C. Weaver, H. F. Hess, J. A. Horne, J. Nunez-Iglesias, R. Aniceto, L. A.
Chang, S. Lauchie, A. Nasca, O. Ogundeyi, C. Sigmund, S. Takemura, J. Tran, C. Langille, K.
Le Lacheur, S. McLin, A. Shinomiya, D. B. Chklovskii, I. A. Meinertzhagen and L. K. Scheffer
(2015). "Synaptic circuits and their variations within different columns in the visual system of
Drosophila." Proc Natl Acad Sci U S A 112(44): 13711-13716.
Tan, L., K. X. Zhang, M. Y. Pecot, S. Nagarkar-Jaiswal, P. T. Lee, S. Y. Takemura, J. M.
McEwen, A. Nern, S. Xu, W. Tadros, Z. Chen, K. Zinn, H. J. Bellen, M. Morey and S. L.
Zipursky (2015). "Ig Superfamily Ligand and Receptor Pairs Expressed in Synaptic Partners in
Drosophila." Cell 163(7): 1756-1769.
Togashi, H., J. Miyoshi, T. Honda, T. Sakisaka, Y. Takai and M. Takeichi (2006). "Interneurite
affinity is regulated by heterophilic nectin interactions in concert with the cadherin machinery." J
Cell Biol 174(1): 141-151.
Williams, M. E., S. A. Wilke, A. Daggett, E. Davis, S. Otto, D. Ravi, B. Ripley, E. A. Bushong,
M. H. Ellisman, G. Klein and A. Ghosh (2011). "Cadherin-9 regulates synapse-specific
differentiation in the developing hippocampus." Neuron 71(4): 640-655.
Winn, M. D., C. C. Ballard, K. D. Cowtan, E. J. Dodson, P. Emsley, P. R. Evans, R. M. Keegan,
E. B. Krissinel, A. G. Leslie, A. McCoy, S. J. McNicholas, G. N. Murshudov, N. S. Pannu, E. A.
Potterton, H. R. Powell, R. J. Read, A. Vagin and K. S. Wilson (2011). "Overview of the CCP4
suite and current developments." Acta Crystallogr D Biol Crystallogr 67(Pt 4): 235-242.
Wojtowicz, W. M., W. Wu, I. Andre, B. Qian, D. Baker and S. L. Zipursky (2007). "A vast
repertoire of Dscam binding specificities arises from modular interactions of variable Ig
domains." Cell 130(6): 1134-1145.

161
Yamagata, M. and J. R. Sanes (2008). "Dscam and Sidekick proteins direct lamina-specific
synaptic connections in vertebrate retina." Nature 451(7177): 465-469.
Zinn, K. and E. Ozkan (2017). "Neural immunoglobulin superfamily interaction networks." Curr
Opin Neurobiol 45: 99-105.