files.domcxem.rufiles.domcxem.ru/infocenter... · web viewthe signal developed by a sensor is...
TRANSCRIPT

http://www.geocities.com/MotorCity/1309/emc_des.html
The information found here is rather out of date, and incomplete. In the end, we got the system working some what, to the stage where is was capable of running ignition on a 2 rotor engine (if somewhat unreliably), and with good serial communications to a PC. Anyway, I managed to get an HD for the project - so that made it worth while. My current plans in this area, are to gradually start again, using a 68332 processor, as used in the efi332 project.
As my final year design project, Brynne Tanton and myself are designing a microcontroller controlled ignition system, and potentially fuel injection system.
Below is an extract from my preliminary report, showing some of the work done (by me) so far. I have been working on the I/O board design, whilst Brynne is working on the microcontroller board design.
Engine Speed/Position One of the most common methods for detecting engine speed and angular position is to use a toothed or notched wheel attached to the crankshaft/camshaft, and sense the teeth using a variable reluctance sensor. Whilst numerous other sensor exist, the variable reluctance sensor is popular due to it’s robustness, and noise immunity.
In order to interface the sensor output to the microcontroller some basic detection circuitry is require. Whilst circuitry could be easily design to do this using standard op-amps, National Semiconductor produce an IC designed especially for the purpose - the LM1815. As well as reducing the detection circuit complexity, this IC offers some features difficult to achieve in a normal op-amp based detection design. The LM1815 costs around $5US in small quantities, however it was not able to be sourced in Australia in small quantities. However, National Semiconductors were offering free samples via their web page, and I was able to obtain two LM1815’s at no cost.
A LM1815 based input circuit based on that in the datasheet has been built and tested - giving very good results.
Manifold Absolute Pressure In a normal distributor timed ignition sensor, a vacuum diaphragm sensing the inlet manifold pressure provides the engine load based ignition timing advance mechanism. In a microcontroller controlled ignition system, this system can be replaced by an semiconductor pressure transducer, sensing the absolute pressure in the inlet manifold.
The Motorola MPX4250 pressure transducer is designed especially for use as a Manifold Absolute Pressure transducer. Benefits of this device are it’s high level analog output, in built temperature compensation, and the fact that is designed for an automotive environment. No further signal processing is required between the sensor and the analog to digital converter. I have located a source in the US, from who the device will cost US$40 + freight. This price compares very favourably with the Farnell price for similar (but less suitable) pressure transducers.
Detonation ("Knock") Detection By increasing the ignition advance for any particular load point of a spark ignition engine, the torque and efficiency can be improved. However, this is limited by the engine’s tendance to detonate or ‘knock’ under the advanced conditions. If knock sensing is not implemented, there needs to be a safety margin in the advance map, and hence resulting in less than optimal performance/efficiency.
Стр. 1

Engine knock can be detected by placing a piezo-electric transducer on the engine block. The signature of knock occurring is a train of damped vibrations in the 4-10kHz region - which can be picked up on the engine block. The frequency band sensed is characteristic of the engine.
Of the methods used for detecting the knock signal, the most flexible, and reliable appears to be as follows -
The microcontroller computes a gate interval from crankshaft position, and samples the knock sensor during this period. The background output of the sensor is also monitored when the gate is closed. The knock output amplitude is compared to a threshold which is adapted by the average background signal. Whenever the knock signal exceeds the threshold, the ignition timing is rapidly retarded. When the knock signal is below the threshold again, ignition timing is slowly advanced.
In hope to implement this along the lines of the block diagram below -
The sample/hold is used to allow the microcontroller to sample the knock signals as desired (non time critical) rather than having to do so at the end of the gate period.
Currently we are looking for a source of the following components
LM1949 - Injector drive controller
If you are interested in this area, you may like to look at the Do-It-Yourself Electronic Fuel Injection web page.
Last Updated May 20th, 1997
1ABSTRACTAn efficient method of detecting engine knock using spectral analysis is presented. Multiple single-pointDFTs are used to condition the measured knock signal. Using multiple frequencies in the detectionalgorithm provides a better signature of the combustion process and enhances the ability to detect low-levelknock across the entire operating range of the engine. The detection strategy compares the DFT outputsto a variable reference to determine a knock intensity metric. Unlike currently used techniques, thealgorithm adapts the reference (no-knock condition) to varying engine speeds and loads. An overview ofthe knock detection problem and current technology is presented. Implementation examples are includedto aid in developing system-specific hardware and software. Two systems are presented. The first is basedon the TMS320C30 floating-point DSP with software written in C. This system could be used for enginestudy and algorithm development. The second, which is more production oriented, is based on aTMS320C25 fixed-point DSP with software written in assembly language.INTRODUCTIONWhat Is Engine Knock?Modern engine control systems are designed to minimize exhaust emissions while maximizing power andfuel economy. The ability to maximize power and fuel economy by optimizing spark timing for a givenair/fuel ratio is limited by engine knock. Detecting knock and controlling ignition timing to allow an engineto run at the knock threshold provides the best power and fuel economy. Normal combustion occurs when
Стр. 2

a gaseous mixture of air and fuel is ignited by the spark plug and burns smoothly from the point of ignitionto the cylinder walls. Engine knock, or detonation, occurs when the temperature or pressure in the unburnedair/fuel mixture (end gases) exceeds a critical level, causing autoignition of the end gases. This producesa shock wave that generates a rapid increase in cylinder pressure. The impulse caused by the shock waveexcites a resonance in the cylinder at a characteristic frequency that is dependent primarily on cylinder borediameter and combustion chamber temperature. Damage to pistons, rings, and exhaust valves can resultif sustained heavy knock occurs. Additionally, most automotive customers find the sound of heavy engineknock objectionable.Knock SensorsImplementing a knock detection/control strategy requires sensors to monitor the combustion process andprovide feedback to the engine controller. Knock sensors can be classified in two broad categories: directand remote measurements.Direct MeasurementsPressure sensors measure the pressure inside the combustion chamber of a running engine. This directmeasurement of the combustion process provides the best signal to analyze to detect engine knock.However, each cylinder requires its own sensor, and individual sensor costs are still relatively high. As aresult, pressure sensors are used primarily in research settings. Currently, Toyota is the only manufacturerthat installs pressure sensors in production engines. Pressure sensor usage will increase in the future assensor costs are reduced and automotive companies develop more sophisticated engine control strategiesthat monitor the combustion process.Remote MeasurementsRemote measurement sensors use vibrations transmitted through the structure of the engine to detect knockin the combustion chamber. The signal received by remote sensors can be contaminated by sources other2than engine knock, which increases the difficulty of signal detection. This is especially true at higher enginespeeds in which background mechanical vibrations are much higher, effectively reducing thesignal-to-noise ratio. One advantage of using remote sensors is that, with careful placement, only one ortwo sensors are required to monitor all cylinders. In addition, the sensors are less expensive, primarily dueto a less harsh operating environment.Two types of remote sensor are being used today: tuned and broadband. Tuned or resonant sensors are usedin many low-end knock detection systems. Either mechanically or electronically, the sensor amplifies themagnitude of the signal in the frequency range of the knock-excited resonance (sometimes called thefundamental frequency). A limitation to this approach is that a different sensor can be required for eachengine type, due to variations in the characteristic frequency. The resulting part number proliferationincreases overall system costs for the manufacturer. To eliminate the cost penalty, sensor bandwidth canbe made wide enough to encompass all expected variations in the fundamental frequency. However, doingso can possibly decrease system performance.Broadband sensors have no resonant peaks below the 20-kHz operating range of the knock-detectionsystem. One sensor works equally well for any engine configuration. Some type of postprocessing isrequired to identify the characteristic frequency, placing an additional burden on the signal conditioningpart of the system. Since variations in the fundamental frequency can be expected for different engineconfigurations, a programmable solution provides the flexibility to easily modify the frequency rangebeing monitored with minimal impact on system cost.Knock Detection OverviewSpectral SignatureWhen engine knock occurs, a shock wave is generated inside the combustion chamber. The shock waveexcites a characteristic frequency in the engine, which is typically in the 5 kHz–7 kHz range. Cylinder borediameter and combustion chamber temperature are the main variables that affect this fundamentalfrequency. Variations in the fundamental frequency for a given engine configuration can be as much as± 400 Hz. Larger diameters and/or lower temperatures result in a lower fundamental frequency.Signals received by a remote sensor contain additional vibrational modes, which are structural resonancesin the engine excited by the shock wave as it hits the cylinder wall. Typically, two to four additionalfrequency peaks are evident between the fundamental frequency and 20 kHz. Each engine structure canhave different higher vibrational modes. Sensor mounting location can affect which modes are detectableand the amplitude of each with respect to the background mechanical noise.Adaptation RequirementsAn engine-knock detection algorithm must be able to adapt to a number of variables to enable the controllerto generate optimum spark timing so that the engine can run at the knock threshold. As mentionedpreviously, the structural design of an engine and the mounting location of the knock sensor(s) affect whichfrequency modes are detectable by the sensor. Usually, the transfer function between the cylinder and the
Стр. 3

sensor is different for each cylinder. This causes both the relative and absolute magnitudes of the vibrationalmodes to be different for each cylinder. A good detection scheme should allow different calibrations foreach cylinder.Another variable that must be accounted for is changes in nonknocking (reference) signal amplitude dueto the mechanical vibration of the engine at different RPMs. As the engine speed increases, the backgroundvibration level increases. When a fixed reference is used, a compromise in performance must be made3because signal magnitudes that would indicate knock at lower engine RPMs are equal to or less than thebackground level at higher engine RPMs. The reference must be set low enough that knock can be detectedat lower RPMs, which limits the algorithm’s ability to function at higher speeds. For this reason, someknock detection systems are shut off above 4000 RPM, and very conservative spark timings are used toguarantee that knock will not occur. A good detection strategy should adapt to varying levels of backgroundvibration levels to allow trace knock to be detected at all engine speeds.Finally, an engine’s operating characteristics change with time. As an engine wears, tolerances betweencomponents change, which could change the magnitudes of the vibrational modes detected by a remotesensor. Normal background vibrational levels could be higher for a given engine speed. The signal-to-noiseratio could decrease at higher engine speeds. A good detection strategy should adjust to changes in dailyoperating characteristics to allow reliable identification of trace knock without false triggers.Signal ConditioningKnock detection systems must perform some type of signal conditioning prior to executing the detectionstrategy. Information about the signal strength in the frequency range(s) excited by knock must be extractedfrom the measurement. If a tuned sensor with a very narrow resonant peak about the fundamental frequencyis being used, no further signal conditioning is required. In all other situations, either a filtering technique(analog or digital) or a spectral estimation technique must be used.Analog filtering is the predominant method used today, due to its low cost, ease of implementation, andlack of computational power of the engine controller CPU. The output of a simple analog filter tuned tothe fundamental knock frequency is integrated and sent to the engine control unit (ECU) to execute thedetection strategy. However, now that higher precision and/or multiple frequency ranges are desired, ananalog implementation is becoming cost prohibitive.Digital filters are starting to become practical as the computational performance of the ECU increases.Programmability allows the same hardware to be shared across a number of engine configurations.Reduction in part numbers can provide big cost savings to manufacturers in all steps in a product’s lifecycle. Enhancing filter performance or adding additional frequency ranges can be readily accomplishedas long as the computational limits of the CPU are not exceeded.Another digital signal conditioning technique is spectral analysis; for example, Fast Fourier Transform(FFT). An FFT provides a higher level of frequency resolving power than a digital filter. In addition,multiple frequency ranges are available as the basic output of the FFT. Limited computational throughputof the ECU and unfamiliarity with the technique have limited its use to research and development. Nocurrent production system uses spectral analysis techniques. The advent of cost-effective digital signalprocessors like TI’s TMS320 fixed-point family is making the computational power available to bringspectral analysis techniques to prominence.Detection StrategiesKnock detection strategies use the output of a signal conditioning stage to compare with a reference todetermine the presence or absence of knock. Most systems today use windowing to isolate periods duringthe cylinder’s firing cycle for analysis when knock is possible. There is a window from approximately 10°to 70° after top dead center (ATDC) of the piston’s cycle when detonation is most likely to occur for thefiring cylinder. The detection algorithm is run only during this window for that cylinder. By eliminatingpossible false trigger sources, such as valve closing, the detection algorithm is more robust. The time thiswindow is active varies with engine speed from 20 ms at 500 RPM down to 1.25 ms at 8000 RPM. Trackingchanging engine speed to calculate this time variation requires hardware or software overhead forimplementation.An indication of signal strength during the active window period is typically used by the detectionalgorithm. Integrating the output of a filter is a common method. The magnitude of the signal strength iscompared with a reference level, which, in nonadaptive systems, must be predetermined during systemdevelopment. If the reference level cannot adapt to changes in engine RPM, a compromise must be made.The reference level must be low enough to prevent sustained knock at low speed, yet high enough to preventfalse triggers at higher engine speed. Today, at engine speeds above approximately 4000 RPM, acombination of very conservative spark timing maps and shutting off the control strategy is used toguarantee knock-free operation. This results in less than optimal performance and fuel efficiency at higherengine speeds, particularly for systems using only fundamental frequency detection. Even at lower engine
Стр. 4

speeds, some compromise is required to guarantee that knock is likely occur only during transientoperation.The tradeoffs between using only the fundamental frequency or the combination of fundamental andvibration mode frequencies concern the issues of false triggers vs. complexity, available CPU time, andcost. When multiple frequencies are used, a better signature is available to determine if knock is present.This effectively increases the signal-to-noise ratio of the system. As a result, either the RPM range forreliable detection can be extended or the baseline spark timing at lower engine speeds can be advanced toallow the engine to continuously run closer to the knock threshold.Control StrategiesKnock control strategies today adjust spark timing to let an engine run at the knock threshold. Look-uptables are used to obtain a baseline setting for a given speed, load, and temperature. Based on the level ofknock detected, timing can be advanced (no knock) or retarded (knock). The rate of advance or retardationcan also be modified based on knock magnitude and/or offset from the baseline spark timing setting.The strategies fall into two categories. The simplest strategy, global control, retards the spark timing of allcylinders by the same amount when any knock is detected. This approach has the advantage that only oneknock value has to be tracked and only one timing control loop needs to be executed. The computationalburden on the CPU is minimized, as are the memory requirements for both data and program. However,engine performance can be compromised if only one or two cylinders are more likely to knock at a givenoperating condition. Since all cylinders’ spark timing is retarded equally, the cylinders not at their knockthreshold are not providing optimal power and/or fuel efficiency.A more sophisticated strategy is to control each cylinder individually so that all cylinders are running atthe knock threshold and provide the best power and fuel efficiency. To implement this type of controlstrategy, knock computations and control updates must be performed individually for each cylinder. Thecomputational burden and memory requirements are higher than with the global control strategy.Both control strategies are used today. As automotive manufacturers attempt to improve the emissions,power, and fuel efficiency of their engines to meet the competition or government regulations, theindividual cylinder control strategy will become predominant. Advanced engine control strategies arebeing developed that use torque and/or combustion feedback to optimize the operation of each cylinderindependently for best spark timing, fuel delivery, and possibly valve timing. When these strategies areimplemented, global control will no longer be a viable alternative.
Стр. 5

http://www.autospeed.com/cms/A_0348/printArticle.html
DIY Detonation Detection - Part 1So what's detonation and how can it be detected?
By Julian Edgar
Sensing when an engine is detonating has become more and more important in recent years. In older cars, the reduction in the lead content of fuel has meant that detonation is more likely to occur - especially when the comp ratio is wound up to give good performance. In factory turbo engines, dramatically increased boost means that detonation is very probable, while in any engine, poor mapping of the ignition advance can easily lead to detonation. But while sensing when detonation is occurring initially looks to be pretty straightforward, it becomes much more complex when the subject is examined in any depth.
What It Is
Engine detonation occurs when the air/fuel mix ignites within the combustion chamber in an uncontrolled manner, instead of by the progressive action of a moving flame front. The terms 'ping' (a light, barely observable detonation) and 'pre-detonation' (detonation caused by the ignition of the charge slightly before the full ignition of the flame front by the spark plug) are also commonly used. 'Knock' is another synonym.
One definition of knock is "an undesirable mode of combustion that originates spontaneously and sporadically in the engine, producing sharp pressure pulses associated with a vibratory movement of the charge and the characteristic sound from which the phenomenon derives its name". If detonation is allowed to go on for more than few seconds, the very sudden pressure changes within the cylinder can damage the engine. In a worse case scenario, pistons, rings and even the head itself can suffer major damage. Obviously, heavy detonation is something to be avoided! Note also that the higher the specific power output of the engine (ie hp per litre), the greater the likelihood of damage if detonation occurs.
In everyday driving, detonation is most likely to be heard when the driver is using a gear too high for the engine speed and load conditions - like climbing a steep hill with the right foot flat to the floor, while in third gear and travelling at 40 km/h. Depending on the engine, detonation can sound like a 'ting, ting' noise, or even a little like coins rattling in a coin tray. However, in some engines, the audible note is much deeper when heard from the cabin. In turbo/blown cars, or cars where the compression ratio has been substantially increased, detonation can occur at high engine speed and high loads, making it very difficult for the driver to hear it over the general noise level that's present at the time.
Electronic Detonation Sensing
Engine detonation can be electronically sensed by any of the following means:
pressure sensor installed flush with the combustion chamber pressure sensor connected to the spark plug temperature measurement at the cylinder wall acceleration sensor, frequency tuned acceleration sensor, not frequency tuned force measurement at the cylinder head bolt by the use a special washer deformation measurement at the head of the cylinder head bolt spark plug with a ring made of piezo ceramics ionic current measuring method
Стр. 6

Of these approaches the most commonly used are acceleration sensors, which make use of piezo ceramics. The sensor is mounted directly on the block, and so listens for sounds transmitted through the structure of the engine. Unfortunately, numerous frequencies in addition to typical detonation frequencies are contained within this noise! However, the use of piezo ceramic sensors has proven to be the most practical method of detecting detonation.
Differentiating the sound of engine detonation from the noise of valves opening and closing, pistons rising and falling, cam chains clanking and general under-bonnet noises has proved to be the hardest part of detecting when detonation is occurring. One way to reduce this problem of sorting the wheat from the chaff is to decrease the time for which the sensor is actually listening. The major noise of detonation for a specific cylinder occurs from shortly after the piston reaches Top Dead Centre on its power stroke to between 60 - 90 crankshaft degrees later. If the detonation signal is allowed pass through to the detection circuit and be averaged only when each piston is in this position, the accuracy of detonation detection improves. Crankshaft position sensing then obviously becomes an important part of this approach.
The signal developed by a sensor is processed so those signals that (hopefully!) aren't detonation are filtered out. This is achieved by the use of an approximately 10KHz wide bandpass filter. Beyond the bandpass filter the signal is commonly split into two paths - one branch going on to become an averaged reference signal, with the other signal compared with the reference only during the periods when each piston is in the right position for accurate detonation sensing. A 'detonation detected' outcome leads to a retard in ignition timing in most factory engine management systems.
Aftermarket Detonation Sensing
As you will have by now realised, electronically sensing when detonation is occurring is not at all simple. A number of aftermarket approaches are taken to this problem. Most typical is a general-purpose detonation sensor that is mechanically attached to the block, with its signal output being monitored by a dedicated meter. The meter can display either by means of a bargraph LED display or an analogue needle the severity of detected detonation.
One example of this type of approach can be seen in the Safeguard, an interceptor-type module that uses an added knock sensor to detect detonation. Not only is the severity of detonation shown on a row of LEDs, but the appropriate retarding of the ignition timing can also be programmed to occur. Two knock sensors are available to work with the system, with the sensor being selected on the basis of cylinder bore diameter.
I was present when Turbo Tune (Adelaide, Australia) dyno-tested a Safeguard unit on a VL Holden Commodore Turbo. The car was running high boost and advanced timing - enough to make it detonate when the non-intercooled air hit the combustion chambers. In order that the dyno operator (sitting in the car under test) could ascertain when detonation really was occurring, he was wearing a set of headphones connected to an amplifier box. The amplifier was fed by a microphone, which in turn was physically connected to the engine block.
Стр. 7

Detonation Frequency
The reverberation resonance generated by detonation generally lies in the range between 2 and 12KHz. The following equation can be used to estimate the detonation resonant frequency for a specific engine.
Detonation resonant frequency =900
3.14 x cylinder radius
Where the resonant frequency is measured in Hertz and the cylinder radius in metres.
Now the interesting point is that the dyno operator - listening directly to the engine - could detect when detonation was occurring well before the piezo knock sensor and dedicated electronic module could hear it! (Overall the Safeguard didn't work terribly well, the salesman - probably quite correctly - suggesting that the particular knock sensor being used wasn't a good match for the engine.)
Another aftermarket approach is to use the factory knock sensor and its dedicated signal conditioning board - the GM-Delco system is one example that lends itself to this. With this approach, the knock sensor board is modified with a transistor and a LED to indicate when knock is being detected by its matched sensor. While ingenious, this approach falls down when the knock sensor is used on engines other than that which it was designed to match. In fact, one person stated to me of this system "It certainly works - the LED was flashing when I could hear detonation...." which makes you wonder why the electronic knock sensor was needed in the first place!
In Australia, Jaycar Electronics have sold a knock detector kit developed by Silicon Chip magazine. This uses the input of a fabricated or factory knock detector, with the electronic inputs including an ignition input signal so that listening only occurs in the right piston positions. As a contributor to that magazine, I was involved in specifying the design of this system, and also tested it in action on turbo cars. And so I'm in a good position to state that the detector is not very good at picking high-rpm knock! As with so many knock detection systems, the problem is that the sensor will detect general engine noise - rather than detonation - if engine rpm is high.
Conclusion
The detection of detonation on a variety of engines - especially during tuning or testing - is most easily and accurately carried out using audio detection. If you can hear the sound, detonation is occurring. While appearing simplistic, audio monitoring beats all other systems when the knock detection method needs to be able to be applied to a variety of engines.
Стр. 8

DIY Detonation Detection - Part 2DIY knock detection: fifteen dollars and fifteen minutes - cheap, easy and very effective!
By Julian Edgar
Last week we went through some of the difficulties in sensing detonation - the fact that the detonation frequency of sound varies depending on engine bore diameter and construction, and the difficulty of using a purely electronic system compared with a good audio detection system being monitored by a skilled operator.
The problem in detecting detonation by simply listening for it is that it's hard to hear the noise clearly from inside the car. The sound deadening that comes from thick firewalls - and wind noise that results if the windows are lowered - mean that it's often hard to even hear the engine, let alone any specific odd noises being emitted from it.
So why not use an electronic stethoscope? This commercially available tool consists of an amplifier, a pair of headphones and a microphone input. In fact - as mentioned last issue - I've seen one such instrument in action, being used on a car being put through its paces on a chassis dynamometer. The instrument had then proved spectacularly successful at detecting detonation, the 'tink, tink' being audible to the headphone-equipped operator long before bystanders or a specific electronic detector could hear its occurrence.
So why not make an electronic stethoscope? Let's do a bit of electronic store catalogue pricing - mmmm, here's an amplifier module (A$7), here's a box (A$4), here's a microphone insert (A$3), here's a 9 volt battery clip (30 cents), here's a cheap pair of headphones (A$6), and here's a headphone jack (A$2). Add an on/off switch, volume control and some hook-up wire and it shouldn't cost too much - maybe A$25 and a few hours' work.
But hold on - here's one that's almost completely finished for just A$10.50!
The Dick Smith Electronics Whisper 2000 Personal Sound Amplifier (cat no Y-2000) consists of a microphone, amplifier, neat box, 9 volt battery clip and mono headphones. It's meant to be worn by the hard of hearing - basically, it's a hearing aid disguised as a 'Walkman' style radio. But would it be suitable for use as an electronic stethoscope? As you can see, the answer to that is 'yes'.
Стр. 9

Building the StethoscopeI am sure that you've read this before: "Building this project shouldn't take longer than 10 or 15 minutes." But in this case, it's the truth! The first step is to buy the Whisper 2000, four metres of single core microphone cable (cat no W-2030) and a 20-amp battery clip (cat no P-6418). The total bill is A$14.70. Carefully pry the front grille off and revealed should be the microphone.Separate the two halves of the Whisper 2000 box by unscrewing from the back the three self-tapping screws that hold it together.The microphone is further held into place with some hot-melt glue - carefully remove it from its recess. Taking note of the polarity of the microphone connections, unsolder the two wires connecting to it. Remove one of the push-on plastic sleeves from the battery clip and slide it onto the new microphone cable. Solder the braid of the cable to the microphone terminal formerly connected to the black wire and then solder the cable's single conductor to the other microphone terminal. Slip a piece of small diameter rubber hose over the cable at the amplifier end, and then unsolder the original microphone wires and replace them with the wires from the new cable, maintaining the same polarity (ie braid to black wire terminal, core to red wire terminal). Temporarily insert a 9-volt battery and check that the Whisper 2000 unit works as it should with the long microphone cable in place. File two adjoining crescent-shaped cut-outs in the two halves of the box so that a round hole is created when the box is re-assembled. Position the piece of rubber hose that you slipped on the cable so that it will be clamped into place by the two halves of the box (or instead you could wrap the microphone cable in electrical tape) and then reassemble the box. Using hot melt or another type of adhesive, glue the microphone into place face-down inside one arm of the clip. Slide the plastic sleeve back over the microphone and arm of the clip, hiding the microphone from view.Then sit back and admire the device that all this hard work has resulted in!Using ItUsing the electronic stethoscope is very simple. You simply clip to the microphone to whatever you are interested in listening to. Noises are transmitted through the metalwork directly to the clip and microphone, making the stethoscope extremely sensitive. To detect detonation, the clip is best placed directly on the block, in the type of place that the factory knock sensors are positioned - no surprise there! Adjust the volume control to give a comfortable loudness level, and sit back and listen. Over the clatter of pistons, valve gear, explosions and gearbox whines, detonation sounds like a sharp "splat!, splat!". Testing was carried out on an RB20DET-powered C210 Skyline running 15 psi boost and water/air intercooling. Even in cool ambient temps, holding full boost in third gear resulted in some low-level detonation, knocking that was simply impossible to hear from inside the car without the electronic helper. Depending on the location of the microphone clip, gearbox noises, injector clicking, suspension clunks, turbo whistling - the whole lot could be individually identified. Note that it's best to listen from the passenger seat while someone else drives the car - that way, the driver can still hear emergency vehicles and concentrate on driving, not listening to strange sounds.
Стр. 10

KNOCK SENSOR TEST PROGRAMDEVELOPMENT
ON THE A5XX PLATFORM
Bill Johnson Harris Semiconductor
Findlay, OHemail: [email protected]
AbstractAccurately measuring the functionality of the HIP9011 knock sensor has been a challenge in the past using standard linear test equipment. The knock sensor is a device used to provide a method of detecting premature detonation often referred to as "Knock" or "Ping" in internal combustion engines. This device can now be tested on the A5XX mixed signal tester approximately four times faster with better fault coverage than the previous tester solution. This will improve throughput and decreasing customer returns. Accuracy and repeatability are significantly improved. Also, testing can now be done in a customer applications run mode, rather than in a test mode as was done on the previous test platform. Use of parallel test with the A5XX reduces test time another 30% as opposed to single site testing. Hot temperature probing now becomes feasible. This in turn eliminates hot temperature testing at package test and improves the cycle time to correct fabrication process changes. The new test methodology and the A5XX tester's advantages and limitations will be discussed. Knock Sensor DescriptionThis device has 64 programmable bandpass filter frequencies ranging from 1.22kHz to 19.98kHz. Also programmable are the gain (0.111 to 2.000) and the integrator time constant (40us to 200us). It also has a test mode, allowing you to check each individual block of the device separately. Below is a functional block diagram of the HIP9011: The following equation applies during customer application run mode under normal operating conditions with a sine wave input: VOUT = [VIN * 1/2 * GIN * GPROG * GBPF * 2/Pi * TINT/TC * GDSE] * 0.95 + VRESET
where:VOUT = output voltage at INTOUT (V)VIN = input amplitude (Vp-p)GIN = external input amplifier gainGPROG = programmed gain at center frequencyGBPF = gain of the bandpass filter (ideally = 2 at center frequency)TINT = integration time (ms)TC = programmed time constant (ms)GDSE = gain of differential single ended converter (ideally = 2)0.95 = correction factorVRESET = integrator reset voltage, ~ 125mv with Vdd = 5v. This is thevoltage of Vo with T = 100us. Using this equation and varying the bandpass filter, programmable gain, and integrator time constant sections successively, we could now check out each section very quickly using customer application run mode.
Test Program DevelopmentInitially a test development session was held with Harris and Teradyne Engineers. Many ideas came from this. First, the A5XX test solution would need to be developed for both probe and final test. It would be desirable to test using the parallel test solution. Originally it was planned to take advantage of multitone testing and test the bandpass filter section similarly to the original tester platform solution in test mode. To do this on the A5XX tester platform, we would need to use the plfdig. This would consume a considerable amount of test time. The customer application run mode test method, on the other hand, would provide more
Стр. 11

accurate testing in less test time. Now the test time of each run mode test would simply consist of basically two components. The first is the amount of time it takes for the device to integrate to its final voltage target level. Secondly is the time to actually take a dc meter measurement using dvm. After further understanding of the device and the capabilities of the A5XX tester, we decided to test the device in customer application run mode as much as possible, with only the antialiasing filter test, the crosstalk tests, and the hysteresis tests remained tested in test mode. All other test mode tests would be replaced by these customer application run mode tests that typically took only ten milliseconds per site. Also it was noted that the device could be tested at speed on the digital pins, since the hsd50 was quite capable.
The previous linear tester platform was not capable of providing frequencies synchronized with the digital trigger INTHOLD pin with any accuracy to be able to test the device in customer application run mode. In order to test in run mode, the Integrator Hold pin would need to be synchronized to the frequency generator to get accurate responses from the device. Not synchronizing the audio source signal with the integrator hold pin would cause unacceptable inaccuracies in the integrator out pin. This was especially noticeable at lower frequencies (ie: 1.22Khz) as seen below:
As you can see, depending on how the integrator hold signal is synchronized with the input ac signal, you could get as much as 100 millivolts difference at the Vout pin. This is unacceptable when trying to get repeatable readings.
Also, the frequency generator would need to be capable of being offset, as the input to the device operated around the vmid voltage level, typically 2.5 volts. Thus a coupling capacitor was needed for the previous test solution. This was very inaccurate and time consuming, needing a minimum wait time of at least 200ms for the coupling capacitor to charge up to the vmidpoint voltage. We eliminated this capacitor on the A5XX test solution by measuring the vmidpoint operating voltage, then offsetting the plfsrc by that voltage using the dc_base. Now the only delay was in waiting for the device to respond to the sinusoidal input, especially at the lower frequencies being tested. An example of code using the plfsrc with dcbase offset is shown below:
Стр. 12

There are additional advantages and some disadvantages of using the plfsrc. Due to the nature of the device, you could not test the band pass filter tests using multitone in customer application run mode, so each frequency tested had to be created separately. A disadvantage to using the plfsrc was that there was not a good method known of finding the center frequency without creating many segments. Fortunately, the device was structured in such a way that not all of the bandpass filter (BPF) frequency selections needed to be tested. In other words, testing one in a bank would guarantee that bank of frequencies was working. This was also true with the gain run mode and the integrator run mode tests. We would, however, need to check the last bit of each bank of frequencies to ensure it was toggling. We could have varied the a0_clk_div to prevent creating many segments, but this was not pursued.
The plfsrc was very accurate, even down in the millivolt peak to peak signals. This was evident in the response of the device as compared to bench setups. The best way to ensure the correct amplitude into the device op amp was to use the IMAGE function tl_plfs_get_amp_filt_spec. This helped in many aspects. First, it was one way to correct for the internal filter attenuation of the plfsrc without having to adjust it via other means. This attenuation was as much as ten percent and varies from tester to tester, which was a source of error and not acceptable for our application. Feeding the plfsrc directly back into the inverting op amp and not using the coupling capacitor eliminated any attenuation from the Device Under Test (DUT) or dib board. This also eliminated the need to use the precision multimeter (PMM) to measure an offset correction factor. The PMM proved to be very slow, even though it would only be used during pre-test setup calibration. Since many different plfsrc amplitudes and frequencies were going to be tested, many PMM correction factors would need to be calculated. This is prone to error and another reason the tl_plfs_get_amp_filt_spec method was superior in our application. It did not seem to affect the test time as both methods were compared and this method did not have much effect on test time. Special care would need to be taken when connecting the plfsrc directly to the DUT, especially with the plfsrc being offset by the vmid voltage level. We did experience difficulties with actually damaging the plfsrc when we connected it to an apu for a short moment when trying to set the DUT feedback pins to an offset level during a test mode test. Proper sequencing of connecting and disconnecting the plfsrc and the apu’s eliminated the problem. Another issue we would have to deal with was that we could get into problems with the plfsrc internally calibrating since we were using so many different frequencies. Being able to test the device in blocks helped to prevent this issue from happening, although it was experienced during program development. If the plfsrc continually recalibrated each time you tested a device, it would cause excessive test time.
The ability to synchronize the plfsrc with the hsd using the plfsrc option by_hsd proved to be invaluable. One test required the plfsrc to be burst with a pulse of 60 millivolts amplitude (Vpeak) for two milliseconds, then immediately the amplitude needed to be decreased to five millivolts for eight milliseconds duration. This signal was easily produced by combining segments (see figure below). The plfsrc was then synchronized to the hsd50 to get the device to integrate over this ten millisecond burst. This test would have been very difficult if not impossible to implement on the previous test platform without discontinuities in the signal, yet relatively simple to create using the plfsrc with by_hsd trigger as seen below:
Стр. 13

Having the hsd50 proved to be very beneficial in clocking the SPI (Serial Peripheral Interface) circuitry. With the previous test solution it had to be done using external clocking circuitry on the load board. This presented issues in itself. If not all of the device digital circuitry was tested from the onset, the test hardware and software would need to be modified. This would require many test engineering man-hours to redesign the performance board. However, with the hsd50 on the A5XX, modifications to the clocking of the SPI were all done via software. Another advantage to the hsd50 was the ability to accurately test the speed characteristics of the device. Developing the hsd50 to work with the SPI interface, especially getting the device into test mode, proved to be quite difficult. The device was especially sensitive on how it was setup; how the digital input rise and fall edges corresponded to each other. Fortunately, we had a PC application tool to analyze the device going into test mode. Using a digital oscilloscope, we were able to capture each digital input and compare edges. Also, a thorough understanding of the hsd50 setup and timing was required. Utilizing the hsd50 start_state and hsd50 init_state command was essential to get the device to set up correctly. In order to get the correct edge timing, nrz mode was used for most pins, and a single line in the hsd50 pattern per clock transition was used. This had minimal effect on test time. The DSIO could have been used, but that method was not pursued. Crosstalk was a test mode test that could not be done in run mode. The idea of the test was to measure the amount of crosstalk from one channel to the other channel internally to the device. What made this test so difficult was that the dib board would need to be laid out very carefully; otherwise you would be checking crosstalk external to the device, which would override the internal crosstalk, if excessive. Attempting to measure to a limit around -40db proved to be very difficult. Shielded coax wire was used as much as possible to prevent external crosstalk. Using the plfdig and DSP made it quite simple in extracting the amplitude of the signal at the desired frequency.
Another very helpful tool in developing this test program was the SHIE (Standard Harris Image Environment) operating interface. It was quite helpful, especially when the program was actually transferred to production. The setup at probe was considerably simplified.
TEST TIME CONSIDERATIONS Test time minimization and reduced test flow was considered from the beginning of the project. Parallel site testing was developed both for probe and for package test. Test time savings due to parallel test saved approximately 30% as opposed to testing a single site at a time. Although this presented some challenges in developing the program, the cost savings made it well worth the effort. One of the difficulties we experienced while developing the parallel site test program was the problem of nested serial loops. This existed when invalid statements where included inside the serial blocks. With experience gained from programming parallel test, though, these were avoided as the project developed. Another possible problem was that certain variables needed to be set differently depending on which site was tested. This included the dcbase vmid voltage level during programming the plfsrc. This was resolved by simply putting the plfsrc statements inside a serial block. The save ddata and retrieve ddata Image commands were used when working with variables, especially during the bandpass filter run mode tests, where the output voltage measured at the center frequency needed to be saved for each site to compare to the -3db levels at both above and below the center frequency.
Another consideration was that this was a PWELL substrate process. With the intention of probing dual site, special care needed to be taken when doing Vdd contact test, and especially during the Vdd operating current test. While test one site, the other site needed to be completely isolated from all resources. Failure to do so would cause false readings and possibly cause both sites to fail falsely. The site not under test would need to disconnect the Vss and Vdd pins, the digital pins from the hsd channels, the analog pins from the apu channels, and any external components like feedback resistors for example. This could be resolved by using the following code to see which site was still active:
Now the s0_working or s1_working variable could be used to disconnect the appropriate resources from the site not being tested. We also experienced inaccurate readings during the run mode tests when the site not
Стр. 14

under test still had the hsd channels connected. This could have been resolved using the above method, or also by using the tl_site_shutdown function.
Now that the device could be tested with very good repeatability, it was decided to probe wafers at 125 degrees Celsius. This had many advantages. First, if a hot temperature yield problem occurred, it would now be rejected at probe, and the problem could be corrected in the fabrication facility sooner. This would also save on packaging faulty devices and retesting them. Bringing 125C testing to probe could reduce the number of test insertions. Now at final test we only needed to test at room and cold temperature, if necessary. Previously all three temperatures were tested in the final test facility. Probing at 125C on the previous tester platform was near impossible due to the unrepeatability of the test mode tests. Also, good product was rejected falsely. This made it very difficult for the product engineer to determine if the device had a yield problem or if indeed it was a matter of unrepeatability of the tester.
One problem we did experience was the docking hardware for probing at 125C. The hardware did not show any difficulties when probing at 25C, but as soon as we started probing at the higher temperature, we experienced problems with the probes moving off pattern and Z height being too deep or too light. This caused many problems, including damage to the die as the probes moved off the probe pads, and also damage to the probe cards when probing to deep. This has been resolved thanks to Cerprobe and Intest providing a better docking solution, especially at 125C.
The apu’s were used as much as possible so that the advantage of measuring dc measurements in parallel could take advantage of to save test time. The dc meter was used for the run mode tests, however, as it was not clear whether integrating both sites at the same time would produce inaccurate measurements due to noise. For this reason, during the run mode tests, the integrator pins for each site needed to be strobed separately (i.e.; outside of a serial block). This was especially noticeable to affect the Vout reading during the run mode at 125C as the output would droop the longer you waited between integrating and actually measuring the voltage level of Vout. This could have been avoided had the apu’s been used to strobe both sites immediately after integrating. This would be a means of test time reduction for future programming.
Hysteresis tests in general consume much test time due to the nature of the test. I chose to use successive approximation as opposed to ramping up the input in incremental steps. The ramp method was how the previous test solution did the measurement, and it was very time consuming. The tl_input_adjust function was considered, but it was not clear that this function worked with hsd50 commands or that it would work in parallel, so a separate successive approximation method was developed. One needed to be careful with variables, since this routine needed to be used for both sites when testing in parallel. Since the vil and vih thresholds do not typically vary across a wafer, testing hysteresis on both sites in parallel could save much test time. The parametric method below could be used:
Using the above method, both sites could be tested for the same time it would take to test a single site, provided the outputs switched at the same vil/vih level, which is normally the case for units from the same wafer or lot.
Another approach was to test hysteresis in a go-no go functional mode. This could be easily implemented because the vil and vih readings were so consistent from lot and from die to die. This method is actually the quickest test time method for doing hysteresis tests, and was used in production mode, when actual vil/vih readings were not necessary (ie: non-datalog mode).
Conclusion Developing the test program on the A5XX for the knock sensor proved to provide many challenges which were shared above. In attempting to resolve these opportunities, many very nice aspects of the mixed signal A5XX tester were utilized to develop a test program that tests four times faster than a strictly linear tester. The ability of the hsd50 digital pins to synchronize with the plfsrc ac signals provided us with the ability to repeatably and accurately test this device in the run mode and at multiple temperatures. The mixed signal
Стр. 15

A5XX tester in this application has proved to be quite adequate in reducing test time and improving test fault coverage; an ultimate goal for any test programmer.
AcknowledgementsI would like to acknowledge the following for their grateful help with this project:
Bart Neeb and Hal Wittlinger from Harris Semiconductor for sharing their knowledge about the HIP9011 fabrication and design process; Steve Lyons and Hank Caughman from Teradyne for their A5XX programming support.
ReferencesTeradyne's IMAGE ANSWERS was used extensively to develop this test program.1) Advance Mixed-Signal Instrumentation Manual (IMAGE VERSION 6.2) 2) Advance Mixed-Signal Programming Manual 3) Harris IPP databook- HIP9011
Стр. 16

Active Ignition Timing
The latest Turbo Imprezas have extremely effective ignition timing strategies. This article describes their function and why it works so well with aftermarket products such as exhausts, turbos and intercoolers.
Note: This is a very technical article and is published to inform the technically minded enthusiast. You don't need to know this to drive the car, but sometimes it's nice to understand exactly what is going on under the bonnet (Bonnet=hood for our US friends!). However, this article isn't all encompassing and is a basic overview of how a very complex system works. If you are interested in this topic, then the patents for this process may be downloaded from the US patent office.
http://www.ecutek.com/tuning/ignition/
Reasons for Active Ignition Timing
An ignition timing system has to balance a number of sometimes opposing objectives - vehicle emissions, engine power output, fuel consumption & engine longevity. An active ignition timing system allows continuous adjustment of ignition timing in order to best meet requirements. What makes the system 'active' is its ability to detect engine knock via the knock sensor attached to the engine block.
Ignition Timing Maps
The maps above are from a 2002 UK WRX Impreza. These maps form the basis of the ignition timing functions of the ECU.
Стр. 17

Ignition Base Map
The base ignition timing map holds the timing values to be used with the lowest octane fuel that the engine will encounter. This is (hopefully) the most retarded timing that the engine will ever need to run in normal circumstances.
Most base ignition maps have the same approximate shape. As engine RPM increases, ignition advance increases. As engine load increases, ignition timing retards. As a result, the most advance is used at high revs and low load, whilst the least advance is used at high loads and low revs.
The ignition timing flattens off at high RPMs. This is because the ECU does not use the knock sensor beyond around 6000rpm. This is for a very good reason - it is difficult to differentiate between knock and engine noise at high load and revs. Because of this, the ECU uses 'safe' timing values after the knock sensor switches off.
Ignition Advance Map
The ignition advance map holds the timing values that may be added on top of the base map should the ECU decide to do so. The values are set so that base plus correction map values total the timing that should be used with the highest octane fuel that the engine will encounter. The ECU will never advance timing beyond the base plus correction lookups.
At low engine loads, the ignition advance map contains no advance - this is the flat 'valley' of the map. No matter what the quality of fuel, the ECU will never advance the timing above the value in the base map. This is because the engine will not produce further power by advancing the timing - MBT (minimum best timing) has been reached. Advancing the timing further increases the chance of knock and also increases vehicles emissions of hydrocarbons and NOx.
MBT is the lowest value of ignition advance that produces maximum power.
Стр. 18

At high engine loads, the advance map contains much larger values. This shows that the timing possible varies greatly with the octane of fuel being used. Under boost, it may not be possible to reach MBT. In other words, the more timing advance that can be run, the higher the engine power output produced - MBT cannot be reached before the engine begins to knock before the plateau is reached. This is where the active ignition timing excels - it allows the ECU to run the highest timing possible without engine knock. This results in high power output, good fuel consumption and low exhaust gas temperatures. At these high loads, emissions aren't relevant for passing government emissions testing procedures, since the cars are always tested at relatively light loads - a handy loophole for turbo cars.
Ignition Learning
The above maps determine the range of ignition timing that the ECU is permitted to use on the engine. However, the ECU must determine the best choice of timing to run from the available range. This process is known as ignition learning. When the car is started (or the ECU reset), the ECU must determine the quality of fuel in the tank, and it does this during normal driving conditions.
Coarse Ignition Learning
When the grade of fuel is unknown, the ECU starts by running timing for a medium octane fuel. I.e. Values from the base map plus half of values from the advance maps. The ECU will then listen for knock. Based on its presence or absence, the ECU will then slowly decrease or increase the proportion of the advance map which is added to the base map until the level of knock is at a safe level. Its goal is to add the highest proportion of the advance map wherever possible. DeltaDash allows this 'proportion' factor to be viewed live as the ECU learns optimal timing - this parameter is labelled 'Advance Multiplier' in DeltaDash and its value ranges from 0 to 16. It is the number of sixteenths of the advance map that the ECU is willing to use - 16 being good, 8 being neutral and 0 being very bad.
Criteria for learning Ignition learning does not happen all the time. The ECU must fulfil certain criteria, such as coolant temperature, engine speed and load before learning with occur. Some fault codes will also inhibit or completely disable ignition learning, so they should be checked for before tuning begins.
The state of the advance multiplier determines the coarse ignition correction to be used across the entire load and rev range. Obviously this may not be optimal, since it may be better to run slightly more timing in some areas, and slightly less timing in others - this is where fine learning comes into play.
Fine Ignition Learning
Once an overall (coarse) ignition learning factor has been determined, the ECU begins to fine tune the timing. In contrast to the single blanket value of coarse ignition correction, the fine correction is stored as an 8x8 table totalling 64 values. This allows the ECU to tailor the timing in 64 separate areas of load and rpm. However, if the ECU is given sufficiently good quality fuel, the advance multiplier will hit its maximum value of 16 and will therefore use the full value from the correction map i.e. once the correction map hits its end stops, it is not possible to advance the timing further using fine learning.
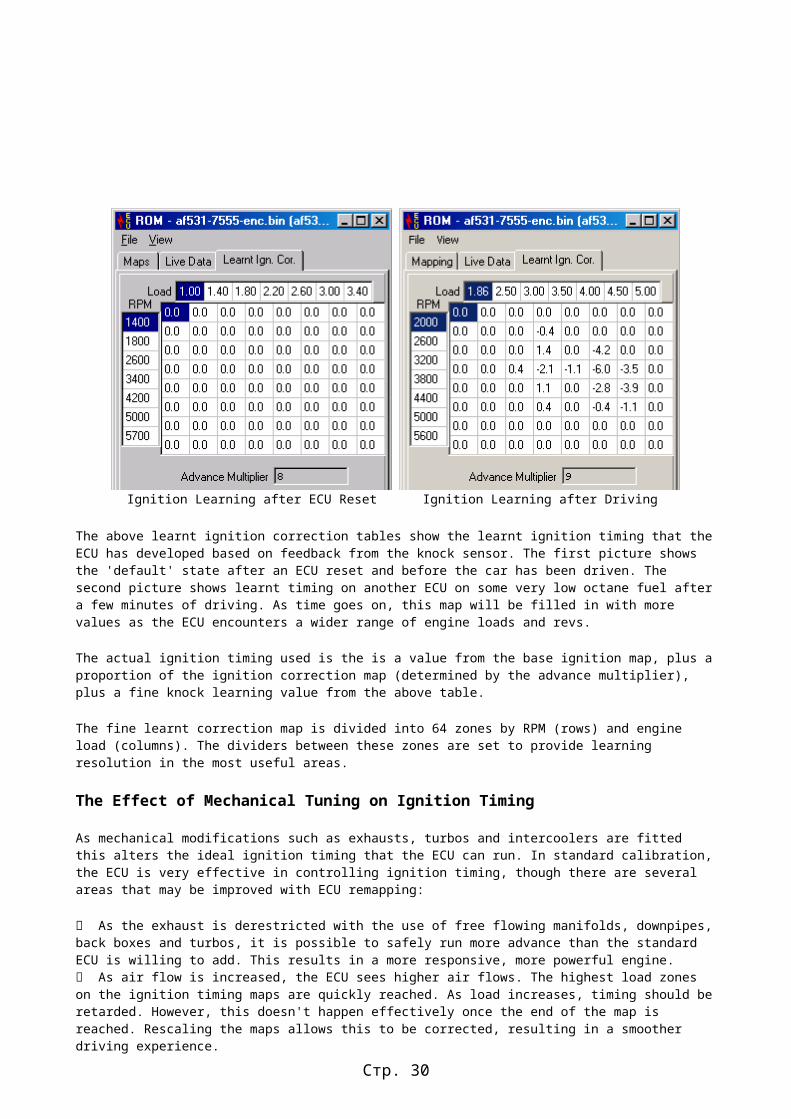
Ignition Learning after ECU Reset Ignition Learning after Driving Стр. 19

The above learnt ignition correction tables show the learnt ignition timing that the ECU has developed based on feedback from the knock sensor. The first picture shows the 'default' state after an ECU reset and before the car has been driven. The second picture shows learnt timing on another ECU on some very low octane fuel after a few minutes of driving. As time goes on, this map will be filled in with more values as the ECU encounters a wider range of engine loads and revs.
The actual ignition timing used is the is a value from the base ignition map, plus a proportion of the ignition correction map (determined by the advance multiplier), plus a fine knock learning value from the above table.
The fine learnt correction map is divided into 64 zones by RPM (rows) and engine load (columns). The dividers between these zones are set to provide learning resolution in the most useful areas.
The Effect of Mechanical Tuning on Ignition Timing
As mechanical modifications such as exhausts, turbos and intercoolers are fitted this alters the ideal ignition timing that the ECU can run. In standard calibration, the ECU is very effective in controlling ignition timing, though there are several areas that may be improved with ECU remapping:
As the exhaust is derestricted with the use of free flowing manifolds, downpipes, back boxes and turbos, it is possible to safely run more advance than the standard ECU is willing to add. This results in a more responsive, more powerful engine. As air flow is increased, the ECU sees higher air flows. The highest load zones on the ignition timing maps are quickly reached. As load increases, timing should be retarded. However, this doesn't happen effectively once the end of the map is reached. Rescaling the maps allows this to be corrected, resulting in a smoother driving experience. The knock sensor and ignition learning is active within a defined range of load and rpm. This range is set to cope with the standard power output of the engine, not a tuned engine. Outside this range, the ECU is deaf, and will not retard timing or advance timing. The active knock sensor range may be increased to listen for knock at higher engine RPMs and to learn timing at higher engine loads. This results in a safer, smoother state of tune. The fine ignition correction zones may be moved to be better spread across the widened load range that the engine will see, as depicted in the second screenshot above. This allows the ECU to learn effective timing for the full range of engine loads.
For optimum timing, it is important that the base and correction maps are the correct shape. Base should correspond to low octane and full addition should be used for high octance. When adjusting the values in these maps, tuners will be treat the maps as a whole, as opposed to working on particular RPM/load areas. This is important since coarse ignition correction is applied across the whole RPM/load range. If the ECU is able to add 50% of the correction map at 3000 revs, then it should be able to add the same proportion of the correction map at 5000 revs. If this is not the case then the maps are not of the correct profile or shape, and the ignition learning process will not work efficiently.
Further Reading
Subaru have published a number of patents on their ignition timing strategy that are publicly available via the Internet:
Method for controlling ignition timing of an internal combustion engine - Patent 5,000,150
Method for controlling ignition timing of an internal combustion engine - Patent 5,038,736
Стр. 20

Индикатор детонации
Для вывода на панель приборов используется индикатор износа тормозных колодок (отключенный уже давно, еще прежним владельцем автомобиля). Датчик детонации – от “десятки”, такой круглый, железный. Ввинтил его в одно из имеющихся отверстий на двигателе. Есть еще датчики в пластмассовом корпусе, они поменьше и крепятся болтом, но, как мне показалось, у них чувствительность хуже (есть датчики широкополосные и есть резонансные), поэтому остановился на «железном» варианте.
Схему нашел в Интернете:
Поскольку таких микросхем у меня под рукой не было, то сделал попроще (для меня):
Настройка:Потенциометром добиться прекращения загорания лампы при явной детонации, затем
повернуть движок на 2-3 оборота назад (потенциометр - многооборотный). Как добиться детонации – неоднократно описывалось в литературе. При неправильной настройке (слишком большой чувствительности) шум двигателя при оборотах более 3-4 тыс. может восприниматься схемой, как детонация.
Поскольку у меня коробка-автомат, то, как выяснилось, индикатор детонации не очень-то и нужен. АКПП сглаживает перепады нагрузки на двигатель, поэтому трудно даже добиться длительной детонации, приходится для настройки отключать кик-даун, т.е. утрачивается оперативность, а значит, можно настраивать и на слух.http :// www . gnttype . org / techarea / projects / projectspage . html
http :// www . gnttype . org / techarea / projects / knock / circuit . gif Стр. 21

The stock sensor puts out about 20mV/g into a 1 meg ohm load, while a GM sensor puts out about 500mV/g into a 3.9 k ohm load.
The 555 circuit was designed for a GM sensor.
Remember, a knock detector is trying to hear knock that you can't hear, and at the same time, trying to ignore engine noise that you CAN hear.
In other words, the knock signal is often smaller than the engine noise. If it's bigger, then you'll probably hear it, and you won't need the detector.
Knock Indicator Theory of Operation
Contributed by Larry Fisher ([email protected])
3 July 1996
The turbo Buick engine control system retards spark timing when "knocking" is detected so that engine damage can be prevented. The knock indicator described here and shown in related diagrams is a diagnostic tool that informs the driver when such knocking is occurring.
Knock Detection Overview
Стр. 22

------------------------
The ECM (Electronic Control Module - engine computer) is signaled that knock is occuring by the ESC, or Electronic Spark Control module. The ESC module is a band-pass filter and logic driver circuit that is connected to an acoustic sensor mounted on the engine block. Normally, the output line of the filter going to the ECM is held "high," or about 10-12 volts. When the filter detects knocking-type sounds, it "grounds" the signal line going to the ECM.
On '84-'87 Turbo Buicks and the '89 Turbo TA, the sensor is mounted on the rear of the engine block, above the transmission bell housing. On '86-'87 Turbo Buicks the ESC module is mounted on the inner side of the passenger fenderwell in front of the heater fan.
The purpose of Knock Indicators
-------------------------------
Aftermarket knock indicators are used as tuning tools and warning devices to prevent engine damage. As a tuning tool, a knock indicator is frequently used as feed-back on whether the engine is operating under too much boost. Boost is one easily-adjusted performance variable that is commonly adjusted to fine-tune a car for maximum performance.
To be completed:
what the knock indicator does
how a knock indicator works
How this circuit works
- characteristics of operation
- diagnostic assistance.
potential additions and variations (based on the basic sense method)
Стр. 23

http://forums.nasioc.com/forums/archive/index.php/t-300599.html
http://home.netcom.com/~bsundahl/knock/sound/KnockSounds.htm
Knock Sensor SoundsThe knock sensor is basically just a microphone screwed into the side of the engine block. You can actually connect an audio amplifier (or in my case, a tape recorder) to the output of this sensor and hear the pinging caused by detonation, along with all the other noises that an engine makes. All of the sounds on this page were recorded from the knock sensor, using a conventional cassette recorder.
Index to this document
Стр. 24

Engine Knock
Here is an excerpt from a .tlg file which I would consider typical (for my car anyway). It shows some engine knock under mild acceleration.
This log show second and third gear. If you play this sound file, which corresponds to this log, you can hear the same sounds that the ECU hears. The pinging is audible just after the shift to third. It has a fairly distinctive sound, that I would describe as similar to the "twang" that you can get from flexing a piece of sheet metal. You will also notice a rather loud crackle around the top of second. I hear this a lot, and I am fairly sure that it is electrical interference, rather than a mechanical sound from the engine. I can't be certain that the ECU is actually hearing this at all... it could just be due to how I have my recorder wired. You will notice that it does NOT show up as knock, even though it is quite loud.
Knock Frequency
There has been a bit of talk about what frequency knock is at. Or put another way, what exactly is the ECU listening for? The more we know about this, the better we can predict what other sounds are likely to fool it. I have tried looking closely at the sound file, to try to see some pattern in the audio wave that I could call knock. But I could not find any such distinct pattern. What I needed was a spectrum analyzer.
A spectrum analyzer is a tool (may be hardware of software) which shows the frequency content within a sound (or radio wave or whatever). Spectrogram is a freeware spectrum analyzer for the PC. It shows a "3 dimensional" graph, where the X axis is time (same as an audio wave form viewer), the Y axis is frequency (as opposed to signal amplitude in a wave form viewer). The "3rd" dimension is color, and is used to show amplitude or intensity. A dark color (black or dark blue) indicates little or no content at that particular frequency and point in time. A light color (mostly light blue in my images) indicates a stronger content.
Стр. 25

The spectrum shown here covers about one second of time, corresponding to roughly 1:18 to 1:19 in the TMO log above (right where the knock sum starts). You can click here to listen to this portion the sound. If you listen carefully to the "ping" sound, you will likely realize that it is not a single frequency. You can hear it drop in pitch over the fraction of a second which it exists. In this spectrum this would show up as a diagonal line, because the frequency starts out high at one point in time, then drops in frequency as time increases, then fades away in amplitude. Look at the spectrum above, just to the left of the "+" which corresponds to 6KHz, 7.6 sec. There is a light blue, slightly diagonal line there, and other similar lines in the first half of this image. These lines correspond to the pings in the sound file. This is what knock looks like.
I should say that this is what I think knock looks like, because I have not been able to completely correlate the audible ping sound, to the knock sum from the TMO logger. I often can hear knock (which is visible in the spectrum) which does not show up on the logger , and the logger often records knock that I cannot hear or see in the spectrum. I have yet to figure out exactly what the ECU knock filter is looking at.
Fuel Turn On
Knocking isn't the only thing you can hear through the knock sensor.
Most fuel injected engines will shut the fuel off completely when coasting. This log file shows such a case. The RPMs are in the normal driving range, but the throttle is closed and the injector pulse width is at zero. At about 6:48 on this log, you can see the throttle tip in and the injector pulse width comes up. This is what it sounds like just as the fuel comes on. You may need headphones or good speakers to here it, as the relevant frequencies are fairly low.
Стр. 26

This is what that sound looks like on the spectrum analyzer.
Look at the bottom half inch of the spectrum. The left half of the image is almost empty in this region, but the right half shows strong "spikes". Each of these spikes is a cylinder firing. You can see almost exactly where the fuel turns on! I measured the spikes at 11.6ms apart, which would correspond to 2586 RPM.
Accel Enrichment
Стр. 27

I stated above that the spikes near the bottom of the spectrum were caused by a cylinder firing, implying that this is a sound produced by the combustion. But I am speculating that the sound is really the injector ticking.
Here is an example of a gentle start from idle, and what it sounds like. The injectors normally fire (open) in sync with the engine, at 5° before TDC on the compression stroke (note 1). During accel, fuel is added simultaneously into all four cylinders every 10 ms, in addition to the sequential injection (note 2). I don't normally log accel enrichment, so unfortunately that does not show in my log. Listen to the sound (recording starts near the middle of the log above). Hear the "zzzzt" staticy sound just as the throttle first starts to tip in? Those seem to be our accel pulses!
And we can see the extra pulses in the spectrum!
This is the portion of the sound that covers this image. This spectrum here is much cleaner than the previous examples because we are at idle, and the engine is much quieter at idle. We happen to be idling at 1000 RPM, so that means the crank rotates once every 60 ms, and a cylinder fires once every 30 ms, or roughly 3 times for each 1/10th second shown on the chart. But there is an obvious region here where there are three times as many pulses as normal, that is, once every 10 ms! Not only that, but the pulses appear to be much stronger than normal, implying that all four injectors are firing simultaneously, just like the book says they should!
Стр. 28

Also notice that there is something going on at the end of the image (right hand side). The last three pulses look stronger than normal, and the very last pulse is only 10 ms from its neighbor. My interest in this is that it is audible! Even though it is only a few very short pulses, I can hear it in the sound file!
Стр. 29
Spectrogram
Spectrogram is a freeware spectrum analyzer for the PC. If you want to try this your self, you can find Spectrogram at: http://www.monumental.com/rshorne/gram.html You can use it to analyze the .wav files that are contained in this document, or any other .wav files for that matter, including ones that you digitize yourself.
Recording your own knock sensor
All of the sounds on this page were recorded with a cassette recorder, by connecting the microphone input into the knock sensor wire at the ECU. I have a 100K resistor and a 0.1uF capacitor in series to prevent the cassette recorder from influencing the signal that the ECU sees. (Click here for more details.) I then digitize the portions of interest on my PC, using the standard Microsoft Sound Recorder.
Стр. 30