f.i.l.a. group 2020 annual report f.i.l.a. s.p.a. 2020
TRANSCRIPT

F.I.L.A. Group
1
(Translation from the Italian original which remains the definitive version)
F.I.L.A. GROUP
2020 ANNUAL REPORT
F.I.L.A. S.p.A.
2020 ANNUAL REPORT
F.I.L.A. – Fabbrica Italiana Lapis ed Affini S.p.A.
Via XXV Aprile 5 Pero (MI)

F.I.L.A. Group
2
CONTENTS I - General information ........................................................................................................................ 4
Corporate Bodies ................................................................................................................................ 4 Overview of the F.I.L.A. Group.......................................................................................................... 5 Organisational structure ...................................................................................................................... 7
II - Directors’ Report ............................................................................................................................ 9
Economic overview ............................................................................................................................ 9 Financial Highlights .......................................................................................................................... 11 F.I.L.A. Group’s Financial Highlights .............................................................................................. 16
Normalised financial performance net of IFRS 16 effects ............................................................ 16 Business seasonality ...................................................................................................................... 19 Statement of Financial Position .................................................................................................... 20 Financial overview ........................................................................................................................ 23
Segment reporting ............................................................................................................................. 26 Business Segments – Statement of financial position ................................................................... 27 Business Segments – Statement of comprehensive income .......................................................... 28 Business Segments – Other Information ....................................................................................... 29
Investments ....................................................................................................................................... 30 Other Information ............................................................................................................................. 31
Management and control ............................................................................................................... 31 Treasury shares ............................................................................................................................. 31 Research and development and Quality Control ........................................................................... 31 Related party transactions ............................................................................................................. 33
Significant events in the year ............................................................................................................ 34 Subsequent events ............................................................................................................................. 37 Outlook ............................................................................................................................................. 37 Going Concern .................................................................................................................................. 37 Risk Management ............................................................................................................................. 38 Environment and Safety .................................................................................................................... 51 Personnel ........................................................................................................................................... 52 Corporate Governance ...................................................................................................................... 54 Reconciliation between Parent’s and Group’s Equity ...................................................................... 55
III - Consolidated Financial Statements at December 31, 2019 ...................................................... 58
Consolidated Financial Statements ................................................................................................... 58 Statement of Financial Position .................................................................................................... 58 Statement of Comprehensive Income ........................................................................................... 59 Statement of changes in Equity ..................................................................................................... 60 Consolidated Statement of Cash Flows ........................................................................................ 61 Statement of financial position with indication of related party transactions pursuant to CONSOB
resolution No. 15519 of July 27, 2006 .......................................................................................... 63 Statement of Comprehensive Income with indication of related party transactions pursuant to
CONSOB resolution No. 15519 of July 27, 2006 ......................................................................... 64 Notes to the Consolidated Financial Statements of the F.I.L.A. Group ............................................ 65 Commitments and guarantees ......................................................................................................... 151 Transactions with Related Parties ................................................................................................... 154 Disclosure pursuant to Article 149-duodecies of the Consob Issuer’s Regulation ......................... 160 Attachments .................................................................................................................................... 161
Attachment 1 - List of companies included in the consolidation scope and other equity
investments ................................................................................................................................. 161

F.I.L.A. Group
3
Attachment 2 - Business combinations ....................................................................................... 162 Atypical and/or Unusual Transactions ............................................................................................ 164 Statement of the Manager in Charge of financial reporting and the Corporate Bodies .................. 165 Independent Auditors’ Report pursuant to Article 14 of Legislative Decree No. 39 of January 27,
2010 ................................................................................................................................................ 166
IV - Separate financial statements of F.I.L.A. S.p.A. at December 31, 2020 ............................... 172
Separate financial statements of F.I.L.A. S.p.A. ............................................................................. 172 Statement of Financial Position .................................................................................................. 172 Statement of Comprehensive Income ......................................................................................... 173 Statement of changes in Equity ................................................................................................... 174 Statement of Cash Flows............................................................................................................. 175 Statement of Financial Position pursuant to CONSOB Resolution No. 15519 of July 27, 2006 177 Statement of Comprehensive Income pursuant to CONSOB Resolution No. 15519 of July 27,
2006............................................................................................................................................. 178 Notes to the Separate Financial Statements of F.I.L.A. S.p.A. ....................................................... 179 Subsequent events ........................................................................................................................... 250 Transactions relating to Atypical and/or Unusual Operations ........................................................ 251 Final Considerations ....................................................................................................................... 252 Statement of the Manager in Charge of financial reporting and the Corporate Bodies .................. 253 Board of Statutory Auditors’ Report on the separate financial statements at December 31, 2017
prepared as per Article 2429 of the Civil Code. ............................................................................. 254 Independent Auditors’ Report pursuant to Article 14 of Legislative Decree No. 39 of January 27,
2010 ................................................................................................................................................ 275

F.I.L.A. Group
4
I - General information
Corporate Bodies
Board of Directors
Chairman Giovanni Gorno Tempini
Honorary Chairman Alberto Candela
Chief Executive Officer Massimo Candela
Executive Director Luca Pelosin
Director (**) Annalisa Barbera
Director (*)(**) Filippo Zabban
Director (*)(**)(***) Gerolamo Caccia Dominioni
Director (*)(**) Francesca Prandstraller
Director (*)(**) Paola Bonini
Director (*)(**) Alessandro Potestà
(*) Independent director in accordance with Article 148 of the Consolidated Finance Act and Article 3 of the Code of Conduct.
(**) Non-Executive Director.
(***) Lead Independent Director.
Control, Risks and Related Parties Committee
Gerolamo Caccia Dominioni
Paola Bonini
Filippo Zabban
Alessandro Potestà
Remuneration Committee
Francesca Prandstraller
Annalisa Barbera
Filippo Zabban
Paola Bonini
Board of Statutory Auditors
Chairman Gianfranco Consorti
Standing Auditor Elena Spagnol
Standing Auditor Pietro Michele Villa
Alternate Auditor Stefano Amoroso
Alternate Auditor Sonia Ferrero
Independent Auditors KPMG S.p.A.

F.I.L.A. Group
5
Overview of the F.I.L.A. Group
The F.I.L.A. Group operates in the creativity tools market, producing and marketing colouring, design,
modelling, writing and painting objects, such as pencils, crayons, modelling clay, chalk, oil colours,
acrylics, watercolours, paints and paper for the fine arts, school and leisure.
The F.I.L.A. Group at the reporting date operates through 21 production facilities and 35 subsidiaries
across the globe and employs over 8,000 people, becoming a pinnacle for creative solutions in many
countries with brands such as GIOTTO, DAS, LYRA, Canson, Maimeri, Daler-Rowney Lukas,
Ticonderoga, Pacon, Strathmore, Princeton and Arches.
Founded in Florence in 1920 by two noble Tuscan families, the della Gherardesca and Marchesi
Antinori Counts, F.I.L.A. S.p.A. (hereafter also the “Parent” or “Issuer”) has achieved strong
international growth in the past 20 years, supported by a series of strategic acquisitions. Over the years,
the Parent has acquired: (i) the Italian firm Adica Pongo in 1994, a leading producer of modelling clay
for children; (ii) the Spanish firm Spanish Fila Hispania S.L. (formerly Papeleria Mediterranea S.L.) in
1997, the Group’s former exclusive distributor in Spain; (iii) the French firm Omyacolor S.A. in 2000,
a leading manufacturer of modelling putties and clays; (iv) the U.S. Dixon Ticonderoga Group in 2005,
a leading producer and distributor of pencils in North America, with subsidiaries operating on the
Canadian, Mexican, Chinese and European markets; (v) the German LYRA Group in 2008, which
allowed the Group to enter the German, Scandinavian and Eastern Asian markets; (vi) the business unit
operated by Lapiceria Mexicana in 2010, one of the main local competitors in the budget coloured and
graphite pencils market; and (vii) the business unit operated by Maimeri S.p.A. in 2014, a manufacturer
and distributor of paints and accessories for fine arts. In addition to these operations, on the conclusion
of an initiative which began with the acquisition of a significant influence in 2011, control of the Indian
company DOMS Industries Pvt Ltd. was acquired in 2015 (viii). In 2016, the F.I.L.A. Group focused
on development through strategic Art&Craft sector acquisitions, seeking to become the leading market
player. On February 3, 2016, F.I.L.A. S.p.A. acquired control of the Daler-Rowney Lukas Group, an
illustrious brand producing and distributing materials and accessories on the arts and crafts market since
1783, with a direct presence in the United Kingdom, the Dominican Republic, Germany and the USA
(ix). In September 2016, the F.I.L.A. Group acquired the entire share capital of St. Cuthberts Holding
Limited and the operating company St. Cuthberts Mill Limited, a highly-renowned English paper mill,
founded in 1907, located in the south-west of England and involved in the production of high quality
artist’s papers (x). In October 2016, F.I.L.A. S.p.A. acquired the Canson Group, founded in 1557 by
the Montgolfier family, with headquarters in Annonay in France, production facilities in France and
conversion and distribution centres in Italy, France, China, Australia and Brazil. Canson products are
available in over 120 countries and the brand is the most respected globally involved in the production
and distribution of high added value paper for the fine arts, design, leisure and schools, but also for

F.I.L.A. Group
6
artists’ editions and technical and digital drawing materials (xi)
In June 2018, F.I.L.A. S.p.A., through its US subsidiary Dixon Ticonderoga Co., consolidated its role
as a leading player on the US market with the acquisition of the US Group Pacon, which through brands
such as Pacon, Riverside, Strathmore and Princeton, is a leader in the US schools and arts and crafts
sector (xii).
On March 2, 2020, F.I.L.A.- Arches S.A.S., a French company wholly-owned by F.I.L.A. S.p.A.,
completed the purchase of the fine arts business unit of the company specialised in fine arts operating
through the ARCHES® brand, until then managed by the Ahlstrom-Munksjö Group, finalising the non-
binding memorandum of understanding signed on October 30, 2019 between F.I.L.A. S.p.A. and
Ahlstrom- Munksjö Oyj and its French subsidiary, Ahlstrom-Munksjö Arches (xiii).

F.I.L.A. Group
7
Organisational structure
The F.I.L.A. S.p.A. organisational structure is reported below. – DA TRADURRE

F.I.L.A. Group
8
DIRECTORS’ REPORT

F.I.L.A. Group
9
II - Directors’ Report
Macroeconomic overview
The year 2020 was characterised by the spread of the COVID-19 pandemic (the “coronavirus”) and the
restrictive containment measures consequently implemented by the Governments of the countries
affected. The health emergency, which is still going on in the early months of 2021, has had very strong
social impacts and direct or indirect repercussions on general economic performance and the propensity
to consume and invest. This situation is clearly reflected in the decrease in GDP seen in almost all
regions in which the Group operates, with the exception of China, which showed an increase in GDP,
albeit to a lesser degree than in 2019.
The F.I.L.A. Group's target market was characterized by partial or total school closures from the
beginning of the pandemic until the end of the year, with remote learning adopted almost everywhere.
This situation penalized sales particularly in regions such as Mexico and India where the market is
focused more on school products and the presence of the online sales channel is limited. On the other
hand, sales in Europe and North America were substantially in line with the previous year, thanks to a
less massive closure of schools, a more developed online sales channel and a greater presence of
consumers of Fine Arts products. The European market experienced weak growth, additionally
impacted by the launch of the European logistics hub in the first quarter, with revenue slowing at the
start of the year due to the necessary set-up operations.
During 2020 the management focused closely on maximum containment of fixed costs and investments,
seeking to minimize the adverse impacts of the pandemic on the Group’s financial performance and
position. Great attention was paid to maintaining robust cash flow, in particular by constantly
monitoring customers’ accounts.

F.I.L.A. Group
10
The inflation and GDP figures for the main countries in which the F.I.L.A. Group companies operate
are reported below:
Country Inflation GDP Inflation GDP
Italy (0.14%) (6.58%) 0.61% 0.46%
Spain (0.32%) (9.05%) 0.70% 1.86%
Portugal (0.01%) (6.11%) 0.34% 1.98%
Greece (1.25%) (7.91%) 0.17% 2.29%
France 0.48% (4.94%) 1.11% 1.42%
Turkey 12.28% 5.04% 15.18% 0.47%
Germany 0.51% (3.65%) 1.45% 0.64%
Poland 3.40% (2.74%) 2.31% 4.06%
Sweden 0.50% (2.14%) 1.78% 1.72%
U.S.A. 1.23% (2.44%) 1.81% 2.07%
Canada 0.72% (3.23%) 1.95% 1.65%
Mexico 3.40% (4.48%) 3.64% (0.22%)
Chile 3.05% (10.25%) 2.56% 2.82%
Argentina 42.02% (10.09%) 53.55% (1.10%)
China n.a. 6.50% 2.9% 6.00%
India 5.56% 0.07% 7.66% 4.66%
Brazil 3.21% (1.24%) 3.73% 1.17%
Russia 3.38% (3.33%) 4.47% 1.63%
South Africa 3.22% (4.16%) 4.12% 0.21%
Australia 0.85% (1.12%) 1.61% 1.74%
Source: OECD, March 2021
BRICs
Others
December 31, 2020 December 31, 2019
Euro zone
North America
Latin America

F.I.L.A. Group
11
Financial Highlights
The F.I.L.A. Group’s 2020 financial highlights are reported below:
Euro thousands
2020%
revenue2019 % revenue
of which:
IFRS 16 FTA effects (3)
of which:
Non-Recurring expenses
Revenue from sales and services 607,382 100,0% 682,686 100,0% (75,304) -11.00% (784)
Gross operating profit (1) 95,051 15.6% 105,923 15.5% (10,873) -10.3% 13,884 (14,184)
Operating profit 49,518 8.2% 60,048 8.8% (10,530) -17.5% 2,041 (14,184)
Net financial expense (35,231) -5.8% (30,279) -4.4% (4,952) -16.4% (5,758) (200)
Total taxes (6,165) -1.0% (3,663) -0.5% (2,502) -68.3% 800 (2,126)
F.I.L.A. Group Profit attributable to the owners of the Parent 8,607 1.4% 24,000 3.5% (15,393) -64.1% (2,784) (11,684)
Earnings per share (€ cents)
basic 0.17 0.47
diluted 0.17 0.46
NORMALISED - Euro thousands
2020%
revenue2019 % revenue
of which:
Fila Arches
Revenue 608,167 100,0% 687,360 100,0% (79,193) -11.5% 4,856
Gross operating profit (1) 95,351 15.7% 110,834 16.1% (15,483) -14.0% 2,728
Operating profit 61,661 10.1% 78,417 11.4% (16,756) -21.4% 1,810
Net financial expense (29,273) -4.8% (24,728) -3.6% (4,545) -18.4% (772)
Total taxes (9,091) -1.5% (8,305) -1.2% (786) -9.5% (618)
F.I.L.A. Group Net Profits attributable to the owners of the Parent 23,075 3.8% 43,133 6.3% (20,058) -46.5% 1,655
Earnings per share (€ cents)
basic 0.45 0.85
diluted 0.44 0.84
Euro thousands
Cash flows from operating activities 74,387 113,305 (38,918)
Investments (10,175) (19,010) 8,835
% revenue
Euro thousands
of which:
IFRS16 FTA effects
of which:
Fila Arches
Net capital employed 824,731 855,501 (30,770) 78,391 41,999
Net Financial debt (2) (493,456) (498,150) 4,694 (84,885) 1,133
Equity (331,275) (357,351) 26,076 6,494 2,060
(1) The Gross Operating Profit (EBITDA) corresponds to the operating result before amortisation and depreciation and impairment losses;
(2) Indicator of the net financial position, calculated as the aggregate of the current and non-current financial debt, net of cash and cash equivalents and current financial assets and loans provided to third parties classified as
non-current assets. The net financial position as per CONSOB Communication DEM/6064293 of July 28, 2006 excludes non-current financial assets. The non-current financial assets of the F.I.L.A. Group at December 31, 2020
amount to Euro 2,614 thousand, of which Euro 68 thousand included in the calculation of the net financial position; therefore the F.I.L.A. Group financial indicator does not equate, for this amount, with the net financial position
as defined in the above-mentioned Consob communication. For further details, see paragraph ‘Financial Overview” of the Report below.
Change
2020 - 2019
Change
2020 - 2019
Change
2020 - 20192020 2019
Normalizations
1.7% 2.8%
Change
2020 - 201920192020

F.I.L.A. Group
12
2020 Adjustments:
The adjustment to the “Revenues from sales and services” mainly concerns returns as a result of
disputes with customers, related to the economic and social effects of the COVID-19 pandemic;
The adjustment to the 2020 gross operating profit relates to non-recurring operating expense of
approx. Euro 14.2 million, mainly for the expense concerning the corporate transaction for the
acquisition of the ARCHES business unit for Euro 6.3 million, the costs incurred to deal with the
pandemic and the inefficiencies on both the production and supply chain caused by the impact of
COVID-19 for Euro 6.3 million and, residually, reorganisation costs of the F.I.L.A. Group for Euro
1.4 million;
The adjustment to the operating profit was Euro 14.2 million, resulting from the aforementioned
effects on the gross operating profit;
The adjustment to net financial expense refers to the financial expense incurred by the Parent
F.I.L.A. S.p.A. for the new loan to support the M&A transaction;
The adjustment to the 2020 profit attributable to the owners of the parent concerns the above
adjustments, net of the tax effect.
2019 Normalisations:
The adjustment to the 2019 gross operating profit relates to non-recurring operating expense of
approx. Euro 17.9 million, principally for Group reorganisation plans and particularly in North
America and Europe;
The adjustment to the operating profit (Euro 2.9 million) relates to the impairment losses on
goodwill pertaining to the sale of the “Superior” business;
The adjustment to the 2019 profit attributable to the owners of the parent concerns the above
adjustments, net of the tax effect.

F.I.L.A. Group
13
In order to permit a more accurate assessment of the F.I.L.A. Group’s financial performance and
financial position, some alternative performance measures are presented alongside the conventional
financial measures pursuant to the IFRS. Such alternative performance measures are not to be
considered replacements for the IFRS-compliant measures.
The alternative performance measures used are illustrated below:
Gross operating profit or EBITDA: this is calculated as profit for the reporting period, excluding the
following components: (i) income taxes for the reporting period, (ii) depreciation, amortisation and
impairment losses, (iii) financial income and expense, and (iv) profit or loss from discontinued
operations. The F.I.L.A. Group uses this measure as an internal management target and in external
presentations (for analysts and investors), as it is useful in measuring the overall operating performance
of the F.I.L.A. Group and of F.I.L.A. S.p.A.
The table below presents a reconciliation of the 2020 profit for the year with the gross operating profit:
The Group defines adjusted gross operating profit net of the effects of IFRS 16 as gross operating profit
before: (i) non-recurring expense and (ii) the application of IFRS 16.
The following is a reconciliation between gross operating profit and adjusted gross operating profit net
of IFRS 16 effects:
Euro thousands 2020 2019
Profit/(loss) attributable to non-controlling interests (485) 2,105
Profit/(loss) attributable to the owners of the parent 8,607 24,000
Profit for the year 8,122 26,105
Income taxes 6,165 3,663
Current taxes 7,353 10,827
Deferred taxes (1,188) (7,164)
Amortisation, depreciation and impairment losses 45,553 45,876
Financial items 35,231 30,279
Financial income (2,348) (3,971)
Financial expense 37,850 34,437
Share of losses of equity-accounted investees (271) (187)
Gross operating profit 95,051 105,923
Euro thousands 2020 2019
Gross operating profit 95,051 105,923
Non-recurring expense 14,184 17,864
IFRS 16 effect (13,884) (12,954)
Adjusted gross operating profit 95,351 110,834

F.I.L.A. Group
14
Operating profit: this is calculated as the profit for the reporting period, excluding the following
components: (i) income taxes for the reporting period, (ii) financial income and expense and (iii) profit
from discontinued operations.
The Group defines adjusted operating profit net of the IFRS 16 effects as the operating profit gross of:
(i) non-recurring expense and (ii) the application of IFRS 16.
The following is a reconciliation between operating profit and adjusted operating profit net of IFRS 16
effects:
F.I.L.A. Group profit for the year: profit for the reporting period, adjusted for non-controlling interest
items.
The Group defines the adjusted profit attributable to the owners of the parent and net of IFRS 16 effects
as the Group profit for the year, gross of: (i) non-recurring expense, (ii) and net of IFRS 16 effects.
The following is the reconciliation of the Profit of the Group with the adjusted Group profit net of IFRS
16 effects:
Net financial position (or net financial debt): this is a valid measure of the F.I.L.A. Group’s financial
structure. It is calculated as the aggregate of the current and non-current financial debt net of cash and
cash equivalents and of current and non-current financial assets relating to derivative instruments. The
net financial position as per CONSOB Communication DEM/6064293 of July 28, 2006 excludes non-
current financial assets. Non-current financial assets amount to Euro 68 thousand at December 31, 2020
and to Euro 1,070 thousand at December 31, 2019. Accordingly, the F.I.L.A. Group financial indicator
Euro thousands 2020 2019
Operating profit 49,518 60,048
Non-recurring expense 14,184 17,864
Impairment losses on Intangible assets - 2,936
IFRS 16 effect (2,041) (2,431)
Adjusted Operating profit 61,661 78,417
Euro thousands 2020 2019
Group Profit of the year 8,607 24,000
Non-recurring expense 11,684 16,710
IFRS 16 effect 2,784 2,423
Adjusted Group Profit of the year 23,075 43,133

F.I.L.A. Group
15
at December 31, 2020 and December 31, 2019 differs by those amounts from the net financial position
as defined in the above-mentioned Consob communication.

F.I.L.A. Group
16
F.I.L.A. Group’s Financial Highlights
The F.I.L.A. Group’s 2020 financial highlights are reported below.
Normalised financial performance net of IFRS 16 effects
The 2020 normalised gross operating profit, net of IFRS 16 effects, decreased by -14.0% compared to
the previous year, 2019.
The main changes compared to 2019 are illustrated below:
“Revenue from sales and services” of Euro 608,167 thousand decreased on 2019 by Euro 79,193
thousand (-11.5%). Net of the negative currency effect of Euro 16,947 thousand (related to all the main
Group currencies and in particular the deterioration of the US Dollar, the Indian Rupee and the main
Central-South American currencies against the Euro), the organic contraction was Euro 62,246
thousand (-9.1%). This decrease, improving on the first nine months of 2020 thanks to the partial
reopening of schools in Europe and North America and the excellent Fine arts business performance in
the fourth quarter, relates to the global contraction in consumption as a result of the impacts of the
COVID-19 pandemic across the world and particularly the closure of schools, which extended far
beyond initial expectations in India and Mexico, regions in which the schools-related business and the
significant lack of online alternative to the classic sales channels are important factors.
Looking to the geographical segments, this result related to Asia for Euro 33,981 thousand (-38.3%),
Central-South America for Euro 30,960 thousand (-45.8%), partially offset by North America for Euro
1,311 thousand (0.4%), Europe for Euro 915 thousand (0.4%) and Euro 469 thousand (15.7%) by the
increase in the rest of the world.
NORMALISED NET OF IFRS 16 EFFECTS - Euro thousands 2020
% revenue
from sales
and services
2019
% revenue
from sales
and services
Revenue from sales and services 608,167 100% 687,360 100% (79) -11,5%
Other revenue and income 7,155 6,544 1 9,3%
Total revenue 615,322 693,904 (79) -11,3%
Total operating expense (519,971) -85,5% (583,070) -84,8% 63 10,8%
Gross operating profit 95,351 15,7% 110,834 16,1% (15) -14,0%
Amortisation, depreciation and impairment losses (33,690) -5,5% (32,417) -4,7% (1) -3,9%
Operating profit 61,661 10,1% 78,417 11,4% (17) -21,4%
Net financial expense (29,273) -4,8% (24,728) -3,6% (5) -18,4%
Pre-tax profit 32,388 5,3% 53,689 7,8% (21) -39,7%
Total taxes (9,091) -1,5% (8,305) -1,2% (1) -9,5%
Profit for the year 23,297 3,8% 45,384 6,6% (22) -48,7%
Non-controlling interest 222 0,0% 2,250 0,3% (2) -90,1%
F.I.L.A. Group Profit attributable to the owners of the Parent 23,075 3,8% 43,133 6,3% (20) -46,5%
Change 2020 - 2019

F.I.L.A. Group
17
2020 Revenue from sales and services also includes Fila Arches from March 2020 for Euro 4,856
thousand, while 2019 Revenue from sales and services included revenue from the “Superior” brand for
Euro 5,392 thousand, which was sold in October 2019.
In order to better illustrate F.I.L.A. Group revenue, the table below highlights revenue by strategic
segment compared with the previous year (the School & Office strategic business segment, the Fine
Arts, Hobby & Digital strategic business segment and, to a residual extent, industrial products):
This analysis highlights the impacts of the Covid-19 pandemic and the resulting lockdown and remote
working period, which resulted in a contraction in revenue mainly concerning school and office
products, as their consumption is mainly linked to the physical presence of students at school and of
personnel at their offices.
Other revenue and income of Euro 7,155 thousand increased by Euro 611 thousand on the previous
year, mainly due to lower exchange gains on commercial transactions.
Operating expense in 2020 of Euro 519,971 thousand decreased by Euro 63,099 thousand on 2019, due
to - in addition to the currency effect almost mirroring that of revenue from sales and services- the
decrease in revenue from sales and service and the actions taken by management to contain commercial,
marketing, administrative and personnel overheads. The reduction of personnel overheads was achieved
through the use of accrued holidays, mechanisms similar to furlough and through reducing the
workforce (mainly of temporary workers) where feasible.
Gross Operating Profit was Euro 95,351 thousand, a decrease of Euro 15,483 thousand on 2019 (-
14.0%).
“Amortisation, depreciation and impairment losses” rose by Euro 1,273 thousand, mainly due to higher
amortisation and depreciation resulting from investments.

F.I.L.A. Group
18
“Net financial expense” increased by Euro 4,545 thousand, due solely to greater exchange losses on
financial transactions for approximately Euro 7,756 thousand.
Adjusted “Total taxes” were Euro 9,091 thousand, increasing exclusively due to deferred tax liabilities,
attributable to a release of deferred tax liabilities in 2019 by the US subsidiary following a reduction in
the federal tax rate as a result of the mergers in 2019 between the US companies.
Net of the profit attributable to non-controlling interests, the F.I.L.A. Group normalised profit in 2020
was Euro 23,075 thousand compared to Euro 43,133 thousand in the previous year.
F.I.L.A. Group
19
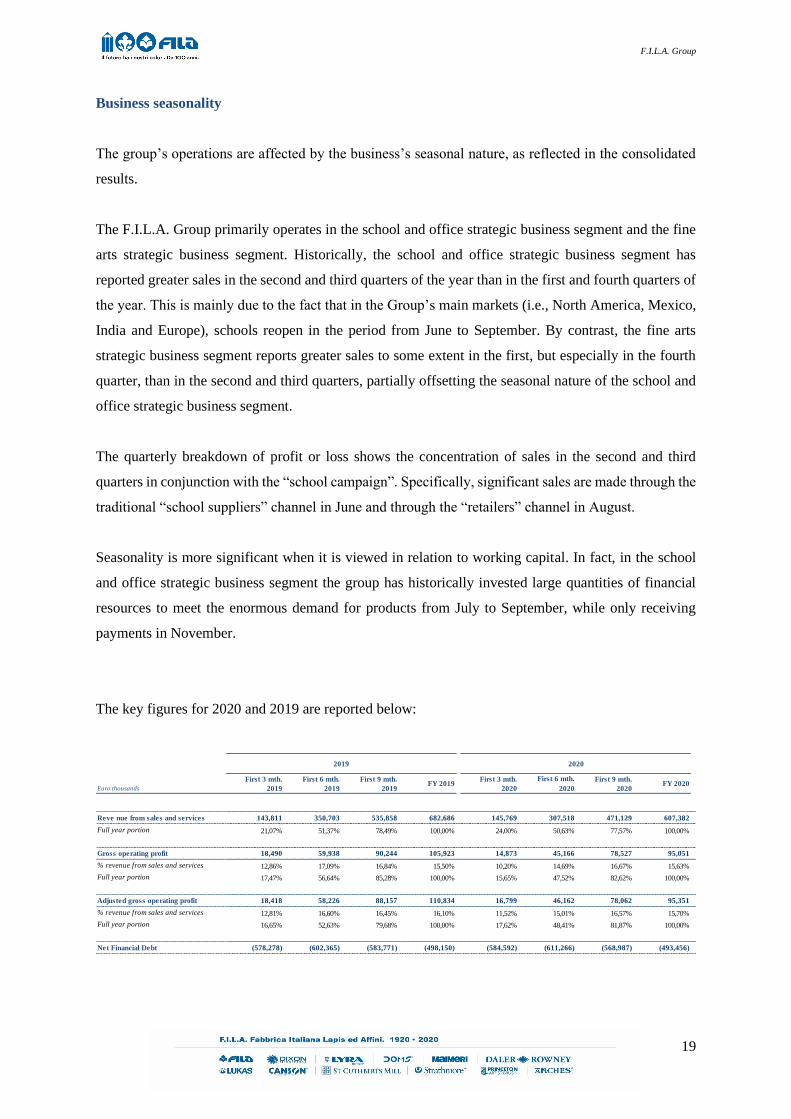
Business seasonality
The group’s operations are affected by the business’s seasonal nature, as reflected in the consolidated
results.
The F.I.L.A. Group primarily operates in the school and office strategic business segment and the fine
arts strategic business segment. Historically, the school and office strategic business segment has
reported greater sales in the second and third quarters of the year than in the first and fourth quarters of
the year. This is mainly due to the fact that in the Group’s main markets (i.e., North America, Mexico,
India and Europe), schools reopen in the period from June to September. By contrast, the fine arts
strategic business segment reports greater sales to some extent in the first, but especially in the fourth
quarter, than in the second and third quarters, partially offsetting the seasonal nature of the school and
office strategic business segment.
The quarterly breakdown of profit or loss shows the concentration of sales in the second and third
quarters in conjunction with the “school campaign”. Specifically, significant sales are made through the
traditional “school suppliers” channel in June and through the “retailers” channel in August.
Seasonality is more significant when it is viewed in relation to working capital. In fact, in the school
and office strategic business segment the group has historically invested large quantities of financial
resources to meet the enormous demand for products from July to September, while only receiving
payments in November.
The key figures for 2020 and 2019 are reported below:
Euro thousands
First 3 mth.
2019
First 6 mth.
2019
First 9 mth.
2019FY 2019
First 3 mth.
2020
First 6 mth.
2020
First 9 mth.
2020FY 2020
Reve nue from sales and services 143,811 350,703 535,858 682,686 145,769 307,518 471,129 607,382
Full year portion 21,07% 51,37% 78,49% 100,00% 24,00% 50,63% 77,57% 100,00%
Gross operating profit 18,490 59,938 90,244 105,923 14,873 45,166 78,527 95,051
% revenue from sales and services 12,86% 17,09% 16,84% 15,50% 10,20% 14,69% 16,67% 15,63%
Full year portion 17,47% 56,64% 85,28% 100,00% 15,65% 47,52% 82,62% 100,00%
Adjusted gross operating profit 18,418 58,226 88,157 110,834 16,799 46,162 78,062 95,351
% revenue from sales and services 12,81% 16,60% 16,45% 16,10% 11,52% 15,01% 16,57% 15,70%
Full year portion 16,65% 52,63% 79,68% 100,00% 17,62% 48,41% 81,87% 100,00%
Net Financial Debt (578,278) (602,365) (583,771) (498,150) (584,592) (611,266) (568,987) (493,456)
2019 2020

F.I.L.A. Group
20
Statement of Financial Position
The F.I.L.A. Group’s financial highlights at December 31, 2020 are as follows.
The F.I.L.A. Group’s net invested capital of Euro 824,731 thousand at December 31, 2020 was
composed of net non-current assets of Euro 611,158 thousand (down by Euro 9,155 thousand on
December 31, 2019), net working capital of Euro 276,582 thousand (down by Euro 18,298 thousand on
December 31, 2019) and other non-current assets/liabilities of Euro 20,242 thousand (up by Euro 1,895
thousand on December 31, 2019), net of provisions of Euro 83,252 thousand (Euro 78,039 thousand at
December 31, 2019).
“Intangible assets” increased on December 31, 2019 by Euro 5,381 thousand, mainly due to the
acquisition of the Arches brand products business unit which generated goodwill of Euro 21,232
thousand, “Brands” of Euro 12,376 thousand and “Customer Relationships” of Euro 10,369 thousand.
The above intangible assets were measured through the Purchase Price Allocation method, carried out
as per the applicable reporting standards. In addition, net investments of Euro 1,817 thousand mainly
carried out by the parent F.I.L.A. S.p.A., of Euro 1,644 thousand for the roll-out of the SAP system
were recognised along with amortisation for the year of Euro 15,311 thousand and net exchange losses
for the year of Euro 25,102 thousand.
“Property, plant and equipment” decreased on December 31, 2019 by Euro 14.524 thousand due to the
decrease of Euro 9,018 thousand in Property, Plant and Equipment and the decrease in rights-of-use
assets of Euro 5,506 thousand.
Net investments in “Property, Plant and Equipment” for the year amounted to Euro 8,932 thousand and
Euro thousands
December 31,
2020
December 31,
2019
Change
2020 - 2019
Intangible assets 435,990 430,609 5,381
Property, plant & equipment 171,489 186,013 (14,524)
Financial assets 3,680 3,690 (10)
Net non-current assets 611,158 620,313 (9,155)
Other Non-Current Assets/ Liabilities 20,242 18,347 1,895
Inventories 256,288 258,409 (2,121)
Trade receivables and other assets 115,929 141,339 (25,410)
Trade payables and other liabilities (100,542) (108,670) 8,128
Other current assets and liabilities 4,908 3,800 1,108
Net working capital 276,582 294,880 (18,298)
Provisions (83,252) (78,039) (5,213)
Net invested capital 824,731 855,501 (30,770)
Equity (331,275) (357,351) 26,076
Net financial debt (493,456) (498,150) 4,694
Net funding sources (824,731) (855,501) 30,770

F.I.L.A. Group
21
were principally undertaken by DOMS Industries Pvt Ltd (India) and Dixon Ticonderoga Company
(U.S.A.), for the extension and development of their local production and logistics plants. There was
also an increase due to the acquisition of the Arches business line for Euro 4,283 thousand. This change
is mainly offset by depreciation of Euro 16,361 thousand and net exchange losses of Euro 5,703
thousand.
“Financial assets” did not change significantly on December 31, 2019 (a decrease of Euro 10 thousand).
The decrease in “Net working capital” of Euro 18,214 thousand relates to the following:
“Inventories” – decline of Euro 2,121 thousand, due mainly to exchange losses of approximately
Euro 17,806 thousand. This decrease was partially offset by the net increase in stock at the F.I.L.A.
Group for approx. Euro 12,835 thousand, particularly in North America and Mexico, mainly due to
the COVID-19 pandemic which resulted in slowdowns in processing orders, in addition to the
impact of the change in the consolidation scope for a total of Euro 2,702 thousand in the year;
“Trade receivables and other assets” – decreasing by Euro 25,410 thousand, mainly due to
improved collections, principally in North America and also due to the contraction of South
American and Indian turnover as a result of the COVID-19 pandemic. Negative currency effects
of Euro 11,358 thousand were also recognised;
Trade payables and other liabilities – decreasing Euro 8,128 thousand, mainly at Grupo F.I.L.A.-
Dixon, S.A. de C.V. (Mexico) and Canson SAS (France), mainly due to lower purchases. The
decrease was amplified by exchange gains of Euro 4,281 thousand, mainly relating to the trade
payables account.
The increase in “Provisions” on December 31, 2019 of Euro 5,213 thousand mainly concerns the:
Increase in “Deferred tax liabilities” of Euro 4,261 thousand, mainly due to the tax effect concerning
“Intangible Assets”, recognised as a result of the acquisition of the Arches business unit for Euro
7,513 thousand. This was offset by positive currency effects of Euro 4,386 thousand;
Decrease in “Provisions for Risks and Charges” of Euro 1,213 thousand, due to utilisations in the
year, mainly by the North American subsidiary;
The increase in “Employee Benefits” of Euro 2,165 thousand, mainly due to the actuarial losses
recognised by Group companies.

F.I.L.A. Group
22
“Equity” attributable to owners of the Parent, amounting to Euro 331,275 thousand, decreased on
December 31, 2019 by Euro 26,076 thousand. Further to the net profit of Euro 8,122 thousand (of which
a negative Euro 485 thousand concerning non-controlling interests), the residual movement mainly
concerned the decrease in the currency reserve of Euro 26,349 thousand and the “Actuarial
Gains/Losses” reserve of Euro 1,086 thousand and the negative movement in the IRS fair value hedge
for Euro 6,009 thousand.
F.I.L.A. Group’s net financial debt at December 31, 2020 was Euro 493,456 thousand, improving Euro
4,694 thousand on December 31, 2019. For greater details, reference should be made to the “Financial
overview” section.

F.I.L.A. Group
23
Financial overview
The Group’s net financial debt at December 31, 2020 and cash flows for the year then ended are
summarised in the following to complete the discussion about its financial position and financial
performance.
The Net Financial Debt at December 31, 2020 was Euro 493,456 thousand:
December 31,
2019
December 31,
2018
Change
2019 - 2018
A Cash 114 135 (21)
B Other cash equivalents 126,991 100,057 26,934
C Securities held for trading - - -
D Cash and cash equivalents ( A + B + C) 127,105 100,192 26,913-
E Current loan assets 622 169 453
F Current bank loans and borrowings (83,757) (79,511) (4,246)
G Current portion of non-current debt (29,658) (15,008) (14,650)
H Other current loans and borrowings (12,636) (8.187) (4,449)
I Current financial debt ( F + G + H ) (126,052) (102,706) (23,346)-
J Net current financial debt (I + E+ D) 1,676 (2,355) 4,021
K Non-current bank loans and borrowings (399,506) (402,546) 3,040
L Bonds issued - - -
M Other non-current loans and borrowings (95,692) (94,328) (1,364)
N Non-current financial debt ( K + L + M ) (495,198) (496,874) 1,675
O Net financial debt (J+N) (493,522) (499,219) 5.697
P Loans issued to third parties 68 1.070 (1.002)
Q Net financial debt (O + P) - F.I.L.A. Group (493,456) (498,150) 4,694
Euro thousands

F.I.L.A. Group
24
Compared to December 31, 2019 (debt of Euro 498,150 thousand), net financial debt decreased by Euro
4,694 thousand, as outlined below in the Statement of Cash Flows:
The net cash flows generated by operating activities of Euro 66,395 thousand (compared to Euro 98,486
thousand in 2019) are due to:
Inflows of Euro 73,560 thousand (Euro 83,180 thousand in 2019) from operating profit,
calculated as the difference of operating costs and revenue from sales and services plus other
operating items, excluding financial items;
Outflows of Euro 7,166 thousand (positive Euro 15,306 thousand in 2019) attributable to
working capital movements, primarily related to the increase in inventories and the decrease in
trade payables and other liabilities, partially offset by the decrease in trade receivables and other
assets.
Euro thousandsDecember 2020 December 2019
Operating profit net of IFRS 16 effect 47,478 57,617
Adjustments for non-cash items net of IFRS 16 effect 34,476 38,222
Income taxes (8,393) (12,659)
Cash Flows from Operating Activities Before Changes in NWC 73,560 83,180
Change in NWC (7,166) 15,306
Change in Inventories (12,835) 6,021
Change in Trade receivables and Other Assets 10,404 11,609
Change in Trade payables and Other Liabilities (1,962) 1,349
Change in Other Current Assets/Liabilities (2,773) (3,672)
Net cash Flows from Operating Activities 66,395 98,486
Investments in Property, Plant and Equipment and Intangible assets (10,175) (19,010)
Interest income 560 -
Net cash Flows used in Investing Activities (9,615) (19,010)
Change in Equity (222) (4,261)
Interest Expense (21,485) (23,821)
Net cash Flows from (used in) Financing Activities (21,706) (28,082)
Other changes (5,521) 2,245
Total Net Cash Flows 29,552 53,640
Effect of exchange losses 21,053 (6,030)
Mark to mark hedging adj (5,196) (8,470)
NFD change due to IFRS16 FTA 2,885 (87,770)
NFD from M&A Transactions (Change in Consolidation Scope) (43,600) 3,242
Change in Net Financial Debt 4,694 (45,390)

F.I.L.A. Group
25
Investing activities used net cash flows of Euro 9,615 thousand (Euro 19,010 thousand in 2019), mainly
due to the use of cash for Euro 10,175 thousand (Euro 19,010 thousand in 2019) for property, plant and
equipment and intangible asset investment, particularly regarding DOMS Industries Pvt Ltd (India),
Dixon Ticonderoga Company (U.S.A.) and F.I.L.A. S.p.A.
Financing activities used net cash flows of Euro 21,706 thousand (Euro 28,082 thousand used in 2019)
due to interest paid on loans and credit lines granted to Group companies, mainly F.I.L.A. S.p.A., Dixon
Ticonderoga Company (U.S.A.) and Grupo F.I.L.A. – Dixon, S.A. de C.V. (Mexico).
Excluding exchange gains from the translation of the net financial positions in currencies other than the
Euro (Euro 21,053 thousand), the Mark-to-Market hedging adjustments of Euro 5,196 thousand and the
negative impact of the application of IFRS 16, ofEuro 2,885 thousand, and the movement generated by
corporate transactions of Euro 43,600 thousand related to the acquisition of the new business unit, the
change in the Group's net financial debt was Euro 4,694 thousand (a Euro 45,390 thousand increase in
debt in 2019).
Changes in cash and cash equivalents are detailed below:
Euro thousandsDecember 2020 December 2019
Opening Cash and Cash Equivalents 85,579 146,831
Cash and cash equivalents 100,191 157,602
Current account overdrafts (14,612) (10,771)
Closing Cash and Cash Equivalents 116,306 85,579
Cash and cash equivalents 127,105 100,191
Current account overdrafts (10,799) (14,612)

F.I.L.A. Group
26
Segment reporting
In terms of segment reporting, the F.I.L.A. Group has adopted IFRS 8.
IFRS 8 requires an entity to base segment reporting on internal reporting, which is regularly reviewed
by the entity’s chief operating decision maker to allocate resources to the various segments and assess
performance.
Geographical segments are the primary basis of analysis and of decision-making by the F.I.L.A.
Group’s management, therefore fully in line with the internal reporting prepared for these purposes.
In particular, the Group’s business is divided into five business segments, each of which is composed
of various geographical segments, i.e. (i) Europe, (ii) North America (USA and Canada), (iii) Central
and South America, (iv) Asia and (v) the Rest of the World, which includes South Africa and Australia.
Each of the five business segments designs, markets, purchases, manufactures and sells products under
known consumer brands in demand amongst end users and used in schools, homes and workplaces.
Product designs are adapted to end users’ preferences in each geographical segment.
The group’s products are similar in terms of quality and production, target market, margins, sales
network and customers, even with reference to the different brands which the group markets.
Accordingly, there is no diversification by segments in consideration of the substantial uniformity of
the risks and benefits relating to the products produced by the F.I.L.A. Group.
The accounting policies applied to segment reporting are in line with those used for the preparation of
the consolidated financial statements.
Business Segment Reporting of the F.I.L.A. Group aggregates companies by geographical segment on
the basis of the “entity location”.
For disclosure on the association between the geographical segments and F.I.L.A. group companies,
reference should be made to the attachments to this report in the “List of companies included in the
consolidation scope and other equity investments” section.
The segment reporting required in accordance with IFRS 8 is presented below.

F.I.L.A. Group
27
Business Segments – Statement of financial position
The group’s key statement of financial position figures broken down by geographical segment at
December 31, 2020 and December 31, 2019, are reported below:
eliminare le maiuscole dale tabelle se non a inizio frase
December 31, 2020
Euro thousands
Intangible Assets 140,829 211,481 1,032 20,751 - 61,897 435,990
Property, plant & equipment 65,009 48,403 21,558 36,030 489 - 171,489
Total non-current assets 205,838 259,884 22,590 56,781 489 61,897 607,479
of which Intercompany (76)0
Inventories 84,282 110,946 36,790 27,194 1,965 (4,889) 256,288
Trade receivables and Other assets 79,310 30,280 36,411 13,845 1,331 (45,248) 115,929
Trade payables and other liabilities (73,702) (36,657) (14,494) (16,751) (3,685) 44,747 (100,542)
Other Current Assets and Liabilities 2,151 2,299 382 76 - - 4,908
Net Working Capital 92,041 106,868 59,089 24,364 (389) (5,390) 276,583
of which Intercompany (11,661) 1,915 2,676 (1,425) 3,104
Net Financial Debt (208,813) (231,068) (41,077) (8,777) (2,481) (1,240) (493,456)
of which Intercompany 140
December 31, 2019
Euro thousands
Intangible Assets 106,092 236,959 1,517 24,904 0 61,137 430,609
Property, plant & equipment 67,576 49,328 26,028 42,839 242 - 186,013
Total non-current assets 173,668 286,287 27,545 67,743 242 61,137 616,622
of which Intercompany (76)0
Inventories 88,746 104,253 36,068 29,814 2,548 (3,020) 258,409
Trade Receivables and other assets 74,994 40,992 55,098 15,420 1,463 (46,628) 141,339
Trade payables and other liabilities (71,699) (34,421) (22,923) (21,434) (3,179) 44,986 (108,670)
Other Current Assets and Liabilities 1,465 2,700 153 (518) - - 3,800
Net Working Capital 93,506 113,524 68,396 23,282 832 (4,662) 294,878
of which Intercompany (10,153) 1,906 3,169 (2,340) 2,756
Net Financial Debt (189,531) (256,843) (42,913) (7,599) (2,185) 921 (498,150)
of which Intercompany 921
F.I.L.A. Group
EuropeNorth
America
Central - South
AmericaAsia
Rest
of the World Consolidation F.I.L.A. Group
EuropeNorth
America
Central & South
AmericaAsia
Rest
of the World Consolidation

F.I.L.A. Group
28
Business Segments – Statement of comprehensive income
The group’s key statement of comprehensive income figures broken down by geographical segment for
the years ended December 31, 2020 and December 31, 2019, are reported below:
Core business revenue→ Revenue
2020
Euro thousands
Core Business Revenue 297,426 322,177 61,105 85,927 3,369 (162,622) 607,382
of which Intercompany (84,940) (12,546) (30,762) (34,217) (158)
Gross operating profit (loss) 36,426 45,704 4,423 10,445 (368) (1.579) 95,051
Operating profit (loss) 18,525 29,632 946 2,721 (1,076) (1,230) 49,518
Net financial income (expense) (11,077) (13,188) (7,127) 1.673 (116) (5,628) (35,231)
of which Intercompany 1,611 (5,372) 156 (2.464) 99
Profit (loss) for the year 7,757 9,838 (5.898) 3,941 (1,035) (6,481) 8,122
Non-controlling interests 314 248 - (1,044) (3) - (485)
Profit attributable to the owners of the Parent 7,445 9,590 (5.898) 4,985 (1,032) (6,481) 8,607
2019
Euro thousands
Core Business Revenue 288,622 323,217 96,868 124,616 3,166 (153,803) 682,686
of which Intercompany (76) (13) (29) (36) (172)
Gross operating profit (loss) 33,586 40,246 12,526 19,658 (947) ,854 105,923
Operating profit (loss) 17,051 25,951 7,779 12,160 (1.096) (1,797) 60,048
Net financial income (expense) 8,951 (10,274) (8,486) (845) (92) (19,533) (30,279)
of which Intercompany (17) (3)
Profit (loss) for the year 21,134 20,048 (990) 8,807 (1,165) (21,729) 26,105
Non-controlling interests 81 - - 2.025 (1) - 2,105
Profit attributable to the owners of the Parent 21,053 20,048 (990) 6,782 (1,164) (21,729) 24,000
F.I.L.A.
Group
EuropeNorth
America
Central - South
AmericaAsia
Rest of the
WorldConsolidation
F.I.L.A.
Group
EuropeNorth
America
Central - South
AmericaAsia
Rest of the
WorldConsolidation

F.I.L.A. Group
29
Business Segments – Other Information
The “Other information”, i.e. the group companies’ property, plant and equipment and intangible assets
broken down by geographical segment for the year ended December 31, 2020 and December 31, 2019,
is reported below:
*Includes initial recognition of Euro 75,164 thousand
Income from the sale of property, plant and equipment during the year amounted to Euro 574
thousand.
December 31, 2020
Euro thousands
Intangible assets 1,766 17 - 34 - 1,817
Property, plant and equipment 2,162 2,395 822 3,380 174 8,932
Right-of-use assets 2,226 8,950 1,332 (627) 326 12,207
Net investments 6,154 11,362 2,154 2,787 500 22,956
December 31, 2019
Euro thousands
Intangible assets 3,688 277 - 76 - 4,041
Property, plant and equipment 3,735 897 2,132 8,182 21 14,968
Right-of-use assets* 19,954 38,487 20,925 14,943 ,166 94,475
Net investments 27,377 39,661 23,057 23,201 187 113,246
F.I.L.A.
Group
EuropeNorth
America
Central - South
AmericaAsia
Rest of the
World
F.I.L.A.
Group
EuropeNorth
America
Central - South
AmericaAsia
Rest of the
World

F.I.L.A. Group
30
Investments
Group investments for the year totalled Euro 10,749 thousand, broken down between “Intangible
Assets” for Euro 1,817 thousand and “Property, Plant and Equipment” for Euro 8,932 thousand,
undertaken both to achieve leaner production and to support sales volume growth.
The main investments in intangible assets concerned F.I.L.A. S.p.A. for the ongoing implementation of
the new ERP system for Euro 1,644 thousand and residually “Concessions, Licenses, Trademarks and
Similar Rights”.
Investments in Land for Euro 112 thousand refer to the Indian subsidiary DOMS Industries Pvt Ltd
which over recent years has acquired lands close to the main production plant in order to extend the
centralised storage and production site.
Investments in “Buildings” amount to Euro 2,125 thousand, mainly incurred by DOMS Industries PVT
Ltd (Euro 1,617 thousand) and are due to the centralised storage and production site extension plan,
whereas capitalisations of work in progress amount to Euro 525 thousand.
Investments in “plant and machinery” of F.I.L.A Group were Euro 4,283 thousand, mainly incurred by
DOMS Industries Pvt Ltd (India) for Euro 2,603 thousand, and Grupo F.I.L.A.-Dixon, S.A. de C.V.
(Mexico) for Euro 602 thousand. In addition, capitalisations of assets under construction were made for
Euro 3,507 thousand.
“Assets under construction” include internal constructions undertaken by the individual companies of
the Group which are not yet operational. The carrying amount at December 31, 2020 was Euro 1,099
thousand, decreasing on the previous year end by Euro 3,342 thousand, mainly due to the transfer to
assets, principally by the US subsidiary Dixon Ticonderoga Company (Euro 1,850 thousand) and by
the French subsidiary Fila Arches (Euro 1,503 thousand).
F.I.L.A. Group
31
Other Information
Management and control
The parent is not considered to be under the management and control of the ultimate parent Pencil
S.p.A. in accordance with Article 2497-bis of the Italian Civil Code.
Treasury shares
At December 31, 2020, the Company did not hold any treasury shares.
Research and development and quality control
Research and development activities are primarily carried out centrally by the Research and
Development Department, as well as at local level, through dedicated teams based at the group’s various
manufacturing facilities, above all in Europe, Central and South America and Asia. The F.I.L.A.
Group’s strong commitment to understanding its customers and designing products that meet their
expectations plays a significant role in the development strategy for its products.
These departments avail of, where necessary, the support of technicians and production staff for the
execution and testing of specific projects.
These operations are performed by expert technicians, who receive ongoing upskilling through targeted
training.
Research and development focuses essentially on the following:
Research and design of new materials and new technical solutions for product and packaging
innovations;
Product quality testing;
Comparative analyses with competitor products in order to improve product efficiency;
Research and design for production process innovation in order to improve efficiency.

F.I.L.A. Group
32
Over recent years, the projects created by the dedicated Research and Development team have led to
the creation of innovative products, such as new formulas for modelling clay, new plastic materials,
new designs for paint and watercolour boxes, new industrial segment products and the polymer
(“woodfree”) pencil. The team, in order to guarantee compliance with physical and chemical
specification rules, constantly monitors the development of product regulations (such as, for example
purposes, those concerning the use of preservatives), amending the formulas or developing new
formulas for altered products.
The Quality Control department is tasked with ensuring compliance with the F.I.L.A. Group’s policies
regarding the safety and quality standards for its products, suppliers and production procedures.
The F.I.L.A. Group’s quality control process consists of two phases:
statistical control, consisting of various tests performed at its internal laboratories for the
analysis of materials and finished products. Its internal laboratories are also used to test its
products in the research and development phase with the aim, inter alia, of assessing industrial
product feasibility;
the “control” process, which consists of various tests conducted on an ongoing and/or random
basis throughout the stages of the production process by its production personnel. Visual and
instrumental controls are performed directly at its facilities by machine technicians. Such tests
are performed in addition to the technical tests required by national and international standards
and/or the customer’s specifications.
Research and development and quality control costs are broken down in the following table, indicating
also the dedicated teams by geographical segment:
Quality Assurance → Quality Control
Euro thousands
Geographical segment Workers Personnel
expense
Other
related
Costs
Workers Personnel
expense
Other
related
Costs
Europe 24 1,037 13 16 724 465
North America - - - 3 249 52
Central-South America 21 247 71 25 173 60
Asia 24 280 45 89 331 71
Total 69 1,563 129 133 1,476 647
R&D Quality Assurance
F.I.L.A. Group
33
Related party transactions
For the procedures adopted in relation to transactions with related parties, also in accordance with
Article 2391-bis of the Italian Civil Code, reference should be made to the procedure adopted by the
Parent pursuant to the Regulation approved by Consob with Regulation No. 17221 of March 12, 2010
and subsequent amendments, published on the parent’s website www.filagroup.it in the “Governance”
section.
Reference should be made to the Related Party Transactions section of the Notes to the Consolidated
Financial Statements of the F.I.L.A. Group

F.I.L.A. Group
34
Significant events in the year
On March 2, 2020, F.I.L.A.- Arches S.A.S., a French company wholly-owned by F.I.L.A.,
completed the purchase of the fine arts business unit specialised in fine arts operating through
the ARCHES® brand, until then managed by the Ahlstrom-Munksjö Group, finalising the non-
binding memorandum of understanding signed on October 30, 2019 between F.I.L.A. S.p.A.
and Ahlstrom-Munksjö Oyj and its French subsidiary, Ahlstrom-Munksjö Arches.
For over 500 years, the ARCHES® brand has been one of the best-known global brands in the
production and distribution of premium fine arts paper. The company creates its products using
a particular “cylinder mould” technique which ensures the delivery of a highly crafted product
and an inimitable natural appearance. Each production cycle is subject to numerous technical
controls, which have always guaranteed the undisputed quality of the paper and its excellent
brand reputation.
The total price, on a debt-free cash-free basis, paid by F.I.L.A. - Arches S.A.S. for the business
unit was Euro 43.6 million. The acquisition was financed by amending the current
medium/long-term loan contract entered into by the Parent, F.I.L.A. S.p.A., through the
granting of new lines for Euro 15 million and the partial use of the RCF line for Euro 25 million,
through its conversion into a medium/long-term line.
COVID-19 impacts
Since January 2020, on the Chinese market - and gradually from March 2020 across the rest of
the world - the operating environment has been dominated by the spread of Covid-19
(“Coronavirus”) and the resulting restrictive containment measures implemented by the public
authorities of the countries affected. The current health emergency, in addition to the enormous
social impacts, is having direct and indirect repercussions on the general economy and on the
propensity to consume and invest, resulting in general uncertainty. The F.I.L.A. Group
monitored the development of the situation in order to mitigate its social impacts and
repercussions on workplace health and safety, and in the group’s financial position and results
of operations, by drawing up and rolling out flexible and timely action plans. In particular, from
the beginning of the pandemic the F.I.L.A. Group has worked tirelessly to ensure maximum
health and safety levels for its employees, customers and suppliers. The group promptly
introduced a series of protective measures for personnel, activating its Crisis Response
Protocol, developing a specific crisis response plan and immediately rolled out a series of
measures at all levels of the organisation - both at headquarters and overseas - at the operating
sites and at the production plant. As a consequence of the Coronavirus related lockdown the
following facilities were temporarily closed: the Yixing facility from February 4 until February

F.I.L.A. Group
35
21, the Kunshan facility from February 4 until February 28, the Indian facilities from March 22
until May 3, the Italian F.I.L.A. S.p.A. facilities from March 23 to April 10, the facilities of
Industria Maimeri from March 16 to April 30, the Dominican Republic facilities from March
23 to April 3 and those in Mexico from April 6 to April 17. At the reporting date, the group's
plants are all up and running again, in accordance with the regulations in each country, although
not all of them at full capacity in view of local market demand. With the exception of India,
where production and commercial activity was totally blocked for the entire month of April,
and, to a more limited extent, for the Chinese branches and Industria Maimeri, shipments to
customers never stopped, although sometimes limited by logistical inefficiencies emerging
during the lockdown period. The majority of the group companies updated their internal
procedures to guarantee a safe workplace so as to mitigate any infection risk, alternating, where
possible, the physical presence of workers with remote working. All subsidiaries introduced all
of the social security and corrective measures available to offset the drop in activity, such as
containing all fixed costs related to non-strategic activities in 2020 and a deferment to 2021 of
all non-strategic investments for the current year. Public aid has principally taken the form of
social security schemes to contain personnel expense (mainly in Italy, under the COVID
furlough, France, Germany, USA and UK), while there are no significant outright grants. The
impact on the business were mainly due to a decrease in sales on the Chinese market in February
and part of March and progressively from the second half of March in the rest of the world (for
example, the total shutdown of the Indian market in April), with the exception of online sales
and Large Scale Retail sector and Organised distribution, where this impact was minimal as
these sales channels have stayed operational during the lockdown.
The partial reopening of schools in Europe and North America from the third quarter onwards,
although not always attended physically and with a certain slowdown in the fourth quarter due
to the worsening of the pandemic, enabled a partial recovery in revenue from products used by
school-age children , which did not happen in India and Mexico with schools remaining closed.
Conversely, the Fine Arts business unit revenue has continued to consistently and significantly
grow over the previous year.
With regard to potential financial stress scenarios, management has monitored and continues
to monitor both the group’s current and forecast liquidity. In April 2020, the first significant
impacts on collection directly related to the worldwide spread of the Coronavirus became
apparent. The group has since introduced a strict customer selection and receivables collection
policy which allowed to limit financial difficulties to a minimum. In terms of suppliers, focus
has been placed on identifying alternative sources of procurement in the case of any critical
logistical or financial situations. No significant criticalities have emerged to date, despite
generally rising prices combined, in some cases, with supply shortages. No significant

F.I.L.A. Group
36
renegotiation of existing contracts with customers and suppliers is reported. This has allowed
the F.I.L.A. Group to strongly generate cash in such a difficult year. Available cash and cash
equivalents are adequate to cover current and future operating needs. In particular, against
financial liabilities due in 2021 of Euro 27.4 million, the F.I.L.A. Group, in addition to
operating cash generation, has available cash of over Euro 100 million and undrawn credit lines
of approx. Euro 140 million. The medium/long-term debt of nominal Euro 436 million is
mainly based on a bullet repayment plan (Euro 113.8 million in 2023 and Euro 253.8 million
in 2024), with that subject to interest settled through increasing instalments until its maturity in
2023. In addition, following the negotiation with the lending banks of the structured debt, no
default will be linked to any failure to comply with the financial covenants relating to the June
2020 and December 2020 tests (“holiday covenants”), while the margin to determine the
interest will continue to be calculated based on the leverage from the financial statements as at
and for the year ended December 31, 2019 (if dividends had not been distributed to shareholders
of FI.L.A. S.p.A. during the second half of 2020). At December 31, 2020, the financial covenant
was 3.92, compared to a contractual value of 3.90.
To date, COVID-19 has only slowed down the Group’s development plans and strategy,
without halting or structurally changing them .

F.I.L.A. Group
37
Subsequent events
As regards the lockdown following the Coronavirus pandemic, at the date of this report, the group's
plant are operational, in accordance with the regulations in each country, though not at full capacity in
order to protect workers’ safety, in particular in India and Mexico.
On March 16, 2021, the liquidation of the non-operative subsidiary in the United Kingdom, CastleHill
Crafts Ltd, was concluded.
Outlook
The first half of 2021 will still be affected by the instability resulting from the outbreak of the
Coronavirus, which was disclosed in the “Significant events in the year” section. A complete reopening
of schools is expected only from the middle of the second quarter of 2021, with the resulting forecast
recovery of “Schools" products, particularly due to the partial recovery of sales in India and Mexico,
and the continued growth of "Fine Arts" products, although to a reduced extent than forecast due to the
exceptional conditions in 2020. On the basis of these assumptions, a partial and gradual recovery of
fixed costs and production and operating and IT investments linked to the upgrade of the Group's IT
systems is expected. The group's margins are therefore forecast to significantly recover in 2021, both
in absolute and percentage terms, and cash generation is also expected to improve considerably,
returning to normal levels thanks to stronger earnings and Management’s close focus on working capital
management.
The F.I.L.A. Group continues to monitor the development of the situation in order to mitigate its social
impacts and repercussions on the workplace health and safety, and in the group’s financial position and
results of operations, by drawing up and rolling out flexible and timely action plans.
Going Concern
The Directors reasonably expect that F.I.L.A. S.p.A. will continue operations into the foreseeable future
and have prepared the consolidated financial statements for the Group and the separate financial
statements of F.I.L.A. S.p.A. on a going concern basis and in line with the long-term business plan,
which forecasts improving results.

F.I.L.A. Group
38
Risk Management
The main F.I.L.A. Group financial instruments include financial assets such as current accounts and on
demand deposits, loans and short and long-term bank loans and borrowings. The objective is to finance
the recurring and non-recurring transactions of the F.I.L.A. Group.
In addition, the F.I.L.A. Group has in place trade receivables and payables arising from its core business.
The management of funding needs and the relative risks is undertaken by the individual F.I.L.A. Group
companies on the basis of the guidelines drawn up by the CFO of the Parent F.I.L.A. S.p.A. and
approved by the Chief Executive Officer.
The principal objective of these guidelines is the ability to ensure a balanced equity structure in order
to maintain a solid capital base.
The main funding instruments used by the F.I.L.A. Group are:
Medium/long-term loans, in order to fund capital expenditure (principally the acquisition of
controlling investments and plant and machinery) and working capital;
Short-term loans and customer advances.
The average borrowing costs were in line with the Euribor/Libor at 3 and 6 months, with the addition
of a spread which depends on the type of financial instrument used.
Loans issued in favour of subsidiaries may be accompanied by guarantees such as sureties and patronage
letters issued by the Parent F.I.L.A. S.p.A..
Loans obtained by the Parent provide for financial “covenants”. In relation to the latter reference should
be made to: “Note 13 - Financial Liabilities” of the Notes to the Consolidated Financial Statements.

F.I.L.A. Group
39
The main financial risks, identified and managed by the F.I.L.A. Group are the following:
Market risks
Risk may be broken down into two categories:
Currency risk
The currency used for the F.I.LA. Group consolidated financial statements is the Euro. However, the
F.I.LA. group undertakes and will continue to undertake transactions in currencies other than the Euro,
particularly as the geographic distribution of the various Group industrial activities differs from the
location of the group’s markets, with an exposure therefore to exchange rate fluctuation risk. For this
reason, the operating results of the F.I.L.A. Group may be impacted by currency movements, both as a
result of the conversion into Euro on consolidation and changes in the exchange rates on trade payables
and receivables in currencies other than the functional currency of the various F.I.L.A. Group
companies.
In addition, in limited cases, where financially beneficial or where local market conditions require such,
the company may undertake debt or use funds in currencies other than the functional currency. The
change in the exchange rate may result in the realisation or the recording of exchange gains and losses.
The F.I.LA. Group is exposed to risks deriving from exchange rate fluctuations, which may impact on
the profit or loss for the year and on equity.
The main exchange rates to which all F.I.L.A. Group companies are exposed concern the individual
local currencies and:
the Euro as the consolidation currency;
the US Dollar, as the base currency for international trade.
The Group has decided not to use derivative financial instruments to offset currency risk arising from
commercial transactions within a prospective twelve month period (or also subsequently, where
considered beneficial according to the business’s characteristics).
The F.I.LA. Group incurs part of its costs and realises part of its revenues in currencies other than the
Euro and, in particular, in US Dollars, Mexican Pesos and British Sterling.
The F.I.LA. Group generally uses natural hedging to protect against this risk through the offsetting of
costs and revenue in the same currency, in addition to acquiring funding in the local currency.

F.I.L.A. Group
40
The policy adopted by the Group is considered adequate to contain currency risk. However, it must be
considered that in the future currently unpredictable movements in the Euro may impact the economic,
financial and equity position of the Group companies, in addition to the comparability between
reporting years.
Also in relation to the commercial activities, the companies of the Group may hold trade receivables or
payables in currencies other than the functional currency of the entity. This is appropriately monitored
by the F.I.L.A. Group, both in relation to the potential economic impact and in terms of financial and
liquidity risk.
A number of F.I.L.A. Group subsidiaries are based in countries not within the Eurozone, in particular
the United States, Canada, Australia, Mexico, the United Kingdom, Scandinavia, China, Argentina
(hyper-inflationary economy), Chile, Brazil, Indonesia, South Africa, Russia and India. As the Group’s
functional currency is the Euro, the statements of comprehensive income of these companies are
converted into Euro at the average exchange rate for the year and, at unchanged revenue and margins
in the local currency, changes in the exchange rate may result in effects on the value in Euro of revenue,
expense and results recognised in the consolidation phase directly in equity under “Translation
Differences” (See Note 12).
In 2020, the nature and the structure of the currency risk exposures and the Group’s monitoring policies
did not change substantially compared to the previous year.
Liquidity risk
The liquidity risk to which the F.I.L.A. Group is exposed may arise from an incapacity or difficulty to
source, at beneficial conditions, the financing necessary to support operations in an appropriate
timeframe.
The cash flows, financing requirements and the liquidity of the Group companies are constantly
monitored centrally in order to ensure the efficient management of financial resources.
The above-stated risks are monitored according to internal procedures and periodic commercial and
financial reporting, which allows management to assess and offset any impacts from these risks through
appropriate and timely policies.
The Group continually monitors financial risks in order to offset any impacts and undertake appropriate
corrective actions.
It has adopted at the same time the following policies and processes aimed at optimising the
management of financial resources, reducing the liquidity risk:

F.I.L.A. Group
41
Maintenance of an adequate level of liquidity;
Diversification of funding instruments and a continual and active presence on the capital
markets;
Obtaining of adequate credit lines;
Monitoring of the liquidity position, in relation to business planning.
Financial transactions are carried out with leading highly rated Italian and international institutions.
Management believes that the funds and credit lines currently available, in addition to those that will
be generated by operating and financial activities, will permit the Group to satisfy its requirements
deriving from investing activities, working capital management and the repayment of debt in
accordance with their maturities.
The capacity to generate liquidity through operations enables the Group to reduce liquidity risk to a
minimum, which concerns the difficulty in sourcing funding to ensure the on time discharge of financial
liabilities.
For details n of financial liabilities due dates, reference should be made to Note 13 “Financial
Liabilities”.
Interest rate risk
The F.I.L.A. Group companies utilise external funding in the form of debt and use the liquidity available
in financial assets. Changes in the market interest rates impact on the cost and return of the various
forms of loans, with an effect on the net financial expense of the Group.
The Parent F.I.L.A. S.p.A. issues loans almost exclusively to Group companies, drawing on directly on
own funds.
Bank debt exposes the F.I.L.A. Group to interest rate risk. In particular, variable rate loans result in
cash flow risk.
The F.I.L.A. Group chose to hedge the interest rate on the strategic loans issued to F.I.L.A. S.p.A.,
Dixon Ticonderoga Company (U.S.A.) and Canson SAS (France) through derivative hedges (Interest
Rate Swaps) recognised as per IAS 39 concerning hedge accounting.

F.I.L.A. Group
42
Credit Risk
The credit risk represents the exposure to potential losses following the non-fulfilment of obligations
by counterparties.
The maximum theoretical exposure to the credit risk for the Group at December 31, 2020 is the carrying
amount of the trade receivables recognised in the financial statements, and the nominal amount of the
guarantees given on liabilities and commitments to third parties.
The F.I.L.A. Group strives to reduce the risk relating to the insolvency of its customers through rules
which ensure that sales are made to customers who are reliable and solvent. These rules, based on
available solvency information and considering historical data, linked to exposure limits by individual
customer, in addition to insurance coverage for overseas clients (at Group level), ensure a good level of
credit control and therefore minimise the related risk.
According to the F.I.L.A. Group policy, customers that request extensions of payment are subject to a
credit rate check. In addition, the maturity of trade receivables is monitored on an ongoing basis
throughout the year in order to anticipate and promptly intervene on credit positions which present
greater risk levels.
The credit risk is therefore offset by the fact that the credit concentration is low, with receivables divided
among a large number of counterparties and clients.
The individual positions are impaired, if individually significant, with an allowance which reflects the
partial or total non-recovery of the receivable. The amount of the impairment loss takes into account
the estimate of the recoverable cash flows and the relative date of collection, charges and future recovery
costs, in addition to the fair value of guarantees. Against the receivables which are not individually
impaired, an individual and general provision is made, taking into account historical experience and
statistical data, applying an expected credit loss approach.
As previously illustrated, the principal F.I.L.A. Group financial instruments include financial assets
such as current accounts and on demand deposits, loans and short and long-term bank loans and
borrowings. The objective is to finance the operating and non-recurring activities of the F.I.L.A. Group.
In addition, the F.I.L.A. Group has in place trade receivables and payables arising from its core business.

F.I.L.A. Group
43
Disclosure in accordance with IFRS 7
The table below reports the carrying amounts for each category identified by IFRS 9, as required by
IFRS 7. This carrying amount generally coincides with the amortised cost of financial assets and
liabilities, with the exception of derivative instruments at fair value. For the fair value, reference should
be made to the notes.
Financial liabilities at amortized cost refer mainly to the loan contracted by F.I.L.A. S.p.A. and Dixon
Ticonderoga Company (U.S.A.) on June 4, 2018 for the acquisition of Pacon Holding and the loan taken
out by the parent F.I.L.A. S.p.A. for the acquisition of the Arches brand products business line. These
loans were agreed by the two companies with a banking syndicate consisting of UniCredit S.p.A. as
global coordinator, Banca IMI S.p.A., Mediobanca Banca di Credito Finanziario S.p.A., Banca
Nazionale del Lavoro and Banco BPM S.p.A. as mandated lead arrangers and UniCredit Bank AG as
security agent.
Euro thousands
December 31, 2020
Assets and liabilities
measurement at
FVOCI
Amortised cost Total
Non-current financial assets
Non-current financial assets Note 3 2,614 2,614 2,614
Current financial assets
Current financial assets Note 3 622 622 622
Trade and Other Assets Note 9 115,929 115,929 115,929
Cash and Cash Equivalents Note 10 127,105 127,105 127,105
Non current financial liabilities
Non current financial liabilities Note 13 (476,432) (476,432) (476,432)
Financial Instruments Note 17 (18,767) (18,767) (18,767)
Current financial libilities
Current financial libilities Note 13 (126,052) (126,052) (126,052)
Trade payables and Other Liabilities Note 19 (100,542) (100,542) (100,542)
Euro thousands
December 31, 2019
Assets and liabilities
measurement at
FVOCI
Amortised cost Total
Non-current financial assets
Non-current financial assets Note 3 3,783 3,783 3,783
Current financial assets
Current financial assets Note 3 169 169 169
Trade and Other Assets Note 9 141,339 141,339 141,339
Cash and Cash Equivalents Note 10 100,191 100,191 100,191
Non current financial liabilities
Non current financial liabilities Note 13 (483,303) (483,303) (483,303)
Financial Instruments Note 17 (13,571) (13,571) (13,571)
Current financial libilities
Current financial liabilities Note 13 (102,706) (102,706) (102,706)
Trade payables and Other Liabilities Note 19 (108,670) (108,670) (108,670)

F.I.L.A. Group
44
The amounts of each facility and the revolving credit facility at the date of disbursement of the loan are
detailed below:
manca traduzione dell’asterisco in nota
Facility A (Euro 121,036 thousand) and Facility A2 (Euro 4,687 thousand) lines stipulate a residual
repayment plan consisting of 10 half-yearly instalments, of which 4 instalments classified as short-term,
as they are due on June 4, 2021 and December 6, 2021, Facility B (Euro 240,069 thousand) and Facility
B2 (Euro 8,750 thousand) and Facility C (Euro 25,000 thousand) and Facility C2 (Euro 893 thousand)
lines are Bullet loans, with single repayment due respectively on June 4, 2024 and June 4, 2023.
The Revolving Credit Facility stipulates the issue of short-term tranches of 1, 3 or 6 months, for a
maximum amount of Euro 50,000 thousand, currently used for Euro 25,000 thousand.
F.I.L.A. S.p.A., Dixon Ticonderoga Company (U.S.A) and Canson SAS (France) entered into derivative
hedges against changes in the interest rates of the structured loans contracted. The Interest Rate Swaps,
with fixed rate payments against variable payments, qualified as hedging derivatives and were
considered as per the hedge accounting provisions of IAS 39. Their fair value at December 31, 2020
amounts to Euro 18,767 thousand, with the negative fair value adjustment recognised as an equity
reserve.
In accordance with IFRS 7, the effects on the consolidated financial statements in relation to each
category of financial instruments of the Group in the years 2020 and 2019 are shown below, which
mainly includes the gains and losses deriving from the purchase and sale of financial assets or liabilities,
as well as the changes in the value of the financial instruments measured at fair value and the interest
expense/income matured on the financial assets/liabilities measured at amortised cost.
Euro thousands
Principal
F.I.L.A.
S.p.A.
Principal
Dixon Ticonderoga
Company (U.S.A.)
Total
Facility A 61,875 59,161 121,036
Facility A2 4,687 - 4,687
Facility B 90,000 150,069 240,069
Facility B2 8,750 - 8,750
Facility C 25,000 - 25,000
Facility C2 893 - 893
RCF 25,000 - 25,000
Total 216,205 209,230 425,435
Note 13.C - BANK LOANS AND BORROWINGS: BREAKDOWN

F.I.L.A. Group
45
Financial gains and losses are recognised in profit or loss:
Non-current loans are broken down below; the F.I.L.A. Group financial statement classification is based
on the settlement time criterion, as expressed by the contracts underlying each liability.
For greater detail on the breakdown of financial liabilities, reference should be made to Note 13.A –
“Financial Liabilities” of the notes to the consolidated financial statements.
Other loans and borrowings include the non-current portion of loans issued by other financial backers.
The total balance at December 31, 2020 was Euro 476,432 thousand, of which Euro 399,506 thousand
concerning bank loans and borrowings, Euro 296 thousand other loans and borrowings and Euro 18,767
thousand concerning the Interest Rate Swaps undertaken by F.I.LA. S.p.A., Dixon Ticonderoga
Euro thousands2020 2019
Interest income from bank deposits 114 182
Total financial income 114 182
Financial assets and liabilities at amortised cost* (8,631) (10,950)
Net exchange gains/(losses) on financial transactions (5,890) 1,865
Total financial expense (14,522) (9,085)
Total net financial expense (14,408) (8,903)
*Interest on the only structured loan signed in 2018 by F.I.L.A. S.p.A. and Dixon Ticonderoga (U.S.A.)
Euro thousandsDecember 31, 2020 December 31, 2019
Non-current financial liabilities 495,199 496,874
Bank loans and borrowings - Principal third parties 405,674 408,140
Bank loans and borrowings - Interest third parties (6,168) (5,594)
Banks 399,506 402,546
Bank loans and borrowings - Principal third parties 298 420
Bank loans and borrowings - Interest third parties (2) (23)
Other loans and borrowings 296 397
IFRS 16 - Principal third parties 76,630 80.360
IFRS 16 76,630 80.360
Loans and borrowings - due after one year 476,432 483,303
Financial Instruments - Principal 18,767 13,571
Financial Instruments 18,767 13,571

F.I.L.A. Group
46
(U.S.A.) and Canson SAS (France).
The balance at December 31, 2020 was Euro 126,052 thousand, of which Euro 102,529 thousand
concerning bank loans and borrowings, Euro 4.381 thousand concerning other loans and borrowings
and Euro 10,887 thousand of current account overdrafts.
Trade receivables and other assets at December 31, 2020 were as follows:
Trade payables and other liabilities at December 31, 2020 were as follows:
In relation to Trade payables and other liabilities and Trade receivables and other assets, reference
should be made to Note 9.A – “Trade receivables and other assets” and Note 19 – “Trade payables and
Euro thousandsDecember 31, 2020 December 31, 2019
Current financial liabilities 126,052 102,706
Bank loans and borrowings - Principal third parties 101,609 78,419
Bank loans and borrowings - Interest third parties 920 1,344
Banks 102,529 79,763
Bank loans and borrowings - Principal third parties 4,320 785
Bank loans and borrowings - Interest third parties 61 (8)
Other loans and borrowings 4,381 777
Current account Overdrafts - Principal third parties 10,799 14,612
Current account Overdrafts - Interest third parties 88 144
Current account overdrafts 10,887 14,756
IFRS 16 - Principal third parties 8,255 7,410
IFRS 16 8,255 7,410
Loans and borrowings - due within one year 126,052 102,706
Euro thousands
December 31,
2020
December 31,
2019Change
Trade receivables 102,155 126,094 (23,939)
Tax assets 2,420 3,005 (,585)
Other assets 7,470 7,317 ,153
Prepayments and accrued income 3,884 4,923 (1,039)
Total 115,929 141,339 (25,410)
Euro thousands
December 31,
2020
December 31,
2019Change
Trade payables 68,418 76,197 (7,779)
Tax liabilities 8,631 9,735 (1,104)
Other liabilities 22,726 21,670 1,056
Accrued expenses & def.income 767 1,068 (301)
Total 100,542 108,670 (8,128)

F.I.L.A. Group
47
other liabilities”.
In relation to the financial instruments recognised in the Statement of Financial Position at fair value,
IFRS 7 requires that these values are classified based on the hierarchy levels which reflects the
significance of the input used in the determination of fair value.
See the specific notes to the consolidated financial statements for the classification of financial
instruments according to the levels of the fair value hierarchy.
Sensitivity Analysis
In accordance with IFRS 7 and further to that outlined in the “Directors’ Report – Financial Risks”, the
following is reported:
Currency risk
Net exposure for the main currencies for translation risk only:
Closing exchange rates applied:
Effect of a 10% increase against the Euro:
(in Euro thousands) USD MXN CNY USD MXN CNY
Trade receivables 19,596 677,433 3,713 29,970 867,734 5,052
Financial assets 741 7,149 3,826 1.755 6.795 1.961
Financial liabilities (253,710) (830,704) - (270,878) (775,342) (2,987)
Trade payables (22,982) (72,218) (16,435) (22,813) (153,218) (27,883)
Total (256,356) (218,340) (8,896) (261,966) (54,030) (23,857)
December 31, 2020 December 31, 2019
CurrencyDecember 31, 2020 December 31, 2019
USD /€ 1.227 1.123
MXN /€ 24.416 21.220
CNY /€ 8.023 7.821
Closing exchange rate

F.I.L.A. Group
48
The impact on the statement of financial position, following an increase of 10% in the exchange rate of
the main foreign currencies against the Euro, would be negative for Euro 19,906 thousand (Euro 21,708
thousand at December 31, 2019).
Interest rate risk
The current F.I.L.A. Group policy is to maintain variable interest rates, monitoring the interest rate
curve.
Financial liabilities at variable rates are reported below:
The financial instruments at variable rates typically include liquidity, loans granted to a number of
Group companies and part of the financial liabilities.
controllare formattazione
A change of 100 basis points in the interest rates applicable to financial liabilities at variable rates in
CurrencyDecember 31, 2020 December 31, 2019
USD /€ (18,992) (21,199)
MXN /€ (813) (231)
CNY /€ (101) (277)
Total (19,906) (21,708)
Changes in equity
Euro thousandsDecember 31, 2020 December 31, 2019
Financial liabilities 621,250 599,580
Financial assets/liabilities at variable rate 621,250 599,580

F.I.L.A. Group
49
place at December 31, 2020 would result in the following financial statements impacts on annualised
basis:
The same variables were maintained to establish the financial statements impact at December 31, 2020.
The capital portions of financial assets and liabilities of the F.I.L.A. Group are broken down by
contractual maturity for 2020 and 2019, in line with “Note 13.A – Financial Liabilities”:
Credit Risk
Euro thousands
+ 100 bps - 100 bps
December 31, 2020
Financial assets/liabilities at variable rate 6,213 (6,213)
December 31, 2019
Financial assets/liabilities at variable rate 5,996 (5,996)
Equity
December 31, 2020
Euro thousands
Within
12 months
Within
1-2 years
Within
2-3 years
Within
3-4 years
Within
4-5 yearsTotal
Financial assets
Cash and cash equivalents 127,105 - - - - 127,105
Loans and receivables 622 - - - 68 622
Financial liabilities
Bank loans and borrowings(1)
113,416 39,813 112,492 246,128 1,072 512,922
Other loans and borrowings 4,381 255 41 - - 4,677
Expected cash flows 9,930 (40,068) (112,534) (246,128) (1,004) (389,804)
December 31, 2019
Euro thousands
Within
12 months
Within
1-2 years
Within
2-3 years
Within
3-4 years
Within
4-5 yearsTotal
Financial assets
Cash and cash equivalents 100,191 - - - - 100,191
Loans and receivables 169 - - - 1.070 1.239
Financial liabilities
Bank loans and borrowings 94,519 54,075 59,497 94,734 194,240 497,065
Other loans and borrowings 776 305 51 29 12 1,173
Expected cash flows 5,065 (54,380) (59,549) (94,763) (193,182) (396,808)
(1) The principal portion of the bank loans amounts to Euro 491,471 thousand euro, the medium-long term part has been adjusted considering an
amortised cost of Euro 5,594 thousand. The carrying amount is Euro 497,065 thousand.
(1) TThe principal portion of the bank loans amounts to Euro 506,754 thousand euro, the medium-long term part has been adjusted considering an
amortised cost of Euro 6,168 thousand. The carrying amount is Euro 512,922 thousand.

F.I.L.A. Group
50
Credit risk may be defined as the possibility of incurring a financial loss due to the breach of a
contractual obligation by a counterparty.
At December 31, 2020, Trade receivables and other assets totalling Euro 115,929 thousand (Euro
141,339 thousand at December 31, 2019) are reported net of the related loss allowance of Euro 5,637
thousand (Euro 5,945 thousand at December 31, 2019).
The aging of trade receivables at December 31, 2020 (Euro 102,155 thousand), net of the loss
allowance, compared with December 31, 2019 is reported below: attenzione, qui si parla di netto, nella
tabella invece lordo
The loss allowance was Euro 5,637 thousand at December 31, 2020 (Euro 5,945 thousand at December
31, 2019), amounting to 5.2% of total receivables (4.3% at December 31, 2019).
Trade receivables classified by type of creditor are also presented below:
Euro thousandsDecember 31, 2020 December 31, 2019 Change
Not yet due 55,671 95,452 (39,781)
Overdue from 0-60 days 22,067 18,959 3,108
Overdue from 60-120 days 16,621 8,582 8.039
Overdue more than 120 days 7,796 7,532 ,264
Total 102,155 126,095 (28,370)
GROSS TRADE RECEIVABLES - AGEING
Euro thousands December 31, 2020 December 31, 2019 Change
Wholesalers 36,886 45,531 (8,645)
School/Office Suppliers 10,105 12,473 (2.368)
Supermarkets 26,942 33,256 (6,314)
Retailers 20,731 25,589 (4,858)
Distributors 5,029 6,208 (1.179)
Promotional & B2B 1,154 1,425 (271)
Other 1,308 1,614 (306)
Total 102,155 126,095 (23,939)
TRADE RECEIVABLES - DISTRIBUTION CHANNEL

F.I.L.A. Group
51
In conclusion, the breakdown of trade receivables by geographical segment is presented below:
Environment and Safety
“Environment and Safety” issues are managed at local level by the F.I.L.A. Group companies under the
applicable regulations and in accordance with the “Group policy”.
Within the F.I.L.A. Group a manager-in-charge of “Environment and Safety” is appointed by each local
entity, reporting to the respective CEO, who in turn report to the Parent F.I.L.A. S.p.A..
“Environment and Safety” for F.I.L.A. S.p.A. has been managed with the support of a specialised
consultancy firm for a number of years. The actions implemented by the Parent F.I.L.A. S.p.A. are in
line with the environmental and workplace safety regulation (Legislative Decree Nos. 626 and No. 81
of April 9, 2008). Waste is appropriately disposed of and its movement is properly recognised in
approved registers.
The Parent, F.I.L.A. S.p.A., is certified according to ISO 14001:2015 on environmental management
and British Standard ISO 45001:2018 “Occupational Health and Safety Assessment Series” for its
Occupational Health and Safety Management System. During the process of managing and improving
its own Occupational Health and Safety Management System, and based on the ISO 45001:2018
standards, the Parent identified and defined, under the scope of its Occupational Health and Safety
Management System, the following processes which it monitors regularly:
definition of health and safety policies
risk factors and legislative compliance
assessment and significance of the implications of the risk factors
definitions of targets and objectives
review of the governance and the Occupational Safety Programme
Canson France is also BS OHAS 18001 certified for its Occupational Health and Safety Management
System and ISO 14001:2015 certified in environmental management.
During the year no significant problems emerged in relation to the environment and safety area. The
ongoing environmental reclamation at the lands owned by the US subsidiary relates to previous
Euro thousands December 31, 2020 December 31, 2019 Change
Europe 38,024 34,505 3.519
North America 22,095 30,973 (8,878)
Central/South America 33,526 50,043 (16,517)
Asia 6,727 8,028 (1,301)
Rest of the world 1,783 2,546 (763)
Total 102,155 126,095 (23,939)
TRADE RECEIVABLES: BY GEOGRAPHICAL SEGMENT

F.I.L.A. Group
52
industrial activity before the acquisition by F.I.L.A. S.p.A.
The company, in accordance with Article 5, paragraph 3, letter b of Legislative Decree 254/2016 has
drawn up the consolidated non-financial statement as a separate report. The 2020 consolidated non-
financial statement, drawn up as per the “GRI Standards” and subject to limited audit by KPMG S.p.A.
is available on the Group website.
Personnel
The FILA Group at the end of 2020 had 8,070 employees (10,067 at December 31, 2019), of which
over 99% on full-time contracts. The workforce is 46% female and who represent 67% of part-time
contracts.
The decrease of 1,997 was mainly in Asia and, concerns the Indian company DOMS Industries Pvt Ltd
in particular, which launched major plant expansion projects during the year, leading to a reduction in
the seasonal workforce, where feasible, as a consequence of the COVID-19 pandemic.
Two tables breaking down the F.I.L.A. Group workforce at December 31, 2020 and December 31, 2019
respectively by region and category are presented below:
Globally, the majority of F.I.L.A. Group personnel are located in Asia (with over 59.9% of group
personnel at the end of 2020), followed by Central and South America (18.6%), Europe (13.8%), North
America and the Rest of the world. The majority of the workforce in fact is based in the countries in
which the main production facilities are located (India, China and Mexico).
The 2020 average workforce of the F.I.L.A. Group was 9,071, decreasing by 743 units on December
31, 2019:
EuropeNorth
America
Central - South
AmericaAsia
Rest
of the WorldTotal
December 31, 2019 1,081 717 1,915 6,331 23 10,067
December 31, 2020 1,115 594 1,503 4,830 28 8,070
Change 34 (123) (412) (1.500) 5 (1.997)

F.I.L.A. Group
53
The bonuses received by F.I.L.A. Group Managers in the year were as follows:
In 2020, as in previous years, F.I.L.A. Group personnel undertook training and upskilling courses,
particularly in the administrative areas in order to maintain appropriate professional standards, in line
with the Group policy.
Manager White-collar Blue-collar Total
December 31, 2019 235 2,153 7,679 10,067
Increase 24 387 3,923 4,334
Decrease 20 559 5,752 6,331
Career advancement 9 (5) (4) 0
December 31, 2019 248 1,976 5,846 8,070
Change 13 (177) (1.833) (1.997)
PERSONNEL - FULL TIME EQUIVALENT
EuropeNorth
America
Central/South
AmericaAsia
Rest
of the WorldTotal
Executives 110 81 13 30 5 240
Managers/White-collar 420 157 480 979 15 2,050
Blue-collar 551 473 1,394 5,099 8 7,525
Total at December 31, 2019 1,080 711 1,888 6,107 28 9,814
Executives 114 74 18 32 4 242
Managers/White-collar 417 141 499 995 13 2,066
Blue-collar 568 441 1,192 4,554 9 6,764
Total at December 31, 2020 1,098 656 1,710 5,581 26 9,071
Change 19 (56) (178) (527) (2) (743)
Euro thousands
December
2020
December
2019Nature
Bonus 2,230 1,437 Perfomance bonus
Total 2,230 1,437
BENEFITS AND OTHER INCENTIVES FOR MANAGERS

F.I.L.A. Group
54
Corporate Governance
For further information on corporate governance, reference should be made to the Corporate
Governance and Ownership Structure Report, prepared in accordance with Article 123-bis of the
Consolidated Finance Act (TUF), approved by the Board of Directors of the Parent, together with the
Directors’ Report made available by the Parent at the registered office of the Parent, as well as on the
Group website (www.filagroup.it - “Governance” section).
The disclosure pursuant to paragraphs 1 and 2 of Article 123-bis of Legislative Decree No. 58/1998 is
contained in the “Corporate Governance and Ownership Structure Report” and the “Remuneration
Report”, prepared in accordance with Article 123-ter of Legislative Decree No. 58/1998. Both reports,
approved by the Board of Directors, are published in accordance with law on the company website
www.filagroup.it.
Disclosures pursuant to Articles 70 and 71 of the Consob regulation 11971/1999.
With effect from October 21, 2013, the Board of Directors of Space S.p.A. (now F.I.L.A. S.p.A.), in
relation to the provisions of Articles 70, paragraph 8 and 71 and paragraph 1-bis of Consob Regulation
No. 11971/1999 and subsequent amendments, opted for the exemption from publication of disclosure
documents established under the above-stated Consob regulation in the case of significant mergers,
spin-offs, share capital increases through the transfer of assets in kind, acquisitions and sales.
The following table outlines the total fees recognised to members of the Board of Directors and the
Board of Statutory Auditors for offices held at F.I.L.A. S.p.A., in addition to remuneration of any kind,
in the case of “performance bonuses and one-off remuneration” received in 2020:
Euro thousands
Fees for
office heldOther remuneration
(Bonus)
Directors 1,971 586
Statutory auditors 105 -
Total amount 2,076 586
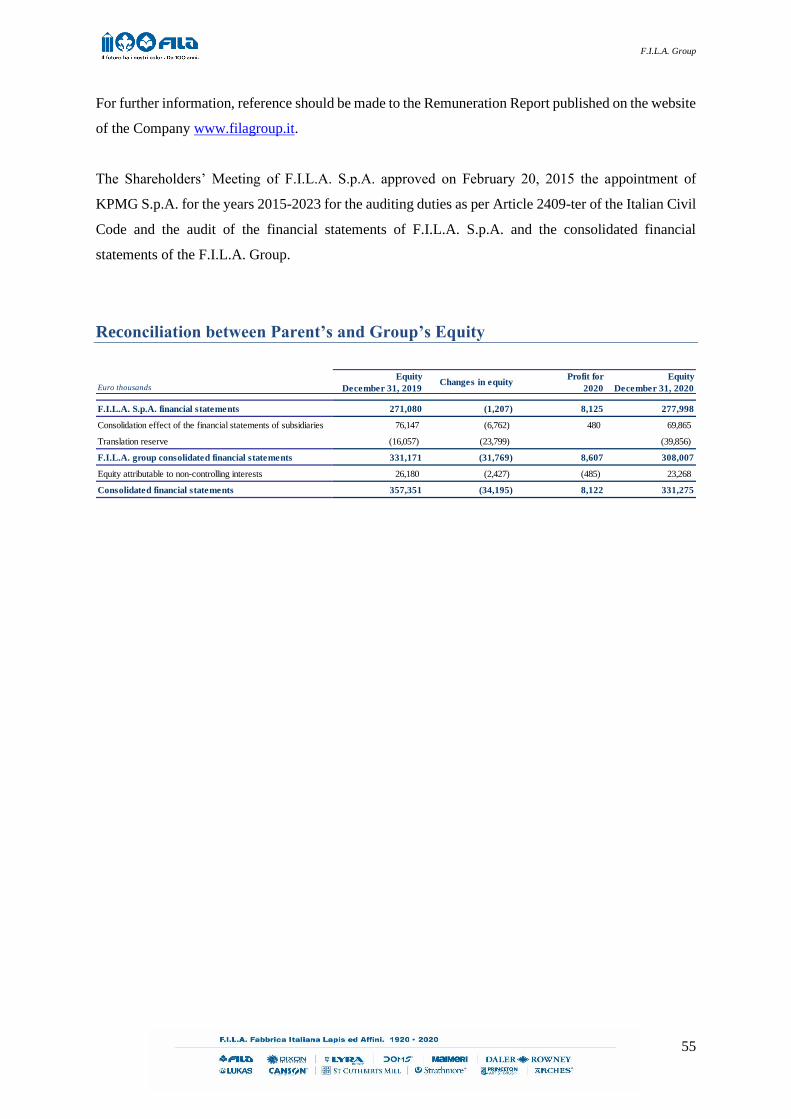
F.I.L.A. Group
55
For further information, reference should be made to the Remuneration Report published on the website
of the Company www.filagroup.it.
The Shareholders’ Meeting of F.I.L.A. S.p.A. approved on February 20, 2015 the appointment of
KPMG S.p.A. for the years 2015-2023 for the auditing duties as per Article 2409-ter of the Italian Civil
Code and the audit of the financial statements of F.I.L.A. S.p.A. and the consolidated financial
statements of the F.I.L.A. Group.
Reconciliation between Parent’s and Group’s Equity
Euro thousands
Equity
December 31, 2019Changes in equity
Profit for
2020
Equity
December 31, 2020
F.I.L.A. S.p.A. financial statements 271,080 (1,207) 8,125 277,998
Consolidation effect of the financial statements of subsidiaries 76,147 (6,762) 480 69,865
Translation reserve (16,057) (23,799) (39,856)
F.I.L.A. group consolidated financial statements 331,171 (31,769) 8,607 308,007
Equity attributable to non-controlling interests 26,180 (2,427) (485) 23,268
Consolidated financial statements 357,351 (34,195) 8,122 331,275

F.I.L.A. Group
56
*****************************
Dear F.I.L.A. S.p.A. Shareholders,
We submit for your approval the financial statements as at and for the year ended December 31, 2020,
comprising the statement of financial position, the statement of comprehensive income, the statement
of change in equity, the statement of cash flows and the notes thereto, with the relative attachments,
which report a profit for the year of Euro 8,125,346.78 and we propose:
to allocate Euro 406,267.34 to the legal reserve, as established in Article 2430 of the Civil Code,
and to allocate Euro 1,594,273.68 to retained earnings;
to distribute the residual “Profit for the year” of Euro 6,124,805.76 as dividends and, therefore,
to distribute a dividend of Euro 0.12 for each of the 51,040,048 ordinary shares currently
outstanding, provided that, should the total number of shares of the Company currently in
circulation increase, the total amount of dividend will remain unchanged and the unit amount
will be automatically adjusted to the new number of shares; the dividend will be issued with
coupon, record and payment dates of May 24, 25 and 26, 2021 respectively.
The Board of Directors
THE CHAIRMAN
GIOVANNI GORNO TEMPINI
(signed on the original)

F.I.L.A. Group
57
CONSOLIDATED FINANCIAL STATEMENTS AS AT AND FOR THE
YEAR ENDED DECEMBER 31, 2020
F.I.L.A. GROUP
SEPARATE FINANCIAL STATEMENTS AS AT AND FOR THE YEAR
ENDED DECEMBER 31, 2020
F.I.L.A. S.p.A.

F.I.L.A. Group
58
III - Consolidated Financial Statements as at and for the year ended December 31,
2019
Consolidated Financial Statements
Statement of Financial Position
The notes from pages 93 to 153 are an integral part of these consolidated financial statements.
Euro thousandsDecember 31, 2020 December 31, 2019
Assets 1,141,333 1,150,978
Non-current assets 631,507 639,773
Intangible assets Note 1 435,990 430,609
Property, plant and equipment Note 2 171,489 186,013
Non-current financial assets Note 3 2,614 3,783
Equity-accounted investments Note 4 1.102 947
Other equity investments Note 5 31 31
Deferred tax assets Note 6 20,281 18,391
Current assets 509,826 511,206
Current financial assets Note 3 622 169
Current tax assets Note 7 9,882 11,097
Inventories Note 8 256,288 258,409
Trade receivables and other assets Note 9 115,929 141,339
Cash and cash equivalents Note 10 127,105 100,191
Liabilities and equity 1,141,333 1,150,978
Equity Note 12 331,275 357,351
Share capital 46,967 46,876
Reserves 74,817 106,679
Retained earnings 177,616 153,616
Profit for the period 8,607 24,000
Equity attributable to the owners of the parent 308,007 331,171
Equity attributable to non-controlling interests 23,268 26,180
Non-current liabilities 577,561 572,817
Non-current financial liabilities Note 13 476,432 483,303
Financial instruments Note 17 18,767 13,571
Employee benefits Note 14 13,965 11,800
Provisions for risks and charges Note 15 935 937
Deferred tax liabilities Note 16 67,423 63,162
Other liabilities Note 19 38 44
Current liabilities 232,497 220,813
Current financial liabilities Note 13 126,052 102,706
Current provisions for risks and charges Note 15 928 2,139
Current tax liabilities Note 18 4,974 7,296
Trade payables and other liabilities Note 19 100,542 108,670

F.I.L.A. Group
59
Statement of Comprehensive Income
The notes from pages 93 to 153 are an integral part of these consolidated financial statements.
Euro thousands
December 31,
2020
December 31,
2019
Revenue from sales and services Note 20 607,382 682,686
Other revenue and income Note 21 8,967 6,746
Total revenue 616,349 689,432
Raw materials, consumables, supplies and goods Note 22 (293,027) (312,020)
Services and use of third party assets Note 23 (103,557) (116,056)
Other costs Note 24 (7,154) (7,073)
Change in raw materials, semi-finished products, work in progress and finished goods Note 22 12,789 (5,921)
Personnel expense Note 25 (130,350) (142,439)
Amortisationand depreciation Note 26 (42,646) (41,047)
Net impairment losses on trade receivables and other assets Note 27 (1,833) (1.707)
Other net impairment losses Note 28 (1,053) (3.122)
Total operating costs (566,830) (629,384)
Operating profit 49,518 60,048
Financial income Note 29 2,348 3,971
Financial expense Note 30 (37,850) (34,438)
Share of profit of equity-accounted investments Note 32 271 187
Net financial expense (35,231) (30,279)
Pre-tax profit 14,287 29,769
Income taxes (7,353) (10,827)
Deferred taxes 1,188 7,163
Total taxes Note 33 (6,165) (3,663)
Profit from continuing operations 8,122 26,105
Profit for the year 8,122 26,105
Attributable to:
Non-controlling interests (485) 2,105
Owners of the parent 8,607 24,0
Other comprehensive income (expense) which may be reclassified subsequently
to profit or loss(32,358) (2,064)
Exchange gains (26,349) 6,338
Hedging reserves (6,009) (8,402)
Other comprehensive income which may not be reclassified subsequently to
profit or loss(1,086) (1,073)
Actuarial losses (1,415) (1,039)
Taxes 329 (34)
Other comprehensive income (expense), net of tax effect (33,444) (3,137)
Comprehensive expense (25,321) (22,968)
Attributable to:
Non-controlling interests (3,032) 1.864
Owners of the parent (22,289) 21,104
Earnings per share:
basic 0,17 0.47
diluted 0,17 0.46

F.I.L.A. Group
60
Statement of changes in Equity
Note:
1) The figures at December 31, 2020 correspond to the consolidated financial statements of F.I.L.A. S.p.A. as at and for the
year ended December 31, 2020, as approved by the shareholders’ of F.I.L.A. S.p.A. in their meeting of April 27, 2021.
2) For information on the changes in equity, reference should be made to Note 12 to the consolidated financial statements.
The notes from pages 93 to 153 are an integral part of these consolidated financial statements.
Euro thousands
Share capitalLegal
reserve
Share
premium
reserve
Actuarial
reserve
Other
reserves
Translation
reserve
Retained
earnings
Profit
attributable
to the owners
of the parent
Equity
attributable
to the owners
of the parent
Capital and
reserves att.
to non-
controlling
interests
Profit
attributable
to non-
controlling
interests
Equity
attributable
to non-
controlling
interests
Total equity
- - -
December 31, 2018 46,799 7,434 151,769 (3,253) (24,192) (22,524) 148,939 8,747 313,719 23,376 1,7140 25,090 338,809
Profit for the year 24,000 24,000 2,105 2,105 26,105
Other comprehensive income (expense) - (961) (8.402) 6.467 , (2.896) (241) (241) (3.137)
Other changes 77 1,839 - (1,498) - 418 (538) (583) (165)
Profit for the year recognised directly in
equity77 - 1,839 (961) (9,90) 6,467 - 24,000 21,522 (824) 2,105 1,281 22,803
Allocation of the 2018 profit 331 (331) 8,747 (8,747) - 1,714 (1,714) - -
Dividends (4,070) (4,070) (191) (191) (4,261)
December 31, 2019 46,876 7,765 153,608 (4,214) (34,423) (16,057) 153,616 24,000 331,717 (24,075) 2,105 26,180 357,351
Profit for the year 8,607 8,607 (485) (485) 8,122
Other comprehensive income (expense) - (1,089) (6,009) (23799) (30,897) (2,547) (2,547) (33,444)
Other changes 91 865 - (1,830) - (874) 389 389 (485),
Profit for the year recognised directly in
equity91 - 865 (1,089) (7,839) (23799) - 8,607 (23,164) (2,158) (485) (2,643) (25,807)
Allocation of the 2019 profit 566 (566) 24,000 (24,000) - 2,105 (2,105) - -
Dividends (269) (269) (269)
December 31, 2019 46,967 8,351 154,473 (5,303) (42,828) (39,856) 177,616 8,607 308,007 (23,753) (485) 23,268 331,275

F.I.L.A. Group
61
Statement of Cash Flows
1) Cash and cash equivalents at December 31, 2020 totalled Euro 127,105 thousand; current account overdrafts amounted to Euro 10,799
thousand net of relative interest.
2) Cash and cash equivalents at December 31, 2019 totalled Euro 100,191 thousand; current account overdrafts amounted to Euro 14,612
thousand net of relative interest.
3) The cash flows are presented using the indirect method. In order to provide a more complete and accurate presentation of the individual
cash flows, the effects of non-monetary items were eliminated (including the translation of statement of financial position items in
currencies other than the Euro), where significant. These effects were aggregated and included in the caption “Other non-monetary
changes”.
Euro thousandsDecember 31, 2020 December 31, 2019
Operating profit 8,122 26,105
Non-monetary and other adjustments: 88,675 83,498
Amortisation and depreciation 31,672 30,524
Depreciation of right-of-use assets 10,974 10.523
Net impairment losses on intangible assets and property, plant and equipment 1,054 3.122
Impairment gains/losses on trade receivables and write-downs of inventories 2,067 2
Accruals for post-employment and other employees benefits 1,128 3,018
Exchange losses on foreign currency trade receivables and payables 961 811,000
Net gains on the sale of intangible assets and property, plant and equipment (577) (48)
Net financial expense 35,502 30,466
Net gains on equity investments (271) (187)
Taxes 6,165 3,663
Addition for: (15,244) (11,604)
Income taxes paid (8,393) (12,659)
Net unrealised exchange gains/losses on foreign currency assets and liabilities (5,886) 1,281
Net realised exchange gains/losses on foreign currency assets and liabilities (965) (227)
Cash flows from operating activities before changes in net working capital 81,553 97,998
Changes in net working capital: (7,166) 15,306
Change in inventories (12,835) 6,021
Change in trade receivables and other assets 10,404 11,609
Change in trade payables and other liabilities (1,962) 1,349
Change in other liabilities, net (1,343) (1,369)
Change in post-employment and other employee benefits (1,430) (2,303)
Net cash flows used in operating activities 74,387 113,305
Net increase in intangible assets (1,817) (4,041)
Net increase in property, plant and equipment (8,358) (14,968)
Net increase in equity investments measured at cost (12,207) (2,784)
Net increase/decrease in other financial assets 134 (385)
Interest collected 560 -
Net cash flows used in investing activities (65,288) (22,178)
Change in equity (222) (4,261)
Financial expense (21,485) (23,821)
Lease expense (5,991) (5.933)
Net increase/decrease in loans and borrowings and other financial liabilities 42,866 (121,075)
Net increase/decrease in lease liabilities 4,277 (7.288)
Net cash flows from (used in) financing activities 19,466 (162,378)
Exchange gains (26,349) 6,349
Other non-monetary changes 28,529 3,651
Net cash flows for the year 30,727 (61,251)
Opening cash and cash equivalents net of current account overdrafts 85,579 146,831
Closing cash and cash equivalents net of current account overdrafts 116,306 85,579

F.I.L.A. Group
62
The notes from pages 93 to 153 are an integral part of these consolidated financial statements.
Euro thousandsDecember 31, 2020 December 31, 2019
Opening cash and cash equivalents 85,579 146,831
Cash and cash equivalents 100,191 157,602
Current account overdrafts (14,612) (10,771)
Closing cash and cash equivalents 116,306 85,579
Cash and cash equivalents 127,105 100,191
Current account overdrafts (10,799) (14,612)

F.I.L.A. Group
63
Statement of financial position with indication of related party transactions pursuant to
CONSOB resolution No. 15519 of July 27, 2006
The notes from pages 93 to 153 are an integral part of these consolidated financial statements.
Euro thousands
December 31,
2020
of which:
Related Parties
December 31,
2019
of which:
Related Parties
Assets 1,141,333 - 1,150,978 -
Non-current assets 631,507 - 639,773 -
Intangible assets Note 1 435,990 430,609
Property, plant and equipment Note 2 171,489 186,013
Non-current financial assets Note 3 2,614 3,783
Equity-accounted investees Note 4 1.102 947
Other equity investments Note 5 31 31
Deferred tax assets Note 6 20,281 18,391
Current assets 509,826 - 511,206 -
Current financial assets Note 3 622 169
Current tax assets Note 7 9,882 11,097
Inventories Note 8 256,288 258,409
Trade receivables and other assets Note 9 115,929 141,339
Cash and cash equivalents Note 10 127,105 100,191
Liabilities and equity 1,141,333 484 1,150,978 572
Equity Note 12 331,275 - 357,351 -
Share capital 46,967 46,876
Reserves 74,817 106,679
Retained earnings 177,616 153,616
Profit for the year 8,607 24,000
Equity attributable to the owners of the parent 308,007 331,171
Equity attributable to non-controlling interests 23,268 26,180
Non-current liabilities 577,561 - 572,817 -
Non-current financial liabilities Note 13 476,432 483,303
Financial instruments Note 17 18,767 13,571
Employee benefits Note 14 13,965 11,800
Provisions for risks and charges Note 15 935 ,937
Deferred tax liabilities Note 16 67,423 63,162
Other liabilities Note 19 38 44
Current liabilities 232,497 484 220,813 572
Current financial liabilities Note 13 126,052 102,706
Current provisions for risks and charges Note 15 928 2,139
Current tax liabilities Note 18 4,974 7,296
Trade payables and other liabilities Note 19 100,542 484 108,670 572

F.I.L.A. Group
64
Statement of Comprehensive Income with indication of related party transactions pursuant to
CONSOB resolution No. 15519 of July 27, 2006
The notes from pages 93 to 153 are an integral part of these consolidated financial statements.
Euro thousands
December 31,
2020
of which:
Related
Parties
of which:
Non-
recurring
expenses
December 31,
2019
of which:
Related
Parties
of which:
Non-
recurring
expenses
Revenue from sales and services Note 20 607,382 (784) 682,686 (4.674)
Other revenue and income Note 21 8,967 1,812 6,746 202
Total revenue 616,349 689,432
Raw materials, consumables, supplies and goods Note 22 (293,027) (1,814) (4,288) (312,020) (1,853) (1.141)
Services and use of third party assets Note 23 (103,557) (366) (8,928) (116,056) (356) (7,664)
Other costs Note 24 (7,154) 98 (7,073)
Change in raw materials, semi-finished products, work in progress and finished
goods Note 2212,789 (5,921)
Personnel expense Note 25 (130,350) (2,212) (142,439) (4,587)
Amortisation and depreciation Note 26 (42,646) (41,047)
Impairment losses on trade receivables and other assets Note 27 (1,833) (1,707)
Other impairment losses Note 28 (1,053) (3.122) (2.936)
Total operating costs (566,830) (629,384)
Operating profit 49,518 60,048
Financial income Note 28 2,348 (200) 3,971 ,332
Financial expense Note 29 (37,850) (34,438)
Share of profit of equity-accounted investees Note 31 271 187
Net financial expense (35,231) (30,279)
Pre-tax profit 14,287 29,769
Income taxes (7,353) 2,126 (10,827) 3,758
Deferred taxes 1,188 7,163
Total taxes Note 32 (6,165) (3,663)
Profit from continuing operations 8,122 26,105
Profit (loss) from discontinued operations - -
Profit for the year 8,122 (12,376) 26,105 (18,794)
Attributable to:
Non-controlling interests (485) (574) 2,105 (142)
Owners of the parent 8,607 (11,802) 24,0 (18,832)
Other comprehensive income (expense) which may be reclassified
subsequently to profit or loss(32,358) (2,064)
Exchange gains (26,349) 6,338
Hedging reserve (6,009) (8,402)
Other comprehensive income (expense) which may not be reclassified
subsequently to profit or loss(1,086) (1,073)
Actuarial gains (losses) (1,415) (1,039)
Taxes 329 (34)
Other comprehensive expense, net of tax effect (3,137) (3,137)
Comprehensive expense (25,321) (22,968)
Attributable to:
Non-controlling interests (3,032) 1.864
Owners of the parent (22,289) 21,104
Earnings per share:
basic 0,17 0.47
diluted 0,17 0.46

F.I.L.A. Group
65
Notes to the Consolidated Financial Statements of the F.I.L.A. Group
Introduction
The F.I.L.A. Group operates in the creativity tools market, producing and marketing colouring, design,
modelling, writing and painting objects, such as pencils, crayons, modelling clay, chalk, oil colours,
acrylics, watercolours, paints and paper for the fine arts, school and leisure.
The Parent F.I.L.A. S.p.A., Fabbrica Italiana Lapis ed Affini (hereafter “the Parent”) is a company
limited by shares with registered office in Pero (Italy), Via XXV Aprile, 5. The ordinary shares of the
Parent were admitted for trading on the MTA, STAR Segment, organised and managed by Borsa
Italiana S.p.A. from November 12, 2015.
The consolidated financial statements of the F.I.L.A. Group have been prepared in accordance with
International Financial Reporting Standards (IFRS) adopted by the European Union. They include the
financial statements of F.I.L.A. S.p.A. and its subsidiaries. For the subsidiaries the financial statements
are reported upon in specific financial reporting packages, for the purposes of the consolidated financial
statements of the Group, in order to comply with the IFRS.
These consolidated financial statements are presented in Euro, as the functional currency in which the
Group operates and comprise the Statement of Financial Position, in which assets and liabilities are
classified as current and non-current, the Statement of Comprehensive Income, the Statement of Cash
Flows, prepared using the indirect method, the Statement of Changes in Equity, the Notes thereto and
are accompanied by the Directors’ Report. All amounts reported in the Statement of Financial Position,
the Statement of Comprehensive Income, the Statement of Cash Flows, the Statement of Changes in
Equity and in the Notes are expressed in thousands of Euro, except where otherwise stated.
With reference to Consob Resolution No. 15519 of July 27, 2006 in relation to the format of the
Financial Statements, significant related party transactions and the income components from non-
recurring items or transactions are indicated separately.
The publication of these consolidated financial statements was authorised by the Board of Directors on
March 22, 2021.

F.I.L.A. Group
66
Basis of preparation and accounting standards
The consolidated financial statements of F.I.L.A. Group and the separate financial statements of
F.I.L.A. S.p.A. as at and for the year ended December 31, 2020, prepared by the Board of Directors of
F.I.L.A. S.p.A., were drawn up in accordance with International Financial Reporting Standards (IFRS),
issued by the International Accounting Standards Board (IASB) and endorsed by the European Union.
The IFRS were applied consistently for all reporting periods presented in this document. For the
consolidated financial statements of the F.I.L.A. Group, the first year of application of IFRS was 2006,
while for the separate financial statements of F.I.L.A. S.p.A. the first year of application of IFRS was
2007.
These consolidated financial statements are prepared under the historical cost convention, modified
where applicable for the measurement of certain financial instruments or for the application of the
acquisition method under IFRS 3, as well as on a going concern basis.
Standards, amendments and interpretations applicable after January 1, 2020
Amendments to the references in IFRSs to the “Conceptual Framework for Financial Reporting”
In October 2018, the IASB published the reviewed version of the Conceptual Framework for Financial
Reporting. The main changes from the previous version of 2010 were as follows:
A new chapter on measurement;
Improved definitions and guidance, in particular with regards to defining liabilities;
Clarification of important concepts such as stewardship, prudence and uncertainty in
measurement.
The amendment updates several references in the IFRS to the previous Conceptual Framework in IFRS
Standards, the accompanying documents and the IFRS Practice Statements.
Amendment to IAS 1 and IAS 8 – Definition of Material
The purpose of the amendment, published in October 2018, is to clarify the definition of “material” in
order to aid companies in assessing whether information is to be included in the financial statements.
Amendment to IFRS 9 Financial instruments, to IAS 39 Financial instruments: recognition and
measurement and to IFRS 7 Financial instruments: additional disclosures
This Interest Rate Benchmark Reform , whose implementation is still in progress globally, has created
uncertainties about the timing and amount of future cash flows associated with certain financial
instruments, with the consequent risk of having to terminate hedging relationships designated in

F.I.L.A. Group
67
accordance with IAS 39 or IFRS 9. According to the IASB, discontinuing hedging relationships because
of these uncertainties does not provide useful information to users of financial statements; therefore,
the document has made specific amendments to IAS 39, IFRS 9 and IFRS 7, introducing exceptions
during the period of uncertainty.
Amendment to IFRS 3 – Definition of a Business
The amendment is intended to aid in determining whether a transaction is an acquisition of a business
or of a group of assets that does not meet the definition of a business provided in IFRS 3.
Amendment to IFRS 16 - Covid-19-related rent concessions
The amendments introduce a practical expedient that simplifies the way the lessee accounts for leases
that are a direct consequence of Covid-19. The amendments will be applicable from periods beginning
on June 1, 2020. Earlier application is permitted.
With reference to the standards and interpretations that came into force on January 1, 2020, there is no
material impact on the measurement of the Group's assets, liabilities, costs and revenue.
Standards, amendments and interpretations endorsed by the EU, not yet mandatory and not
adopted in advance by the group.
Extension of the temporary exemption from applying IFRS 9 (Amendments to IFRS 4)
In June 2020, the IASB Board amended IFRS 17, deferring its effective date by two years. Accordingly,
an amendment to IFRS 4 was necessary to extend the temporary exemption from applying IFRS 9 from
January 1, 2021 (previous effective date of IFRS 17) to January 1, 2023. The amendment to IFRS 4
does not have a specific effective date as it only refers to the extension of a temporary exemption already
provided for in IFRS 4. The EU endorsing regulation states that the amendments to IFRS 4 are to be
applied from financial statements for annual periods beginning on or after January 1, 2021.
Interest Rate Benchmark Reform - Phase 2 - Amendments to IFRS 9, IAS 39, IFRS 7, IFRS 4 and
IFRS 16.
In Phase 2 of the project, the IASB Board's goal was to include some practical expedients and some
facilitations in order to limit the accounting impacts of the reform of the IBORs used as interest rate
benchmarks.

F.I.L.A. Group
68
With reference to the standards and interpretations which are not yet mandatory, their adoption is not
expected to have a material impact on the measurement of the group's assets, liabilities, costs and
revenue.
Standards, amendments and interpretations not yet endorsed by the EU and applicable after
January 1, 2020
IFRS 17 Insurance Contracts
In May 2017, the IASB published IFRS 17 Insurance Contracts which replaces IFRS 4, issued in 2004.
The objective of the standard is to improve investors’ understanding of the exposure to risk, earnings
and the financial position of insurers, requiring that all insurance contracts are recognised on a uniform
basis, overcoming the problems created within IFRS 4.
The standard is applicable from January 1, 2023, however early application is permitted.
Amendment to IAS 1 - Presentation of Financial Statements – Classification of liabilities as
current or non-current
The IASB has clarified how to classify payables and other liabilities among current and non-current
liabilities. These amendments will be applied retrospectively from January 1, 2023. Early application
is permitted.
Amendment to IAS 16 - Property, Plant and Equipment: Proceeds before Intended Use
The amendments refer to the accounting of proceeds from selling items before they are available for
use. The amendments will be applicable from annual periods beginning January 1, 2022.
Amendment to IAS 37 - Onerous Contracts: Cost of Fulfilling a Contract
The amendment clarifies the type of costs that must be considered by an entity as the cost of fulfilling
a contract when assessing whether a contract is onerous. . The amendments will be applicable from
annual periods beginning January 1, 2022.
Annual Improvements to IFRS Standards 2018–2020
The amendments will be applicable from annual periods beginning January 1, 2022.
The main changes relate to:
- IFRS 1 First-time Adoption of IFRSs - Subsidiary as First-time Adopter - A subsidiary that
applies IFRS standards for the first time after its parent may apply paragraph D16(a) of IFRS 1
and measure cumulative translation differences using the amounts reported in the parent's
consolidated financial statements that have been determined based on the parent's date of

F.I.L.A. Group
69
transition to IFRSs. The above exemption can also be applied by associates and joint ventures
that apply IFRSs for the first time after their investor.
- IFRS 9 Financial Instruments - Fees and cost included in the "10 per cent test" for
derecognition of financial liabilities - The amendment to IFRS 9 clarifies that the fees to be
considered in the above 10% test are only the fees paid or received between the entity and the
lender and the fees paid or received by either the entity or the lender on the other’s behalf.
- Illustrative Examples of IFRS 16 Leases - Lease Incentives - The accounting treatment in the
lessee's financial statements of a sum received from the lessor for leasehold improvement costs
was removed from Illustrative Example 13 accompanying IFRS 16 as the conclusion of the
example was not supported by an adequate explanation.
- IAS 41 Agriculture - Taxation in Fair Value Measurements - The IASB Board clarifies that
cash flows from taxation need not be excluded in the fair value measurement of biological
assets.
Amendments to IFRS 3 - Reference to the Conceptual Framework
The amendments will be applicable from annual periods beginning January 1, 2022.
Amendment to IFRS 10 and IAS 28 “Sales or Contribution of Assets between an Investor and its
associate or Joint Venture”
The document was published in September 2014 in order to resolve the current conflict between IAS
28 and IFRS 10 relating to the measurement of the gain or loss from the sale or contribution of a non-
monetary asset to a joint venture or associate in exchange for an equity stake in the entity. Currently,
the IASB has deferred indefinitely the application of this amendment.
Tax effect of the United Kingdom’s withdrawal from the EU
On March 29, 2017, the government of the United Kingdom, invoking Article 50 of the Lisbon treaty,
announced to the European Council its intention to leave the EU. The United Kingdom and the EU
initially have a period of two years to reach an agreement on the withdrawal and their future relations:
this deadline can be extended. The process, in addition to the relative timing and outcome of the
negotiations and future agreements between the United Kingdom and the EU, are subject to significant
degrees of uncertainty.

F.I.L.A. Group
70
Group management has assessed the consequences of these uncertainties on the carrying amounts of
the assets and liabilities recognised in these consolidated financial statements. Following this
assessment, the group found no indicators of impairment regarding its UK subsidiary at the reporting
date.
Basis of consolidation
Subsidiaries
The subsidiaries, reported in “Attachment 1 - List of companies included in the consolidation scope and
other equity investments”, are companies where the Group, as per IFRS 10, holds control or rather is
exposed to variable income streams, possesses rights to such variable returns, based on the relationship
with the entity, and at the same time has the capacity to affect such income returns through the exercise
of its power over such entities.
The subsidiaries are consolidated line-by-line from the acquisition date, or rather the date in which the
Group acquires control and until such control is relinquished. The carrying amount of the subsidiaries
is eliminated against the share of equity held, net of the share of the profit or loss for the year. Non-
controlling interests in equity and the profit or loss for the year are recognised separately in the statement
of financial position and statement of comprehensive income.
Equity-accounted investees
Associates are entities in which the Group exercises a significant influence on the financial and
operating policies, although not having direct or joint control. Significant influence is the power to
participate in the financial and operating policy decisions of an investee, however not exercising control
or joint control.
Joint Ventures are entities in which the Group exercises, with one or more parties, joint control of their
economic activities based on a contractual agreement. Joint control assumes that the strategic, financial
and operating decisions are taken unanimously by the parties that exercise control.
The investments in associates and joint ventures are recognised in the separate financial statements at
cost and in the consolidated financial statements under the equity method. Based on this method, equity
investments are initially recognised at cost, subsequently adjusted according to the changes in the value
of the share of the Group in the equity of the associate. The group’s share in the profit or loss of
associates and joint ventures is recognised in a separate statement of comprehensive income caption
from the date in which significant influence is exercised and until such ceases to be exercised. Where
necessary, the accounting policies of associates and joint ventures are modified in line with the
accounting policies adopted by the Group.

F.I.L.A. Group
71
Business combinations
Business combinations are recognised using the acquisition method, based on which the identifiable
assets, liabilities, and contingent liabilities of the company acquired, which are in compliance with the
requirements of IFRS 3, are recognised at their fair value at the acquisition date.
Deferred taxes are recognised on adjustments made to carrying amounts in line with present values.
The application of the acquisition method due to its complexity provides for a first phase which
provisionally determines the fair values of the assets, liabilities and contingent liabilities acquired, to
permit a recording of the transactions in the consolidated financial statements in the year in which the
business combination occurred. The initial recording is completed and adjusted within 12 months of the
acquisition date. Amendments to initial payments which derive from events or circumstances
subsequent to the acquisition date are recognised in profit or loss
Goodwill is recognised as the difference between:
a) the sum of:
the payment transferred;
Of the non-controlling interest, measured aggregation by aggregation or at fair value (full
goodwill) or the share of the net assets identifiable attributable to non-controlling interests;
In a business combination achieved in stages, the fair value of the interest previously held in
the acquisition, recognising any resulting gain or loss in profit or loss; and
b) the carrying amount of the identifiable assets acquired and liabilities assumed.
The costs related to the business combination are not part of the payment transferred and are therefore
recognised in profit or loss for the year.
If the group’s interest in the fair value of the identifiable assets, liabilities and contingent liabilities
recognised exceeds the cost of the business combination, the excess is immediately recognised in the
profit or loss. Goodwill is periodically reviewed to verify its recoverability through comparison with
the greater of fair value less costs to sell and value in use, based on the future cash flows generated by
the underlying investment.
For the sake of the congruity, the goodwill acquired in a business combination is allocated, at the
acquisition date, to the group’s cash-generating units, or to the group of cash-generating units which
should benefit from the synergies of the business combination, independently of the fact that other
assets or liabilities of the Group are allocated to this unit or group of units. Each unit or group of units
to which the goodwill is allocated:
Represents the smallest identifiable group of assets that generates cash flows largely independent of the
cash flows from other assets or groups of assets;
Is not greater than the operating segments identified based on IFRS 8 Operating segments.
When the goodwill constitutes part of a cash generating unit and part of the internal activities of this

F.I.L.A. Group
72
unit are sold, the goodwill associated with the activity sold is included in the carrying amount of the
activity to determine the gain or loss deriving from the sale. The goodwill sold in these circumstances
is measured on the basis of the relative values of the activities sold and of the portion of the unit
maintained.
When the sale relates to a subsidiary, the difference between the sales price and the net assets plus the
accumulated translation differences and the residual goodwill is recognised in profit or loss.
On first-time adoption of IFRS, the Group chose not to apply IFRS 3 retrospectively for acquisitions
carried out prior to the transition date to IFRS; consequently, the goodwill resulting from the
acquisitions prior to this date was maintained at the previous value determined in accordance with
Italian GAAP and is periodically tested for impairment.
In the event of purchase and sale of non-controlling interests, the difference between the acquisition
cost, as determined above and the share of equity acquired from third parties or sold is directly
recognised as a decrease/increase in consolidated equity.
Infragroup transactions
In preparing the consolidated financial statements, inter-company transactions, in addition to unrealised
inter-company revenues and costs, are eliminated.
Unrealised gains arising from transactions with equity-accounted investees are eliminated to the extent
of the group's interest in the entity. Unrealised losses are eliminated in the same way as unrealised gains,
to the extent that there is no evidence of impairment.
Foreign currency transactions
Foreign currency transactions are translated into the functional currency of each Group entity at the
exchange rate at the date of the transaction. The monetary items in foreign currencies at the reporting
date are translated into the functional currency using the exchange rate at the same date. The non-
monetary items measured at fair value in foreign currencies are translated using the exchange rate when
the fair value was determined. The exchange differences are generally recognised in profit or loss. The
non-monetary items measured at historical cost in foreign currencies are translated using the exchange
rate at the transaction date.
Exchange differences arising from the translation of financial liabilities designated as hedges of the net
investment in a foreign operation, to the extent that the hedge is effective and cash flow hedges to the
extent that the hedge is effective, are recognised in other comprehensive income.
Foreign operations
The assets and liabilities of foreign operations, including goodwill and fair value adjustments deriving
from their acquisition, are translated into Euro using the exchange rate at the reporting date. The revenue

F.I.L.A. Group
73
and costs of foreign operations are translated into Euro using the average exchange rate for the year.
The exchange differences are recognised under other comprehensive income and included in the
translation reserve, except for exchange differences attributable to non-controlling interests.
The exchange rates adopted for the translation of local currencies into Euro are as follows:
Average Exchange Rates
December 31, 2020
Fixed Exchange Rates
December 31, 2020
Argentinean Peso 103.2494 80.7561
Australian Dollar 1.5896 1.6554
Brazilian Real 6.3735 5.8900
Canadian Dollar 1.5633 1.5294
Swiss Franc 1.0802 1.0703
Chilean Peso 872.5200 903.1100
Renminbi Yuan 8.0225 7.8708
Singapore Dollar 1.6218 1.5736
Euro 1 1
Pound 0.8990 0.8892
Indonesian Rupiah 17,240.76 16,619.7800
Shekel 3.9447 3.9239
Indian Rupee 89.6605 84.5795
Mexican Peso 24.4160 24.5118
Polish Zloty 4.5597 4.4432
Russian Ruble 91.4671 82.6454
Swedish Krona 10.0343 10.4881
Dominican Peso 71.4411 64.5047
Turkish Lira 9.1131 8.0436
US Dollar 1.2271 1.1413
South Africa Rand 18.0219 18.7685
Source: Banca d'Italia
EXCHANGE RATES

F.I.L.A. Group
74
Basis of preparation
Intangible assets
An intangible asset is a clearly identifiable non-monetary asset without physical substance, subject to
control and capable of generating future economic benefits. They are recognised at acquisition cost
where acquired separately and are capitalised at fair value at the acquisition date where acquired through
business combinations.
The interest expense on loans required for the purchase and the development of intangible assets, which
would not have been incurred if the investment had not been made, is not capitalised.
Intangible Assets with Indefinite Useful Life
Intangible assets with indefinite useful lives mainly consist of assets which do not have limitations in
terms of useful life as per contractual, legal, economic and competitive conditions. This category
includes only “goodwill”. Goodwill is represented by the excess of the purchase cost incurred compared
to the net fair value at the acquisition date of assets and liabilities or business units. The goodwill
relating to equity-accounted investees is included in the carrying amount of the equity investments.
This is not subject to amortisation but an impairment test is made at least annually on the carrying
amount. This test is made with reference to the “cash generating unit” to which the goodwill is allocated.
Any reduction in value of the goodwill is recognised where the recoverable value of the goodwill is
lower than the carrying amount; the carrying amount is the higher between the fair value of a cash
generating unit, less costs to sell, and the value in use, represented by the present value of the estimated
cash flows of the cash generating units.
The principal assumptions adopted in the determination of the value in use of the “cash generating
units”, or rather the present value of the estimated future cash flows which are expected to derive from
the continuing use of the activities, relates to the discount rate and the growth rate.
In particular, the F.I.L.A. Group used discount rates which it considers correctly expresses the market
valuations, at the date of the estimate, of the time value of money and the specific risks related to the
individual cash generating units.
The operating cash flow forecasts derive from the most recent budgets and long-term plans prepared by
the F.I.L.A. Group.
The cash flow forecasts refer to current business conditions, therefore they do not include cash flows
related to future investments.
The forecasts are based on reasonableness and consistency relating to future general expenses, financial
conditions, as well as macro-economic assumptions, with particular reference to increases in product
prices, which take into account expected inflation rates.

F.I.L.A. Group
75
In the event of an impairment loss, the carrying amount of goodwill may not be restated.
Reference should be made to Note 1 to the separate and consolidated financial statements of the parent
and the group for further information on the indicators used for the impairment test at the reporting date.
Intangible Assets with Finite Useful Lives
Intangible assets with finite useful lives are amortised on a straight-line basis over their useful life to
take account of the residual possibility of use. Amortisation commences when the asset is available for
use.
The amortisation policies adopted by the Group provide for:
Trademarks: based on the useful life;
Concessions, Licences and Patents: based on the duration of the right under concession or
license and based on the duration of the patent;
Other intangible assets: 3 years.
Research and development costs
Research and development costs are recognised in profit or loss in the year they are incurred, with the
exception of development costs recognised under “Intangible assets”, when they satisfy the following
conditions:
The project is clearly identified and the related costs are reliably identifiable and measurable;
The technical feasibility of the project is demonstrated;
The intention to complete the project and sell the assets generated from the project are
demonstrated;
A potential market exists or, in the case of internal use, the use of the
intangible asset is demonstrated for the production of the intangible assets generated by the
project;
The technical and financial resources necessary for the completion of the project are available;
The intangible asset will generate probable future economic benefits.
Amortisation of development costs recognised under intangible assets begins from the date in which
the outcome of the project is commercialised. Amortisation is calculated, on a straight-line basis, over
the estimated useful life of the project.

F.I.L.A. Group
76
Property, plant and equipment
Property, plant and equipment are measured at purchase cost, net of accumulated depreciation and any
impairment losses. The cost includes all charges directly incurred for the purchase and/or production.
The interest expense on loans for the purchase and the construction of Property, Plant and Equipment,
which would not have been incurred if the investment had not been made, are not capitalised but
expensed in the year it is incurred. Where an item of property, plant and equipment is composed of
various components with differing useful lives, these components are recognised separately (significant
components) and depreciated separately. Property, plant and equipment acquired through business
combinations are recognised in the financial statements at fair value at the acquisition date.
The expense incurred for maintenance and repairs is directly charged to profit or loss in the year in
which it is incurred. The costs for improvements, modernisation and transformation are recognised in
the statement of financial position as an increase to the carrying amount of Property, Plant and
Equipment.
The purchase price or construction cost is net of public grants which are recognised when the conditions
for their granting are confirmed. At the reporting date, there are no public grants recognised as a
decrease of “Property, Plant and Equipment”.
The initial carrying amount of property, plant and equipment is adjusted for depreciation on a systematic
basis, calculated on a straight-line basis monthly, when the asset is available and ready for use, based
on its estimated useful life.
The estimated useful lives for the current and previous years are as follows:
Buildings 25 years
Plant and machinery 8.7 years
Equipment 2.5 years
Other assets:
Office equipment: 8.3 years
Furniture and EDP: 5 years
Transport vehicles: 5years
Motor vehicles: 4 years
Other: 4 years
Leases
At the contract’s commencement date the group assesses whether the contract is – or contains – a lease.
The contract is, or contains a lease, where in exchange for consideration, it transfers the right to control
the use of an identified asset for a period of time. In order to assess whether a contract grants the right
to control the use of an identified asset, the group uses the definition of a lease in IFRS 16.

F.I.L.A. Group
77
The group has adopted a single recognition and measurement model for all leases, except for short-term
leases and low value leases. The group recognises the lease liabilities and the right-of-use asset
representing the right to use the asset underlying the contract.
Right-of-use assets
The Group recognises right-of-use assets at the initial lease date (i.e. the date on which the underlying
asset is available for use). Right-of-use assets are measured at cost, net of accumulated depreciation
and impairment losses, adjusted for any remeasurement of the lease liabilities. The cost of the right-of-
use assets includes the amount of the lease liabilities recognised, the initial direct costs incurred and the
lease payments made at the commencement date or before, net of any incentives received.
Right-of-use assets are depreciated on a straight-line basis from the effective date to the end of the
useful life of the asset consisting of the right of use or at the end of the lease term, whichever is earlier.
Lease liabilities
At the lease commencement date, the Group recognises the lease liabilities measuring them at the
present value of the future lease payments not yet settled at that date. The payments include the fixed
payments net of any lease incentives to be received, the variable lease payments which depend on an
index or a rate and the amounts expected to be paid as guarantee on the residual amount. The lease
payments include also the exercise price of a purchase option where it is reasonably certain that this
option will be exercised by the Group and the lease termination penalty payments, where the lease
duration takes account of the exercise by the Group of the termination option on the lease.
In calculating the present value of the future payments, the Group uses the incremental borrowing rate
at the commencement date where the implicit interest rate cannot be readily determined. The Group's
incremental borrowing rate is calculated on the basis of the interest rates obtained from various external
funding sources by making certain adjustments reflecting the terms of the lease and the type of asset
leased.
After the commencement date, the amount of the lease liability increases to take account of the interest
on the lease liabilities and reduces to consider the payments made. In addition, the carrying amount of
the lease liabilities are restated in the case of any changes to the lease or a review of the contractual
terms with regards to the change in the payments; it is also restated in the event of changes in the
valuation of the option to purchase the underlying asset or for changes in future payments resulting
from a change in the index or rate used to determine those payments.

F.I.L.A. Group
78
Where the lease liabilities are remeasured, the lessee correspondingly alters the right-of-use asset. If
the carrying amount of the right-of-use asset is reduced to zero, the lessee recognises the change in
profit or loss.
In the statement of financial position, the Group presents right-of-use assets that do not meet the
definition of investment property under “Property, plant and equipment” and lease liabilities under
“Financial liabilities”.
Short-term leases and low value asset leases
The Group applies the exemption for the recognition of leases relating to low value assets such as PCs,
printers, electronic equipment and contracts that have a duration of 12 months or less and do not contain
purchase options (short-term leases). The short-term lease instalments and those for low value assets
are recognised as costs on a straight-line basis over the lease duration.
Impairment losses on non-financial assets
At each reporting date, the intangible assets and property, plant and equipment are analysed to identify
the existence of any indicators, either internally or externally to the Group, of impairment. Where these
indications exist, an estimate of the recoverable amount of the above-mentioned assets is made,
recording any impairment losses in profit or loss. In the case of goodwill and other intangible assets
with indefinite useful lives, this estimate is made annually independently of the existence of such
indicators. The recoverable value of an asset is the higher between the fair value less costs to sell and
its value in use. The fair value is estimated on the basis of the values in an active market, from recent
transactions or on the basis of the best information available to reflect the amount which the entity could
obtain from the sale of the asset. The value in use is the present value of the expected future cash flows
to be derived from an asset. In defining the value in use, the expected future cash flows are discounted
using a pre-tax discount rate that reflects the current market assessment of the time value of money, and
the specific risks of the asset.
For an asset that does not generate sufficient independent cash flows, the realisable value is determined
in relation to the cash-generating unit to which the asset belongs. An impairment loss is recognised in
profit or loss when the carrying amount of the asset, or of the cash-generating unit to which it is
allocated, is higher than the recoverable amount.
Impairment losses on cash generating units are firstly allocated as a decrease in the carrying amount of
any goodwill allocated to the cash generating unit and, thereafter, as a decrease in other assets, in
proportion to their carrying amount. Impairment losses relating to goodwill may not be reversed. In
relation to assets other than goodwill, where the reasons for the impairment loss no longer exist, the
carrying amount of the asset is reversed up to the amount at which the asset would have been recognised
F.I.L.A. Group
79
if no impairment had taken place and amortisation had been recognised.
Financial assets and loans and receivables
Trade receivables and debt securities issued are recognised as they arise. All other financial assets and
liabilities are initially recognised on the trading date, i.e. when the Group becomes a contractual party
to the financial instrument.
With the exception of trade receivables without a material financing component, financial assets are
initially recognised at fair value, plus, in the case of financial assets or liabilities not at FVTPL, the
transaction costs directly attributable to the acquisition or issue of the financial asset. Upon initial
recognition, trade receivables without a material financing component are measured at their transaction
price.
Upon initial recognition, a financial asset is classified according to how it is measured: at amortised
cost, at fair value through other comprehensive income (FVOCI) for debt and equity securities, or at
fair value through profit or loss (FVTPL). Financial assets are not reclassified following initial
recognition unless the Group modifies the business model within which the financial assets are held. In
such cases, all the affected financial assets are reclassified on the first day of the first reporting period
following the change of the business model.
Loans and receivables are measured at amortised cost, taking the interest to profit or loss according to
the effective interest rate method or applying a rate that results in a nil balance of the present values of
the net cash flows generated by the financial instrument. Losses are recognised in profit or loss when
they become apparent or when the loans and receivables are derecognised. Loans are tested for
impairment and then recognised at their estimated realisable value (fair value) by setting aside a specific
loss allowance deducted directly from the carrying amount of such assets. Loans are impaired when
there is objective evidence of a probable default on the loan and on the basis of past experience and
historical data based on expected credit losses. When, in subsequent periods, the reasons for the
impairment no longer exist, the carrying amount of the asset is restated up to the amount deriving from
the application of the amortised cost as if no impairment loss had been recognised.
Other non-current equity instruments are measured at cost.
Changes in fair value and any gains or losses on disposal of an equity investment are taken to other
comprehensive income and never pass through profit or loss. Since this election is irrevocable and may
be made on an investment-by-investment basis, any exceptions upon initial recognition will be disclosed
in the notes to the caption. All equity instruments must be measured at fair value. The fair value of
securities traded in active markets is determined by reference to the exchange prices recognised at the
end of trading at the reporting date.

F.I.L.A. Group
80
The fair value of investments for which no active market exists is determined on the basis of the price
in recent transactions between independent parties of essentially similar instruments or the use of other
valuation techniques such as methods based on income or an analysis of discounted cash flows.
However, in certain limited circumstances, cost may represent an adequate estimate of fair value if, for
example, the most recent information available to assess fair value is insufficient, or if there is a wide
range of possible fair values. Cost is never the best estimate of fair value for investments in listed equity
instruments. Financial assets designated at fair value through profit or loss upon initial recognition are
measured with reference to their market value at the reporting date. The value of non-quoted instruments
is determined through generally accepted financial valuation techniques based on market data. Gains or
losses deriving from the fair value measurement of assets classified in this category are recognised in
profit or loss.
Cash and cash equivalents
Cash and cash equivalents principally include cash, bank deposits on demand and other highly liquid
short-term investments (convertible into liquidity within ninety days). These are recognised at their
nominal value.
For the purposes of the classification of financial instruments according to the criteria set out in IFRS
9, as required by IFRS 7, cash and cash equivalents have been classified as financial assets at amortised
cost for credit risk purposes. Current account overdrafts are classified under “Current Financial
Liabilities”.

F.I.L.A. Group
81
Inventories
Inventories of raw materials, semi-finished products and finished goods are measured at the lower of
purchase or production price, including related charges, determined in accordance with the weighted
average cost method, and the net realisable value. Net realisable value is the estimated selling price in
the ordinary course of business, less the estimated costs of completion and the estimated costs to sell.
Obsolete and slow-moving inventories are written down in relation to their possible use or realisable
value.
The purchase cost is used for direct and indirect materials, purchased and used in the production cycle.
The production cost is however used for finished goods or in work in progress.
For the determination of the purchase price, consideration is taken of the actual costs incurred net of
commercial discounts.
Production cost includes, in addition to the costs of the materials used, as defined above, the direct and
indirect production costs allocated. The indirect costs were allocated based on the normal production
capacity of the plant.
Distribution costs were excluded from purchase cost and production cost.
Provisions for risks and charges (current and non-current)
Provisions for risks and charges are recognised where the Group has a current obligation, legal or
constructive, deriving from a past event and it is probable that fulfilment of the obligation will result in
an outflow of resources and the amount of the obligation can be reasonably estimated.
Provisions are recognised at the value representing the best estimate of the amount that the entity would
pay to discharge the obligation or transfer it to a third party. When the time value of money is significant
and the payment dates of the obligations can be reliably estimated, the provision is discounted. The rate
used in the determination of the present value of the liability reflects the current market values and
includes the further effects relating to the specific risk associated with each liability. The increase in the
provision due to the passage of time is recognised in profit or loss under “Financial income/(expense)”.
The provisions are periodically updated to reflect the changes in the estimate of the costs, of the time
period and of the discount rate; the revisions of estimates are recognised in the same profit or loss
caption in which the provision was recognised, or when the liability relates to an asset, against the asset
caption to which it refers.

F.I.L.A. Group
82
The notes illustrate the contingent liabilities represented by: (i) possible obligations (but not probable)
deriving from past events, whose existence will be confirmed only on the occurrence or otherwise of
one or more uncertain future events not fully under the control of the entity; (ii) current obligations
deriving from past events whose amount cannot be reliably estimated or whose fulfilment will likely
not generate an outflow of resources.
Restructuring provisions are recognised where a detailed formal programme has been approved which
has raised a valid expectation among third parties that the entity will carry out the restructuring by
starting to implement that plan or announcing its main features to those affected by it.
Employee benefits
All employee benefits are measured and reflected in the financial statements on an accruals basis.
Defined contribution plans
Defined contribution plans are post-employment benefit plans under which the entity pays fixed
contributions to a separate entity and will not have a legal or constructive obligation to pay further
contributions. The contributions to be paid to defined contribution plans are recognised as costs in profit
or loss when incurred. Contributions paid in advance are recognised under assets to the extent the
advance will determine a reduction in future payments or a reimbursement.
Defined benefit plans
Defined benefit plans are post-employment benefit plans other than defined contribution plans. The net
obligation of the Group deriving from defined benefit plans is calculated separately for each plan
estimating the amount of the future benefit which the employees matured in exchange for the services
provided in the current and previous years; this benefit is discounted to calculate the present value,
while any costs relating to past services not recognised in the financial statements and the fair value of
any plan assets is deducted from liabilities. The discount rate is the return, at the reporting date, of the
primary obligations whose maturity date approximates the terms of the obligations of the Group and
which are expressed in the same currency in which it is expected the benefits will be paid. The
calculation is made by an independent actuary using the projected credit unit method. Where the
calculation generates a benefit for the Group, the asset recognised is limited to the total, net of all costs
relating to past service not recognised and the present value of all economic benefits available in the
form of refunds from the plan or curtailments in future contributions to the plan. Where improvements
are made to the plan benefits, the portion of increased benefits relating to past service is recognised as
an expense on a straight-line basis over the average period until the benefits become vested. If the
benefits vest immediately, the cost is recognised immediately in the statement of comprehensive

F.I.L.A. Group
83
income.
The Group records all actuarial gains and losses from a defined benefit plan directly and immediately
under other comprehensive income.
In relation to Post-Employment Benefits, following the amendments to Law No. 296 of December 27,
2006 and subsequent Decrees and Regulations (“Pension Reform”) issued in the first months of 2007,
the Parent F.I.L.A. S.p.A. adopted the following accounting treatment:
The Post-Employment Benefits, accrued to December 31, 2006 are considered a defined benefit
plan as per IAS 19. The benefits guaranteed to employees, in the form of Post-Employment
Benefits, paid on the termination of employment, are recognised in the period the right vests;
The Post-Employment Benefits accruing from January 1, 2007 are considered a defined
contribution plan and therefore the contributions accrued in the period were fully recognised as
a cost and recognised as a liability in the caption “Post-Employment Benefits”, after deduction
of any contributions already paid.
Other long-term employee benefits
The net obligation of the Group for long-term employee benefits, other than those deriving from pension
plans, corresponds to the amount of the future benefits which employees accrued for service in current
and previous years. This benefit is discounted, while the fair value of any assets is deducted from the
liabilities. The discount rate is the return, at the reporting date, on the primary obligations whose
maturity date approximates the terms of the obligations of the Company. The obligation is calculated
using the projected unit credit method. Any actuarial gains or losses are recognised in the statement of
financial in the year in which they arise.

F.I.L.A. Group
84
Short-term employee benefits
Short-term employee benefits are recognised as undiscounted expenses when the services that generate
them are provided.
The Group records a liability for the amount that it expects will be paid in the presence of a present
obligation, legal or constructive, as a consequence of past events and for which the obligation can be
reliably estimated.
Financial liabilities
Financial liabilities are initially recognised at fair value, which essentially coincides with the sum
received, less directly attributable transaction costs. Management determines the classification of
financial liabilities according to the criteria laid down in IFRS 9 and cited in IFRS 7 on initial
recognition.
Subsequent to initial recognition, these liabilities are measured at amortised cost by applying the
effective interest rate method, i.e. applying a rate that results in the sum of the present value of the net
cash flows generated by the financial instrument as equal to zero. Nominal value is used as an
approximation of amortised cost for instruments maturing within twelve months.
When there is a change in the expected cash flows, the value of the liabilities is recalculated to reflect
this change, based on the present value of the new expected cash flows and on the internal yield initially
determined.
A financial liability is derecognised from the financial statements when the underlying liability is settled
or cancelled.
Financial instruments
Financial instruments are initially recognised at fair value and, subsequent to initial recognition, are
measured on the basis of their classification, as per IFRS 9.
IFRS 9 classifies financial assets into three principal categories: at amortised cost, at fair value through
other comprehensive income (FVOCI) or at fair value through profit or loss (FVTPL). According to the
standard, classification is usually based on the entity’s business model for the financial assets and the
contractual cash flow characteristics of each financial asset.
IFRS 9 essentially maintains the provisions of IAS 39 for the classification and measurement of
financial liabilities.
Derivatives are classified in the category “Hedging derivatives” if they satisfy the requisites for the
application of so-called hedge accounting, otherwise, although in place in order to manage exposure to
risk, they are recognised as “Non-hedging derivatives”.

F.I.L.A. Group
85
In accordance with IFRS 9, the F.I.L.A. Group has elected to continue to apply the hedge accounting
method and requirements set out in the standard previously in force, IAS 39, and thus to determine the
hedge effectiveness of the derivative financial instrument. In particular, financial instruments are only
accounted for under the hedge accounting methods adopted by the Company when the relationship
between the derivative and the hedged item is formally documented and the hedge is highly effective
(effectiveness test).
The effectiveness of hedges is documented both at the inception of the transaction and periodically (at
least at the annual or interim reporting dates).
When the hedging derivatives cover the risk of change in the fair value of the instruments subject to the
hedge (fair value hedge), the derivatives are recognised at fair value with the effects recognised through
profit or loss.
When the derivatives hedge the risk of changes in the cash flows of the hedged instrument (cash flow
hedge), the effective part of the changes in the fair value of the derivatives is recognised in the statement
of comprehensive income and presented in the hedging reserve. The ineffective part of the changes in
the fair value of the derivative instrument is immediately recognised in profit or loss.
Trade payables and other liabilities
Trade payables and other liabilities are initially recognised at fair value, normally equal to the nominal
amount, net of discounts, returns or invoice adjustments, and are subsequently measured at amortised
cost. When there is a change in the cash flows and it is possible to estimate them reliably, the liabilities
are recalculated to reflect this change, based on the present value of the cash flows and on the internal
rate of return initially determined.
Current, deferred and other taxes
Income taxes for the year includes current and deferred taxes recognised in profit or loss, with the
exception of those on business combinations or amounts recognised directly under equity or under other
items comprehensive income.
Income taxes include all the taxes calculated on the taxable income of the group companies applying
the tax rates in force at the reporting date.
Other taxes not related to income, such as taxes on property and capital gains, are included under other
operating costs (“Services”, “Use of third party assets” and “Other charges”). The liabilities related to
indirect taxes are classified under “Other Liabilities”.
The Group has determined that interest and penalties relating to income taxes, including the accounting
treatments to be applied to income taxes of an uncertain nature, are accounted for in accordance with
IAS 37 Provisions, contingent liabilities and contingent assets as they do not meet the definition of
income taxes.

F.I.L.A. Group
86
Current taxes include the estimated amount of income taxes due or receivable, calculated on the taxable
income or tax loss for the year, as well as any adjustments to previous years' taxes. The amount of taxes
due or receivable, determined on the basis of the tax rates in force or substantially in force at the
reporting date, also includes the best estimate of the amount to be paid or received, if any, which is
subject to factors of uncertainty. Current taxes also include any taxes relating to dividends.
Deferred tax assets and liabilities are classified respectively to non-current assets and liabilities.
manca frase → “Le attività e le passività per imposte correnti sono compensate solo quando vengo
soddisfatti determinati criteri” “Current tax assets and liabilities are only offset when certain criteria are
met”
Deferred tax assets and liabilities are determined in accordance with the global assets/liability method
and are calculated on the basis of the temporary differences arising between the carrying amounts of
the assets and liabilities and the corresponding amounts recognised for tax purposes, taking into account
the tax rate under current tax legislation for the years in which the differences will reverse, with the
exception of goodwill at the initial recognition date and those differences deriving from investments in
subsidiaries which are not expected to be reversed in the foreseeable future, and on the tax losses to be
carried forward.
Deferred Tax Assets are classified under non-current assets and are recognised only when there is a
high probability of future taxable profit to recover these assets.
The valuation of deferred taxes reflects the tax effects arising from the manner in which the Group
expects to recover or extinguish the carrying amount of assets and liabilities at year-end.
Deferred tax assets and liabilities are only offset when certain criteria are met.
Revenues and costs
Revenue recognition
The revenue and income are recognised, as per IFRS 15, net of returns, discounts, rebates and premiums
as well as direct taxes related to the sale of products and services. In particular, revenue is measured
taking into account the consideration specified in the contract with the customer and is recognised when
control of the good or service is transferred. As it concerns the sale of goods, revenue is recognised at
a point in time, i.e. when control of the goods is transferred to the buyer, which generally coincides with
their physical delivery.

F.I.L.A. Group
87
Recognition of costs
Costs are recognised when relating to goods and services acquired or consumed in the year or when
there is no future utility.
The costs directly attributable to share capital transactions are recognised as a direct reduction of equity.
Commercial costs relating to the acquisition of new customers are expensed when incurred.
Financial income and expense
Financial income includes interest income on liquidity invested, dividends received and income from
the sale of available-for-sale financial assets. Interest income is recognised in profit or loss on an
accruals basis using the effective interest method. Dividend income is recognised when the right of the
Group to receive the payment is established which, in the case of listed securities, corresponds to the
coupon date.
Financial expense includes interest on loans, discounting of provisions, dividends distributed on
preference shares reimbursable, changes in the fair value of financial assets through profit or loss and
losses on financial assets. Borrowing costs are recognised in profit or loss using the effective interest
method. Exchange differences are shown on a net basis.
Dividends
Dividends to be paid to shareholders are recognised on the date of the shareholders’ resolution.
Earnings per share
The basic earnings/(loss) per share are calculated by dividing the group’s profit or loss by the weighted
average shares outstanding during the year.
In order to calculate the diluted earnings/(loss) per share, the average weighted number of shares
outstanding is adjusted assuming the conversion of all shares with potential dilutive effect.
The profit or loss for the year is also adjusted to account for the effects of the conversion, net of taxes.
The diluted earnings/(loss) per share are calculated by dividing the group’s profit or loss for the year by
the weighted average number of ordinary shares outstanding during the year and those potentially
arising from the conversion of all potential ordinary shares with dilutive effect.

F.I.L.A. Group
88
Share-based payment arrangements
2019-2021 Performance Shares Plan
In accordance with IFRS 2 - Share-based payments, the key data regarding the “2019-2021 Performance
Shares Plan” approved by the shareholders of F.I.L.A. S.p.A. in their meeting of April 18, 2019 in
replacement of the 2017-2019 Performance Share Plan closed in advance and based on the free
awarding of shares of the parent F.I.L.A. S.p.A to managers and senior executives of the F.I.L.A. Group,
is presented below.
The “2019-2021 Performance Shares Plan” represents a medium/long-term incentive system based on
the free assignment of company shares and subject to the achievement of specific performance
objectives, in addition to continued employment with the Group. In particular, the free assignment of
shares is linked (i) partly to the achievement of the performance objectives calculated for all
beneficiaries of the “2019-2021 Performance Shares Plan” with reference to the scope of the F.I.L.A.
Group, and (ii) partly to the achievement of certain individual or organisational strategic objectives
defined specifically for each beneficiary of the “2019-2021 Performance Shares Plan” by reason of the
role and position held.
The total maximum number of shares to be assigned to beneficiaries of the “2019-2021 Performance
Shares Plan” was established at 789,320. It is stipulated that these shares derive from (i) a share capital
increase to be executed through the use, in accordance with Article 2349 of the Italian Civil Code, of
profits or retained earnings and/or (ii) treasury shares from repurchases made in accordance with Article
2357 and 2357-ter of the Italian Civil Code. Against a total maximum 789,320 ordinary shares of
F.I.L.A. S.p.A. to be granted to beneficiaries where achieving the maximum performance objectives set
out under the Plan, the Board of Directors, on conclusion of the three-year vesting period (i.e. December
31, 2021) shall establish the effective number of shares to be assigned to the beneficiaries of the Plan,
which shall be made available to each, according to the terms and methods established by the Plan and,
in particular, not beyond 60 calendar days from approval of the financial statements at December 31,
2021.
For equity-settled share-based payment transactions, the entity shall measure the goods or services
received, and the corresponding increase in equity, directly, at the fair value of the goods or services
received, unless that fair value cannot be estimated reliably. Where the entity cannot estimate reliably
the fair value of the goods or services received, it shall measure their value, and the corresponding
increase in equity, indirectly, by reference to the fair value of the equity instruments granted.
The F.I.L.A. Group calculated the fair value of the benefit received against options on shares granted
referring to the fair value of the options granted, calculated on the grant date and using the binomial
options pricing model.

F.I.L.A. Group
89
In calculating the fair value at the grant date of the share-based payment, the following parameters are
used:
Share price at the grant date: Euro 13.22;
Risk free interest rate (based on iBoxx Euro Sovereign): 0.20%;
Expected volatility (expressed as weighted average volatility): 26.4%;
Duration of the option: 3 years;
Expected dividends: 0.50% per year.
The expected volatility is estimated according to the historic average price volatility of the shares over
the three years since the grant date.
Fair value measurement
For measuring the fair value of an asset or a liability, the Group as far as possible refers to observable
market data. The fair values are broken down into hierarchical levels based on the input data used for
measurement, as outlined below.
Level 1: unadjusted asset or liability prices on an active market;
Level 2: inputs other than prices listed at the previous point, which are directly observable
(prices) or indirectly (derived from the prices) on the market;
Level 3: input which is not based on observable market data.
Where the input data utilised to calculate the fair value of an asset or a liability may be classified in
differing fair value hierarchy levels, the entire measurement is included in the lowest hierarchy level of
the input which is significant for the entire measurement.
The Group records the transfers between the various fair value hierarchy levels at the end of the period
in which the transfer took place.
Tax effect of the United Kingdom’s withdrawal from the EU
On March 29, 2017, the government of the United Kingdom, invoking Article 50 of the Lisbon treaty,
announced to the European Council its intention to leave the EU. The United Kingdom and the EU
initially have a period of two years to reach an agreement on the withdrawal and their future relations:
this deadline can be extended. The process, in addition to the relative timing and outcome of the
negotiations and future agreements between the United Kingdom and the EU, are subject to significant
degrees of uncertainty.

F.I.L.A. Group
90
Group management has assessed the consequences of these uncertainties on the carrying amounts of
the assets and liabilities recognised in these consolidated financial statements. As a result of this
assessment, the group has found no impairment loss indicators with reference to the assets of the UK
subsidiaries recognised in the financial statements at the reporting date.
Use of estimates
The preparation of the consolidated financial statements requires the directors to apply accounting
principles and methods that, in some circumstances, are based on judgements and estimates based on
experience and assumptions which are from time to time considered reasonable and realistic based on
the relative circumstances. The application of these estimates and assumptions impact the carrying
amount of the assets and liabilities and of the costs and revenue and the disclosure on contingent assets
and liabilities at the reporting date. Actual results may differ from these estimates.
The captions which require greater judgement by the Directors in the preparation of the estimates and
for which a change in the underlying conditions or the assumptions may have a significant impact on
the combined financial figures are briefly described below.
Measurement of receivables: trade receivables are adjusted by the loss allowance, taking into account
the effective recoverable amount. The calculation of the impairment losses requires the directors to
make judgements based on the documentation and the information available relating to the solvency of
the customers, and from market and historical experience.
Measurement of goodwill and intangible assets with indefinite useful life: in accordance with the
accounting principles applied by the Company, goodwill and the indefinite intangible assets are subject
to impairment testing at least annually in order to verify whether a reduction in value has taken place.
This assessment requires the directors to make judgements based on the information available within
the Group and from the market, as well as from historical experience; this depends in addition on factors
which may change over time, affecting the judgements and estimates made by directors. In addition,
when it is determined that there may be a potential impairment loss, the Group determines this through
using the most appropriate technical valuation methods available.
Risk provisions: the identification of the existence of a present obligation (legal or constructive) in some
circumstances may be difficult to determine. The directors evaluate these factors case-by-case, together
with the estimate of the amount of the economic resources required to fulfil the obligation. When the
directors consider that a liability is only possible, the risks are disclosed in the notes under the section
on commitments and risks, without any provision.
Measurement of closing inventories: inventories of products which are obsolete or slow moving are
periodically subject to impairment testing and written down where the recoverable amount is lower than
the carrying amount. The write-downs are made based on assumptions and estimates of management

F.I.L.A. Group
91
deriving from experience and historic results.
Pension plans and other post-employment benefits: the companies of the Group participate in pension
plans and other post-employment benefits in various countries; in particular in Italy, Germany, the
United States, France, Canada and Mexico. Management uses multiple statistical assumptions and
valuation techniques with the objective of anticipating future events for the calculation of the charges,
liabilities and assets relating to these plans. The assumptions relate to the discount rate, the expected
return of the plan assets and the rate of future salary increases. In addition, the actuarial consultants of
the Group use subjective factors, for example mortality and employee turnover rates.
The transition to IFRS 16 introduces some elements of professional judgment that entail the use of
assumptions and estimates with regard to the lease term and the definition of the incremental borrowing
rate.
The calculation of deferred tax assets is supported by a recoverability plan prepared on the basis of
assumptions which the directors consider reasonable.

F.I.L.A. Group
92
Note 1 - Intangible Assets
“Intangible Assets” at December 31, 2020 amount to Euro 435,990 thousand (Euro 430,609 thousand
at December 31, 2019) and are comprised for Euro 162,903 thousand of intangible assets with indefinite
useful life – goodwill (“Note 1.B - Goodwill”) and for Euro 273,087 thousand of intangible assets with
finite useful lives (“Note 1.D – Intangible Assets with finite useful lives”).
The changes of the year were as follows:
Intangible Assets with Indefinite Useful Life
“Intangible Assets with Indefinite Useful Lives” are comprised entirely of goodwill for a total amount
of Euro 162,903 thousand (Euro 147,761 thousand at December 31, 2019). The change on the previous
year end was due mainly to the M&A of the French company F.I.L.A.- Arches S.A.S., wholly-owned
Euro thousands
Goodwill
Industrial patents
and intellectual
property rights
Concessions,
licenses, trademarks
and similar rights
OtherAssets under
developmentTotal
Historical cost
December 31, 2018 147,334 200 143,464 186,811 3,360 481,169
Increases 3,407 - 2,947 9,263 (1,433) 14,121
Increase (Investments) 1,932 - 126 2,071 1,839 6,022
Transfers from assets under development - - - 3,326 (3,326) -
Exchange gains 1,412 - 2,821 3,866 - 8,099
Decreases (2,926) - (588) (8,457) - (11,971)
Decreases (Disinvestments) - - (26) (12) - (38)
Reclassifications - - 500 (2,394) - (1,894)
Impairment losses - - - (6) - (6)
Change in consolidation scope - - (1,062) (6,023) - (7,085)
Other (2,926) - - (22) - (2,984)
December 31, 2019 147,761 200 145,823 187,618 1,927 483,329
Increases 21,232 - 12,624 11,657 281 45,794
Increase (Investments) - - 72 821 924 1,817
Transfers from assets under development - - 176 467 (643) -
Change in consolidation scope 21,232 - 12,376 10,369 - 43,977
Decreases (6,090) - (8,840) (14,507) - (29,437)
Decreases (Disinvestments) - - (489) (331) - (820)
Exchange losses (6,090) - (8,351) (14,176) - (28,617)
December 31, 2020 162,903 200 149,607 184,768 2,208 499,686
Accumulated amortisation
December 31, 2018 - (158) (24,565) (13,856) - (38,580)
Increases - (10) (5,452) (10,323) (15,757)
Depreciation - (10) (4,925) (10,160) (15,095)
Exchange gains - - (500) (163) (662)
Decreases - - (438) 2,056 1,618
Disinvestments - - (16) 4 (12)
Reclassification - - (469) 1.741 1,272
Change in consolidation scope - - 47 309 356
Other - - - 2 2
December 31, 2019 - (168) (30,428) (22,123) (52,719)
Increases - (8) (5,081) (10,222) (15,311)
Depreciation - (8) (5,081) (10,222) (15,311)
Decreases - - 2,330 2,003 4,334
Disinvestments - - 489 331 820
Exchange losses - - 1,841 1,672 3.514
December 31, 2020 - (177) (33,179) (30,340) (63,696)
Carrying amount at December 31, 2017 150,670 42 118,898 (172,954) 2,008 445,924
Carrying amount at December 31, 2018 147,761 31 115,394 165,496 3,360 430,609
Carrying amount at December 31, 2019 162,903 23 116,428 154,428 1,927 435,990
Change 15,142 (8) 1,034 (11,068) (1,433) 5,381
Note 1.A - INTANGIBLE ASSETS

F.I.L.A. Group
93
by F.I.L.A S.p.A., which in March 2020 acquired of the business unit specialised in fine arts operating
through the ARCHES® brand. This transaction generated goodwill of Euro 21,232 thousand, measured
through the Purchase Price Allocation, carried out as per the applicable reporting standards.
During the year, exchange losses were recognised of Euro 6,090 thousand, primarily due to the
devaluation against the Euro of the US dollar (Euro 5,901 thousand), the main Central and South
American currencies (Euro 175 thousand) and the Indian rupee (Euro 14 thousand).
Goodwill is not amortised but is tested for test at least annually and whenever events or circumstances
arise which may indicate the risk of an impairment loss.
In accordance with the provisions of IAS 36, goodwill is allocated to the various cash generating units
(CGUs) and at least on an annual basis subject to recoverability analysis through an impairment testing.
The cash generating units relate to the operating segments, on a geographical basis, in line with the
minimum level at which goodwill is monitored for internal management purposes.
The CGU’s to which goodwill is allocated are as follows:
The allocation of goodwill was made considering individual CGUs or Groups of CGUs based on
potential synergies and similar operating strategies on the various markets. The goodwill relating to the
acquisition of Arches was allocated to the CGU of the Canson Group and North America.
The annual impairment test undertaken by the Group has the objective to compare the carrying amount
Euro thousands
December 31, 2020 December 31, 2019 ChangeGoodwill
Reallocation (A)
Exchange Rate
Difference
Impairment
Losses
Consolidation Area
Change
DOMS Industries Pvt Ltd (India) 33,261 33,275 (14) - (14) - -
Canson Group (4) 17,015 12,486 4,529 4,529 - - -
Fila Arches 5,473 - 5,473 (15,759) - - 21.232
Daler - Rowney Lukas Group(5) 5,922 5,922 - - - - -
North America(2) 93,215 87,886 5,329 11,230 (5,901) - -
Dixon Group - Central / South America(1) 1,768 1,942 (174) - (174) - -
Industria Maimeri S.p.A. (Italy) 1,695 1,695 - - - - -
St. Cuthberts Holding (UK) (6) 1,323 1,323 - - - - -
Fila Hellas (Greece) 1,932 1,932 - - - - -
Lyra Group(3) 1,217 1,217 - - - - -
FILA SA (South Africa) 83 83 - - - - -
Total 162,903 147,761 15,141 - (6,090) - 21,232
(1) - Grupo F.I.L.A.-Dixon, S.A. de C.V. (Mexico); F.I.L.A. Chile Ltda (Chile); FILA Argentina S.A. (Argentina).
(6) - St. Cuthberts Holding (UK); St. Cuthberts Mill (UK)
(B) The change in the scope of consolidation is generated by the acquisition of the business unit operating through the "Arches" brand which took place during the year.
(5) - Renoir Topco Ltd (UK); Renoir Midco Ltd (UK); Renoir Bidco Ltd (UK); FILA Benelux SA (Belgium); Daler Rowney Ltd (UK); Brideshore s.r.l. (Dominican Republic) in CGU Daler e Creativity International (UK).
(2) - Dixon Ticonderoga Company (U.S.A.); Dixon Canadian Holding (Canada);Brideshore srl (Dominican Republic) as CGU North America; Dixon Ticonderoga ART ULC; Castle Hill Crafts (Regno Unito); Princeton Hong Kong (U.S.A); Fila
NOTE 1.B GOODWILL BY CASH GENERATING UNIT
(3) - Johann Froescheis Lyra Bleistift-Fabrik GmbH & Co. KG (Germany); FILA Nordic AB (Sweden); PT. Lyra Akrelux (Indonesia); Daler Rowney GmbH (Germany); Lukas-Nerchau GmbH (Germany); Nerchauer Malfarben GmbH (Germany).
(4) - Canson SAS (France); Lodi 12 SAS (France); Canson Brasil I.P.E. LTDA (Brazil); Canson Australia PTY LTD (Australia); Canson Qingdao Ltd.(China); Fila Iberia S.L. (Spain); Fila Yixing (China) Canson Italy (Italy); Fila Arches

F.I.L.A. Group
94
of the cash-generating units to which the goodwill was allocated with the relative recoverable amount.
This latter is determined as the higher of the fair value less costs to sell and the value in use estimated
by discounting cash flows.
The F.I.L.A. Group identifies the recoverable amount as the value in use of the cash generating units,
identified (as per IAS 36) as the present value of expected cash flows, discounted at a separate rate for
each geographical segment and reflecting the specific risks of the individual CGUs at the measurement
date.
The assumptions used for the purposes of the impairment test are as follows:
The expected cash flows used to determine the value in use were developed on the basis of the Group's
2021 Budget approved on February 11, 2021 and the 2021-2025 Business Plan approved by the Board
of Directors on March 16, 2021, whereas the individual business plans were submitted for approval by
the Boards of Directors of the individual Group companies.
In particular, the cash flows were determined taking the assumptions from the budget and applying the
growth rate identified for each CGU in line with the long-term assumptions relating to the growth rate
of the sector and the specific risk of the country in which each CGU operates. Value in use is determined
by valuation assumptions influenced by the performance of the related markets for the specific socio-
economic and political conditions that are difficult to forecast and often unstable as well as by the
assumptions underlying the realization of the expected synergies, so as reflected in the business plan.
The terminal value was calculated applying the perpetual yield method.
As of 2019, the effects of the application of IFRS 16 on impairment tests was also taken into account.
In particular, right-of-use assets were included within the CGU being measured, gross of the related
lease liabilities, and the value in use was determined excluding the related lease payments and using an
updated discount rate, which reflects the financial leverage attributable to leases.
The discount rate (W.A.C.C.) is the weighted average cost of risk capital and borrowing cost,
considering the tax effects generated by the financial leverage.
The table below outlines the main assumptions for the impairment test. The discount rate is different
from December 31, 2019 to reflect the changed market conditions at the reporting date, as commented
upon below:
The main changes to the discount rate used for the impairment test on the previous year were:

F.I.L.A. Group
95
DOMS Industries Pvt Ltd (India) – The W.A.C.C. is 11.3% (11.9% at December 31, 2019),
with the change on the previous year principally due to a decrease in the risk-free rate, an
increase in the beta levered component and a reduction in the cost of debt;
Dixon Group - Central/South America - The discount rate is 10.4% (10.4% at December 31,
2019) and is in line with the previous year. The increase in the cost of capital (Ke) was offset
by a decrease in the cost of debt;
North America - The W.A.C.C. used is 7.7% (7.8% at December 31, 2019). The discount factor
decreased on the previous year and the change is mainly due to the increase in the levered beta
component;
Canson Group (France) - The W.A.C.C. amounted to 6.7% (5.9% at December 31, 2019). The
change on the previous year is mainly due to an increase in the levered beta component and the
cost of equity (Ke);
Daler-Rowney Lukas Group and St. Cuthberts (United Kingdom) - The discount rate is 7.3%
(6.8% at December 31, 2019). The increase is essentially due to the rise in the levered beta
component;
Euro thousands
Discount Rate
(W.A.C.C.)
Growth Rate
(g rate)
Cash flow
horizon
Terminal Value
Calculation
Method
DOMS Industries Pvt Ltd (India) 11.3% 4.0% 5 years Perpetuity growth rate
Canson Group (France) (4) 6.7% 1.8% 5 years Perpetuity growth rate
Daler-Rowney Lukas Group (UK) (5) 7.3% 1.9% 5 years Perpetuity growth rate
North America(2) 7.7% 2.1% 5 years Perpetuity growth rate
Dixon Group - Central / South America(1) 10.4% 3.6% 5 years Perpetuity growth rate
Industria Maimeri S.p.A. (Italy) 8.0% 1.3% 5 years Perpetuity growth rate
St. Cuthberts Holding (UK)(6) 7.3% 1.9% 5 years Perpetuity growth rate
Lyra Group (3) 6.4% 1.9% 5 years Perpetuity growth rate
Fila Hellas 10.4% 1.5% 5 years Perpetuity growth rate
Fila Arches 6.7% 1.8% 5 years Perpetuity growth rate
FILA SA (South Africa) 12.8% 4.8% 5 years Perpetuity growth rate
* Source: Bloomberg (source of tax rate: KPMG tax advisory)
(6) - St. Cuthberts Holding (Johann Froescheis Lyra Bleistift-Fabrik GmbH & Co. KG (Germany); FILA Nordic AB (Sweden); PT. Lyra Akrelux (Indonesia);Daler Rowney
GmbH (Germany); Lukas- Nerchau GmbH (Germany); Nerchauer Malfarben GmbH (Germany); St.Cuthberts Holding (UK); St. Cuthberts Mill (UK)
IMPAIRMENT TEST GOODWILL - VALUE IN USE CALCULATION ASSUMPTIONS
(1) - Grupo F.I.L.A.-Dixon, S.A. de C.V. (Mexico); F.I.L.A. Chile Ltda (Chile); FILA Argentina S.A. (Argentina).
(2) - Dixon Ticonderoga Company (U.S.A.); Dixon Canadian Holding Inc. (Canada); Brideshore S.R.L. (Dominican Republic) in CGU North America; Dixon Ticonderoga ART
ULC (Canada); Princeton Hong Kong (U.S.A); Fila Arches (Francia) as CGU North America..
(3) - Johann Froescheis Lyra Bleistift-Fabrik GmbH & Co. KG (Germany); FILA Nordic AB (Sweden); PT. Lyra Akrelux (Indonesia);Daler Rowney GmbH (Germany); Lukas-
Nerchau GmbH (Germany); Nerchauer Malfarben GmbH (Germany)
(4) - Canson SAS (France); Lodi 12 SAS (France); Canson Brasil I.P.E. LTDA (Brazil); Canson Australia PTY LTD (Australia); Canson Qingdao Ltd.(China); Fila Iberia
(Spain); Fila Yixing (China) Canson Italy (Italy); Fila Arches (Francia) as CGU Canson Group.
(5) - Renoir Topco Ltd (UK); Renoir Midco Ltd (UK); Renoir Bidco Ltd (UK); FILA Benelux SA (Belgium); Daler Rowney Ltd (UK); Brideshore srl (Dominican Republic) in
quota CGU Daler e Creativity International (UK); Castle Hill Crafts (UK);.

F.I.L.A. Group
96
Industria Maimeri S.p.A. (Italy) – the discount rate was 8.0% (7.6% at December 31, 2019).
The increase on the previous year is mainly due to the increase in the levered beta component;
Lyra Group (Germany) – the discount rate used was 6.4% (5.6% at December 31, 2019). The
change on the previous year is due to an increase in the levered beta component and the cost of
equity capital (Ke);
FILA SA (South Africa) – W.A.C.C. equal to 12.8% (12.7% at December 31, 2019). The
change on 2019 is due to an increase in the cost of equity capital (Ke) and levered beta
component;
Fila Hellas - The W.A.C.C. is 10.4% (12.1% at December 31, 2019). The change on the
previous year is due to an increase in the levered beta component and a decrease in the cost of
debt.
Particular importance was given to the impairment tests on the goodwill allocated to the North American
cash generating unit of Euro 93,215 thousand (Euro 87,886 thousand at December 31, 2019), DOMS
Industries Pvt Ltd of Euro 33,261 thousand (Euro 33,275 thousand at December 31, 2019) and Canson
Group of Euro 17,015 thousand (Euro 12,486 thousand at December 31, 2019). The goodwill of the
above CGUs accounts for 88.1% of the Group’s intangible assets with indefinite useful lives of Euro
162,903 thousand. The impairment tests performed showed headroom of approximately Euro 343
million for the North American CGU (40%), of Euro 43 million for the Doms Industries Pvt Ltd CGU
(India) (33%) and of Euro 151 million for the Canson CGU (67%).
The DCF (Discounted Cash Flow) method applied to the carrying amount of the above CGUs confirms
their carrying amount.
Further complementary activities were also undertaken such as:
A sensitivity analysis to verify the recoverability of goodwill against possible changes in the
basic assumptions used to calculate the discounted cash flows (the "Growth Rate" and the
"WACC" Discount Rate have been assumed), which would lead to an impairment loss, both by
maintaining the Growth rate fixed and identifying the maximum value of the discount rate and,
by maintaining the Discount Rate fixed and identifying the minimum value of the Growth rate:

F.I.L.A. Group
97
The comparison between the value in use of the CGU for 2020 and 2019 with the analysis of
the variations;
Reasonableness test between the overall value in use at Group level and the stock market
capitalisation.
Analysis of the impairment result in response to changes in EBITDA over the explicit time
horizon.
In addition, account was taken of what was highlighted by ESMA, which on October 28, 2020 published
the Public Statement "European common enforcement priorities for 2020 financial statements", on the
sensitivity analysis for significant changes in key operational and financial assumptions due to Covid-
19. Specifically, the basic cash flow assumptions include that the effects of the COVID-19 pandemic
Discount Rate
(W.A.C.C.)
Growth Rate
(g rate)
DOMS Industries Pvt Ltd (India) 11.3% -0.3%
Canson Group (France) 6.7% -12.8%
Daler-Rowney Lukas Group (UK) 7.3% -5.8%
North America 7.7% -4.9%
Dixon Group - Central / South America 10.4% -1.7%
Industria Maimeri S.p.A. (Italy) 8.0% -1.4%
St. Cuthberts Holding (UK) 7.3% 0.2%
Lyra Group 6.4% -83.6%
Fila Hellas 10.4% -126.4%
FILA SA (South Africa) 12.8% -27.6%
Fila Arches 6.7% -0.2%
Discount Rate
(W.A.C.C.)
Growth Rate
(g rate)
DOMS Industries Pvt Ltd (India) 14.5% 4.0%
Canson Group (France) 15.8% 1.8%
Daler-Rowney Lukas Group (UK) 12.8% 1.9%
North America 12.6% 2.1%
Dixon Group - Central / South America 14.1% 3.6%
Industria Maimeri S.p.A. (Italy) 10.1% 1.3%
St. Cuthberts Holding (UK) 8.7% 1.9%
Lyra Group 29.1% 1.9%
Fila Hellas 30.8% 1.5%
FILA SA (South Africa) 25.3% 4.8%
Fila Arches 8.3% 1.8%
SENSITIVITY ANALYSIS - Variable Growth Rate
SENSITIVITY ANALYSIS - Variable W.A.C.C.

F.I.L.A. Group
98
projected for 2021 will extend into 2022, deferring the start of a full economic recovery until 2023.
The above-mentioned analysis confirmed the full recoverability of the goodwill and the reasonableness
of the assumptions used.
The cash flows and assumptions used for the impairment test were approved by the Board of Directors
on March 16, 2021.

F.I.L.A. Group
99
Intangible Assets with Finite Useful Lives
The changes at the reporting date of “Intangible Assets with Finite Useful Lives” are reported below:
Euro thousands
Industrial patents
and intellectual
property rights
Concessions,
licenses, trademarks
and similar rights
OtherAssets under
developmentTotal
Historical cost
December 31, 2018 200 143,464 (186,811) 3,360 333,875
Increases - 3,447 8,764 1,433 10,778
Investments - 126 2,072 1,893 4,091
Transfers from assets under development - - 3,326 (3,326) -
Reclassifications - 500 (500) - -
Exchange gains - 2,821 3,866 - 6,687
Decreases - (1,088) (7,957) - (9,045)
Disinvestments - (26) (12) - (38)
Reclassifications - - (1,894) - (1,894)
Impairment losses - - (6) - (6)
Change in consolidation scope - (1,026) (6,023) - (7,085)
Other - - (22) - (22)
December 31, 2019 200 145,823 187,618 1,927 335,568
Increases - 12,624 11,657 281 24,562
Investments - 72 821 924 1,817
Transfers from assets under development - 176 467 (643) -
Change in consolidation scope - 12,376 10,369 - 22,745
Decreases - (8,840) (14,507) - (23,347)
Disinvestments - (489) (331) - (820)
Exchange losses - (8,351) (14,176) - (22,527)
December 31, 2020 200 149,607 184,768 2,208 336,783
Accumulated amortisation
December 31, 2018 (158) (24,566) (13,856) (38,580)
Increases (10) (5,894) (9,854) - (15,757)
Investments (10) (4,925) (10,160) - (15,095)
Reclassifications - (469) 469 - -
Exchange gains - (500) (163) - (662)
Other - - - - -
Decreases - 31 1,587 - (1,618)
Disinvestments - (16) 4 - (12)
Reclassifications - - (1,272) - (1,272)
Change in consolidation scope - 47 309 - 356
Other - - 2 - 2
December 31, 2019 (168) (30,428) (22,123) - (52,719)
Increases (8) (5,081) (10,222) - (15,311)
Investments (8) (5,081) (10,222) - (15,311)
Decreases - 2,330 2,003 - 4,334
Disinvestments - 489 331 - 820
Exchange losses - 1,841 1,672 - (3,514)
December 31, 2020 (177) (33,179) (22,123) - (63,696)
Carrying amount at December 31, 2018 42 118,898 40,794 2,008 (295,255)
Carrying amount at December 31, 2019 31 115,394 172,955 3,360 282,848
Carrying amount at December 31, 2020 23 116,428 165,496 1,927 273,087
Change (8) 1,034 (7,459) (1,433) (9,761)
Note 1.D - INTANGIBLE ASSETS WITH FINITE USEFUL LIVES

F.I.L.A. Group
100
“Industrial Patents and Intellectual Property Rights” amount to Euro 23 thousand at December 31, 2020
(Euro 31 thousand at December 31, 2019).
The average residual useful life of the “Industrial Patents and Intellectual Property Rights”, recognised
in the financial statements at December 31, 2020, is 5 years.
“Concessions, Licences, Trademarks and Similar Rights” amount to Euro 116,428 thousand at
December 31, 2020 (Euro 115,394 thousand at December 31, 2019).
The carrying amount increased compared to December 31, 2019 by Euro 1,034 thousand, mainly due
to the M&A transaction of the French company F.I.L.A. - Arches S.A.S., wholly-owned by F.I.L.A.
S.p.A., which acquired the business unit specialised in fine arts operating through the ARCHES® brand,
resulting in an increase in “Concessions, licenses, trademarks and similar rights” of Euro 12,376
thousand, partially offset by amortisation for the year of Euro 5,081 thousand and exchange losses of
Euro 6,510 thousand. In addition, a significant amount of the amortisation relates to Business
combinations undertaken in 2018 and concerning the brands of the Pacon Group (Euro 31,903
thousand) and in 2016 relating to the brands of the UK Group Daler Rowney (Euro 40,223 thousand)
and the Canson Group (Euro 32,400 thousand).
The other historic trademarks subject to amortisation refer principally to “Lapimex” held by F.I.L.A.-
Dixon, S.A. de C.V. (Mexico) and the “Lyra” brands held by Lyra KG (Germany) and “DOMS” held
by DOMS Industries Pvt Ltd (India).
The average useful life of the “Concessions, Licenses, Trademarks and Similar Rights”, recognised in
the financial statements of December 31, 2020, is 30 years. Trademarks are amortised on the basis of
their useful lives and tested for impairment to below their recoverable amount when there are signs that
they may have become impaired.
“Other” amounts to Euro 154,428 thousand at the reporting date (Euro 165,496 thousand at December
31, 2019). The decrease on the previous year of Euro 11,068 thousand was due to (i) increases of Euro
10,369 thousand following the M&A transaction of the French company F.I.L.A.-Arches S.A.S.,
wholly- owned by F.I.L.A. S.p.A., which acquired the business line specialised in fine arts operating
under the ARCHES® brand, (ii) net investments of Euro 821 thousand undertaken during the year,
primarily involving the implementation and roll-out of ERP (Enterprise Resource Planning) to certain
Group companies, (iii) decreases due to amortisation of Euro 10,222 thousand referring in particular to
“Development Technology” recognised by the companies of the Daler-Rowney Lukas Group (Euro
30,532 thousand), the Canson Group (Euro 1,500 thousand) and St. Cuthberts (Euro 2,462 thousand),
identified as strategic assets through the “Purchase Price Allocation” within the business combinations
undertaken in 2016 and “Customer Relationship” determined by the “Purchase Price Allocation” as part

F.I.L.A. Group
101
of the business combination resulting in the acquisition of the Pacon Group and (iv) decreases due to
exchange losses of Euro 12,504 thousand.
The average useful life of “Other”, recognised in the financial assets at December 31, 2020, is 30 years.
Assets under development totalled Euro 2,208 thousand, entirely attributable to F.I.L.A. S.p.A. and
relating to investments for the installation of the ERP system not yet activated during the year.
With regards to intangible assets with finite useful lives, no impairment indicators were identified
during the year.

F.I.L.A. Group
102
Note 2 - Property, Plant and Equipment
At December 31, 2020, property, plant and equipment amounted to Euro 171,489 thousand (Euro
186,013 thousand at December 31, 2019), consisting of Euro 96,622 thousand of property,
plant and equipment (“Note 2.A - Property, Plant and Equipment”) and Euro 74,867 thousand
of right-of-use assets (“Note 2.B - Right-of-Use assets”).
The changes of the year are shown below:
Euro thousands
Land BuildingsPlant and
machinery
Industrial and
commercial
equipment
Other assetsAssets under
constructionTotal
Historical cost
December 31, 2018 13,305 59,602 126,209 18,446 13,303 5,213 236,078
Increases 137 4,015 12,012 5,420 (305) 775 22,054
Investments 77 3,379 8,024 1,129 1,305 3,298 17,212
Transfers from assets under construction - 97 1,151 338 - (1,586) -
Reclassifications (104) 104 972 3,741 (1,841) (978) 1,894
Exchange gains 164 435 1,766 212 146 41 2,764
Other - - 99 - 85 - 184
Decreases - (258) (2,647) (3.663) (3,137) (1,546) (11,251)
Disinvestments - (96) (2,097) (3,837) (2,645) (1,546) (10,221)
Impairment losses - (162) (5) (1) (12) - (180)
Change in consolidation scope - - (84) (2) (9) - (95)
Other - - (461) 177 (471) - (755)
December 31, 2019 13,442 63,359 135,575 20,202 9,862 4,441 246,881
Increases 112 3,815 8,909 2,959 698 (2.949) 13,544
Investments 112 2,154 4,425 ,665 ,675 1,155 9,186
Transfers from assets under construction - 525 3,507 1.575 - (5,607) -
Reclassifications - - (719) ,719 - - -
Change in consolidation scope - 1.136 1,634 - 10 1.503 4,283
Other - - 62 - 13 - 75
Decreases 641 (2.070) (8,665) (2.148) (1,211) (,392) 15,128
Disinvestments - (84) (1,893) (1,532) (,428) - (3,937)
Impairment losses - (8) (159) (14) (10) - 191
Exchange losses (641) (1.978) (6.613) (602) (773) (392) (11.000)
December 31, 2020 12,913 65,103 135,819 21,014 9,349 1,099 245,297
Accumulated depreciation
December 31, 2018 (31,866) (73,140) (16,477) (10,123) (131,606)
Increases (2,629) (12,155) (3.177) (261) (18,221)
Depreciation (2,498) (11,134) (1,190) (616) (15,429)
Reclassifications - 6 (1,805) 528 (1,271)
Change in consolidation scope - (4) 4 - -
Exchange gains (140) (984) (186) (99) (1,409)
Other - (39) - (74) (113)
Decreases (139) 2,246 3,800 2,680 8,587
Disinvestments (139) 1,952 3,813 2,400 8,026
Change in consolidation scope - 13 - 3 16
Other - 281 (13) 277 545
December 31, 2019 (34,633) (83,050) (15,855) (7,703) (141,241)
Increases (2,421) (11,502) (1.727) (764) (16,414)
Depreciation (2,421) (11,452) (1,724) (761) 16,361
Reclassifications 3 - (3) - -
Impairment losses - - - 6 6
Other - (50) - (9) (59)
Decreases 666 5,475 1,906 933 8,980
Disinvestments 56 1,715 1,540 336 3,683
Exchange losses 610 3,724 366 597 5,297
December 31, 2020 (36,389) (89,076) (15,675) (7,535) (148,675)
Carrying amount at December 31, 2018 13,305 (27,736) 53,068 1,968 3,182 5,213 104,472
Carrying amount at December 31, 2019 13,442 28,726 52,524 4,348 2,159 4,441 105,640
Carrying amount at December 31, 2020 12,913 28,715 46,743 5,339 1,813 1,099 96,622
Change (529) (11) (5,781) 991 (436) (3,342) (9,018)
Note 2.A - PROPERTY, PLANT AND EQUIPMENT

F.I.L.A. Group
103
“Land” at December 31, 2020 amounts to Euro 12,913 thousand (Euro 13,442 thousand at December
31, 2019) and includes the land relating to the buildings and production facilities owned by the company
F.I.L.A. S.p.A. (Rufina Scopeti – Italy), by subsidiaries Lyra KG (Germany), DOMS Industries Pvt Ltd
(India), Daler Rowney Ltd (UK) and Canson SAS (France). The decrease of Euro 529 thousand was
primarily due to exchange losses of Euro 641 thousand, to investments of Euro 112 thousand by the
Indian subsidiary DOMS Industries Pvt Ltd which over recent years has acquired the lands close to the
main production plant in order to extend the centralised storage and production site.
“Buildings” at December 31, 2020 amount to Euro 28,715 thousand (Euro 28,726 thousand at
December 31, 2019) and mainly concern the buildings of the Group’s production facilities. The decrease
on December 31, 2019 was Euro 11 thousand. Net investments amount to Euro 2,126 thousand and
refer mainly to the Indian company DOMS Industries PVT Ltd (Euro 1,617 thousand), relating to the
centralised storage and production site extension plan, whereas assets under construction were
capitalised for Euro 525 thousand.
The change in the consolidation scope concerns the building forming part of the new acquired business
unit.
Depreciation of Euro 2,424 thousand particularly concerns Canson SAS (France), F.I.L.A. S.p.A.,
DOMS Industries Pvt Ltd (India) and Dixon Ticonderoga Company (U.S.A.).
“Plant and Machinery” amount to Euro 46,743 thousand (Euro 52,524 thousand at December 31, 2019).
Compared to the first half of the previous year, this caption decreased by Euro 5,781 thousand. The
main changes in this category concern net investments of Euro 4,283 thousand, mainly by DOMS
Industries Pvt Ltd (India) for Euro 2,603 thousand, and by Grupo F.I.L.A.-Dixon, S.A. de C.V.
(Mexico) for Euro 602 thousand. In addition, assets under construction were capitalised for Euro 3,507
thousand. These increases were offset by depreciation of Euro 11,452 thousand and exchange losses of
Euro 2,889 thousand.
The change in the consolidation scope concerns the Plant and Machinery included in the acquired
business unit.
“Industrial and Commercial Equipment” amounted to Euro 5,339 thousand at December 31, 2020 (Euro
4,348 thousand at December 31, 2019). The increase of Euro 991 thousand was mainly due to net
investments of Euro 673 thousand, primarily undertaken by Dixon Ticonderoga Company (U.S.A) for
Euro 328 thousand, Daler Rowney Ltd (UK) for Euro 98 thousand and Lyra KG (Germany) for Euro
89 thousand.
“Other Assets” amount to Euro 1,813 thousand at December 31, 2020 (Euro 2,159 thousand at

F.I.L.A. Group
104
December 31, 2019) and include furniture and office equipment, electronic office equipment and motor
vehicles. The decrease of Euro 346 thousand is mainly due to investments of Euro 583 thousand, mainly
by DOMS Industries Pvt Ltd (India) for Euro 193 thousand, F.I.L.A. S.p.A. (Italy) for Euro 180
thousand and FILA SA (South Africa) for Euro 91 thousand, offset by depreciation for the year of Euro
761 thousand and exchange losses of Euro 176 thousand.
“Assets under construction” include internal constructions undertaken by the individual companies of
the Group which are not yet operational. The carrying amount at December 31, 2020 was Euro 1,099
thousand, decreasing on the previous year by Euro 3,342 thousand, mainly due to the transfer to assets,
principally by the American subsidiary Dixon Ticonderoga Company (Euro 1,850 thousand) and by the
French subsidiary Fila Arches (Euro 1,503 thousand).
There is no property, plant and equipment subject to restrictions.

F.I.L.A. Group
105
Right-of-Use assets
The Group has adopted IFRS 16 “Leases” from January 1, 2019 and recognised in the statement of
financial position right-of-use assets and lease liabilities, with the exception of short-term contracts
(less than 12 months) or low value leases (less than Euro 5 thousand), for which the Group applied the
recognition and measurement exemptions under IFRS 16.
“Buildings” at December 31, 2020 amounted to Euro 72,357 thousand (Euro 77,231 thousand at
December 31, 2019), decreasing Euro 4,874 thousand on the previous year. This decrease is mainly due
to net investments of Euro 11,462 thousand by the US subsidiary Dixon USA Ticonderoga (Euro 8,960
thousand) and the UK subsidiary Daler Rowney Ltd (Euro 1,470 thousand), partially offset by exchange
losses of Euro 1,953 thousand and depreciation for the year of Euro 9,735 thousand.
“Plant and machinery” amounted to Euro 212 thousand at December 31, 2020 (Euro 465 thousand at
December 31, 2019). Compared to the previous year, this item decreased by Euro 253 thousand.
Euro thousands
BuildingsPlant and
machinery
Industrial and
commercial
equipment
Other assets Total
Historic cost
December 31, 2018 - - - - -
Initial recognition 72,613 756 197 2,458 76,024
Investments 13,393 196 220 1,048 14,857
December 31, 2019 86,006 952 417 3,506 90,881
Increases 12,189 184 84 758 13,215
Investments 12,189 184 84 758 13,215
Decreases (9,078) (780) (44) (690) (10,601)
Disinvestments (1,159) (611) (34) (485) (2,289)
Impairment losses (869) - - - (869)
Exchange losses (7,050) (177) (10) (205) (7,443)
December 31, 2020 89,118 348 456 3,573 (93,495)
Accumulated depreciation
December 31, 2018 - - - - -
Initial recognition (721) (41) (6) (92) (860)
Depreciation (8,054) (455) (66) (1,087) (9.662)
Exchange gains (losses) - 9 (1) 7 15
December 31, 2019 (8,775) (487) (73) (1,172) (10,508)
Increases (8,638) 22 (134) (871) (9,621)
Depreciation (9,735) (102) (137) (1,000) (10,974)
Exchange gains 1,097 124 3 129 1,353
Decreases 652 329 24 496 1.501
Disinvestments 432 329 24 496 1,281
Other 220 - - - 220
December 31, 2019 (16,761) (136) (183) (1.548) (18,628)
Carrying amount at December 31, 2019 77,231 465 344 (2,333) (80,373)
Carrying amount at December 31, 2020 72,357 212 273 2,025 74,867
Change (4,874) (253) (71) (308) (5,506)
Nota 2.B RIGHT-OF-USE ASSETS

F.I.L.A. Group
106
Changes concern net divestments of Euro 98 thousand, mainly by the Brazilian subsidiary Canson
Brazil, exchange losses of Euro 53 thousand and depreciation for the year of Euro 102 thousand.
“Industrial and Commercial Equipment” amounted to Euro 273 thousand at December 31, 2020 (Euro
344 thousand at December 31, 2019). The decrease of Euro 71 thousand was mainly due to net
investments of Euro 74 thousand, mainly attributable to the Chinese subsidiary Fila Dixon Stationery
Kunshan (Euro 35 thousand) and the Italian subsidiary Industria Maimeri S.p.A. (Euro 25 thousand),
offset by depreciation for the year of Euro 137 thousand.
“Other Assets” referred mainly to vehicles at December 31, 2020 and amounted to Euro 2,025 thousand
(Euro 2,333 thousand at December 31, 2019). Compared to the previous year, this item decreased by
Euro 308 thousand, due to net investments of Euro 769 thousand, mainly made by Canson S.A.S. for
Euro 305 thousand, the Parent F.I.L.A. S.p.A. for Euro 185 thousand, and the subsidiary Lyra KG
(Germany) for Euro 120 thousand, offset by depreciation for the year of Euro 1,000 thousand and
exchange losses of Euro 76 thousand.

F.I.L.A. Group
107
Note 3 – Financial assets
“Financial assets” amount to Euro 3,236 thousand at December 31, 2020 (Euro 3,952 thousand at
December 31, 2019).
Financial investments held to maturity
This item amounts to Euro 375 thousand and relates to banking products of a financial nature held by
the Chinese subsidiary Fila Dixon Stationery Kunshan.
Loans and Receivables
These amount to Euro 145 thousand and concern receivables of a financial nature claimed from third
parties and recognised by F.I.L.A. S.p.A.
Other financial assets
“Other financial assets” totalled Euro 2,716 thousand (Euro 2,801 thousand at December 31, 2019),
decreasing Euro 85 thousand. They mainly concern the guarantee deposits on goods and service supply
contracts of the various Group companies, including in particular DOMS Industries Pvt Ltd (India)
(Euro 1,327 thousand) and Grupo F.I.L.A.-Dixon, S.A. de C.V. (Mexico) (Euro 292 thousand). The
Euro 604 thousand recognised by Dixon Ticonderoga Company (U.S.A.) concern assets underlying
employee indemnity plans.
“Loans and receivables” and “Other financial assets” are stated at amortised cost in accordance with
IFRS 9.
Euro thousands
Financial Investments Held to
Maturity: Interest
Loans and
Receivables
Other financial
assets Total
December 31, 2019 - 1,151 2,801 3,952
non-current portion - 1,070 2,713 3,783
current portion 81 88 169
December 31, 2020 375 145 2,716 316
non-current portion - 68 2,546 2,614
current portion 375 77 170 622
Change 375 (1,006) (85) (716)
non-current portion - (1,002) (167) (1,169)
current portion 375 (4) 82 453
Note 3.A - FINANCIAL ASSETS

F.I.L.A. Group
108
Note 4 - Equity-accounted investees
“Equity-accounted investees” amount to Euro 1.102 thousand (Euro 947 thousand at December 31,
2019).
The increase of the year relates to the two investments in associates held by DOMS Industries Pvt Ltd
(India). At December 31, 2020, the carrying amount of the investments was adjusted in line with the
share of equity held in the associates.
The investment in Pioneer Stationary Pvt Ltd (India) increased by Euro 443 thousand, partially offset
by the reduction in the investment in Uniwrite Pens Plastics Pvt Ltd for an amount of Euro 172 thousand.
Exchange losses of Euro 116 thousand were recognised.
Note 5 - Other investments
“Other investments”, amounting to Euro 31 thousand, relate to F.I.L.A. S.p.A.’s Euro 28 thousand
investment in Maimeri S.p.A. corresponding to 1% of irs share capital, and in the consortiums Conai,
Energia Elettrica Zona Mugello and Energia Elettrica Milano by F.I.L.A. S.p.A. at December 31, 2020.
Euro thousandsInv. in associates
December 31, 2018 767
Increases 187
Investments 187
Decreases (7)
Exchange losses (7)
December 31, 2019 947
Increases 271
Investments 271
Decreases (116)
Exchange losses (116)
December 31, 2020 1.102
Change 155
Note 4.A EQUITY-ACCOUNTED INVESTEES
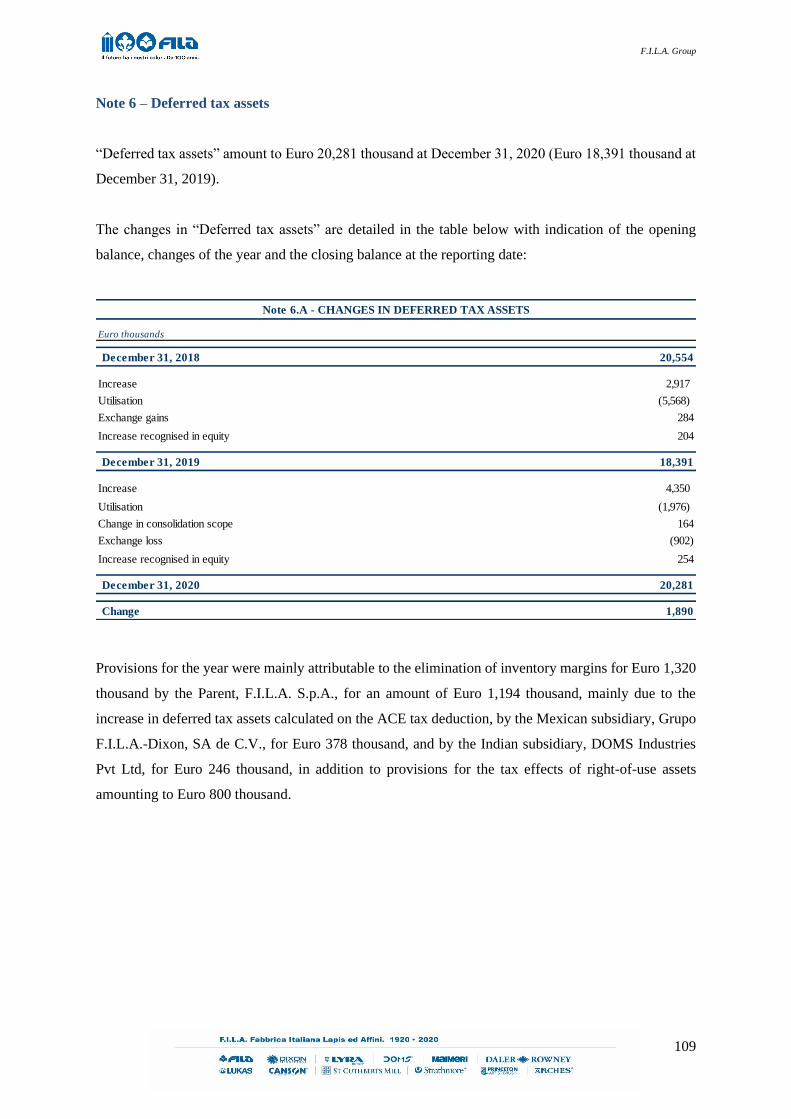
F.I.L.A. Group
109
Note 6 – Deferred tax assets
“Deferred tax assets” amount to Euro 20,281 thousand at December 31, 2020 (Euro 18,391 thousand at
December 31, 2019).
The changes in “Deferred tax assets” are detailed in the table below with indication of the opening
balance, changes of the year and the closing balance at the reporting date:
Provisions for the year were mainly attributable to the elimination of inventory margins for Euro 1,320
thousand by the Parent, F.I.L.A. S.p.A., for an amount of Euro 1,194 thousand, mainly due to the
increase in deferred tax assets calculated on the ACE tax deduction, by the Mexican subsidiary, Grupo
F.I.L.A.-Dixon, SA de C.V., for Euro 378 thousand, and by the Indian subsidiary, DOMS Industries
Pvt Ltd, for Euro 246 thousand, in addition to provisions for the tax effects of right-of-use assets
amounting to Euro 800 thousand.
Euro thousands
December 31, 2018 20,554
Increase 2,917
Utilisation (5,568)
Exchange gains 284
Increase recognised in equity 204
December 31, 2019 18,391
Increase 4,350
Utilisation (1,976)
Change in consolidation scope 164
Exchange loss (902)
Increase recognised in equity 254
December 31, 2020 20,281
Change 1,890
Note 6.A - CHANGES IN DEFERRED TAX ASSETS

F.I.L.A. Group
110
Deferred tax assets recognised in an equity reserve relate to the change in the IAS 19 reserve.
The following table breaks down the balance of deferred tax assets by nature at year-end:
Deferred tax assets recognised at the reporting date concerned the amounts of probable realisation based
on management estimates of future taxable income.
Note 7 - Current tax assets
At December 31, 2020, tax assets relating to income tax amounted overall to Euro 9,882 thousand (Euro
11,097 thousand at December 31, 2019) and refer principally to Dixon Ticonderoga Co. (USA) for Euro
3,990 thousand, the Company F.I.L.A. S.p.A. for Euro 2,180 thousand and DOMS Industries Pvt Ltd
(India) for Euro 1,489 thousand.
Statement of Financial Position
Euro thousands2020
Variation in
Consolidation Scope2019 2020 2019 2020 2019
Deferred tax assets relating to:
Intangible Assets - - 97 97 97 - -
Property, Plant and Equipment 943 - 377 566 (2,793) - -
Other Provision 1,006 - 1,037 (31) 938 - -
Trade Receivables and Other Assets 1,175 - 1,288 (113) (465) - -
Inventories 3,347 - 1,312 2,035 (1,065) - -
Personnel 2,938 164 1,899 785 334 254 (76)
Exchange gains (losses) - - - - - - -
Exchange difference recognised in "Translation Reserve" - - 283 619 (230) (902) 283
Other 3,906 - 3,602 140 1.276 - 280
Prior year tax losses 1,969 - 1,121 848 (1,543) - -
Deferred deductible costs 4,999 - 4,160 839 1.035 - -
ACE - - 3,215 (3.215) (232) - -
Total deferred tax assets 20,281 164 18,390 2,374 (2,648) (648) 487
NOTE 6.B - BREAKDOWN OF DEFERRED TAX ASSETS
Profit or loss Equity

F.I.L.A. Group
111
Note 8 - Inventories
Inventories at December 31, 2020 amount to Euro 256,288 thousand (Euro 258,409 thousand at
December 31, 2019):
This caption decreased Euro 2,121 thousand. The changes of this account during the year were mainly
due to the net increase in inventories of Euro 13,045 thousand, attributable in particular to the US
subsidiary Dixon Ticonderiga USA (Euro 16,053 thousand) and the Mexican subsidiary Gruppo
F.I.L.A.-Dixon, S.A. de C.V. (Euro 3,712 thousand), offset by the Parent F.I.L.A. S.p.A. (Euro 2,520
thousand), the German subsidiary Lyra KG (Euro 2,005 thousand) and the French subsidiary Canson
S.A.S. (Euro 1,374 thousand). In addition, there was a change in the consolidation scope of Euro 2,702
thousand and, lastly, all this was offset by exchange losses of Euro 17,806 thousand.
Inventories are presented net of the allowance for inventory write-down for raw materials (Euro 1,368
thousand), work-in-progress (Euro 401 thousand) and finished goods (Euro 4,383 thousand).
Euro thousands
Raw materials,
consumables and
supplies
Work in progress
and semi-finished
products
Finished goods Total
December 31, 2019 60,089 28,346 169,974 258,409
December 31, 2020 58,304 27,281 170,703 256,288
Change (1,785) (1,065) 729 (2,121)
Note 8.A - INVENTORIES

F.I.L.A. Group
112
The provisions refer to obsolete or slow-moving materials for which it is not considered possible to
recover their value through sale.
Note 9 – Trade receivables and other assets
Trade receivables and other assets amount to Euro 115,929 thousand at December 31, 2020 (Euro
141,339 thousand at December 31, 2019):
Trade receivables decreased on December 31, 2019 by Euro 23,939 thousand, mainly due to Dixon
Ticonderoga Company (U.S.A.), Grupo F.I.L.A.-Dixon, S.A. de C.V. (Mexico) and Fila Chile (Chile),
in addition to a exchange losses of Euro 11,358 thousand.
Euro thousands
Raw materials,
consumables and
supplies
Work in progress
and semi-finished
products
Finished goods Total
December 31, 2018 1,450 357 4,712 6,519
Accruals 498 249 (275) 472
Utilisation (278) (34) (106) (418)
Release (50) (135) 31 (154)
Exchange gains (losses) 1 - 5 6
December 31, 2019 1,621 437 4,367 6,425
Accruals 373 269 668 1,310
Utilisation (585) (252) (238) (1,075)
Release (41) (53) (163) (256)
Exchange gains (losses) - - (251) (251)
December 31, 2020 1,368 401 4,383 6,152
Change (253) (36) 16 (272)
Note 8.B- CHANGE IN THE ALLOWANCE FOR INVENTORY WRITE-DOWN
Euro thousands
December 31,
2020
December 31,
2019Change
Trade receivables 102,155 126,094 (23.939)
Tax assets 2,420 3,005 (585)
Other 7,470 7,317 153
Prepayments and accrued income 3,884 4,923 (1.039)
Total 115,929 141,339 (25,410)
Note 9.A - TRADE RECEIVABLES AND OTHER ASSETS

F.I.L.A. Group
113
Trade receivables broken down by country are illustrated below:
The changes in the loss allowance to cover doubtful positions are illustrated in the table below:
The Group measures the loss allowance at an amount reflecting the lifetime expected credit losses of
the asset. In order to establish whether the credit risk concerning a financial asset has increased
significantly after initial recognition in order to assess expected credit losses on assets, the Group
considers reasonable and demonstrable information which is pertinent and available without excessive
cost or burden. Quantitative and qualitative information and analysis, based on historic Group
experience, to assess the asset - in addition to information indicative of expected developments - is
included. The allowance was used for Euro 966 thousand, mainly due to the US subsidiary Dixon
Ticonderoga Company (Euro 443 thousand), the Brazilian subsidiary Canson Brasil (Euro 230
thousand) and the Parent F.I.L.A. S.p.A. (Euro 200 thousand).
Euro thousands
December 31,
2020
December 31,
2019Change
Europe 38,024 34,505 3.519
North America 22,095 30,973 (8,878)
Central-South America 33,526 50,043 (16,517)
Asia 6,727 8,028 (1,301)
Other 1,783 2,545 (763)
Total 102,155 126,095 (23,940)
TRADE RECEIVABLES BY GEOGRAPHICAL SEGMENT
Euro thousands
December 31, 2018 7,361
Provisions 1,892
Utilisation (3,275)
Release (68)
Exchange gains 60
Other changes (26)
December 31, 2019 5,945
Provisions 2.084
Utilisation (966)
Release (383)
Exchange loss (550)
Other changes (493)
December 31, 2020 5,637
Change (308)
Note 9.B - CHANGES IN THE LOSS ALLOWANCE

F.I.L.A. Group
114
“Tax assets” totalled Euro 2,420 thousand at December 31, 2020 (Euro 3,005 thousand at December
31, 2019) and include VAT assets (Euro 1,777 thousand) and other tax assets for local taxes other than
direct income taxes (Euro 643 thousand). The decrease compared to the previous year principally
concerns the Chinese subsidiary Dixon China for Euro 242 thousand and the French subsidiary Canson
SAS for Euro 217 thousand.
“Other Assets” amount to Euro 7,470 thousand at December 31, 2020 (Euro 7,317 thousand at
December 31, 2019) and mainly concern receivables from employees (Euro 550 thousand), from social
security institutions (Euro 31 thousand) and advances paid to suppliers (Euro 2,324 thousand),
principally concerning the Indian and Chinese subsidiaries. The carrying amount of “Other assets”
represents the fair value at the reporting date.
All of the above assets are due within 12 months.
Note 10 - Cash and cash equivalents
“Cash and cash equivalents” at December 31, 2020 amount to Euro 127,105 thousand (Euro 100,191
thousand at December 31, 2019):
"Bank and postal deposits" consist of temporary liquid funds generated within the treasury management
and mainly relating to ordinary current accounts of F.I.L.A. S.p.A. for Euro 49,610 thousand and current
accounts of the subsidiaries for Euro 77,494 thousand, in particular: Dixon Ticonderoga Company
(Euro 25,181 thousand), Daler Rowney Ltd (Euro 9,865 thousand), Canson SAS (Euro 3,559 thousand),
F.I.L.A. Iberia S.L. (Euro 7,927 thousand), the Dixon Group’s Chinese subsidiaries (Euro 7,035
thousand) and Grupo F.I.L.A.-Dixon, S.A. de C.V. (Euro 2,601 thousand).
Euro thousands
Bank and postal
deposits
Cash in hand and
other cash
equivalents
Total
December 31, 2019 100,056 135 100,191
December 31, 2020 126,991 114 127,105
Change 26,935 (21) 26,914
Note 10 - CASH AND CASH EQUIVALENTS

F.I.L.A. Group
115
“Cash in hand and other cash equivalents” amount to Euro 114 thousand, of which Euro 6 thousand
relates to the Parent F.I.L.A. S.p.A and Euro 108 thousand to the various subsidiaries.
Bank and postal deposits are remunerated at rates indexed to inter-bank rates such as Libor and Euribor.
There are no bank and postal deposits subject to restrictions.
Reference should be made to the “Statement of Financial Position” section for comments relating to the
net financial debt of the F.I.L.A. Group.

F.I.L.A. Group
116
Note 11 - Net financial debt
The F.I.L.A. Group “Net financial debt” at December 31, 2020 was Euro 493,456 thousand, with a
decrease of Euro 4,694 thousand on December 31, 2019. This decrease was partly due to the financial
liabilities arising from the application of IFRS 16, included in other current and non-current financial
liabilities.
Reference should be made to the “Statement of Financial Position” section for comments relating to the
net financial debt of the F.I.L.A. Group.
December 31,
2020
December 31,
2019Change
A Cash 114 135 (21)
B Other cash equivalents 126,991 100,057 26,934
C Securities held-for-trading - - -
D Cash and cash equivalents ( A + B + C) 127,105 100,192 26,913
-
E Current financial loan assets 622 169 453
F Current bank loans and borrowing (83,757) (79,511) (4,246)
G Current portion of non-current debt (29,658) (15,008) (14,650)
H Other current loans and borrowing (12,636) (8,187) (4,449)
I Current financial debt ( F + G + H ) (126,052) (102,706) (23,345)
-
J Net curre nt financial position (debt) (I + E+ D) 1,676 (2,355) 4,031
K Non-current bank loans and borrowing (399,506) (402,546) 3,040
L Bonds issued - - -
M Other non-current loans and borrowing (95,692) (94,328) (1,364)
N Non-current financial debt ( K + L + M ) (495,198) (496,874) 1,675
O Net financial debt (J+N) (493,522) (499,219) 5,696
P Loans issued to third parties 68 1,070 (1,002)
-
Q Net financial debt (O + P) - F.I.L.A. Group (493,456) (498,150) 4,694
Euro thousands

F.I.L.A. Group
117
Note 12 - Share Capital and Equity
Share capital
The subscribed and fully paid-up share capital at December 31, 2020 of the Parent F.I.L.A. S.p.A.
comprises 51,040,048 shares, as follows:
- 42,958,192 ordinary shares, without nominal value;
- 8,081,856 class B shares, without nominal value, which attribute 3 votes exercisable at the
shareholders’ meeting (ordinary and extraordinary) of F.I.L.A. S.p.A..
The breakdown of the share capital of F.I.L.A. S.p.A. is illustrated below:
According to the available information, published by Consob and updated at December 31, 2020, the
main shareholders of the Parent were:
Each ordinary share attributes voting rights without limitations.
Each class B share attributes three votes, in accordance with Article 127-sexies of Legislative Decree
No. 58/1998.
No. of shares % of share capital Euro Listing
Ordinary shares 42,958,192 84.16% 39,530,525 MTA - STAR Segment
Class B shares (multiple votes) 8,081,856 15.84% 7,436,999 Unquoted Shares
No. of shares % of share capital Euro Listing
Ordinary shares 42,958,192 84.16% 39,530,525 MTA - STAR Segment
Class B shares (multiple votes) 8,081,856 15.84% 7,436,999 Unquoted Shares
Shareholder Ordinary shares %
Pencil S.p.A. 13,694,564 31.88%
Venice European Investment Capital S.p.A. 2,535,000 7.71%
Sponsor 361,291 0.84%
Market investors 26,367,337 59.57%
Total 42,958,192
Shareholder Ordinary shares Class B shares Total Voting rights
Pencil S.p.A. 13,694,564 8,081,856 21,776,420 56.46%
Venice European Investment Capital S.p.A. 2,535,000 3,310,866 4.93%
Space Holding Srl 361,291 361,291 0.54%
Market investors 26,367,337 - 38.08%
Total 42,958,192 8,081,856 51,040,048

F.I.L.A. Group
118
Legal reserve
At December 31, 2020 this caption amounted to Euro 8,331 thousand. The increase of Euro 566
thousand as per the Shareholders’ resolution of April 22, 2020, is reported, which allocated a portion
of the profit for the year to the legal reserve in accordance with Article 2430 of the Italian Civil Code.
Share Premium Reserve
The reserve at December 31, 2020 amounts to Euro 154,473 thousand (Euro 153,608 thousand at
December 31, 2019). The increase of Euro 865 thousand is due to the price difference of the shares
allocated and subscribed in application of the medium/long-term incentive plan in favour of F.I.L.A.
Group management.
IAS 19 reserve
Following the application of IAS 19, the equity reserve is negative for Euro 5,303 thousand, decreasing
in the year by Euro 1,089 thousand limited to the share of the F.I.L.A. Group.
Other reserves
At December 31, 2020, the reserve is negative for Euro 42,828 thousand, decreasing Euro 8,405
thousand on December 31, 2019. The changes concern the following events:
The fair value reserve for hedging financial instruments (IRS) entered into by F.I.L.A. S.p.A.,
Dixon Ticonderoga Company (U.S.A.) and Canson SAS (France); at December 31, 2020 the
reserve was negative for Euro 18,767 thousand, with a decrease of Euro 6,009 thousand
compared to December 31, 2019 (negative for Euro 13,571 thousand) due to the adjustment of
the financial statements, offset by an increase due to foreign exchange gains of Euro 816
thousand. This change relates to the adjustment of the value of financial instruments for Euro
8 thousand to the fair value adjustment of the derivative of Canson SAS, for Euro 383 thousand
to the fair value adjustment of the derivative of F.I.L.A. S.p.A. and for Euro 5,618 thousand to
the fair value adjustment of the derivative of the US subsidiary Dixon Ticonderoga Company
(U.S.A.). For further information, reference should be made to Note 17 – Financial Instruments;
“Share Based Premium” reserve, totalling Euro 1,314 thousand and decreasing by Euro 733
thousand compared to the previous year end (Euro 2,047 thousand at December 31, 2019),
following the adjustment of the probability of occurrence of the vesting condition under the
medium/long-term incentive plan in favour of F.I.L.A. Group management, in view of the
current economic and social environment consequent to the Covid-19 pandemic, net of the
portion accruing in the period, and for Euro 956 thousand due to the exercise of the portion
allocated to the US management. The accounting treatment applied is in line with the
accounting standards which establish that for equity-settled share-based payments, the fair

F.I.L.A. Group
119
value at the vesting date of the share options granted to employees is recognised under
personnel expense, with a corresponding increase in equity under “Other reserves and retained
earnings”, over the period in which the employees will obtain the unconditional right to the
incentives. The amount recognised as cost is adjusted to reflect the effective number of
incentives (options) for which the conditions have vested and the achievement of “non-market”
conditions, in order that the final cost recognised is based on the number of incentives which
will vest. Similarly, in the initial estimate of the fair value of the options assigned, consideration
is taken of the non-vesting conditions. The changes to market value subsequent to the grant
date will not produce any financial statement effect.
Translation reserve
The reserve refers to the exchange differences relating to the translation of the financial statements of
subsidiaries prepared in local currencies and converted into Euro as the consolidation currency.
The changes in the “Translation Reserve” in 2020 are illustrated below (limited to the equity attributable
to the owners of the parent):
Retained earnings
The reserve totalled Euro 177,616 thousand and increased on the previous year end by Euro 24,000
thousand, relating to the allocation of the 2019 profit of Euro 24,000 thousand.
We highlight in addition the restriction on the distribution of a portion of retained earnings related to
the revaluation of the investment held in the company DOMS Industries Pvt Ltd (Euro 15,052
thousand), in accordance with Article 6, paragraph 1, letter a) of Legislative Decree No. 38 of February
28, 2005, following the purchase of the controlling interest.
Euro thousands
December 31, 2018 (16,057)
Changes
Difference between the average rate for the year and the closing rate (23,214)
Difference between the historical rate and the closing rate (585)
December 31, 2019 (39,856)
Change (23,799)
TRANSLATION RESERVE

F.I.L.A. Group
120
Equity attributable to non-controlling interests
Non-controlling interest equity decreased Euro 2,912 thousand, mainly due to:
Loss for the year attributable to non-controlling interests of Euro 485 thousand, primarily
relating to the Indian subsidiary DOMS Industries PVT Ltd;
Distribution of dividends to non-controlling interests of Euro 269 thousand;
Exchange differences for Euro 2,550 thousand;
IAS 19 reserve attributable to non-controlling interests of Euro 3 thousand;
Share capital increase of Euro 47 thousand by non-controlling interests in the Russian
subsidiary Fila Stationary O.O.O.;
Other decreases for Euro 342 thousand concerning the subsidiary Industria Maimeri S.p.A.
Basic and diluted earnings per share
The basic earnings per share are calculated by dividing the Group’s profit for the year by the weighted
average number of ordinary shares outstanding during the period, excluding any treasury shares.
The diluted earnings/(loss) per share is calculated by dividing the company’s profit for the year by the
weighted average number of ordinary shares outstanding during the year and those potentially arising
from the conversion of all potential ordinary shares with dilutive effect.
The basic and diluted earnings per share are reported in the Statement of Comprehensive Income, to
which reference should be made.
The table below illustrates the reconciliation between the equity of the Parent F.I.L.A. S.p.A. and the
consolidated equity and the reconciliation between the profit for the year of the Parent F.I.L.A. S.p.A.
and the profit for the year shown in the consolidated financial statements:

F.I.L.A. Group
121
Euro thousands
F.I.L.A. S.p.As equity 278,116
Elimination of infragroup margins and other consolidation entries (2,818)
Consolidation effect FILA Art and Craft (Israel) 366
Consolidation effect Dixon Ticonderoga group 43,022
Consolidation effect Lyra group 1.948
Consolidation effect FILA Stationary and Office Equipment Industry Ltd. Co. (Turkey) (2,168)
Consolidation effect FILA Stationary O.O.O. (Russia) (970)
Consolidation effect FILA Hellas (Greece) 1,028
Consolidation effect Industria Maimeri S.p.A. (Italy) (1,705)
Consolidation effect FILA S.A. (South Africa) (2,010)
Consolidation effect Fila Polska Sp. Z.o.o (Poland) 1,104
Consolidation effect DOMS Industries Pvt Ltd (India) 17,326
Consolidation effect Daler & Rowney Lukas Group (20,246)
Consolidation effect St. Cuthberts Holding (England) 495
Consolidation effect FILA Iberia S.L. (Spain) 8,232
Consolidation effect Canson Group 7,574
Consolidation effect FILA Art Product AG (Switzerland) 182
Consolidation effect Pacon Group 3,975
Consolidation effect Fila Arches (2,060)
Total equity 331,275
Consolidation effects attributable to non-controlling interests 23,268
F.I.L.A. group equity 308,007
Reconciliation at December 31, 2020 between Parent's Equity and F.I.L.A. Group Equity

F.I.L.A. Group
122
Euro thousands
F.I.L.A. S.p.A.’s profit for the year 8,125
Profit for the year of the subsidiarie s of the Parent 6.479
Elimination of the effects of transactions between consolidated companies:
Dividends (18,440)
Net Inventory Margins (1,501)
Adjustments to Group accounting policies
Stock Option Plan recognised by the Parent to the Subsidiaries 401
FTA of IFRS 9 245
Daler Rowney Lukas Group - reversal of impairment losses on equity investments in wound-up
"Dormant Entities" 7,505
Gruppo Canson - reversal of impairment losses on equity investments in wound-up 4,956
Reversal of the goodwill for the Superior business transfer 342
Total profit for the year 8,122
Profit for the year attributable to owners of the parent (485)
Profit for the year attributable to the owners of the Parent 8,607
Reconciliation at December 31, 2020 between Parent's Result and F.I.L.A. Group Result

F.I.L.A. Group
123
Note 13 - Financial Liabilities
The balance at December 31, 2020 amounts to Euro 602,484 thousand (Euro 586,009 thousand at
December 31, 2019), of which Euro 476,432 thousand non-current and Euro 126,052 thousand current.
The caption refers to both non-current and current portions of bank loans and borrowings, other loans
and borrowings and current account overdrafts in addition to lease liabilities as per IFRS 16.
The breakdown at December 31, 2020 is illustrated below:
Bank loans and borrowings With reference to “Bank loans and borrowings”, the total exposure of the
Group amounts to Euro 502,035 thousand, of which Euro 102,529 thousand considered as current (Euro
79,763 thousand at December 31, 2019) and Euro 399,506 thousand as non-current (Euro 402,546
thousand at December 31, 2019).
Bank interest liabilities, amounting to a positive Euro 5,248 thousand, include a positive Euro 6,168
thousand relating to amortised cost and a negative Euro 920 thousand relating to interest accrued on
outstanding loans, mainly relating to the Parent, FILA S.p.A., the subsidiary Dixon Ticonderoga
Company (U.S.A.) and Grupo F.I.L.A.-Dixon, S.A. de C.V. (Mexico).
The decrease in the non-current portion of Euro 3,040 thousand is primarily due to the net effect of the
following movements:
Increases of Euro 69,791 thousand regarding the Parent F.I.L.A. S.p.A. for Euro 69,330
thousand following the signing of two new loans, the first of which with Cassa Depositi e
Prestiti for Euro 30,000 thousand and the second with the same banking syndicate as used for
the structured loan for the purchase of the Pacon Group totalling Euro 40,000 thousand, of
which Euro 670 thousand already recognised as short-term as paid during the year and used for
the acquisition of the Arches brand products business. Euro 25,000 thousand obtained from the
drawdown of the Revolving Credit Facility already in place in addition to the Euro 461 thousand
recognised by the Italian subsidiary Industria Maimeri S.p.A.;
Decreases in the short-term portion of loans totalling Euro 57,600 thousand, of which Euro
Euro thousands Principal Interest Total Principal Interest Total Principal Interest Total Principal Interest Total
December 31, 2019 486,559 (4,250) 482,309 1,205 (31) 1,174 14,612 144 14,756 87,770 - 87.770 586,009
non-current portion 408,140 (5,594) 402,546 420 (23) 397 - - - 80,360 - 80,360 483,303
current portion 78,419 1,344 79,763 785 (8) 777 14,612 144 14,756 7,410 - 7,410 102,706
December 31, 2020 507,283 (5,248) 502,035 4,618 59 4,677 10,799 88 10,887 84,885 - 84,885 602,484
non-current portion 405,674 (6,168) 399,506 298 (2) 296 - - - 76,630 - 76,630 476,432
current portion 101,609 920 102,529 4,320 61 4,381 10,799 88 10,887 8,255 - 8,255 126,052
Change 20,724 (998) 19,726 (3,413) 90 3,503 (3,813) (56) (3,869) (2,885) - (2,885) 16,475
non-current portion (2,466) (574) (3,040) (122) 21 (101) - - - (3,730) - (3,730) (6,871)
current portion 23,190 (424) 22,766 3,535 69 3,604 (3,813) (56) (3,869) 845 - 845 (23,346)
Total
Note 13.A - FINANCIAL LIABILITIES: Third parties
Bank loans and borrowings Other loans and borrowings Current account overdrafts Lease liabilities

F.I.L.A. Group
124
30,000 thousand, relating to the new loan taken out with Cassa Depositi e Prestiti to be repaid
in November 2021, Euro 27,456 thousand relating to structured loans granted to the Parent
F.I.L.A. S.p.A. (Euro 14,063 thousand), the US subsidiary, Dixon Ticonderoga Company (Euro
12,549 thousand) and the French subsidiary, Canson SAS (Euro 844 thousand), in addition to
Euro 144 thousand relating to loans taken out by the Indian subsidiary, DOMS Industries Pvt
(Ltd);
Exchange gains of Euro 15,172 thousand;
Decreases for new interest measured at amortised cost of Euro 59 thousand.
Capital bank loans and borrowings at December 31, 2020, amounting to Euro 507,283 thousand (Euro
486,559 thousand at December 31, 2019) mainly comprise the structured loan taken out by F.I.LA.
S.p.A. and Dixon Ticonderoga Company (U.S.A.) for Euro 425,435 thousand, details of which for each
facility are provided below:
Facility A (Euro 121,036 thousand) and Facility A2 (Euro 4,687 thousand) stipulate a residual
repayment plan consisting of 10 half-yearly instalments, of which 4 instalments classified as current, as
their maturity date is before December 2021, while Facility B (Euro 240,069 thousand),Facility B2
(Euro 8,750 thousand) Facility C (Euro 25,000 thousand) and Facility C2 (Euro 893 thousand) are Bullet
loans, with fixed single repayment respectively on June 4, 2024 and June 4, 2023.
The Revolving Credit Facility stipulates the issue of short-term tranches of 1, 3 or 6 months, for a
maximum amount of Euro 50,000 thousand, currently used for Euro 25,000 thousand.
Euro thousands
Principal
F.I.L.A.
S.p.A.
Principal
Dixon Ticonderoga
Company (U.S.A.)
Total
Facility A 61,875 59,161 121,036
Facility A2 4,687 - 4,687
Facility B 90,000 150,069 240,069
Facility B2 8,750 - 8,750
Facility C 25,000 - 25,000
Facility C2 893 - 893
RCF 25,000 - 25,000
Total 216,205 209,230 425,435
Note 13.C - BANK LOANS AND BORROWINGS: BREAKDOWN

F.I.L.A. Group
125
The new structured loan was increased by Euro 40,000 thousand by the Parent F.I.L.A. S.p.A. with the
same banking syndicate as for the original structured loan, consisting of UniCredit S.p.A. as global
coordinator, Banca IMI S.P.A., Mediobanca Banca di Credito Finanziario S.p.A., Banca Nazionale del
Lavoro and Banco BPM S.p.A. as mandated lead arrangers and UniCredit Bank AG as security agent
and in support of the acquisition of the business unit involved in the production and sale of Arches
brand products. This loan disbursed to F.I.L.A. S.p.A. inherits from the previous structured loan the
breakdown into three facilities and the repayment plan.
The repayment plans by facility are outlined below:
The loan was initially recognised at fair value, including directly associated transaction costs. The initial
carrying amount was subsequently adjusted to account for repayments of principal, any impairment
losses and amortisation of the difference between the repayment amount and initial carrying amount.
Amortisation is calculated on the basis of the internal effective interest rate represented by the rate equal
to, at the moment of initial recognition, the present value of expected cash flows and the initial carrying
Euro thousands
FacilityPrincipal
F.I.L.A. S.p.A.
Principal
Dixon Ticonderoga
Company (U.S.A.)
Total
June 4, 2021 Facility A 5,625 5,379 11,004
December 6, 2021 Facility A 7,500 7,171 14,671
June 6, 2022 Facility A 7,500 7,171 14,671
December 5, 2022 Facility A 11,250 10,756 22,006
June 2, 2023 Facility A 30,000 28,684 58,684
Total - Facility A 61,875 59,161 121,036
June 4, 2021 Facility A2 402 - 402
December 6, 2021 Facility A2 536 - 536
June 6, 2022 Facility A2 536 - 536
December 5, 2022 Facility A2 803 - 803
June 2, 2023 Facility A2 2,410 - 2,410
Total - Facility A2 4,687 - 4,687
Bullet Loan - June 4, 2024 Facility B 90,000 155,000 245,000
Total - Facility B 90,000 155,000 245,000
Bullet Loan - June 4, 2024 Facility B2 8,750 8,750
Total - Facility B2 8,75000 - 8,75000
Bullet Loan - June 4, 2023 Facility C 25,000 25,000
Total - Facility C 25,000 - 25,000
Bullet Loan - June 4, 2023 Facility C2 893 893
Total - Facility C2 893 - 893
Bullet Loan - June 4, 2023 RCF (25,000) 25.000
Total - RCF (25,000) - 25.000
Total (216,205) (209,230) (425,435)
Note 13.D - BANK LOANS AND BORROWINGS: REPAYMENT PLAN
F.I.L.A. Group
126
amount (amortised cost method). The effect in 2020 of the amortised cost method is Euro 379 thousand
of interest (of which Euro 429 thousand concerning F.I.L.A. S.p.A. and Euro 50 thousand concerning
Dixon Ticonderoga U.S.A.). The non-current portion, in addition to the loan, includes the fair value of
the negotiation charges related to derivatives of Euro 6,168 thousand.
In addition to the loan described above, capital bank loans and borrowings, including Euro 81,848
thousand broken down into current (Euro 76,961 thousand) and non-current (Euro 4,887 thousand),
are described below.
The main bank current account exposures of the Group companies to banks concern:
Credit lines granted by Grupo Financiero BBVA Bancomer S.A., Banco Santander S.A., Banco
Sabadell S.A. and Scotiabank Inverlat S.A., Banco Nacional de Mexico, S.A. and HSBC
México, S.A. to Grupo F.I.L.A.-Dixon, S.A. de C.V. (Mexico) for a total of Euro 33,976
thousand;
A short-term loan of Euro 30,000 thousand recognised by the parent F.I.L.A. S.p.A. and taken
out with Cassa Depositi e Prestiti, due by November 2021;
The current portion of non-current debt of Euro 144 thousand and the credit lines granted to
DOMS Industries Pvt Ltd (India) by HDFC Bank for Euro 1,882 thousand and BNP Paribas
for Euro 2,873 thousand;
Credit lines issued to Lyra KG (Germany) by Commerzbank for Euro 1,500 thousand at
December 31, 2020. The current debt of the German company also comprises the loans issued
by Hypo Real Estate for Euro 1,000 thousand entirely classified as short-term.
The current portion of the loan contracted by Canson SAS (France) for Euro 844 thousand;
Short-term loans granted to Fila Chile Ltda (Chile) by Bank BICE and Bank BCI for Euro 1,139
thousand;
The current portion of the loans of Euro 1,235 thousand granted to Industria Maimeri by Banca
Popolare di Milano, Intesa and Unicredit;
The current portion of the loans granted mainly to the subsidiary FILA Stationary and Office
Equipment Industry Ltd. Co (Turkey) and the associate Fila Polska Sp Z.o.o (Poland) amounted
to Euro 2,512 thousand.
Non-current bank debt amounts to Euro 4,887 thousand and mainly relates to the non-current portions

F.I.L.A. Group
127
of the loans granted to:
Industria Maimeri S.p.A. (Italy) for Euro 1,061 thousand;
DOMS Industries Pvt Ltd (India) from HDFC Bank for Euro 221 thousand;
Canson SAS (France) from Intesa Sanpaolo for Euro 3,605 thousand.
The breakdown of current financial liabilities by due date is shown below:
Covenants
The F.I.L.A. Group, against the debt undertaken with leading banks (UniCredit S.p.A., Banca IMI
S.P.A., Mediobanca Banca di Credito Finanziario S.p.A., Banca Nazionale del Lavoro, Banco BPM
S.p.A. and UniCredit Bank AG) is subject to commitments and covenants.
Covenants are verified half-yearly and annually. In particular, the covenants on the loan contracts
concern: Net Financial Debt (NFD), gross operating profit /(loss) (EBITDA) and Net Financial Expense
(NFE), calculated on the basis of the F.I.L.A. Group’s half-year and annual consolidated financial
statements prepared in accordance with the IFRS.
The criteria for the calculation of the NFD and gross operating profit (loss) are established by the related
loan contract. The covenants for the loan undertaken by F.I.L.A. S.p.A. and Dixon Ticonderoga
Company (U.S.A.) are outlined below, applied from December 31, 2020:
Leverage Ratio at December 2020: NFD / Gross operating profit (loss) < 3.90
December 31, 2020
Euro thousands
Within
12 months
Within
1-2 years
Within
2-3 years
Within
3-4 years
Within
4-5 yearsTotal
Financial liabilities
Bank loans and borrowings(1)
113,416 39,813 112,492 246,128 1,072 512,922
Other loans and borrowings 4,381 255 41 - - 4,677
Expected cash flows 9,930 (40,068) (112,534) (246,128) (1,004) (389,804)
December 31, 2019
Euro thousands
Within
12 months
Within
1-2 years
Within
2-3 years
Within
3-4 years
Within
4-5 yearsTotal
Financial liabilities
Bank loans and borrowings 94,519 54,075 59,497 94,734 194,240 497,065
Other loans and borrowings 776 305 51 29 12 1,173
Expected cash flows 5,065 (54,380) (59,549) (94,763) (193,182) (396,808)
(1) The principal portion of the bank loans amounts to Euro 491,471 thousand euro, the medium-long term part has been adjusted considering an
amortised cost of Euro 5,594 thousand. The carrying amount is Euro 497,065 thousand.
(1) TThe principal portion of the bank loans amounts to Euro 506,754 thousand euro, the medium-long term part has been adjusted considering an
amortised cost of Euro 6,168 thousand. The carrying amount is Euro 512,922 thousand.

F.I.L.A. Group
128
As required by Consob Communication No. DEM/6064293 of 28/07/2006, we report that the impact of
non-compliance with the covenants as established by the underlying contracts essentially concerns the
possibility that the lending banks may revoke the loan contract and/or declare forfeiture of the
repayment conditions upon all or part of the loans.
At December 31, 2020, the F.I.L.A. Group had complied with the above covenants.
The structured debt was in any case negotiated with the lending banks in advance and no default would
be linked to any failure to comply with the financial covenants relating to the December 2020 tests
(“covenants holiday”), while the margin to be used to calculate the interest shall continue to be based
on the financial statements as at and for the year ended December 31, 2019 (if dividends are not
distributed to shareholders of FI.L.A. S.p.A. during the second half of 2020).
Financial liabilities - Other loans and borrowings
“Financial liabilities – Other loans and borrowings” at December 31, 2020 totalled Euro 4,677 thousand
(Euro 1,174 thousand at December 31, 2019), with the current portion totalling Euro 4,381 thousand
(Euro 777 thousand at December 31, 2019).
Financial Liabilities - Current Account Overdrafts
“Current account overdrafts” amounted to Euro 10,887 thousand (Euro 14,756 thousand at December
31, 2019) and mainly concern the overdrafts of Industria Maimeri S.p.A. (Euro 5,386 thousand), Fila
Stationary O.O.O. (Euro 1,188 thousand) and Cansos SAS (Euro 3,766 thousand).
Financial liabilities - IFRS 16
Financial liabilities at December 31, 2020 include the effects deriving from the adoption by the Group
of the new international accounting standard IFRS 16 which came into force on January 1, 2019 and
which led to a reduction of Euro 2,885 thousand as at December 31, 2020, of which Euro 3,730 thousand
as the non-current portion and an increase of Euro 845 thousand as the current portion.

F.I.L.A. Group
129
Liabilities at fair value at December 31, 2020 and December 31, 2019 are broken down as follows by
hierarchy level.
Fair value is divided into the following hierarchy levels:
Level 1: listed prices (not adjusted) on active markets for identical assets or liabilities;
Level 2: input data other than listed prices (included in Level 1) which are observable for
assets or liabilities, both directly (as in the case of prices) and indirectly (as derived from
prices);
Level 3: input data concerning assets or liabilities which are not based on observable market
data.
Euro thousands
December 31,
2020
Measurement
modelLevel 1 Level 2 Level 3
Financial Liabilities
Bank Loans and Borrowings 502,035 Amortised cost
Other Loans and Borrowigs 4,677 Amortised cost
Current account overdrafts 10,887 Amortised cost
Financial Instruments 18,767 Fair value 18,767
Trade Payables and Other Liabilities 100,542 Amortised cost
Total Financial Liabilities 636,909 - - 13,571
Euro thousands
December 31,
2019
Measurement
modelLevel 1 Level 2 Level 3
Financial Liabilities
Bank Loans and Borrowings 482,309 Amortised cost
Other Loans and Borrowigs 1,174 Amortised cost
Current account overdrafts 14,756 Amortised cost
Financial Instruments 13,571 Fair value 13,571
Trade Payables and Other Liabilities 108,670 Amortised cost
Total Financial Liabilities 620,480 - - 13,571

F.I.L.A. Group
130
In accordance with the latest amendments to IAS 7, the following table shows the variations in liabilities
(and any related assets) recognised in the statement of financial position, whose cash flows are or will
be recognised in the statement of cash flows as cash flows from financing activities.
Note 14 - Employee Benefits
The F.I.L.A. Group companies guarantee post-employment benefits for employees, both directly and
through contributions to external funds.
The means for accruing these benefits varies according to the legal, tax and economic conditions of
each country in which the Group operates. These benefits are based on remuneration and years of
employee service.
The benefits recognised to employees of the Parent F.I.L.A. S.p.A. concern salary-based Post-
Employment Benefits, governed by Italian legislation and in particular Article 2120 of the Italian Civil
Code. The amount of these benefits is in line with the contractually-established remuneration agreed
between the parties on hiring.
The other Group companies, particularly Daler Rowney Ltd (United Kingdom), Canson SAS (France),
DOMS Industries Pvt Ltd (India) and Fila Hellas (Greece) guarantee post-employment benefits, both
through defined contribution plans and defined benefit plans.
In the case of defined contribution plans, the Group companies pay the contributions to public or private
insurance institutions based on legal or contractual obligations, or on a voluntary basis. With the
payment of contributions, the companies fulfil all of their obligations. The cost is accrued based on
employment rendered and is recognised under personnel expense.
The defined benefit plans may be unfunded, or they may be partially or fully funded by the contributions
paid by the company, and sometimes by its employees to a company or fund, legally separate from the
Euro thousands
Banks Principal
Other Loans and
borrowings
Principal
Other Financial
Expenses
Financial expenses
TFR
Note 13 Note 13 Note 13 Note 17
December 31, 2019 (486,599) (1,205) 1,878 (146)
Cash Flows (41,907) (3,441) 2,660 (178)
Other changes:
Exchange losses 21,958 27
FV Variation
Change in amortised cost (776) 385
December 31, 2020 (507,284) (4,618) 3,045 (178)

F.I.L.A. Group
131
company which provides the benefits to the employees. The plans provide for a fixed contribution by
the employees and a variable contribution by the employer, necessary to at least satisfy the funding
requirements established by law and regulation in the individual countries.
Finally, the Group recognises employees other long-term benefits, generally issued on the reaching of
a fixed number of years of service or in the case of invalidity. In this instance, the amount of the
obligation recognised in the financial statements reflects the probability that the payment will be made
and the duration for which it will be made. These plans are calculated on an actuarial basis, utilising the
“projected unit credit” method.
The amounts at December 31, 2020 were as follows:
Actuarial losses accrued during 2020 totalled Euro 1,336 thousand and were recognised, net of the tax
effect, in the statement of comprehensive income and are mainly attributable to Daler Rowney Ltd (UK)
for Euro 1,053 thousand and to the French subsidiary Canson SAS for Euro 152 thousand.
Euro thousands
Post-employment benefits
(Italy)Other employee benefits Total
December 31, 2018 2,220 8,711 10,931
Benefits paid (1.095) (1.210) (2,305)
Interest cost 24 122 146
Service cost 947 876 1,823
Actuarial losses 108 931 1,039
Exchange losses - 166 166
December31 , 2019 2,204 9,596 11,800
Benefits paid (1.019) (410) (1,429)
Interest cost 37 141 178
Service cost 954 907 1,861
Actuarial gains/losses 165 1.171 1,336
Exchange losses 568 - 568
(1) (348) (349)
December31 , 2020 2,908 11,057 13,6950
Change 704 1,461 2,165
Note 14.A - ITALIAN POST-EMPLOYMENT BENEFITS AND OTHER EMPLOYEE BENEFITS

F.I.L.A. Group
132
The following table outlines the amount of employee benefits, broken down by funded and unfunded
by plan assets over the last two years:
The financial assets at December 31, 2020 invested by the F.I.L.A. Group to cover financial liabilities
arising from “Employee benefits” amount to Euro 1,480 thousand (Euro 3,569 thousand at December
31, 2019) relate to Grupo F.I.L.A.-Dixon, S.A. de C.V. (Mexico). The financial investments have an
average return of 5% on invested capital (equally broken down between investments in the “Ticket
PFG” fund and investments in guaranteed investment contracts). The “structure” of financial
investments at December 31, 2020 did not change on the previous year.
The table below highlights the net cost of employee benefit components recognised in profit or loss in
2020 and 2019:
The main actuarial assumptions used for the estimate of the post-employment benefits were the
following:
1. Employee benefit obligations December 31, 2020 December 31, 2019
Present value of obligations covered by unfunded plan assets 2,908 2,204
2,908 2,204
Present value of obligations covered by plan assets 12,537 13,165
Fair value of plan assets relating to the obligations (1,480) (3,569)
11,057 9,596
Total 13,965 11,800
EMPLOYEE BENEFIT PLANS
2. Cost recognised in profit or loss December 31, 2020 December 31, 2019
Service cost 1,861 1,823
Interest cost 178 146
Cost recognised in profit or loss 2,039 1,969
3. Main actuarial assumptions at reporting date (average values) December 31, 2019 December 31, 2019
Annual technical discount rate 1.8% 3.1%
Increase in cost of living index 1.6% 4.0%
Future salary increase 2.1% 3.2%
Future pension increase 1.6% 2.8%

F.I.L.A. Group
133
Details of the cash flows of employee benefits at December 31, 2020 are illustrated in the table below.
2021 2022 2023 2024 After 2024
Italian post-employment benefits (TFR) 2,908 199 219 198 139 2,154
Employee benefits 11,057 330 230 251 316 9,931
Total 13,965
* Euro thousands
Nota 14.B - EMPLOYEE BENEFIT: CASH FLOWS SCHEDULE
Nature AmountCash flows schedule
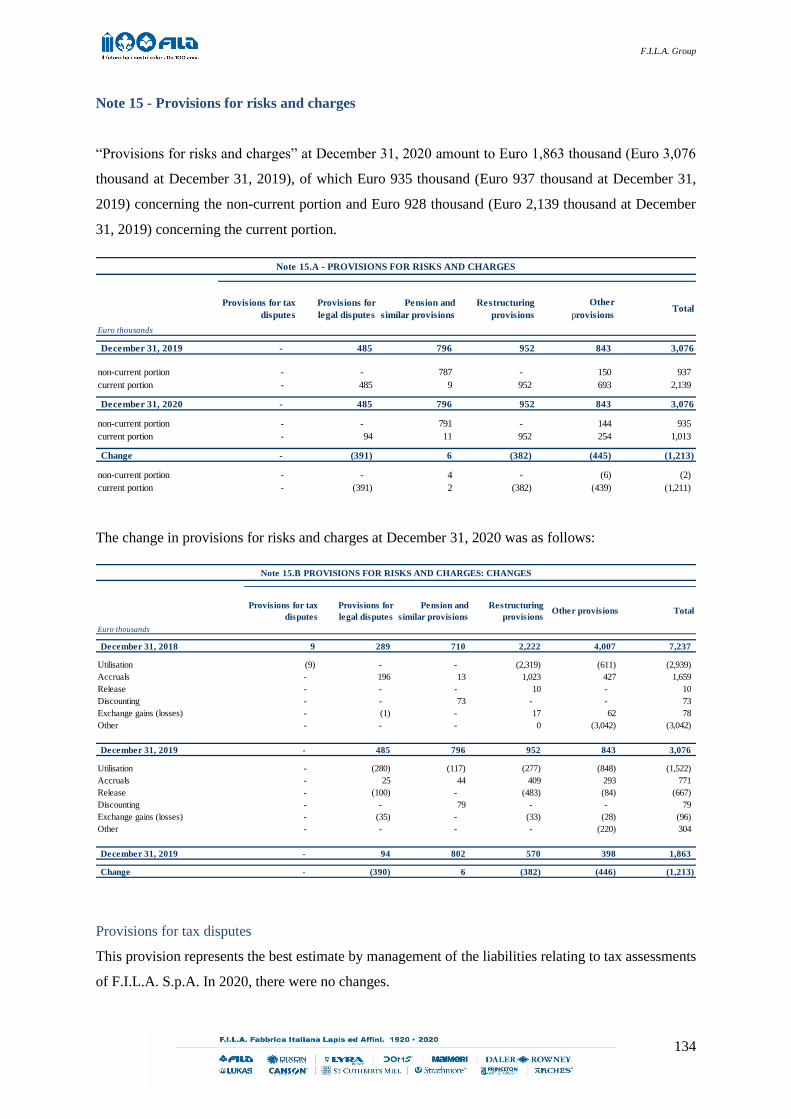
F.I.L.A. Group
134
Note 15 - Provisions for risks and charges
“Provisions for risks and charges” at December 31, 2020 amount to Euro 1,863 thousand (Euro 3,076
thousand at December 31, 2019), of which Euro 935 thousand (Euro 937 thousand at December 31,
2019) concerning the non-current portion and Euro 928 thousand (Euro 2,139 thousand at December
31, 2019) concerning the current portion.
The change in provisions for risks and charges at December 31, 2020 was as follows:
Provisions for tax disputes
This provision represents the best estimate by management of the liabilities relating to tax assessments
of F.I.L.A. S.p.A. In 2020, there were no changes.
Euro thousands
Provisions for tax
disputes
Provisions for
legal disputes
Pension and
similar provisions
Restructuring
provisions
Other
provisionsTotal
December 31, 2019 - 485 796 952 843 3,076
non-current portion - - 787 - 150 937
current portion - 485 9 952 693 2,139
December 31, 2020 - 485 796 952 843 3,076
non-current portion - - 791 - 144 935
current portion - 94 11 952 254 1,013
Change - (391) 6 (382) (445) (1,213)
non-current portion - - 4 - (6) (2)
current portion - (391) 2 (382) (439) (1,211)
Note 15.A - PROVISIONS FOR RISKS AND CHARGES
Euro thousands
Provisions for tax
disputes
Provisions for
legal disputes
Pension and
similar provisions
Restructuring
provisionsOther provisions Total
December 31, 2018 9 289 710 2,222 4,007 7,237
Utilisation (9) - - (2,319) (611) (2,939)
Accruals - 196 13 1,023 427 1,659
Release - - - 10 - 10
Discounting - - 73 - - 73
Exchange gains (losses) - (1) - 17 62 78
Other - - - 0 (3,042) (3,042)
December 31, 2019 - 485 796 952 843 3,076
Utilisation - (280) (117) (277) (848) (1,522)
Accruals - 25 44 409 293 771
Release - (100) - (483) (84) (667)
Discounting - - 79 - - 79
Exchange gains (losses) - (35) - (33) (28) (96)
Other - - - - (220) 304
December 31, 2019 - 94 802 570 398 1,863
Change - (390) 6 (382) (446) (1,213)
Note 15.B PROVISIONS FOR RISKS AND CHARGES: CHANGES

F.I.L.A. Group
135
Provisions for legal disputes
The provisions concern accruals made in relation to:
Legal proceedings arising from ordinary operating activities;
Legal proceedings concerning disputes with employees or former employees and agents.
The provision decreased by Euro 390 thousand due to the utilisation of the provision recognised by the
US subsidiary Dixon Ticonderoga Company (U.S.A.), amounting to Euro 280 thousand, and a release
by the German subsidiary Johann Froescheis Lyra Bleistift KG amounting to Euro 100 thousand. New
provisions were also recognised by the Brazilian subsidiary, Canson Brasil I.P.E. LTDA, amounting to
Euro 25 thousand, and in addition to foreign exchange losses of Euro 35 thousand.
Pension and similar provisions
This provision includes the agents’ leaving indemnity provision at December 31, 2020 of the Parent
F.I.L.A. S.p.A. and of the subsidiary Industria Maimeri S.p.A. The actuarial loss for 2020 was Euro 79
thousand. The actuarial changes in the year, net of the tax effect, are recognised directly in equity.
Restructuring provisions
For the integration and reorganisation of the Group structure following the corporate transactions of
recent years, a number of companies established provisions for risks and charges concerning personnel
mobility plans for a total at December 31, 2020 of Euro 570 thousand and decreased by Euro 382
thousand. The plans involve in particular the reorganisation of the North American strategic segment
which began in 2019, recognising utilisations of Euro 277 thousand, mainly by the US subsidiary Dixon
Ticonderoga Company (U.S.A.) for Euro 190 thousand. In addition, a new provision of Euro 409
thousand was recognised by the French subsidiary, Canson SAS, and a release of Euro 483 thousand
was used by the same French subsidiary in relation to the old reorganisation plans, now completed.
Other provisions
These total Euro 398 thousand and decreased by Euro 446 thousand, mainly due to the utilisation of
provisions by the US subsidiary Dixon Ticonderoga Company (U.S.A.).
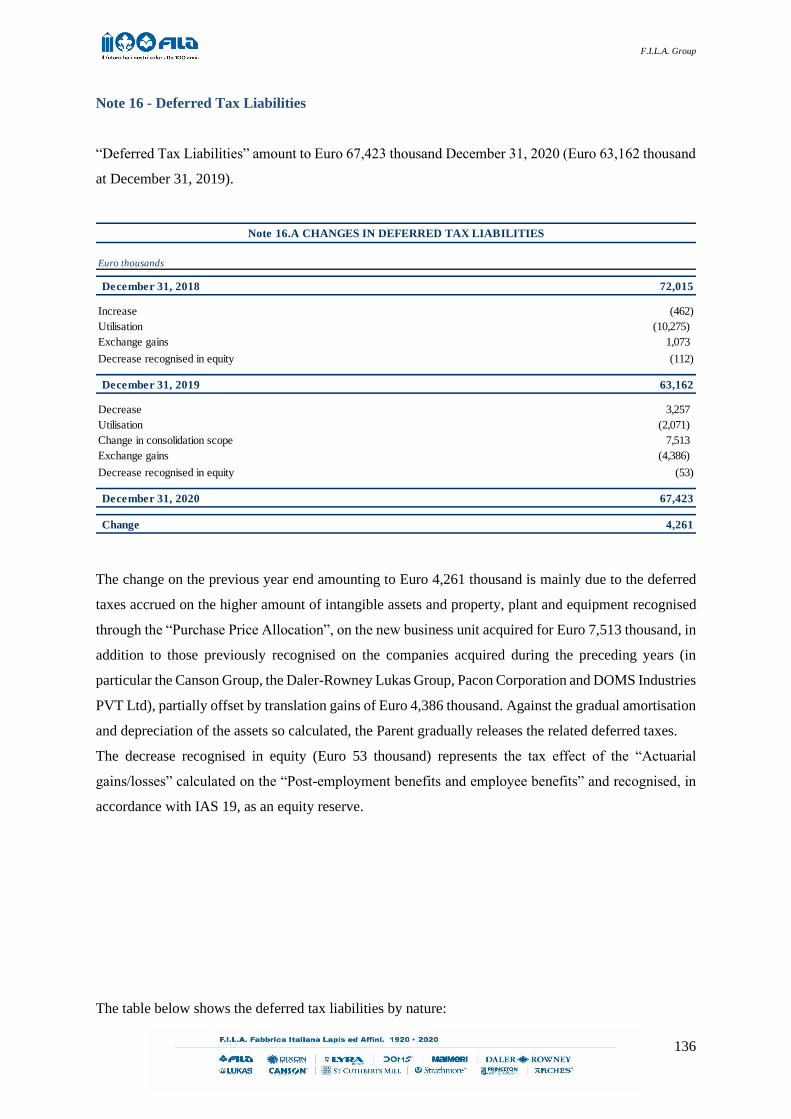
F.I.L.A. Group
136
Note 16 - Deferred Tax Liabilities
“Deferred Tax Liabilities” amount to Euro 67,423 thousand December 31, 2020 (Euro 63,162 thousand
at December 31, 2019).
The change on the previous year end amounting to Euro 4,261 thousand is mainly due to the deferred
taxes accrued on the higher amount of intangible assets and property, plant and equipment recognised
through the “Purchase Price Allocation”, on the new business unit acquired for Euro 7,513 thousand, in
addition to those previously recognised on the companies acquired during the preceding years (in
particular the Canson Group, the Daler-Rowney Lukas Group, Pacon Corporation and DOMS Industries
PVT Ltd), partially offset by translation gains of Euro 4,386 thousand. Against the gradual amortisation
and depreciation of the assets so calculated, the Parent gradually releases the related deferred taxes.
The decrease recognised in equity (Euro 53 thousand) represents the tax effect of the “Actuarial
gains/losses” calculated on the “Post-employment benefits and employee benefits” and recognised, in
accordance with IAS 19, as an equity reserve.
The table below shows the deferred tax liabilities by nature:
Euro thousands
December 31, 2018 72,015
Increase (462)
Utilisation (10,275)
Exchange gains 1,073
Decrease recognised in equity (112)
December 31, 2019 63,162
Decrease 3,257
Utilisation (2,071)
Change in consolidation scope 7,513
Exchange gains (4,386)
Decrease recognised in equity (53)
December 31, 2020 67,423
Change 4,261
Note 16.A CHANGES IN DEFERRED TAX LIABILITIES

F.I.L.A. Group
137
Note 17 - Financial instruments
“Financial instruments” at December 31, 2020 amount to Euro 18,767 thousand (Euro 13,571 thousand
at December 31, 2019) and refer to the fair value of loan hedging derivatives (hedged instrument),
issued in favour of F.I.L.A. S.p.A. (Euro 4,183 thousand) and Dixon Ticonderoga Company (U.S.A.)
(Euro 14,458 thousand), both for the acquisition of the Pacon Group and the refinancing of the debt
agreed by F.I.L.A. S.p.A. in 2016 (in support of the M&A transactions relating to the acquisition of the
Daler-Rowney Lukas Group, the Canson Group and St. Cuthberts Holding).
Canson SAS (France) also entered into a derivative to hedge borrowings (hedged instrument) agreed
by the company in support of investments relating to the implementation of the Annonay logistics hub
of Euro 126 thousand.
The accounting treatment adopted for the hedging instruments, based on IFRS 9, is based on hedge
accounting and in particular that concerning “cash flow hedges” and involving the recognition of a
financial asset or liability and an equity reserve.
Note 18 - Current Tax Liabilities
Euro thousands
2019Variation in
Consolidation Scope2019 2019 2019 2019 2019
Deferred tax liabilities relating to:
Intangible Assets 52,227 7,513 45,161 (446) 1,153 - -
Inventories 1,161 - 661 500 0 - -
Property, Plant and Equipment 12,556 - 15,028 (2,472) (2,687) - -
Personnel - IAS 19 - - 114 (61) (28) (53) (112)
Dividends - - 289 (289) 1 - -
Conversion difference accounted for as "Translation Reserve" - - 1,073 3.313 1.655 (4,386) 1,073
Other 1,479 - 837 642 (420) - -
Total deferred tax liabilities 67,423 7,513 63,162 1,186 (328) (4.439) 961
NOTE 16.B - BREAKDOWN OF DEFERRED TAX LIABILITIES
Statement of Financial Position Profit or Loss Equity

F.I.L.A. Group
138
“Current Tax Liabilities” total Euro 4,974 thousand at December 31, 2020 (Euro 7,296 thousand at
December 31, 2019), mainly attributable to the parent F.I.L.A. S.p.A. (Euro 323 thousand), Dixon
Ticonderoga Company (Euro 1,567 thousand), DOMS Industries Pvt Ltd (Euro 1,383 thousand) and
Canson SAS (Euro 213 thousand).
Note 19 - Trade payables and other liabilities
“Trade payables and other liabilities” at December 31, 2020 amount to Euro 100,542 thousand (Euro
108,670 thousand at December 31, 2019). The breakdown of “Trade payables and other liabilities” of
the F.I.L.A. Group is reported below:
The decrease in “Trade Payables” was Euro 7,779 thousand and mainly concerned the subsidiary Grupo
F.I.L.A. – Dixon, S.A. de C.V. (Mexico) for Euro 3,314 thousand, the Indian subsidiary DOMS
Industries Pvt Ltd for Euro 1,481 thousand and the Parent F.I.L.A. S.p.A. for Euro 1,393 thousand.
The change is mainly due to lower purchases linked to the containment of variable production costs.
Euro thousandsDecember, 2020 December, 2019 Change
Trade payables 68,418 76,197 (7,779)
Tax liabilities 8,631 9,735 (1,104)
Other 22,726 21,670 1,056
Accrued expenses and deferred income 767 1,068 (301)
Total 100,542 108,670 (8,128)
Note 19.A TRADE PAYABLES AND OTHER LIABILITIES

F.I.L.A. Group
139
The geographical breakdown of trade payables is shown below:
The carrying amount of trade payables at the reporting date approximates their “fair value”.
The trade payables reported above are due within 12 months.
Tax liabilities to third parties amount to Euro 8,631 thousand at December 31, 2020 (Euro 9,735
thousand at December 31, 2019), of which Euro 5,558 thousand VAT liabilities and Euro 3,073
thousand concerning tax liabilities other than current taxes, mainly recognized by F.I.L.A. S.p.A. (Euro
631 thousand) and relating to liabilities in connection with independent contractors. The residual
amount mainly refers to Canson SAS (Euro 376 thousand), Dixon Ticonderoga Company U.S.A (Euro
963 thousand) and the Chinese subsidiaries (Euro 309 thousand).
“Other” amounts to Euro 22,726 thousand at December 31, 2020 and mainly include:
Employee salaries of Euro 13,103 thousand (Euro 12,476 thousand at December 31, 2019);
Social security contributions to be paid of Euro 5,854 thousand (Euro 5,027 thousand at
December 31, 2019);
Payables for agent commissions of Euro 493 thousand (Euro 208 thousand at December 31,
2019);
Residual liabilities of Euro 3,276 thousand mainly concerning advances to clients (Euro 3,950
thousand at December 31, 2019).
The carrying amount of “Tax Liabilities”, “Other” and “Accrued expense and deferred income” at the
reporting date approximate their fair value.
With reference to the other non-current liabilities, the balance at December 31, 2020 amounted to Euro
38 thousand and refers to deposits paid by customers to guarantee long-term supply contracts of the
Indian company DOMS Industries Pvt Ltd (India).
Euro thousands
December 31,
2020
December 31,
2019Change
Europe 33,061 34,016 (954)
North America 21,505 21,163 342
Central-South America 5,353 8,883 (3,530)
Asia 8,319 11,951 (3,632)
Other 180 183 (3)
Total 68,418 76,197 (7,777)
TRADE PAYABLES BY GEOGRAPFICAL SEGMENT

F.I.L.A. Group
140
Note 20 – Revenue from sales and services
Revenue from sales and services in 2020 amounted to Euro 607,382 thousand (Euro 682,686 thousand
in 2019):
“Revenue from sales and services” of Euro 607,382 thousand,decreasing by Euro 75,304 thousand on
the same period of the previous year.
This decrease, improving on the first nine months of 2020 thanks to the partial reopening of schools in
Europe and North America and the excellent Fine arts business performance in the fourth quarter, is
attributable to the global contraction in consumption as a result of the impacts of the COVID-19
pandemic across the world and particularly the closure of schools, which lasted far longer than the initial
expectations in India and Mexico, regions in which the schools-related business and the significant lack
of alternative online channel are important factors.
Revenue from sales and services compared with the previous year by eegments, broken down by
geographical location” according to IFRS 15, is presented below:
Euro thousands
December 31, 2020 December 31, 2019 Change
Revenue from Sales and Services 655,295 732,138 (76,843)
Adjustments to Sales (47,913) (49,452) 1,539
Returns on Sales (13,494) (13,139) (355)
Discounts, Allowances and bonuses (34,419) (36,313) 1,894
Total 607,382 682,686 (75,304)
Note 20.A - REVENUE FROM SALES AND SERVICES
2020
Euro Thousand
Fine Art, Hobby & Digital 85,877 114,975 5,096 8,453 2,085 216,486
Industrial 10,854 6,527 642 655 - 18,678
School & Office 115,755 188,13 24,605 42,602 1,126 372,218
Revenue from Sales and Services 212,486 309,632 30,343 51,710 3,211 607,382
2019
Euro Thousand
Fine Art, Hobby & Digital 78,818 92,017 4,621 8,548 2,024 186,027
Industrial 10,386 6,212 2,079 643 34 19,353
School & Office 123,676 212,295 60,903 79,495 936 477,306
Revenue from Sales and Services 212,880 310,523 67,603 88,686 2,994 682,686
F.I.L.A. Group
Europe
EuropeNorth
America
Central - South
AmericaAsia
Rest
of the World
North
America
Central - South
AmericaAsia
Rest
of the World F.I.L.A. Group

F.I.L.A. Group
141
Note 21 – Other revenue and income
This caption relates to ordinary operations and does not include the sale of goods and provision of
services, in addition to realised and unrealised exchange gains on commercial transactions.
For further details on exchange differences, reference should be made to “Note 31 - Foreign currency
transactions”.
“Other revenue and income” in 2020 amounted to Euro 8,967 thousand (Euro 6,746 thousand in 2019).
“Other revenue and income” in 2020 of Euro 2,317 thousand principally includes income from the sale
of production waste by Group companies.
Euro thousands
December 31, 2020 December 31, 2019 Change
Europe 212,486 212,881 (395)
North America 309,632 310,522 (890)
Central - South America 30,344 67,603 (37,259)
Asia 51,710 88,686 (36,976)
Rest of world 3,210 2,994 216
Total 607,382 682,686 93,939
Note 20.B - REVENUE FROM SALES AND SERVICES BY GEORGRAPHICAL SEGMENT
Euro thousandsDecember 31, 2020 December 31, 2019 Change
Gains on Sale of Immaterial Tangible 3 - 3
Gains on Sale of Property, Plant and Equipment 574 48 526
Unrealised Exchange Gains on Commercial Transactions 2,314 2,268 46
Realised Exchange Gains on Commercial Transactions 3,759 2,513 1,246
Other Revenue and Income 2,317 1,917 400
Total 8,967 6,746 2,221
Note 21 – OTHER REVENUE AND INCOME

F.I.L.A. Group
142
Note 22 - Costs for Raw Materials, Consumables, supplies and goods and Change in Raw
Materials, Semi-Finished Products, Work in progress and Finished Goods → minuscule dove non
serve
This account includes all purchases of raw materials, semi-finished products, transport for purchases,
goods and consumables for operating activities.
“Costs for Raw Materials, Consumables, supplies and Goods” in 2020 totalled Euro 293,027 thousand
(Euro 312,020 thousand in 2019).
The relative detail is shown below:
The increase in “Costs for Raw Materials, Consumables, supplies and Goods” in 2020 was Euro 18,993
thousand. The decrease is attributable to the decline in revenues, mitigated in part by the actions taken
by management to contain costs.
The increases in inventories at December 31, 2020 totalled Euro 12,789 thousand, of which:
Increase of “raw materials, consumables, supplies and goods” for Euro 2,085 thousand
(decrease of Euro 5,991 thousand in 2019);
Decrease in “Work-in-Progress and Semi-Finished products” of Euro 688 thousand (decrease
of Euro 436 thousand in 2019);
Increase in “Finished Goods” of Euro 11,192 thousand (increase of Euro 506 thousand in 2019).
For further details, reference should be made to the “Normalised financial performance” section of the
Directors’ Report.
Euro thousandsDecember 31, 2020 December 31, 2019 Change
Raw materials, Consumables, supplies and Goods (244,493) (269,613) 25,120
Transport costs (17,926) (12,650) (5,275)
Packaging (6,319) (10,861) 4,543
Import Charges and Customs Duties (11,376) (5,620) (5,756)
Other purchase costs (13,394) (13,623) 229
Materials for Maintenance (689) (1,058) 369
Adjustments to Purchases 1,170 1,405 (235)
Returns on purchases 303 1,209 (906)
Discounts, rebates and rewards on purchases 867 196 (629)
Total (293,027) (312,020) 18,993
Note 22 - COSTS FOR RAW MATERIALS, ANCILLARY, CONSUMABLES AND GOODS

F.I.L.A. Group
143
Note 23 - Services and Use of Third-Party Assets
“Services and Use of Third-Party Assets” amounted to Euro 103,557 thousand in 2020 (Euro 116,056
thousand in 2019).
Services are broken down as follows:
The decrease in “Services and Use of Third-Party Assets” on 2019 was Euro 12,499 thousand. This
change is mainly due to lower variable production costs, such as transport costs, travel, accommodation
and entertainment expenses, and sale incentive costs, as impacted by the drop in revenue, in addition to
the actions taken by the management to contain commercial, administrative and marketing overheads.
Consultancy costs mainly increased as a result of the M&A carried out by the parent F.I.L.A. S.p.A.
Note 24 – Other Costs
”Other Costs” totalled Euro 7,154 thousand in 2020 (Euro 7,073 thousand in 2019).
This caption principally includes realised and unrealised exchange losses on commercial transactions.
For further details on exchange differences, reference should be made to “Note 30 - Foreign currency
transactions”.
Euro thousandsDecember 31, 2020 December 31, 2019 Change
Sundry services (11,088) (9,097) (1,991)
Transport (26,654) (29,938) 3,284
Warehousing (1,878) (1,755) (123)
Maintenance (12,061) (12,044) (17)
Utilities (8,714) (10,183) 1,469
Consulting fees (12,329) (11,762) (567)
Directors' and Statutory Auditors' Fees (3,998) (3,978) 32
Advertising, Promotions, Shows and Fairs (4,793) (6,874) 2,081
Cleaning (1,026) (1,273) 247
Bank Charges (1,215) (1,066) (149)
Agents (7,042) (7,748) 706
Sales representatives (2,529) (5,931) 3,402
Sales Commissions (2,025) (2,598) 573
Insurance (2,722) (2,654) (68)
Other Service Costs (2,619) (4,237) 1,618
Rent (1,607) (3,888) 2,281
Royalties and Patents (1,256) (1,030) (226)
Total (103,557) (116,056) 12,499
Note 23 - SERVICES COSTS AND USE OF THIRD-PARTY ASSETS

F.I.L.A. Group
144
“Other costs” are broken down as follows:
The decrease in “Other ” of Euro 1,360 thousand in 2020 primarily relates to tax charges other than
income taxes, such as municipal taxes on property.
Note 25 – Personnel Expense
“Personnel Expense” includes all costs and expenses incurred for employees.
“Personnel Expense” amounted to Euro 130,350 thousand in 2020 (Euro 142,439 thousand in 2019).
These costs are broken down as follows:
Euro thousandsDecember 31, 2020 December 31, 2019 Change
Unrealised Exchange Rate Losses on Commercial Transactions (2,476) (2,549) 73
Realised Exchange Rate Losses on Commercial Transactions (4,557) (3,043) (1,514)
Other Operating Charges (121) (1,481) 1,360
Total (7,154) (7,073) (81)
Note 24 – OTHER COSTS
Euro thousandsDecember 31, 2020 December 31, 2019 Change
Wages and Salaries (99,784) (107,584) 7,800
Social Security Charges (25,364) (26,732) 1,368
Employee Benefits (907) (876) (31)
Post-Employment Benefits (954) (947) (7)
Other (3,341) (6,300) 2,959
Total (130,350) (142,439) 12,089
Note 25 – PERSONNEL EXPENSES

F.I.L.A. Group
145
“Personnel expense” decreased by Euro 12,089 thousand on 2019.
The following table reports the breakdown of the F.I.L.A. Group workforce at December 31, 2020 and
December 31, 2019 by geographical segment.
For further details, reference should be made to the Personnel section of the Directors’ Report.
Note 26 – Amortisation and Depreciation
This caption amounted to Euro 42,646 thousand in 2020 (Euro 41,047 thousand in 2019). Amortisation
and depreciation in 2020 and 2019 are reported below:
The change in Amortisation and depreciation in 2020 concerns the greater amortisation and depreciation
recognised in the year for investments.
For further details, reference should be made to “Note 1 – Intangible Assets” and “Note 2 – Property,
Plant and Equipment”.
EuropeNorth
America
Central - South
AmericaAsia
Rest
of the WorldTotal
December 31, 2019 1,081 717 1,915 6,331 23 10,067
December 31, 2020 1,115 594 1,503 4,830 28 8,070
Change 34 (123) (412) (1.501) 5 (1.997)
Euro thousandsDecember 31, 2020 December 31, 2019 Change
Depreciation (16,361) (15,429) (932)
Amortisation (15,311) (15,095) (216)
Depreciaition of right-of-use assets (10,974) (10,523) (451)
Total (42,646) (41,047) (1,599)
Note 26 – AMORTISATION AND DEPRECIATION

F.I.L.A. Group
146
Note 27 – Net Impairment losses on Trade Receivables and Other assets
Net impairment losses on Trade Receivables and Other assets amounted to Euro 1,833 thousand in 2020
(Euro 1,707 thousand in 2019):
The increase in “Net impairment losses on Trade Receivables and Other assets” is mainly due to greater
provisions. There are also direct credit losses amounting to Euro 241 thousand.
Nota 28 – Other net impairment losses
Total “Other net impairment losses” amount to Euro 1,053 thousand in 2020 (Euro 3,122 thousand in
2019):
For further information, reference should be made to “Note 1 - Intangible Assets”.
Euro thousandsDecember 31, 2020 December 31, 2019 Change
Net impairment losses on trade receivables and other assets (1,833) (1,707) (126)
Total (1,833) (1,707) (126)
Note 27 - NET IMPAIRMENT LOSSES ON TRADE RECEIVABLES AND OTHER ASSETS
Euro thousandsDecember 31, 2020 December 31, 2019 Change
Net impairment losses on Property, Plant and Equipment (1.053) (180) (873)
Net impairment losses on intangible Assets - (2,942) 2,942
Total (1,053) (3,122) 2,069
Note 28 – OTHER NET IMPAIRMENT LOSSES

F.I.L.A. Group
147
Note 29 – Financial Income
Total” Financial Income” amounted to Euro 2,348 thousand in 2020 (Euro 3,971 thousand in 2019).
Financial income, together with the comment on the main changes on the previous year, was as follows:
The change concerns the “Unrealised Exchange Gains on Financial Transactions” and “Realised
Exchange Gains on Financial Transactions” items. → minuscolo dove non serve
Note 30 – Financial Expense
In 2020 “Financial Expense” amounted to Euro 37,850 thousand (Euro 34,438 thousand in 2019).
Financial expense, together with the main changes on the same period of the previous year, was as
follows:
“Financial expense” increased by Euro 3,412 thousand in 2020, net of exchange differences. In detail.
interest on bank loans and borrowings decreased due to loans incurred by the parent F.I.L.A. S.p.A. and
by the US subsidiary Dixon Ticonderoga Co.. The portion of amortised cost accrued in 2020 on the new
loan contracted by F.I.L.A. S.p.A. and Dixon Ticonderoga Company (U.S.A.) at December 31, 2020
amounted to Euro 375 thousand.
Euro thousandsDecember 31, 2019 December 31, 2019 Change
Interest on Bank Deposits 114 182 (68)
Other Financial Income 248 496 (248)
Unrealised Exchange Gains on Financial Transactions 1,516 2,807 (1,291)
Realised Exchange Gains on Financial Transactions 470 486 (16)
Total 2,348 3,971 (1,623)
Note 29 – FINANCIAL INCOME
Euro thousandsDecember 31, 2020 December 31, 2019 Change
Interest on current account Overdrafts (145) (210) (65)
Interest on Bank Loans and borrowings (20,883) (24,976) 4,093
Interest on other loans and borrowings (152) (62) (90)
Other Financial Expenses (3,035) (1,878) (1,157)
Unrealised Exchange Losses on Financial Transactions (7,241) (1,246) (5,995)
Realised Exchange Losses on Financial Transactions (636) (183) (453)
Lease interest expense (5,758) (5,883) 125
Total (37,850) (34,438) (3,412)
Note 30 - FINANCIAL EXPENSE

F.I.L.A. Group
148
For further details concerning these issues, reference should be made to “Note 13 - Financial
Liabilities”.
Note 31 – Foreign Currency Transactions
Exchange differences on financial and commercial transactions in foreign currencies in 2020 are
reported below:
Exchange differences in 2020 mainly arose from exchange movements against the euro, in addition to
the change in the year of assets and liabilities in foreign currencies, following commercial and financial
transactions.
Note 32 – Share of profits (losses) of Equity-Accounted Investees → elimiinare maiuscole dove
non serve
“The “Share of profit of equity-accounted investees” of Euro 271 thousand (Euro 187 thousand in 2019)
relates to the adjustment of the investments in associates held by DOMS Industries Pvt Ltd (India),
consolidated under the equity method.
Note 33 – Income Taxes
These amounted to Euro 6,165 thousand in 2020 (Euro 3,663 thousand in 2019) and concern current
taxes for Euro 7,353 thousand (Euro 10,827 thousand in 2019) and net deferred tax income of Euro
Euro thousandsDecember 31, 2020 December 31, 2019 Change
Unrealised Exchange Gains on Commercial Transactions 2,314 2,268 46
Realised Exchange Gains on Commercial Transactions 3,758 2,513 1,245
Unrealised Exchange Losses on Commercial Transactions (2,476) (2,549) 73
Realised Exchange Losses on Commercial Transactions (4,557) (3,043) (1,514)
Net exchange losses on commercial transactions (961) (811) (150)
Unrealised Exchange Gains on Financial Transactions 1,517 2,808 (1,291)
Realised Exchange Gains on Financial Transactions 470 486 (16)
Unrealised Exchange Losses on Financial Transactions (7,241) (1,246) (5,995)
Realised Exchange Losses on Financial Transactions (636) (183) (453)
Net exchange gains (losses) on financial transactions (5,890) 1,865 (7,755)
Net exchange gains (losses) (6,851) 1,054 (7,905)
Note 31 - FOREIGN CURRENCY TRANSACTIONS

F.I.L.A. Group
149
1,188 thousand (income of Euro 7,163 thousand in 2019).
Note 33.A – Current Taxes
The breakdown is shown below:
Current Italian taxes concern F.I.L.A. S.p.A., Industria Maimeri S.p.A and Canson Italia S.r.l..
The breakdown of foreign current taxes is illustrated below:
The foreign income taxes also include the tax charge relating to F.I.L.A S.p.A. (Euro 114 thousand)
concerning the tax representation of the subsidiary Lyra KG and the tax under Article 167 of
Presidential Decree No. 917/1986 concerning “Controlled Foreign Company” (Euro 8 thousand).
Euro thousandsDecember 31, 2020 December 31, 2019 Change
Italy 33 (580) 538
Abroad (7,386) (10,247) 2,860
Total (7,353) (10,827) 3,474
Note 33.A - CURRENT TAXES
Euro thousandsDecember 31, 2020 December 31, 2019 Change
FILA (Italy) (122) (11) (111)
Dixon Ticonderoga Company (U.S.A.) (3,131) (1,849) (1.282)
Dixon (China) (177) (187) 11
Dixon Canadian Holding Inc. 13 (79) 91
Dixon (Mexico) (154) (436) 282
FILA (Chile) (65) (220) 155
Lyra KG (Germany) (210) (17) (192)
Lyra Verwaltungs (Germany) (1) (5) 4
Fila Nordic (Scandinavia) (131) (90) (42)
Lyra Akrelux (Indonesia) (45) (74) 29
DOMS Industries PVT Ltd (India) 27 (1,838) 1,865
FILA (Russia) - (102) 102
FILA Hellas (Greece) (136) (195) 58
Fila Dixon (Kunshan) (814) (1,091) 276
FILA Benelux (247) (211) (36)
Daler Rowney Ltd (UK) (513) (61) (452)
Brideshore srl (Dominican Republic) (38) (70) 32
FILA (Polond) (101) (98) (3)
FILA (Yixing) (218) (195) (23)
St.Cuthberts Mill Limited Paper (UK) (117) (54) (63)
FILA Hiberia (1,354) (1,015) (339)
Canson SAS (France) 905 (1,858) 2,763
Canson Qingdao (China) (5) - (5)
FILA Art Products AG (26) (1) (25)
Fila Art and Craft Ltd (66) (42) (24)
Dixon Ticonderoga Art ULC (562) (355) (207)
Princeton Hong Kong (98) (23) (75)
Creativity International - (72) 72
Total (7,386) (10,247) 2,861
Note 33.A.1 - FOREIGN INCOME TAXES

F.I.L.A. Group
150
Nota 33.B – Deferred Tax Income and Expense
The relative detail is shown below:
The table below shows the overall tax for the year.
Current income taxes of Euro 7,353 thousand represent an average effective tax rate for the F.I.L.A.
Group of 32.9%, up 0.7% on the previous year.
There was an increase in total current taxes for the year due to the lower release of deferred taxes on
the U.S. subsidiary as a result of the reduction in the federal tax rate following the 2019 mergers between
the various U.S. companies.
Euro thousandsDecember 31, 2020 December 31, 2019 Change
Change in deferred tax assets (1,186) 9,814 (11,000)
Change in deferred tax liabilities 1,574 (3,535) 5,109
Change in deferred tax assets on right-of-use assets 800 884 (84)
Total 1,188 7,163 (5,975)
Note 33.B DEFERRED TAX INCOME AND EXPENSE
Euro thousands
2020Effective
tax rate2019
Effective
tax rate
Pre-Tax profit for the year of the F.I.L.A. Group 14,287 29,769
Profit for the year of the F.I.L.A. Group not subject to Current Taxes 1,195 3,847
Consolidation Effect of the F.I.L.A. Group - Before Current Taxes 6,857 ,029
Theoretical Tax Base 22,340 33,644
Total current income taxes (7,353) 32.2% (10,827) 32.2%
Deferred Tax Income on Temporary Differences (1,186) (2.651)
Deferred Tax Expense on Temporary Differences 2,374 9,814
Total deferred tax income & charges 1,188 -5,3% 7,163 -21.3%
Net tax expense (6,125) 27,6% (3,664) 10.9%
Note 33.C TOTAL TAXES FOR THE YEAR

F.I.L.A. Group
151
Commitments and guarantees
Commitments
In 2020, commercial supplier commitments maturing in 2021 totalled Euro 81 thousand and concern
F.I.L.A. Iberia S.L. (Spain - Euro 49 thousand) and Fila Nordic AB (Sweden - Euro 32 thousand).
Guarantees
In 2020 new lines were drawn for Euro 15,000 thousand, as the overall amount subscribed increased.
Against this exposure, there are “share security” guarantees put in place on June 4, 2018 the following
companies:
Renoir Topco Ltd;
Renoir Bidco Ltd;
Daler-Rowney Ltd;
Grupo F.I.L.A. – Dixon, S.A. de C.V.;
Canson SAS;
Johann Froescheis Lyra-Bleistift-Fabrik GmbH & Co. KG;
F.I.L.A. Iberia S.L.;
Dixon Ticonderoga Art ULC.
The guarantees provided by F.I.L.A. S.p.A. are as follows:
Bank surety issued in favour of Banco BPM S.p.A. on medium-term loan granted to Industria
Maimeri S.p.A. (Italy) for Euro 1,000 thousand;
Bank surety issued in favour of Unicredit S.p.A. granted to Dixon Ticonderoga Co. (USA) for
USD 22 million.
Bank sureties in favour of third parties:
as guarantee of the Pero offices lease contract for Euro 88 thousand;
to the Ministry for Economic Development for promotional activities for Euro 285
thousand.
Bank sureties issued in favour of Banca Nazionale del Lavoro S.p.A. on credit lines granted
to:

F.I.L.A. Group
152
FILA Stationary and Office Equipment Industry Ltd. Co. (Turkey) for Euro 550
thousand;
Canson Brasil I.P.E. Ltda (Brazil) for BRK 2,200 thousand;
Dixon Ticonderoga Co. (USA) for USD 20 million;
DOMS Industries Pvt Ltd (India) for INR 400 million.
Patronage letters provided on opening of credit granted to Industria Maimeri S.p.A. (Italy) in
favour of the following credit institutions:
Credito Emiliano S.p.A. for Euro 1,000 thousand;
Banco BPM for Euro 2,000 thousand;
Banca Popolare dell’Emilia Romagna for Euro 1,025 thousand;
Credito Valtellinese for Euro 500 thousand.
Loan mandates granted to Unicredit S.p.A. in favour of:
Fila Dixon Stationery Company (Kunshan) Co. Ltd. (China) for Euro 2,100
thousand;
Industria Maimeri S.p.A. (Italy) for Euro 1,950 thousand;
Fila Stationary O.O.O. (Russia) for RUB 150 million;
Johann Froescheis Lyra- Bleitstitift-Fabrik GmbH&Co-KG for Euro 8 million;
Daler Rowney Ltd (United Kingdom) for GBP 2 million.
Loan mandates granted in favour of Banca Intesa Sanpaolo S.p.A. to the subsidiaries:
Fila Dixon Stationery (Kunshan) Co. Ltd. (China) for RMB 32 million;
Fila Dixon Stationary (Kunshan) Co., Ltd. (China) for USD 500 thousand;
Fila Dixon Stationery (Kunshan) Co. Ltd. (China) for Euro 2,000 thousand;
Xinjiang Fila Dixon Plantation Co. Ltd. (China) for Euro 1,600 thousand;
Industria Maimeri S.p.A. (Italy) for Euro 2,000 thousand;
Fila Stationary O.O.O. (Russia) for Euro 1,250 thousand.
Dixon Ticonderoga Co. (U.S.A.) for USD 10,000 thousand;
Canson Sas (France) for Euro 500 thousand.
Credit line in favour of Banca Nazionale del Lavoro S.p.A. granted to Industria Maimeri
S.p.A. (Italy) for Euro 1.3 million.
Lyra KG “Johann Froescheis Lyra- Bleitstitift-Fabrik GmbH&Co-KG” (Germany) provided a
guarantee in favour of PT. Perma Plasindo (a local F.I.L.A. Group partner) which, in turn, pledged
property, plant and equipment in guarantee (land and buildings) of the obligations devolving to PT.

F.I.L.A. Group
153
Lyra Akrelux under the loan contract with PT. Bank Central Asia of February 11, 2010 for a total IDR
2,500,000,000 (approx. Euro 145,005).
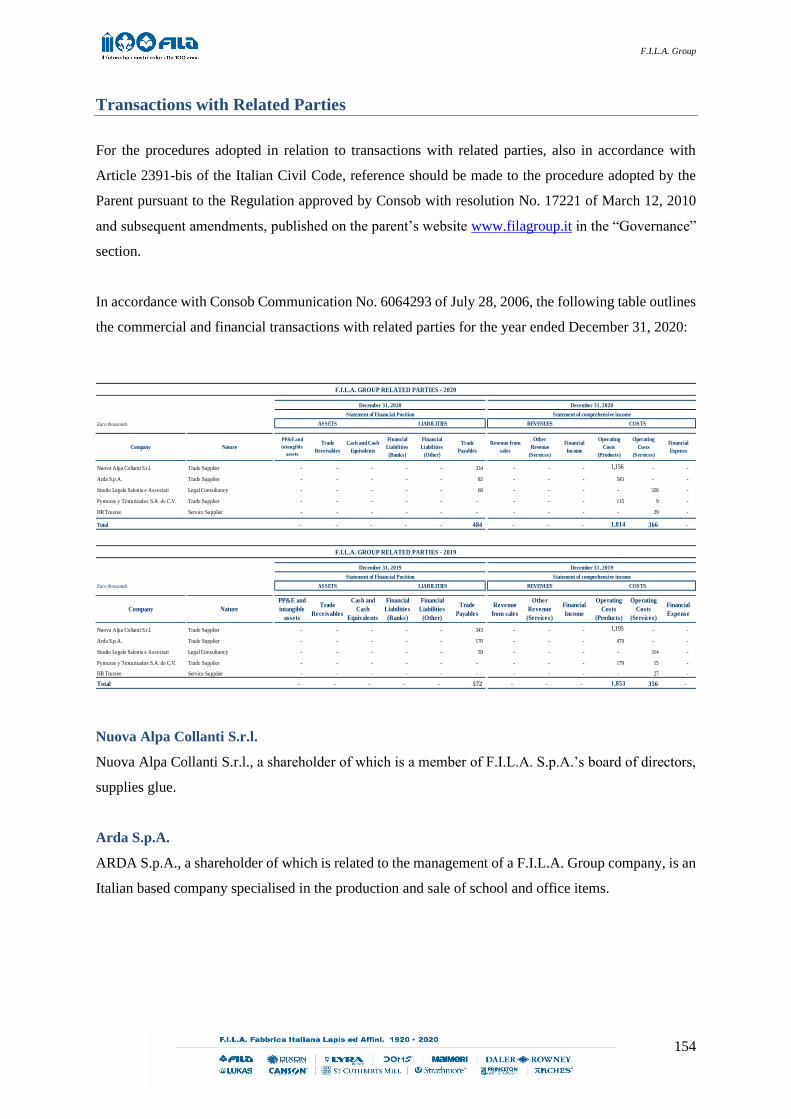
F.I.L.A. Group
154
Transactions with Related Parties
For the procedures adopted in relation to transactions with related parties, also in accordance with
Article 2391-bis of the Italian Civil Code, reference should be made to the procedure adopted by the
Parent pursuant to the Regulation approved by Consob with resolution No. 17221 of March 12, 2010
and subsequent amendments, published on the parent’s website www.filagroup.it in the “Governance”
section.
In accordance with Consob Communication No. 6064293 of July 28, 2006, the following table outlines
the commercial and financial transactions with related parties for the year ended December 31, 2020:
Nuova Alpa Collanti S.r.l.
Nuova Alpa Collanti S.r.l., a shareholder of which is a member of F.I.L.A. S.p.A.’s board of directors,
supplies glue.
Arda S.p.A.
ARDA S.p.A., a shareholder of which is related to the management of a F.I.L.A. Group company, is an
Italian based company specialised in the production and sale of school and office items.
Euro thousands COSTS
Nuova Alpa Collanti S.r.l. Trade Supplier - - - - - 334 - - - 1,156 - -
Arda S.p.A. Trade Supplier - - - - - 82 - - - 543 - -
Studio Legale Salonia e Associati Legal Consultancy - - - - - 68 - - - - 328 -
Pynturas y Texturizados S.A. de C.V. Trade Supplier - - - - - - - - - 115 9 -
HR Trustee Service Supplier - - - - - - - - - - 29 -
Total - - - - - 484 - - - 1,814 366 -
Euro thousands COSTS
Nuova Alpa Collanti S.r.l. Trade Supplier - - - - - 343 - - - 1,195 - -
Arda S.p.A. Trade Supplier - - - - - 170 - - - 479 - -
Studio Legale Salonia e Associati Legal Consultancy - - - - - 59 - - - - 314 -
Pynturas y Texturizados S.A. de C.V. Trade Supplier - - - - - - - - - 179 15 -
HR Trustee Service Supplier - - - - - - - - - - 27 -
Total - - - - - 572 - - - 1,853 356 -
F.I.L.A. GROUP RELATED PARTIES - 2020
December 31, 2020 December 31, 2020
Statement of Financial Position Statement of comprehensive income
LIABILITIES REVENUES
Company Nature
Statement of Financial Position Statement of comprehensive income
December 31, 2019 December 31, 2019
Financial
Liabilities
(Banks)
Financial
Liabilities
(Other)
Financial
Income
Operating
Costs
(Products)
Operating
Costs
(Services)
Financial
Expense
ASSETS
Trade
Payables
Revenue from
sales
Other
Revenue
(Services)
PP&E and
intangible
assets
Trade
Receivables
Cash and Cash
Equivalents
Cash and
Cash
Equivalents
Financial
Liabilities
(Banks)
Financial
Liabilities
(Other)
Trade
Payables
F.I.L.A. GROUP RELATED PARTIES - 2019
Financial
Expense
ASSETS LIABILITIES REVENUES
Company Nature
PP&E and
intangible
assets
Trade
Receivables
Financial
Income
Operating
Costs
(Products)
Operating
Costs
(Services)
Revenue
from sales
Other
Revenue
(Services)

F.I.L.A. Group
155
Studio Legale Salonia e Associati
The law firm Studio Legale Salonia e Associati, a partner of which is related to the controlling interest
of the Parent, principally provides legal consultancy.
Pinturas y Texturizados S.A. de C.V.
Pinturas y Texturizados S.A. de C.V., a shareholder of which is related to the management of a F.I.L.A.
Group company until October 29, 2020, is a company specialised in the production and sale of paint,
coating paints and anti- corrosion products.
HR Trustee
HR Trustee, a shareholder of which is related to the management of a F.I.L.A. Group company, is a
United Kingdom based company specialised in the provision of professional pension plan services.
The related party transactions carried out by the F.I.L.A. Group refer to normal transactions and are
regulated at market conditions, i.e. the conditions that would be applied between two independent
parties, and are undertaken in the interests of the Group. Typical or normal transactions are those which,
by their object or nature, are not outside the normal course of business of the F.I.L.A. Group and those
which do not involve particular critical factors due to their characteristics or to the risks related to the
nature of the counterparty or the time at which they are concluded; normal market conditions relate to
transactions undertaken at standard Group conditions in similar situations.
On this basis, the exchange of goods, services and financial transactions between the various group
companies were undertaken at competitive market conditions.
The infragroup transactions of F.I.L.A. S.p.A., relate to operations to develop synergies between Group
companies, integrating production and commercial operations.
The nature and the balances of transactions of the Parent F.I.L.A. S.p.A. with the companies of the
F.I.L.A. Group at December 31, 2020 and December 31, 2019 are detailed below:

F.I.L.A. Group
156
Company
Euro thousands
Trade
Receivables
Financial
AssetsTrade Payables
Financnail
liabilities
Revenue from
sales
Other
RevenueDividends
Financial
Income
Operating
Costs
(Products)
Operating
Costs
(Services)
Financial
Expense
F.I.L.A. Iberia (Spagna) 36 13 9 209 3,871 4
Dixon Ticonderoga Company (U.S.A.) 877 6,291 38 480 3,049 1,432 579
Beijing F.I.L.A.-Dixon Stationery Company Limited
(Cina) 4
Grupo F.I.L.A.-Dixon, S.A. de C.V. (Messico) 260 194 906 65 139 525 39
F.I.L.A. Chile Ltda (Cile) 218 1 773 5
FILA Argentina S.A. (Argentina) 248 1 320 2
Johann Froescheis Lyra KG (Germania) 118 146 98 545 1,277 243
F.I.L.A. Nordic (Svezia) 112 3 493 10
PT. Lyra Akrelux (Indonesia) 45 1 125 3
FILA Stationary Ltd. Co. (Turchia) 11 1 220 3 5
DOMS Industries Pvt Ltd (India) 14 354 23 29 1,841
Fila Stationary O.O.O. (Russia) 296 2,793 1 316 5 110
FILA Hellas SA (Grecia) 171 2 936 8
Industria Maimeri S.p.A. (Italia) 266 482 22 9 417 14 2
FILA SA (Sudafrica) 176 11 1 211 4
FILA Dixon Stationery (Kunshan) Co., Ltd. (Cina) 185 935 243 47 8,51 9
F.I.L.A. Benelux (Belgio) 37 2 97
Daler Rowney Ltd (Regno Unito) 309 6,77 43 1.541 356 216
Brideshore (Rep. Dominicana) 20 1 17 37
FILA Poland (Polonia) 55 131 153
Canson Art & Craft Yixing Co., Ltd. (Cina) 49 103 111 133 1,518 6
St. Cuthberts Holdings (Regno Unito) 276
St. Cuthberts Mill (Regno Unito) 2 15 37
Canson Brasil (Brasile) 83 1.415 1 44 35 34
Lodi 12 (Francia) 422 17
Canson SAS (Francia) 825 21,389 413 5,735 1,893 732 1,543 24
Canson Australia (Australia) 610 1,716 1 68 57 55
Canson Italy Srl (Italia) 62 3 233
Fila Art Products AG (Svizzera) 95 203 278 6
Fila Art & Craft (Israele) 49 353 1 565 4 15
Dixon Ticonderoga ART ULC (Canada) 15 2 14 64
Fila Arches (Francia) 1,298 22,775 21 1,368 746
Totale 6,542 64,620 2,319 - 13,643 8,709 5,732 2,697 15,220 325 -
F.I.L.A. S.P.A. INFRAGROUP TRANSACTIONS 2020
Statement of Financial Position - December 31, 2020 Statement of comprehensive income - December 31, 2020
Asset Liabilities Revenues Costs
Company
Euro thousands
Trade
Receivables
Financial
AssetsTrade Payables
Financial
Liabilities
Revenue from
sales
Other
RevenueDividends
Financial
Income
Operating
Costs
(Products)
Operating
Costs
(Services)
Financial
Expense
F.I.L.A. Iberia (Spain) 32 6 142 1,258 ,209 -
Dixon Ticonderoga Company (U.S.A.) 1.166 5.417 70 ,278 2.614 5,927 867 2 14 -
Beijing F.I.L.A.-Dixon Stationery Company Limited
(China) 9 -
Dixon Canadian Holding Inc. (Canada) 5 5 -
Grupo F.I.L.A.-Dixon, S.A. de C.V. (Mexico) 241 5 1.757 869 56 652 6 -
F.I.L.A. Chile Ltda (Chile) 506 1 977 6 -
FILA Argentina S.A. (Argentina) 189 1 234 3 -
Johann Froescheis Lyra KG (Germany) 89 136 190 473 1.241 900 162 -
F.I.L.A. Nordic (Sweden) 134 3 482 13 -
PT. Lyra Akrelux (Indonesia) 25 1 129 6 -
FILA Stationary Ltd. Co. (Turkey) 8 1 181 5 20 -
DOMS Industries Pvt Ltd (India) 31 277 4 51 1.400 1 -
Fila Stationary O.O.O. (Russia) 158 1.549 3 377 11 55 -
FILA Hellas SA (Greece) 298 3 1.144 10 800 -
Industria Maimeri S.p.A. (Italy) 319 1.179 29 ,013 344 19 176 4 -
FILA SA (South Africa) 107 ,011 1 122 6 11 -
FILA Dixon Stationery (Kunshan) Co., Ltd. (China) 72 811 315 95 8.529 65 -
F.I.L.A. Benelux (Belgio) 19 3 58 -
Daler Rowney Ltd (UK) 652 8.112 36 1.193 320 173 1 -
Brideshore (Dominican Republic) 7 1 22 21 -
Lukas-Nerchau GmbH (Germany) 6 -
FILA Poland (Polond) ,036 133 155 -
Canson Art & Craft Yixing Co., Ltd. (China) 71 61 121 124 950 -
St. Cuthberts Mill (UK) 3 14 30 233 -
Canson Brasil (Brazil) 189 1.373 1 41 26 111
Lodi 12 (France) 422 14 -
Canson SAS (France) 610 22.401 484 5.569 1.514 2.089 651 1.275 13 -
Creativity International (UK) 9 9 -
Canson Australia (Australia) 498 1.661 1 44 70 56 -
Canson Qingdao (China) 3 ,006 -
Canson Italy Srl (Italy) 71 3 260 -
Fila Art Products AG (Switzerland) 57 221 180 6 -
Fila Art & Craft (Israel) 604 1 346 2 17 -
Dixon Ticonderoga ART ULC (Canada) 60 2 57 -
Total 5,651 42,950 1,964 1.757 12,969 6,343 11,703 2,0 14,102 266 -
F.I.L.A. S.P.A. INFRAGROUP TRANSACTIONS 2019
Statement of Financial Position - December 31, 2019 Statement of comprehensive income - December 31, 2019
Asset Liabilities Revenues Costs

F.I.L.A. Group
157
In particular, in 2020 the nature of transactions between F.I.L.A. S.p.A. and the other Group companies
concerned:
Sale of products/goods of F.I.L.A. S.p.A. and other Group companies;
Recharges for services and consultancy provided by F.I.L.A. S.p.A., mainly in favour of
Canson SAS (France - Euro 503 thousand), Canson Italy S.r.l. (Italy - Euro 200 thousand),
Dixon Ticonderoga Company (U.S.A. - Euro 269 thousand), Canson Art & Craft Yixing Co.,
Ltd (China - Euro 9 thousand), Daler Rowney Ltd. (United Kingdom - Euro 123 thousand),
Grupo F.I.L.A.-Dixon, S.A. de C.V. (Mexico - Euro 59 thousand), Industria Maimeri S.p.A.
(Italy - Euro 125 thousand), Fila Dixon Stationery (Kunshan) Co, Ltd. (China - Euro 44
thousand), Lyra KG (Germany - Euro 94 thousand), DOMS Industries Pvt Ltd (India - Euro 23
thousand), F.I.L.A. Iberia S.L. (Spain - Euro 44 thousand), Fila Benelux (Belgium - Euro 29
thousand), Fila Nordic AB (Scandinavia - Euro 3 thousand), PT Lyra Arkelux (Indonesia - Euro
1 thousand), Fila Hellas (Greece - Euro 3 thousand), Fila SA (South Africa - Euro 3 thousand),
Saint Cuthberts Mill (United Kingdom - Euro 7 thousand), Canson Brasil (Brazil - Euro 3
thousand), Fila Arches (France – Euro 37 thousand), Canson Australia (Australia – Euro 2
thousand), Fila Chile LTDA (Chile – Euro 2 thousand), Fila Art & Craft Ltd (Israel – Euro 2
thousand) and Dixon Ticonderoga Art ULC (Canada – Euro 7 thousand);
Recharges for costs incurred by F.I.L.A. S.p.A. against Group insurance coverage principally
related to the companies Canson SAS (France - Euro 234 thousand), Daler Rowney Ltd. (United
Kingdom - Euro 86 thousand), Lyra KG (Germany - Euro 40 thousand), F.I.L.A. Iberia S.L.
(Spain - Euro 18 thousand) , Dixon Ticonderoga Company (U.S.A. - Euro 17 thousand) and
Saint Cuthberts Mill (United Kingdom - Euro 29 thousand), Industria Maimeri S.p.A. (Italy -
Euro 15 thousand) and Fila Arches (France - Euro 21 thousand);
Recharges of costs incurred by F.I.L.A. S.p.A. related to the ERP and network management
roll out at the F.I.L.A. Group, principally related to Dixon Ticonderoga Company (U.S.A. –
Euro 2,762 thousand), Canson Art & Craft Yixing Co., Ltd (China - Euro 123 thousand), Lyra
KG (Germany - Euro 411 thousand), Canson Australia PTY Ltd. (Australia - Euro 53
thousand), Industria Maimeri S.p.A. (Italy - Euro 277 thousand), F.I.L.A. Iberia S.L. (Spain -
Euro 148 thousand), Canson SAS (France - Euro 1,148 thousand), Daler Rowney Ltd. (United
Kingdom - Euro 147 thousand) and Fila Benelux (France - Euro 63 thousand).

F.I.L.A. Group
158
Recharging of M&A and financing costs to Fila Arches (France - Euro 1,298 thousand) relating
to the acquisition of the Arches business unit from the Swedish group Ahlstrom-Munksjo.
Dividends approved but not yet distributed by the subsidiary Dixon Ticonderoga Co. (U.S.A. -
Euro 1,432 thousand), F.I.L.A. Iberia S.L. (Spain - Euro 3,871 thousand), Fila Polska Sp Z.o.o.
(Poland - Euro 153 thousand), and St. Cuthberts Holding (United Kingdom - Euro 276
thousand).
Recharging of financial income recharged principally to the subsidiaries of the Canson Group
(Euro 804 thousand), to the subsidiary Daler Rowney Ltd. (United Kingdom – Euro 216
thousand), to the subsidiary Dixon Ticonderoga (USA – Euro 220 thousand), to the subsidiary
Canson Brasil I.P.E. Ltda (Brazil – Euro 28 thousand), the subsidiary Dixon S.A. de C.V.
(Mexico - Euro 54 thousand), the subsidiary Fila Arches (France - Euro 656 thousand) and to
the subsidiary FILA Stationery O.O.O. (Russia – Euro 71 thousand), calculated on the loans
granted by F.I.L.A. S.p.A.
Recharging of fees relating to the unused portion of the RCF line of the new loan disbursed in
June 2018 attributable to the subsidiary Dixon Ticonderoga Co. (U.S.A.) and recharging of
costs to subsidiaries for sureties granted in favour of F.I.L.A. Stationary and Office Equipment
Industry Ltd. Co. (Turkey - Euro 5 thousand), Canson Brasil I.P.E. LTDA (Brazil – Euro 6
thousand) and DOMS Industries PVT Ltd (India - Euro 29 thousand) by F.I.L.A. S.p.A., in
guarantee of credit lines agreed with Banca Nazionale del Lavoro S.p.A. and in favour of FILA
Stationary O.O.O. (Russia - Euro 12 thousand) in guarantee of the credit lines agreed with
Banca Intesa Sanpaolo. Loans in foreign currency subject to currency hedges were recharged
to Dixon, S.A. de C.V. (Mexico - Euro 85 thousand) and Stationary O.O.O. (Russia - Euro 27
thousand).

F.I.L.A. Group
159
In addition, the following information is provided in relation to the remuneration of the Directors,
Statutory Auditors, Chief Executive Officer and the General Manager, in the various forms in which
they are paid and reported in the financial statements.
The following members of the Board of Statutory Auditors also received fees for offices held in other
companies of the Group.
Name and Surname Office held Duration Fees for office (€)Bonuses and other
incentives (€)
Giovanni Gorno Tempini Chairman (from August 2019) 2019-2020 110.000 -
Massimo Candela Chief Executive Officer 2018-2020 1,200.000 375.000
Luca Pelosin CEO 2018-2020 400.000 125.000
Alberto Candela Director & Honorary Chairman 2018-2020 170.000 -
Annalisa Barbera Director 2018-2020 15.000 6.000
Gerolamo Caccia Dominioni Director 2018-2020 15.000 37.000
Francesca Prandstraller Director 2018-2020 15.000 12.000
Filippo Zabban Director 2018-2020 15.000 12.480
Paola Bonini Director 2018-2020 15.000 12.000
Alessandro Potestà Director 2018-2020 15.000 6.240
Total - directors in office at December 31, 2020 1,970.000 585.720
The fees reported above do not include Long Term Incentive.
Name and Surname Office held Duration Fees for office (€)
Gianfranco Consorti Chair. Board of Statutory Auditors 2018-2020 40.000
Elena Spagnol Statutory Auditor 2018-2020 30.000
Pietro Villa Statutory Auditor 2018-2020 30.000
Total statutory auditors in office as at December 31, 2020 100.000
Name and Surname Office held Fees for Office € Company
Stefano Amoroso Statutory Auditor 6.760 Industria Maimeri S.p.A.

F.I.L.A. Group
160
Disclosure pursuant to Article 149-duodecies of the Consob Issuer’s Regulation
The following table, prepared pursuant to Article 149-duodecies of the CONSOB Issuers’ Regulation,
reports the payments made in 2020 for audit and other services carried out by the independent auditor
and entities of its network:
* Other services for Euro 181 thousand concern mainly the limited consolidated not financial information reviewing and other
services audit related.
**Other companies belonging to the KPMG S.p.A. Network.
*** KPMG S.p.A. and other companies belonging to the KPMG S.p.A. Network.
Euro thousands
Company providing the
serviceRecipient 2020 Fees
Audit KPMG S.p.A. Parent 342
KPMG S.p.A. Italian Subsidiaries 25
KPMG ** Non-Italian Subsidiaries 807
Non Audit Servicess * KPMG ** 181
Total 1,355

F.I.L.A. Group
161
Attachments
Attachment 1 - List of companies included in the consolidation scope and other equity investments
Company CountrySegment
IFRS 81
Year of
acquisition
% Held
directly
(F.I.L.A.
S.p.A.)
% Held
indirectly
% Held
F.I.L.A.
Group
Held By Recognition
Non
controlling
interests
Johann Froescheis Lyra Bleistift-Fabrik GmbH & Co. KG Germany EU 2008 99,53% 0,47% 100,00%FILA S.p.A.
Lyra Bleistift-Fabrik Verwaltungs GmbHLine-by-Line 0,00%
Lyra Bleistift-Fabrik Verwaltungs GmbH Germany EU 2008 0,00% 100,00% 100,00%Johann Froescheis Lyra Bleistift-Fabrik GmbH &
Co. KG Line-by-Line 0,00%
F.I.L.A. Nordic AB2 Sweden EU 2008 0,00% 50,00% 50,00%
Johann Froescheis Lyra Bleistift-Fabrik GmbH &
Co. KG Line-by-Line 50,00%
FILA Stationary and Office Equipment Industry Ltd. Co. Turkey EU 2011 100,00% 0,00% 100,00% FILA S.p.A. Line-by-Line 0,00%
Fila Stationary O.O.O. Russia EU 2013 90,00% 0,00% 90,00% FILA S.p.A. Line-by-Line 10,00%
Industria Maimeri S.p.A. Italy EU 2014 51,00% 0,00% 51,00% FILA S.p.A. Line-by-Line 49,00%
Fila Hellas Single Member S.A. Greece EU 2013 100,00% 0,00% 100,00% FILA S.p.A. Line-by-Line 0,00%
Fila Polska Sp. Z.o.o Poland EU 2015 51,00% 0,00% 51,00% FILA S.p.A. Line-by-Line 49,00%
Dixon Ticonderoga Company U.S.A. NA 2005 100,00% 0,00% 100,00% FILA S.p.A. Line-by-Line 0,00%
Dixon Canadian Holding Inc. Canada NA 2005 0,00% 100,00% 100,00% Dixon Ticonderoga Company Line-by-Line 0,00%
Grupo F.I.L.A.-Dixon, S.A. de C.V. Mexico CSA 2005 0,00% 100,00% 100,00%Dixon Canadian Holding Inc.
Dixon Ticonderoga CompanyLine-by-Line 0,00%
F.I.L.A. Chile Ltda Chile CSA 2000 0,79% 99,21% 100,00%Dixon Ticonderoga Company
FILA S.p.A.Line-by-Line 0,00%
FILA Argentina S.A. Argentina CSA 2000 0,00% 100,00% 100,00%F.I.L.A. Chile Ltda
Dixon Ticonderoga CompanyLine-by-Line 0,00%
Beijing F.I.L.A.-Dixon Stationery Company Ltd. China AS 2005 0,00% 100,00% 100,00% Dixon Ticonderoga Company Line-by-Line 0,00%
Xinjiang F.I.L.A.-Dixon Plantation Company Ltd. China AS 2008 0,00% 100,00% 100,00% Beijing F.I.L.A.-Dixon Stationery Company Ltd. Line-by-Line 0,00%
PT. Lyra Akrelux Indonesia AS 2008 0,00% 52,00% 52,00%Johann Froescheis Lyra Bleistift-Fabrik GmbH &
Co. KG Line-by-Line 48,00%
FILA Dixon Stationery (Kunshan) Co., Ltd. China AS 2013 0,00% 100,00% 100,00% Beijing F.I.L.A.-Dixon Stationery Company Ltd. Line-by-Line 0,00%
FILA SA PTY LTD South Africa RM 2014 99,43% 0,00% 99,43% FILA S.p.A. Line-by-Line 0,57%
Canson Art & Craft Yixing Co., Ltd. China AS 2015 0,00% 100,00% 100,00% Beijing F.I.L.A.-Dixon Stationery Company Ltd. Line-by-Line 0,00%
DOMS Industries Pvt Ltd India AS 2015 51,00% 0,00% 51,00% FILA S.p.A. Line-by-Line 49,00%
Renoir Topco Ltd U.K. EU 2016 100,00% 0,00% 100,00% FILA S.p.A. Line-by-Line 0,00%
Renoir Midco Ltd U.K. EU 2016 0,00% 100,00% 100,00% Renoir Topco Ltd Line-by-Line 0,00%
Renoir Bidco Ltd U.K. EU 2016 0,00% 100,00% 100,00% Renoir Midco Ltd Line-by-Line 0,00%
FILA Benelux SA Belgium EU 2016 0,00% 100,00% 100,00%
Renoir Bidco Ltd
Daler Rowney Ltd
Daler Board Company Ltd
Line-by-Line 0,00%
Daler Rowney Ltd U.K. EU 2016 0,00% 100,00% 100,00% Renoir Bidco Ltd Line-by-Line 0,00%
Daler Rowney GmbH Germany EU 2016 0,00% 100,00% 100,00% Daler Rowney Ltd Line-by-Line 0,00%
Lukas-Nerchau GmbH Germany EU 2016 0,00% 100,00% 100,00% Daler Rowney GmbH Line-by-Line 0,00%
Nerchauer Malfarben GmbH Germany EU 2016 0,00% 100,00% 100,00% Daler Rowney GmbH Line-by-Line 0,00%
Brideshore srl Domenica Republic CSA 2016 0,00% 100,00% 100,00% Daler Rowney Ltd Line-by-Line 0,00%
St. Cuthberts Holding Limited U.K. EU 2016 100,00% 0,00% 100,00% FILA S.p.A. Line-by-Line 0,00%
St. Cuthberts Mill Limited U.K. EU 2016 0,00% 100,00% 100,00% St. Cuthberts Holding Limited Line-by-Line 0,00%
Fila Iberia S. L. Spain EU 2016 96,77% 0,00% 96,77% F.I.L.A. Hispania S.L. Line-by-Line 3,23%
Canson SAS France EU 2016 100,00% 0,00% 100,00% FILA S.p.A. Line-by-Line 0,00%
Canson Brasil I.P.E. LTDA Brazil CSA 2016 0,04% 99,96% 100,00%Canson SAS
FILA S.p.A.Line-by-Line 0,00%
Lodi 12 SAS France EU 2016 100,00% 0,00% 100,00% FILA S.p.A. Line-by-Line 0,00%
Canson Australia PTY LTD Australia RM 2016 0,00% 100,00% 100,00% Lodi 12 SAS Line-by-Line 0,00%
Canson Qingdao Ltd. China AS 2016 0,00% 100,00% 100,00% Lodi 12 SAS Line-by-Line 0,00%
Canson Italy S.r.l. Italy EU 2016 0,00% 100,00% 100,00% Lodi 12 SAS Line-by-Line 0,00%
FILA Art Products AG Switzerland EU 2017 52,00% 0,00% 52,00% FILA S.p.A. Line-by-Line 48,00%
FILA Art and Craft Ltd Israel AS 2018 51,00% 0,00% 51,00% FILA S.p.A. Line-by-Line 49,00%
Dixon Ticonderoga ART ULC Canada NA 2018 0,00% 100,00% 100,00%Dixon Canadian Holding Inc.
Dixon Ticonderoga CompanyLine-by-Line 0,00%
Castle Hill Crafts U.K. EU 2018 0,00% 100,00% 100,00% Daler Rowney Ltd Line-by-Line 0,00%
Creativity International U.K. EU 2018 0,00% 100,00% 100,00% Daler Rowney Ltd Line-by-Line 0,00%
Princeton Hong Kong Hong Kong AS 2018 0,00% 100,00% 100,00% Dixon Ticonderoga Company Line-by-Line 0,00%
Fila Arches SAS France EU 2019 100,00% 0,00% 100,00% FILA S.p.A. Line-by-Line 0,00%
Fila Specialty Paper LLC U.S.A. NA 2019 0,00% 50,00% 50,00% Dixon Ticonderoga Company Line-by-Line 50,00%
Pioneer Stationery Pvt Ltd. India AS 2015 0,00% 51,00% 51,00% DOMS Industries Pvt Ltd Equity method 49,00%
Uniwrite Pens and Plastics Pvt Ltd Inida AS 2016 0,00% 60,00% 60,00% DOMS Industries Pvt Ltd Equity method 40,00%
1 - EU - Europe; NA - North America; CSA - Central South America; AS - Asia; RM - Rest of the world
2 - Although not holding more than 50% of the share capital, considered a subsidiary under IFRS10

F.I.L.A. Group
162
Attachment 2 - Business combinations
Arches
On March 2, 2020, F.I.L.A.- Arches S.A.S., a French company wholly-owned by F.I.L.A., purchased
of the fine arts business unit specialised in fine arts operating through the ARCHES® brand, until then
managed by the Ahlstrom-Munksjö Group, finalising the non-binding memorandum of understanding
signed on October 30, 2019 between F.I.L.A. S.p.A. and Ahlstrom-Munksjö Oyj and its French
subsidiary, Ahlstrom-Munksjö Arches.
In 2020, the acquisition only contributed to the profit for the period between March 2, 2020 and
December 31, 2020.
In such period, the subsidiary generated revenue from third parties of Euro 4,856 thousand, in addition
to Euro 5,427 thousand of revenue from other Group companies, and reported a loss of Euro 1.655
thousand. Management consider that if the acquisition of the business had taken place on January 1,
2020, the consolidated revenue would have been Euro 2,626 thousand higher (therefore Euro 610,008
thousand). In calculating this amount, management assumed that the fair value adjustments at the
acquisition date would have been the same even if the acquisition took place on January 1, 2020.
The acquisition involves the payment of a net consideration of Euro 43,032 thousand, based on the
initial price of Euro 43,600 thousand, adjusted for liabilities for post-employment benefits transferred
and concerning personnel previously at Ahlstrom-Munksjö Arches of Euro 568 thousand. The
acquisition was accounted for by applying the purchase method, based on the definition of a business
provided for in IFRS 3, in accordance with the recently introduced amendments to such standard.
The fair values of the assets acquired and liabilities assumed at the acquisition date are summarised
below:

F.I.L.A. Group
163
The differential between the net financial outlay of Euro 43,032 thousand and the value of the business
unit acquired at that date resulted in the recognition of Goodwill of Euro 21,232 thousand. The
breakdown of the calculation of Goodwill considering the above-stated effects at the transaction date
are reported in detail:
Goodwill deriving from the acquisition refers to the future economic benefits resulting from the
integration of the business unit acquired in the Group's fine arts sector.
This goodwill has been allocated to the individual CGUs or groups of CGUs already identified on the
basis of potential synergies and similar operating strategies on the various markets. A portion of the
F.I.L.A. Group
164
goodwill was allocated to the CGU of the Canson Group and North America.
The verifications carried out at the time of the final PPA did not lead to significantly different
conclusions than those emerging for the provisional PPA at March 31, 2020.
Atypical and/or Unusual Transactions
In accordance with Consob Communication of July 28, 2006, during 2020 the F.I.L.A. Group did not
undertake any atypical and/or unusual transactions as defined by this communication, whereby atypical
and/or unusual transactions refers to transactions which for size/importance, nature of the
counterparties, nature of the transaction, method in determining the transfer price or time period (close
to the year-end) may give rise to doubts in relation to: the correctness/completeness of the information
in the financial statements, conflicts of interest, the safeguarding of the Group’s assets and the protection
of non-controlling interests.
The Board of Directors
THE CHAIRMAN
Mr. Giovanni Gorno Tempini

F.I.L.A. Group
165
Statement of the Manager in Charge of financial reporting and the Corporate
Bodies

F.I.L.A. Group
166
Independent Auditors’ Report pursuant to Article 14 of Legislative Decree No. 39
of January 27, 2010

F.I.L.A. Group
167

F.I.L.A. Group
168

F.I.L.A. Group
169

F.I.L.A. Group
170

F.I.L.A. Group
171

F.I.L.A. Group
172
IV - Separate financial statements of F.I.L.A. S.p.A. at December 31, 2020
Separate financial statements of F.I.L.A. S.p.A.
Statement of Financial Position
in Euro
December 31,
2020
December 31,
2019
Assets 552,496,305 491,282,976
Non-Current Assets 394,603,084 383,016,038
Intangible Assets Note 1 4,966,340 6,599,172
Property, Plant and Equipment Note 2 9,138,955 10,498,578
Non-Current Financial Assets Note 3 2,739,431 11,454,168
Investments Note 4 371,688,593 348,744,147
Deferred Tax Assets Note 5 6,069,765 5,719,973
Current Assets 157,893,222 108,266,938
Current Financial Assets Note 3 61,944,867 31,634,274
Current Tax Assets Note 6 2,180,247 2,978,285
Inventories Note 7 24,062,143 25,152,052
Trade Receivables and Other Assets Note 8 20,089,574 16,923,328
Cash and Cash Equivalents Note 9 49,616,392 31,578,999
Liabilities and Equity 552,496,305 491,282,976
Equity Note 12 277,998,246 271,080,143
Share Capital 46,967,524 46,876,272
Reserves 133,830,795 134,563,201
Retained Earnings 89,074,581 78,318,869
Profit for the year 8,125,346 11,321,802
Non-Current Liabilities 209,599,271 184,703,932
Non-Current Financial Liabilities Note 13 202,144,640 177,218,053
Financial Instruments Note 17 4,182,633 3,796,903
Post-Employment Benefits Note 14 1,643,353 1,700,084
Provisions for Risks and Charges Note 15 667,878 652,742
Deferred Tax Liabilities Note 16 960,766 1,336,150
Current Liabilities 64,898,788 35,498,901
Current Financial Liabilities Note 13 45,506,587 14,969,443
Provisions for Risks and Charges Note 15 35,855 35,855
Current Tax Liabilities Note 18 323,294 725,297
Trade Payables and Other Liabilities Note 19 19,033,051 19,768,306

F.I.L.A. Group
173
Statement of Comprehensive Income
in Euro
December 31,
2020
December 31,
2019
Revenue from Sales and Service Note 20 70,775,966 74,883,614
Other Revenue and Income Note 21 9,226,259 6,769,487
Total Revenue 80,002,225 81,653,101
Raw Materials, Consumables, Supplies and Goods Note 22 (34,534,436) (34,600,156)
Services and Use of third party assets Note 23 (20,816,750) (19,534,410)
Other Costs Note 24 (554,150) (437,604)
Change in Raw Materials, Semi-Finished, Work-in-progress & Finished Prod. Note 22 (1,089,910) (3919,813)
Personnel expenses Note 25 (11,287,428) (11,714,893)
Amortisation and Depreciation Note 26 (5,325,538) (4,924,811)
Impairment gains (losses) on trade receivables and other assets Note 27 (193,075) (593,096)
Total Operating Costs (73,801,287) (75,724,783)
Operating Profit 6,200,938 5,928,318
Financial Income Note 29 8,477,205 13,917,883
Financial Expense Note 30 (6,818,992) (6,822,883)
Impairment gains ( losses) on financial assets Note 31 (8,800) 111,080
Impairment losses on Investments Note 32 (342,262) -
Net Financial Income (Expense) 1,307,152 7,206,081
Pre-Tax Profit 7,508,089 13,134,398
Income Taxes (75,742) (591,676)
Deferred Taxes 692.998 (1220,922)
Income Taxes Note 33 617,256 (1,812,598)
Profit for the Year 8,125,346 11,321,801
Other Comprehensive Income (Expense) which may be reclassified
subsequently to Profit or Loss(385,730) (2,228,051)
Adjustment of Fair value of Hedges (385,730) (2,228,051)
Other Comprehensive Income (Expense) which may not be reclassified
subsequently to Profit or Loss(91,193) (67,791)
Actuarial Losses on Employee Benefits recorded directly in Equity (123,370) (103,043)
Income Taxes on income and expenses recorded directly in Equity 32.177 35,252
Other Comprehensive Expense (net of tax effect) (476.923) (2,295,824)
Comprehensive Income 7,648,423 9,025,959

F.I.L.A. Group
174
Statement of changes in Equity
Euro thousands
Share capital Legal ReserveShare Premium
ReserveIAS 19 Reserve
Other
Reserves
Retained
Earnings
Profit for the
yearEquity
December 31, 2018 46,799 7,434 151,768 (399) 24,587 28,868 6,633 265,690
Profit for the year - - - - - - 11,322 11,322
Share Capital Increase 77 - 1,839 - - - - 1,916
Other comprehensive income - - - (103) (2,193) - - (2,296)
Other Changes in the year - - - - (1,480) - - (1,480)
Profit for the year recorded directly in
equity77 - 1,839 (103) (3,673) - 11,322 9,462
Allocation of 2018 profit - 332 - - - 6,301 (6,633) -
Dividends - - - - - (4,070) - (4,070)
December 31, 2019 46,876 7,766 153,606 (502) 20,914 31,099 11,322 271,081
Profit for the year - - - - - - 8,125 8,125
Share Capital Increase 92 - 868 - - - - 960
Other comprehensive income - - - (91) (386) - - (477)
Other changes of the year - - - - (1,689) - - (1,689)
Gains/(losses) recorded directly in equity 92 - 868 (91) (2,075) - 8,125 6,918
Allocation of 2019 profit - 566 - - - 10,756 (11,322) -
December 31, 2020 46,967 8,332 154,473 (593) 18,839 41,855 8,125 277,998
STATEMENT OF CHANGES IN EQUITY
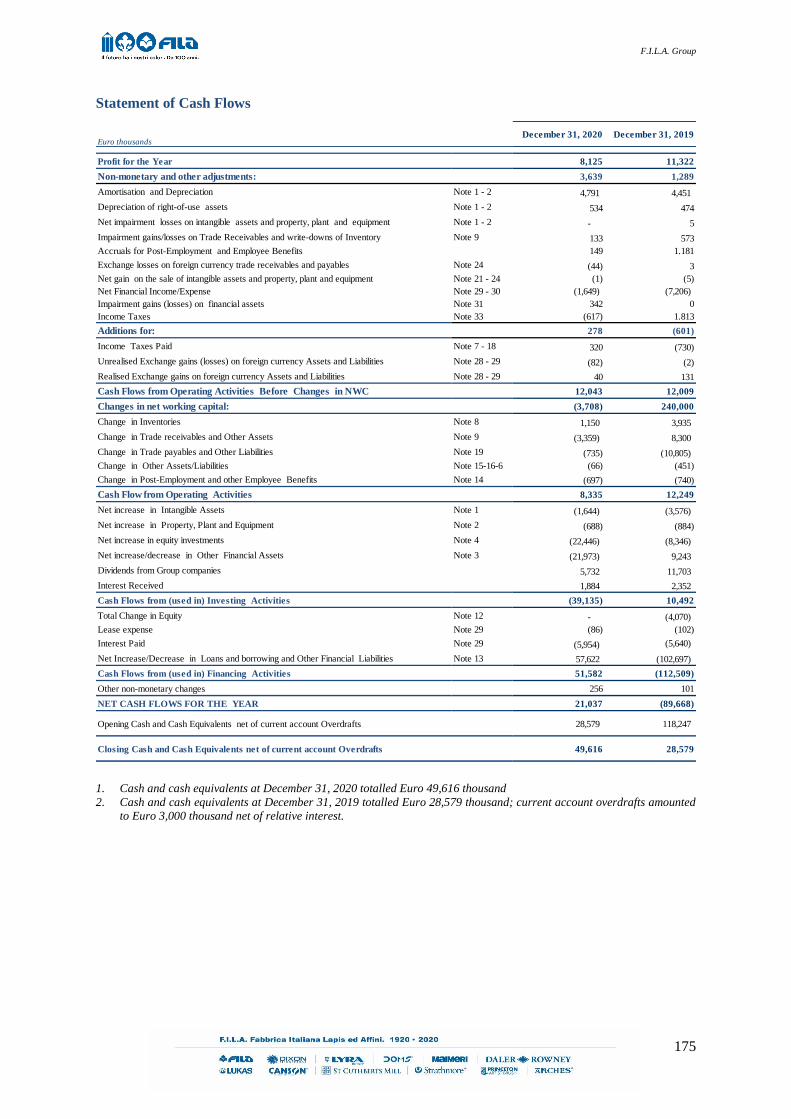
F.I.L.A. Group
175
Statement of Cash Flows
1. Cash and cash equivalents at December 31, 2020 totalled Euro 49,616 thousand
2. Cash and cash equivalents at December 31, 2019 totalled Euro 28,579 thousand; current account overdrafts amounted
to Euro 3,000 thousand net of relative interest.
Euro thousandsDecember 31, 2020 December 31, 2019
Profit for the Year 8,125 11,322
Non-monetary and other adjustments: 3,639 1,289
Amortisation and Depreciation Note 1 - 2 4,791 4,451
Depreciation of right-of-use assets Note 1 - 2 534 474
Net impairment losses on intangible assets and property, plant and equipment Note 1 - 2 - 5
Impairment gains/losses on Trade Receivables and write-downs of Inventory Note 9 133 573
Accruals for Post-Employment and Employee Benefits 149 1.181
Exchange losses on foreign currency trade receivables and payables Note 24 (44) 3
Net gain on the sale of intangible assets and property, plant and equipment Note 21 - 24 (1) (5)
Net Financial Income/Expense Note 29 - 30 (1,649) (7,206)
Impairment gains (losses) on financial assets Note 31 342 0
Income Taxes Note 33 (617) 1.813
Additions for: 278 (601)
Income Taxes Paid Note 7 - 18 320 (730)
Unrealised Exchange gains (losses) on foreign currency Assets and Liabilities Note 28 - 29 (82) (2)
Realised Exchange gains on foreign currency Assets and Liabilities Note 28 - 29 40 131
Cash Flows from Operating Activities Before Changes in NWC 12,043 12,009
Changes in net working capital: (3,708) 240,000
Change in Inventories Note 8 1,150 3,935
Change in Trade receivables and Other Assets Note 9 (3,359) 8,300
Change in Trade payables and Other Liabilities Note 19 (735) (10,805)
Change in Other Assets/Liabilities Note 15-16-6 (66) (451)
Change in Post-Employment and other Employee Benefits Note 14 (697) (740)
Cash Flow from Operating Activities 8,335 12,249
Net increase in Intangible Assets Note 1 (1,644) (3,576)
Net increase in Property, Plant and Equipment Note 2 (688) (884)
Net increase in equity investments Note 4 (22,446) (8,346)
Net increase/decrease in Other Financial Assets Note 3 (21,973) 9,243
Dividends from Group companies 5,732 11,703
Interest Received 1,884 2,352
Cash Flows from (used in) Investing Activities (39,135) 10,492
Total Change in Equity Note 12 - (4,070)
Lease expense Note 29 (86) (102)
Interest Paid Note 29 (5,954) (5,640)
Net Increase/Decrease in Loans and borrowing and Other Financial Liabilities Note 13 57,622 (102,697)
Cash Flows from (used in) Financing Activities 51,582 (112,509)
Other non-monetary changes 256 101
NET CASH FLOWS FOR THE YEAR 21,037 (89,668)
Opening Cash and Cash Equivalents net of current account Overdrafts 28,579 118,247
Closing Cash and Cash Equivalents net of current account Overdrafts 49,616 28,579

F.I.L.A. Group
176
Reference should be made to the “Directors’ Report” for comment and analysis.
Euro thousands
December 31,
2020
December 31,
2019
Opening Cash and Cash Equivalents 28,579 118,247
Cash and cash equivalents 31,579 121,247
Current account overdrafts (3,000) (3,000)
Closing Cash and Cash Equivalents 49,616 28,579
Cash and cash equivalents 49,616 31,579
Current account overdrafts - (3,000)

F.I.L.A. Group
177
Statement of Financial Position pursuant to CONSOB Resolution No. 15519 of July 27, 2006
Euro thousandsDecember 31, 2020
of which:
Related PartiesDecember 31, 2019
of which:
Related Parties
Assets 552,496 491,283
Non-Current Assets 394,603 383,016
Intangible Assets Note 1 4,966 6,599
Property, Plant and Equipment Note 2 9,139 10,499
Non-Current Financial Assets Note 3 2,736 2,664 11,454 11,444
Equity investments Note 4 371,689 371,686 348,744 348,741
Deferred Tax Assets Note 5 6,070 5,720
Current Assets 157,893 108,267
Current Financial Asset Note 3 61,945 61,867 31,634 31,559
Current Tax Assets Note 6 2,180 2,978
Inventories Note 7 24,062 8,047 25,152 7,573
Trade receivables and Other Assets Note 8 20,090 6,540 16,923 5,651
Cash and Cash Equivalents Note 9 49,616 31,579
Liabilities and Equity 552,496 491,283
Equity Note 12 277,998 271,080
Share Capital 46,968 46,876
Reserves 133,831 134,563
Retained Earnings 89,075 78,319
Profit for the year 8,125 11,322
Non-Current Liabilities 209,599 184,704
Non-Current Financial Liabilities Note 13 202,145 177,218
Financial Instruments Note 17 4,183 3,797
Post-Employment Benefits Note 14 1,643 1,700
Provisions for Risks and Charges Note 15 668 653
Deferred Tax Liabilities Note 16 961 1,336
Current Liabilities 64,899 35,499
Current Financial Liabilities Note 13 45,507 14,969
Provisions for Risks and Charges Note 15 36 36
Current Tax Liabilities Note 18 323 725
Trade payables and Other Liabilities Note 19 19,033 2,319 19,768 2,290

F.I.L.A. Group
178
Statement of Comprehensive Income pursuant to CONSOB Resolution No. 15519 of July 27, 2006
Euro thousands
December 31, 2020of which:
Related Parties
of which:
Non-Recurring
Charges
December 31,
2019
of which:
Related Parties
of which:
Non-Recurring
Charges
Revenue from Sales and Service Note 20 70,776 13,641 74,884 12,721
Other Revenue and Income Note 21 9,226 8,712 1,298 6,769 (6,342)
TOTAL REVENUE 80,002 81,563
Raw Materials, Consumables, supplies and Goods Note 22 (34,534) (15,341) (34,600) (15,580)
Services and use of third-party assets Note 23 (20,817) (206) (3,326) (19,534) (454) (1,411)
Other Costs Note 24 (554) (438)
Change in Raw Materials, Semi-Finished products, Work-in-progress and goods Note 22 (1,090) (3,920)
Personnel expense Note 25 (11,287) 64 (11,715) 102
Amortisation and Depreciation Note 26 (5,326) (4,925)
Impairment gains (losses) on Trade Receivables and Other assets Note 27 (193) (,593)
TOTAL OPERATING COSTS (73,801) (75,725)
OPERATING PROFIT 6,201 5,928
Financial Income Note 29 8,477 8,429 13,918 13,317
Financial Expense Note 30 (6,819) (6,823)
Impairment gains (Impairment losses) on Financial Assets Note 31 (9) 111
Impairment losses on equity investments Note 32 (342) (342) -
NET FINANCIAL INCOME (EXPENSE) 1,307 7,206
PRE-TAX PROFIT/(LOSS) 7,508 13,134
Income Taxes (76) (592) 365
Deferred Taxes 693 (1,221)
TOTAL INCOME TAXES Note 33 617 (1,813)
PROFIT (LOSS) FOR THE YEAR 8,125 11,322
Other Compre he nsive expense which may be reclassified subsequently
toProfit or Loss(386) (2,228)
Fair value losses on hedging derivatives (386) (2,228)
Other Comprehensive expense which may not be reclassified subsequently to
Profit or Loss(91) (68)
Actuarial Losses on Employee Benefits recorded directly in Equity (123) (103)
Income Taxes and expenses recorded directly in Equity 32 35
Other Comprehensive expense (net of tax effect) (477) (2,296)
Total Comprehensive Income/(expenses) 7,648 (1.964) 9,026 (944)

F.I.L.A. Group
179
Notes to the Separate Financial Statements of F.I.L.A. S.p.A.
Introduction
The separate financial statements of F.I.L.A. S.p.A. (hereafter also “ “Company”) as at and for the year
ended December 31, 2020, prepared by the Board of Directors of F.I.L.A. S.p.A., were drawn up in
accordance with International Financial Reporting Standards (IFRS) issued by the International
Accounting Standards Board (IASB) and endorsed by the European Union.
The IFRS were applied consistently for all reporting periods presented in this document.
For the separate financial statements of F.I.L.A. S.p.A. the first year of application of IFRS was 2007.
The separate financial statements of F.I.L.A. S.p.A. are comprised of the Statement of Financial
Position, the Statement of Comprehensive Income, the Statement of Cash Flows, the Statement of
Changes in Equity and the Notes.
The presentation of these separate financial statements as at and for the year ended December 31, 2020,
in line with the consolidated financial statements, is as follows:
Statement of Financial Position: in accordance with IAS 1, the assets and liabilities must be
classified as current and non-current or, alternatively, according to the liquidity order. The
Company chose the classification between current and non-current;
Statement of Comprehensive Income: IAS requires alternatively classification based on the
nature or destination of the items. The Company chose the classification by nature of income
and expense;
Statement of Changes in Equity: IAS 1 requires that the statement of changes in equity
illustrates the changes in the year of each individual equity caption or that it illustrates the nature
of income and expense recognised in the financial statements. The Company chose to use the
latter in the statement of changes in equity, reconciling the opening and closing amounts of
each caption in a statement in the notes;
Statement of Cash Flows: IAS 7 requires that the statement of cash flow includes the cash flows
for the year for operating, investing and financing activities. The cash flows from operating
activities may be represented using the direct method or the indirect method. The Company
decided to use the indirect method.
The separate financial statements of F.I.L.A. S.p.A. are accompanied by the Directors’ Report, to which
reference should be made in relation to the business activities, subsequent events and transactions with
related parties, the statement of the cash flow, the reclassified statement of comprehensive income and
statement of financial position and the outlook.

F.I.L.A. Group
180
The separate financial statements of F.I.L.A. S.p.A. were prepared in accordance with the general
historical cost criterion.
During the year, no special circumstances arose requiring recourse to the exceptions allowed under IAS
1.
The preparation of the financial statements and the relative notes in application of IFRS require that
management make estimates and assumptions. These estimates and relative assumptions are based on
historical experience and other factors considered reasonable and were adopted to determine the
carrying amount of the assets and liabilities which are not easily obtained from other sources, are
reviewed periodically and the effects of each change are immediately reflected in profit or loss.
However as they concern estimates, it should be noted that the actual results may differ from such
estimates included in the financial statements.
The estimates are used to measure the loss allowance, depreciation and amortisation, impairment losses
on assets, employee benefits, income taxes and other provisions.
The accounting policies used in the preparation of the financial statements and the composition and
changes of the individual captions are illustrated below.
For a better comparison of the data, the figures for the prior year were adjusted where necessary.
All amounts are expressed in thousands of Euro, unless otherwise stated.
Basis of preparation
Intangible assets
An intangible asset is a clearly identifiable non-monetary asset without physical substance, subject to
control and capable of generating future economic benefits. They are recognised at acquisition cost
where acquired separately and are capitalised at fair value at the acquisition date where acquired through
business combinations.
The interest expense on loans required for the purchase and the development of intangible assets, which
would not have been incurred if the investment had not been made, is not capitalised.
Intangible assets with finite useful lives
Intangible assets with finite useful lives are amortised on a straight line basis over their useful life to
take account of the residual possibility of use. Amortisation commences when the asset is available for
use.

F.I.L.A. Group
181
The amortisation policies adopted by the Company provide for the following useful lives:
Trademarks: based on the useful life;
Concessions, Licences and Patents: based on the duration of the right under concession or
license and based on the duration of the patent;
Other intangible assets: 3 years.
Research and development costs
Research and development costs are recognised in profit or loss in the year they are incurred, with the
exception of development costs recognised under “Intangible assets”, when they satisfy the following
conditions:
The project is clearly identified and the related costs are reliably identifiable and measurable;
The technical feasibility of the project is demonstrated;
The intention to complete the project and sell the assets generated from the project are
demonstrated;
A potential market exists or, in the case of internal use, the use of the
intangible asset is demonstrated for the production of the intangible assets generated by the
project;
The technical and financial resources necessary for the completion of the project are available;
The intangible asset will generate probable future economic benefits.
Amortisation of development costs recognised under intangible assets begins from the date in which
the outcome of the project is commercialised. Amortisation is calculated, on a straight-line basis, over
the estimated useful life of the project.
Property, plant and equipment
Property, plant and equipment are measured at purchase cost, net of accumulated depreciation and any
impairment losses. The cost includes all charges directly incurred for the purchase and/or production.
The interest expense on loans for the purchase and the construction of Property, Plant and Equipment,
which would not have been incurred if the investment had not been made, are not capitalised but
expensed in the year it is incurred. Where an item of property, plant and equipment is composed of
various components with differing useful lives, these components are recognised separately (significant
components) and depreciated separately. Property, plant and equipment acquired through business
combinations are recognised in the financial statements at fair value at the acquisition date.
The expense incurred for maintenance and repairs is directly charged to profit or loss in the year in
which it is incurred. The costs for improvements, modernisation and transformation are recognised in
the statement of financial position as an increase to the carrying amount of Property, Plant and
Equipment.

F.I.L.A. Group
182
The purchase price or construction cost is net of public grants which are recognised when the conditions
for their granting are confirmed. At the reporting date, there are no public grants recognised as a
decrease of “Property, Plant and Equipment”.
The initial carrying amount of property, plant and equipment is adjusted for depreciation on a systematic
basis, calculated on a straight-line basis monthly, when the asset is available and ready for use, based
on its estimated useful life.
The estimated useful lives for the current and previous years are as follows:
Buildings 25 years
Plant and machinery 8.7 years
Equipment 2.5 years
Other assets:
Office equipment: 8.3 years
Furniture and EDP: 5 years
Transport vehicles: 5years
Motor vehicles: 4 years
Other: 4 years
Leases
The Company has adopted IFRS 16 using the modified retrospective method.
At the contract’s commencement date the Company assesses whether the contract is – or contains – a
lease. The contract is, or contains a lease, where in exchange for consideration, it transfers the right to
control the use of an identified asset for a period of time. In order to assess whether a contract grants
the right to control the use of an identified asset, the Company uses the definition of a lease in IFRS 16.
F.I.L.A. S.p.A. adopts a single recognition and measurement model for all leases, except for short-term
leases and low value leases. The Company recognises the lease liabilities and the right-of-use asset
representing the right to use the asset underlying the contract.
Right-of-use assets
The Company recognises right-of-use assets at the initial lease date (i.e. the date on which the
underlying asset is available for use). Right-of-use assets are measured at cost, net of accumulated
depreciation and impairment losses, adjusted for any remeasurement of the lease liabilities. The cost
of the right-of-use assets includes the amount of the lease liabilities recognised, the initial direct costs
incurred and the lease payments made at the commencement date or before, net of any incentives
received.

F.I.L.A. Group
183
Right-of-use assets are depreciated on a straight-line basis from the effective date to the end of the
useful life of the asset consisting of the right of use, or the end of the lease term, whichever is earlier.
Lease liabilities
At the lease commencement date, the Company recognises the lease liabilities measuring them at the
present value of the payments due. The payments include the fixed payments net of any lease incentives
to be received, the variable lease payments which depend on an index or a rate and the amounts expected
to be paid as guarantee on the residual amount. The lease payments include also the exercise price of a
purchase option where it is reasonably certain that this option will be exercised by the Company and
the lease termination penalty payments, where the lease duration takes account of the exercise by the
Company of the termination option on the lease.
In calculating the present value of the payments due, the Company uses the incremental borrowing rate
at the commencement date where the implicit interest rate cannot be readily determined. The
Company's incremental borrowing rate is calculated on the basis of the interest rates obtained from
various external funding sources by making certain adjustments reflecting the terms of the lease and the
type of asset leased.
After the commencement date, the amount of the lease liability increases to take account of the interest
on the lease liabilities and reduces to consider the payments made. In addition, the carrying amount of
the lease liabilities are restated in the case of any changes to the lease or a review of the contractual
terms with regards to the change in the payments; it is also restated in the event of changes in the
valuation of the option to purchase the underlying asset or for changes in future payments resulting
from a change in the index or rate used to determine those payments.
Where the lease liabilities are remeasured, the lessee correspondingly alters the right-of-use asset. If
the carrying amount of the right-of-use asset is reduced to zero, the lessee recognises the change in
profit or loss.
In the statement of financial position, the Company presents right-of-use assets that do not meet the
definition of investment property under “Property, plant and equipment” and lease liabilities under
“Financial liabilities”.
Short-term leases and low value asset leases
F.I.L.A. S.p.A. applies the exemption for the recognition of leases relating to low value assets such as
PCs, printers, electronic equipment and contracts that have a duration of 12 months or less and do not
contain purchase options (short-term leases). The short-term lease instalments and those for low value
assets are recognised as costs on a straight-line basis over the lease duration.

F.I.L.A. Group
184
Impairment losses on non-financial assets
At each reporting date, the intangible assets and property, plant and equipment are analysed to identify
the existence of any indicators, either internally or externally to the Group, of impairment. Where these
indications exist, an estimate of the recoverable amount of the above-mentioned assets is made,
recording any impairment losses in profit or loss. In the case of goodwill and other intangible assets
with indefinite useful lives, this estimate is made annually independently of the existence of such
indicators. The recoverable value of an asset is the higher between the fair value less costs to sell and
its value in use. The fair value is estimated on the basis of the values in an active market, from recent
transactions or on the basis of the best information available to reflect the amount which the entity could
obtain from the sale of the asset. The value in use is the present value of the expected future cash flows
to be derived from an asset. In defining the value in use, the expected future cash flows are discounted
using a pre-tax discount rate that reflects the current market assessment of the time value of money, and
the specific risks of the asset.
For an asset that does not generate sufficient independent cash flows, the realisable value is determined
in relation to the cash-generating unit to which the asset belongs. An impairment loss is recognised in
profit or loss when the carrying amount of the asset, or of the cash-generating unit to which it is
allocated, is higher than the recoverable amount.
Impairment losses on cash generating units are firstly allocated as a decrease in the carrying amount of
any goodwill allocated to the cash generating unit and, thereafter, as a decrease in other assets, in
proportion to their carrying amount. Impairment losses on goodwill may not be reversed. In relation to
assets other than goodwill, where the reasons for the impairment loss no longer exist, the carrying
amount of the asset is reversed up to the amount at which the asset would have been recognised if no
impairment had taken place and amortisation had been recognised.
Equity investments
Investments in companies represent investments in the share capital of enterprises.
Investments in companies are carried at acquisition or subscription cost, adjusted for any impairment
losses, and measured under the cost method. Where the reasons for the impairment loss no longer exist,
the original carrying amount is reinstated.
Financial assets and loans and receivables
Trade receivables and debt securities issued are recognised as they arise.
All other financial assets and liabilities are initially recognised on the trading date, i.e. when the
Company becomes a contractual party to the financial instrument.

F.I.L.A. Group
185
The financial assets are initially recognized at fair value, plus or minus, in the case of financial assets
or liabilities not at FVTPL, the transaction costs directly attributable to the acquisition or issue of the
financial asset.
Upon initial recognition, a financial asset is classified according to how it is measured: at amortised
cost, at fair value through other comprehensive income (FVOCI) for debt and equity securities, or at
fair value through profit or loss (FVTPL). Financial assets are not reclassified following initial
recognition unless the Company modifies the business model within which the financial assets are held.
In such cases, all the affected financial assets are reclassified on the first day of the first reporting period
following the change of the business model.
Loans and receivables are measured at amortised cost, taking the interest to profit or loss according to
the effective interest rate method or applying a rate that results in a nil balance of the present values of
the net cash flows generated by the financial instrument. Losses are recognised in profit or loss when
they become apparent. Loans are tested for impairment by setting aside a specific loss allowance
deducted directly from the carrying amount of such assets. Loans are impaired when there is objective
evidence of a probable default on the loan and on the basis of past experience and historical data
(expected credit losses). When, in subsequent periods, the reasons for the impairment no longer exist,
the carrying amount of the asset is restated up to the amount deriving from the application of the
amortised cost as if no impairment loss had been recognised.
Other non-current equity instruments classified to FVOC are initially measured at fair value plus any
directly attributable transaction costs. Changes in fair value and any gains or losses on disposal of an
equity investment are taken to other comprehensive income and never pass through profit or loss. Since
this election is irrevocable and may be made on an investment-by-investment basis, any exceptions
upon initial recognition will be disclosed in the notes to the caption. All equity instruments must be
measured at fair value. The fair value of securities traded in active markets is determined by reference
to the exchange prices recognised at the end of trading at the reporting date.
The fair value of investments for which no active market exists is determined on the basis of the price
in recent transactions between independent parties of essentially similar instruments or the use of other
valuation techniques such as methods based on income or an analysis of discounted cash flows.
Financial assets designated at fair value through profit or loss upon initial recognition are measured
with reference to their market value at the reporting date. The value of non-quoted instruments is
determined through generally accepted financial valuation techniques based on market data. Gains or
losses deriving from the fair value measurement of assets classified in this category are recognised in
profit or loss.

F.I.L.A. Group
186
Cash and cash equivalents
Cash and cash equivalents principally include cash, bank deposits on demand and other highly liquid
short-term investments (convertible into liquidity within ninety days). They are recognised at nominal
value, which represents fair value.
For the purposes of the classification of financial instruments according to the criteria set out in IFRS
9, as required by IFRS 7, cash and cash equivalents have been classified as financial assets at amortised
cost for credit risk purposes. Current account overdrafts are classified under “Current Financial
Liabilities”.
Trade receivables and other Assets
Trade receivables and other assets are initially recognised at fair value and subsequently measured at
amortised cost, using the effective interest rate method. Trade and other receivables are reduced by an
appropriate loss allowance for doubtful accounts to reflect estimated impairment losses taking into
account objective evidence of indicators of impairment of trade receivables. The impairment losses are
recognised so that the assets are discounted to the present value of the expected future cash flows. If, in
subsequent periods, the reasons for the impairment loss no longer exist, the carrying amount of the
assets is reinstated up to the amount deriving from the application of the amortised cost where no
impairment loss had been applied.
The loss allowance is recognised as a direct reduction of trade receivables and other assets. These
provisions are classified in profit or loss caption “Impairment losses”; the same classification was used
for any utilisations and impairment losses on trade receivables.
Inventories
Inventories of raw materials, semi-finished products and finished goods are measured at the lower of
purchase or production price, including related charges, determined in accordance with the weighted
average cost method, and the net realisable value. Net realisable value is the estimated selling price in
the ordinary course of business, less the estimated costs of completion and the estimated costs to sell.
Obsolete and slow-moving inventories are written down in relation to their possible use or realisable
value.
The purchase cost is used for direct and indirect materials, purchased and used in the production cycle.
The production cost is however used for finished goods or in work-in-progress.
For the determination of the purchase price, consideration is taken of the actual costs incurred net of
commercial discounts.

F.I.L.A. Group
187
Production cost includes, in addition to the costs of the materials used, as defined above, the direct and
indirect production costs allocated. The indirect costs were allocated based on the normal production
capacity of the plant.
Distribution costs were excluded from purchase cost and production cost.
Provisions for risks and charges
Provisions for risks and charges are recognised where the Company has a current obligation, legal or
constructive, deriving from a past event and it is probable that fulfilment of the obligation will result in
an outflow of resources and the amount of the obligation can be reasonably estimated.
Provisions are recognised at the value representing the best estimate of the amount that the entity would
pay to discharge the obligation or transfer it to a third party. When the time value of money is significant
and the payment dates of the obligations can be reliably estimated, the provision is discounted. The rate
used in the determination of the present value of the liability reflects the current market values and
includes the further effects relating to the specific risk associated with each liability. The increase in the
provision due to the passage of time is recognised in profit or loss under “Financial income/(expense)”.
The provisions are periodically updated to reflect the changes in the estimate of the costs, of the time
period and of the discount rate; the revisions of estimates are recognised in the same profit or loss
caption in which the provision was recognised, or when the liability relates to an asset, against the asset
caption to which it refers.
The notes illustrate the contingent liabilities represented by: (i) possible obligations (but not probable)
deriving from past events, whose existence will be confirmed only on the occurrence or otherwise of
one or more uncertain future events not fully under the control of the entity; (ii) current obligations
deriving from past events whose amount cannot be reliably estimated or whose fulfilment will likely
not generate an outflow of resources.
Restructuring provisions
Restructuring provisions are recognised where an approved, detailed formal programme has raised a
valid expectation among third parties that the entity will carry out the restructuring by starting to
implement that plan or announcing its main features to those affected by it.

F.I.L.A. Group
188
Employee benefits
All employee benefits are measured and reflected in the financial statements on an accruals basis.
Defined contribution plans
Defined contribution plans are post-employment benefit plans under which the entity pays fixed
contributions to a separate entity and will not have a legal or constructive obligation to pay further
contributions. The contributions to be paid to defined contribution plans are recognised as costs in profit
or loss when incurred. Contributions paid in advance are recognised under assets up to the extent the
advance will determine a reduction in future payments or a reimbursement.
Defined benefit plans
Defined benefit plans are post-employment benefit plans other than defined contribution plans. The net
obligation of the Company deriving from defined benefit plans is calculated separately for each plan
estimating the amount of the future benefit which the employees matured in exchange for the services
provided in the current and previous years; this benefit is discounted to calculate the present value,
while any costs relating to past services not recognised in the financial statements and the fair value of
any plan assets is deducted from liabilities. The discount rate is the return, at the reporting date, of the
primary obligations whose maturity date approximates the terms of the obligations of the Company and
which are expressed in the same currency in which it is expected the benefits will be paid. The
calculation is made by an independent actuary using the projected credit unit method. Where the
calculation generates a benefit for the Company, the asset recognised is limited to the total, net of all
costs relating to past services not recognised and the present value of all economic benefits available in
the form of refunds from the plan or curtailments in future contributions to the plan. Where
improvements are made to the plan benefits, the portion of increased benefits relating to past service is
recognised as an expense on a straight-line basis over the average period until the benefits vested. If the
benefits vest immediately, the cost is recognised immediately in profit or loss.
The Company recognises all actuarial gains and losses from a defined benefit plan directly and
immediately in equity.

F.I.L.A. Group
189
In relation to Post-Employment Benefits, following the amendments to Law No. 296 of December 27,
2006 and subsequent Decrees and Regulations (“Pension Reform”) issued in the first months of 2007,
the company F.I.L.A. S.p.A. adopted the following accounting treatment:
The Post-Employment Benefits, accrued to December 31, 2006 are considered a defined benefit
plan as per IAS 19. The benefits guaranteed to employees, in the form of Post-Employment
Benefits, paid on the termination of employment, are recognised in the period the right vests;
The Post-Employment Benefits accruing from January 1, 2007 are considered a defined
contribution plan and therefore the contributions accrued in the period were fully recognised as
a cost and recognised as a liability in the caption “Post-Employment Benefits”, after deduction
of any contributions already paid.
Other long-term employee benefits
The net obligation of F.I.L.A. S.p.A. for long-term employee benefits, other than those deriving from
pension plans, corresponds to the amount of the future benefits which employees accrued for services
in current and previous years. This benefit is discounted, while the Fair Value of any assets is deducted
from the liabilities. The discount rate is the return, at the reporting date, on the primary obligations
whose maturity date approximates the terms of the obligations of the Company. The obligation is
calculated using the projected unit credit method. Any actuarial gains or losses are recognised in the
statement of financial position in the year in which they arise.
Short-term employee benefits
Short-term employee benefits are recognised as undiscounted expenses when the services that generate
them are provided.
F.I.L.A. S.p.A. records a liability for the amount that it expects will be paid in the presence of a present
obligation, legal or constructive, as a consequence of past events and for which the obligation can be
reliably estimated.
Financial liabilities
Financial liabilities are initially recognised at fair value, which essentially coincides with the sum
received, less directly attributable transaction costs. Management determines the classification of
financial liabilities according to the criteria laid down in IFRS 9 and cited in IFRS 7 on initial
recognition.

F.I.L.A. Group
190
Subsequent to initial recognition, such liabilities are measured at amortised cost, as defined in IFRS 9.
Financial liabilities measured at amortised cost are measured at amortized cost, taking the interest to
profit or loss according to the effective interest rate method or applying a rate that results in a nil balance
of the present values of the net cash flows generated by the financial instrument. Nominal value is used
as an approximation of amortised cost for instruments maturing within twelve months.
Financial instruments
Financial instruments are initially recognised at fair value and, subsequent to initial recognition, are
measured on the basis of their classification, as per IFRS 9.
IFRS 9 classifies financial assets into three principal categories: at amortised cost, at fair value through
other comprehensive income (FVOCI) or at fair value through profit or loss (FVTPL). According to the
standard, classification is usually based on the entity’s business model for the financial assets and the
contractual cash flow characteristics of each financial asset. Under IFRS 9, derivatives embedded in
contracts where the host contract is a financial asset falls within the scope of the standard are never to
be separated. Rather, the hybrid instrument is examined as a whole to determine its classification.
IFRS 9 essentially maintains the provisions of IAS 39 for the classification and measurement of
financial liabilities.
Derivatives
Derivatives are classified in the category “Hedging derivatives” if they satisfy the requisites for the
application of so-called hedge accounting, otherwise, although in place in order to manage exposure to
risk, they are recognised as “Non-hedging derivatives”.
Financial instruments are only accounted for under the hedge accounting methods adopted by the
Company when the relationship between the derivative and the hedged item is formally documented
and the hedge is highly effective (effectiveness test).
The effectiveness of hedges is documented both at the inception of the transaction and periodically (at
least at the annual or interim reporting dates).
When the hedging derivatives cover the risk of change in the fair value of the instruments subject to the
hedge (fair value hedge), the derivatives are recognised at fair value with the effects in profit or loss.
When the derivatives hedge the risk of changes in the cash flows of the hedged instrument (cash flow
hedge), the effective part of the changes in the fair value of the derivatives is recognised in the statement
of comprehensive income and presented in the cash flow hedge reserve. The ineffective part of the
changes in the fair value of the derivative instrument is immediately recognised in profit or loss.
The methods for the calculation of the fair value of these financial instruments, for accounting or

F.I.L.A. Group
191
disclosure purposes, are summarised below with regards to the main categories of financial instruments:
Derivative financial instruments: the pricing models are adopted based on the market values of
the interest rates;
Unlisted financial assets and liabilities: for financial instruments with maturity greater than 1
year the discounted cash flow method was applied, i.e. the discounting of expected cash flows
in consideration of current interest rate conditions and credit ratings, for the determination of
the fair value on first-time recognition. Subsequent measurements are made based on the
amortised cost method;
Listed financial instruments: the market value at the reporting date is used.
In relation to financial instruments measured at fair value, IFRS 13 requires the classification of these
instruments according to the hierarchy levels, which reflect the significance of the inputs used in
establishing the fair value. The following levels are used:
Level 1: unadjusted asset or liability prices on an active market;
Level 2: inputs other than prices listed at the previous point, which are directly observable
(prices) or indirectly (derived from the prices) on the market;
Level 3 - input which is not based on observable market data.
Trade payables and other liabilities
Trade payables and other liabilities are initially recognised at fair value, normally equal to the nominal
amount, net of discounts, returns or invoice adjustments, and are subsequently measured at amortised
cost. When there is a change in the cash flows and it is possible to estimate them reliably, the liabilities
are recalculated to reflect this change, based on the present value of the cash flows and on the internal
rate of return initially determined.
Current, deferred and other taxes
Income taxes include all the taxes calculated on the taxable income of the Company applying the tax
rates in force at the reporting date.
Income taxes are recognised in profit or loss, except those relating to items directly credited or debited
to equity, in which case the tax effect is recognised directly in equity.
Other taxes not related to income, such as taxes on property and capital gains, are included under other
operating costs (“Services”, “Use of third party assets” and “Other charges”). The liabilities related to
indirect taxes are classified under “Other Liabilities”.
Deferred tax assets and liabilities are determined in accordance with the global assets/liability method

F.I.L.A. Group
192
and are calculated on the basis of the temporary differences arising between the carrying amounts of
the assets and liabilities and the corresponding amounts recognised for tax purposes, taking into account
the tax rate under current tax legislation for the years in which the differences will reverse, with the
exception of non-tax deductible goodwill and those differences deriving from investments in
subsidiaries which are not expected to reverse in the foreseeable future, and on the tax losses to be
carried forward.
“Deferred Tax Assets” are classified under non-current assets and are recognised only when there is a
high probability of future taxable profit to recover these assets.
The recovery of the “Deferred Tax Assets” is reviewed at each reporting date and those for which
recovery is no longer probable are taken to profit or loss.
Revenues and costs
Revenue recognition
The revenue and income are recognised, as per IFRS 15, net of returns, discounts, rebates and premiums
as well as direct taxes related to the sale of products and services. In particular, revenue is measured
taking into account the consideration specified in the contract with the customer and is recognised when
control of the good or service is transferred. As it concerns the sale of goods, revenue is recognised at
a point in time, i.e. when control of the goods is transferred to the buyer, which generally coincides with
their physical delivery.
Recognition of costs
Costs are recognised when relating to goods and services acquired or consumed in the year or when
there is no future utility.
The costs directly attributable to share capital transactions are recognised as a direct reduction of equity.
Commercial costs relating to the acquisition of new customers are expensed when incurred.
Financial income and expense
Financial income includes interest income on liquidity invested, dividends received and income from
the sale of available-for-sale financial assets. Interest income is recognised in profit or loss on an
accruals basis using the effective interest method. Dividend income is recognised when the right of the
company to receive the payment is established which, in the case of listed securities, corresponds to the
coupon date.
Financial expense includes interest on loans, discounting of provisions, dividends distributed on

F.I.L.A. Group
193
preference shares reimbursable, changes in the fair value of financial assets recognised through profit
or loss and losses on financial assets. Borrowing costs are recognised in profit or loss using the effective
interest method. Exchange differences are shown on a net basis.
Dividends
Dividends to be paid to shareholders are recognised on the date of the shareholders’ resolution.
Earnings per share
The basic earnings/(loss) per share are calculated by dividing the Company’s profit or loss by the
weighted average shares outstanding during the year.
In order to calculate the diluted earnings/(loss) per share, the average weighted number of shares
outstanding is adjusted assuming the conversion of all shares with potential dilutive effect.
The profit or loss for the year is also adjusted to account for the effects of the conversion, net of taxes.
The diluted earnings/(loss) per share are calculated by dividing the Company’s profit or loss for the
year by the weighted average number of ordinary shares outstanding during the year and those
potentially arising from the conversion of all potential ordinary shares with dilutive effect.
Use of estimates
The preparation of the separate financial statements requires the directors to apply accounting principles
and methods that, in some circumstances, are based on judgements and estimates based on experience
and assumptions which are from time to time considered reasonable and realistic based on the relative
circumstances. The application of these estimates and assumptions impact the carrying amount of the
assets and liabilities and of the costs and revenue and the disclosure on contingent assets and liabilities
at the reporting date. Actual results may differ from these estimates.
The captions which require greater judgement by the Directors in the preparation of the estimates and
for which a change in the underlying conditions or the assumptions may have a significant impact on
the combined financial figures are briefly described below.
Measurement of receivables: trade receivables are adjusted by the loss allowance, taking into
account the effective recoverable amount. The calculation of the impairment losses requires the
directors to make judgements based on the documentation and the information available
relating to the solvency of the customers, and from market and historical experience.
Measurement of goodwill and intangible assets with indefinite useful life: in accordance with
the accounting principles applied by the Company, goodwill and the indefinite intangible assets
are subject to impairment testing at least annually in order to verify whether a reduction in value
has taken place. This assessment requires the directors to make judgements based on the
information available within the Group and from the market, as well as from historical

F.I.L.A. Group
194
experience; this depends in addition on factors which may change over time, affecting the
judgements and estimates made by directors. In addition, when it is determined that there may
be a potential impairment loss, the Company determines this through using the most appropriate
technical valuation methods available.
Risk provisions: the identification of the existence of a present obligation (legal or constructive)
in some circumstances may be difficult to determine. The directors evaluate these factors case-
by-case, together with the estimate of the amount of the economic resources required to fulfil
the obligation. When the directors consider that a liability is only possible, the risks are
disclosed in the notes under the section on commitments and risks, without any provision.
Measurement of closing inventories: inventories of products which are obsolete or slow moving
are periodically subject to impairment testing and written down where the recoverable amount
is lower than the carrying amount. The write-downs are made based on assumptions and
estimates of management deriving from experience and historic results.
Pension plans and other post-employment benefits: management uses multiple statistical
assumptions and valuation techniques with the objective of anticipating future events for the
calculation of the charges, liabilities and assets relating to these plans. The assumptions relate
to the discount rate, the expected return of the plan assets and the rate of future salary increases.
In addition, the actuarial consultants of the Company use subjective factors, for example
mortality and employee turnover rates.
The calculation of deferred tax assets is supported by a recoverability plan prepared on the basis of
assumptions which the directors consider reasonable.
The transition to IFRS 16 introduces some elements of professional judgment that entail the use of
assumptions and estimates with regard to the lease term and the definition of the incremental borrowing
rate.

F.I.L.A. Group
195
Introduction
F.I.L.A. S.p.A. operates in the creativity tools market, producing writing and design objects such as
crayons, paints, modelling clay and pencils etc..
F.I.L.A. S.p.A., Fabbrica Italiana Lapis ed Affini (hereafter “the Company”) is a limited liability
company with registered office in Pero (Italy), Via XXV Aprile 5. The ordinary shares of the company
were admitted for trading on the MTA, STAR Segment, organised and managed by Borsa Italiana
S.p.A. from November 12, 2015.
The separate financial statements of the F.I.L.A. S.p.A. were prepared in accordance with the
International Financial Reporting Standards (IFRS) endorsed by the European Union.
For further details regarding the share capital increase, see Note 12 – Share capital and equity to F.I.L.A.
S.p.A.’s financial statements as at and for the year ended December 31, 2020.
The breakdown of the share capital of F.I.L.A. S.p.A. is illustrated below:
Shareholder Ordinary shares %
Pencil S.p.A. 13,694,564 31.88%
Venice European Investment Capital S.p.A. 2,535,000 5.9%
Sponsor 361,291 0.84%
Market Investors 26.367.337 61.38%
Total 42,958,192
Shareholder Ordinary shares Class B Shares Total Voting rights
Pencil S.p.A. 13,694,564 8,081,856 21,776,420 56.46%
Venice European Investment Capital S.p.A. 2,535,000 2,535,000 3.77%
Space Holding Srl 361,291 361,291 0.54%
Market Investors 26,367,33700 26,367,33700 39.23%
Total 42,958,192 8,081,856 51,040,048
F.I.L.A. Group
196
These financial statements as at and for the year ended December 31, 2020, are presented in Euro, as
the functional currency in which the Company operates and comprise the Statement of Financial
Position, the Statement of Comprehensive Income, the Statement of Cash Flows, the Statement of
Changes in Equity and the Notes and are accompanied by the Directors’ Report.

F.I.L.A. Group
197
Note 1 - Intangible Assets
“Intangible Assets” at December 31, 2020 amount to Euro 4,966 thousand (Euro 6,599 thousand at
December 31, 2019) and consist only of intangible assets with finite useful lives.
The table below shows the changes in the year.
Industrial Patents and Intellectual Property Rights amount to Euro 23 thousand at December 31, 2020
(Euro 31 thousand at December 31, 2019).
The average residual useful life of the industrial patents and intellectual property rights recognised in
the financial statements at December 31, 2020, is 5 years. coerenza tra masiuscolo e minuscolo
Concessions, Licenses, Trademarks and Similar Rights amount to Euro 238 thousand at December 31,
2020 (Euro 298 thousand at December 31, 2019) and include the costs incurred for the registration and
acquisition of trademarks necessary for the marketing of F.I.L.A. products.
Their average residual useful life recognised in the financial statements at December 31, 2020 is 10
Euro thousands
Industrial Patents &
Intellectual Property
Rights
Concessions,
Licenses,
Trademarks &
Similar Rights
Other Intangible
Assets
Assets under
developmentTotal
Change in Historical Cost
December 31, 2018 200 3,099 5,533 3,360 12,192
Increases - 51 5,095 (1,570) 3,576
Investments - 51 1,769 1,756 3,576
Transfers from assets under development - - 3,326 (3,326) -
December 31, 2019 200 3,151 10,627 1,790 15,768
Increases - 8 1,234 ,402 1,644
Investments - 8 766 870 1,644
Transfers from assets under development - - 468 (468) -
December 31, 2020 200 3,158 11,862 2,193 17,413
Accumulated amortisation
December 31, 2018 (158) (2,780) (3,284) - (6,222)
Increases (10) (73) (2.864) - (2.947)
Amortisation of the year (10) (73) (2,864) - (2,947)
December 31, 2019 (168) (2,853) (6,148) - (9,169)
Increases (8) (67) (3,202) - (3,277)
Amortisation of the year (8) (67) (3,202) - (3,277)
December 31, 2020 (177) (2,920) (9,349) - (12,446)
Carrying Amount at December 31, 2018 42 320 2.248 3,360 5,970
Carrying Amount at December 31, 2019 31 298 4.480 1,790 6,599
Carrying Amount at December 31, 2020 23 238 2.512 2,193 4,966
Change 2020 - 2019 (8) (60) (1.968) 403 (1.633)
Note 1 - INTANGIBLE ASSETS WITH FINITE LIFE

F.I.L.A. Group
198
years.
Assets under development totalled Euro 2,193 thousand at December 31, 2020 (Euro 1,790 thousand at
December 31, 2019) and include costs relating to the capitalisation of software licenses owned for the
SAP system, although not activated in 2020, in addition to consultancy costs incurred.
Other amounts to Euro 2,512 thousand at December 31, 2020 (Euro 4,480 thousand at December 31,
2019) and include costs relating to the capitalisation of the software licenses related to the SAP system
activated for the full year 2019 and the consultancy and personnel expense incurred to implement and
develop the Company’s ERP system.
The average residual useful life of other intangible assets recognised in the financial statements at
December 31, 2020, is 3 years.
There are no intangible assets whose usage is subject to restrictions (for further details, reference should
be made to the “Directors’ Report - Commitments and Guarantees”).
Note 2 - Property, Plant and Equipment
“Property, Plant and Equipment” at December 31, 2020 amounts to Euro 9,140 thousand (Euro 10,498
thousand at December 31, 2019), comprising for Euro 7,464 thousand Property, Plant and Equipment
(“Note 2.A - Property, Plant and Equipment”) and for Euro 1,676 thousand Right-of-Use Assets (“Note
2.B - Right-of-Use Assets”).

F.I.L.A. Group
199
The table below shows the changes in the year:
Note 2.A - Property, Plant and Equipment
Land at December 31, 2020, amounting to Euro 1,977 thousand (Euro 1,977 thousand at December 31,
2019), includes land adjacent to the building owned at the production site in Rufina Scopeti (Florence,
Italy).
“Buildings” at December 31, 2020 totalling Euro 1,701 thousand (Euro 2,068 thousand at December
31, 2019) solely refer the company’s buildings located in Rufina Scopeti (Florence, Italy).
“Plant and Machinery” amounts to Euro 3,131 thousand at December 31, 2020 (Euro 3,676 thousand
at December 31, 2019) and mainly includes investments in machinery for the production plant at Rufina
Euro thousands
Land BuildingsPlant and
Machinery
Industrial &
Commercial
Equipment
Other AssetsAssets under
construction Total
Change in Historical Cost
December 31, 2018 1,977 9,573 17,925 8,963 1,245 1.036 40,719
Increases - 103 1.039 383 52 (920) 657
Investments - 6 94 80 52 425 657
Transfers from assets under construction - 97 945 303 - (1,345) -
Decreases - - (11) - (12) - (23)
Divestments - - (11) - (7) - (18)
Write-downs (5) (5)
December 31, 2019 1,977 9,676 18,954 9,346 1,284 115 41,352
Increases - 6 230 120 180 (32) 504
Investments - 6 78 39 180 201 504
Transfers from assets under construction - - 152 81 - (233) -
Decreases - - - - (6) - (6)
Divestments - - - - (6) - (6)
December 31, 2020 1,977 9,682 19,183 9,465 1,460 83 41,850
Change in Accumulated Depreciation
December 31, 2018 - (7,237) (14,544) (8,601) (1.009) - (31,391)
Increases - (372) (745) (314) (73) - (1,504)
Depreciation of the year - (372) (745) (314) (73) - (1,504)
Decreases - 1 11 - 6 - 18
Divestments - 1 11 - 6 - 18
December 31, 2019 - (7,608) (15,278) (8,914) (1,078) - (32,878)
Increases - (373) (774) (282) (85) - (1,514)
Depreciation of the year - (373) (774) (282) (85) - (1,514)
Decreases - - - - 6 - 6
Divestments - - - - 6 - 6
December 31, 2020 - (7,981) (16,052) (9,197) (1,156) - (34,386)
Carrying Amount at December 31, 2018 1,977 2,336 3,381 362 236 1.036 9,328
Carrying Amount at December 31, 2019 1,977 2,068 3,676 432 206 115 8,474
Carrying Amount at December 31, 2020 1,977 1,701 3,131 269 303 83 7,464
Change 2020 - 2019 - (367) (545) (163) 97 (32) (1.010)
Note 2.A - PROPERTY, PLANT AND EQUIPMENT

F.I.L.A. Group
200
Scopeti (Florence, Italy).
During the year, the account increased due to investment in new plant and machinery to expand the
current production capacity and to streamline production (Euro 230 thousand).
“Industrial and Commercial Equipment” amount to Euro 269 thousand at December 31, 2020 (Euro
432 thousand at December 31, 2019) and mainly relates to investments in production moulds and the
updating of the production plant at Rufina Scopeti (Florence, Italy).
“Other” amount to Euro 303 thousand at December 31, 2020 (Euro 206 thousand at December 31, 2019)
and include furniture and office equipment, electronic office equipment and cars. In 2020, there was an
increase mainly due to the renewal and implementation of the PC fleet necessary for the adoption of
remote working to cope with the ongoing COVID-19 pandemic (Euro 180 thousand).
“Assets under construction” amount to Euro 83 thousand at December 31, 2020 and mainly include the
costs incurred for investments in new plant and machinery not yet operational at the reporting date,
intended to expand current production capacity and increase the efficiency of the production process at
the Rufina plant (Florence, Italy).

F.I.L.A. Group
201
Note 2.B - Right-of-Use Assets
Right-of-use assets at December 31, 2020 amounted to Euro 1,676 thousand and mainly refer to head
office buildings in Pero and to company car leases.
During 2020, rental/leasing contracts were terminated for Euro 147 thousand and new contracts were
entered into for Euro 228 thousand. → questa parte va dopo la tabella
Euro thousandsBuildings Plant and machinery Other assets Total
Historical cost
December 31, 2019 1,778 53 667 2,498
Increases - - 228 228
Investments - - 228 228
Decreases - - (147) (147)
Divestments - - (147) (147)
December 31, 2020 1,778 53 748 2579
Accumulated depreciation
December 31, 2019 (271) (15) (187) (473)
Initial recognition (273) (14) (246) (534)
Depreciation (273) (14) (246) (534)
Decreases - - 104 104
Divestments - - 104 104
December 31, 2020 (545) (29) (329) (903)
Carrying amount at December 31, 2019 1,507 38 479 2,024
Carrying amount at December 31, 2020 1,233 24 419 1,676
Change 2020 - 2019 (274) (14) (60) (348)
Nota 2.B RIGHT-OF-USE ASSETS

F.I.L.A. Group
202
Note 3 – Financial assets
“Financial Assets” amount to Euro 64,684 thousand at December 31, 2020 (Euro 43,088 thousand at
December 31, 2019).
The breakdown of the “Financial Assets” at December 31, 2020 and at December 31, 2019 is shown
below:
The account “Loans and Receivables - subsidiaries -non-current portion” includes loans to:
Fila Stationery O.O.O. (Russia) for Euro 563 thousand. The loan accrues interest equal to
Euribor at 3 months, plus a spread of 375 basis points (floor 0);
Industria Maimeri (Italy) for Euro 56 thousand. The loan accrues interest at a variable rate
equal to Euribor at 6 months, plus a spread of 200 basis points;
Canson SAS (France) for Euro 2,045 thousand. The loan accrues interest at a variable rate equal
to Euribor at 3 months, plus a spread of 315 basis points (floor 0).
In addition, the loss allowance on these medium/long-term loans calculated on the basis of the average
term (3 years) and country risk totalled Euro 4 thousand, a write-down down sharply compared to Euro
13 thousand in 2019.
“Loans and Receivables - subsidiaries -current portion” includes the current portion:
of the loan, granted to Industria Maimeri S.p.A. (Italy) in 2014 of Euro 20 thousand, down by
Euro 150 thousand on the previous year, following the waiver by F.I.L.A. S.p.A. and related
recapitalisation of the company. The loan accrues interest equal to Euribor at 6 months, plus a
spread of 200 basis points;
the loan, granted to Industria Maimeri S.p.A. (Italy), in 2018, of Euro 406 thousand. The loan
Euro thousands
Loans and
Receivables -
Subsidiaries
Derivative Financial
Instruments
Other Financial
Assets - Third
Parties
Total
December 31, 2019 42,867 - 221 43,088
non-current portion 11,310 - 145 11,455
current portion 31,557 - 76 31,633
December 31, 2020 64.527 - 157 64,684
non-current portion 2,659 - 80 2,739
current portion 61,868 - 77 61,945
Change 21,660 - (63) 20,217
non-current portion (8,651) - (65) (8,716)
current portion 30,311 - 1 30,312
Note 3.A - FINANCIAL ASSETS

F.I.L.A. Group
203
accrues interest equal to Euribor at 3 months, plus a spread of 300 basis points (floor 0). The
amount includes Euro 6 thousand of accrued interest;
loans granted in favour of Canson Sas (France – Euro 18,114 thousand), Canson Australia Pty
Ltd. (Australia – Euro 1,716 thousand) and Lodi 12 Sas (France - Euro 422 thousand) and
Dixon Ticonderoga (USA - Euro 1,777 thousand). The amount includes Euro 245 thousand of
accrued interest. The loans bear interest at a variable rate equal to the three-month Euribor, plus
a spread of 375 basis points;
the loan, amounting to Euro 1.415 thousand, granted to the subsidiary Canson Brasil I.P.E.
LTDA (Brazil - formerly Licyn Mercantil Industrial Ltda). The amount includes Euro 419
thousand of accrued interest. The loan accrues interest at a variable rate equal to Euribor at 3
months, plus a spread of 350 basis points (floor 0);
the loan, amounting to Euro 1,230 thousand, granted to the subsidiary Canson SAS (France).
The amount includes Euro 30 thousand of accrued interest. The loan accrues interest at a
variable rate equal to Euribor at 3 months, plus a spread of 315 basis points (floor 0);
the loan, amounting to Euro 11 thousand, granted to FILA SA PTY Ltd. (South Africa)
regarding only the payable for interest on the old loan repaid in 2019;
the loan, amounting to Euro 1,124 thousand, granted to FILA Stationary O.O.O. (Russia). The
loan accrues interest at a variable rate equal to Euribor at 3 months, plus a spread of 225 basis
points and 375 basis points (floor 0);
the loan, amounting to Euro 1,105 thousand, granted to FILA Stationary O.O.O. (Russia). The
loan was disbursed in Russian roubles (RUB 100,000 thousand) with a currency swap contract
to hedge future currency fluctuations. The loan accrues interest at a variable rate equal to a
fixed rate of 225 basis points;
the non interest-bearing loan, granted to Industria Maimeri S.p.A. (Italia) in 2018 of Euro 400
thousand. This loan did not accrue interest as it is non-interest bearing loan;
the loan, amounting to Euro 22,775 thousand, granted to FILA Arches (France), for the
purchase on March 2, 2020 of the business unit for the manufacture and marketing of Arches
brand products from the Swedish Ahlstrom-Munksjo group. The loan accrues interest at a
variable rate equal to Euribor at 3 months, plus a spread of 345 basis points (floor 0);
the loans, amounting to Euro 3,733 thousand, granted to Daler Rowney Ltd. (United Kingdom)
in 2019. The loan accrues interest at a variable rate equal to Euribor at 3 months, plus a spread
of 350 basis points (floor 0);
the loan, amounting to Euro 1,122 thousand, granted to Daler Rowney Ltd. (United Kingdom)
in 2019. The loan does not accrue interest;
the loan, amounting to Euro 1,916 thousand, granted to Daler Rowney Ltd. (United Kingdom)

F.I.L.A. Group
204
in 2019. The amount includes Euro 15 thousand of accrued interest. The loan accrues interest
at a variable rate equal to Euribor at 3 months, plus a spread of 300 basis points (floor 0);
the loan, amounting to Euro 203 thousand, granted to FILA Art Product AG (Switzerland) in
2017. The loan accrues interest at a variable rate equal to Euribor at 6 months, plus a spread of
300 basis points (floor 0);
the loan, amounting to Euro 3,136 thousand, granted to Dixon Ticonderoga (USA). The loan
accrues interest at a variable rate equal to Euribor at 3 months, plus a spread of 300 basis points
(floor 0);
the loan, amounting to Euro 353 thousand, granted to Fila Art & Craft (Israel) in 2018. The
loan accrues interest at a variable rate equal to Euribor at 3 months, plus a spread of 270 basis
points (floor 0);
a financial receivable of Euro 1,379 thousand at 31 December 2020 relating to dividends
approved by Dixon Ticonderoga Company and not paid in the current year.
“Other Financial Assets - Third Parties” of Euro 157 thousand at December 31, 2020 (Euro 221
thousand at December 31, 2019) include:
deposits paid to third parties as contractual guarantees for the provision of services and goods
(Euro 12 thousand);
the loan granted in 2017 to Gianni Maimeri, who has a non-controlling interest in Industria
Maimeri S.p.A., in the amount of Euro 145 thousand. In 2020, the company waived the partial
repayment of Euro 67 thousand. The amount includes Euro 9 thousand of accrued interest. The
loan accrues interest at a fixed rate of 200 basis points.

F.I.L.A. Group
205
Details on the timing of cash flows and financial assets at December 31, 2020 are illustrated in the
following table:
As per IFRS 7, the accounting treatment by class of financial assets at December 31, 2020 was as
follows:
Current
Financial
Assets
Euro thousands
Security Deposits 13 - 13 2004-15-19-20 EUR Italy 0% 0.00% - - - - 13 None None
Loan to third parties 135 10 145 2015 EUR Italy 0% 2.00% 77 68 - - - None None
Dividends to Dixon Ticonderoga (U.S.A.) 1,379 - 1,379 2020 USD U.S.A. Euribor 3 Months 0.00% 1,379 - - - - None None
Loan Canson Sas (France) 3,245 30 3,275 2019 EUR France Euribor 3 Months 3.15% 1,230 1,400 645 - - None None
Loan Canson Sas (France) 17,969 145 18,114 2016 EUR France Euribor 3 Months 3.75% 18,114 - - - - None None
Loan Lodi 12 Sas (France) 418 4 422 2016 EUR France Euribor 3 Months 3.75% 422 - - - - None None
Loan Canson Australia (Australia) 1,619 96 1,715 2016 EUR Australia Euribor 3 Months 3.75% 1,716 - - - - None None
Loan Daler Rowney Ltd. (UK) 3,700 33 3,733 2016-2019 EUR UK Euribor 3 Months 3.50% 3.733 - - - - None None
Loan Daler Rowney Ltd. (UK) 1,122 - 1,122 2019 EUR UK 0.00% 1,122 - - - - None None
Loan Daler Rowney Ltd. (UK) 1,901 15 1,916 2019 EUR UK Euribor 3 Months 3.00% 1,916 - - - - None None
Loan Industria Maimeri S.p.A. (Italy) 75 1 76 2014-2015 EUR Italy 0.00% 20 56 - - - None None
Loan Industria Maimeri S.p.A. (Italy) 400 6 406 2018 EUR Italy Euribor 3 Months 3.00% 406 - - - - None None
Loan Dixon Ticonderoga (U.S.A.) 1,777 - 1,777 2016 EUR U.S.A. Euribor 3 Months 3.75% 1,777 - - - - None None
Loan Dixon Ticonderoga (U.S.A.) 3,136 - 3,136 2018 EUR U.S.A. Euribor 3 Months 3.00% 3,136 - - - - None None
Fila Sud Africa - 11 11 2018 USD South Africa 0.00% 11 - - - - None None
Loan Canson Brasil I.P.E. Ltda (Brazil) 996 419 1,415 2012 EUR Brazil Euribor 3 Months 3.50% 1,415 - - - - None None
Loan FILA Stationery O.O.O. (Russia) 1,468 219 1,687 2013-2020 EUR Russia Euribor 3 Months 2.80% - 3.75% 1.124 70 493 - - None None
Loan FILA Stationery O.O.O. (Russia) 1,093 12 1,105 2020 RUB Russia Euribor 3 Months 2.25% 1.105 - - - - None None
Loan F.I.L.A. Art & Craft (Israel) 350 3 353 2018 EUR Israel Euribor 3 Months 2.70% 353 - - - - None None
Loan FILA Art & Product AG (Switzerland) 203 - 203 2017 EUR Switzerland Euribor 6 Months 3.00% 203 - - - - None None
Loan FILA Arches (France) 22.685 90 22.775 2020 EUR France Euribor 6 Months 3.35% 22.775 - - - - None None
Allowance for impairment (IFRS9) 93- - 93- 88- 4- - - -
Total amount 63,592 1.092 64,684 61,945 1,589 1,138 - 13
Note 3.B - FINANCIAL ASSETS
Description
General information Amount
Guarantees Received Guarantees GrantedAmount
Total Year Currency
Principal Interest Variable Spread 2021 2024After
2024
Country
Interest Non-Current Financial Assets
2022 2023
Euro thousands
December 31,
2020
Asset and
liabilities
measurement at
FVOCI
Assets and
Liabilities at
Amortised Cost
Total
Non-Current assets
Non-Current financial assets Note 3 2,739 2,739 2,739
Current assets
Current financial assets Note 3 61,945 61,945 61,945
Trade Receivables and Other Assets Note 8 20,090 20,090 20,090
Cash and Cash Equivalents Note 9 49,616 49,616 49,616
Euro thousands
December 31,
2019
Asset and
liabilities
measurement at
FVOCI
Assets and
Liabilities at
Amortised Cost
Total
Non-Current assets
Non-Current financial assets Note 3 11,454 11,454 11,454
Current assets
Current financial assets Note 3 31,634 31,634 31,634
Trade Receivables and Other Assets Note 8 16,923 16,923 16,923
Cash and Cash Equivalents Note 9 31,579 31,579 31,579

F.I.L.A. Group
206
Note 4 - Equity Investments
“Equity Investments” at December 31, 2020 amount to Euro 371,689 thousand (Euro 348,744 thousand
at December 31, 2019). The changes of the year are shown below:
The increase of the year totalling Euro 22,945 thousand is due to:
the capital injection by Fila-Arches for the purpose of acquiring the business unit for the
production and marketing of Arches brand products from the Swedish group Ahlstrom-
Munksjo for a total of Euro 22,564 thousand;
increase for recapitalisation of Industria Maimeri S.p.A. through the waiver of the short-term
portion of the loan for an amount of Euro 700 thousand and subsequent write-down for Euro
342 thousand on the basis of the results of the impairment test.
increase for recapitalisation of FILA Stationary O.O.O. (Russia) for Euro 425 thousand by
waiving the short-term portion of the loan;
decrease due to the annual portion of the “2019-2021 Performance Shares Plan” concerning
investments by F.I.L.A. S.p.A. reserved for the executives and managers of the Group’s
international subsidiaries, down by Euro 402 thousand.
Euro thousands
Investments in
Subsidiaries
Investments in
Associates
Investments in
Other CompaniesTotal Amount
December 31, 2019 348,714 28 2 348,744
Increases in the year 23,689 - - 23,689
Decreases in the year (744) - - (745)
December 31, 2020 371,659 28 2 371,689
Change 2020 - 2019 22,945 - - 22,945
Note 4.A - EQUITY INVESTMENTS

F.I.L.A. Group
207
Investments in subsidiaries at December 31, 2020 and the changes of the year are illustrated in the table
below:
For further details, reference should be made to the “Significant events in the year” paragraph.
A comparison between equity investments and the share of equity of the subsidiaries at December 31,
2020 is illustrated in the table below:
The investments held by F.I.L.A. S.p.A. in subsidiaries were subject to impairment tests where
Euro thousands
December 31,
2019Increases Decreases
December 31,
2020
F.I.L.A. Iberia S.L. (Spain) 218 - (8) 210
Fila Arches (France) 10 22,564 22.574
Dixon Ticonderoga Co. (U.S.A.) 107,718 (345) 107,373
F.I.L.A. Chile Ltda (Chile) 62 62
Lyra Bleistift-Fabrik GmbH & Co. KG 12,454 12,454
FILA Stationary and Office Equipment Industry Ltd. Co. (Turkey) 4.069 4,069
FILA Art & Craft (Israel) - -
FILA Stationery O.O.O. (Russia) 95 425 520
Industria Maimeri S.p.A. 1.246 700 (342) 1,603
FILA S.A. (Pty) Ltd. (South Africa) 3.747 3,747
FILA Hellas S.A. (Greece) 2.797 2,797
Fila Polska Sp. Z.o.o (Poland) 44 44
DOMS Industries PTV Ltd (India) 57,278 57,278
Renoir Topco Limited (UK) 97,281 (11) 97,271
St. Cuthberts Holdings Limited (UK) 6,727 6,727
Canson SAS (France) 37,787 (38) 37,749
Lodi 12 SAS (France) 17,133 17,133
Fila Art Products AG (Switzerland) 48 48
Total 348,714 23,689 (744) 371,659
4.B Current Financial Assets
Subsidiaries
Euro thousands
Fila SA PTY LTD (South Africa) 1,655 99.43% 1,645 3,747
Fila Stationary O.O.O. (Russia) (450) 90.00% (405) 520
FILA Stationary and Office Equipment Industry Ltd. Co. (Turkey) 1,902 100.00% 1,902 4,070
DOMS Industries PVT LTD 41,462 51.00% 21,145 57,278
Industria Maimeri S.p.A. (Italy) (102) 51.00% (52) 1,603
Renoir Topco Ltd (UK) (1) 73,503 100.00% 73,503 97,270
St. Cuthberts Holding (UK) (3) 6,009 100.00% 6,009 6,726
Lodi 12 (France) (2) 593 100.00% 593 17,133
Fila Hellas (Greece) 1,893 100.00% 1,893 2,797
Fila Arches (France)* 20,356 100.00% 20,356 22,574
(3) - St. Cuthberts Holding (UK); St. Cuthberts Mill (UK)
(1) - Renoir Topco Ltd (UK); Renoir Midco Ltd (UK); Renoir Bidco Ltd (UK); FILA Benelux SA (Belgium); Daler Rowney Ltd (UK); Brideshore srl (Dominican Republic).
(2) - Lodi 12 SAS (France); Canson Australia PTY LTD (Australia); Canson Qingdao Ltd.(China);Canson Italy (Italy).
* - The net load value of F.I.L.A. S.p.A.'s balance sheet as at 31.12.20 is considered recoverable on the basis of the same assumptions adopted for the definition of the CGU FILA
Arches useful in testing goodwill recoverability
IMPAIRMENT TEST RESULT INVESTMENTS
Equity at
December 31,
2020
Total percentage
of investmentEquity Share
Net carrying
amount

F.I.L.A. Group
208
indicators highlighted a possible impairment loss, comparing the carrying amount in the financial
statements with the recoverable amount. The “Value in use” was used to establish the recoverable
amount of investments. The Value is use as per IAS 36 is calculated as the present value of expected
cash flows.
The expected cash flows for the calculation of the “Value in use” of each subsidiary are developed
based on the information received from the Boards of Directors of the individual subsidiaries in the
2021 Budget, approved by the Group on February 11, 2021, and the Business Plan approved by the
Group’s Board of Directors on March 16, 2021.
In particular, the cash flows were determined based on the assumptions in the plan and applying the
growth rate identified for each subsidiary in line with the long-term assumptions relating to the growth
rate of the sector and the specific country risk in which each company operates. The “Terminal Value”
was calculated applying the perpetual yield method. These financial estimates were subject to approval
by the Boards of Directors of the individual Group companies subject to impairments testing.
The discount rate (W.A.C.C.) is the weighted average cost of risk capital and borrowing cost
considering the tax effects generated by the financial leverage.
The table below outlines the main assumptions for the impairment test on the investments held. The
discount rate is different from December 31, 2019 to reflect the changed market conditions at December
31, 2020, as commented upon below:
With regard to the main considerations on the changes of the year of the discount rates used, reference
should be made to “Note 1 - Intangible assets” of the Notes to the consolidated financial statements at
December 31, 2020.
Taking into account the existence of indicators of impairment, impairment tests were carried out on the
Euro thousands
Discount Rate
(W.A.C.C.)*
Growth Rate
(g rate)
Cash flow
horizon
Terminal Value
Calculation
Method
FILA SA (South Africa) 12.8% 4.8% 5 years Perpetuity growth rate
Fila Stationary O.O.O. (Russia) 11.7% 4.1% 5 years Perpetuity growth rate
Fila Stationary and Office Equipment Industry Ltd. Co (Turkey) 19.6% 9.4% 5 years Perpetuity growth rate
DOMS Industries Pvt Ltd (India) 11.3% 4.0% 5 years Perpetuity growth rate
Industria Maimeri S.p.A. (Italy) 8.0% 1.3% 5 years Perpetuity growth rate
Renoir Topco Ltd (UK) (1)
7.3% 1.9% 5 years Perpetuity growth rate
St. Cuthberts Holding (UK) (3)
7.3% 1.9% 5 years Perpetuity growth rate
Fila Hellas 10.4% 1.5% 5 years Perpetuity growth rate
Lodi 12 (France) (2)
6.7% 1.8% 5 years Perpetuity growth rate
Fila Arches 6.7% 1.8% 5 years Perpetuity growth rate
* Source Bloomberg
IMPAIRMENT TEST - VALUE IN USE CALCULATION ASSUMPTIONS
(1) - Renoir Topco Ltd (UK); Renoir Midco Ltd (UK); Renoir Bidco Ltd (UK); FILA Benelux SA (Belgium); Daler Rowney Ltd (UK); Brideshore srl (Dominican Republic); Castle
Hill Crafts (UK); Creativity (UK).
(2) - Lodi 12 SAS (France); Canson Australia PTY LTD (Australia); Canson Qingdao Ltd.(China) Fila Yixing (China); Canson Italy (Italy).
(3) - St. Cuthberts Holding (UK); St. Cuthberts Mill (UK)

F.I.L.A. Group
209
following subsidiaries:
F.I.L.A. SA PTY LTD (South Africa);
FILA Stationary and Office Equipment Industry Ltd. Co. (Turkey);
FILA Stationary O.O.O. (Russia);
Renoir Topco Ltd (United Kingdom);
DOMS Industries Pvt Ltd (India);
St. Cuthberts Holding (United Kingdom);
Lodi 12 (France);
Fila Hellas SA (Greece);
Industria Maimeri S.p.A. (Italy);
Fila Arches SAS (France).
No impairments losses emerged on the companies subject to testing and no impairment losses were
recognised, except for Industria Maimeri S.p.A. (Italy), which was written down by Euro 342 thousand.
Note 5 – Deferred Tax Assets
“Deferred tax assets” amount to Euro 6,070 thousand at December 31, 2020 (Euro 5,720 thousand at
December 31, 2019).
“Deferred Tax Assets” at December 31, 2020 include temporary differences deductible in future years,
recognised as there is a reasonable certainty of the existence, in the years in which they will reverse, of
taxable profit not lower than the amount of these differences.
Euro thousands
December 31, 2019 5,720
Provisions 1,194
Utilisations (844)
December 31, 2020 6,070
Change 2020 - 2019 350
Note 5.A - CHANGES IN DEFERRED TAX ASSETS
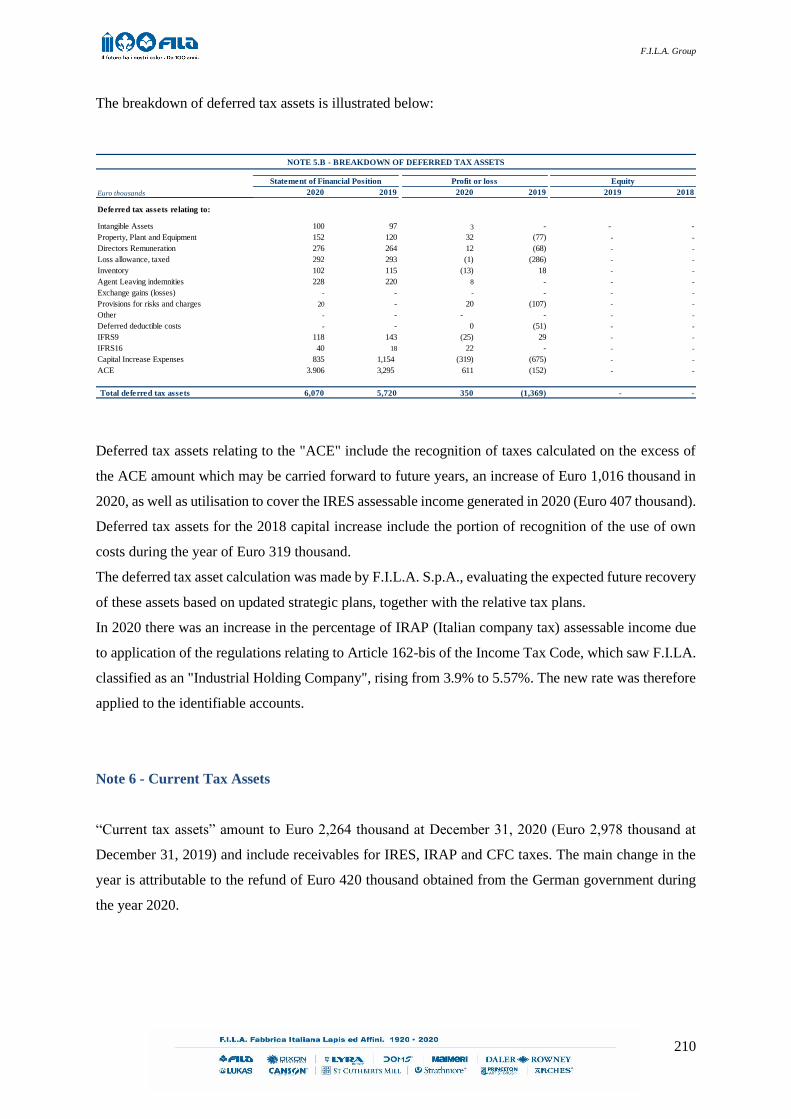
F.I.L.A. Group
210
The breakdown of deferred tax assets is illustrated below:
Deferred tax assets relating to the "ACE" include the recognition of taxes calculated on the excess of
the ACE amount which may be carried forward to future years, an increase of Euro 1,016 thousand in
2020, as well as utilisation to cover the IRES assessable income generated in 2020 (Euro 407 thousand).
Deferred tax assets for the 2018 capital increase include the portion of recognition of the use of own
costs during the year of Euro 319 thousand.
The deferred tax asset calculation was made by F.I.L.A. S.p.A., evaluating the expected future recovery
of these assets based on updated strategic plans, together with the relative tax plans.
In 2020 there was an increase in the percentage of IRAP (Italian company tax) assessable income due
to application of the regulations relating to Article 162-bis of the Income Tax Code, which saw F.I.LA.
classified as an "Industrial Holding Company", rising from 3.9% to 5.57%. The new rate was therefore
applied to the identifiable accounts.
Note 6 - Current Tax Assets
“Current tax assets” amount to Euro 2,264 thousand at December 31, 2020 (Euro 2,978 thousand at
December 31, 2019) and include receivables for IRES, IRAP and CFC taxes. The main change in the
year is attributable to the refund of Euro 420 thousand obtained from the German government during
the year 2020.
Euro thousands 2020 2019 2020 2019 2019 2018
Deferred tax assets relating to:
Intangible Assets 100 97 3 - - -
Property, Plant and Equipment 152 120 32 (77) - -
Directors Remuneration 276 264 12 (68) - -
Loss allowance, taxed 292 293 (1) (286) - -
Inventory 102 115 (13) 18 - -
Agent Leaving indemnities 228 220 8 - - -
Exchange gains (losses) - - - - - -
Provisions for risks and charges 20 - 20 (107) - -
Other - - - - - -
Deferred deductible costs - - 0 (51) - -
IFRS9 118 143 (25) 29 - -
IFRS16 40 18 22 - - -
Capital Increase Expenses 835 1,154 (319) (675) - -
ACE 3.906 3,295 611 (152) - -
Total deferred tax assets 6,070 5,720 350 (1,369) - -
NOTE 5.B - BREAKDOWN OF DEFERRED TAX ASSETS
Statement of Financial Position Profit or loss Equity

F.I.L.A. Group
211
Note 7 - Inventories
Inventories at December 31, 2020 amount to Euro 24,062 thousand (Euro 25,152 thousand at December
31, 2019).
The breakdown of inventories is as follows:
A decrease was recognised, mainly in finished products and goods, due to careful management of
inventories.
Inventories are shown net of the allowance for inventory write-down for raw materials, work in progress
and finished goods, amounting respectively at December 31, 2020 to Euro 50 thousand (Euro 50
thousand at December 31, 2019), Euro 50 thousand (Euro 50 thousand at December 31, 2019) and Euro
170 thousand (Euro 230 thousand at December 31, 2019), which refer to obsolete or slow moving
materials for which it is not considered possible to recover their value through sales.
No inventory is provided as a guarantee on liabilities.
Euro thousands
Raw Materials,
supplies and
Consumables
Work-in-progress
and Semi-finished
Products
Finished Products
and GoodsTotal
December 31, 2019 4,173 2,803 18,176 25,152
December 31, 2020 4,000 2,895 17,167 24,062
Change (173) 92 (1,009) (1,090)
Note 7.A - INVENTORIES

F.I.L.A. Group
212
The changes in the allowance for inventory write-downs in the year were as follows:
During the year the provision was used for disposals and product scrapping. The allocation in the year
was made against obsolete materials and slow moving inventories at December 31, 2020.
Note 8 – Trade receivables and Other assets
Trade receivables and other assets amount to Euro 20,090 thousand, up by Euro 3,167 thousand on the
previous year, when they amounted to Euro 16,923 thousand.
The breakdown is illustrated below.
Trade receivables from third parties amount to Euro 13,550 thousand at December 31, 2020 (Euro
11,272 thousand at December 31, 2019). The increase of Euro 2,278 thousand is mainly due to the
extension of payment terms and the difficulty in collecting payments during the year, due to the
economic effects of the COVID-19 pandemic.
Euro thousands
Raw Materials,
supplies and
Consumables
Work-in-progress
and Semi-finished
Products
Finished Products
and GoodsTotal
December 31, 2018 45 34 266 345
Provisions 50 50 70 170
Utilisations (45) (34) (106) (185)
December 31, 2019 50 50 230 330
Provisions 50 50 62 162
Utilisations (50) (50) (122) (222)
December 31, 2020 50 50 170 270
Change 2020 - 2019 0 0 (60) (60)
Note 7.B - CHANGE IN THE ALLOWANCE FOR INVENTORY WRITE-DOWNS
Euro thousandsDecember 31, 2020 December 31, 2019 Change
Trade Receivables 12,203 10,149 2,054
Tax Assets 137 115 22
Other Assets 252 137 115
Prepayments and Accrued Income 959 872 87
Third parties 13,550 11,272 2,278
Trade Receivables - Subsidiaries 6,540 5,651 889
Subsidiaries 6,540 5,651 889
Total 20,090 16,923 3,167
Note 8.A - TRADE RECEIVABLES AND OTHER ASSETS

F.I.L.A. Group
213
Trade receivables from subsidiaries amount to Euro 6,540 thousand at December 31, 2020 (Euro 5,651
thousand at December 31, 2019). The increase of Euro 889 thousand is primarily due to the
postponement of sales to Group companies in the fourth quarter. Reference should be made to the
"Consolidated Financial Statements of the F.I.L.A. Group - Related Party Transactions" for further
details of the breakdown of Trade receivables from subsidiaries.
The change was due to business dynamics and, in particular, to the reinvoicing of Group companies for
all expenses and management costs handled centrally by the Group's SAP management system.
The amounts of the previous table are shown net of the loss allowance.
At December 31, 2020, there were no trade receivables pledged as guarantees.
All of the above assets are due within 12 months.
The breakdown by geographical segment of trade receivables (by customers) is illustrated in the table
below:
In addition, the changes in the loss allowance to cover doubtful positions are illustrated in the table
below: During the year, positions considered irrecoverable were closed for an amount of Euro 200
thousand.
Euro thousands
December 31,
2020
December 31,
2019Change
Europe 11,921 9,588 2,333
Asia 281 556 (275)
Rest of the World - 5 (5)
Third parties 12,203 10,149 2,054
Note 8.B - TRADE RECEIVABLES FROM THIRD PARTIES BY GEOGRAPHICAL SEGMENT

F.I.L.A. Group
214
“Tax assets” includes V.A.T. and other local taxes other than direct income taxes.
Current tax assets amounted to Euro 137 thousand at December 31, 2020 (Euro 115 thousand at
December 31, 2019) and mainly relate to a tax credit arising from a claim for a refund for current taxes
and related to prior years.
"Other receivables" amounted to Euro 252 thousand at December 31, 2020 (Euro 137 thousand at
December 31, 2019) and mainly include receivables from suppliers for credit notes to be received for
Euro 120 thousand and advances to suppliers.
“Prepayments and accrued income” mainly relate to:
rent for the Pero offices lease (Italy - Euro 70 thousand);
lease payments for company cars (Euro 64 thousand);
insurance premiums (Euro 323 thousand);
costs of maintenance activities relating to EDP expenses (Euro 160 thousand).
The carrying amount of “Other assets” represents the “fair value” at the reporting date.
All of the above assets are due within 12 months.
Euro thousandsAllowance for impairment
December 31, 2018 2,655
Provisions 588
Utilisations (1.428)
December 31, 2019 1,815
Provisions 193
Utilisations (200)
December 31, 2020 1,808
Change 2020 - 2019 (7)
Note 8.C - CHANGES IN THE LOSS ALLOWANCE

F.I.L.A. Group
215
Note 9 - Cash and cash equivalents
“Cash and Cash Equivalents” at December 31, 2020 amount to Euro 49,616 thousand (Euro 31,579
thousand at December 31, 2019).
The breakdown and the change on the previous year are illustrated in the table below.
"Bank and Postal Deposits" consist of temporary liquid funds as part of treasury management and
concern the ordinary current accounts of F.I.L.A. S.p.A..
Bank and postal deposits are remunerated at rates near zero.
There are no bank and postal deposits subject to restrictions.
For comments on cash flows of the year reference should be made to the statement of cash flows.
Euro thousands
Bank and Postal
Deposits
Cash in hand and
other cash
equivalents
Total
December 31, 2019 31,571 8 31,579
December 31, 2020 49,610 6 49,616
Change 2020 - 2019 18,039 (2) 18,037
Note 9.A - CASH AND CASH EQUIVALENTS

F.I.L.A. Group
216
Note 10 - Net financial debt
The “Net Financial Debt” at December 31, 2020 was as follows:
The net financial debt increased by Euro 16,218 thousand compared to December 31, 2019, mainly due
to:
the cash generation totalling Euro 8,453 thousand from operating activity;
net investments in property, plant and equipment and intangible assets of Euro 2,332 thousand
(Euro 4,460 thousand in 2019);
use of cash for "Investing Activities” of Euro 22,564 thousand, relating to the increase in the
equity investment in the subsidiary FILA Arches SAS following the acquisition of the "Arches"
brand business unit;
the generation of cash totalling Euro 5,732 thousand from dividends received from subsidiaries;
the payment of financial expense of Euro 5,954 thousand.
December 31,
2020
December 31,
2019Change
A Cash 6 8 (2)
B Other cash equivalents 49,611 31,571 18,040
C Securities held for trading - - -
D Cash and Cash Equivalents ( A + B + C) 49,617 31,579 18,038
E Current loan assets 61,945 31,634 30,311
F Current bank loans and borrowings (30,485) (3,408) (27,077)
G Current portion of non-current debt (14,063) (9,375) (4,688)
H Other current loans and borrowings (959) (2.186) 1,227
I Current financial debt ( F + G + H ) (45,507) (14,968) (30,539)
J Net curre nt financial position (I + E+ D) 66,055 48,245 17,810
K Non-current bank loans and borrowings (200,788) (175,532) (25,256)
L Bonds issued - - -
M Other non-current loans and borrowings (5,539) (5,474) (65)
N Non-current financial debt ( K + L + M ) (206,327) (181,006) (25,321)
O Net financial debt (J+N) (140,272) (132,761) (7,511)
P Loans issued to third parties 2,727 11,434 (8,707)
Q Net financial debt (O + P) - F.I.L.A. S.p.A. (137,545) (121,327) (16,218)
Euro thousands

F.I.L.A. Group
217
Note 12 - Share Capital and Equity
Share capital
In April and June 2020, 91,252 ordinary F.I.L.A. S.p.A. shares were assigned following the subscription
of a number of “Pacon warrants” by the managers of the US subsidiary Dixon Ticonderoga Company
(U.S.A.).
The resulting breakdown of the share capital of F.I.L.A. S.p.A. is shown below.
According to the available information, published by Consob and updated at December 31, 2020, the
main shareholders of the company were:
Current Share Capital - December 31,
2020No. of Shares % of Share Capital Euro Listing
Ordinary shares 42,958,192 84.17% 39,530,525 MTA - STAR Segment
Class B Shares (multiple votes) 8,081,856 15.83% 7,436,999 Unlisted
Previous Share Capital No. of Shares % of Share Capital Euro Listing
Ordinary shares 42,866,940 84.13% 39,440,428 MTA - STAR Segment
Class B Shares (multiple votes) 8,081,856 15.87% 7,435,844 Unlisted
Shareholder Ordinary shares %
Pencil S.p.A. 13,694,564 31.88%
Venice European Investment Capital S.p.A. 2,535,000 5.9%
Sponsor 361,291 0.84%
Market Investors 26.367.337 61.38%
Total 42,958,192
Shareholder Ordinary shares Class B Shares Total Voting rights
Pencil S.p.A. 13,694,564 8,081,856 21,776,420 56.46%
Venice European Investment Capital S.p.A. 2,535,000 2,535,000 3.77%
Space Holding Srl 361,291 361,291 0.54%
Market Investors 26,367,33700 26,367,33700 39.23%
Total 42,958,192 8,081,856 51,040,048

F.I.L.A. Group
218
The availability and distributability of equity is outlined in the following table:
manca la legenda
Legal reserve
At December 31, 2020 this caption amounted to Euro 8,332 thousand. The increase of Euro 566
thousand as per the Shareholders’ resolution of April 22, 2020, is reported, which allocated a portion
of the profit for the year to the legal reserve in accordance with Article 2430 of the Italian Civil Code.
Share Premium Reserve
The balance at December 31, 2020 amounted to Euro 154,473 thousand (Euro 153,608 thousand at
December 31, 2019). The change is due to the subscription of “Pacon Warrants” by American managers
for Euro 865 thousand.
IAS 19 Reserve
Following the application of IAS 19, the equity reserve is negative for Euro 594 thousand, decreasing
in the year by Euro 91 thousand.
Other reserves
At December 31, 2020, the reserve is positive for Euro 18,839 thousand, decreasing Euro 1,954
thousand on December 31, 2019.
The changes concern the following events:
The share based premium reserve, which relates to the accounting treatment of the “2019-2021
Performance Shares Plan” concerning ordinary F.I.L.A. S.p.A. shares reserved for Group
executives and managers down by a total of Euro 733 thousand;
The reserve for future capital increases to service the Warrants assigned free of charge to certain
managers employed by the subsidiary Dixon Ticonderoga Company (formerly Pacon Holding
Company), as approved on October 11, 2018 by F.I.L.A. S.p.A.’s shareholders in an
Euro
thousandEquity items December 31, 2020 Possibility of use Available portion to cover losses other reasons
Share Capital 46,967
Reserves
Legal Reserve 8,332 B 8,332
Share Premium Reserve 154,473 A, B, C 154,473
IAS 19 Reserve (594) -20.912
Other Reserves 18,839 A, B, C 18,839
Profit for the year 41,855 A, B, C 26,803 11,577
269,991 208,566 - 11,577
Summary of the use in the past three years
(2018 - 2020)
NOTE 12.A ORIGIN, POSSIBILITY OF USE AND DISTRIBUTION OF THE EQUITY

F.I.L.A. Group
219
extraordinary meeting, decreased of Euro 956 thousand against the subscription of a portion of
the Warrants; the present amount is therefore Euro 191 thousand;
The “Hedging” reserve, recognised to account for fair value changes in the hedging instruments
(IRSs) entered into by F.I.L.A. S.p.A., amounted to a negative Euro 4,180 thousand at
December 31, 2020. The decrease for the year amounted to Euro 383 thousand against the
recognition of the change in the fair value of the IRSs hedging the loan agreement entered into
to finance the Pacon Holding Company deal.
In relation to utilisations, in addition, we report the presence in other reserves of reserves
taxable on distribution for Euro 3,885 thousand at December 31, 2020.
Retained Earnings
They amount to Euro 41,855 thousand at December 31, 2020 (Euro 31,099 thousand at December 31,
2019). The increase of Euro 10,756 thousand relates to the application of the shareholders’ resolution
of April 22, 2020 concerning the allocation of the 2019 net profit of Euro 11,322 thousand to “Retained
earnings” for Euro 10,756 thousand, net of the allocation to the legal reserve for Euro 566 thousand.
We highlight in addition the restriction on the distribution of a portion related to the revaluation of the
investment held in the company DOMS Industries Pvt Ltd (Euro 15,052 thousand), in accordance with
Article 6, paragraph 1, letter a) of Legislative Decree No. 38 of February 28, 2005, following the
purchase of the controlling interest.
Dividends
During the reporting year, F.I.L.A. S.p.A. did not carry out the usual distribution of dividends to the
Shareholders.
F.I.L.A. S.p.A. expects to receive approx. Euro 16 million from subsidiaries in 2021.
Over the last three years and in its forecasts, the F.I.L.A. Group coordinates its dividend policy in line
with the financial needs of its non-recurring transactions.
………………….
The Board of Directors of F.I.L.A. S.p.A. have proposed:
1. to allocate Euro 406,267.34 to the legal reserve, as established in Article 2430 of the Italian
Civil Code, and to allocate the remainder of Euro 1,594,273.68 to retained earnings;

F.I.L.A. Group
220
2. to distribute the residual “Profit for the year” of Euro 6,124,805.76 as dividend and, therefore,
to distribute a dividend of Euro 0.12 for each of the 51,040,048 ordinary shares currently
outstanding, while it should be noted that in the case where the total number of shares of the
Company currently in circulation should increase, the total amount of dividend will remain
unchanged and the unit amount will be automatically adjusted to the new number of shares; the
dividend will be issued with coupon, record and payment dates of May 24, 25 and 26, 2021
respectively.

F.I.L.A. Group
221
Note 13 - Financial Liabilities
The balance at December 31, 2020 was Euro 247,651 thousand (Euro 192,187 thousand at December
31, 2019).
The breakdown at December 31, 2020 is illustrated below:
Bank loans and borrowings
With reference to “Bank loans and borrowings”, the total exposure of the Group amounts to Euro
245,335 thousand, of which Euro 44,546 thousand considered as current (Euro 9,763 thousand at
December 31, 2019) and Euro 200,789 thousand as non-current (Euro 175,532 thousand at December
31, 2019).
The increase in the non-current portion of Euro 25,255 thousand mainly concerns:
Increases of Euro 69,330 thousand following the signing of two new loans, the first of which
with Cassa Depositi e Prestiti for Euro 30,000 thousand and the second with the same banking
syndicate as used for the structured loan for the purchase of the Pacon Group totalling Euro
40,000 thousand, of which Euro 670 thousand already recognised as short-term as paid during
the year and used for the acquisition of the Arches brand products business. Euro 25,000
thousand obtained from the drawdown of the Revolving Credit Facility already in place;
Decreases in the short-term portion of loans totalling Euro 44,062 thousand, of which Euro
30,000 thousand, relating to the new loan taken out with Cassa Depositi e Prestiti to be repaid
in full in November 2021 and Euro 14,062 thousand relating to structured loans;
Decreases for new interest measured at amortised cost of Euro 12 thousand due to the effect of
an increase of Euro 438 thousand stemming from the new loan undertaken for the acquisition
of the Arches brand products business and a decrease of Euro 426 thousand due to release.
“– Bank loans and borrowings – Non-current portion” of Euro 203,006 thousand include:
Euro thousands Principal Interest Principal Interest Principal Interest Principal Interest
December 31, 2019 187,438 (2,142) 1.782 - 3,000 20 2,090 - 192,187
non-current portion 178,063 (2,531) - - - - 1,685 - 177,218
current portion 9,375 388 1,782 - 3,000 - 404 - 14,969
December 31, 2020 247,068 (1,733) 502 - - 1 1.813 - 247,651
non-current portion 203,006 (2,217) - - - - 1,356 - 202,145
current portion 44,062 484 502 - - 1 457 - 45,507
Change 2020-2019 59,630 409 (1,279) - (3.000) (19) (277) - 55,464
non-current portion 24,942 313 - - - - (329) - 24,927
current portion 34,687 96 (1,279) - (3.000) (19) 52 - 30,537
Note 13.A - FINANCIAL LIABILITIES
Banks loansOther loans and borrowings
Third PartiesCurrent account Overdrafts
TotalIFRS 16

F.I.L.A. Group
222
the non-current portion of Facility A and A2 for Euro 52,500 thousand (amortising line);
the non-current portion of Facility B and B2 for Euro 98,750 thousand (bullet line);
the non-current portion of Facility C for Euro 25,893 thousand (bullet line);
the non-current portion of the RCF Facility for Euro 25,000 thousand (bullet line);
the fair value of the negotiation charges related to the derivative financial instruments of Euro
863 thousand undertaken in 2018.
“ Bank loans and borrowings – Current portion” amounted to Euro 44,062 thousand, broken down as
follows:
the current portion of Facility A1 and A2 for Euro 14,062 thousand (amortising line);
the loan granted by Cassa Depositi e Prestiti, which provides for bullet repayment in November
2021, amounting to Euro 30,000 thousand.
The portion of the Facility A and A2 credit lines amounting to Euro 10,044 thousand was repaid in June
and December 2020 per the repayment plan.
The loan stipulates a Euribor at 3 months interest rate, plus a spread of 1.85% on Facility A and A2, in
addition to a spread of 2.15% on Facility B and C, with quarterly calculation of interest. The spread
applied, which by contract was to be subject to changes based on compliance with the covenants
established for the loan, was not revised during the year, since the parties negotiated that the benchmarks
would remain unchanged from the December 2019 versions.
The following is reported with regards to the loan repayment plan:

F.I.L.A. Group
223
The repayment plan establishes for settlement by June 4, 2024 (“Termination Date”) through half-yearly
capital instalments to be repaid from December 4, 2019.
Euro thousandsInterest Rate Maturity
December 31,
2020
Facility A-A2 Euribor 3 months + spread 1.85% June 2023 52,500
Facility B-B2 Euribor 3 months + spread 2.15% June 2024 98,750
Facility C-C2 Euribor 3 months + spread 2.15% June 2023 25,893
RCF Fixed rate 1.85% June 2023 25,000
Total non-current Financial liabilities 202,143
Facility A Euribor 3 months + spread 1.85% 2021 14,062
Total current Financial liabilities 14,062
Total Financial liabilities 216,205
Note 13.B - BANK LOANS AND BORROWINGS INTEREST RATE AND MATURITY

F.I.L.A. Group
224
The repayment plan by maturity is outlined below:
F.I.L.A. S.p.A., exposed to future cash flow fluctuations in relation to the interest rate indexing
mechanism under the loan agreed (hereafter “hedged instrument”), considered a hedge based on the
payment of a fixed rate against the variable rate necessary (base parameter of the loan contract) to
stabilise future cash flows.
The derivative instruments, qualifying as hedges and represented by Interest Rate Swaps, present
characteristics in line with those of the hedged instrument, such as the same maturity and the same
repayment plan broken down into quarterly instalments with interest in arrears, in addition to a variable
interest rate indexed to the Euribor at 3 months. Derivative financial instruments, in the form of 3
Euro thousandsFacility Principal
June 4, 2021 Facility A 5,625
December 6, 2021 Facility A 7,500
June 6, 2022 Facility A 7,500
December 5, 2022 Facility A 11,250
June 2, 2023 Facility A 30,000
Total - Facility A 61,875
June 4, 2021 Facility A2 402
December 6, 2021 Facility A2 536
June 6, 2022 Facility A2 536
December 5, 2022 Facility A2 803
June 2, 2023 Facility A2 2,410
Total - Facility A2 4,687
Bullet Loan - June 4, 2024 Facility B 90,000
Total - Facility B 90,000
Bullet Loan - June 4, 2024 Facility B2 8,750
Total - Facility B2 8,750
Bullet Loan - June 4, 2023 Facility C 25,000
Total - Facility C 25,000
Bullet Loan - June 4, 2023 Facility C2 893
Total - Facility C2 893
Bullet Loan - June 4, 2023 RCF 25,000
Total - RCF 25,000
TOTAL 216,205
Note 13.C - BANK LOANS AND BORROWINGS: LOAN REPAYMENT PLAN

F.I.L.A. Group
225
Interest Rate Swaps, were agreed with the same banks issuing the loan, concerning a total of 10
contracts.
“Financial Liabilities - Other Loans and borrowingd” include the payables of F.I.L.A. S.p.A. to
factoring companies for advances on transfer of receivables (Ifitalia S.p.A.) and the amount of the
financial payables that arose from the lease contracts due to the application of IFRS 16.
The balance at December 31, 2020 of other loans and borrowings was Euro 2,315 thousand (Euro 3,871
thousand at December 31, 2019). uniformare maiuscole e minuscole
Details on the timing of cash flows and other loans and borrowings at December 31, 2020 concerning
F.I.L.A. S.p.A. are illustrated in the following table:
“Current account Overdrafts” at December 31, 2020 amounted to Euro 1 thousand, inclusive of unpaid
interest accrued.
Reference should be made to “Note 10 - Net Financial Debt” and the “Directors’ Report – Financial
Highlights of the F.I.L.A. Group – Financial Debt” in relation to the net financial debt at December 31,
2020.
Loan Repayment
plan
Current Financial
Liabilities
Euro thousands Principal Interest Variable Spread 2021
Ifitalia S.p.A. 502 - 502 2020 EUR Italy 0.75% - 502 - None
Leasing 1,813 - 1,813 2020 EUR Italy - - 457 1,356 None
Total 2,315 - 2,315 959 1,356
Note 13.D - OTHER LOANS AND BORROWINGS
Description
General information
Guarantees
GrantedAmount Total Year Curr. Country
InterestBeyond 2021

F.I.L.A. Group
226
As per IFRS 7, the accounting treatment by class of financial liabilities at December 31, 2020 was as
follows:
In accordance with the latest amendments to IAS 7, the following table shows the changes in liabilities
(and any related assets) recognised in the statement of financial position, whose cash flows are or will
be recognised in the statement of cash flows as cash flows from financing activities.
December 31,
2020
Assets and
liabilities at
FVOCI
Amortised Cost Total
Non-Current liabilities
Non-Current financial liabilities Note 13 202,144 - 202,144 202,144
Financial Instruments Note 17 4,183 4,183 4,183
Current liabilities
Current financial liabilities Note 13 45,507 - 45,507 45,507
Other financial liabilities Note 19 19,033 - 19,033 19,033
December 31,
2019
Assets and
liabilities at
FVOCI
Amortised Cost Total
Non-Current liabilities
Non-Current financial liabilities Note 13 175,532 - 175,532 175,532
Financial Instruments Note 17 3,797 3,797 3,797
Current liabilities
Current financial liabilities Note 13 16,654 - 16,654 16,654
Other financial liabilities Note 19 19,768 - 19,768 19,768
Euro thousands
Bank Loans
and borrowing
Other Loans
and borrowing
Current
account
Overdrafts
Hedging
DerivativesTotal
Note 13 Note 13 Note 13 Note 13
December 31, 2019 (185,296) (1.782) (3,020) (3,797) (190,875)
Cash Flows (59,614) 1,280 3,019 - (55,315)
Other changes: (425) - - - (425)
Exchange gains (losses) - - - - -
Fair Value variations - - - (386) -
Consolidation scope changes - - - - -
December 31, 2020 (245,335) (502) (1) (4,183) (250,020)

F.I.L.A. Group
227
Note 14 - Employee Benefits
The benefits recognised to employees of F.I.L.A. S.p.A. concern salary based Post-Employment
Benefits, governed by Italian legislation and in particular Article 2120 of the Italian Civil Code. The
amount of these benefits is in line with the contractually-established remuneration agreed between the
parties on hiring.
The Post-Employment Benefits, accrued to December 31, 2006 are considered a defined benefit plan
as per IAS 19. The benefits guaranteed to employees, under the form of the Post-Employment Benefits,
paid on the termination of employment, are recognised in the period the right vests. The relative liability
is based on actuarial assumptions and the effective liability accrued and not settled at the reporting date.
The discounting process, based on demographic and financial assumptions, is undertaken applying the
“Projected Unit Credit Method” by professional actuaries.
The Post-Employment Benefits accrued since January 1, 2007 are considered a defined contribution
plan and therefore contributions accrued in the period were fully recognised as a cost and recognised as
a liability under “Other Current Liabilities”, after the deduction of any contributions already paid.
The amounts at December 31, 2020 were as follows:
The actuarial revaluation recognised in 2020 amounts to Euro 42 thousand. The actuarial changes of
the year, net of the tax effect, were taken directly to equity.
There are no financial assets at December 31, 2020 invested by F.I.L.A. S.p.A. to cover financial
liabilities relating to Post-Employment Benefits.
Euro thousands
December 31, 2019 1,700
Disbursements (709)
Financial Expense 6
Pension Cost for Service 598
IAS 19 Reserve 48
December 31, 2020 1,643
Change 2020 - 2019 (57)
Note 14.A - POST-EMPLOYMENT BENEFITS
Euro thousands
December 31, 2019 1,700
Disbursements (709)
Financial Expense 6
Pension Cost for Service 598
IAS 19 Reserve 48
December 31, 2020 1,643
Change 2020 - 2019 (57)
Note 14.A - POST-EMPLOYMENT BENEFITS

F.I.L.A. Group
228
The table below highlights the net cost recognised in 2020 and 2019:
The obligations deriving from the above-mentioned plans are calculated based on the following
actuarial assumptions.
For comparative purposes we illustrate the actuarial assumptions applied in 2020.
Details on the timing of financial cash flows relating to post-employment benefits at December 31,
2020 are illustrated in the following table:
Note 15 - Provisions for risks and charges
“Provisions for Risks and Charges” amount to Euro 704 thousand in 2020 and increased by Euro 15
thousand on the previous year.
2. Cost Recognised in Profit or Loss December 31, 2020 December 31, 2019
Pension Cost for Service (598) (608)
Financial Expense (6) (17)
Cost Recognised in Profit or Loss (604) (625)
3. Main Actuarial Assumptions at Reporting Date (average values) December 31, 2020 December 31, 2019
Annual Technical Discounting Rate 0.0% 0.4%
Increase in Cost of Living index 1.0% 1.0%
Future Increase in Pensions 2.3% 2.3%
Euro thousands
Post-Employment Benefits 1,643 125 138 140 97 1,143
Total 1,643
Note 14.B - POST-EMPLOYMENT BENEFITS: TIMING OF CASH FLOWS
NatureAmount
Timing of cash flows
2021 2022 2023 2024Beyond
2024
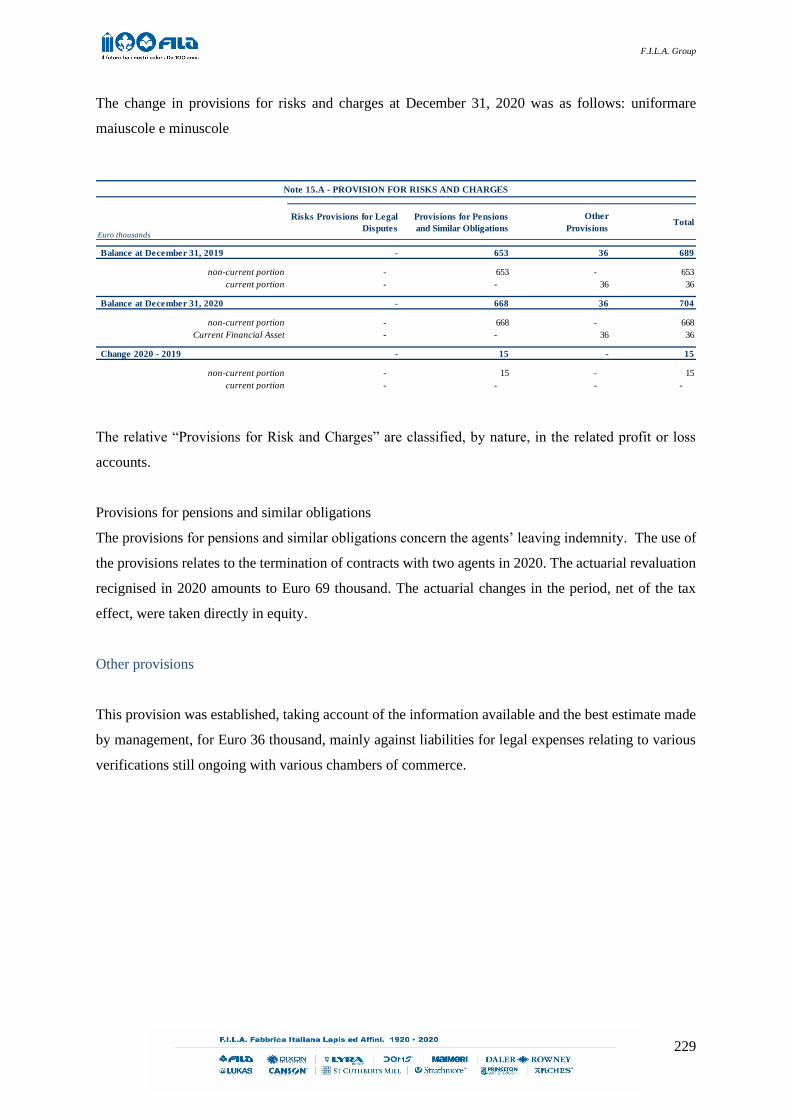
F.I.L.A. Group
229
The change in provisions for risks and charges at December 31, 2020 was as follows: uniformare
maiuscole e minuscole
The relative “Provisions for Risk and Charges” are classified, by nature, in the related profit or loss
accounts.
Provisions for pensions and similar obligations
The provisions for pensions and similar obligations concern the agents’ leaving indemnity. The use of
the provisions relates to the termination of contracts with two agents in 2020. The actuarial revaluation
recignised in 2020 amounts to Euro 69 thousand. The actuarial changes in the period, net of the tax
effect, were taken directly in equity.
Other provisions
This provision was established, taking account of the information available and the best estimate made
by management, for Euro 36 thousand, mainly against liabilities for legal expenses relating to various
verifications still ongoing with various chambers of commerce.
Euro thousands
Risks Provisions for Legal
Disputes
Provisions for Pensions
and Similar Obligations
Other
ProvisionsTotal
Balance at December 31, 2019 - 653 36 689
non-current portion - 653 - 653
current portion - - 36 36
Balance at December 31, 2020 - 668 36 704
non-current portion - 668 - 668
Current Financial Asset - - 36 36
Change 2020 - 2019 - 15 - 15
non-current portion - 15 - 15
current portion - - - -
Note 15.A - PROVISION FOR RISKS AND CHARGES

F.I.L.A. Group
230
Details on the timing of cash flows relating to provisions at December 31, 2020 are illustrated in the
following table:
Note 16 - Deferred Tax Liabilities
“Deferred Tax Liabilities” amount to Euro 961 thousand December 31, 2020 (Euro 1,336 thousand at
December 31, 2019).
The nature of the deferred tax liabilities and the relative effects on the Statement of Financial Position,
Profit or loss and Equity are illustrated in the table below.
In 2020 deferred tax liabilities were taken directly to profit or loss for Euro 339 thousand (decrease)
Provisions for Tax Disputes
Assessment Year 2004 84 - - - - 84
Provisions for Pensions and similar obligations
Agents’ Leaving Indemnity 668 668 0.34% - - 668
Other Provisions
Other Provisions for Risks and Charges 36 36 - - - 36
Total 788 704 - - 788
Euro thousands
Note 15.C - PROVISIONS FOR RISKS AND CHARGES: TIMING OF CASH FLOWS
Nature Amoun
t
Actuarial Value
Year 2020
Discount Rate Applied for
Actuarial Value
Timing of cash flows
2021 2022Beyond
2022
Euro thousands
December 31, 2019 (1,336)
Utilisations (47)
Decrease recognised in Equity 390
December 31, 2020 (961)
Change 375
Note 16.A CHANGES IN DEFERRED TAX LIABILITIES
Euro thousands2020 2019 2020 2019 2020 2019
Deferred tax liabilities relating to:
Intangible Assets (8) (8) - - - -
Property, Plant and Equipment 1,004 1.055 (51) (95) - -
Personnel - IAS 19 (72) (37) - - (35) (35)
Dividends - 289 (289) - - -
Other 37 37 - - - -
Total deferred tax liabilities 961 1,336 (339) (95) (35) (35)
Statement of Financial Position Profit or loss Equity
NOTE 16.B - BREAKDOWN OF DEFERRED TAX LIABILITIES

F.I.L.A. Group
231
and to equity for Euro 35 thousand (decrease). The deferred tax liabilities recognised directly in Equity
relate to “Actuarial Gains/Losses” on the Post-Employment Benefit Provision.
“Deferred Tax Liabilities” on “Property, Plant and Equipment” mainly relate to the application of
international accounting standard IFRS 16 (Leases) to the production plant at Rufina Scopeti (Florence,
Italy); the temporary differences refer to the difference between the lease payments deducted until the
redemption date and the net carrying amount of the assets.
In 2020 there was an increase in the percentage of IRAP taxable income due to application of the
regulations relating to Article 162-bis, whereby F.I.LA.was classified as an "Industrial Holding
Company", rising from 3.9% to 5.57%. The new rate was therefore applied to the identifiable accounts.
Note 17 - Financial instruments
“Financial Instruments” amounted to Euro 4,183 thousand, including the fair value of trading costs,
expressed in terms of the discounted future cash flows at December 31, 2020, applied on inception by
the banks, related to the elimination of the zero floor on the hedged instrument. The accounting
treatment adopted for the hedging instruments centres on hedge accounting and in particular that
concerning “cash flow hedges” and involving the recognition of a financial asset or liability and an
equity reserve with reference to pure cash flows which establishes the efficacy of the hedge (reference
should be made to “Note 12 - Share Capital and Equity”), while the negotiating charges incurred against
the contractual amendment to the hedged instrument (elimination of the floor to zero) were subject to
amortised cost and bank financial liabilities, with subsequent reversal to profit or loss of the amount
pertaining to each year until conclusion of the contract.
In addition, Euro 17 thousand was recognised in relation to an interest rate hedging transaction on an
intercompany loan in Russian roubles. The value refers to the MTM at December 31, 2020.
We break down below by bank the notionals subject to hedging under derivative instruments, the
relative fair values, in addition to the relative contractual conditions:
Intesa Sanpaolo S.p.A. Banco BPMMediobanca Banca di
Credito FinanziarioUnicredit S.p.A.
Euro thousands
IRS Date agreed Loan % Hedge Fixed Rate Variable rate Notional Notional Notional Notional Total
IRS 1 2018/29/06 TLA F.I.L.A. S.p.A. 100.00% 0.30% -0.316% 8,250,000 27,750,000 19,500,000 19,500,000 75,000,000
IRS 2 2018/29/06 TLB F.I.L.A. S.p.A. 100.00% 0.54% -0.316% - 43,200,000 23,400,000 23,400,000 90,000,000
IRS 3 2018/29/06 TLC F.I.L.A. S.p.A. 20.00% 0.40% -0.316% - 12,000,000 6,500,000 6,500,00 25,000,000
8,250,000 82,950,000 49,400,000 49,400,000 190,000,000
Note 17 - FINANCIAL INSTRUMENTS

F.I.L.A. Group
232
Financial liabilities are initially recognised at fair value, including directly attributable transaction costs.
The initial carrying amount is subsequently adjusted to account for payments of principal and interest
calculated under the effective interest rate method represented by the rate that at the moment of initial
recognition renders the present value of expected cash flows equal to the initial carrying amount
(amortised cost method) and the interest paid.
Nota 18 - Current Tax Liabilities
“Current tax payables” amount to Euro 323 thousand at December 31, 2020 (Euro 725 thousand at
December 31, 2019) and includes the tax charge of Article 167 of Presidential Decree 917/1986
concerning “Controlled Foreign Companies”.
An analysis was conducted on the foreign subsidiaries in order to establish whether concerning parties
qualify as “Controlled Foreign Companies”. For these companies, the national tax charge borne by
F.I.L.A. S.p.A. was calculated in relation to the income earned by them abroad (Euro 122 thousand).
Note 19 - Trade payables and other liabilities
The breakdown of “Trade payables and other liabilities” of F.I.L.A. S.p.A. is reported below:
“Trade payables and other liabilities” at December 31, 2020 amount to Euro 19,033 thousand (Euro
19,768 thousand at December 31, 2019).
Trade receivables third parties amount to Euro 12,807 thousand at December 31, 2020 (Euro 14,200
thousand at December 31, 2019) and were down, largely due to the decline in purchases.
Euro thousands
December 31,
2020
December 31,
2019Change
Trade payables 12,807 14,200 (1,393)
Tax Liabilities 1,161 1,172 (11)
Other Liabilities 2,743 2,430 313
Accrued expenses and deferred income 2 4 (2)
Third parties 16,713 17,806 (1,093)
Trade payables - Subsidiaries 2,035 1,724 311
Accrued expenses and deferred income 285 239 46
Subsidiaries 2,320 1,963 357
Total 19,033 19,768 (736)
Note 19.A - TRADE PAYABLES AND OTHER LIABILITIES
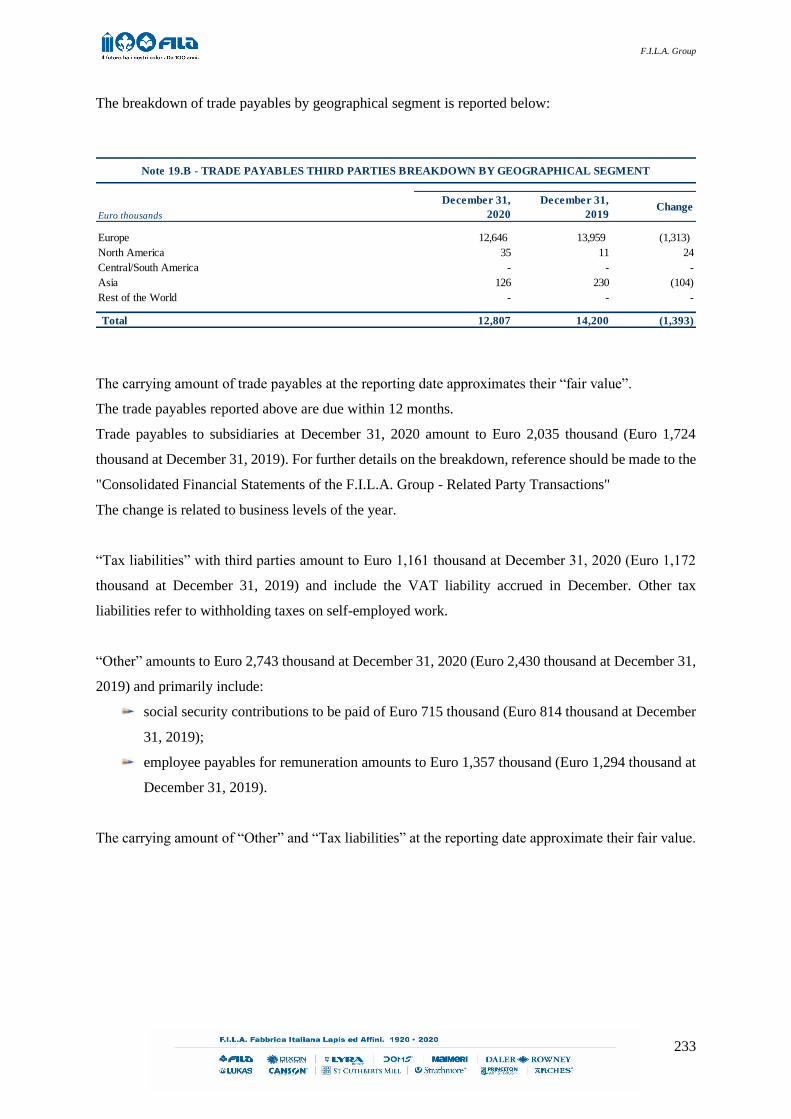
F.I.L.A. Group
233
The breakdown of trade payables by geographical segment is reported below:
The carrying amount of trade payables at the reporting date approximates their “fair value”.
The trade payables reported above are due within 12 months.
Trade payables to subsidiaries at December 31, 2020 amount to Euro 2,035 thousand (Euro 1,724
thousand at December 31, 2019). For further details on the breakdown, reference should be made to the
"Consolidated Financial Statements of the F.I.L.A. Group - Related Party Transactions"
The change is related to business levels of the year.
“Tax liabilities” with third parties amount to Euro 1,161 thousand at December 31, 2020 (Euro 1,172
thousand at December 31, 2019) and include the VAT liability accrued in December. Other tax
liabilities refer to withholding taxes on self-employed work.
“Other” amounts to Euro 2,743 thousand at December 31, 2020 (Euro 2,430 thousand at December 31,
2019) and primarily include:
social security contributions to be paid of Euro 715 thousand (Euro 814 thousand at December
31, 2019);
employee payables for remuneration amounts to Euro 1,357 thousand (Euro 1,294 thousand at
December 31, 2019).
The carrying amount of “Other” and “Tax liabilities” at the reporting date approximate their fair value.
Euro thousands
December 31,
2020
December 31,
2019Change
Europe 12,646 13,959 (1,313)
North America 35 11 24
Central/South America - - -
Asia 126 230 (104)
Rest of the World - - -
Total 12,807 14,200 (1,393)
Note 19.B - TRADE PAYABLES THIRD PARTIES BREAKDOWN BY GEOGRAPHICAL SEGMENT

F.I.L.A. Group
234
Note 20 – Revenue from Sales and Services
Revenue from sales and services in 2020 amounted to Euro 70,776 thousand (Euro 74,884 thousand in
2019).
Revenue from Sales and Services was broken down as follows:
“Revenue from Sales and Services” of Euro 70,776 thousand decreased by Euro 4,108 thousand on the
previous year, mainly due to the decline in consumption, owing in particular to the school closure due
to the COVID-19 pandemic.
“Adjustments to Sales” (Euro 9,315 thousand) mainly includes:
Bonuses to customers of Euro 4,885 thousand, down on the previous year (Euro 5,413
thousand);
Variable promotional contributions of Euro 3,516 thousand, up on the previous year (Euro
3,373 thousand);
Corrections and returns of sales of Euro 914 thousand, up on the previous year (Euro 771
thousand).
The following table illustrates the breakdown of revenue by geographical location, based on the location
of the customers to whom the revenues relate:
Euro thousandsDecember 31, 2020 December 31, 2019 Change
Revenue from Sales and Services 80,091 84,442 (4,351)
Adjustments to Sales (9,315) (9,558) 243
Returns on Sales (4,470) (4,145) (325)
Discounts, Allowances and bonuses (4,845) (5,413) 568
Total 70,776 74,884 (4,108)
Note 20.A - REVENUE FROM SALES AND SERVICES
Euro thousandsDecember 31, 2020 December 31, 2019 Change
Europe 70,012 74,244 (4.232)
North America - 142 (142)
Central/South America 679 - 679
Rest of the World 85 498 (413)
Total 70,776 74,884 (4,108)
Note 20.B -REVENUE FROM SALES AND SERVICES BY GEOGRAPHICAL AREA

F.I.L.A. Group
235
The following table illustrates the breakdown of revenue by strategic business area:
Note 21 – Other revenue and income
This caption includes other income relates to ordinary operations and does not include the sale of goods
and provision of services.
“Income” in 2020 amounted to Euro 9,226 thousand (Euro 6,769 thousand in 2019).
“Other revenue and income” (Euro 8,924 thousand) mainly includes:
recharges for services and consultancy provided by F.I.L.A. S.p.A., mainly in favour of Canson
SAS (France - Euro 503 thousand), Canson Italy S.r.l. (Italy - Euro 200 thousand), Dixon
Ticonderoga Company (U.S.A. - Euro 269 thousand), Canson Art & Craft Yixing Co., Ltd
(China - Euro 9 thousand), Daler Rowney Ltd. (United Kingdom - Euro 123 thousand), Grupo
F.I.L.A.-Dixon, S.A. de C.V. (Mexico - Euro 59 thousand), Industria Maimeri S.p.A. (Italy -
Euro 125 thousand), Fila Dixon Stationery (Kunshan) Co, Ltd. (China - Euro 44 thousand),
Lyra KG (Germany - Euro 94 thousand), DOMS Industries Pvt Ltd (India - Euro 23 thousand),
F.I.L.A. Iberia S.L. (Spain - Euro 44 thousand), Fila Benelux (Belgium - Euro 29 thousand),
Fila Nordic AB (Scandinavia - Euro 3 thousand), PT Lyra Arkelux (Indonesia - Euro 1
thousand), Fila Hellas (Greece - Euro 3 thousand), Fila SA (South Africa - Euro 3 thousand),
St. Cuthberts Mill (United Kingdom - Euro 7 thousand), Canson Brasil I.P.E. LTDA (Brazil -
Euro 3 thousand), Fila Arches (France – Euro 37 thousand), Canson Australia (Australia – Euro
Euro thousands
December 31,
2020
December 31,
2019Change
Fine Art, Hobby & Digital 443 599 (156)
Industrial 19 18 1
School & Office 70,314 74,267 (3,953)
Total 70,776 74,884 (4,108)
Euro thousands
December 31,
2020
December 31,
2019Change
Gains on Sale of Property, Plant and Equipment 1 5 (4)
Unrealised Exchange Gains on Commercial Transactions 23 14 9
Realised Exchange Gains on Commercial Transactions 278 110 168
Other 8,924 6,641 2,283
Total 9,226 6,769 2,457
Note 21 – OTHER REVENUE AND INCOME

F.I.L.A. Group
236
2 thousand), Fila Chile LTDA (Chile – Euro 2 thousand), Fila Art & Craft Ltd (Israel – Euro 2
thousand) and Dixon Ticonderoga Art ULC (Canada – Euro 7 thousand);
recharges for costs incurred by F.I.L.A. S.p.A. against Group insurance coverage principally
related to the companies Canson SAS (France - Euro 234 thousand), Daler Rowney Ltd. (United
Kingdom - Euro 86 thousand), Lyra KG (Germany - Euro 40 thousand), F.I.L.A. Iberia S.L.
(Spain - Euro 18 thousand) , Dixon Ticonderoga Company (U.S.A. - Euro 17 thousand) and St.
Cuthberts (United Kingdom - Euro 29 thousand), Industria Maimeri S.p.A. (Italy - Euro 15
thousand) and Fila Arches (France - Euro 21 thousand);
recharges of costs incurred by F.I.L.A. S.p.A. related to the ERP roll out at the F.I.L.A. Group,
principally related to Dixon Ticonderoga Company (U.S.A. – Euro 2,762 thousand), Canson
Qingdao Ltd (China - Euro 123 thousand), Lyra KG (Germany - Euro 411 thousand), Canson
Australia PTY Ltd. (Australia - Euro 53 thousand), Industria Maimeri S.p.A. (Italy - Euro 277
thousand), F.I.L.A. Iberia S.L. (Spain - Euro 148 thousand), Canson SAS (France - Euro 1,148
thousand), Daler Rowney Ltd. (United Kingdom - Euro 147 thousand), and Fila Benelux
(France - Euro 63 thousand);
recharging of M&A and financing costs to Fila Arches SAS (France - Euro 1,298 thousand)
relating to the acquisition of the Arches business unit from the Swedish group Ahlstrom-
Munksjo.

F.I.L.A. Group
237
Note 22 - Costs for Raw Materials, Consumables, supplies and Goods
This caption includes all purchases of raw materials, semi-finished products, transport for purchases,
goods and consumables for operating activities.
The relative detail is shown below:
“Costs for Raw Materials, Consumables, supplies and Goods” includes purchases for production and
the provision of adequate inventory for future sales.
“Other Purchase Costs” include all accessory charges, such as outsourcing and consortium fees.
“Raw Materials, Semi-Finished, Work in Progress and Goods” at 2020 decreased by Euro 1,089
thousand (increase of Euro 3,935 thousand in 2019), due to:
decrease in “Raw Materials, Consumables, supplies and Goods” for Euro 172 thousand;
increase in “Contract Work in Progress and Semi-Finished products” of Euro 92 thousand;
decrease in “Finished Goods” of Euro 1,009 thousand.
Euro thousandsDecember 31, 2020 December 31, 2019 Change
Raw materials, Consumables, Supplies and Goods (30,773) (30,292) (481)
Transport costs (1,282) (1,223) (59)
Packaging (180) (294) 114
Other purchase costs (2,301) (2,793) 492
Total (34,534) (34,600) 66
Note 22 - COSTS FOR RAW MATERIALS, CONSUMABLES, SUPPLIES AND GOODS

F.I.L.A. Group
238
Note 23 - Services and Use of Third-Party Assets
“Services and Use of Third-Party Assets” amounted to Euro 20,817 thousand in 2020 (Euro 19,534
thousand in 2019).
Services are broken down below:
The increase in services and use of third party assets primarily relates to consulting (Euro 2,359
thousand). In 2020 non-recurring costs were recognised on the acquisition of the Arches brand products
business from the Swedish Ahlstrom-Munksjo Group. These costs refer to the services rendered by
consultants in connection with the acquisition. Part of this amount was recharged to Fila Arches SAS
(France), as reported in Note 21 - Other Revenue and Income.
“Maintenance” mainly refers to software maintenance relating to the SAP project of Euro 1,837
thousand.
These maintenance costs are partly charged to Group companies on the basis of specific KPIs and
contracts.
"Directors' and Statutory Auditors' fees" include the portion of the Shared-Bases Premium relating to
Euro thousandsDecember 31, 2020 December 31, 2019 Change
Sundry services (537) (596) 59
Transport (3,172) (3,678) 506
Maintenance (2,463) (1,990) (473)
Utilities (1,058) (1,136) 78
Consulting fees (5,057) (2,698) (2,359)
Directors' and Statutory Auditors Fees (2,972) (2,936) (36)
Advertising, Promotions, Shows and Fairs (1,509) (1,393) (116)
Cleaning costs (107) (53) (54)
Bank Charges (468) (399) (69)
Agents (1,658) (1,832) 174
Sales Representatives (108) (697) 589
Sales Commissions (391) (691) 300
Insurance (697) (605) (92)
Other Service Costs (179) (202) 23
Rent (241) (325) 84
Royalties and Patents (200) (303) 103
Total (20,817) (19,534) (1,283)
Note 23 - SERVICE COSTS AND USE OF THIRD PARTY ASSETS

F.I.L.A. Group
239
directors recognized in view of the new 2019-2021 Shared-Bases Premium and includes the payment
of an extraordinary bonus paid in 2020 in relation to the acquisition of Fila Arches for Euro 500
thousand.
“Agents” decreased due to the reduction in sales and the related decrease in related fees for Euro 174
thousand.
“Advertising, Promotions, Shows and Fairs” increased by Euro 116 thousand on December 31, 2019,
relating to activities to commemorate the “1920-2020” F.I.L.A. centennial.
“Sales representatives” decreased by Euro 589 thousand, mainly due to the COVID-19 pandemic.
“Sales Commissions” decreased by Euro 300 thousand due to the failure to carry out the COVID-19
bonus trip linked to customer sales results.
“Royalties and patents" decreased by Euro 103 thousand due to the termination of the contract with
Disney. This contract governed the exploitation of the image of the American Group's characters in the
context of sales of F.I.L.A. S.p.A. products.
Note 24 – Other Costs
“Other Costs” in 2020 totalled Euro 554 thousand (Euro 438 thousand in 2019).
“Other Operating Charges” include residual costs such as municipal property tax (IMU - Euro 76
thousand).
Euro thousands
December 31,
2020
December 31,
2019Change
Unrealised Exchange Losses on Commercial Transactions (52) (15) (37)
Realised Exchange Losses on Commercial Transactions (205) (111) (94)
Other (297) (312) 15
Total (554) (438) (116)
Note 24 – OTHER COSTS

F.I.L.A. Group
240
Note 25 – Personnel Expense
“Personnel Expense” includes all costs and expenses incurred for employees.
These costs are broken down as follows:
The change was mainly due to the specific measures taken by management to contain personnel
expense, through the use of accrued vacation and the downsizing of the workforce, mainly of temporary
workers, where possible.
From March 23, 2020 and for 9 weeks, the Company used a form of the COVID-19 Extraordinary
Temporary Furlough that involved 203 workers, 64 of whom at the production site in Pero and 139 of
whom at the production site in Rufina. This agreement was renewed from October 26, 2020 with
conclusion on December 26, 2020 and involved 188 workers, of whom 64 at the Pero site and 124 at
the Rufina site. Other personnel expenses also include the costs related to the “2019-2021 Performance
Shares Plan” concerning ordinary F.I.L.A. S.p.A. shares reserved for Group executives and managers.
During the year the targets set were revised and the portion for the year was recognised, resulting in a
lower cost of Euro 204 thousand.
Euro thousandsDecember 31, 2020 December 31, 2019 Change
Wages and Salaries (8,102) (8,320) 218
Social Security Charges (2,640) (2,750) 110
Post-employment benefits (598) (608) 10
Other 53 (37) 90
Total (11,287) (11,715) 428
Note 25.A - PERSONNEL EXPENSES

F.I.L.A. Group
241
At December 31, 2020, the workforce of F.I.L.A. S.p.A. was as follows:
The 2020 turnover is related to the current production decline due to the current COVID-19 health
emergency.
Note 26 – Amortisation and Depreciation
Amortisation and depreciation in 2020 and 2019 are reported below:
For further details, reference should be made to “Note 1 – Intangible Assets” and “Note 2 – Property,
Plant and Equipment”.
No impairment losses were recognised in the year.
Managers White-collars Blue-collarsTotal Amount
Total at December 31, 2019 11 88 109 208
Increases 2 2 17 21
Decreases - (3) (25) (28)
Total at December 31, 2020 13 87 101 201
2020 Average headcount 12 88 103 203
Note 25.B - PERSONNEL
Euro thousandsDecember 31, 2020 December 31, 2019 Change
Depreciation (1,515) (1,504) (11)
Amortisation (3,277) (2,947) (330)
Depreciation of Right-of-Use Assets (534) (474) (60)
Total (5,326) (4,925) (401)
Note 26 – AMORTISATION AND DEPRECIATION

F.I.L.A. Group
242
Note 27 – Net Impairment Gains (Losses) on Trade Receivables and Other assets
“Net Impairment Gains (Losses) on Trade Receivables and Other Assets” amounted to net impairment
losses of Euro 193 thousand in 2020, compared to net impairment losses of Euro 593 thousand in 2019.
Note 29 – Financial Income no nota 28 anche da originale
Financial income, together with the comment on the main changes on the previous year, was as follows:
“Investment income” includes the dividends approved by the subsidiary Dixon Ticonderoga Co.
(U.S.A. - Euro 1,432 thousand), F.I.L.A. Iberia S.L. (Spain - Euro 3,871 thousand), Fila Polska Sp
Z.o.o. (Poland - Euro 153 thousand), and St. Cuthberts Holding (United Kingdom - Euro 276 thousand).
“Interest and income from Group companies” include the interest of a financial nature recharged
principally to the subsidiaries of the Canson Group (Euro 804 thousand), to the subsidiary Daler
Rowney Ltd. (United Kingdom – Euro 216 thousand), to the subsidiary Dixon Ticonderoga (USA –
Euro 220 thousand), to the subsidiary Canson Brasil I.P.E. Ltda (Brazil – Euro 28 thousand), the
subsidiary Dixon S.A. de C.V. (Mexico - Euro 54 thousand), the subsidiary Fila Arches (France - Euro
Euro thousandsDecember 31, 2020 December 31, 2019 Change
Net impairment gains (losses) on Trade Receivables and Other Assets (193) (593) 400
Total (193) (593) 400
Nota 27 - NET IMPAIRMENT GAINS (LOSSES) ON TRADE RECEIVABLES AND OTHER ASSERTS
Euro thousandsDecember 31, 2020 December 31, 2019 Change
Investment Income 5,732 11,703 (5.971)
Dividends 5,732 11,703 (5.971)
Interest and Income from Group Companies 2,085 1,614 471
Bank Interest Income 1 31 (30)
Other Financial Incomes 621 337 284
Unrealised Exchange Gains on Financial Transactions 0 0 0
Realised Exchange Gains on Financial Transactions 38 233 (195)
Total 8,477 13,918 (5,441)
Note 29 – FINANCIAL INCOME

F.I.L.A. Group
243
656 thousand) and to the subsidiary FILA Stationery O.O.O. (Russia – Euro 72 thousand), calculated
on the loans granted by F.I.L.A. S.p.A.
For further information, reference should be made to “Note 3 - Financial Assets”.
“Other financial income” includes the recharge of fees for the non-use of the RCF line of the new loan
issued in June 2018 of the subsidiary Dixon Ticonderoga (U.S.A.) for Euro 359 thousand and to the
costs to subsidiaries for sureties granted in favour of FILA Stationary and Office Equipment Industry
Ltd. Co. (Turkey – Euro 5 thousand), Canson Brasil I.P.E. LTDA (Brazil – Euro 6 thousand), DOMS
Industries Pvt Ltd (India – Euro 29 thousand) by F.I.L.A. S.p.A., in guarantee of credit lines agreed
with Banca Nazionale del Lavoro S.p.A. and in favour of FILA Stationary O.O.O. (Russia - Euro 12
thousand) in guarantee of the credit lines agreed with Banca Intesa Sanpaolo. Loans in foreign currency
subject to currency hedges were recharged to Grupo F.I.L.A. - Dixon, S.A. de C.V. (Mexico - 85
thousand) and company FILA Stationary O.O.O. (Russia - Euro 27 thousand).
For further information, reference should be made to “Note 3 - Financial Assets”.

F.I.L.A. Group
244
Note 29.A - Foreign Currency Transactions
Exchange differences on financial and commercial transactions in foreign currencies in 2020 are
reported below:
Exchange differences in 2020 arose from transactions in US dollars against the euro, in addition to the
change in the year of assets and liabilities in foreign currencies, following commercial and financial
transactions.
Euro thousandsDecember 31, 2020 December 31, 2019 Change
Unrealised Exchange Gains on Commercial Transactions 23 14 9
Realised Exchange Gains on Commercial Transactions 278 109 169
Unrealised Exchange Losses on Commercial Transactions (52) (15) (37)
Realised Exchange Losses on Commercial Transactions (205) (111) (94)
Net exchange losses on comme rcial transactions 44 (3) 47
Realised Exchange Gains on Financial Transactions 38 233 (195)
Unrealised Exchange Losses on Financial Transactions (53) - (53)
Realised Exchange Losses on Financial Transactions (71) (100) 29
Net exchange gains on financial transactions (86) 133 (219)
Net exchange gains (42) 130 (172)
Note 29.A - FOREIGN CURRENCY TRANSACTIONS
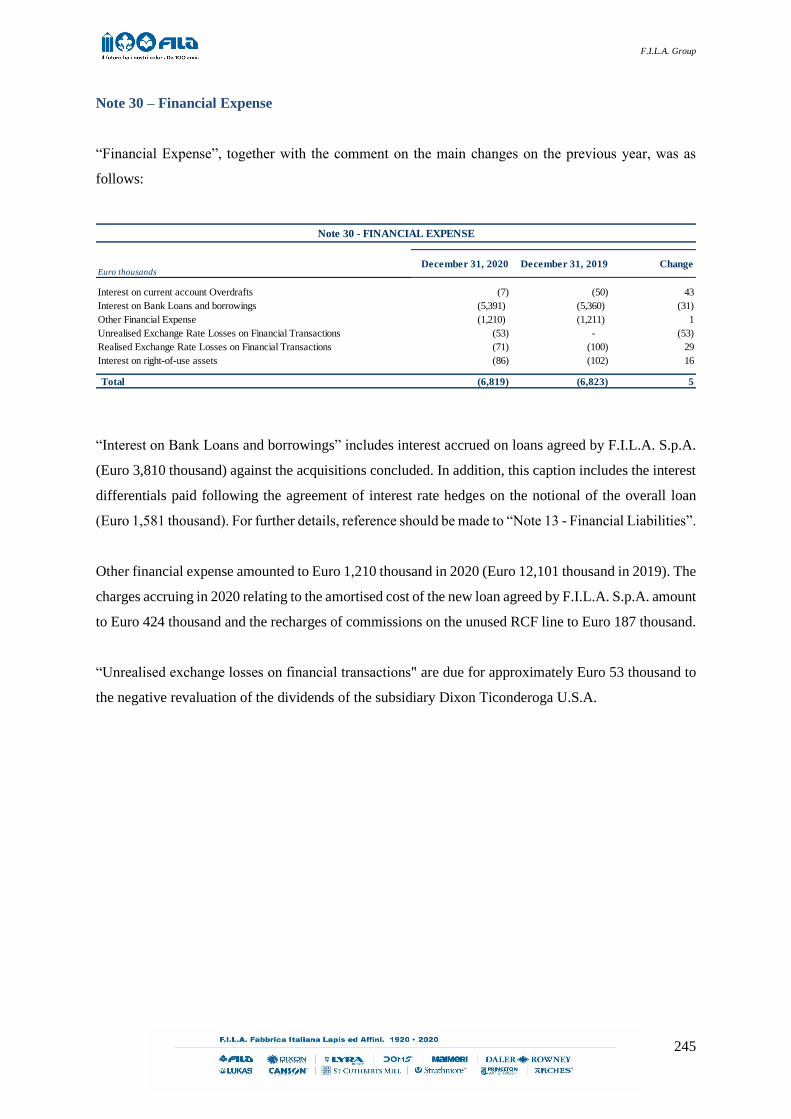
F.I.L.A. Group
245
Note 30 – Financial Expense
“Financial Expense”, together with the comment on the main changes on the previous year, was as
follows:
“Interest on Bank Loans and borrowings” includes interest accrued on loans agreed by F.I.L.A. S.p.A.
(Euro 3,810 thousand) against the acquisitions concluded. In addition, this caption includes the interest
differentials paid following the agreement of interest rate hedges on the notional of the overall loan
(Euro 1,581 thousand). For further details, reference should be made to “Note 13 - Financial Liabilities”.
Other financial expense amounted to Euro 1,210 thousand in 2020 (Euro 12,101 thousand in 2019). The
charges accruing in 2020 relating to the amortised cost of the new loan agreed by F.I.L.A. S.p.A. amount
to Euro 424 thousand and the recharges of commissions on the unused RCF line to Euro 187 thousand.
“Unrealised exchange losses on financial transactions" are due for approximately Euro 53 thousand to
the negative revaluation of the dividends of the subsidiary Dixon Ticonderoga U.S.A.
Euro thousandsDecember 31, 2020 December 31, 2019 Change
Interest on current account Overdrafts (7) (50) 43
Interest on Bank Loans and borrowings (5,391) (5,360) (31)
Other Financial Expense (1,210) (1,211) 1
Unrealised Exchange Rate Losses on Financial Transactions (53) - (53)
Realised Exchange Rate Losses on Financial Transactions (71) (100) 29
Interest on right-of-use assets (86) (102) 16
Total (6,819) (6,823) 5
Note 30 - FINANCIAL EXPENSE

F.I.L.A. Group
246
Nota 31 – Net Impairment Gains (Losses) on Financial Assets
“Net Impairment Gains (Losses) on Financial Assets” amount to Euro 9 thousand in 2020 (Euro 111
thousand in 2019).
Note 32 – Impairment losses on equity-accounted investees
“Impairment losses on equity-accounted investees” include the write-down of the investment held by
F.I.L.A. S.p.A. in the subsidiary Industria Maimeri (Italy) for Euro 342 thousand.
Note 33 – Income Taxes
Collectively they amount to net deferred tax liabilities of Euro 617 thousand in 2020 (Euro 1,813
thousand in 2019) and consist of current taxes of Euro 76 thousand (Euro 592 thousand in 2019) and
net deferred tax liabilities of Euro 693 thousand (net deferred tax assets of Euro 1,221 thousand in
2019).
Euro thousandsDecember 31, 2020 December 31, 2019 Change
Net impairment gains (losses) on Financial Assets (9) 111 (120)
Total (9) 111 (120)
Nota 31 - NET IMPAIRMENT GAINS (LOSSES) ON FINANCIAL ASSETS

F.I.L.A. Group
247
Note 33.A – Current Taxes
The breakdown is shown below:
Current taxes in 2020 refer to IRAP calculated on assessable income in accordance with current
legislation (Euro 201 thousand).
In addition, the impact of 2018 IRAP was recognised due to the application of the regulations relating
to Article 162 bis, whereby F.I.L.A. was classified as an "Industrial Holding Company" for a credit of
approximately Euro 420 thousand.
Foreign taxes owed by F.I.L.A. relating to the investment in Lyra Kg (Germany) amounted to Euro 114
thousand.
IRES was fully offset by the tax asset under the economic growth aid (ACE) program.
In addition, “Current Taxes” include tax assets for consolidated income produced overseas (principally
dividends and interest) for Euro 72 thousand under Article 165 of the Income Tax Act following the
absence of an IRES tax charge. Euro 8 thousand was in addition recognised for the CFC calculation.
Euro thousandsDecember 31, 2020 December 31, 2019 Change
Current taxes (76) (592) 516
Total (76) (592) 516
Note 33.A - CURRENT INCOME TAXES

F.I.L.A. Group
248
Note 33.B - Deferred tax income and expense
The relative detail is shown below:
The overall tax effects in the year, compared to the previous year, are reported below.
Euro thousands
December 31,
2020
December 31,
2019Change
Change in deferred tax assets 343 95 248
Change in deferred tax liabilities 329 (1,334) 1,663
Change in deferred Tax assets on Right-of-Use Assets 21 18 3
Total 693 (1,221) 1,914
Note 33.B DEFERRED TAX INCOME AND EXPENSE
Euro thousandsI.R.E.S. I.R.A.P.
Assessable Tax Base 7,533 16,097 -
Tax adjustments (5,197) (12,490) -
Taxable profit 2,336 3,607 -
Total current income taxes - (201) (201)
Lyra KG (Germany) German tax representation (114) (114)
Controlled Foreign Company (8) (8)
Other changes - Foreign Withholding Taxes (72)
Other tax changes from previous years (176) 423 247
Total current income taxes (370) 222 (76)
Deferred Tax Income of the Year on Temporary Differences 353 0 353
Deferred Tax Expense of the Year on Temporary Differences 340 0 340
Total deferred taxes 693 0 693
Total taxes 323 222 617
Note 33.C TOTAL TAXES FOR THE YEAR
December 31, 2020 Total Income
Taxes
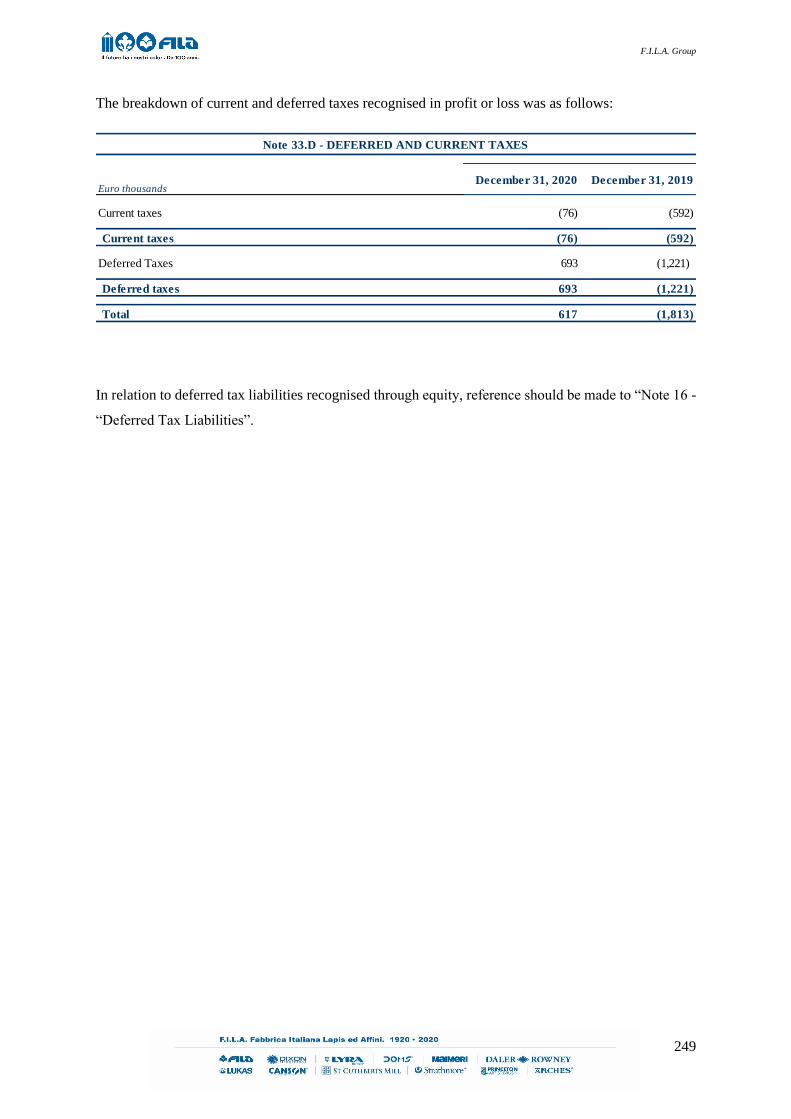
F.I.L.A. Group
249
The breakdown of current and deferred taxes recognised in profit or loss was as follows:
In relation to deferred tax liabilities recognised through equity, reference should be made to “Note 16 -
“Deferred Tax Liabilities”.
Euro thousandsDecember 31, 2020 December 31, 2019
Current taxes (76) (592)
Current taxes (76) (592)
Deferred Taxes 693 (1,221)
Deferred taxes 693 (1,221)
Total 617 (1,813)
Note 33.D - DEFERRED AND CURRENT TAXES

F.I.L.A. Group
250
Subsequent events
As regards the lockdown following the Coronavirus pandemic, at the date of this report, the company's
plant are operational, in accordance with the regulations, though not at full capacity in order to protect
worker safety.

F.I.L.A. Group
251
Transactions relating to Atypical and/or Unusual Operations
In accordance with Consob Communication of July 28, 2006, during 2020, F.I.L.A. S.p.A. did not
undertake any atypical and/or unusual transactions as defined by this communication, whereby atypical
and/or unusual transactions refers to transactions which for size/importance, nature of the
counterparties, nature of the transaction, method in determining the transfer price or time period (close
to year-end) may give rise to doubts in relation to: the correctness/completeness of the information in
the financial statements, conflicts of interest, the safeguarding of the Company’s assets and the
protection of non-controlling interests.
The Board of Directors
THE CHAIRMAN
Mr. Giovanni Gorno Tempini
(signed on the original)

F.I.L.A. Group
252
Final Considerations
These notes, as is the case for the financial statements, as a whole, of which they are an integral part,
provide a true and fair view of the financial position of F.I.L.A. S.p.A. at December 31, 2020 and the
result of operations for the year ended.
These separate financial statements as at and for the year ended December 31, 2020 comprise the
statement of financial position, the statement of comprehensive income, the statement of cash flows,
the statement of changes in equity and the notes, and reflect the underlying accounting records.

F.I.L.A. Group
253
Statement of the Manager in Charge of financial reporting and the Corporate
Bodies

F.I.L.A. Group
254
Board of Statutory Auditors’ Report on the separate financial statements at
December 31, 2017 prepared as per Article 2429 of the Civil Code.
BOARD OF STATUTORY AUDITORS’ REPORT
TO THE SHAREHOLDERS’ MEETING
OF F.I.L.A. – FABBRICA ITALIANA LAPIS ED AFFINI S.p.A.
IN ACCORDANCE WITH ARTICLE 53 OF LEGS. DEGREE 58/1998
Dear Shareholders,
The Board of Statutory Auditors of F.I.L.A - Fabbrica Italiana Lapis ed
Affini S.p.A (hereafter also “FILA S.p.A.” or “the Company”), in accordance
with Article 153 of Legislative Decree 58/1998 (hereafter the “CFA”) is
required to report to the Shareholders’ Meeting, called for the approval of the
financial statements at December 31, 2020, on the result for the year, on the
supervisory activities carried out in execution of its duties, on any omissions
and citable events, while in addition required to draw up observations and
proposals regarding the financial statements, their approval and the matters
within its scope.
The Board of Statutory Auditors has fulfilled its oversight duties, as per Article
149 of the CFA and, as the Internal Control and Audit Committee, has executed
the duties established by Article 19 of Legislative Decree 39/2010, as amended
by Legislative Decree 135/2016, taking account also of the conduct rules for
the Boards of Statutory Auditors of listed companies issued by the Italian
Accounting Profession (Consiglio Nazionale dei Dottori Commercialisti e
degli Esperti Contabili). Moreover, it carried out its supervisory activities in
compliance with the provisions and notices issued by Consob concerning
corporate controls and the activities of the Board of Statutory Auditors, as well
as the guidelines contained in the Code of Conduct1 of listed companies
1 In this Report, means the Corporate Governance Code for Listed Companies approved in December 2015, as updated in July 2018, by the Corporate Governance Committee.

F.I.L.A. Group
255
(hereinafter the "Code of Conduct").
This Report was prepared in compliance with the indications provided by
Consob with Communication DEM/1025564 of April 6, 2001 and subsequent
amendments and rule Q.7.1. of the Conduct Rules of Boards of Statutory
Auditors of listed companies issued by the Italian Accounting Profession
(Consiglio Nazionale dei Dottori Commercialisti e degli Esperti Contabili).
The audit appointment, as per Legislative Decree 58/1998 and Legislative
Decree 39/2010, was undertaken by KPMG S.p.A. (hereafter also “KPMG” or
“the Independent Audit Firm”), as awarded by the Shareholders’ Meeting of
February 20, 2015 for a period of nine years (for the financial years 2015 to
2023 inclusive).
1. Board of Directors - appointment, duration of office and functioning
The Board of Directors in office at the date of this Report was appointed by
the Shareholders’ Meeting of FILA S.p.A. of April 27, 2018 (with the
exception of Mr. Alessandro Potestà and Mr. Giovanni Gorno Tempini, co-
opted respectively on November 13, 2018 and August 6, 2019, in accordance
with Article 2386 of the Civil Code and thereafter respectively appointed by
the Shareholders’ Meeting of April 18, 2019 and by the Shareholders’ Meeting
of April 22, 2020) for three financial years and specifically until the
Shareholders’ Meeting called to approve the financial statements at December
31, 2020.
The Board of Directors on March 16, 2021 verified and confirmed fulfilment
of the standing requirements set out by the applicable regulation by all the
directors and of the independence requirements by directors Francesca
Prandstraller, Paola Bonini, Gerolamo Caccia Dominioni, Alessandro Potestà
and Filippo Zabban, with regards to Article 148, paragraph 3, of the CFA, as
restated in Article 47-ter, paragraph 4, of the CFA and Article 3 of the Self-
Governance Code. On this occasion, the Board of Statutory Auditors verified
the correct application of the criteria and procedures adopted by the Board of
Directors to assess the independence of its members, in accordance with

F.I.L.A. Group
256
application criterion 3.C.5 of the Self-Governance Code.
The Board of Statutory Auditors noted the substantially positive outcomes of
the assessments undertaken by the Board of Directors at the same meeting of
March 16, 2021 concerning the size, composition and functioning of the Board
of Directors and of the sub-committees, communicating a number of
indications and improvement proposals emerging from this assessment. These
include, in particular, the indication to: i) strengthen the induction activity by
scheduling specific meetings on sustainability and, as soon as possible, visits
to the main subsidiaries; ii) increase the number of board meetings by
discussing aspects concerning the organization and the tasks entrusted to the
various functions at central level and at the subsidiaries; iii) improve the
information flow to all the directors and further anticipate the sending of
documentation supporting the items on the agenda; iv) create an appointments
committee and a sustainability committee or, at least, formally assign their
specific competences to the existing committees.
2. Board of Statutory Auditors - Appointment, duration of office and
functioning.
The Board of Statutory Auditors in office at the date of this report was
appointed by the Shareholders’ Meeting of FILA S.p.A. of April 27, 2018 for
three financial years and therefore until the Shareholders’ Meeting called to
approve the financial statements at December 31, 2020.
The Board, on February 24, 2021, completed its annual self-assessment
process, declaring the absence of any causes of ineligibility, lapse and
incompatibility among its members, as per Article 148 of the CFA and rule
Q.1.1. of the conduct rules of Boards of Statutory Auditors of listed companies
issued by the Italian Accounting Profession (Consiglio Nazionale dei Dottori
Commercialisti e degli Esperti Contabili), in addition to their satisfaction of
the independence requirements as per application criterion 8.C.1. of the Self-
Governance Code.
As part of this process, the Board of Statutory Auditors in addition considered
itself, overall, adequate to execute the appointment assigned to it regarding its
composition, in addition to the preparation, professionalism, experience,

F.I.L.A. Group
257
gender and age profiles of its members.
Finally, the members of the Board of Statutory Auditors have declared
compliance with the limit on the number of offices envisaged by Article 144-
terdecies of the Issuers’ Regulation and of the availability of the time and
resources necessary to undertake the appointment.
The results of the self-assessment were communicated to the Board of
Directors for its consideration and so as to announce to the market, in the
Corporate Governance Report, the fulfilment of the independence
requirements of the members of the control board.
In executing its duties, the Board of Statutory Auditors met 12 times in 2020,
with the justified absence of one of its members on one occasion, utilising
audio and video communication after the restrictions imposed to deal with the
health emergency. The Board of Statutory Auditors in addition met informally,
on various other occasions, and considered particular matters, examined
relevant documents, set out work schedules, and prepared minutes and
communications. In addition, the Board of Statutory has attended, with its
Chairperson and with at least one other member, all the meetings of the Control
and Risks and Related Parties Committee and of the Remuneration Committee
(meeting respectively on 10 and 8 occasions in 2020), as outlined in greater
detail in the table presented in the specific section of the Corporate Governance
and Ownership Structure Report 2020, and at the meeting of the Independent
Directors (held on March 23, 2020), during which the initiatives undertaken to
handle the COVID-19 health emergency were discussed, its possible effects
and the proposal to allocate the 2019 result.
3. Compliance of the company with the Self-Governance Code
The company adopted the Self-Governance Code of listed companies with
motion of the Board of Directors of March 15, 2016.
The Board of Statutory Auditors has monitored the correct application by the
Company of the corporate governance rules outlined in the Self-Governance
Code and, to the extent of its scope, acted in compliance with the code.
The Board of Directors on February 11, 2021 approved the adoption of the new
Corporate Governance Code approved in January 2020 by the Corporate

F.I.L.A. Group
258
Governance Committee and entering into force, for the company, from January
1, 2021. The process to adjust and implement the recommendations contained
therein has begun for those matters considered necessary and shall be
completed in 2021, taking account of the fact that the Shareholders’ Meeting
called to approve the financial statements at December 31, 2020 shall be called
to appoint the new corporate boards.
4. Oversight and control activities
As part of its duties and with reference to the activities that fall within the scope
of its responsibility, the Board of Statutory Auditors declares to have:
• attended the Shareholders’ Meeting of April 22, 2020, which among
other matters, approved the financial statements at December 31, 2019;
• attended 7 meetings of the Board of Directors, obtaining appropriate
information from the executive directors on the general operating
performance and its expected development, in addition to the initiatives
undertaken to handle the health emergency and its possible
implications;
• acquired the elements of information needed to verify compliance with
the law, By-Laws and principles of good administration and supervised
the adequacy of the organisational structure of the company, through
the acquisition and review of relevant documents, meetings with the
heads of the various company departments and periodical exchanges of
information with the Independent Audit Firm;
• attended, as previously stated, with its Chairperson and also with at least one
other member, all the meetings of the Control and Risks and Related Parties
Committee and of the Remuneration Committee;
• met the members of the Supervisory Board, also at the meetings of the
Control and Risks and Related Parties Committee;
• monitored the functioning and effectiveness of internal control systems
and the suitability of the administrative and accounting system,
particularly in terms of the latter’s reliability in representing accounting
data;
• obtained from the directors at least on a quarterly basis in accordance
F.I.L.A. Group
259
with Article 150, paragraph 1, of the CFA, adequate information on the
activities and significant economic, financial and equity transactions
carried out by the Company and its subsidiaries;
• exchanged in a timely manner with the managers of the Independent
Audit Firm the relevant data and information for the undertaking of the
respective duties as per Article 150, paragraph 3, of the CFA,
examining to the extent necessary both the methodological approach
and the planning of its activities and the result of the work carried out
and acquiring the auditor’s report prepared in accordance with Article
14 of Legislative Decree 39/2010 and Article 10 of Regulation (EC)
No. 537/2014;
• exchanged information on administration and control systems and on
the general operating performance with the Board of Statutory Auditors
of the Italian subsidiaries in accordance with Article 151, paragraph 1
and 2 of the CFA and requested from the Executive Director, the
Internal Audit function and the independent audit firm information
concerning the most significant matters regarding the main overseas
investees of the FILA Group (hereafter also the “Group”);
• reviewed (as outlined in greater detail below) the content of the
Additional report to the Board of Statutory Auditors on the functioning
of the Internal Control and Audit Committee prepared by the
Independent Audit Firm as per Article 11 of Regulation (EC) 537/2014,
whose review did not indicate any aspects requiring reporting herein;
• monitored the functionality of the control system on Group companies
and the suitability of the instructions imparted to them, also pursuant to
Article 114, paragraph 2 of the CFA;
• noted the preparation of the Remuneration Report pursuant to Article
123-ter of the CFA, as amended by Legislative Decree No. 49 of May
10, 2019, and Article 84-quater and Annex 7-bis of the Issuers’
Regulation, as amended by Consob motion No. 2163 of December 10,
2020 without any particular observations to report;
• ascertained the compliance of statutory provisions with legal and
regulatory provisions;

F.I.L.A. Group
260
• supervised the compliance of the internal procedure concerning
Related Parties Transactions according to the principles indicated in the
Regulation approved by Consob with Resolution No. 17221 of March
12, 2010 and subsequent amendments, and its observance, pursuant to
Article 4, paragraph 6 of this Regulation, attending, as stated, the
periodic meetings of the Control and Risks and Related Parties
Committee called to review these transactions;
• supervised the corporate information process, verifying the directors’
compliance with procedural rules concerning the drafting, approval and
publication of the statutory and consolidated financial statements;
• ascertained the methodological suitability and the reasonableness of the
criteria and parameters utilised for the impairment test implemented by
the competent company functions and approved by the Board of
Directors in order to verify the possible existence of impairment losses
on the assets recorded to the consolidated financial statements and the
separate financial statements;
• verified that the Directors’ Report for the financial year 2020 complies
with applicable legislation and was consistent with the decisions taken
by the Board of Directors and with the facts represented in the statutory
and consolidated financial statements;
• noted the content of the Consolidated Half-Year Report, without the
need to report any observations, and also ascertained that the latter was
published in accordance with the procedures laid down;
• noted that the company continued to publish on a voluntary basis the
Quarterly Reports according to the deadlines established by the pre-
existing rules;
• in the role of Internal Control and Audit Committee, pursuant to Art. 19,
paragraph 1 of Legislative Decree 39/2010, as amended by Legislative Decree
135/2016, performed the specific information, monitoring, control and audit
functions envisaged therein and accomplished the duties and tasks indicated
by the aforesaid legislation;
• supervised compliance with the provisions set forth in Legislative Decree No.
254/2016 by examining, inter alia, the Consolidated Non-Financial
Statement, while also ascertaining compliance with the provisions governing

F.I.L.A. Group
261
its preparation pursuant to the above-mentioned decree;
• attended, as part of the Board’s activities, information sessions for
Directors and Statutory Auditors, broadening therefore their
knowledge on the sectors in which the company and the Group
operates, of the main operating aspects and regarding the regulatory
framework (with particular regard to the new Corporate Governance
Code) and acquiring updates on the state of advancement of the main
initiatives;
• held, on its own initiative, meetings with the Chief Executive Officer,
for a close examination (organisational structure, key roles, and
operating aspects concerning activities, products, commercial
organisation and relations with other Group companies) of the main
overseas subsidiaries;
• oversaw the activities concerning Regulation (EC) 2016/679
concerning personal data protection (GDPR).
Following the supervisory activities carried out within the scope of and in
accordance with the methods described above, no facts emerged from which
to deduce non-compliance with the law and the By-Laws, nor to justify reports
to the Supervisory Authorities or a mention in this report.
In addition, the Board of Statutory Auditors, on the basis of the information
and findings, reasonably consider that these operations comply with law and
the By-Laws and were not manifestly imprudent, hazardous or against the
motions undertaken by the Shareholders’ Meeting or such as to compromise
the integrity of the company’s assets.
In this regard, it is highlighted that the Board of Statutory Auditors, in
accordance with its role, dedicated particular attention to a number of aspects
concerning the acquisition (completed on March 2, 2020) of the business unit
of Ahlstrom-Munksjö Arches S.A.S., which is engaged in the production and
distribution of ARCHES® products, acquiring from the management of FILA
S.p.A. and its consultants extensive information and adequate documentation
on the strategic reasoning, price and funding of the transaction, and its
sustainability from an economic-financial and management viewpoint.
With regards to the other transactions undertaken in the recent past (Arches
F.I.L.A. Group
262
business unit on March 2, 2020, Pacon Group on June 7, 2018, Daler-Rowney-
Lukas on February 3, 2016, Canson Group - France on October 5, 2016 and St.
Cuthberts Holding Limited on September 14, 2016), the Board of Statutory
Auditors, within its supervisory activities regarding the adequacy of the
organisational, administrative and accounting structure of the company,
consistently monitored the integration of the groups and the companies
acquired, from an organisational and operating viewpoint and with regards to
the collation of financial information and, on the basis of the findings and
activities carried out, does not highlight any particular matters in this regard.
The Board of Statutory Auditors has constantly monitored with particular
attention the functioning of the governance processes and bodies and, in this
regard, highlights how the Company, also in FY 2020, has made significant
progress in the direction of a strengthening of the governance and control
structures in line with best practices among listed companies, in particular with
the adoption of a new Group Organisational Model, approved by the Board of
Directors on 15 May 2020, which is still being fully implemented.
5. Oversight on atypical or unusual transactions and related party
transactions
In 2020, the Board of Statutory Auditors did not note, or receive reports of,
any atypical or unusual transactions with Group companies, third parties or
with other related parties.
The Board of Statutory Auditors had not received in 2020 and until the date of
the present report any communication from the control boards of the
subsidiaries, associates or investees, or from the independent audit firm
containing issues which require disclosure in this report.
The Board of Statutory Auditors, in addition, noted that the statement of financial
position and income statement balances of inter-company transactions and those with
related parties undertaken by the company and its subsidiaries in 2020, are
respectively indicated in the “Statement of financial position with indication of
transactions with related parties in accordance with Consob Motion No. 15519 of July
27, 2006”, and in the “Statement of comprehensive income with indication of
transactions with related parties in accordance with Consob Motion No. 15519 of July
27, 2006”, and in greater detail in the “Related party transactions” paragraph of the
F.I.L.A. Group
263
Consolidated Financial Statements of the FILA Group at December 31, 2020, to which
reference should be made. In particular, in this paragraph the transactions executed by
the FILA Group with related parties in the course of ordinary operations and based on
market conditions are outlined.
The Board of Statutory Auditors assesses the overall adequacy of the
information, provided in the manner indicated above, concerning the above
transactions and, also on the basis of the analyses and periodic checks carried
out by the Control and Risks and Related Parties Committee, considers that
they are adequate and in line with the company's interests. The Related Party
Transactions, identified on the basis of international accounting standards and
Consob’s provisions, were governed by an internal policy (the “Policy”),
adopted by the Board of Directors of Space S.p.A. (now F.I.L.A. - Fabbrica
Italiana Lapis ed Affini S.p.A.) on October 15, 2013 and amended, latterly,
with Board motion of May 15, 2018. The Board de1 Statutory Auditors
examined the Procedure, ascertaining compliance with Consob Regulation No.
17221 of March 12, 2010, as amended by Resolution No. 17389 of June 23,
2010 and interpreted with Resolution No. 78683 of September 24, 2010.
The Board also monitored the regulatory changes introduced by Directive (EU)
2017/828 and transposed by Legislative Decree 49 /2019 and began
discussions with the Company and its advisors on the amendments to the
Related Party Transactions Regulation introduced by Consob Resolution No.
21624 of December 10, 2020, which will come into force on July 1, 2021.
6. Relations with the Independent Audit Firm, in accordance with
Legislative Decree 39/2010 and observations on its independence
The Board of Statutory Auditors oversaw the efficacy of the legal audit,
discussing and examining through specific meetings with the Independent
Audit Firm aspects concerning:
• the planning of activities, the methodological approach and the
supervision and co-ordination of works carried out by the auditors of
the overseas subsidiaries;
• the particularly significant areas in terms of audit risks;
• the efficacy and reliability of the internal control system;
• the periodic checks on the proper keeping of accounting records;

F.I.L.A. Group
264
• the results emerging from the work carried out.
The Independent Audit Firm communicated the fees accruing in 2020 for audit
services and non-audit services (NAS) provided to FILA S.p.A. and to its subsidiaries
by KPMG S.p.A. and its network. These fees are summarised in the “Information
provided as per Article 149-duodecies of Consob Issuers’ Regulation” of the
Consolidated Financial Statements of the F.I.L.A. Group at December 31, 2020, in
compliance with Article 149-duodecies of the Issuers’ Regulation.
In particular, the fees for non-audit services, according to that confirmed by
the Independent Audit Firm, for 2020 totalled Euro 181 thousand, at
consolidated level, of which Euro 69 thousand concerning the services
provided by KPMG S.p.A. and Euro 92 thousand the services provided by
parties belonging to the KPMG network in favour of the overseas Group
subsidiaries. In this regard, in all of those cases in which, in accordance with
Article 8, paragraph 4 of Regulation (EC) 537/2014, the prior review of the
Internal Control and Audit Committee was requested, the Board of Statutory
Auditors, in that role, reviewed in accordance with Articles 4, 5 and 6 of the
above Regulation and considering the relative research and interpretation
documents the requests to receive and adopt its decisions after assessing: i) the
subject, method of execution of the appointment and fees; ii) the documents
and relevant professional technical principles and iii) the declarations of the
independent audit firm concerning the absence of risks regarding its
independence.
In carrying out its investigatory activities, the Board of Statutory Auditors took
into consideration the overall rationale of the rules stated, and assumed a more
prudent approach in order to guarantee the complete independence of the
auditor.
With reference to the so-called 70% fee-cap rule provided for by Article 4 of
Regulation (EC) 537/14, applicable starting from the financial year ended
31.12.2020, the Board of Statutory Auditors found that the fee for NAS
services paid to KPMG S.p.A. in 2020 compared to the average fee for the
legal audit in the three-year period 2017-2019 is well below the established
percentage limit. Incidentally, it should be noted that the company, on the
request of the Board of Statutory Auditors, prepared and approved with Board
of Directors’ motion of May 15, 2019, both the new procedure for the

F.I.L.A. Group
265
“Conferment to the independent audit firm of non-audit services” and with
regards to the “Selection of the Audit Firm” to which the audit appointment is
assigned. With regards also to the independence of the audit firm, the Board of
Statutory Auditors, as previously indicated, in its role also as Internal Control
and Audit Committee:
a) fulfilled the duties required of Article 19, paragraph 1, letter e) of
Legislative Decree 39/2010, as amended by Legislative Decree
135/2016, verifying and monitoring i) the independence of the Audit
Firm, in accordance with Article 10, 10-bis, 10-ter and 10-quater and 17
of Legislative Decree 39/2010 and Article 6 of Regulation (EC) No.
537/2014; ii) the adequacy of the provision of non-audit services in
accordance with Article 5 of the above Regulation;
b) examined the Additional Report for the Internal Control and Audit
Committee established by Article 11 of Regulation (EC) 537/2014 and
noted that contained in the Transparency Report published by the
Independent Audit Firm on its website in compliance with the criteria
outlined in the Regulation;
c) received as an annex to the above Additional Report, the “Annual
confirmation of independence in accordance with Article 6, paragraph 2,
letter a) of Regulation 537/2014 and in accordance with paragraph 17 of
international audit principle (ISA Italy) 260” where the independent
Audit Firm, among others, declares that, in the period between January
1, 2020 and the issue of the Confirmation, no situations which would
compromise its independence with regards to FILA S.p.A. arose in
accordance with Articles 10 and 17 of Legislative Decree 39/2010 and
Articles 4 and 5 of Regulation (EC) 537/2014;
d) discussed with the Independent Audit Firm, the risks regarding its
independence and the measures taken to mitigate them, pursuant to Art.
6, para. 2(b) of EU Reg. No. 537/2014.
On the basis of the information acquired and the activities carried out, no
aspects or situations emerged indicating risks to the independence of the
Independent Audit Firm, and in this regard the Board of Statutory Auditors
does not report any observations for the Shareholders’ Meeting.

F.I.L.A. Group
266
7. Supervisory activities on the financial disclosure process and
internal control system
The Board of Statutory Auditors supervised the adequacy of the administrative
and accounting system, in addition to its reliability to correctly represent the
operating events, obtaining information from the administrative department
managers and exchanging information with the Control and Risks and Related
Parties Committee, the Internal Audit department and the Independent Audit
Firm.
The Board of Statutory Auditors in addition supervised, also through periodic
meetings with the Executive Officer responsible for financial reporting, the
organisation and company procedures and the instruments adopted for the collation of
the information and the data necessary for the drawing up of the statutory financial
statements, the consolidated financial statements and the periodic financial reports, in
addition to other financial communications, in order to: i) assess the adequacy and
the effective adoption and ii) verify the adequacy and the suitability of the powers and
the means assigned by the Board of Directors to the Executive Officer for the
undertaking of his/her role.
In this regard, the Board of Statutory Auditors notes that in relation to the
statements issued by the Executive Bodies (specifically the Chief Executive
Officer) and the Executive officer for financial reporting in accordance with
Article 154-bis, paragraph 5 of the CFA, on the statutory financial statements
and on the consolidated financial statements of the Group at December 31,
2020, in addition to the Half-Year Financial Report at June 30, 2020 and on
the quarterly reports, no citable matters or annotations emerged.
The Board of Statutory Auditors considers the administration and accounting
system overall to be substantially adequate and reliable in view of the size and
complexity of the company and of the Group.
Considering that responsibility for the audit of the accounts is assigned to the
Independent Audit Firm, the Board of Statutory Auditors supervised the
general lay-out of the statutory financial statements and the consolidated
financial statements and their compliance with the rules governing their
formation and structure. The Board of Statutory Auditors also verified their
consistency with the events and information noted during the execution of their

F.I.L.A. Group
267
duties. In this regard, the Board of Statutory Auditors does not highlight any
particular observations.
The Board of Statutory Auditors supervised, within the extent of its remit, the
adequacy of the internal control and risk management system: a) obtaining
information from the managers of the various company departments, so as to
verify the existence, adequacy and proper implementation of the procedures;
b) attended the meetings of the Control and Risks and Related Parties
Committee; c) met periodically with the internal audit manager and acquired
information regarding the results of work carried out, actions recommended
and subsequent initiatives undertaken to solve specific problems and/or for the
improvement of the procedures; ii) exchanged information with the
Independent Audit Firm.
In this regard, the Board of Statutory Auditors noted the information provided
periodically by the Executive Director as the Director in charge of setting up
and maintaining an effective internal control system and the periodic reports
prepared by the Control and Risks and Related Parties Committee in
accordance with Application Criterion 7.C.2, letter f) of the Self-Governance
Code on the activities undertaken, whereby, among others, a favourable
opinion was expressed with regards to the adequacy of the internal control and
risk management system.
The Board of Statutory Auditors, on the basis of that reported above and considering
the control activities put in place and the improvement actions taken and being
implemented, considers that the internal control system should be considered in
overall terms adequate to the size, complexity and operations undertaken by the
Company and by the Group.
In this regard and considering the major acquisitions of overseas companies in
the recent past, and the consequent expansion of the FILA Group
internationally, the Board of Statutory Auditors in various circumstances
expressed its opinion on the completion within a short timeframe of the
integration process and to further strengthen the control functions and the
governance system of the main subsidiaries.
In this regard, the Board of Statutory Auditors reports that during the year i)
the activities to fine-tune and improve the Group's single ERP system
continued at the subsidiaries that have already adopted it, ii) its implementation

F.I.L.A. Group
268
was completed at Fila Arches, which will use it as of January 1, 2021, and iii)
the new Organizational Model was adopted, which, as mentioned above,
provides for, among other matters, the strengthening of the role and
responsibilities of the central functions, the better functioning of the strategic
committees with the tasks of controlling, supervising and monitoring the
activities and operating performance of the subsidiaries and an operating
control manager (Group Controlling VP), appointed on December 1, 2020.
8. Oversight of the non-financial disclosure process
As previously indicated, the Board of Statutory Auditors oversaw compliance
with Legislative Decree 254/2016 and the enactment regulation adopted by
Consob with Motion No. 20267 of 18/01/2018, with regards to the Non-
financial statement (hereafter “NFS”) and regarding the existence of an
adequate administrative, reporting and control system of the company to
permit the correct and complete presentation of non-financial disclosure.
In this regard, the Board of Statutory Auditors met with the Executive Director,
in addition to the various company structures and outsourcers which were part
of the work group under its responsibility involved in the preparation of the
NFS, acquiring information regarding the materiality analysis carried out by
the company to establish the relevant non-financial reporting scopes for the
FILA Group, the involvement of the subsidiaries and the operating procedures
and instruments adopted for the collation of data/information and their
subsequent analysis, control and consolidation.
The Board of Statutory Auditors in addition discussed with the independent
audit firm the content of the Non-Financial Statement, taking account of the
call to attention of Consob No. 1/21 of February 16, 2021, in addition to the
procedures undertaken and the operating means for the planning and execution
of works.
On the basis of the information and the evidence acquired and according to the
terms reported above, the Board of Statutory Auditors considers the
procedures, processes, and structures for the production, reporting, measuring
and presentation of this information to be adequate and does not highlight any
particular matters for the Shareholders’ Meeting.

F.I.L.A. Group
269
9. Additional information requested by Consob Communication No.
DEM/1025564 of April 6, 2001 and subsequent supplements
In accordance with that required by Consob, the Board of Statutory Auditors
also reports the following:
a) the Board of Statutory Auditors did not receive any petitions as per
Article 2408 of the Civil Code, nor notices from third parties;
b) the Board of Statutory Auditors, during 2020, did not receive any
disclosure requests from Consob, neither as per Article 115 of the
CFA, nor as per Article 114 of the CFA;
c) during the year 2020, the Board of Statutory Auditors issued the
opinion provided for by Article 2389, paragraph 3, of the Civil Code,
in relation to: i) the allocation to the Executive Directors of an
extraordinary bonus linked to the completion of the acquisition of the
Arches business unit (Board of Directors' motion of March 16, 2020),
ii) the proposal for a temporary exception pursuant to Article 123-
ter, paragraph 3-bis, of the Consolidated Finance Act of the
Remuneration Policy 2020 (Board of Directors' motion of August 5,
2020) and iii) the application of the Remuneration Policy 2020 and
Remuneration Policy 2021 (Board of Directors' motion of March 22,
2021);
d) expressed its opinion in view of the motions considered by the Board
of Directors, as required by the Self-Governance Code (Article 7,
criterion 7.C.1. and 7.C.2.), in relation to i) the 2021 work plan
prepared by the Internal Audit function; ii) the correct use of the
accounting standards and their appropriateness for the Separate and
consolidated annual and half-year financial statements.
10. Significant events indicated in the Directors’ Report, in the separate
financial statements and in the consolidated financial statements
The Board of Statutory Auditors reports the following significant operating,

F.I.L.A. Group
270
financial and equity events in the Directors’ Report, the financial statements
and the consolidated financial statements at December 3l, 2020, which took
place during the 2020 financial year.
• On March 2, 2020, F.I.L.A.- Arches S.A.S., a French company wholly-
owned by FILA S.p.A., completed the purchase of the business unit
involved in the production of premium paper used in the fine art sector
with the ARCHES® brand, finalizing the non-binding memorandum of
understanding signed on October 30, 2019 between FILA S.p.A. and
Ahlstrom-Munksjö Oyj and its French subsidiary, Ahlstrom-Munksjö
Arches. The total price, on a debt-free cash-free basis, paid by F.I.L.A.
- Arches S.A.S. for the business unit was Euro 43.6 million. The
acquisition was funded through amending the existing medium/long-
term loan contract, through the granting of new lines for Euro 15
million and the partial use of the Revolving Credit Facility line for Euro
25 million, through its conversion into a medium/long-term line.
• In relation to the emergency caused by the COVID-19 outbreak, the
Directors have outlined the measures adopted and the initiatives taken
at all levels of the organisation to deal with the serious crisis situation
that has arisen, to mitigate its effects and to guarantee the health and
safety of workers as much as possible. In addition, they report on
developments regarding the situation in the various countries, on the
economic and financial effects caused by the pandemic at group level
and on the main subsidiaries, highlighting in particular that the liquidity
available is adequate to cover normal operating needs and the
repayment of the instalments due on the structured debt.
In relation to the acquisition of the Arches business unit, the Board of Statutory
Auditors, on the basis of information provided by the company and data
acquired, ascertained its compliance with law, the By-Laws and the principles
of correct administration, ensuring that these were not manifestly imprudent or
risky, in possible conflict of interest, inconsistent with the resolutions taken by
the Shareholders’ Meeting or such as to compromise the integrity of corporate
assets.

F.I.L.A. Group
271
11. Subsequent events
The Board of Statutory Auditors notes that in the “Subsequent events”
paragraph of the 2020 Directors' Report, the Company indicates that all the
Group's plant are operational, with some limitations on the maximum potential
to ensure the safety of workers - in particular in Mexico and India.
12. Independent Auditors’ Report and Board of Statutory Auditors’
Report
The Independent Audit Firm issued on March 30, 2021 the Reports as per
Article 14 of Legislative Decree No. 39/2010 and Article 10 of Regulation
(EC) 537/2014, on the separate financial statements and on the consolidated
financial statements at December 31, 2020 where, in particular, it certified that:
- the separate financial statements and the consolidated financial statements
provide a true and fair view of the statement of financial position of the
Company and of the Group at December 31, 2020 and of the economic
result and cash flow for the year ended at that date in compliance with
International Financial Reporting Standards adopted by the European
Union and the provisions issued in implementation of Article 9 of
Legislative Decree 38/05;
- the Directors’ Report and certain specific information contained in the
Corporate Governance and Ownership Structure Report indicated in
Article 123-bis, paragraph 4 of Legislative Decree 58/1998, are consistent
with the company’s statutory financial statements and Group consolidated
financial statements and are drawn up in accordance with law;
- the opinion on the statutory financial statements and the consolidated
financial statements is in line with that indicated in the Additional Report
drawn up pursuant to Article 11 of Regulation (EC) 537/2014 and in
accordance with Article 19 of Legislative Decree 39/2010.
It is recalled for informational purposes alone that in the above-stated Reports
the Independent Audit Firm considered it beneficial to identify as key aspects
of the audit, for the statutory financial statements of FILA S.p.A., the process
to measure the recoverable value of the investments while, with regards to the

F.I.L.A. Group
272
consolidated financial statements of the Group, a) the process to measure the
recoverable value of goodwill and b) the recognition and valuation of
inventory. In the Auditors’ Report on the consolidated financial statements, the
Independent Audit Firm also stated that it had verified the approval of FILA
S.p.A.’s directors of the Consolidated Non-Financial Statement for the year
2020 for the FILA Group.
In the above Reports of the Independent Audit Firm, no issues or requests for
disclosure were raised, nor were declarations issued in accordance with Article 14,
paragraph 2, letters d) and e) of Legislative Decree 39/2010.
In addition, also on March 30, 2021, the Independent Audit Firm:
- sent to the Board of Statutory Auditors, as the Internal Control and Audit
Committee, the additional report as per Article 11 of Regulation (EC) No.
537/2014, which does not contradict that outlined in the Reports on the
financial statements indicated above and reports on other significant
aspects, and that the Board of Statutory Auditors sends to the Board of
Directors;
- issued, in accordance with Article 3, paragraph 10 of Legislative Decree
254/2016 and Article 5 of Consob Regulation 20267/2018, the
Consolidated non-financial statement, regarding which the Independent
Audit Firm declares that, on the basis of the work carried out, no matters
came to its attention to suggest that the FILA Group’s Non-Financial
Statement for the year ended December 31, 2020 was not drawn up, in all
significant aspects, in compliance with the requirements of Articles 3 and
4 of the Decree and selected GRI Standards.
The regular meetings held by the Board of Statutory Auditors with the
Independent Audit Firm, pursuant to Article 150, paragraph 3 of Legislative
Decree 58/1998, did not reveal aspects that should be highlighted in this
Report.
Moreover, the Board did not receive any disclosures from the Independent
Audit Firm on reprehensible facts detected during the audit activity on the
annual and consolidated financial statements.

F.I.L.A. Group
273
13. Considerations on the current health emergency
The Board of Statutory Auditors cannot fail to point out that, at the date of this
Report, the COVID-19 outbreak health emergency continues, with respect to
which regulations have been issued imposing restrictions on the movement of
persons and the exercise of business activities, which differ from country to
country, in addition to stringent health protocols for the protection of persons,
especially in the workplace. However, the availability of vaccines and the
actions and plans developed for their administration allow us to reasonably
expect a positive development of the situation and a slow and progressive
return to normality.
In addition, the Board of Statutory Auditors points out that, as of the date of
issue of this Report, the extraordinary legal provisions and regulations to
enable the holding of shareholders' meetings, and the exercise of votes at such
meetings, remotely remain in force. In this regard, the Board of Statutory
Auditors will work in close coordination with the Board of Directors so that
the next Shareholders' Meeting, called for April 27, 2021, can be held properly
held, and the rights of Shareholders duly exercised, in compliance with the
above provisions.
The Board of Statutory Auditors, in close coordination with the Board of
Directors, ensures maximum attention to monitoring the development of the
health situation in the various countries and the economic and, in particular,
financial impact on the Company and the Group.
14. Final considerations
Considering all that stated above, the Board of Statutory Auditors does not
raise specific critical matters, omissions, reportable events or irregularities, nor
observations or proposals to be submitted to the Shareholders’ Meeting in
accordance with Article 153 of Legislative Decree 58/1998, to the extent of its
remit, and therefore does not indicate any reasons to prevent approval of the
statutory financial statements at December 31, 2020 and the proposals for the
allocation of the profit drawn up by the Board of Directors for the
Shareholders’ Meeting.

F.I.L.A. Group
274
Rome, March 30, 2021
Gianfranco Consorti, Chairman of the Board of Statutory Auditors
Elena Spagnol, Statutory Auditor
Pietro Michele Villa, Statutory Auditor

F.I.L.A. Group
275
Independent Auditors’ Report pursuant to Article 14 of Legislative Decree No. 39
of January 27, 2010

F.I.L.A. Group
276

F.I.L.A. Group
277
F.I.L.A. Group
278

F.I.L.A. Group
279