fiji marine conservation & diving - … · fiji marine conservation & diving ......
TRANSCRIPT

FIJI MARINE
CONSERVATION & DIVING
Beqa Island, Fiji
FJM Phase 164 Science Report
October 2016 – December 2016
Authors: Kimberley Lees M.Sc. (Research Officer)
& Teodora Forascu (Research Officer)

Field Staff
Staff member
Role
Jane Giat (JG) Principal Investigator
Kimberley Lees (KL)
Teodora Forascu (TF)
Research Officer
Research Officer
Laurence Pidgeon (LP) Dive Officer

Table of Contents 1. Introduction ..................................................................................................................................................... 4
1.1 Frontier ...................................................................................................................................................... 4
1.2 Location ..................................................................................................................................................... 4
1.3 Background ................................................................................................................................................ 6
1.3.1 Natural Sources of Reef Degradation ................................................................................................. 6
1.3.2 Anthropogenic Sources of Reef Degradation ..................................................................................... 7
1.4 Project Aims & Objectives .................................................................................................................. 9
1.5 Phase Achievements .............................................................................................................................. 9
2. Training ......................................................................................................................................................... 10
2.1 Briefing sessions ...................................................................................................................................... 10
2.2 Science lectures ....................................................................................................................................... 10
2.3 Field work training .................................................................................................................................. 11
2.4 BTEC and Other Qualifications ............................................................................................................... 11
3. Research Work Program ................................................................................................................................ 12
3.1 Baseline Survey of Coral Reef Health in Beqa Lagoon .......................................................................... 12
3.1.1. Introduction...................................................................................................................................... 12
3.1.2 Survey Areas ..................................................................................................................................... 13
3.1.3 Materials and Methods ..................................................................................................................... 15
3.1.4 Results .............................................................................................................................................. 17
3.1.5 Discussion ......................................................................................................................................... 20
3.2 Mangrove Mapping in Vaga Bay ............................................................................................................ 22
3.2.1. Introduction...................................................................................................................................... 22
3.2.2 Restoration Area ............................................................................................................................... 24
3.2.3. Materials and Method ...................................................................................................................... 26
3.2.4. Results ............................................................................................................................................. 27
3.2.5 Discussion ......................................................................................................................................... 28
3.3. Identifying Blacktip Reef Shark Nursery Grounds ................................................................................. 28
3.3.1. Introduction...................................................................................................................................... 29
3.3.2. Methodology .................................................................................................................................... 31
3.3.3. Results ............................................................................................................................................. 32
3.3.4. Discussion ........................................................................................................................................ 32
3.3.5 References......................................................................................................................................... 33
4. Acknowledgement ......................................................................................................................................... 39

1. Introduction
1.1 Frontier
Frontier, established in 1989, is a UK-based non-profit NGO. Its mission statement
is:
“to conserve the world’s most endangered wildlife and threatened habitats and
to build sustainable livelihoods for marginalised and under resourced communities
in the world’s poorest countries and to create solutions that are apolitical, forward-
thinking, community- driven and innovative, and which take into consideration the
long-term needs of low income communities”.
Frontier employs non-specialist volunteers, or Research Assistants (RA). Frontier’s
marine projects give RAs basic science and species identification training at the
beginning of their placement, to enable them to collect data on local fish, benthic and
invertebrate species. After working on Gau Island in Fiji conducting baseline surveys,
Frontier relocated to Beqa Island, south of mainland Fiji, in order to assess the status
of the coral reef systems around Beqa and within Beqa Lagoon.
1.2 Location
Fiji is an archipelago in the South Pacific Ocean composed of 332 islands and 500
islets and cays, with land mass occupying 18,376 km² (Cumming et al.,, 2002)
(Figure 1). Approximately one third of the islands are inhabited and, of these, the
two largest islands, Viti Levu and Vanua Levu, contain approximately 90% of Fiji’s
population (Vuki et al.,, 2000).
Figure 1: The Fiji Islands, Beqa circled in red (adapted from Veitayaki, 2006).

Beqa is a large island in the Fijian archipelago and lies within Beqa Lagoon
(Figure 2), with the coordinates 18°24’S 178°08’E. The island is located
approximately 10 km south of the main island of Viti Levu and has a population of
around 3,000 people. Nine villages are present on Beqa. These are Waisomo,
Lalati, Soliyaga, Dakuni, Dakuibeqa, Naceva, Naiseuseu, Rukua and Raviravi.
Figure 2: Beqa Island with surrounding barrier reef system (Google Earth)
Fiji is world renowned as the Soft Coral Capital of the World and is also home to
Beqa Lagoon, which is famous amongst divers. It features over 50 world class dive
sites and is frequented by numerous species of mega fauna, including dolphins,
whales, sharks, rays and turtles. The primary source of income on Beqa is tourism,
largely through recreational scuba diving. No large scale fishing, agriculture or
horticulture occurs and heavy industry is non-existent, therefore the reefs within
Beqa Lagoon are unaffected by the potential negative environmental impacts that
such industries can bring (FLMMA, 2013).
Fiji's coral reef fisheries are mainly inshore, small-scale subsistence and artisanal
fisheries and are therefore recognised as not receiving the management attention at a
national level. The total value of Fiji's subsistence and artisanal fisheries was US$64million
(FAO 2007). Of Fiji's 400 traditional fishing grounds (qoliqoli), around 70 are over-
expolited while 250 are fully developed (Teh et al.,, 2008). Various no-take or ‘tabu’
areas have been designated by chiefs of the villages to try to control extraction levels
as village population’s increase. The ‘tabu’ areas surrounding Beqa can be seen in
figure 3. Although village chiefs have no legal right to the reefs, they traditionally
lay claim to certain reefs within their territories and consequently have the power to
create ‘tabu’ areas on reefs of their choice in order to maintain populations of
N

targeted fish species for subsistence. This unofficial law is expected to be respected
and adhered to by all inhabitants of Beqa Island. Studies on other reefs elsewhere
have shown that similar traditional methods are an effective way to control and
sustainably manage harvest rates of marine resources (Hoffmann 2002).
Figure 3: Tabu areas around Beqa (FLMMA, 2013).
1.3 Background
Fiji is dependent on its low lying coastal regions for its socio-economic development
(Teh et al., 2008). This, like many other South Pacific islands, makes it extremely
vulnerable to climate change. Current predictions indicate a potential rise in global
sea levels of between 49.9cm to 1m by 2100 (Solomon et al., 2009). The frequency
of destructive environmental events is predicted to increase, occurring at a faster rate
than potential recovery (Hutchings et al., 2008). A rise of this size would cause
widespread devastation to Fiji's coastal infrastructure and would be a substantial
drain on Fiji's economy.
1.3.1 Natural Sources of Reef Degradation
Natural sources of coral reef degradation include cyclones, coral bleaching and
invasive predator outbreaks. 64% of all coral colonies surrounding Fiji suffered
mass bleaching in 2000 and in the southern areas of Viti Levu 84% of colonies
were affected (Cumming et al., 2002). Since 2002, significant damage has been
sustained on coral reefs within the Southwest Pacific region as a result of cyclones
(Lovell et al., 2004). More recently, severe tropical cyclone Winston made a

category 5 landfall over Fiji and was the strongest tropical cyclone to hit Fiji since
records began (Fritz, 2016). The impact of the cyclone towards reef health has not
yet been assessed. Coral predator outbreaks, specifically the Crown of Thorns
starfish (Acanthaster planci), have occurred on Fijian reefs since 1965, for periods
ranging from two to five years and continue to this day (Zann et al., 1990). This can
be attributed to natural fluctuations in availability of planktonic food, water salinity
levels and temperature (Lovell, 2001).
1.3.2 Anthropogenic Sources of Reef Degradation
The main anthropogenic sources of reef degradation include climate change,
overfishing, destructive fishing practices (such as dynamite fishing), poisoning,
pollution, deforestation and coral harvesting for the curio and marine aquarium trade
(Lovell 2001; Teh et al., 2008).
The fisheries sector is the third largest natural resource sector in Fiji. The main
sources of foreign exchange are the tourism industry (contributing 19% to GDP),
sugar industry (contributing 8.5%) and fisheries (contributing 2.5%). Understanding
the role of societal and economic factors on fishing is critical for designing
appropriate fisheries management strategies. Teh et al. (2008) produced an overview
of the socio-economic and ecological perspectives of Fiji’s inland reef fisheries. This
overview stated that there is not enough dependable data to ascertain the status of
Fiji’s reef-associated fisheries at national level.
Growing population and demand for fish since the 1990's has put continued pressure
on small scale fisheries. A socio-economic study carried out in the Beqa villages of
Rukua and Yanuca reported that, of the fish caught locally, 54% were consumed by
the local community while 46% were sold to a middleman/agent, presumably to an
outside source (MRIS, 2012). Common methods for targeting reef fish species
include: hand-line, spear, gillnet, seine net, hookah (diving with surface supplied air)
and reef gleaning (Teh et al., 2009). Of these methods, hand-lining and spearfishing
are used most frequently by residents of Rukua and Yanuca (MRIS, 2012).
Commercial fishing does not occur near the island of Beqa, however, overfishing in
other areas may have reduced population numbers to such an extent that emperors
species such as L. harak, L. xanthochilus, L nebulosus and B. muricatum are not
present or very rarely encountered. Other species such as the humphead parrotfish
(Bolbometopon muricatum), have now become almost completely extinct in Fijian
waters (Cumming et al., 2002). Lack of long term monitoring and limited technical
expertise hinders assessment of the coral reef fisheries. There have been numerous
site-specific studies yet no national level evaluation of Fiji's reef fisheries. To tackle
this at a national level, the Fisheries Division, Fiji Locally Managed Marine Areas
(FLMMA) and the University of the South Pacific have started facilitating coral reef
conservation initiatives by conducting socio-economic surveys of marine resource
use.
The marine aquarium trade inflicts reef degradation in a variety of ways. According
to Fiji's Fisheries Department annual estimate, 311,097 aquarium fish were exported
from Fiji in 2001. Convention of International Trade of Endangered Species (CITES)

database recorded that 169,143 ornamental fish and 31,900 invertebrates were
exported from Fiji in 2004 to overseas markets. It has also been reported that
between 2000 and 2004 annual live rock exports from Fiji increased from 800,000kg
in the year 2000 to 1.3million kg in 2004 (CITES, 2004). In 2001, a reported 800,000
kg of ‘live rock’ was harvested and exported (CITES 2004); however the actual
figure is likely much greater as a substantial quantity is lost in the trimming and
grading process (Lovell et al., 2004). Live rock exports are a major problem in Fiji as
it significantly diminishes reef ecosystems by reducing the number of available
spawning sites for marine species, reducing the buffer areas for sites of increased
wave action, and decreasing carbon dioxide sequestration by reducing the amount of
photosynthetic material in the marine environment. Although this has not been
observed around Beqa, likely due to tourism being the main activity, there is
potential for harvesting to occur in the future.
Pollution through sewage is a major threat to coral reefs in Fiji. Untreated sewage
deposited directly into the ocean causes increased levels of phosphates and
consequently macro algal blooms and eutrophication (Ginsberg 1994). Coral reefs
are unique in that they possess low levels of nutrients and are highly efficient at
recycling them. Consequently, they can cope with minor levels of eutrophication,
however, when marine ecosystems are highly enriched with chemical nutrients, the
result is excessive plant growth in the form of macro algae. Such algae are
detrimental to the health of the reef because they use all available oxygen within the
water column, causing fish populations to die off. In addition, these algal blooms
reduce the amount of light penetrating the water column, inhibiting coral
photosynthesis, subsequently causing rapid declines in reef system biodiversity
(Fabricius, 2005).
Unmanaged disposal of raw sewage is common in areas of dense population as well
as in popular tourist destinations. Villages on Beqa use pit latrines for sewage,
however, because they are close to the coast it is likely that nutrients leach through
the soil into the surrounding coastal waters and increase levels of phosphates and
nitrates, which in turn negatively affect near shore reefs. Not only is there an issue of
disposal of human waste, but each village also has at least one piggery, usually next
to a watercourse or at the top of the beach (pers. obs., 2016) leading to a heavy influx
of raw sewage into the ocean. It is also unclear how the resorts on Beqa manage their
waste, but it is likely that septic tanks are employed. Incidents of dumping on reefs
along the Coral Coast of Viti Levu, Mamanuca and Suva have been observed
(Mosley and Aalbersberg, 2002, Tamata and Thaman, 2001; Zann and Lovell, 1992).
Many families on Beqa lay claim to some plantation regions which they farm, both
for local consumption and trading as well as to sell on the mainland (MRIS, 2012). It
has been noted that there has been an increase in the area of land cleared using slash
and burn methodologies to make room for these farms (pers. comm., 2015). These
areas of clearing will increase sedimentation and the rate at which fresh water is
being leached onto the reef. Mangrove forests help stabilize shorelines, filter
freshwater run off and reduce the impact of natural disasters such as tsunamis and
hurricanes. In addition, many of the reef fish targeted for consumption are known to
depend on the mangroves for refuge from predators and for ontological development

(FAO, 2007, Giri et al., 2010). According to locals, the areas of mangroves have
significantly decreased and with the added impact of slash and burn techniques this
is likely to continue (pers comm, 2015).
1.4 Project Aims & Objectives
The overarching aim of the Fiji Marine Conservation project is to ascertain the health
of the reef through the use of baseline surveys in order to inform sustainable
management.
Baseline surveys will be used to;
1. Identify anthropogenic impacts on the reef system.
2. Determine the effect of the current locally managed marine areas.
3. Feed into national data collection objectives through Fiji Fisheries
Department and University of the South Pacific (USP)
4. Raise awareness and education of local people as to the importance of
sustained marine management techniques with the hope to assist with the
long term sustainable use of marine resources.
1.5 Phase Achievements
The overall objective of the phase was to expand the scope of data gathering and
engage more with the community;
Camp and logistics:
• Rebuild the toilet area with corrugated iron.
• Upgraded shower area.
Scientific Development:
• Submitted proposal to PADI for funding towards mangrove restoration.
• Pilot studies for black tip nursery sites.
• Working towards a partnership with Aquatrek.
• Further Crown of Thorns removals across all dive sites.
• Added another site to our regular fish and coral surveys.
• Improved training resources.
Community:
• Attended fundraising events for the community hall and church in Rukua.
• Attended staff sports day at Beqa Lagoon Resort.

2. Training
2.1 Briefing sessions
• Orientation – staff member takes new volunteers around camp.
• Bula and Welcome – staff member introduces all members of staff, other
volunteers and local Fijian family.
• Intro to duties – staff member shows new volunteers the rota and description
of duties and outlines what needs doing for each duty.
• Health and safety – staff member outlines important health and safety points
for camp and new volunteers and then take health and safety and medical
tests.
• Dive and Boat Safety – Dive Officer explains the possible hazards of diving
which may be encountered as well as safety equipment used in case of an
incident.
• Surface cover briefing – Dive Officer demonstrate procedure of surface cover
including emergency procedures such as emergency diver recall, deploying
the anchor, re-mooring the boat, and retrieving tired divers.
Briefing session Presenter
Orientation JG/TF
Bula and Welcome JG/TF
Intro to Duties JG/TF
Health and Safety JG/TF
Dive and Boat Safety LP
Surface Cover LP/KL
Table 1. Briefing sessions conducted during phase 164
2.2 Science lectures
Research assistants (RA’s), with the support of staff members, are fully responsible
for all data collection on FJM. Before RA’s were permitted to conduct surveys,
rigorous testing was undertaken. RA’s were given an array of lectures, computer ID
tests and in-water ID tests. A pass rate of 95% accuracy was required for theory tests
and only when theory and in-water ID tests have been completed were RA’s allowed
to start surveying. RA’s were then required to complete two practice surveys before
actual benthic and fish surveys could be undertaken and data recorded.
The science lectures given to guide learning are as follows;
• Introduction to Coral Reefs – coral reef biology, function and threats, most
common benthic forms found along transects, and how to conduct snorkel
survey.
• Mangrove Mapping – Introduction to mangroves and how to conduct transect
based surveys for mangrove mapping.

• Fish Survey Methodology – underwater techniques and processes involved in
conducting a fish survey
• Fish Anatomy – important parts of fish biology which will help identify
indicator and distinguishing features which separate families
• Indicator Fish Families – distinguishing features of indicator fish families.
• Indicator Fish Species – distinguishing features of indicator fish species
• Other Butterflies and Damsels – illustrate which species may get confused
with indicator species
• Shark Conservation – Introduction to shark conversation and threats.
• Blacktip reef sharks – information about our current pilot study.
Science Lectures Presenter
Introduction to Coral Reefs JG/TF
Mangrove Mapping JG
Fish Survey Methodology JG/TF
Fish Anatomy JG/TF
Indicator Fish Family JG/TF
Indicator Fish Species JG/TF
Other Butterflies and Damsels JG/TF
Shark Conservation KL
Blacktip Reef Sharks KL
Table 2. Science lectures conducted during phase 164
2.3 Field work training
The following computer ID tests were conducted before in-water tests:
• Fish families
• Indicator fish species
• Master test – encompassing indicators, families and others
A dry run of survey methodology and an underwater spot test was also conducted in
order to reinforce techniques before conducting in-water surveys.
2.4 BTEC and Other Qualifications
1. Name: Lucy Goodwin
Verification type: CoPE
Mentor: Jane Giat

3. Research Work Program
3.1 Baseline Survey of Coral Reef Health in Beqa Lagoon
3.1.1. Introduction
Beqa Island lies within Beqa Lagoon, 10 km south of the main island of Viti Levu.
The island is known for its traditional subsistence village lifestyles, as well as
hosting a number of tourism resorts (Burns, 1994). Fiji Fisheries department
currently monitor the area as part of their national monitoring plan, however, surveys
are only conducted once a year in different areas around Fiji due to personnel
restrictions.
The most comprehensive assessment conducted by Fisheries to date was a resource
survey for Yanuca and Rukua villages in 2012 by the Marine Resource Inventory
Survey (MRIS) team. The overall goal of this survey was to formulate and later
implement a management plan for sustainable use of the marine resources.
Methodologies included an underwater visual census and socio-economic surveys. It
was reported that the main source of income for villagers was fishing and that over
90% of villagers “always” or “sometimes” consumed fresh fish in a week. Also
recorded was the most common fish species caught per fishing trip, the top 5 being;
E.polyphekadion, L.harak, L.atkinsoni, C.ignobilis and L.gibbus (MRIS, 2012). The
survey identified that many of the marine inshore species that usually inhabit the
Beqa reef system are under threat due to the continued destruction of the reef system
through anthropogenic activities including; pollution from pig farms, reef-walking,
over-fishing, anchor damage and the use of destructive fishing methods. It was
reported that many of the reefs in the region have a major algae overgrowth problem
with large areas of reef totally covered by algae thought to be attributed to the
combination of sewage stimulating algae growth and lack of major algae grazers
from overfishing.
Indicator species are used to infer reef health trends. Indicator families (emperors,
butterflyfish, angelfish, damsel fish and barracudas) are identified to species level as
there are many interspecies variations. Angelfish show a preference for structurally
complex reefs and are not tolerant to fluctuations in physical variables such as
temperature, while barracudas are very tolerant due to ontological and seasonal shifts
in habitat range (Christine, 2010). Butterflyfish are very sensitive to reef degradation
and have species dependent feeding preferences (Carpenter and Allen, 1989). On the
other hand emperors display niche partitioning (Pratchett, 2005).

3.1.2 Survey Areas
Seven survey sites were used for reef data collection;
Table 3. Survey site coordinates Site Name GPS coordinates
Bikini S 18˚23’40.1”
E 178˚05’26.0”
Mala’s S 18˚24’10.5”
E 178˚05’58.2”
Rabbit S 18˚24’.07.5”
E 178˚06’09.9”
Vuvale S 18˚24’07.6”
E 178˚03’54.9”
Wreck Reef S 18˚22’48.22”
E 178˚05’18.3”
Snapper S 18˚24’56.7”
E 178˚04’04.4”
Milky Bar S 18˚23’46.3”
E 178˚5’53.2”
Bikini – A near-shore site (1.29 nautical miles from camp) protected from westerly
winds but is more prone to northerly, southerly and easterly winds. Average depth is
7.5m and a gentle slope drops down to a depth of 20 m on the outer reef. Bikini is
outside of Vaqa Bay and so will encounter freshwater dissipating out of the bay and
also from the local village of Rukua. The site is rarely visited by Beqa Lagoon Resort
for tourism. Bikini is a no take zone and so only fished on rare occasions when the
chief opens the site for fishing for celebrations or funerals.
Mala’s – An inshore site (0.56 nautical miles from camp) found within Vaqa Bay and
relatively protected from southerly and easterly winds. It is an estuarine environment
with three freshwater streams flowing into it. The majority of the reef is at around 8
m, whereas the outer reef is at around 18 m. It is near the local village of Naiseuseu
and the site is not visited for tourism and is a non-tabu area. Targeted fish include
parrotfish, unicornfish, porcupinefish, rabbitfish, surgeonfish and goatfish.
Rabbit – An inshore site (0.44 nautical miles from camp) located within Vaqa Bay
close to river outflows. The site is generally shallow with an average depth of 6 m
dropping down to 12 m at the reef edge. The site is not visited for tourism and is a
no-take zone.
Vuvale – an offshore site (2.53 nautical miles from camp) relatively protected from
south easterly, easterly and north easterly winds and usually is not subjected to strong
currents. The reef is extremely large, comprising of numerous patch reefs and coral
bommies. The average depth is around 8 m dropping down to 16 m at the reef’s edge.
Vuvale is located far away from Beqa and can be difficult to get to because of rough
weather conditions. It will encounter no freshwater and there can often be strong
currents. The site is not visited for tourism.

Wreck Reef – a nearshore site (1.97 nautical miles from camp) very exposed with a
purpose sunk wreck is located on the seabed just off the reef at a depth of 22 m. The
reef has an average depth of 8 m, however, the edge of the reef has a steep drop off
down to a depth of 22 m. There can be strong currents present, however, the site is
far enough away from freshwater sources to not be affected by dissipation. The site
is rarely visited by Beqa Lagoon Resort for tourism or fishing by the locals.
Snapper – An offshore site (2.42 nautical miles from camp) relatively protected from
south easterly and north easterly winds. The reef has as average depth of 8.5 m with
a drop off to 15 m at the reef edge. Six large coral bommies surround the mooring
line with depths ranging 3-6 m. Transects are places on patch reefs with areas of
sand.
Milky Bar – A nearshore site just at the mouth of Vaga Bay (0.88 nautical miles from
camp). It is relatively exposed to the prevailing winds and has high tourist pressure,
with a boat coming every day to take around 20 passengers to the secluded beach.
The majority of the reef here is very shallow, between 1 and 5 metres deep, but drops
off quickly as you move away from the beach down to 18 metres. It is often fished
when the resort boat leaves the area.
Figure 4. Map of survey sites and FJM basecamp
3.1.3 Materials and Methods
Baseline Survey Protocol (BSP) was used following standardised Reef Check
methodology (Hodgson, 2001). In order to initially set up the permanent transects,
fifty metre survey tapes were used to create transect lines spaced 10 m apart. Four
permanent transect sites were set up at each of the survey sites and highly visible
markers deployed in order to allow RAs to easily locate the transect start points.
Transect bearings were kept consistent in order to obtain independent samples to be
replicated at each site. Transect lines were laid for a total length of 50 m and this
permitted 2 x 20 metre transects to be completed separated by a 10 m gap.
3.1.3.1. Indicator Fish Species Survey
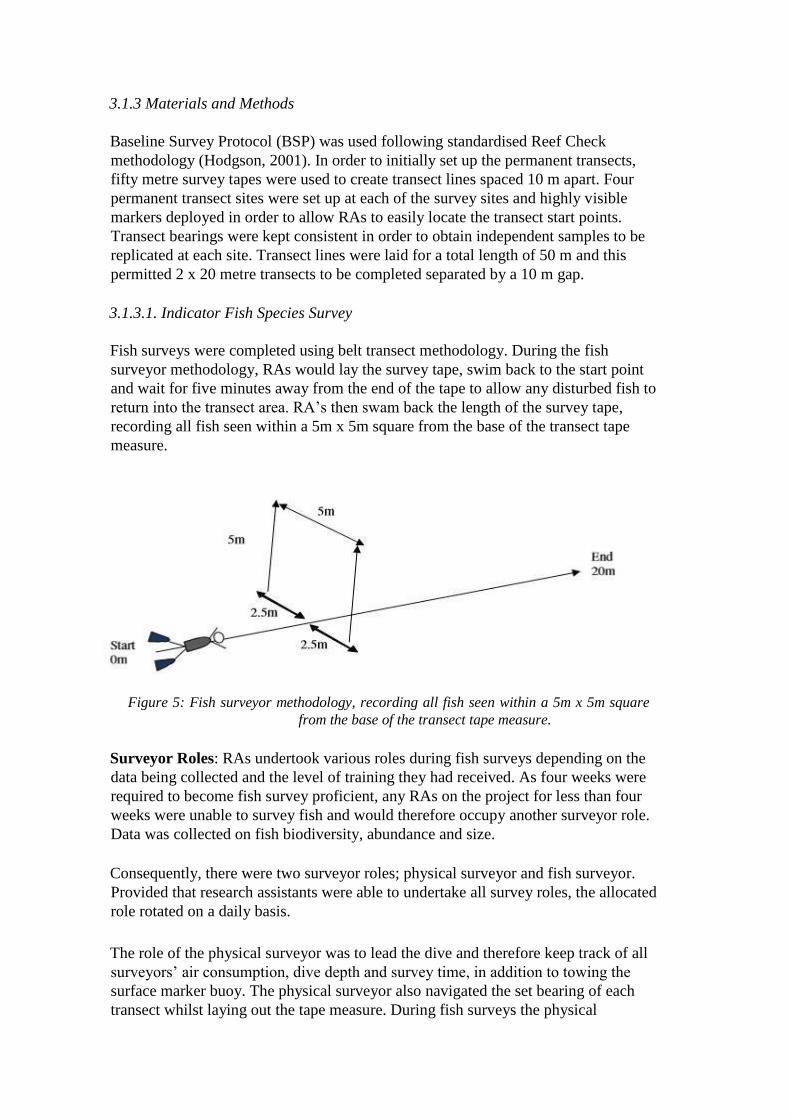
Fish surveys were completed using belt transect methodology. During the fish
surveyor methodology, RAs would lay the survey tape, swim back to the start point
and wait for five minutes away from the end of the tape to allow any disturbed fish to
return into the transect area. RA’s then swam back the length of the survey tape,
recording all fish seen within a 5m x 5m square from the base of the transect tape
measure.
Figure 5: Fish surveyor methodology, recording all fish seen within a 5m x 5m square
from the base of the transect tape measure.
Surveyor Roles: RAs undertook various roles during fish surveys depending on the
data being collected and the level of training they had received. As four weeks were
required to become fish survey proficient, any RAs on the project for less than four
weeks were unable to survey fish and would therefore occupy another surveyor role.
Data was collected on fish biodiversity, abundance and size.
Consequently, there were two surveyor roles; physical surveyor and fish surveyor.
Provided that research assistants were able to undertake all survey roles, the allocated
role rotated on a daily basis.
The role of the physical surveyor was to lead the dive and therefore keep track of all
surveyors’ air consumption, dive depth and survey time, in addition to towing the
surface marker buoy. The physical surveyor also navigated the set bearing of each
transect whilst laying out the tape measure. During fish surveys the physical

surveyor remained behind the fish surveyor to reduce disturbance to the fish within
the transect area. On completion of the survey the physical surveyor reeled in the
tape.
Fish species richness, abundance and size were recorded. Research assistants learn
forty-five indicator species and twenty other fish families. Fish size was recorded in
categories; 1-10 cm, 11-20 cm, 21-30 cm, 31-40 cm, 41-50 cm and >50 cm. When a
fish surveyor encountered a large school of fish, the abundance was estimated and
recorded in the most common average size category. Upon completion of a survey
dive, RAs directly enter their survey data into the master database.
3.1.3.2. Benthic Lifeform Survey
Medium-scale monitoring is used to assess the occurrence of coral recruitment and
composition of the underlying benthos. During this survey RAs will lay their survey tape,
swim back to the starting point. They will lay down a 50 cm x 50 cm quadrant every 5 metres,
producing 10 recorded quadrants per transect, recording the benthic composition within each
quadrant.
Surveyor Roles: RAs undertook various roles during benthic surveys depending on
the data being collected and the level of training they had received. As benthic
lifeforms are much easier to learn than fish identification, RAs that are on project for
four weeks or less will be able to carry out the survey.
Consequently, there were two surveyor roles; quadrant holder and data recorder.
Provided that research assistants were able to undertake all survey roles, the allocated
role rotated on a daily basis.
The role of the quadrant holder was to lead the dive and therefore keep track of all surveyors’
air consumption, dive depth and survey time, in addition to navigating bearings. Quadrant
holder will hold the quadrant every 5 metres while the data recorder counts the live benthic
cover and underlying substratum. The following data will be collected along each transect:
1) Live benthic cover recorded at 5m intervals, producing 10 recorded quadrant per transect.
Scleractinian corals will be categorized as: Branching, Corymbose, Encrusting, Foliaceous,
Massive, Tabular, Columnar, or Laminar.
2) Underlying substratum (i.e., sand, rock, live rock, rubble, or dead coral) quantified at 5 m
intervals.
This survey can be taken together with the fish indicator species survey by combining the role
of physical surveyor and quadrant holder.

3.1.4 Results
3.1.4.1. Indicator Fish Species Survey
The data obtained from the fish surveys carried out during October-December 2016 was
analysed at three different levels – indicator families, indicator species and total averages,
broken down into size classes (in increments of 10 cm), whilst considering a series of
explanatory factors – distance from shore, fishing restrictions and the differences between
sites.
Average total fish abundance was significantly higher in the offshore than the near shore and
the inshore sites (X-squared = 23.101, df = 2, p-value < 0.001) (Figure 6). Fish family
abundance was higher in the near shore than the offshore (though not statistically significant (
X-squared = 1.085, df = 2, p-value = 0.5813). Fish species abundance was consistent with total
fish (X-squared = 26.667, df = 2, p-value < 0.001).
Figure 6. Average total fish abundance according to distance from shore.
Fishing restriction doesn’t appear to have an effect on the average fish abundance, with no
significant difference between tabu and non-tabu areas, for either average family, species or
total abundances (P-value > 0.05).
When analysing average abundances based on sites (Figure 7), Snapper, Wreck Reef and
Vuvale show the highest total abundance (X-squared = 81.98, df = 6, p-value < 0.001) and
species abundance (X-squared = 89.338, df = 6, p-value < 0.001), though average family
abundance is higher in Bikini and Wreck Reef (however no significance was proved for this,
p-value > 0.05).

Figure 7. Average total fish abundance according to site
Average abundances based on size classes. On the family level, except for Snapper, the
dominant size range is <10 cm. At Snapper, there are more fish between 11-20 cm (Figure 8).
Total fish abundance (Figure 9), as well as species and family abundances are highest in the
<10 cm size class, as proved by analyses of variance (ANOVA) performed at each level –
family (F = 23.55, p-value < 0.001), species (F = 13.8, p-value < 0.001) and total (F = 16.98,
p-value < 0.001).
Figure 8. Average fish family abundance according to sites, distributed along size classes.
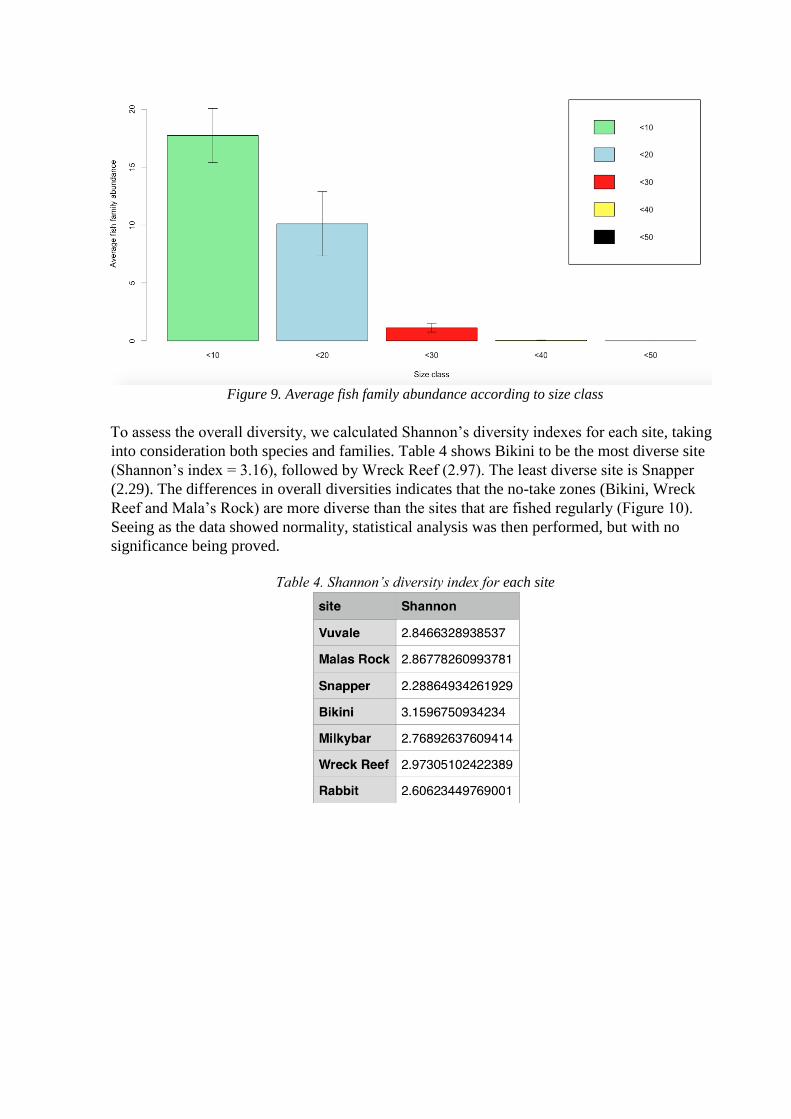
Figure 9. Average fish family abundance according to size class
To assess the overall diversity, we calculated Shannon’s diversity indexes for each site, taking
into consideration both species and families. Table 4 shows Bikini to be the most diverse site
(Shannon’s index = 3.16), followed by Wreck Reef (2.97). The least diverse site is Snapper
(2.29). The differences in overall diversities indicates that the no-take zones (Bikini, Wreck
Reef and Mala’s Rock) are more diverse than the sites that are fished regularly (Figure 10).
Seeing as the data showed normality, statistical analysis was then performed, but with no
significance being proved.
Table 4. Shannon’s diversity index for each site

Figure 10. Shannon’s diversity index in relation to fishing restriction
3.1.4.2. Benthic Lifeform Survey
During this quarter we carried on the training of RA’s on benthic lifeforms. However, no conclusive
data was recorded. It is an aim for the next phase to enhance the benthic composition surveying of our
sites, focusing not only on coral morphologies, but taking into consideration other life forms such as
sponges etc.
3.1.5 Discussion
Indicator families are defined as families that use the reef primarily for recruitment,
protection and food, seldom straying from their respective territories. Although they are not
commercially important, their presence is indicative of a healthy reef (Hourigan et al., 1988).
Indicator families are identified down to species level for those that are most commonly seen
on survey sites. This covers 4 species of angelfish, 18 species of butterfly fish, 2 species of
barracuda, 4 species of emperor and 17 damsels. There are however “others” encountered of
these families during surveying.
Average fish abundance was recorded to be highest at Snapper, Wreck Reef and Vuvale.
Two of these sites (Snapper and Vuvale) are offshore sites and therefore are likely to
encounter lower levels of disturbance from boat traffic and are less accessible for fishing. In
addition, offshore sites are not as likely to encounter salinity, sediment, nitrate and phosphate
fluctuations as would be present at inshore sites due to their proximity to freshwater run off.
One of the inshore sites, Rabbit, showed the lowest average abundance of fish per transect.
Inshore sites are closer to areas of mangroves that are known to be vital habitats for juvenile
reef fish, which may account for there being a comparable number of families present to the
offshore sites which many fish will migrate to as they mature (FAO 2007). Of the indicator
species used, angelfish are the least tolerant to fluctuations in physical variables, especially
temperature, as a temperature increase to 27 degrees Celsius triggers gamete release

(Olivotto et al., 2006). Angelfish were recorded to be in higher abundance at near-shore and
offshore sites, which supports the idea that these sites are less influenced by fluctuating
physical factors. Lower abundances of angelfish were found at inshore sites where these
fluctuations will be higher. To confirm the differences in these fluctuations between near
shore, offshore and inshore sites water quality testing would need to be conducted.
The lower abundance of fish stock identified during this quarter at the inshore sites can
further be explained by the more intense variations in freshwater input. As Fiji experiences
heavy rainfall in the wet season (November-April), that only intensifies the fluctuations in
the chemical properties of the more estuarine environments. Additionally, most of the
indicator species that are used for this study (angelfish, butterflyfish and especially
damselfish) are typically more territorial fish (Ormond et al., 1996). This would imply that
they are more resilient to changes in the water chemical composition, unlike the targeted
indicator families which are highly migrant and therefore more likely to choose better, more
stable conditions found at the near or off shore sites.
Our furthest sites (Wreck, Vuvale, Snapper) seem to have significantly more species than our
closest sites (Rabbit, Mala’s Rock, Bikini). There is also the high possibility that Beqa
lagoon has transient fish species that use the further reefs as either breeding or hunting
grounds (Cohen & Alexander, 2013). Because of this the enforcement of the no take area or
“tabu” area is essential to help the recovery of fish stock.
Interestingly enough, no significant difference in fish abundances was found in relation to
fishing regulation, with both tabu and non-tabu areas showing fairly equal average values of
abundances on family, species and total levels. Coral reefs are known to be habitats that
sustain a very large amount of biomass compared to adjacent open water areas (McClanahan
et al., 2016). This can explain why the overall abundance would not change significantly in
relation to fishing pressure, as the open space created by removing certain targeted species
would soon be occupied by other species, through intricate ecological processes such as
larval recruitment, post-settlement competition, predation regulation or the lottery
competition for territories (Sale, 1974; Hixon, 1991).
The analyses performed on fish abundances at each site based on size classes showed an
unexpected result at Snapper, in comparison to all of the other sites. While the overall
dominant range is 0-10 cm, at Snapper the average family abundance was mostly found in
the 11-20 cm class. This difference came from vastly larger numbers of parrotfish and
goatfish. Due to the location of our survey transects at Snapper, there are a high amount of
territorial goatfish schools that will shift the data towards a much higher family abundance.
Goatfish have been shown to maintain a certain territory with favourable conditions as a
home range rather than migrate to other sites (Uiblein, 2007). Given the relative stability of
the habitat at Snapper, it is then expected that larger adults (between 11 and 20 cm) would
inhabit the reef for an extended amount of time, especially at the beginning of summer
(November- December), since that is also the start of the breeding season.
Additionally, as most of our surveys at Snapper were done towards the end of the quarter,
there could be potential bias in our data, since this period coincides with the breeding season
of certain parrotfish species. Muñoz et al. (2014), have identified that in some species of the
Scaridae family, the adults tend to congregate in harems consisting of one larger male
(usually >20 cm) and a few slightly smaller females (<20 cm) according to the lunar phase.
To eliminate this type of bias in our data for future phases we aim to plan a more evenly
scheduled surveying dates.

Sites closer to shore (such as Rabbit or Mala’s Rock) are also more likely to be inhabited by
smaller species, as it is known that most coral reef associated fish use the mangrove –
seagrass – coral reef habitat connectivity mosaic (Sheaves, 2009). Mala’s and Rabbit are both
within very short range (~0.5 nautical miles) of mangrove forests and seagrass beds (pers obs
2016) so smaller, younger fish are likely to be encountered as they shift towards further sites
that are then far more likely to be used as breeding grounds for larger adults.
The shift in fish size ranges that dominate the reef is also consistent with effect of fishing
pressure. As large top predators are removed from the area (as indicated by the lack of fish
>30 cm surveyed and the decrease of large fish families) there will be an increase in mid-
sized (11 – 20 cm) fish species observed (Jackson et al., 2001). This is a major shift in
ecological top-down interaction. However in this quarter, similarly to previous quarters, the
dominating size class is < 10 cm. This is similar to last year’s reports giving more support to
seasonal effect in fish sizes assemblage (Cohen & Alexander 2013).
A diversity index is a quantitative measure that reflects how many different types (such as
species) there are in a dataset, and simultaneously takes into account how evenly the basic
entities (such as individuals) are distributed among those types. The value of a diversity
index increases both when the number of types increases and when evenness increases. For a
given number of types, the value of a diversity index is maximized when all types are equally
abundant. The results of this analysis show that two of the near-shore sites, Bikini and Wreck
Reef, show the highest diversity. It is much easier to interpret these findings when
considering the fishing restrictions on the survey sites. Out of the seven sites that have been
monitored during this quarter, three of them belong to traditionally tabu areas. Fishing is
prohibited by local management practices at Bikini, Wreck Reef and Mala’s Rock, while the
other four (Rabbit, Milkybar, Snapper and Vuvale) are open to fishing. The no-take zones
show the highest overall diversities, which is a strong indication that fishing pressure has a
strong effect on the composition of fish populations on the reefs. This could mean that “tabu”
areas in Beqa may be effective in recovering fish stock. There are many instances where
locally managed marine protected areas have been essential to the health of the reef. This is
good news for the reef system in Beqa. The management procedures employed by local
communities has shown to maintain and encourage a healthy ecosystems in terms of overall
diversity
Aims for the next studies in the coming phase include a thorough assessment of the list of
targeted indicator families and species on the fish surveys, developing the benthic life form
project by focusing on a survey protocol that would allow to get a better picture of the
composition of the sites and potentially identifying new survey sites. Preliminary exploratory
dives in areas that FJM is not typically visiting indicate promising results. Ideally, an even
number of tabu and non-tabu sites in each of the distance classes (inshore, near-shore and
off-shore). Also, seeing as Beqa lagoon expands over a much larger area than we generally
have access to, we aim to improve our relationships with other villages on the island so that
we could get permission to regularly visit a series of other sites.
3.2 Mangrove Mapping in Vaga Bay
3.2.1. Introduction

Mangrove forests occur on low energy, sedimentary shorelines of the tropics, between mean
tide and high tide elevations (Molony et al., 1995). Mangrove trees have physiological and
morphological adaptations to the environmental stresses of their intertidal habitat, of high
salinity, low oxygen, poor nutrient availability and substrate mobility (Duggan, 2003). These
cause different mangrove species to prefer a particular elevation between mean tide and high
tide. True mangrove species occur exclusively in this saline wetland environment, with
adaptations such as aerial roots and halophytic strategies (Molony et al., 1995, Duggan 2003).
Mangrove ecosystems provide a useful buffer between the land and the sea. Mangrove forests
are a sink for sediment and nutrient-rich runoff, protecting nearshore waters from
eutrophication and turbidity to benefit seagrass and coral reef health (Peters et al., 1997). They
also provide protection of the land from marine inundation during storms. Mangroves have
been shown to be important fish habitats, particularly functioning as a fish nursery (Lal et al.,
1984). Mangroves sustain a food chain within the mangrove habitat, and tidal export of
mangrove material supports offshore food chains (Ley et al., 2002). Many species of fishes,
crustaceans, molluscs, amphibians, reptiles and birds are found in mangroves (Lal et al., 1984,
Ley et al., 2002)
Mangrove wetlands are one of the most threatened natural communities worldwide, with about
50% of the global area lost since 1900, and 35% of the global area lost in the past two decades
(FAO, 2003; Spalding et al., 2010). Human activities remain a major cause of degradation and
loss of mangrove ecosystems in all parts of the world, including the Pacific Islands region
(Polidero et al., 2010). Monitoring will measure mangrove extent and condition, and allow
mangrove ecosystems to be conserved and managed sustainably to maintain their
environmental, ecological, and socioeconomic benefits.
Mangrove ecosystems are also sensitive to climate change impacts, particularly to associated
relative sea level rise. Inter-tidal mangroves are most extensively developed on sedimentary
shorelines, where mud accretion determines their ability to keep up with sea-level rise
(Gillman et al., 2008). The IPCC 4th Assessment projected a global sea level rise of 0.18-0.59
m by 2099 (1.5-9.7 mm per year), and mangrove accretion rates are usually less than this,
resulting in dieback at the seaward edge, and inland recruitment. Rise in temperature and the
effects of increased CO2 levels should increase mangrove productivity, change phenological
patterns, and continue expansion of mangrove species ranges into higher latitudes (Gillman et
al., 2008).
Fiji has the third largest mangrove area in the Pacific Island region, after PNG and the
Solomon Islands. Mangrove areas are one of the better wetland types inventoried in the Pacific
Islands (particularly Fiji), though the information sources are fairly dated (Watkins, 1999). The
mangrove area was estimated by Spalding et al., (1997) from a forest cover map prepared by
the Ministry of Forests, Fiji based on a 1985 survey, with mangroves distinguished using the
Fiji Forest Inventory carried out in 1966-9. This gave a total mangrove area for Fiji of 517km2.
Largest areas are on the SE and NW Viti Levu shorelines, and the northern shore of Vanua
Levu (Richmond and Ackermann, 1974). Only 19.7 km2 of mangrove was recorded for Fiji by
Saenger et al., (1983).

Rehabilitation of degraded mangrove and inshore reef areas will increase their resilience to
climate change effects. Site selection should consider value for money, the level of community
or stakeholder support, benefits to adjacent systems and the relative risk of sea-level rise. Any
rehabilitation program should initially remove the stress that caused decline, decide on whether
to use natural regeneration or active replanting techniques, in which case use of local sources
of seeds or juveniles will reduce loss of genetic variation across Fiji.
3.2.2 Restoration Area
A survey done by the WWF (2014) showed that Beqa Island is one of the major mangrove
habitat in Fiji, housing approximately 0.72 km2 of mangrove. Vaga bay is the largest bay on
the west side of Beqa Island. It is approximately 1.2 km wide and 1.5 km deep inshore. There
is mangrove wetland present along the inside of the bay which is the characteristic of the
sheltered bay area. There are two villages in the bay: Rukua which is located on the north part
at the mouth of the bay and Naiseuseu which is located in the south part inside the bay. Both of
these villages fish in the bay as part of their livelihood. Mangroves have been shown to be
important fish habitats, particularly functioning as a fish nursery, therefore it is beneficial to
restore the mangrove wetlands in the Bay.
Figure 11. Aerial photograph of planned restoration area in Vaqa Bay, Beqa Island, marked by red
square. Frontier Fiji Marine basecamp marked by red pin. (Source: Google Maps)
Approximately 12.600 m2 of Mangroves wetland was mapped throughout the 161 and 162
quarters. Four species of true mangroves and one species of associate mangroves have been
found (Figure 12). Two genera of true mangroves are found in the wetland: black mangroves
(Bruguiera gymnorhiza) and the red mangroves (Rhizopora stylosa, Rhizopora samoensis, and
Rhizopora x selala). The one associate mangrove species (Barringtonia asciata) is found by

the high tide line and cover approximately 11% of the wetland. Canopy cover are mostly
uniform with only 5% of bare patch throughout the area. Damage observed on the trees is
mostly storm damage. High tide mark varies around 50 – 60 cm on the landward edge and
around 90 – 110 cm on the seaward edge. Seaward edge is littered with recruitments; most of
them are black mangroves.
Figure 12. Distribution of Mangrove Species in Vaga Bay
Restoration area is planned on 1,032 m2 of bare wetland on the north side of present
mangroves (Figure 11). The area is divided into 4 zones, in which zones 1 -3 will be
restoration area and zone 4 will be nursery area where we grow propagules up to transplantable
size (Figure 13). The zones are further divided into seaward and landward zones. Red
mangroves (Rhizopora spp.) will be planted on the seaward zones while black mangroves
(Bruguiera spp.) will be planted on the landward zones following the pattern of present
mangroves. Walls are built to protect propagules from wave action and to retain nutrients from
land, with gaps to allow circulation. Freshwater is provided by a creek on the north side of the
mudflat. Regular rainfall will also help provide freshwater necessary for the propagule to grow.
9%
7%
21%
47%
11% 5%
Rhizopora stylosa
Rhizopora samoensis
Rhizopora x selala
Bruguiera gymnorhiza
Barringtonia asciata
Bare

Figure 13. Plan for mangrove restoration area in Vaga Bay
3.2.3. Materials and Method
3.2.3.1. Wall building
The walls are built by stacking rocks in a chicken wire frame. Each wall will be 10 m in length,
75 cm in height, and 50 cm thick. The rocks for the wall will be collected from the beach and
creek area. This method will allow water move through the small gaps on the wall while
protect against wave action effectively.
3.2.3.2. Propagule collection
RAs are deployed in groups of 4 on mid tide and comb the tideline for viable red and black
mangroves propagules (Figure 14). Viable propagules have visible budding and form root
nubs, the body of the propagules should be whole without cuts or gouges. After collection the
propagules are incubated in freshwater for 2-3 days before planting to check for viability. Only
viable red mangroves propagules were collected in 163.

Figure 14. Viable and non-viable mangroves propagules
3.2.3.2. Planting
Red mangroves propagules will be planted in a row approximately 1 m apart from each other.
Approximately 10 – 12 rows will be planted on every seaward zone. Since black mangroves
grown naturally sparser than red mangroves, propagules will be planted in a row
approximately 3 m apart from each other. Approximately 3 – 4 rows will be planted on every
landward zone. Circle of small rock will be arranged around each propagule to assist in rooting
and second protection against wave action aside from the wall.
3.2.4. Results
The wall in Zone 1 is under construction. So far it is 10 m long, 40 cm high and 30 cm thick.
Current wall is not held together by chicken wire and will have to be reconstructed in the near
future.
One hundred and twelve viable red mangrove propagules are collected and planted in zone 1
seaward at the beginning of 163. Monthly survey to observe the survival rate of the propagules
showed that ~60% of the propagules survived the quarter and are growing healthy leaves
(Figure 15).
Red Mangrove Black Mangrove
Non-viable Viable Non-viable Viable

Figure 15. Propagules survival rate
3.2.5 Discussion
From the survival rate of propagules in this quarter, the current wall seems to provide enough
protection from the wave action. However, studies have shown that mangroves propagules will
be able to survive wave action after they reach ±1m in height (Robertson & Alongi 1992, Allen
& Duke 2006), therefore adding up to the wall until it is 75 cm at least will increase the
survival rate of the propagules even more. Holding together the wall with the chicken wire will
also help the wall to stay together in the occasion of strong wave action (Pers comm. 2016)
The mangrove wetland seems to be healthy with uniform canopy cover. This indicates that the
area was relatively free of direct anthropogenic impact such as piggeries, garbage, or illegal
cutting (IPCC 2007). The wetland also produces a good amount of viable propagules that are
readily accessible for the restoration effort. This is obvious in the more than one hundred
viable propagules collected within one month. Studies show that propagules from nearby
mangroves are more likely to survive when planted as the environment has already proven to
be able to sustain the growth of the mangroves (Prance 2001, Allen & Duke 2006, Spalding et
al., 2010).
The average survival rate of propagules in the wild is 15% within the first two months (Smith
1992, Sheue et al., 2005). The average survival of propagules in restoration project in Fiji
varies greatly. The restoration in Lambasa, Vanua Levu have 30% survival rate within the first
two months (Molony & Sheaves 1995) and the restoration in Sigatoka, Viti Levu has 55%
survival rates (Krauss et al., 2014). Based on this, the survival rate of our propagules is very
high. This restoration effort has good chance to completely restore the mangroves in the area
within 3 – 4 years.
3.3. Identifying Blacktip Reef Shark Nursery Grounds
0
20
40
60
80
100
120
July August September
Nu
mb
er
of
Prp
agu
les
on
Zo
ne
1
Propagules Survival

3.3.1. Introduction
Fijian waters play host to a wide variety of elasmobranch species; from large, highly migratory
sharks to coastal dwelling rays and reef sharks. Beqa Island is known globally for precisely
this reason.
Blacktip reef sharks, Carcharhinus melanopterus, are commonly sighted around Beqa and are
an extremely important predator within reef systems globally (Papastamatiou et al., 2009a).
They are a coastal species found in tropical and sub-tropical reef systems (Fowler et al., 2005).
They can reach a maximum length of 1.8m with females growing larger than males (Mourier
& Planes, 2013a) and are easily recognised by prominent black tips on the fins, especially the
first dorsal and caudal fin. They favour shallow sand flats and coral reefs, using reef systems
as primary hunting grounds. Blacktips are apex predators in many reef systems (Mourier et al.,
2013), including those in Beqa lagoon. This allows them to exert top-down effects on the
ecosystem, having an above average effect on ecosystem processes. This makes it imperative
to protect them in order to preserve the health of the reef and its associated species.
Globally, elasmobranch species are in a state of severe population decline (Fowler et al.,
2005). The IUCN 2014 Red List classed blacktip reef sharks as 'near threatened' in their 2014
review (Dulvy et al., 2014). The main causes for decline in blacktips are fishing pressure, both
for meat and fins, and through bycatch. However, sharks in Fiji are relatively well protected.
Fijian culture dictates that sharks are sacred and are forbidden to be caught in numerous
villages (Rasalato et al., 2010). The local people of Beqa and Yanuca in particular recognize a
shark god, Dakuwaga, and there is a lot of superstition surrounding the harming of sharks
(pers. comm., 2016). However, Fijian shark populations may still be threatened by foreign
fishing vessels in their waters and the demand for shark fins internationally.
An effective way to protect a species is to focus conservation efforts upon areas of key
ecological significance; for example nursery grounds (Hueter et al., 2005). The concept of
nursery ground use by some elasmobranch species has been widely recognized in scientific
literature for decades (Heupel et al., 2007). These are generally classed as 'an area where
young are born and reside as they grow towards maturity' (Heupel et al., 2007), which is a
common life history strategy in many fish species (MSEL, 2014). Genetic studies have
identified this behaviour in black tip reef sharks in French Polynesia (Mourier & Planes,
2012). Natal philopatry has also been identified within the species whereby females return to
the same area for parturition, although they tend to stay within the area of the island that their
home range is associated with (Mourier & Planes, 2013; Porcher, 2005). Blacktip reef sharks
in particular have very small home ranges with high site fidelity (Papastamatiou et al. 2009b),
suggesting at least one nursery area must be present around Beqa island and the surrounding
lagoon. This phenomenon results in genetic heterogeneity between sub-populations meaning
that each individual stock requires protection to preserve species genetic diversity (Hueter et
al., 2005).
However, there is no definitive method for correctly identifying a nursery area. Heupel et al.,
(2007) proposes classifying it under three key characteristics:
• Sharks are more commonly encountered in the area than other areas
• Sharks have a tendency to remain or return for extended periods
• The area or habitat is repeatedly used across years
These are widely accepted characteristics of elasmobranch nursery grounds and will be
referred to regularly throughout this study. It is also important to account for the size ratio of
the population when identifying nursery areas. If the population in the proposed area has a
high proportion of juveniles it will also be an indicator of a nursery ground (Duncan et al.,
2006).
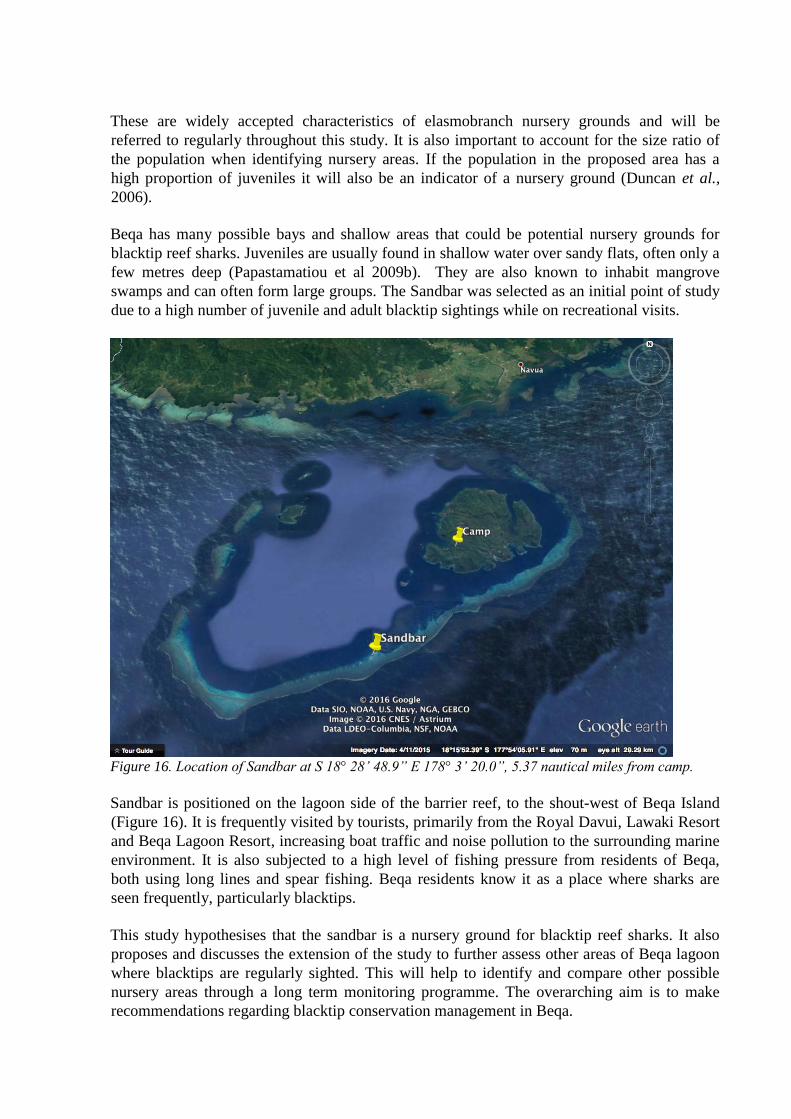
Beqa has many possible bays and shallow areas that could be potential nursery grounds for
blacktip reef sharks. Juveniles are usually found in shallow water over sandy flats, often only a
few metres deep (Papastamatiou et al 2009b). They are also known to inhabit mangrove
swamps and can often form large groups. The Sandbar was selected as an initial point of study
due to a high number of juvenile and adult blacktip sightings while on recreational visits.
Figure 16. Location of Sandbar at S 18° 28’ 48.9” E 178° 3’ 20.0”, 5.37 nautical miles from camp.
Sandbar is positioned on the lagoon side of the barrier reef, to the shout-west of Beqa Island
(Figure 16). It is frequently visited by tourists, primarily from the Royal Davui, Lawaki Resort
and Beqa Lagoon Resort, increasing boat traffic and noise pollution to the surrounding marine
environment. It is also subjected to a high level of fishing pressure from residents of Beqa,
both using long lines and spear fishing. Beqa residents know it as a place where sharks are
seen frequently, particularly blacktips.
This study hypothesises that the sandbar is a nursery ground for blacktip reef sharks. It also
proposes and discusses the extension of the study to further assess other areas of Beqa lagoon
where blacktips are regularly sighted. This will help to identify and compare other possible
nursery areas through a long term monitoring programme. The overarching aim is to make
recommendations regarding blacktip conservation management in Beqa.

3.3.2. Methodology
Following selection of the sandbar as one of the initial study sites, 3 trips have been conducted
so far for reconnaissance and to work out the finer points of the methodology. Initially, the
sandbar was divided into two study areas as their depth and topographies vary significantly
(Table 5). Both sites extend for 50m from the edges of the sandbar.
Site Depth Range
(m)
Topography
Sandbar 1 – facing barrier reef 0.5 – 2.5 Mainly reef with occasional
sandy patches, small wreck
close to barrier
Sandbar 2 – facing Beqa Island 0.5 - 14 Large sandy area with the
occasional coral bommies
Table 5: Survey site specifics
Snorkel surveys were deemed most appropriate due to the relatively shallow depth ranges of
the sites. It is also less disruptive without the bubbles, and therefore the noise, generated by the
use of scuba; in fact sharks are seen on our dive sites more often by snorkelers than divers
(pers. obs. 2016).
For the initial reconnaissance trip, it was decided to split the 2 sides of the sandbar into 4
sections. There was one snorkeler per section and we used a sweeping method to firstly assess
the site for suitability by looking at the various habitat types found in the area, and to look out
for any black tips in the area. Surveyors carried a slate to record any sightings; upon sighting a
blacktip shark during their session, surveyors were to record the estimated size of the shark,
distance from the surveyor to the shark and any physical characteristics that may be used to
identify the individuals, for example scars or unusual markings. Length estimate can give an
idea of sexual maturity. At birth, blacktips range from 30-50 cm, mature between 90-110cm
and reach a total length of up to 1.8m (Compagno 1984, Stevens 1984, Last and Stevens
1994). This can be used to identify individuals as juveniles, adolescents or adults. They also
record any other shark species seen as this can also give information about the likelihood of
there being blacktips in the area. There is often interspecific competition between
elasmobranch species (Papastamatiou et al., 2006), so the presence of whitetips (or other
species) could suggest lower chances of encountering blacktips.
Following the initial survey, the effectiveness of a true belt transect or sweeping pattern at
Sandbar was assessed. Two further surveys were conducted from the Sandbar, wading in the
shallows at high tide. Sandbar is nearly completely underwater at high tide but this has shown
to be the most effective way of finding juveniles; although surveys have so far been limited,
they appear to congregate in the very shallow water covering the Sandbar at high tide. It was
decided our best option was to determine the maximum number of sharks seen per visit to
Sandbar, wading for half an hour before to half an hour after high tide (based on high tide at
Suva Harbour, Viti Levu).

Statistical analysis of data this early in the study is limited due to the low number of transects
completed; the reliability of such statistical outputs would be very low. For this reason only
basic comparisons have been made in this report.
3.3.3. Results
The initial reconnaissance survey found no black tip sharks in either of the study areas at
Sandbar. However, it was noted that as we were leaving the area close to high tide, one
juvenile was seen in the shallows. We have also previously seen juveniles, adolescents and
adult blacktip reef sharks at Sandbar on recreational trips.
Following the review of the methodology, we have been much more successful finding
juvenile black tip reef sharks at Sandbar. The second survey found a maximum of 7 juveniles
at one time in the shallows when the Sandbar was covered with very shallow water (less than 1
metre deep). Nine juveniles and one sub-adult were then recorded on the third survey. If left
alone and not approached, the sharks stay in the shallow water covering the Sandbar
throughout the duration of the survey. Surveyors can be within around 5 metres distance to the
juveniles without eliciting a flight response.
3.3.4. Discussion
Preliminary data is extremely promising, especially in terms of determining whether Sandbar is
a nursery area for blacktip reef sharks. Juvenile blacktips have been sighted during each of our
visits to Sandbar over the course of 6 weeks, with particularly high numbers in the last survey.
This suggests that they are resident there, at least as juveniles. Sandbar has a lot of artisanal
fishing pressure from fishermen local to Beqa and Yanuca (pers. obs., 2016) so it is surprising
that this does in fact seem to be an often frequented nursery ground. However it could also
explain why the juveniles do not leave as soon as we arrive in the area; they would be used to
the boat noise and fishermen wading on the surrounding reefs. Sharks are not fished in Beqa
due to local customs (pers. comm., 2016) and for this reason, these sharks would not be chased
or caught if seen in the area and so would have no fear of people. If by chance they were
caught on a line, they are always thrown back so there is zero fishing pressure on the sharks
themselves. Given the number and the size of sharks we have seen in the surveys so far, it
would suggest that they tend to stay in the area whilst young. However, conclusions drawn
from preliminary data of such a small sample size are speculative at best. Continued surveying
is crucial to determine if this is in fact a nursery for blacktip reef sharks. Continuing study will
refer to the guidelines set by Heupel et al., (2007):
1. Sharks are more commonly encountered in the area than other areas
2. Sharks have a tendency to remain or return for extended periods
3. The area or habitat is repeatedly used across years
To meet these criteria, as many new sites as possible need to be added to draw valid
conclusions. Further studies will target sites in several locations where the right habitat type is
found, in conjunction with discussions with local fishermen who are knowledgeable about the
various different qoliqoli’s (traditional fishing grounds for each village) in Beqa Lagoon. This
aims to first of all find other potential nursery grounds, but also to ensure that guideline 1 can
be confirmed regarding Sandbar – if we find other areas with similar favourable conditions and
habitat type without juvenile blacktips, it would suggest that Sandbar is preferred as a nursery
area as they are more commonly encountered there. We will also continue to visit Sandbar to
try to meet the criteria for guideline 3, surveying over a longer period of time.
However, we do not as yet know where the juveniles go when the Sandbar is exposed at low
tide. During recreational trips we have only seen one at a time in the shallows surrounding
Sandbar, suggesting that they may leave the immediate area of the Sandbar when conditions
are less favourable for them. Further studies could be carried out in conjunction with the
University of the South Pacific to tag and identify each juvenile to determine whether we can
fulfil guideline 2; although we know that there are plenty of juvenile blacktips at Sandbar, we
as yet do not have a way to determine if they are the same sharks visiting regularly and
remaining in the vicinity of the Sandbar, or if they are different sharks each time.
3.3.5 References
Allen, J.A. & N.C. Duke. 2006. Bruguiera gymnorrhiza (large-leafed mangrove). ver. 2.1. In:
Elevitch, C.R. (ed.). Species Profiles for Pacific Island Agroforestry. Permanent
Agriculture Resources (PAR), Hōlualoa, Hawai‘i
Botsford LW, Castilla JC, Peterson CH (1997) The Management of Fisheries and Marine
Ecosystems. Science 277:509-515
Burns, G. L. "Amidst our people': Impact of tourism and local knowledge in Beqa." Science of
Pacific Island People (1994): 25-40.
Carpenter, K. E. and Allen, G. R. (1989) FAO Species Catalogue, Emperor fishes and large-eye
breams of the world (family Lethrinidae). An annotated and illustrated catalogue of
lethrinid species known to date. FAO Fisheries Synopsis 125: 9, 1-118.
Cheal AJ, Thompson AA (1997) Comparing visual counts of coral reef fish: Implications of
transect width and species selection. Mar Ecol-Prog Ser 158:241-248
Christine, A.O. The physiological ecology and behaviour of an apex marine predatory fish, the
great barracuda (Sphyraena barracuda). (2010). Dissertation. Carleton University Ottawa.
Cohen PJ, Alexander TJ (2013) Catch rates, composition and fish size from reefs managed with
periodically-harvested closures.
Compagno, L.J.V. 1984. Sharks of the World. An annotated and illustrated catalogue of shark
species to date. Part II (Carcharhiniformes). FAO Fisheries Synopsis, FAO, Rome.

Cumming, R. L., Aalbersberg, W. G. L., Lovell, E. R., Sykes, H. & Vuki, V. C. (2002).
Institute of Applied Sciences, The University of the South Pacific. IAS technical report
2002/11. 1-16.
Done, T. J., Ogden, J. C., Wiebe, W. J & Rosen B, R. (1996). Biodiversity and ecosystem
function of coral reefs. In: Mooney, H. A, Cushman, J. H & Medina E. Sala, O. E. Schulze
ED (eds). Functional roles of biodiversity: a global perspective. John LViley & Sons, New
York. 394-427.
Duggan L (2003) Mangroves. University of Queensland Press, St Lucia, Qld
Dulvy, N. K., Fowler, S.L., Musick, J.A., Cavanagh, R. D., Kyne, P. M., Harrison, L.
R., Carlson, J. K., Davisdson, L. N. K., Fordham, S.V., Francis, M. P., Pollock, C.
M., Simpfendorfer, C. A., Burgess, G. H., Carpenter, K. E., Compagno, L. V. J., Ebert,
D. A., Gibson, C., Heupel, M. R., Livingstone, S. R., Sanciangco, J. C., Stevens, J.
D., Valenti, S. and White, W. T. (2014) Extinction risk and conservation of the world's
sharks and rays. eLIFE: eLife 2014;3:e00590.
Duncan, K, M, Holland, K (2006). Habitat use, growth rates and dispersal patterns of juvenile
scalloped hammerhead sharks Sphyrna lewini in a nursery habitat. Marine Ecology
Progress Series; 312; 211-221.
Fabricius KE (2005) Effects of terrestrial runoff on the ecology of corals and coral reefs:
review and synthesis. Mar Pollut Bull 50:125-146
FAO (2003) Status and trends in mangrove area extent worldwide. In Wilkie ML, Fortuna S,
editors. Forest Resources Assessment Working Paper No. 63. Rome: Forest Resources
Division, FAO. http:// www.fao.org/docrep/007/j1533e/j1533e00.HTM
FAO (2007). The world’s mangroves 1980–2005. FAO Forestry Paper 153. FAO, Rome
Fernandez LA, Macfarlane JK, Tcaciuc AP, Gschwend PM (2009) Measurement of freely
dissolved PAH concentrations in sediment beds using passive sampling with low-density
polyethylene strips. Environmental Science and Technology 43:1430-1436
Ferrari MCO, Lysak KR, Chivers DP (2010) Turbidity as an ecological constraint on learned
predator recognition and generalization in a prey fish. Animal Behaviour 79:515-519
FLMMA (2013). Fiji Locally Manage Marine Area. FLMMA Annuals 2013, Fiji.
Fowler, S.L., R.D. Cavanagh, M. Camhi, G.H. Burgess, G.M. Cailliet, S.V. Fordham, C.A.
Simpfendorfer, and J.A. Musick (2005). Sharks, Rays and Chimaeras: The Status of the
Chondrichthyan Fishes. International Union for Conservation of Nature and Natural
Resources. pp. 296–297. ISBN 2-8317-0700-5.
Fritz, A. (2016). Catastrophic cyclone winston bears down on fiji's main island in worst case
scenario. Washington: WP Company LLC d/b/a The Washington Post. Retrieved from
http://search.proquest.com/docview/1766612999?accountid=16285

Giesen, W., S. Wulffraat, M. Zierenand & L. Scholten. (2007). Mangrove Guidebook for
Southeast Asia, p. 692-693. FAO and Wetlands International, Bangkok. ISBN 974-7946-
85-8
Gilman, E. L., Ellison, J., Duke, N. C., & Field, C. (2008). Threats to mangroves from climate
change and adaptation options: A review. Aquatic Botany, 89(2), 237-250.
doi:10.1016/j.aquabot.2007.12.009
Giri, C., Ochieng. E., Tieszen L.L.,Zhu Z., Singh, A., Loveland, T. Masek, J. and. Duke, N.
(2010). Status and distribution of mangrove forests of the world using earth observation
satellite data. Global Ecology and Biogeography, 20, 154-159.
Heupel M, Carlson JK, Simpfendorfer JM (2007). Shark nursery areas: concepts, definition,
characterization and assumptions. Marine Ecology Progress Series 337; 287-297.
Hixon, M. A. (1991). Predation as a Process Structuring Coral Reef Fish Communities. p. 475-
508. In: The Ecology of Fishes on Coral Reefs. P. Sale (ed). Academic Press, Inc., San Diego,
CA.
Hodgson, G. (2001). Reef Check; The first step in community-based management. Bulletin of
Marine Science. 69: 861-868
Hoffmann TC (2002) Coral reef health and effects of socio-economic factors in Fiji and Cook
Islands. Mar Pollut Bull 44:1281-1293
Holmes TH, Wilson SK, Vanderklift M, Babcock R, Fraser M (2012) The role of Thalassoma
lunare as a predator of juvenile fish on a sub-tropical coral reef. Coral Reefs 31:1113-1123
Hourigan, Thomas F., C. Tricas Timothy, and Ernst S. Reese (1988). "Coral reef fishes as
indicators of environmental stress in coral reefs." Marine organisms as indicators. Springer
New York. 107-135.
Hueter RE, Heupel MR, Heist EJ, Keeney DB (2005) The implications of philopatry in sharks
for the management of shark fisheries. Fisheries Science 35; 239-247
Hutchings, P., Kingsford, M & Hoegh-Guldberg, O. (2008) The Great Barrier Reef; Biology,
Environment and Management. CSIRO Publishing. 298.
Intergovernmental Governmental Panel on Climate Change (2007). Climate Change 2007: The
Physical Basis. Intergovernmental Panel on Climate Change. IPCC, Geneva.
Jackson JBC, Kirby MX, Berger WH, Bjorndal KA, Botsford LW, Bourque BJ, Bradbury RH,
Cooke R, Jon E, Estes JA, Hughes TP, Kidwell S, Lange CB, Lenihan HS, Pandolfi JM, Peterson
CH, Steneck RS, Tegner MJ, Warner RR (2001) Historical Overfishing and the Recent Collapse
of Coastal Ecosystems. Science 293:629-638
Karplus I, Algom D (1981) Visual Cues for Predator Face Recognition by Reef Fishes.
Zeitschrift für Tierpsychologie 55:343-364

Krauss, K. W., McKee, K. L., Lovelock, C. E., Cahoon, D. R., Saintilan, N., Reef, R., & Chen,
L. (2014). How mangrove forests adjust to rising sea level. New Phytologist, 202(1), 19-34.
doi:10.1111/nph.12605
Lal, P.N., K. Swamy, and P. Singh. 1984. Mangrove Ecosystem: Fisheries Associated with
Mangroves and their Management. Mangrove Fishes in Wairiki Creek and their Implications on
the Management of Resources in Fiji. In Productivity and Processes in Island Marine
Ecosystems. UNESCO Report on Marine Science. Paris, France.
Last, P.R. and Stevens, J.D. 2009. Sharks and Rays of Australia, 2nd edition. CSIRO,
Melbourne, Australia.
Ley, J.A., I.A. Halliday, A.J. Tobin, R.N. Garrett, N.A. Gribble. 2002. Ecosystem effects of
fishing closures in mangrove estuaries of tropical Australia. Marine Ecology Progress Series 245:
223-238.
Lovell, E., H. Sykes, M. Deiye, L. Wantiez, C. Garrigue, S. Virly, J. Samuelu, A. Solofa, T.
Poulasi, K. Pakoa, A. Sabetian, D. Afzal, A. Hughes and R. Sulu. (2004), Status of Coral Reefs
in the South West Pacific: Fiji, Nauru, New Caledonia, Samoa, Solomon Islands, Tuvalu and
Vanuatu. In: C. Wilkinson (eds.). Status of coral reefs of the world Volume 2. Townsville,
Queensland: Australian Institute of Marine Science, Pp. 337–362.
Marine Spatial Ecology Lab (2014) Fish Ecology, http://www.marinespatialecologylab.org/fish-
ecology/
McClanahan, T. R., Maina, J. M., Graham, N. A. J., & Jones, K. R. (2016). Modeling Reef Fish
Biomass, Recovery Potential, and Management Priorities in the Western Indian Ocean. PLoS
ONE, 11(5), e0154585
Messmer V (2010) From genes to ecosystems: patterns, processes and consequences of declining
biodiversity in coral reef fish communities. Dissertation/Thesis
Molony B, Sheaves M. (1995) Mangroves: ecology of intertidal forests, Vol 4. James Cook
University of North Queensland, Townsville, Qld
Morris, C. and Mackay, K. 2008. Status of the coral reefs in the South West Pacific: Fiji, New
Caledonia, Samoa, Solomon Islands, Tuvalu and Vanuatu. In: Status of Coral Reefs of the
World: 2008, p.177–188
Mosley, L. M., Aalbersberg, W. G. L. (2002). Nutrient levels in sea and river water along the
"Coral Coast" of Viti Levu, Fiji. South Pacific Journal of Natural Sciences. 7.
Mourier J, Mills SC and Planes S (2013) Population structure, spatial distribution and life-history
traits of blacktip reef sharks Carcharhinus melanopterus. Journal of Fish Biology 82, 979–993
doi:10.1111/jfb.12039.
Mourier, J., Planes, S. (2013) Direct genetic evidence for reproductive philopatry and associated
fine-scale migrations in female blacktip reef sharks (Carcharhinus melanopterus) in French
Polynesia. Molecular Ecology doi: 10.1111/mec.12103

MRIS (Marine Resource Inventory Survey) (2012) - Team Resource Survey at Beqa Lagoon for
Yannuca and Rakua Villages and Commissioner Central – Fisheries dept, Lami. Sept 2012.
MRIS (Marine Resource Inventory Survey) (2012) - Team Resource Survey at Beqa Lagoon for
Yannuca and Rakua Villages and Commissioner Central – Fisheries dept, Lami. Sept 2012.
Muñoz RC, Zgliczynski BJ, Teer BZ, Laughlin JL. (2014) Spawning aggregation behavior and
reproductive ecology of the giant bumphead parrotfish, Bolbometopon muricatum, in a remote
marine reserve. PeerJ 2:e681 https://doi.org/10.7717/peerj.681
Nadon M-O, Stirling G (2006) Field and simulation analyses of visual methods for sampling
coral cover. Coral Reefs 25:177-185
Ormond RFG, Roberts JM, Jan R-Q (1996) Behavioral differences in microhabitat use by
damselfishes (Pomacentridae): implications for reef fish biodiversity. J Exp Mar Biol Ecol
202:85–95
Papastamatiou YP, Lowe CG, Caselle JE, Friedlander AM (2009b) Scale-dependent effects of
habitat on movements and path structure of reef sharks at a predator-dominated atoll. Ecology,
90, 996–1008.
Papastamatiou YP, Wetherbee BM, Lowe CG and Crow, GL (2006) Distribution and diet of four
species of carcharhinid shark in the Hawaiian Islands: evidence for resource partitioning and
competitive exclusion. Marine Ecology Progress Series 320, 239-251.
Papastamatiou, Y.P.; J.E. Caselle; A.M. Friedlander; C.G. Lowe (2009a). "Distribution, size
frequency, and sex ratios of blacktip reef sharks Carcharhinus melanopterus at Palmyra Atoll: a
predator-dominated ecosystem". Journal of Fish Biology. 75 (3): 647–654.
Peters, E. C., Firman, J. C., Richmond, R. H., & Power, E. A. (1997). Ecotoxicology of tropical
marine ecosystems. Environmental Toxicology and Chemistry, 16(1), 12-40.
doi:10.1002/etc.5620160103
Polidoro, B.A., Carpenter, K.E., Collins, L., Duke, N.C., Ellison, A.M., Ellison, J.C., Farnsworth,
E.J., Fernando, E.S., Kathiresan, K., Koedam, N.E., Livingstone, S.R., Miyagi, T., Moore, G.E.,
vien, N.N., Ong, J.E., Primavera, J.H., Salmo, S.G., Sanciangco, J.C., Sukardjo, S., Wang, Y.M.,
and Yong, J.W.H. (2010). The loss of species: Mangrove extinction risk and geographic areas of
concern. Plos One, 5(4), 1-10.
Porcher, I.F. (April 2005). "On the gestation period of the blackfin reef shark, Carcharhinus
melanopterus, in waters off Moorea, French Polynesia". Marine Biology. 146 (6): 1207–1211.
Prance, G. T. 2001. Rhizophoraceae. En: Stevens, W.D., C. Ulloa, A. Pool & O.M. Montiel
(eds.). Flora de Nicaragua. Monogr. Syst. Bot. Missouri Bot. Gard. 85(3): 2200–2201.
Pratchett, M.S. (2005) Dietary overlap among coral-feeding butterflyfishes (Chaetodontidae) at
Lizard Island, northern Great Barrier Reef. Marine Biology, 148:373382.

Rasalato E, Maginnity A, Brunnschweiller JM (2010). Using local ecological knowledge to
identify shark river habitats in Fiji (South Pacific). Environmental Conservation 37; 90-97
Reaka-Kudla, M.L. (1996). The global biodversity of coral reefs: a comparison with rain
forests. In: Reaka-Kudla ML, Wil- son DE, Wilson E0 (eds) Biodiversity 11. Joseph Henry
Press, Washington. 83-108.
Robertson, A. I., & Alongi, D. M. (1992). Tropical mangrove ecosystems. Washington, DC:
American Geophysical Union.
Russ GR (2002) Yet another review of marine reserves as reef fishery management tools.
Elsevier.
Sale, P. F. (1974). Mechanisms of co-existence in a guild of territorial fishes at Heron Island.
Proc. Int. Coral Reef Symp., 2nd 1, 193-206
Sheaves M (2009) Consequences of ecological connectivity: the coastal ecosystem mosaic.
Mar Ecol Prog Ser 391:107-115.
Sheue, C.R., J.W.H. Yong & Y.P. Yang. 2005. The Bruguiera (Rhizophoraceae) Species in the
Mangroves of Singapore, Especially on the New Record and the Rediscovery. Taiwania 50(4):
251-260, 2005
Smith, TJ. 1992. Forest structure p 101-136 In Tropical mangrove ecosystems. Coastal and
estuarine studies no. 4. In: Robertson, AI; Alongi, DM, editors. Washington D.C.: American
Geophysical Union.
Solomon, S., Plattner, G. K., Knutti, R., & Friedlingstein, P. (2009). Irreversible climate
change due to carbon dioxide emissions. Proceedings of the national academy of sciences,
106(6), 1704-1709.
Spalding, M., Kainuma, M. and Collins, L. (2010). World Atlas of Mangroves. Earthscan:
London ad Washington D.C.
Stevens, J.D. 1984. Life history and ecology of sharks at Aldabra Atoll, Indian Ocean.
Proceedings of the Royal Society, London B 222: 79–106.
Sykes, H. R. and Lovell, E. R. 2009. “A Cause for Optimism”: Identification of threats and
resiliency on Pacific Reefs through establishment of a long term reef monitoring network in
Fiji : The Fiji Coral Reef Monitoring Network (FCRMN ). In: French Research in the Pacific,
02 – 06 March 2009, 2009, Tahiti, French Polynesia., p.1–15.
Tamata, B & Thaman, B. (2001). Water quality in the ports of Fiji – survey of various ports
and industrial point sources of pollution. IAS Environment Studies Report C103, Institute of
Applied Sciences, The University of the South Pacific.
Tan, R. (2001). "Sea Poison Tree". Mangrove and wetland wildlife at Sungei Buloh Nature
Park. Singapore.
Teh L.C.I, Tech L.S.L, Starkhuse B, Sumalla R (2008). An overview of the socio-economic
and ecological perspectives of Fiji’s inshore reef fisheries. Marine Policy (33), 807-817.

Uiblein F, (2007). Goatfishes (Mullidae) as indicators in tropical and temperate coastal habitat
monitoring and management, Marine Biology Research, 3:5, 275-288
Veitayaki, J. (2006). Caring for the Environment and the Mitigation of Natural Extreme Events
in Vanuaso Tikina, Gau Island, Fiji Islands: A Self-help Community Initiative. Island Studies
Journal, Vol. 1, No. 2
Zann L. P & Lovell, E. R. (1992). The coral reefs of the Mamanuca group, Fiji: preliminary
descriptions and recommendations for management. National Environmental Management
Project. Report on the Marine Environment. Annex 3.
Zann, L. P., Brodie, J. E & Vuki, V. C. (1990). History and dynamics of the crown-of-thorns
starfish Acanthaster planci (L.) in the Suva area, Fiji. Coral Reefs. 9: 135-144.
4. Acknowledgement
We would like to thank the family that owns the land we operate from who have been crucial for our
fieldwork. Thanks also to all of the RAs who have been working hard in collecting all of the data.