fifth external quality assessment for listeria moncytogenes · cgmlst core genome multilocus...
TRANSCRIPT

TECHNICAL REPORT
Fifth external quality assessment scheme for
Listeria monocytogenes typing
www.ecdc.europa.eu

ECDC TECHNICAL REPORT
Fifth external quality assessment scheme for Listeria monocytogenes typing

ii
This report was commissioned by the European Centre for Disease Prevention and Control (ECDC), coordinated by by Taina Niskanen (ECDC Food- and Waterborne Diseases and Zoonoses Programme) and produced by Susanne Schjørring, Gitte Sørensen, Kristoffer Kiil, Malgorzata Ligowska-Marzeta, and Eva Møller Nielsen of the Foodborne Infections Unit at Statens Serum Institut, Copenhagen, Denmark.
Suggested citation: European Centre for Disease Prevention and Control. Fifth external quality assessment scheme for Listeria monocytogenes typing. Stockholm: ECDC; 2018.
Stockholm, August 2018
ISBN 978-92-9498-263-6 DOI 10.2900/653723 Catalogue number TQ-04-18-737-EN-N
© European Centre for Disease Prevention and Control, 2018
Reproduction is authorised, provided the source is acknowledged
TECHNICAL REPORT Fifth external quality assessment scheme for Listeria monocytogenes typing
iii
Contents Abbreviations ................................................................................................................................................ 1 Executive summary ........................................................................................................................................ 2 1. Introduction .............................................................................................................................................. 3
1.1 Background ........................................................................................................................................ 3 1.2 Surveillance of listeriosis ...................................................................................................................... 3 1.3 Objectives .......................................................................................................................................... 4
1.3.1 Serotyping ................................................................................................................................... 4 1.3.2 Molecular typing-based cluster analysis .......................................................................................... 4
2. Study design .............................................................................................................................................. 5 2.1 Organisation ....................................................................................................................................... 5 2.2 Selection of test isolates ...................................................................................................................... 5 2.3 Carriage of isolates .............................................................................................................................. 5 2.4 Testing ............................................................................................................................................... 5 2.5 Data analysis ...................................................................................................................................... 6
3. Results ...................................................................................................................................................... 7 3.1 Participation ....................................................................................................................................... 7 3.3 Serotyping .......................................................................................................................................... 7
3.3.1 Conventional serotyping ................................................................................................................ 7 3.3.2 Molecular serotyping ..................................................................................................................... 8
3.4 Molecular typing-based cluster analysis ............................................................................................... 10 3.4.1 PFGE-derived data ...................................................................................................................... 10 3.4.2 WGS-derived data ...................................................................................................................... 12
4. Discussion ............................................................................................................................................... 19 4.1 Serotyping ........................................................................................................................................ 19
4.1.1 Conventional serotyping .............................................................................................................. 19 4.1.2 Molecular serotyping ................................................................................................................... 19
4.2 Molecular typing-based cluster analysis ............................................................................................... 19 4.2.1 PFGE-derived data ...................................................................................................................... 19 4.2.3 WGS-derived data ...................................................................................................................... 19
5. Conclusions ............................................................................................................................................. 21 6. Recommendations .................................................................................................................................... 22
6.1 Laboratories ..................................................................................................................................... 22 6.2 ECDC and FWD-Net ........................................................................................................................... 22 6.3 EQA provider .................................................................................................................................... 22
7. References .............................................................................................................................................. 23
Figures Figure 1. Participant scores for conventional serotyping of the 11 test isolates..................................................... 7 Figure 2. Correct conventional serotyping of three repeated isolates through EQA-1 to 5 ...................................... 8 Figure 3. Participant scores for molecular serotyping of the 11 test isolates ......................................................... 9 Figure 4. Correct molecular serotyping of three repeated isolates through EQA-1 to 5 .......................................... 9 Figure 5. Average score of the 11 test isolates ................................................................................................ 10 Figure 6. Difference between reported total number of bands (A and B) and shared bands (C and D) for each isolate ............ 11 Figure 7. Reported SNP distances or allelic differences for each test isolate to selected cluster representative isolate 14 Figure 8. Minimum spanning tree of core genome multi locus sequence typing participant FASTQ files ................ 15 Figure 9. Participant allele difference from reference result (EQA-provider) for each test isolate .......................... 16 Figure 10. Calculated allele difference between participant and REF isolates compared with selected QC parameters 17
Tables Table 1. Number and percentage of laboratories submitting results for each method ............................................................... 7 Table 2. Results of cluster identification based on PFGE-derived data .................................................................................... 11 Table 3. Results of cluster identification based on WGS-derived data ..................................................................................... 12 Table 4. Results of SNP-based cluster analysis ...................................................................................................................... 13 Table 5. Results of allele-based cluster analysis .................................................................................................................... 13 Table 6. Summary of quantitative and qualitative parameters reported by participants ........................................................... 16 Table 7. Results of raw reads submitted by participants evaluated by EQA provider QC pipeline summarised by laboratory ..... 18

Fifth external quality assessment scheme for Listeria monocytogenes typing TECHNICAL REPORT
iv
Annexes Annex 1. List of participants .......................................................................................................................... 24 Annex 2. Serotyping result scores .................................................................................................................. 25 Annex 3. EQA provider cluster analysis based on PFGE-derived data ................................................................. 26 Annex 4. EQA provider cluster analysis based on WGS-derived data ................................................................. 27 Annex 5. Reported cluster of closely related isolates based on PFGE-derived data .............................................. 28 Annex 6. Reported band differences .............................................................................................................. 29 Annex 7. Reported sequencing details ............................................................................................................ 30 Annex 8. Reported cluster of closely related isolates based on WGS-derived data .............................................. 31 Annex 9. Reported SNP distance and allelic differences ................................................................................... 32 Annex 10. Reported QC parameters ............................................................................................................... 33 Annex 11. Calculated qualitative/quantitative parameters ................................................................................ 34 Annex 12. EQA-5 laboratory questionnaire ..................................................................................................... 39
TECHNICAL REPORT Fifth external quality assessment scheme for Listeria monocytogenes typing
1
Abbreviations BN BioNumerics cgMLST Core genome multilocus sequence type wgMLST Whole genome multilocus sequence type EFSA European Food Safety Authority EQA External quality assessment EU/EEA European Union/European Economic Area EURL European Union Reference Laboratory FWD Food- and waterborne diseases and zoonoses FWD-Net Food- and Waterborne Diseases and Zoonoses Network PFGE Pulsed-field gel electrophoresis QC Qualitative control SNP Single nucleotide polymorphism SSI Statens Serum Institut ST Sequence type TESSy The European Surveillance System WGS Whole genome sequence

Fifth external quality assessment scheme for Listeria monocytogenes typing TECHNICAL REPORT
2
Executive summary This report presents the results of the fifth round of the external quality assessment (EQA-5) scheme for typing of Listeria monocytogenes (L. monocytogenes) organised for laboratories providing data to the Food- and Waterborne Diseases and Zoonoses Network (FWD-Net) managed by ECDC. Since 2012, the Section for Foodborne Infections at the Statens Serum Institut (SSI) in Denmark has arranged this EQA under a framework contract with ECDC. The EQA-5 contain serotyping and molecular typing-based cluster analysis.
Human listeriosis is a relatively rare but serious zoonotic disease with an EU notification rate of 0.47 cases per 100 000 population in 2016 [3]. The number of human listeriosis cases in the EU has increased since 2008, with the highest annual number of deaths since 2009 reported in 2015 at 270.
Since 2007, ECDC's FWD Programme has been responsible for the EU-wide surveillance of listeriosis, including facilitating detecting and investigating foodborne outbreaks. Surveillance data, including basic typing parameters for the isolated pathogen, are reported by Member States to The European Surveillance System (TESSy), including molecular typing data. This molecular surveillance system relies on the capacity of laboratories providing data to FWD-Net to produce comparable typing results. In order to ensure the EQA is linked to the development of surveillance methods used by public health national reference laboratories in Europe, EQA-5 contains a molecular typing-based cluster analysis using either pulsed-field gel electrophoresis (PFGE) and/or whole genome sequencing (WGS)-derived data, while quality assessment of PFGE performed in previous years has been excluded.
The objectives of the EQA are to assess the quality and comparability of the typing data reported by public health national reference laboratories participating in FWD-Net. Test isolates for the EQA were selected to cover isolates currently relevant to public health in Europe and represent a broad range of clinically relevant types for invasive listeriosis. Two separate sets of 11 test isolates were selected for serotyping and molecular typing-based cluster analysis. Twenty-two laboratories signed up and 20 completed the exercise, representing a decrease in participation of 13% from the previous assessment (EQA-4). This decrease in the number of participants may have been caused by adding WGS or removing PFGE as an independent part. The majority (65%) of participants completed the full EQA scheme. In total, 18 (90%) participants participated in the serotyping part and 15 (75%) in the molecular typing-based cluster analysis.
Conventional serotyping results were provided by six participants (30%) and molecular serotyping results were provided by 17 (85%) participants. Five participants performed both serotyping methods. The performance of molecular serotyping was highest, with 67% and 88% of the respective participants correctly serotyping all test isolates by conventional and molecular methods. The number of errors in the conventional serotyping was the same as in EQA-4. However, the number of participants decreased from nine to six. The performance of molecular serotyping increased from EQA-4, where 81% of the participants correctly serotyped all 11 test isolates. Since the first EQA in 2012, a trend towards substituting conventional serotyping with molecular serotyping has been observed. In EQA-5, only one participant exclusively performed conventional serotyping, while the remaining participants performed either both methods or only molecular serotyping.
Out of the 20 laboratories participating in EQA-5, 15 (75%) performed molecular typing-based cluster analysis using any method. The idea of the cluster analysis part of the EQA was to assess the public health national reference laboratories’ ability to identify a cluster of genetically closely related isolates given that a multitude of different laboratory methods and analytical methods are used as the primary cluster detection approach in Member States. This part of the EQA was atypical in the sense that the aim was to assess the participants’ ability to reach the correct conclusion, i.e.to correctly categorise the cluster test isolates, not to follow a specific procedure.
The cluster of closely related isolates contained four ST6 isolates that could be identified by both PFGE- (combination of ApaI and AscI profiles) and WGS-derived data. The expected cluster was based on a pre-defined categorisation by the organiser. Seven laboratories used PFGE for cluster analysis and four of them also reported cluster analysis based on WGS data. Only one laboratory did not identify the correct cluster using PFGE.
Twelve laboratories performed cluster analysis using WGS-derived data. Performance was high, with 11 (92%) of the participants correctly identifying the cluster of closely related isolates. However, only two laboratories identified a cluster of three isolates due to data quality not meeting the laboratory’s own QC standards for one of the cluster isolates. An allele-based method was preferred since 67% (8/12) used core genome multilocus sequence type (cgMLST) compared with 33% (4/12) using single nucleotide polymorphism (SNP) as the main reported cluster analysis. In this EQA, the participants were free to choose their preferred analytical method for the WGS-based cluster identification. In general, the reported cgMLST results were at a comparable level despite analysis with different schemes. The reported SNP results showed more variability. EQA results indicate that cgMLST is a good method for inter-laboratory comparability and cluster definition and cgMLST is more robust compared with non-standardised SNP based analysis.

TECHNICAL REPORT Fifth external quality assessment scheme for Listeria monocytogenes typing
3
1. Introduction 1.1 Background ECDC is an independent EU agency with a mandate to operate dedicated surveillance networks. The mission of ECDC is to identify, assess and communicate current and emerging threats to human health from communicable diseases. The ECDC shall foster the development of sufficient capacity within the European Community’s network for diagnosis, detection, identification and characterisation of infectious agents that may threaten public health. The ECDC shall maintain and extend such cooperation and support the implementation of quality assurance schemes [1].
External quality assessment (EQA) is an essential part of quality management and uses an external evaluator to assess the performance of participating laboratories on test samples supplied specifically for the purpose.
ECDC’s disease-specific networks organise a series of EQAs for EU/European Economic Area (EEA) countries. The aim of the EQA is to identify needs of improvement in the laboratory diagnostic capacities relevant to epidemiological surveillance of communicable diseases as in Decision No 1082/2013/EU [2] and to ensure reliability and comparability of the results generated by the laboratories across all EU/EEA countries.
The main purposes of EQA schemes are to:
• assess the general standard of performance (‘state of the art’) • assess the effects of analytical procedures (method principle, instruments, reagents, calibration) • evaluate individual laboratory performance • identify and justify of problem areas • provide continuing education; and • identify needs for training activities.
Since 2012, the section for Foodborne Infections at Statens Serum Institut (SSI), Denmark has been the EQA provider for the three lots covering typing of Salmonella enterica ssp. enterica, Shiga toxin/verocytotoxin-producing Escherichia coli (E. coli) (STEC/VTEC) and L. monocytogenes. In 2016, SSI was also granted the new round of tenders (2017-2020) for all three lots. For lot 3 (L. monocytogenes) from 2017, the EQA scheme no longer covers assessment of the PFGE quality. However, it still covers serotyping and includes a new part for cluster identification of L. monocytogenes. The present report presents the results of the fifth EQA scheme (Listeria EQA-5).
1.2 Surveillance of listeriosis Human listeriosis is a relatively rare but serious foodborne disease, with high rates of morbidity, hospitalisation and mortality in vulnerable populations. The number of human listeriosis cases in the EU has increased since 2008to 270 in 2015, the highest annual number of deaths reported since 2009. In the EU, 2,536 confirmed human cases of listeriosis were reported in 2016, corresponding to a notification rate of 0.47 cases per 100,000 population, which is similar to 2014 [3].
ECDC’s FWD Programme is responsible for EU-wide surveillance of listeriosis and facilitating detecting and investigating foodborne outbreaks since 2007. One of the key objectives for the FWD programme is to improve and harmonise the surveillance system in the EU to increase scientific knowledge of aetiology, risk factors and burden of food- and waterborne diseases and zoonoses. Surveillance data, including some basic typing parameters for the isolated pathogen, are reported by Member States to TESSy. In addition to the basic characterisation of the pathogens isolated from infections, there is a public health value to use more discriminatory typing techniques in the surveillance of foodborne infections. Since 2012, ECDC has enhanced surveillance incorporating molecular typing data (‘molecular surveillance’). Three selected FWD pathogens were included: Salmonella enterica ssp. enterica, L. monocytogenes and STEC/VTEC. The overall aims of integrating molecular typing into EU level surveillance are to:
• foster rapid detection of dispersed international clusters/outbreaks • facilitate the detection and investigation of transmission chains and relatedness of isolates across MS and
contribution to global investigations • detect emergence of new evolving pathogenic isolates • support investigations to trace-back the source of an outbreak and identify new risk factors; and • aid the study of a particular pathogen’s characteristics and behaviour in a community of hosts.
Molecular typing surveillance gives Member State users access to EU-wide molecular typing data for the pathogens included. It also gives users the opportunity to perform cluster searches and cross-sector comparability of EU-level data to determine whether isolates characterised by molecular typing at the national level are part of a multinational cluster that may require cross-border response collaboration.
Fifth external quality assessment scheme for Listeria monocytogenes typing TECHNICAL REPORT
4
The EQA schemes have targeted public health national reference laboratories already expected to be performing molecular surveillance at the national level.
1.3 Objectives 1.3.1 Serotyping The EQA-5 scheme assessed the serotype determination by either conventional antigen-based typing of somatic ‘O’ antigens and flagellar ‘H’ antigens and/or PCR-based molecular serotyping.
1.3.2 Molecular typing-based cluster analysis The objective of the L. monocytogenes EQA-5 was to assess the ability to detect a cluster of closely related isolates. Laboratories could perform analysis by using PFGE and/or derived data from WGS.

TECHNICAL REPORT Fifth external quality assessment scheme for Listeria monocytogenes typing
5
2. Study design 2.1 Organisation Listeria EQA-5 was funded by ECDC and arranged by SSI following ISO/IEC 17043:2010 [4]. EQA-5 included serotyping and molecular typing-based cluster analysis and was carried out between September and December 2017.
Invitations were emailed to ECDC contact points in FWD-Net (30 countries) by 14 June 2017 with a deadline to respond by 28 June 2017. In addition, invitations were sent to EU candidate and potential candidate countries Albania, Montenegro, the former Yugoslav Republic of Macedonia, Serbia, Turkey, Bosnia and Herzegovina and Kosovoi.
Twenty-two public health national reference laboratories in EU/EEA and EU candidate countries accepted the invitation to participate, but only 20 submitted results (Annex 1). The EQA test isolates were sent to participants on 30 August 2017. Participants were asked to submit their results by 9 October 2017 using the online form (Annex 12). If WGS was performed, submission of the raw reads (FASTQ files) to https://sikkerftp.ssi.dk was also requested.
The EQA submission protocol was distributed by e-mail and available at the online site.
2.2 Selection of test isolates Twenty-two L. monocytogenes test isolates were selected to fulfil the following criteria:
• cover a broad range of the common clinically relevant types for invasive listeriosis • include closely related isolates • remain stable during the preliminary test period at the organising laboratory.
Thirty-two candidate isolates were analysed by the methods used in the EQA before and after re-culturing 10 times. All candidate isolates remained stable using these methods and the final selection of 22 test isolates, including technical duplicates (same isolate culture twice), was made. The 11 test isolates for serotyping were selected to cover different serotypes relevant for the current epidemiological situation in Europe. Isolates within serotypes 1/2a, 1/2b, 1/2c, 3a and 4b were selected. Among the serotyping test isolates, the three repeat isolates from EQA-1 to 4 were included to evaluate the performance development of the participants. Two sets of technical duplicates were also included this year. (Annex 2). The 11 test isolates for cluster analysis were selected to include isolates with different or varying relatedness isolates and different multi locus sequence types (ST 1, 6, 213, 382). Using either PFGE or WGS-derived data, the cluster of closely related isolates consisted of four L. monocytogenes ST6 isolates (one technical duplicate). The characteristics of all the L. monocytogenes test isolates are listed as Original/REF in Annexes 2–9.
2.3 Carriage of isolates At the end of August 2017, all test isolates were blinded and shipped on 30 August. The protocol for the EQA exercise and a letter stating the unique isolate IDs were included in the packages, and distributed individually to the participants by e-mail on 29 August 2017 as an extra precaution. Nineteen participants received their dispatched isolates within one day, two within three days and one participant received the isolates six days after shipment. The parcels were shipped from SSI labelled as UN 3373 Biological Substance. No participants reported damage to the shipment or errors in the unique isolates IDs.
On 13 September 2017, instructions to the submission of results procedure were e-mailed to the participants. This included the links to the online uploading site and online submission form.
2.4 Testing In the serotyping part, the 11 L. monocytogenes isolates were tested to assess the participants’ ability to obtain the correct serotype. The participants could choose to perform conventional serological methods and/or PCR-based molecular serotyping (multiplex PCR according to the protocol suggested by Doumith et al. [5]). The serotypes were submitted in the online form.
i This designation is without prejudice to positions on status, and in line with UNSCR 1244/99 and the ICJ Opinion on the Kosovo Declaration of Independence.
Fifth external quality assessment scheme for Listeria monocytogenes typing TECHNICAL REPORT
6
In the cluster analysis part, the participants could choose to perform the laboratory part using PFGE (combining ApaI and AscI profiles) or WGS-derived data. The participants were instructed to report the IDs of the isolates included in the cluster of closely related isolates by method. If PFGE analysis was conducted, the participant reported the total number of bands and number of shared bands with a selected cluster representative isolate for both ApaI and AscI.
Laboratories performing WGS could use their own analysis pipeline for cluster analysis, e.g. single nucleotide polymorphism analysis (SNP-based) or whole genome multilocus sequence typing (wgMLST) /cgMLST (allele-based), and was asked to submit the isolates identified as cluster of closely related isolates based on the analysis used. The laboratories could report results from up to three analyses (one main and one to two additional), but the detected cluster had to be based on results from the main analysis. The laboratories reported SNP distance or allelic differences between a selected cluster isolate and each test isolate and uploaded the raw reads (FASTQ files).
2.5 Data analysis As participating laboratories submitted their results, serotyping and cluster analysis results, as well as the participants’ uploaded raw reads, were imported to a dedicated Listeria EQA-5 BioNumerics (BN) database. The EQA provider reported to participants when errors in the submission process were identified, thereby obtaining analysable results. The EQA provider was in contact with five participants in order to ensure no misunderstandings in data were submitted in the online submission form. Only two participants changed their submissions.
Serotyping results were evaluated according to the percentage of correct results, generating a score from 0-100%. Molecular typing-based cluster analysis was evaluated according to correct or incorrect identification of the expected cluster of closely related isolates based on a pre-defined categorisation by the organiser. The EQA provider’s PFGE results were based on combined ApaI and AscI profiles. Cluster analysis based on WGS-derived data was derived on allele-based (cgMLST [6] and SNP analysis (NASP, [7]). The correct number of closely related L. monocytogenes isolates (4) could be identified by both PFGE- and WGS-derived data. The cluster contained four ST6 isolates: REF1, REF4, REF9 and REF11 (REF4 and REF9 were technical duplicates). The EQA provider found at most five allele differences or three SNPs between any two isolates in the cluster. The rest of the cluster test isolates were an additional four ST6s, one ST1, one ST213 and one ST382.
Individual evaluation reports were distributed to participants in December 2017 and certificates of attendance in March 2018. If WGS data were used, the evaluation report included a quality assessment made by the EQA provider´s in-house quality control pipeline (e.g. coverage, N50, sequence length and number of contigs). The evaluation report did not include an evaluation based on quality thresholds.

TECHNICAL REPORT Fifth external quality assessment scheme for Listeria monocytogenes typing
7
3. Results 3.1 Participation Laboratories could participate either in the full EQA scheme or one part only (serotyping or molecular typing-based cluster analysis). Of the 22 participants who signed up, 20 completed and submitted their results. The majority of participants (65%; 13/20) completed the full EQA scheme. In total, 18 (90%) participants participated in serotyping and 15 (75%) in cluster analysis. Conventional serotyping results were provided by six participants (30%) and molecular serotyping was provided by 17 (85%). Five participants performed both serotyping methods. Most participants (80%, 12/15) reported cluster analysis using WGS-derived data, while three (20%) reported only using PFGE data. Four participants (27%) submitted cluster data based on both PFGE and WGS. (Table 1).
Table 1. Number and percentage of laboratories submitting results for each method
Serotyping Cluster analysis
Conventional only Molecular only Both Total PFGE-only WGS-only Both Total Number of participants 1 12 5 18 3 8 4 15 Percentage of participants 6% 67% 28% 90%* 20% 53% 27% 75%*
Thirteen of the 20 participants (65%) completed both parts (serotyping and cluster analysis) of the EQA. * Percentage of total number of participating laboratories (20)
3.3 Serotyping 3.3.1 Conventional serotyping Six participants performed conventional serotyping of L. monocytogenes (Figure 1). Performance was high, with four (67%) participants correctly serotyping all 11 test isolates. Two participants (100 and 56) reported the incorrect result of the 3a isolate as a 1/2a. Laboratory 56 also failed one of the two 1/2b isolates when reporting 1/2a.
Figure 1. Participant scores for conventional serotyping of the 11 test isolates
Arbitrary numbers represent participating laboratories. Bars represent the percentage of correctly assigned serotypes for the 11 test isolates (SERO1-11).
To follow the development of each laboratory’s performance, three isolates of different serotypes were included in EQA-1 to 5: SERO6 (1/2a - IIa), SERO8 (4b - IVb) and SERO9 (technical duplet with isolates SERO3) (1/2c - IIc). Figure 2 shows the individual participants’ performances on conventional serotyping of these three repeated isolates during the five EQAs. Conventional serotyping results on the repeated isolates shows stability and high performance among the participants. None of the participants failed to serotype all three isolates correctly in EQA-5.

Fifth external quality assessment scheme for Listeria monocytogenes typing TECHNICAL REPORT
8
Figure 2. Correct conventional serotyping of three repeated isolates through EQA-1 to 5
Arbitrary numbers represent the participating laboratories. Bars represent the number of correctly assigned serotypes for the three repeated isolates (SERO6, 8 and 9).
3.3.2 Molecular serotyping Seventeen participants performed molecular serotyping of L. monocytogenes (Figure 3), including two new laboratories (96 and 130). Molecular serotyping was carried out in accordance to guidelines in Doumith et al. [5] and nomenclature from Doumith et al. [8] was used. Fifteen (88%) of the 17 participants were able to correctly serotype all 11 EQA test isolates. The two new laboratories and the new participants from EQA-4 were among the 15 participants. Only two isolates were incorrectly serotyped by one participant each. One of the errors was in isolate SERO9 that was a technical duplicate of isolate SERO3, which the same participant was able to serotype correctly.

TECHNICAL REPORT Fifth external quality assessment scheme for Listeria monocytogenes typing
9
Figure 3. Participant scores for molecular serotyping of the 11 test isolates
Arbitrary numbers represent the participating laboratories. Bars represent the percentage of correctly assigned serotypes for the 11 test isolates SERO1-11.
Figure 4 shows the individual participants’ performances on molecular serotyping of the three repeated isolates during the five EQAs. As for conventional serotyping, the general performance among participating laboratories was high and stable. The majority of participants (70%) correctly serotyped all three repeated isolates when participating.
Figure 4. Correct molecular serotyping of three repeated isolates through EQA-1 to 5
Arbitrary numbers represents the participating laboratories. Bars represent the number of correctly assigned serotypes for the three repeated isolates (SERO6, 8 and 9). # Laboratory did not correctly identify any of the three repeated isolates.
# #

Fifth external quality assessment scheme for Listeria monocytogenes typing TECHNICAL REPORT
10
Ten (91%) of the 11 test isolates were correctly serotyped by all participants in either the molecular or conventional serotyping part of the EQA (Figure 5). All participants in both parts of the serotype EQA correctly serotyped eight isolates, but errors were reported in isolates SERO2, SERO4 and SERO9. These isolates belonged to serotype 1/2b – IIb, 3a – IIa and 1/2c-IIc. Again this year, serotype 4b -IVb was the one serotype correctly assigned by all the participating laboratories, but isolates with 1/2a-IIa were also serotyped 100% correctly.
Figure 5. Average score of the 11 test isolates
Bars represent the percentage of correctly assigned serotypes by the participants.
3.4 Molecular typing-based cluster analysis Participants were to correctly identify the cluster of closely related isolates defined by pre-categorisation from the EQA provider among the 11 cluster test isolates using either PFGE and/or WGS-derived data.
The EQA provider’s PFGE results were based on combined ApaI and AscI profiles. The EQA provider’s cluster analysis of WGS-derived data was based on an allele-based analysis (cgMLST [6]) and an SNP analysis (NASP [7]). The correct number of closely related isolates (4) could be identified by both PFGE and WGS-derived data. The cluster contained four ST6 isolates: REF1, REF4, REF9 and REF11 (REF4 and REF9 were technical duplicates). The EQA provider found at most five allele differences or three SNPs between any two isolates in the cluster. The rest of the cluster test isolates were an additional four ST6s, one ST1, one ST213 and one ST382 (Annexes 3–4).
3.4.1 PFGE-derived data Seven (35%) participants performed cluster analysis using PFGE-derived data. Performance was high, with six (86%) of the participants correctly identifying the cluster of closely related isolates defined by a pre-categorisation from the EQA provider among the 11 cluster test isolates. Table 2 shows the overview of the isolate each participant included or excluded in their cluster identification. Laboratory 145 reported all 11 cluster isolates as part of the cluster of closely related isolates and had misunderstood the meaning of selecting a cluster representative. Instead, laboratory 145 selected Salmonella Braenderup (S. Braenderup) 9812, which is normally used as a size marker.

TECHNICAL REPORT Fifth external quality assessment scheme for Listeria monocytogenes typing
11
Table 2. Results of cluster identification based on PFGE-derived data Laboratory ID Isolate no. ST 19 100 105 138 141 142 145 REF1‡ 6 Yes Yes Yes Yes Yes Yes Yes REF2 1 No No No No No No Yes REF3 6 No No No No No No Yes REF4‡# 6 Yes Yes Yes Yes Yes Yes Yes REF5 6 No No No No No No Yes REF6 6 No No No No No No Yes REF7 213 No No No No No No Yes REF8 6 No No No No No No Yes REF9‡# 6 Yes Yes Yes Yes Yes Yes Yes REF10 382 No No No No No No Yes REF11‡ 6 Yes Yes Yes Yes Yes Yes Yes Cluster identified conclusion Yes Yes Yes Yes Yes Yes No
‡ Closely related isolates # Technical duplicate isolates (Annex 5).
For each isolate, participants were instructed to report the total number of bands in the ApaI and AscI profiles separately. The number of bands shared between each test isolate and the selected cluster representative was reported for each enzyme (Figure 6). Data from the laboratory that had misunderstood this part is not shown in Figure 6 (Annexes 5–6).
In Figure 6, A and B show the difference between the number of bands reported by the participants and the number observed by the EQA provider for ApaI and AscI respectively. Only laboratory 138 reported one to two bands more or less in the ApaI profiles compared with the EQA provider’s results.
C and D show the difference between the participants’ reported number of shared bands with a selected cluster representative and the number observed by the EQA provider for ApaI and AscI, respectively. The majority of differences (12/14) were reported by laboratory 138, which recorded a higher number of shared bands using ApaI and a lower number of shared bands using AscI. Band differences above 2 were not observed.
Figure 6. Difference between reported total number of bands (A and B) and shared bands (C and D) for each isolate to selected isolates
Data from all eight ST6 isolates: REF1, REF3, REF4, REF5, REF6, REF8, REF9 and REF11. C: Laboratory 141 only reported data for six isolates (Annex 6).
C D

Fifth external quality assessment scheme for Listeria monocytogenes typing TECHNICAL REPORT
12
3.4.2 WGS-derived data Reported results from participants Twelve participants (60%) performed cluster analysis using WGS-derived data. Only one laboratory reported using external assistance for sequencing. Different sequencing platforms were listed among the participants: 1 MiniSeq, 6 MiSeq, 2 HiSeq, 1 NextSeq and 2 Ion Torrent. All reported using commercial kits for library preparation. Out of the 12 participants, eight (67%) used Illumina’s Nextera kit. Two participants reported volume changes from the manufactory protocol and one laboratory- listed increased (5 ng) input DNA, altered PCR protocol to favour longer fragment sizes, adjustment of extension temperature from 72°C to 65°C and ‘manual’ normalisation using library concentration and fragment size as opposed to bead-based normalisation (Annex 7).
Performance was high in cluster analysis with WGS-derived data. Nine participants (75%) correctly identified the cluster of closely related isolates defined by pre-categorisation from the EQA provider among the 11 test isolates (Table 3). Laboratories 105 and 56 only analysed WGS data from 10 and seven isolates respectively due to data quality not meeting the laboratory’s own QC standards, but identified the correct cluster among the remaining isolates. When these two laboratories are included, performance was even higher at 92% out of 11 laboratories. One laboratory included all ST6 isolates as being in the cluster of closely related isolates.
Table 3. Results of cluster identification based on WGS-derived data Laboratory ID
Isolate no. ST 19 35 56 70 105 108 129 135 141 142 144 146 REF1‡ 6 Yes Yes Yes Yes Yes Yes Yes Yes Yes Yes Yes Yes REF2 1 No No ND No No No No No No No No No REF3 6 No No No No No No No No No No No Yes REF4‡# 6 Yes Yes ND Yes Yes Yes Yes Yes Yes Yes Yes Yes REF5 6 No No No No No No No No No No No Yes REF6 6 No No No No No No No No No No No Yes REF7 213 No No ND No No No No No No No No No REF8 6 No No ND No No No No No No No No Yes REF9‡# 6 Yes Yes Yes Yes ND Yes Yes Yes Yes Yes Yes Yes REF10 382 No No No No No No No No No No No No REF11‡ 6 Yes Yes Yes Yes Yes Yes Yes Yes Yes Yes Yes Yes Main analysis Allele Allele SNP Allele SNP SNP Allele Allele Allele Allele Allele SNP Additional analysis SNP Allele SNP Identified cluster Yes Yes Yes Yes Yes Yes Yes Yes Yes Yes Yes No
‡ Closely related isolates # Technical duplicate isolates ST: Sequence type ND: Not evaluated due to data quality not meeting laboratory’s own QC thresholds Allele: Allele-based analysis SNP: Single-nucleotide polymorphism (Annex 8).
Laboratories were instructed to report the data analysis used for cluster identification and select a representative isolate in the cluster for reporting SNP distance or allelic differences between the selected isolate and each test isolate included in analysis. Laboratories could report results from up to three analyses (1 main and 1–2 additional), but the detected cluster had to be based on results from the main analysis.
Out of the six participants using SNP, only four (33%) used SNP as the main analysis for cluster detection, while two reported SNP as an additional analysis. Five out of six (83%) used a reference-based approach with different ST6 isolates as reference. Two used Burrows-Wheeler Aligner (BWA) and two used CLC as the read mapper, but different variant callers were used (Tables 4–5).

TECHNICAL REPORT Fifth external quality assessment scheme for Listeria monocytogenes typing
13
Table 4. Results of SNP-based cluster analysis
* Additional analysis # Only three isolates included due to data quality not meeting laboratory’s own QC thresholds ¤ Reported distance to ST6 (non-ST6) isolates (Annex 9).
Eight of the nine participants that used allele-based analysis selected this method as the main analysis for cluster detection (Table 5 legend). Eight of nine (89%) used an assembly-based allele calling method and laboratory 19 used both mapping and assembly-based allele calling (Table 5). All reported using cgMLST, six (60%) used cgMLST Ruppitsch [9], two cgMLST Pasteur [6] and one an in-house cgMLST scheme.
Table 5. Results of allele-based cluster analysis
* Additional analysis # Only three isolates included due to data quality not meeting laboratory’s own QC thresholds (Annex 9).
All nine laboratories performing cgMLST identified the correct cluster of closely related isolates (Figure 7). Eight laboratories reported allele differences of 0-4 within the cluster and laboratory 141 reported an allele difference within the cluster of at most 7 (Figure 7, Table 5). The differences reported depended on the isolate selected as cluster representative. Five laboratories selected REF11, four used REF4 or REF9 (technical duplicates) and none selected REF1 (Figure 7).
Four other test isolates (REF3, REF5, REF6 and REF8) were also ST6, but not pre-defined by the EQA provider as part of the cluster. Based on cgMLST, the nine laboratories reported allele differences to the selected cluster isolate at 13-50 for this group of isolates. Three test isolates (REF2, REF7 and REF10) were not ST6 and allele differences to the selected cluster isolate at 839-2042 were reported (Table 5,Annex 9).
Laboratories 19 and 142 used the same cgMLST scheme as the EQA provider (cgMLST/Pasteur) [6] and all but one laboratory used the Ruppitsch scheme [9]. All participants reported similar results, with allele differences within the cluster of 7 at most.
Lab ID SNP-based
Approach Reference Read mapper Variant caller Assembler Distance within cluster Distance outside cluster Provider Reference-based ST6 (REF4) BWA GATK 0-3 38-71 19* Reference-based ST6 ID 2362 BWA GATK 0-4 43-81 56 Assembly-based ksnp3 SPAdes 0-57# 561-591 (6109) 105 Reference-based ST6 J1817 Bowtie2 VARSCAN 2 0-2# 22-42 (1049)
108 Reference-based In-house strain resp ST
CLC assembly cell v4.4.2
CLC assembly cell v4.4.2 0-2 37-72
142* Reference-based Listeria EGDe (cc9) CLC Bio CLC Bio 0-1219 1223-2814 (8138)
146 Reference-based ST6 ref. CP006046
ST1 ref. F2365 ST213/ST382 no
ref. BWA In-house 0-358
Lab ID Allele based analysis
Approach Allelic calling method Assembler Scheme Difference within cluster
Difference outside cluster
EQA provider BioNumerics Assembly- and mapping-based SPAdes Applied Math
(cgMLST/Pasteur) 0-3 24-1112
19 BioNumerics Assembly- and mapping-based SPAdes Applied Math
(cgMLST/Pasteur) 0-3 25-1120
35 SeqPhere Assembly-based only Velvet Ruppitsch (cgMLST) 0-2 16-1065 70 SeqPhere Assembly-based only Velvet Ruppitsch (cgMLST) 0-2 16-1062 105* SeqPhere Assembly-based only SPAdes v 3.80 Ruppitsch (cgMLST) 0-1# 23-812 129 SeqPhere Assembly-based only Velvet In-house (cgMLST) 0-4 15-862
135 SeqPhere Assembly-based only CLC Genomics Workbench 10 Ruppitsch (cgMLST) 0-2 16-2042
141 SeqPhere Assembly-based only SPAdes 3.9.0 Ruppitsch (cgMLST) 0-7 19-1060 142 Inhouse Assembly-based only SPAdes Pasteur (cgMLST) 0 13-1120 144 SeqPhere Assembly-based only Velvet Ruppitsch (cgMLST) 0-2 16-1065

Fifth external quality assessment scheme for Listeria monocytogenes typing TECHNICAL REPORT
14
Figure 7. Reported SNP distances or allelic differences for each test isolate to selected cluster representative isolate
* Additional analysis SNP: Single nucleotide polymorphism Selected cluster representative marked as REF in dark green: Reported cluster of closely related isolates Light green: Not reported as part of cluster.
Of the six laboratories performing SNP analysis (four as main analysis and two as additional), laboratories 19, 56, 105 and 108 identified the correct cluster of closely related isolates (Figure 7). Laboratory 146 performed only SNP analysis and could not identify the correct cluster. Laboratory 142 correctly identified the cluster using main analysis, but the additional SNP analysis provided no clear separation of cluster and non-cluster isolates.
The reported SNP differences within the cluster varied from 0-4 (laboratories 19, 105 and 108) to 0-57 (laboratory 56). If the cut-off for cluster definition used by laboratory 56 was used on data from laboratory 19, 105 and 108, all eight ST6 isolates would have been included in the cluster. Very high SNP differences within the cluster were also reported by laboratories 146 (0-309) and 142 (0-1219). Laboratory 146 identified a cluster of eight isolates as closely related based on a reported SNP difference of 0-358 to the selected cluster representative isolate. In addition, the same laboratory selected a non-cluster isolate (REF3) as the cluster representative, while the other five laboratories performing SNP analysis selected REF11 (two), REF1 (one), or REF4 or 9 (two) as the cluster representative.
Analysis of raw reads uploaded by participants In addition to the reported cluster identification, participants submitted their FASTQ files to be evaluated by the EQA provider. The FASTQ files were uploaded to an Applied Maths calculation engine for allele calling (Institut Pasture)[6] and evaluated by the EQA provider’s in-house quality control (QC) pipeline [10].
The overall cgMLST analysis, shown in the minimum spanning tree (MST) based on submitted raw reads (FASTQ files) from 12 laboratories reveals clear clustering of the results for each test isolate (Figure 8). One laboratory seem to have switched the labels of the isolates and the numbering. All nine results in Figure 8 where an isolate (colour) is clustered wrongly are due to data from laboratory 146. It appears to be a labelling switch and not sequencing errors as the isolates still cluster as expected.
SNP-based analysis Allele-based analysis
TECHNICAL REPORT Fifth external quality assessment scheme for Listeria monocytogenes typing
15
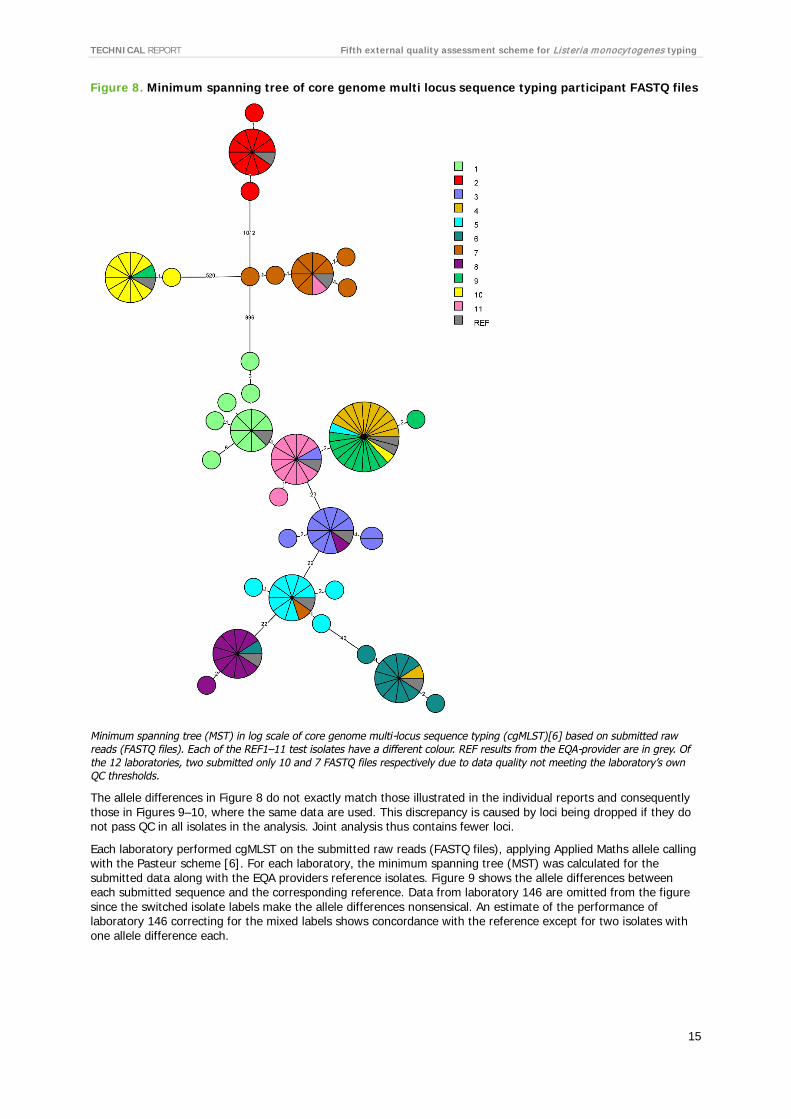
Figure 8. Minimum spanning tree of core genome multi locus sequence typing participant FASTQ files
Minimum spanning tree (MST) in log scale of core genome multi-locus sequence typing (cgMLST)[6] based on submitted raw reads (FASTQ files). Each of the REF1–11 test isolates have a different colour. REF results from the EQA-provider are in grey. Of the 12 laboratories, two submitted only 10 and 7 FASTQ files respectively due to data quality not meeting the laboratory’s own QC thresholds.
The allele differences in Figure 8 do not exactly match those illustrated in the individual reports and consequently those in Figures 9–10, where the same data are used. This discrepancy is caused by loci being dropped if they do not pass QC in all isolates in the analysis. Joint analysis thus contains fewer loci.
Each laboratory performed cgMLST on the submitted raw reads (FASTQ files), applying Applied Maths allele calling with the Pasteur scheme [6]. For each laboratory, the minimum spanning tree (MST) was calculated for the submitted data along with the EQA providers reference isolates. Figure 9 shows the allele differences between each submitted sequence and the corresponding reference. Data from laboratory 146 are omitted from the figure since the switched isolate labels make the allele differences nonsensical. An estimate of the performance of laboratory 146 correcting for the mixed labels shows concordance with the reference except for two isolates with one allele difference each.

Fifth external quality assessment scheme for Listeria monocytogenes typing TECHNICAL REPORT
16
Figure 9. Participant allele difference from reference result (EQA-provider) for each test isolate
Allele difference of participant isolates from corresponding REF isolates (EQA provider) based on submitted raw reads (FASTQ files). Data from laboratory 146 are excluded due to switched isolate labels. Only 7 and 10 isolates respectively are used for laboratories 56 and 105 due to data quality not meeting laboratory’s own QC thresholds.
For 74 of 116 results (64%), no difference was identified. For 40 results (34%), a difference of 1–2 alleles from the REF isolate was calculated and a difference of 3 and 6 alleles were seen from laboratories 141 and 129 for only 2 results (2%). Data from five of the 11 laboratories (70, 108, 129, 141 and 144) covered 76% (32/42) of all allele differences. Laboratories 70 and 144 had 8 and 9 isolates respectively, with one or more allele differences. The provider result for REF11 was one allele removed from the majority of the participants and the two results with more than two allele differences both originated from REF1 (data not shown). Separately, the laboratories listed quantitative and qualitative QC parameters used to evaluate their data. As seen in Table 6, coverage was the most widely used QC parameter, with acceptance thresholds ranging from 20-60X coverage. CgMLST quality metrics were widely used, as was the correct assembly length and a genus/species confirmation or contamination check. For the full QC evaluation of all isolates, see Annex 10.
Table 6. Summary of quantitative and qualitative parameters reported by participants
Parameters Number of laboratories Coverage 10 Number of good cgMLST targets 7 Genome size 6 Confirmation of genus 6 Q score (Phred) 5 Number of contigs 3 FastQC per base sequence content 2 N50 2 Others 5
Figure 10A shows the allele differences from Figure 9 plotted against the coverage of the individual isolate. The isolate that differs by 6 alleles has a coverage that exceeds the reported QC coverage thresholds. Figure 10B shows the allele differences from Figure 9 plotted against the number of contigs with coverage below 25. Both the isolates with 3 and 6 allele differences have a higher number of low-coverage contigs.

TECHNICAL REPORT Fifth external quality assessment scheme for Listeria monocytogenes typing
17
Figure 10. Calculated allele difference between participant and REF isolates compared with selected QC parameters
Allele difference of participant isolates from corresponding REF isolates from Figure 9 plotted against average coverage of submitted raw reads (FASTQ files) calculated by EQA provider QC pipeline (A) and number of contigs with minimum coverage <25 when reads are mapped back against SPAdes de novo assembly (B).
A
B
Fifth external quality assessment scheme for Listeria monocytogenes typing TECHNICAL REPORT
18
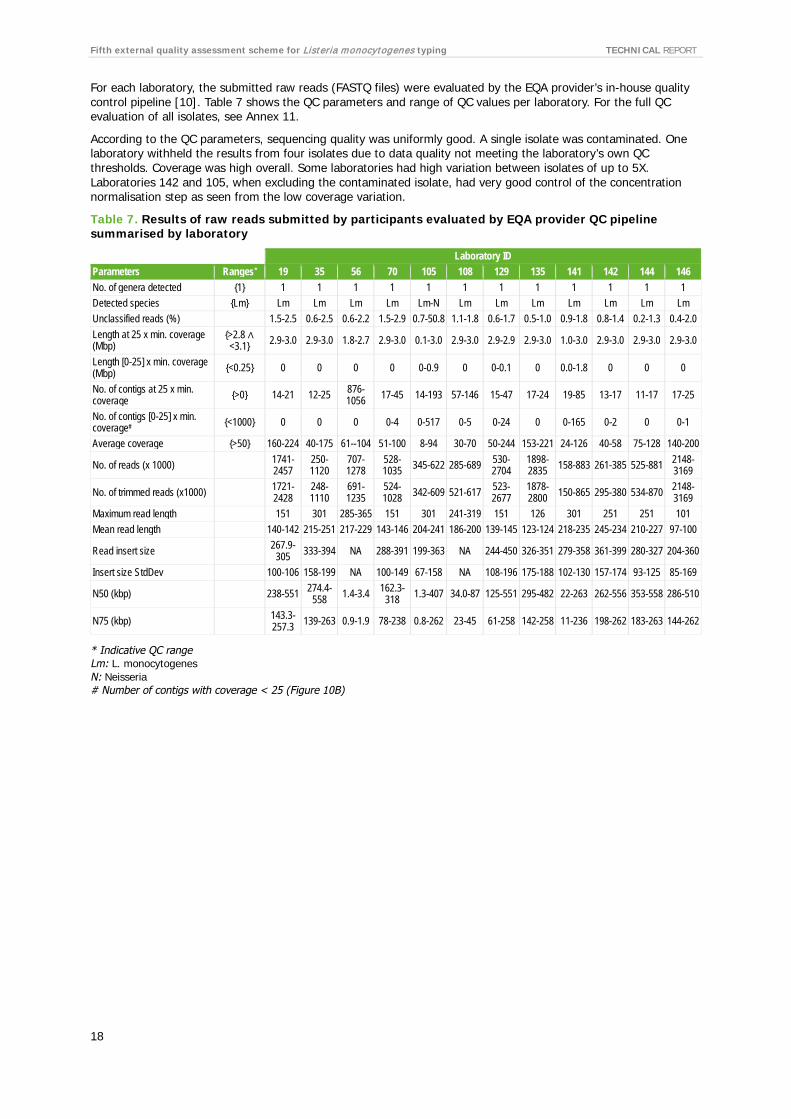
For each laboratory, the submitted raw reads (FASTQ files) were evaluated by the EQA provider’s in-house quality control pipeline [10]. Table 7 shows the QC parameters and range of QC values per laboratory. For the full QC evaluation of all isolates, see Annex 11.
According to the QC parameters, sequencing quality was uniformly good. A single isolate was contaminated. One laboratory withheld the results from four isolates due to data quality not meeting the laboratory’s own QC thresholds. Coverage was high overall. Some laboratories had high variation between isolates of up to 5X. Laboratories 142 and 105, when excluding the contaminated isolate, had very good control of the concentration normalisation step as seen from the low coverage variation.
Table 7. Results of raw reads submitted by participants evaluated by EQA provider QC pipeline summarised by laboratory
Laboratory ID Parameters Ranges* 19 35 56 70 105 108 129 135 141 142 144 146 No. of genera detected {1} 1 1 1 1 1 1 1 1 1 1 1 1 Detected species {Lm} Lm Lm Lm Lm Lm-N Lm Lm Lm Lm Lm Lm Lm Unclassified reads (%) 1.5-2.5 0.6-2.5 0.6-2.2 1.5-2.9 0.7-50.8 1.1-1.8 0.6-1.7 0.5-1.0 0.9-1.8 0.8-1.4 0.2-1.3 0.4-2.0 Length at 25 x min. coverage (Mbp)
{>2.8 ∧ <3.1} 2.9-3.0 2.9-3.0 1.8-2.7 2.9-3.0 0.1-3.0 2.9-3.0 2.9-2.9 2.9-3.0 1.0-3.0 2.9-3.0 2.9-3.0 2.9-3.0
Length [0-25] x min. coverage (Mbp) {<0.25} 0 0 0 0 0-0.9 0 0-0.1 0 0.0-1.8 0 0 0
No. of contigs at 25 x min. coverage {>0} 14-21 12-25 876-
1056 17-45 14-193 57-146 15-47 17-24 19-85 13-17 11-17 17-25
No. of contigs [0-25] x min. coverage# {<1000} 0 0 0 0-4 0-517 0-5 0-24 0 0-165 0-2 0 0-1
Average coverage {>50} 160-224 40-175 61--104 51-100 8-94 30-70 50-244 153-221 24-126 40-58 75-128 140-200
No. of reads (x 1000) 1741-2457
250-1120
707-1278
528-1035 345-622 285-689 530-
2704 1898-2835 158-883 261-385 525-881 2148-
3169
No. of trimmed reads (x1000) 1721-2428
248-1110
691-1235
524-1028 342-609 521-617 523-
2677 1878-2800 150-865 295-380 534-870 2148-
3169 Maximum read length 151 301 285-365 151 301 241-319 151 126 301 251 251 101 Mean read length 140-142 215-251 217-229 143-146 204-241 186-200 139-145 123-124 218-235 245-234 210-227 97-100
Read insert size 267.9-305 333-394 NA 288-391 199-363 NA 244-450 326-351 279-358 361-399 280-327 204-360
Insert size StdDev 100-106 158-199 NA 100-149 67-158 NA 108-196 175-188 102-130 157-174 93-125 85-169
N50 (kbp) 238-551 274.4-558 1.4-3.4 162.3-
318 1.3-407 34.0-87 125-551 295-482 22-263 262-556 353-558 286-510
N75 (kbp) 143.3-257.3 139-263 0.9-1.9 78-238 0.8-262 23-45 61-258 142-258 11-236 198-262 183-263 144-262
* Indicative QC range Lm: L. monocytogenes N: Neisseria # Number of contigs with coverage < 25 (Figure 10B)

TECHNICAL REPORT Fifth external quality assessment scheme for Listeria monocytogenes typing
19
4. Discussion 4.1 Serotyping Eighteen laboratories participated in the serotyping part of the EQA-5, of which six participants (33%) provided conventional serotyping results and 17 (94%) provided molecular serotyping results. Five participants performed both serotyping methods. Performance was high for both methods, with 67% and 88% of the participating laboratories correctly serotyping all 11 L. monocytogenes test isolates by conventional or molecular methods respectively.
4.1.1 Conventional serotyping The performance of the conventional serotyping results was acceptable (67%), but a decrease was observed compared with EQA-4, where the same number of errors were reported, but more laboratories participated. Again this year, the main problem was an uncommon serotype 3a isolate that two laboratories reported as 1/2a. One of the laboratories repeated the mistake from EQA-3, reporting 1/2a instead of 3a. One explanation for this mistyping could be difficulties in agglutination with the IV serum that defines the O:3 groups. If the I/II polyvalent sera are positive and the I monovalent serum is negative, the agglutinations need to be evaluated in parallel when observing negative results for I and IV monovalent sera. This step requires well trained eyes in order to see the agglutination in IV monovalent serum and not the I serum. Comparing the conventional serotyping results from EQA-1 to -5, the three repeated isolates showed stable high performances among participants during the EQAs and all six participants serotyped the three repeated isolates correctly. All participants performed at the same level or better than the year before.
4.1.2 Molecular serotyping The performance of the PCR-based molecular serotyping was high, with 88% of participants obtaining a score of 100% correct. The two errors were from two different laboratories reported in two different isolates. One of the errors was in isolate SERO9, a technical duplicate of SERO3, which the participant correctly serotyped as IIc. The general performance among the participating laboratories was high and increased from EQA-1 (57%, 7 participants) to -5 (88%, 17 participants). The majority of participants (94%) correctly serotyped all three repeated isolates. All but one participant performed at the same level or better than the year before.
4.2 Molecular typing-based cluster analysis The EQA scheme no longer covers PFGE as an independent part, but by adding cluster identification using either PFGE and/or WGS-derived data, this EQA is contemporary with the development of surveillance methods used by public health national reference laboratories in Europe. This adjustment of the EQA appears to be well accepted by the Member States as 15 of the twenty laboratories (75%) participated. Only seven participated in cluster identification using PFGE-derived data and only three of them did not also participate in cluster identification using WGS-derived data. However, six laboratories participating in PFGE in EQA-4 did not participate in cluster identification in EQA-5. This decrease in the number of participants could be caused by adding WGS or removing PFGE as an independent part and no longer give the laboratories an external quality assessment of their PFGE performance.
4.2.1 PFGE-derived data Out of the twenty laboratories, seven (35%) performed cluster analysis using PFGE-derived data. Performance was high, with 6 participants (86%) correctly identifying the cluster of closely related isolates. The present cluster designed by the EQA provider allowed the participants to detect the same number of closely related isolates by both PFGE and WGS, but both ApaI and AscI enzymes were needed to identify the correct number of isolates by PFGE. Neither the ApaI nor AscI profiles alone would have delineated the cluster correctly. Only one laboratory did not identify the cluster. However, this was probably due to not understanding the terms ‘reference’ used for S. Braenderup and ‘a cluster representative isolate’. Another laboratory thath had minor differences in the total number of observed bands in ApaI profiles and in shared bands in both ApaI and AscI profiles compared with the EQA provider did identify the correct cluster.
4.2.3 WGS-derived data Twelve out of the twenty laboratories (60%) performed cluster analysis using WGS-derived data. Performance was very high, with 11 (92%) correctly identifying the cluster of closely related isolates, but two laboratories could not obtain WGS data for all test isolates. Only one laboratory reported the use of external assistance for sequencing and the majority (10/12) reported using an Illumina platform. All reported using commercial kits for preparing the library.
Fifth external quality assessment scheme for Listeria monocytogenes typing TECHNICAL REPORT
20
Out of the twelve laboratories, eight (67%) reported using an allele-based method as the main analysis and four (33%) reported using SNP analysis. The one laboratory not identifying the correct cluster had used SNP analysis. If only evaluating the main analysis of the laboratories reporting the correct cluster, the distances reported using SNP-based analysis showed a higher variation within the cluster isolates (0-57) than the allele differences reported using cgMLST (0-7).
Of the laboratories reporting SNP distances, three laboratories (50%) reported distances comparable to those reported using allele-based methods. The remaining three reported SNP distances that were several orders of magnitude higher. One laboratory used cgMLST as the main analysis and SNP analysis as an additional analysis. In the SNP analysis, it identified a very large number of SNPs and could not separate the cluster from the non-cluster isolates using the submitted SNP distances. Another laboratory correctly identified the cluster, but with a level of variance within the cluster incomparable to that found by the remaining laboratories. If a cluster was defined as any isolate within 57 SNPs of the selected reference isolate, other laboratories would report more than the correct four cluster isolates.
This is problematic in terms of inter-laboratory comparability and cluster definitions and makes the use of SNP distances obtained from non-standardised SNP analyses less suitable for communicating about genetic clusters when investigating international outbreaks. The reported high SNP distances seem unlikely to represent real biological divergence and are more likely to be artefacts of SNP calling.
Reported cgMLST results were much more comparable, with 0-7 allelic differences within the cluster isolates and 13-2042 outside the cluster, despite not being analysed using the same scheme. Analysing all participants’ raw reads in the same scheme [6], the maximum distance between any two cluster isolates were 9 allele differences (data not shown), similar to the distances reported by the participants. The choice of assembly tool seems not to have influence on the number of allelic differences.
The reported QC parameters (quantitative and qualitative) were used by the participants as QC of their data before analysis and submission. The main reported QC parameters, coverage, cgMLST allele calls and species confirmation, are all essential for the end use of the data.
In order to compare the quality of the raw data, the EQA provider analysed the submitted raw reads to obtain selected QC parameters. There appear to be laboratory differences in accuracy. The sequencing depths of the submitted raw reads vastly exceeded QC coverage thresholds reported by the participants’. This in combination with a high variation in sequencing depth makes sequencing more costly than necessary. Decreasing the variation in sequencing depth and subsequently the necessary overall sequencing depth could allow for significant savings in terms of higher multiplexing on the sequencer.
The EQA provider’s analysis of the submitted raw data showed that when using a standardised cgMLST analysis, a random variation of 1–2 alleles is likely to be observed even with high coverage (Figure 10). Only two isolates showed more variation, deviating from the EQA provider’s reference with 3 and 6 alleles respectively (both isolates correspond to REF1). The result with 3 allele differences from the references had low overall sequencing depth. The result with 6 allele differences had fairly high overall coverage, but upon assembly, a number of low-coverage contigs occurred. Apparently this uneven coverage can lead to inflated allele differences. Low average coverage can be resolved by lower multiplexing of samples in sequencing runs and more care in the normalisation of the multiplexed samples. The cause of the uneven coverage is unknown.

TECHNICAL REPORT Fifth external quality assessment scheme for Listeria monocytogenes typing
21
5. Conclusions Twenty laboratories participated in the EQA-5 scheme, with 18 (90%) performing serotyping and 15 (75%) cluster identification. In the EQA program, a change was made from including quality assessment of PFGE in EQA-4 to including a molecular typing-based cluster analysis using either PFGE and/or WGS-derived data in EQA-5. This adjustment of the EQA seemed to be well accepted by Member States, but a decrease in the number of participants was seen compared with previous years. The level of participation in serotyping remained the same, but not all laboratories performing PFGE (EQA-4) signed up for molecular typing-based cluster analysis.
In the present EQA, only a small percentage of the serotyping participating laboratories (6%, 1/18) solely performed conventional serotyping. Most laboratories (67%, 12/18) performed only molecular serotyping and 28% molecular serotyping in combination with the conventional serotyping. In general, a trend towards substituting conventional serotyping with molecular was observed through the five EQAs, reflecting a decrease in participation in conventional serotyping from 63% to 33% and an increase in molecular serotyping from 44% to 94% from EQA-1 to 5.
In general, the quality of serotyping was high. The performance of molecular serotyping was highest, with 67% and 88% of the participants correctly serotyping all test isolates by conventional and molecular methods respectively. In EQA-3, the main problem was an uncommon serotype 3a isolate, which again caused two out the three errors in the conventional serotyping this year.
Incorporating molecular typing-based cluster analysis in this EQA is up to date with the development of surveillance methods used by public health national reference laboratories in Europe. Out of the twenty laboratories participating the EQA-5, fifteen (75%) performed cluster analysis using either PFGE and/or WGS-derived data.
Seven laboratories participated using PFGE for cluster analysis. Three participated solely using PFGE-derived data for analysis. Only one did not identify the correct cluster using PFGE, probably due to misunderstanding the purpose of the analysis. Correct identification of the isolates in the cluster of closely related isolates needed analysis with both enzymes (ApaI and AscI).
Twelve laboratories performed cluster analysis using WGS-derived data. The performance was high, 11 (92%) of the participants correctly identified the cluster of closely related isolates, but two laboratories only identified a cluster of three isolates due to data quality not meeting the laboratory’s own QC thresholds for one of the cluster isolates.
An allele-based method was preferred, as 67% (8/12) used cgMLST compared to 33% (4/12) using SNP as the main reported cluster analysis. In general, the reported cgMLST results were at a comparable level of allelic difference (0-7) within the cluster isolates despite analysis with different schemes. This highlights the advantages of cgMLST as a method for inter-laboratory comparability and communication about cluster definitions. The EQA results also illustrated the challenges in using non-standardised SNP analysis as a method for inter-laboratory comparison and cluster definition.
The current EQA scheme for L. monocytogenes typing is the fifth organised for laboratories in FWD-Net. The molecular surveillance system implemented as part of TESSy relies on the capacity of FWD-Net laboratories to produce analysable and comparable typing results in a central database. In 2018, it is planned to allow WGS variables for L. monocytogenes to be submitted to TESSy to be used for EU-wide surveillance and cross-sector comparison.

Fifth external quality assessment scheme for Listeria monocytogenes typing TECHNICAL REPORT
22
6. Recommendations 6.1 Laboratories Two participants in the WGS-based cluster analysis experienced generated sequences not meeting their own QC criteria and had neither the time nor resources to repeat the failed analyses. Participants are encouraged to assign sufficient resources to repeat failed analysis if required.
Results from the EQA disclose higher variations between different SNP pipelines analysing the same isolate compared with allele-based analysis. For some laboratories, a more conservative SNP calling would facilitate better cluster delineation. Generally, standardiszation of analysis parameters would improve inter-laboratory comparability.
One laboratory mislabelled the submitted raw read files. Laboratories are encouraged to check correct relabelling by checksum or otherwise before submission if internal labelling is used.
6.2 ECDC and FWD-Net ECDC planes to encourage and assist new participants ever better, potentially with training or workshops. ECDC is working on standardise the TESSy system for use of MLST nomenclature and cgMLST.
6.3 EQA provider This year, the EQA provider changed the invitation letter to contain the recommended methods and a short description of the molecular typing-based cluster analysis. The requirements for submission and evaluation criteria were also listed. The submission protocol was short and precise, but some laboratories did not follow protocol when labelling the FASTQ files. In the next round, participants who do not comply with the requested naming convention of FASTQ files will be asked to rename their files.
The link to the online submission waspersonal to the e-mail listed during registration, so participants need to circulate the e-mail within their institute. The participants will be made aware of this issue in the next round.
Participants were instructed to perform the PCR for the molecular serotyping. It is unclear if some of the participants have already replaced it with an in silico PCR (gene detected based on WGS). This will be possible to report in the next round of the EQA.
In the next round of EQAs, laboratories can submit the ST of the isolates in the cluster analysis. They will also be asked to report the number of loci in the used allelic scheme and the name of the used SNP-pipeline if publicly available. The EQA provider will try to give the participants more time to test and report the results.
TECHNICAL REPORT Fifth external quality assessment scheme for Listeria monocytogenes typing
23
7. References 1. Official Journal of the European Union. Regulation (EC) No 851/2004 of the European Parliament and of the
Council of 21 April 2004 establishing a European Centre for Disease Prevention and Control, Article 5.3. Strasbourg: European Parliament and European Council; 2004. Available from: http://ecdc.europa.eu/en/aboutus/Key%20Documents/0404_KD_Regulation_establishing_ECDC.pdf.
2. Official Journal of the European Union. Decision No 1082/2013/EU of the European Parliament and the Council of 22 October 2013 on serious cross-border threats to health and repealing Decision No 2119/98/EC (Text with EEA relevance). Strasbourg: European Parliament and European Council; 2013. Available from: http://ec.europa.eu/health/preparedness_response/docs/decision_serious_crossborder_threats_22102013_en.pdf.
3. European Food Safety Authority and European Centre for Disease Prevention and Control. The European Union summary report on trends and sources of zoonoses, zoonotic agents and food-borne outbreaks in 2016. EFSA Journal 2017;15(12):5077.
4. International Organization for Standardization. ISO/IEC 17043:2010 Conformity assessment -- General requirements for proficiency testing [Internet]. Vernier: ISO; 2015 [cited 20 June 2018]. Available at: http://www.iso.org/iso/catalogue_detail.htm?csnumber=29366.
5. Doumith M, Buchrieser C, Glaser P, Jacquet C, Martin P. Differentiation of the Major Listeria monocytogenes erovars by multiplex PCR. J J Clin Microbiol. 2004 Aug;42(8):3819-3822.
6. Moura A, Criscuolo A, Pouseele H, Maury MM, Leclercq A, Tarr C, et al. Whole genome-based population biology and epidemiological surveillance of Listeria monocytogenes. Nat Microbiol. 2016 Oct 10;2:16185. Available from: https://www.nature.com/articles/nmicrobiol2016185.
7. Doumith M, Jacquet C, Gerner-Smidt P, Graves LM, Loncarevic S, Mathisen T, et al. Multicenter validation of a multiplex PCR assay for differentiating the major Listeria monocytogenes serovars 1/2a, 1/2b, 1/2c, and 4b: toward an international standard. J Food Prot. 2005 Dec;68(12):2648-50.
8. Sahl JW, Lemmer D, Travis J, Schupp JM, Gillece JD, Aziz M, et al. NASP: an accurate, rapid method for the identification of SNPs in WGS datasets that supports flexible input and output formats. Microb Genom. 2016 Aug 25;2(8):e000074. Available from: http://mgen.microbiologyresearch.org/content/journal/mgen/10.1099/mgen.0.000074.
9. Ruppitsch W, Pietzka A, Prior K, Bletz S, Fernandez HL, Allerberger F, et al. Defining and Evaluating a Core Genome Multilocus Sequence Typing Scheme for Whole-Genome Sequence-Based Typing of Listeria monocytogenes. J Clin Microbiol. 2015 Sep;53(9):2869-76.
10. Statens Serum Institut. SerumQC [Internet, software package]. Copenhagen: Statens Serum Institut; 2017. Available from: https://github.com/ssi-dk/SerumQC.

Fifth external quality assessment scheme for Listeria monocytogenes typing TECHNICAL REPORT
24
Annex 1. List of participants Country Laboratory National institute
Austria NRL Listeria Austria AGES - Austrian Agency for Health and Food Safety
Belgium National Reference Centre Listeria Scientific Institute Public Health
Denmark Foodborne Infections Statens Serum Institut
Finland Expert Microbiology National Institute for Health and Welfare
France NRC Listeria Institut Pasteur
Germany NRC Salmonella and Other Bacterial Enterics Robert Koch- Institute, Branch Wernigerode
Greece National Reference Laboratory for Salmonella and Other Enteropathogens National School of Public Health
Hungary Department of Phage-Typing and Molecular Epidemiology National Public Health Institute
Ireland National Salmonella, Shigella and Listeria Reference Laboratory University Hospital Galway
Italy Department of Food Safety, Nutrition and Veterinary Public Health Istituto Superiore di Sanità
Latvia National Microbiology Reference Laboratory Riga East University Hospital
Lithuania National Public Health Surveillance Laboratory Nacionaliné Visuomenés Sveikatos Prieziuros Laboratorija
Luxembourg Epidémiologie et Génomique Microbienne Laboratoire National de Santé
Portugal LNR de Infeções Gastrintestinais Instituto Nacional de Saúde Doutor Ricardo Jorge
Slovakia NRC for Listeriosis Regional Public Health Authority
Slovenia Department for Public Health Microbiology National Laboratory of Health, Environment and Food, Centre for Medical Microbiology
Spain Neisseria, Listeria and Bordetella Unit (National Centre for Microbiology) Instituto de Salud Carlos III
Sweden Microbiology Folkhälsomyndigheten
The Netherlands
Ce ntre for Infectious Research, Diagnostics and Screening
National Institute for Public Health and the Environment
UK Gastrointestinal Bacteria Reference Unit Public Health England

TECHNICAL REPORT Fifth external quality assessment scheme for Listeria monocytogenes typing
25
Annex 2. Serotyping result scores Conventional serotyping
Laboratory ID Isolate no. Provider 49 56 100 141 142 145 Total score
SERO1 4b 4b 4b 4b 4b 4b 4b 100/1 SERO2 1/2b 1/2b 1/2a 1/2b 1/2b 1/2b 1/2b 83 SERO3#1 1/2c 1/2c 1/2c 1/2c 1/2c 1/2c 1/2c 100/67 SERO4 3a 3a 1/2a 1/2a 3a 3a 3a 67 SERO5#2 1/2b 1/2b 1/2b 1/2b 1/2b 1/2b 1/2b 100/100 SERO6 1/2a 1/2a 1/2a 1/2a 1/2a 1/2a 1/2a 100 SERO7 4b 4b 4b 4b 4b 4b 4b 100 SERO8 4b 4b 4b 4b 4b 4b 4b 100 SERO9#1 1/2c 1/2c 1/2c 1/2c 1/2c 1/2c 1/2c 100 SERO 10 1/2a 1/2a 1/2a 1/2a 1/2a 1/2a 1/2a 100 SERO 11#2 1/2b 1/2b 1/2b 1/2b 1/2b 1/2b 1/2b 100 Total score 100 82 91 100 100 100
Molecular serotyping Laboratory ID
Isolate no. Provider 19 35 56 70 88 96 100 105 108 129 130 141 142 143 144 145 146 Total score SERO1 IVb IVb IVb IVb IVb IVb IVb IVb IVb IVb IVb IVb IVb IVb IVb IVb IVb IVb 100 SERO2 IIb IIb IIb IIa IIb IIb IIb IIb IIb IIb IIb IIb IIb IIb IIb IIb IIb IIb 94 SERO3#1 IIc IIc IIc IIc IIc IIc IIc IIc IIc IIc IIc IIc IIc IIc IIc IIc IIc IIc 100 SERO4 IIa IIa IIa IIa IIa IIa IIa IIa IIa IIa IIa IIa IIa IIa IIa IIa IIa IIa 100 SERO5#2 IIb IIb IIb IIb IIb IIb IIb IIb IIb IIb IIb IIb IIb IIb IIb IIb IIb IIb 100 SERO6 IIa IIa IIa IIa IIa IIa IIa IIa IIa IIa IIa IIa IIa IIa IIa IIa IIa IIa 100 SERO7 IVb IVb IVb IVb IVb IVb IVb IVb IVb IVb IVb IVb IVb IVb IVb IVb IVb IVb 100 SERO8 IVb IVb IVb IVb IVb IVb IVb IVb IVb IVb IVb IVb IVb IVb IVb IVb IVb IVb 100 SERO9#1 IIc IIc IIc IIc IIc IIc IIc IIc IIc IIc IIa IIc IIc IIc IIc IIc IIc IIc 94 SERO 10 IIa IIa IIa IIa IIa IIa IIa IIa IIa IIa IIa IIa IIa IIa IIa IIa IIa IIa 100 SERO 11#2 IIb IIb IIb IIb IIb IIb IIb IIb IIb IIb IIb IIb IIb IIb IIb IIb IIb IIb 100 Total score 100 100 91 100 100 100 100 100 100 91 100 100 100 100 100 100 100
Pink: Incorrect Purple: Repeat isolates in EQA-1 to 5 # Set of technical duplicates 1 and 2
Fifth external quality assessment scheme for Listeria monocytogenes typing TECHNICAL REPORT
26
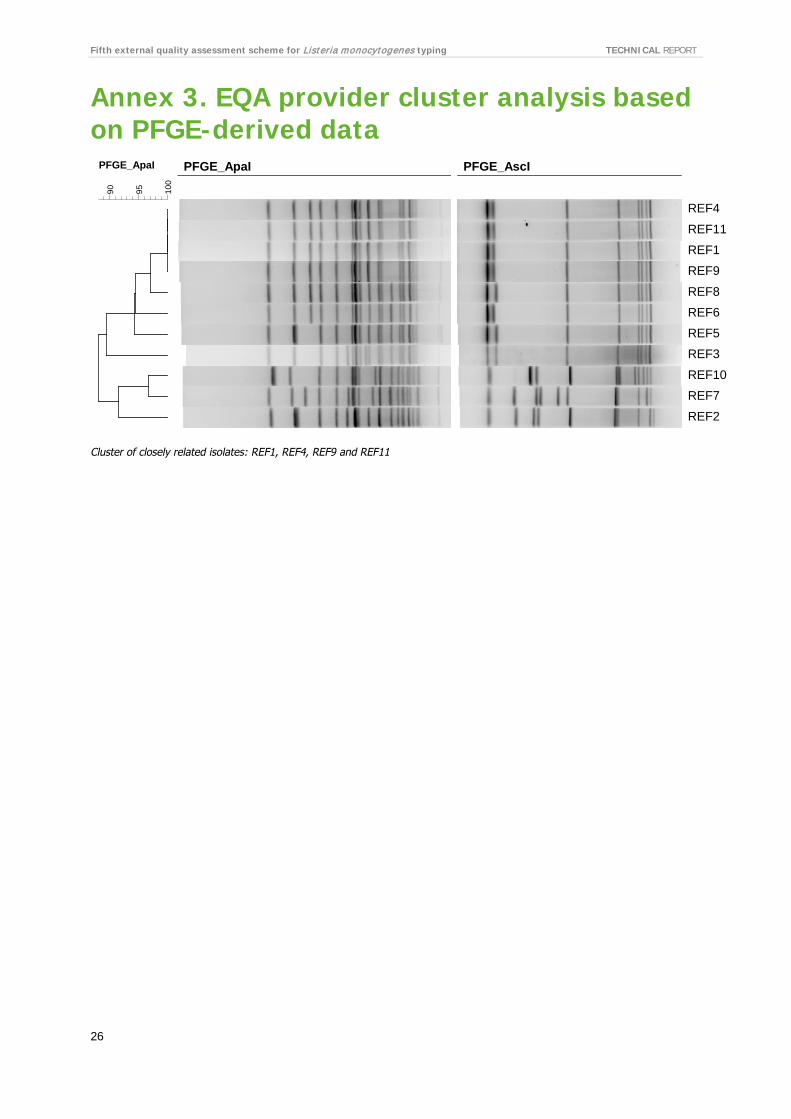
Annex 3. EQA provider cluster analysis based on PFGE-derived data
Cluster of closely related isolates: REF1, REF4, REF9 and REF11
PFGE_ApaI10
0
9590
PFGE_ApaI PFGE_AscI
REF4
REF11
REF1
REF9
REF8
REF6
REF5
REF3
REF10
REF7
REF2

TECHNICAL REPORT Fifth external quality assessment scheme for Listeria monocytogenes typing
27
Annex 4. EQA provider cluster analysis based on WGS-derived data
Minimum spanning tree of core genome multi locus sequence typing (cgMLST, [6]) profiles of L. monocytogenes EQA-5 isolates. Logarithmic scaling in BioNumerics.
Dark grey: Cluster isolates Light grey: Outside cluster isolates
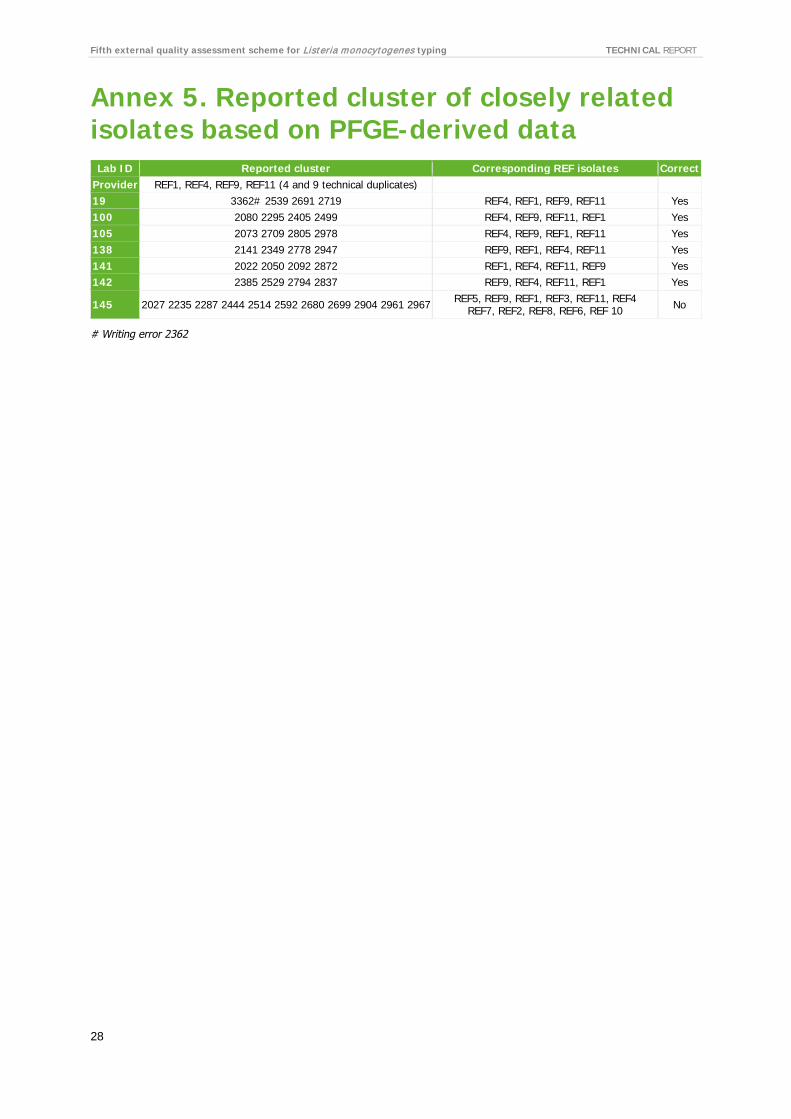
Fifth external quality assessment scheme for Listeria monocytogenes typing TECHNICAL REPORT
28
Annex 5. Reported cluster of closely related isolates based on PFGE-derived data
Lab ID Reported cluster Corresponding REF isolates Correct Provider REF1, REF4, REF9, REF11 (4 and 9 technical duplicates) 19 3362# 2539 2691 2719 REF4, REF1, REF9, REF11 Yes 100 2080 2295 2405 2499 REF4, REF9, REF11, REF1 Yes 105 2073 2709 2805 2978 REF4, REF9, REF1, REF11 Yes 138 2141 2349 2778 2947 REF9, REF1, REF4, REF11 Yes 141 2022 2050 2092 2872 REF1, REF4, REF11, REF9 Yes 142 2385 2529 2794 2837 REF9, REF4, REF11, REF1 Yes
145 2027 2235 2287 2444 2514 2592 2680 2699 2904 2961 2967 REF5, REF9, REF1, REF3, REF11, REF4 REF7, REF2, REF8, REF6, REF 10 No
# Writing error 2362

TECHNICAL REPORT Fifth external quality assessment scheme for Listeria monocytogenes typing
29
Annex 6. Reported band differences 8 Laboratory ID
Isolate no. ST Expected ApaI bands 19 100 105 138 141 142 145 REF1‡ 6 16 16 16 16 14 16 16 13 REF2 1 Clearly unrelated profile 15 15 15 15 15 14 13 REF3 6 18 18 18 18 16 18 18 16 REF4‡# 6 16 16 16 16 14 16 16 13 REF5 6 16 16 16 16 14 16 16 14 REF6 6 16 16 16 16 15 16 16 15 REF7 213 Clearly unrelated profile 16 17 16 16 16 16 15 REF8 6 17 17 17 17 15 17 17 14 REF9‡# 6 16 16 16 16 14 16 16 13 REF10 382 Clearly unrelated profile 16 16 16 16 16 15 14 REF11‡ 6 16 16 16 16 14 16 16 11
Laboratory ID Isolate no. ST Shared ApaI bands 19 100 105 138 141 142 145 REF1‡ 6 16 16 16 16 14 16 16 3 REF2 1 Clearly unrelated profile 9 6 13 9999 9999 10 0 REF3 6 15 15 14 15 9999 9999 15 4 REF4‡# 6 16 16 16 16 14 16 16 4 REF5 6 15 15 15 15 9999 15 15 3 REF6 6 15 15 15 15 15 15 15 2 REF7 213 Clearly unrelated profile 5 5 10 9999 9999 8 5 REF8 6 16 16 16 16 15 16 15 3 REF9‡# 6 16 16 16 16 14 16 16 3 REF10 382 Clearly unrelated profile 8 5 11 9999 9999 8 3 REF11‡ 6 16 16 16 16 14 16 16 2
Laboratory ID Isolate no. ST Expected AscI bands 19 100 105 138 141 142 145 REF1‡ 6 8 8 8 8 8 8 8 8 REF2 1 Clearly unrelated profile 10 10 9 8 10 10 9 REF3 6 8 8 8 8 8 8 8 8 REF4‡# 6 8 8 8 8 8 8 8 8 REF5 6 8 8 8 8 8 8 8 8 REF6 6 8 8 8 8 8 8 8 8 REF7 213 Clearly unrelated profile 10 11 11 10 11 11 10 REF8 6 8 8 8 8 8 8 8 8 REF9‡# 6 8 8 8 8 8 8 8 8 REF10 382 Clearly unrelated profile 11 11 12 11 11 11 11 REF11‡ 6 8 8 8 8 8 8 8 8
Laboratory ID Isolate no. ST Shared AscI bands 19 100 105 138 141 142 145 REF1‡ 6 8 8 8 8 8 8 8 3 REF2 1 Clearly unrelated profile 3 3 4 9999 9999 4 0 REF3 6 7 7 7 7 8 7 7 3 REF4‡# 6 8 8 8 8 8 8 8 0 REF5 6 7 7 7 7 8 7 7 0 REF6 6 8 8 8 8 8 8 8 0 REF7 213 Clearly unrelated profile 4 5 6 9999 9999 5 2 REF8 6 7 7 6 7 8 7 7 0 REF9‡# 6 8 8 8 8 8 8 8 0 REF10 382 Clearly unrelated profile 3 4 5 9999 9999 4 1 REF11‡ 6 8 8 8 8 8 8 8 0
‡Cluster identification of closely related isolates (based on PFGE-derived data) #Technical duplicate ST: Sequence type 9999: Not reported by laboratory.

Fifth external quality assessment scheme for Listeria monocytogenes typing TECHNICAL REPORT
30
Annex 7. Reported sequencing details Sequencing performed Protocol (library prep) Commercial kit Sequencing platform
In own laboratory Commercial kits Nextera XT DNA library Preparation Kit* HiSeq2500 In own laboratory Commercial kits NEBNext® Fast DNA Fragmentation & Library Prep Set for Ion Torrent, New England ’Biolabs** Ion Torrent PGM
Externally Commercial kits Illumina HiSeq 2500 In own laboratory Commercial kits Ion Xpress™ Plus Fragment Library Kit for AB Library Builder™ System IonTorrent S5XL In own laboratory Commercial kits Nextera XT MiSeq In own laboratory Commercial kits NEXTERA MiSeq In own laboratory Commercial kits SureSelect QXT Library Prep Kit (Agilent) MiSeq In own laboratory Commercial kits Nextera XT DNA Library Preparation Kit MiSeq In own laboratory Commercial kits Nextera XT MiSeq In own laboratory Commercial kits Nextera XT*** Miniseq In own laboratory Commercial kits Nextera XT Libray Prep kit (96 samples)*** NextSeq In own laboratory Commercial kits Illumina Nextera XT library Prep Kit MiSeq
* 5ng input DNA (as opposed to 1ng) Altered PCR protocol to favour longer fragment sizes Adjustment of extension temperature (and final extension) from 72° to 65°C ‘Manual’ normalisation using library concentration and fragment size as opposed to bead-based normalisation. ** Shearing carried out for 15 minutes at 25°C instead of 20 minutes because 400bp sequencing protocol was used *** Half volume for all reagents.

TECHNICAL REPORT Fifth external quality assessment scheme for Listeria monocytogenes typing
31
Annex 8. Reported cluster of closely related isolates based on WGS-derived data
Lab ID Reported cluster Corresponding to REF isolates Correct Provider REF1, REF4, REF9, REF11 (4 and 9 technical duplicates)
19 #3562 3539 2691 2719 REF4, REF1 REF9, REF11 Yes 35 2251 2737 2783 2993 REF11, REF9, REF1, REF4 Yes 56 2341 2165 2612 REF9, REF1, REF11 Yes 70 2104 2216 2567 2767 REF4, REF1, REF11, REF9 Yes
105 2073 2805 2978 REF4, REF1, REF11 Yes 108 2098 2788 2582 2422 REF1, REF11, REF9, REF4 Yes 129 2079 2640 2912 2950 REF1, REF9, REF11, REF4 Yes 135 2161 2423 2673 2897 REF1, REF4, REF11, REF9 Yes 141 2022 2050 2092 2872 REF1, REF4, REF11, REF9 Yes 142 2385 2529 2794 2837 REF9, REF4, REF11, REF1 Yes 144 2143 2626 2727 2822 REF4, REF11, REF1, REF9 Yes 146 2068 2197 2377 2488 ##2353 2575 2655 2726 REF5, REF8, REF3, REF1, REF6, REF4, REF9, REF11 No
#Writing error 2362 ##Writing error 2553

Fifth external quality assessment scheme for Listeria monocytogenes typing TECHNICAL REPORT
32
Annex 9. Reported SNP distance and allelic differences SNP distances
8 Laboratory ID Isolate no. ST Provider 19* 56 105 108 142* 146
REF1‡ 6 3 4 0¤ 1 2 1030 306 REF2 1 9999 9999 9999 812 9999 7502 9999 REF3 6 41 47 579 23 45 2814 0¤
REF4‡# 6 0¤ 0¤ 9999 1 2 1219 309 REF5 6 40 43 561 24 37 2056 259 REF6 6 72 81 591 42 72 2732 358 REF7 213 9999 9999 9999 734 9999 8050 9999 REF8 6 39 43 9999 22 40 1223 48
REF9‡# 6 0 0 57 9999 2 0¤ 296 REF10 382 9999 9999 6109 745 9999 8138 9999 REF11‡ 6 1 2 48 0¤ 0¤ 1114 304
Allelic distances Laboratory ID
Isolates no. ST Provider 19 35 70 105* 129 135 141 142 144 REF1‡ 6 3 3 1 1 1 4 1 7 0 1 REF2 1 1118 1120 1065 1062 812 862 2042 1060 1120 1065 REF3 6 25 25 16 16 23 15 16 19 16 16
REF4‡# 6 0¤ 0¤ 2 2 1 0 2 0¤ 0 2 REF5 6 26 26 18 18 24 17 17 20 13 18 REF6 6 44 43 35 35 42 32 50 38 41 36 REF7 213 1073 1070 1028 1026 734 842 1031 1024 1074 1028 REF8 6 28 28 24 24 22 20 39 26 22 24
REF9‡# 6 0 0 2 2 9999 0¤ 2 0 0¤ 2 REF10 382 1060 1060 1027 1021 745 839 1592 1025 1063 1027 REF11‡ 6 3 2 0¤ 0¤ 0¤ 2 0¤ 2 0 0¤
* Additional analysis ‡ Closely related isolates # Technical duplicate isolate ¤Isolate used as cluster representative by participant 9999: Isolates not included in analysis by participant ST: Sequence type
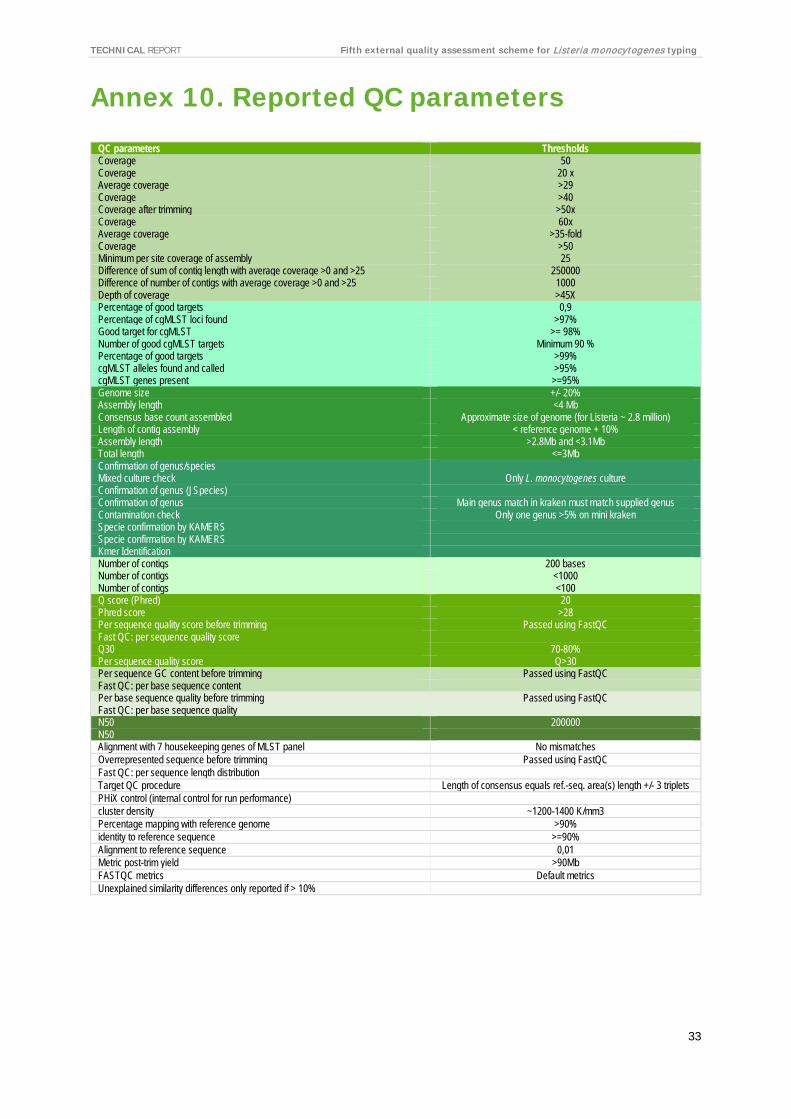
TECHNICAL REPORT Fifth external quality assessment scheme for Listeria monocytogenes typing
33
Annex 10. Reported QC parameters
QC parameters Thresholds Coverage 50 Coverage 20 x Average coverage >29 Coverage >40 Coverage after trimming >50x Coverage 60x Average coverage >35-fold Coverage >50 Minimum per site coverage of assembly 25 Difference of sum of contig length with average coverage >0 and >25 250000 Difference of number of contigs with average coverage >0 and >25 1000 Depth of coverage >45X Percentage of good targets 0,9 Percentage of cgMLST loci found >97% Good target for cgMLST >= 98% Number of good cgMLST targets Minimum 90 % Percentage of good targets >99% cgMLST alleles found and called >95% cgMLST genes present >=95% Genome size +/- 20% Assembly length <4 Mb Consensus base count assembled Approximate size of genome (for Listeria ~ 2.8 million) Length of contig assembly < reference genome + 10% Assembly length >2.8Mb and <3.1Mb Total length <=3Mb Confirmation of genus/species Mixed culture check Only L. monocytogenes culture Confirmation of genus (JSpecies) Confirmation of genus Main genus match in kraken must match supplied genus Contamination check Only one genus >5% on mini kraken Specie confirmation by KAMERS Specie confirmation by KAMERS Kmer Identification Number of contigs 200 bases Number of contigs <1000 Number of contigs <100 Q score (Phred) 20 Phred score >28 Per sequence quality score before trimming Passed using FastQC Fast QC: per sequence quality score Q30 70-80% Per sequence quality score Q>30 Per sequence GC content before trimming Passed using FastQC Fast QC: per base sequence content Per base sequence quality before trimming Passed using FastQC Fast QC: per base sequence quality N50 200000 N50 Alignment with 7 housekeeping genes of MLST panel No mismatches Overrepresented sequence before trimming Passed using FastQC Fast QC: per sequence length distribution Target QC procedure Length of consensus equals ref.-seq. area(s) length +/- 3 triplets PHiX control (internal control for run performance) cluster density ~1200-1400 K/mm3 Percentage mapping with reference genome >90% identity to reference sequence >=90% Alignment to reference sequence 0,01 Metric post-trim yield >90Mb FASTQC metrics Default metrics Unexplained similarity differences only reported if > 10%
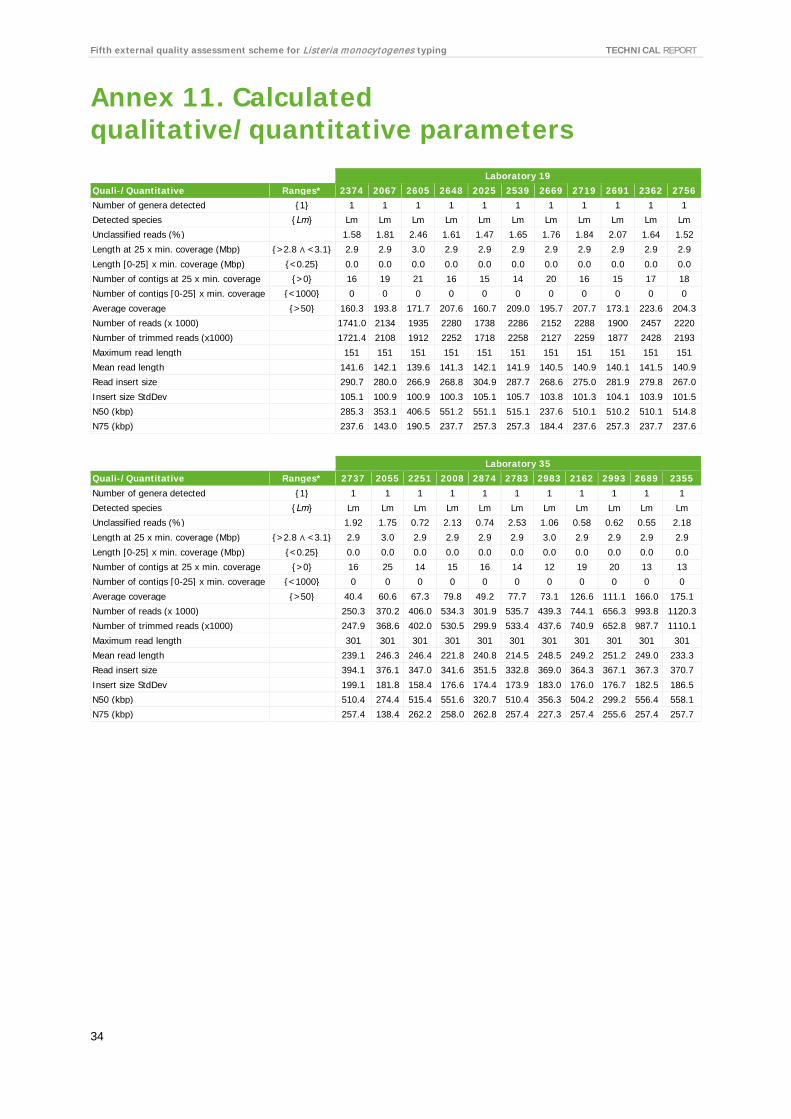
Fifth external quality assessment scheme for Listeria monocytogenes typing TECHNICAL REPORT
34
Annex 11. Calculated qualitative/quantitative parameters
Laboratory 35 Quali-/Quantitative Ranges* 2737 2055 2251 2008 2874 2783 2983 2162 2993 2689 2355
Number of genera detected {1} 1 1 1 1 1 1 1 1 1 1 1
Detected species {Lm} Lm Lm Lm Lm Lm Lm Lm Lm Lm Lm Lm
Unclassified reads (%) 1.92 1.75 0.72 2.13 0.74 2.53 1.06 0.58 0.62 0.55 2.18
Length at 25 x min. coverage (Mbp) {>2.8 ∧ <3.1} 2.9 3.0 2.9 2.9 2.9 2.9 3.0 2.9 2.9 2.9 2.9
Length [0-25] x min. coverage (Mbp) {<0.25} 0.0 0.0 0.0 0.0 0.0 0.0 0.0 0.0 0.0 0.0 0.0
Number of contigs at 25 x min. coverage {>0} 16 25 14 15 16 14 12 19 20 13 13
Number of contigs [0-25] x min. coverage {<1000} 0 0 0 0 0 0 0 0 0 0 0
Average coverage {>50} 40.4 60.6 67.3 79.8 49.2 77.7 73.1 126.6 111.1 166.0 175.1
Number of reads (x 1000) 250.3 370.2 406.0 534.3 301.9 535.7 439.3 744.1 656.3 993.8 1120.3
Number of trimmed reads (x1000) 247.9 368.6 402.0 530.5 299.9 533.4 437.6 740.9 652.8 987.7 1110.1
Maximum read length 301 301 301 301 301 301 301 301 301 301 301
Mean read length 239.1 246.3 246.4 221.8 240.8 214.5 248.5 249.2 251.2 249.0 233.3
Read insert size 394.1 376.1 347.0 341.6 351.5 332.8 369.0 364.3 367.1 367.3 370.7
Insert size StdDev 199.1 181.8 158.4 176.6 174.4 173.9 183.0 176.0 176.7 182.5 186.5
N50 (kbp) 510.4 274.4 515.4 551.6 320.7 510.4 356.3 504.2 299.2 556.4 558.1
N75 (kbp) 257.4 138.4 262.2 258.0 262.8 257.4 227.3 257.4 255.6 257.4 257.7
Laboratory 19 Quali-/Quantitative Ranges* 2374 2067 2605 2648 2025 2539 2669 2719 2691 2362 2756 Number of genera detected {1} 1 1 1 1 1 1 1 1 1 1 1
Detected species {Lm} Lm Lm Lm Lm Lm Lm Lm Lm Lm Lm Lm
Unclassified reads (%) 1.58 1.81 2.46 1.61 1.47 1.65 1.76 1.84 2.07 1.64 1.52
Length at 25 x min. coverage (Mbp) {>2.8 ∧ <3.1} 2.9 2.9 3.0 2.9 2.9 2.9 2.9 2.9 2.9 2.9 2.9
Length [0-25] x min. coverage (Mbp) {<0.25} 0.0 0.0 0.0 0.0 0.0 0.0 0.0 0.0 0.0 0.0 0.0
Number of contigs at 25 x min. coverage {>0} 16 19 21 16 15 14 20 16 15 17 18
Number of contigs [0-25] x min. coverage {<1000} 0 0 0 0 0 0 0 0 0 0 0
Average coverage {>50} 160.3 193.8 171.7 207.6 160.7 209.0 195.7 207.7 173.1 223.6 204.3
Number of reads (x 1000) 1741.0 2134 1935 2280 1738 2286 2152 2288 1900 2457 2220
Number of trimmed reads (x1000) 1721.4 2108 1912 2252 1718 2258 2127 2259 1877 2428 2193
Maximum read length 151 151 151 151 151 151 151 151 151 151 151
Mean read length 141.6 142.1 139.6 141.3 142.1 141.9 140.5 140.9 140.1 141.5 140.9
Read insert size 290.7 280.0 266.9 268.8 304.9 287.7 268.6 275.0 281.9 279.8 267.0
Insert size StdDev 105.1 100.9 100.9 100.3 105.1 105.7 103.8 101.3 104.1 103.9 101.5
N50 (kbp) 285.3 353.1 406.5 551.2 551.1 515.1 237.6 510.1 510.2 510.1 514.8
N75 (kbp) 237.6 143.0 190.5 237.7 257.3 257.3 184.4 237.6 257.3 237.7 237.6

TECHNICAL REPORT Fifth external quality assessment scheme for Listeria monocytogenes typing
35
Laboratory 56 Quali-/Quantitative Ranges* 2165 2636 2178 2612 2341 2811 2813 Number of genera detected {1} 1 1 1 1 1 1 1 Detected species {Lm} Lm Lm Lm Lm Lm Lm Lm Unclassified reads (%) 0.89 1.32 0.72 1.0 0.79 2.23 0.58 Length at 25 x min. coverage (Mbp) {>2.8 ∧ <3.1} 1.8 2.7 2.0 1.9 2.2 1.9 2.1 Length [0-25] x min. coverage (Mbp) {<0.25} 0.0 0.0 0.0 0.0 0.0 0.0 0.0 Number of contigs at 25 x min. coverage {>0} 1009 876 1054 1005 1056 1006 1008 Number of contigs [0-25] x min. coverage {<1000} 0 0 0 0 0 0 0 Average coverage {>50} 60.5 84.2 76.4 77.0 92.6 103.8 85.0 Number of reads (x 1000) 707.0 832.7 889.4 938.4 1045.2 1277.9 956.1 Number of trimmed reads (x1000) 690.9 813.1 871.1 915.1 1023.3 1235.1 936.7 Maximum read length 325 285 325 365 295 340 325 Mean read length 224.8 223.6 224.7 217.4 227.6 228.8 226.7 Read insert size NA NA NA NA NA NA NA Insert size StdDev NA NA NA NA NA NA NA N50 (kbp) 1.4 3.4 1.6 1.5 1.8 1.5 1.8 N75 (kbp) 0.9 1.9 1.0 0.9 1.1 0.9 1.1
Laboratory 70
Quali-/Quantitative Ranges* 2104 2216 2300 2219 2397 2567 2606 2767 2424 2695 2903 Number of genera detected {1} 1 1 1 1 1 1 1 1 1 1 1
Detected species {Lm} Lm Lm Lm Lm Lm Lm Lm Lm Lm Lm Lm
Unclassified reads (%) 1.49 2.54 2.17 1.78 1.99 2.18 2.86 2.38 1.96 1.87 1.96
Length at 25 x min. coverage (Mbp) {>2.8 ∧ <3.1} 2.9 2.9 2.9 2.9 2.9 2.9 3.0 2.9 2.9 2.9 2.9
Length [0-25] x min. coverage (Mbp) {<0.25} 0.0 0.0 0.0 0.0 0.0 0.0 0.0 0.0 0.0 0.0 0.0
Number of contigs at 25 x min. coverage {>0} 22 25 24 17 26 22 45 21 19 38 23
Number of contigs [0-25] x min. coverage {<1000} 1 0 0 0 0 0 1 1 0 4 0
Average coverage {>50} 81.3 57.6 50.7 99.8 66.4 67.3 60.0 60.2 64.6 60.4 83.1
Number of reads (x 1000) 830.4 600.8 527.9 1034.9 678.0 694.0 636.7 626.4 672.2 625.3 857.7
Number of trimmed reads (x1000) 826.1 595.9 524.2 1028.0 673.2 687.9 631.5 621.2 668.2 622.3 850.7
Maximum read length 151 151 151 151 151 151 151 151 151 151 151
Mean read length 145.5 142.7 142.6 144.5 143.8 144.5 142.6 143.2 143.1 144.5 144.7
Read insert size 391.0 335.3 327.0 312.8 325.4 329.0 313.7 324.7 288.1 383.6 314.0
Insert size StdDev 147.0 124.8 126.4 111.1 115.8 112.1 115.9 116.8 100.3 148.9 107.0
N50 (kbp) 238.2 238.0 234.6 317.7 223.0 239.1 143.1 295.1 238.0 162.3 261.4
N75 (kbp) 139.4 186.2 168.3 238.2 164.2 218.6 92.5 164.8 184.4 78.2 185.7
Laboratory 105
Quali-/Quantitative Ranges* 2073 2281 2709 2327 2677 2701 2450 2391 2978 2782 2805 Number of genera detected {1} 1 1 2 1 1 1 1 1 1 1 1
Detected species {Lm} Lm Lm N Lm Lm Lm Lm Lm Lm Lm Lm
Unclassified reads (%) 1.79 0.89 50.81 1.65 1.51 0.36 0.98 0.78 1.17 1.57 0.57
Length at 25 x min. coverage (Mbp) {>2.8 ∧ <3.1} 2.9 2.9 0.1 3.0 2.9 2.9 2.9 2.9 2.9 3.0 3.0
Length [0-25] x min. coverage (Mbp) {<0.25} 0.0 0.0 0.9 0.0 0.0 0.0 0.0 0.0 0.0 0.0 0.0
Number of contigs at 25 x min. coverage {>0} 29 20 21 18 22 116 20 15 17 14 193
Number of contigs [0-25] x min. coverage {<1000} 0 0 517 0 0 0 0 0 0 0 0
Average coverage {>50} 76.9 83.9 17.5 77.2 81.1 93.2 81.9 83.8 76.9 83.9 93.8
Number of reads (x 1000) 578.1 577.8 344.6 551.2 592.4 611.3 567.9 574.2 533.6 589.6 622.1
Number of trimmed reads (x1000) 569.1 567.6 341.9 538.6 582.3 592.6 554.6 558.3 527.2 578.6 609.1
Maximum read length 301 301 301 301 301 301 301 301 301 301 301
Mean read length 204.0 220.1 121.0 216.9 208.7 239.0 217.0 222.9 216.3 218.4 240.5
Read insert size 298.0 320.3 199.2 320.9 308.1 358.9 319.1 331.6 315.7 322.6 363.3
Insert size StdDev 142.7 153.1 67.3 155.7 149.7 150.7 152.9 155.9 152.3 155.2 157.7
N50 (kbp) 206.1 299.8 1.3 406.6 295.8 54.8 255.6 295.2 302.6 353.2 26.6
N75 (kbp) 105.2 225.1 0.8 183.0 257.4 26.4 200.9 257.4 262.0 201.1 13.4
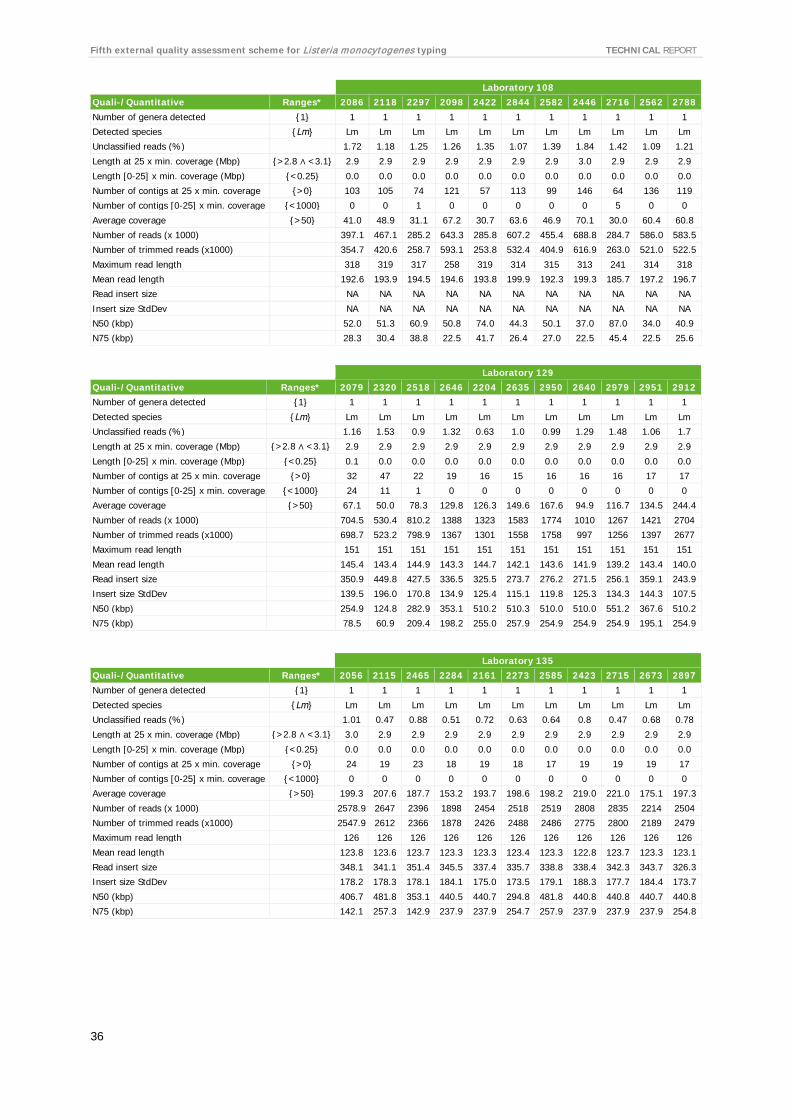
Fifth external quality assessment scheme for Listeria monocytogenes typing TECHNICAL REPORT
36
Laboratory 108 Quali-/Quantitative Ranges* 2086 2118 2297 2098 2422 2844 2582 2446 2716 2562 2788
Number of genera detected {1} 1 1 1 1 1 1 1 1 1 1 1
Detected species {Lm} Lm Lm Lm Lm Lm Lm Lm Lm Lm Lm Lm
Unclassified reads (%) 1.72 1.18 1.25 1.26 1.35 1.07 1.39 1.84 1.42 1.09 1.21
Length at 25 x min. coverage (Mbp) {>2.8 ∧ <3.1} 2.9 2.9 2.9 2.9 2.9 2.9 2.9 3.0 2.9 2.9 2.9
Length [0-25] x min. coverage (Mbp) {<0.25} 0.0 0.0 0.0 0.0 0.0 0.0 0.0 0.0 0.0 0.0 0.0
Number of contigs at 25 x min. coverage {>0} 103 105 74 121 57 113 99 146 64 136 119
Number of contigs [0-25] x min. coverage {<1000} 0 0 1 0 0 0 0 0 5 0 0
Average coverage {>50} 41.0 48.9 31.1 67.2 30.7 63.6 46.9 70.1 30.0 60.4 60.8
Number of reads (x 1000) 397.1 467.1 285.2 643.3 285.8 607.2 455.4 688.8 284.7 586.0 583.5
Number of trimmed reads (x1000) 354.7 420.6 258.7 593.1 253.8 532.4 404.9 616.9 263.0 521.0 522.5
Maximum read length 318 319 317 258 319 314 315 313 241 314 318
Mean read length 192.6 193.9 194.5 194.6 193.8 199.9 192.3 199.3 185.7 197.2 196.7
Read insert size NA NA NA NA NA NA NA NA NA NA NA
Insert size StdDev NA NA NA NA NA NA NA NA NA NA NA
N50 (kbp) 52.0 51.3 60.9 50.8 74.0 44.3 50.1 37.0 87.0 34.0 40.9
N75 (kbp) 28.3 30.4 38.8 22.5 41.7 26.4 27.0 22.5 45.4 22.5 25.6
Laboratory 135 Quali-/Quantitative Ranges* 2056 2115 2465 2284 2161 2273 2585 2423 2715 2673 2897 Number of genera detected {1} 1 1 1 1 1 1 1 1 1 1 1
Detected species {Lm} Lm Lm Lm Lm Lm Lm Lm Lm Lm Lm Lm
Unclassified reads (%) 1.01 0.47 0.88 0.51 0.72 0.63 0.64 0.8 0.47 0.68 0.78
Length at 25 x min. coverage (Mbp) {>2.8 ∧ <3.1} 3.0 2.9 2.9 2.9 2.9 2.9 2.9 2.9 2.9 2.9 2.9
Length [0-25] x min. coverage (Mbp) {<0.25} 0.0 0.0 0.0 0.0 0.0 0.0 0.0 0.0 0.0 0.0 0.0
Number of contigs at 25 x min. coverage {>0} 24 19 23 18 19 18 17 19 19 19 17
Number of contigs [0-25] x min. coverage {<1000} 0 0 0 0 0 0 0 0 0 0 0
Average coverage {>50} 199.3 207.6 187.7 153.2 193.7 198.6 198.2 219.0 221.0 175.1 197.3
Number of reads (x 1000) 2578.9 2647 2396 1898 2454 2518 2519 2808 2835 2214 2504
Number of trimmed reads (x1000) 2547.9 2612 2366 1878 2426 2488 2486 2775 2800 2189 2479
Maximum read length 126 126 126 126 126 126 126 126 126 126 126
Mean read length 123.8 123.6 123.7 123.3 123.3 123.4 123.3 122.8 123.7 123.3 123.1
Read insert size 348.1 341.1 351.4 345.5 337.4 335.7 338.8 338.4 342.3 343.7 326.3
Insert size StdDev 178.2 178.3 178.1 184.1 175.0 173.5 179.1 188.3 177.7 184.4 173.7
N50 (kbp) 406.7 481.8 353.1 440.5 440.7 294.8 481.8 440.8 440.8 440.7 440.8
N75 (kbp) 142.1 257.3 142.9 237.9 237.9 254.7 257.9 237.9 237.9 237.9 254.8
Laboratory 129 Quali-/Quantitative Ranges* 2079 2320 2518 2646 2204 2635 2950 2640 2979 2951 2912 Number of genera detected {1} 1 1 1 1 1 1 1 1 1 1 1
Detected species {Lm} Lm Lm Lm Lm Lm Lm Lm Lm Lm Lm Lm
Unclassified reads (%) 1.16 1.53 0.9 1.32 0.63 1.0 0.99 1.29 1.48 1.06 1.7
Length at 25 x min. coverage (Mbp) {>2.8 ∧ <3.1} 2.9 2.9 2.9 2.9 2.9 2.9 2.9 2.9 2.9 2.9 2.9
Length [0-25] x min. coverage (Mbp) {<0.25} 0.1 0.0 0.0 0.0 0.0 0.0 0.0 0.0 0.0 0.0 0.0
Number of contigs at 25 x min. coverage {>0} 32 47 22 19 16 15 16 16 16 17 17
Number of contigs [0-25] x min. coverage {<1000} 24 11 1 0 0 0 0 0 0 0 0
Average coverage {>50} 67.1 50.0 78.3 129.8 126.3 149.6 167.6 94.9 116.7 134.5 244.4
Number of reads (x 1000) 704.5 530.4 810.2 1388 1323 1583 1774 1010 1267 1421 2704
Number of trimmed reads (x1000) 698.7 523.2 798.9 1367 1301 1558 1758 997 1256 1397 2677
Maximum read length 151 151 151 151 151 151 151 151 151 151 151
Mean read length 145.4 143.4 144.9 143.3 144.7 142.1 143.6 141.9 139.2 143.4 140.0
Read insert size 350.9 449.8 427.5 336.5 325.5 273.7 276.2 271.5 256.1 359.1 243.9
Insert size StdDev 139.5 196.0 170.8 134.9 125.4 115.1 119.8 125.3 134.3 144.3 107.5
N50 (kbp) 254.9 124.8 282.9 353.1 510.2 510.3 510.0 510.0 551.2 367.6 510.2
N75 (kbp) 78.5 60.9 209.4 198.2 255.0 257.9 254.9 254.9 254.9 195.1 254.9

TECHNICAL REPORT Fifth external quality assessment scheme for Listeria monocytogenes typing
37
Laboratory 141 Quali-/Quantitative Ranges* 2022 2535 2092 2050 2207 2509 2510 2872 2177 2194 2464
Number of genera detected {1} 1 1 1 1 1 1 1 1 1 1 1
Detected species {Lm} Lm Lm Lm Lm Lm Lm Lm Lm Lm Lm Lm
Unclassified reads (%) 1.81 1.47 1.0 1.37 0.98 0.91 1.67 1.39 1.77 1.4 1.71
Length at 25 x min. coverage (Mbp) {>2.8 ∧ <3.1} 1.0 3.0 2.9 2.9 2.9 2.9 2.9 2.9 2.9 3.0 2.9
Length [0-25] x min. coverage (Mbp) {<0.25} 1.8 0.0 0.0 0.0 0.0 0.0 0.0 0.0 0.0 0.0 0.0
Number of contigs at 25 x min. coverage {>0} 57 41 31 85 35 35 29 70 43 37 19
Number of contigs [0-25] x min. coverage {<1000} 165 1 0 0 0 0 0 7 1 1 0
Average coverage {>50} 24.3 57.7 69.5 80.2 77.3 66.4 63.3 46.9 85.1 91.9 126.1
Number of reads (x 1000) 157.6 385.6 479.8 560.8 508.9 450.9 423.5 327.0 574.2 622.1 882.9
Number of trimmed reads (x1000) 150.2 374.1 461.0 547.0 492.0 434.8 412.8 311.4 552.5 604.6 864.8
Maximum read length 301 301 301 301 301 301 301 301 301 301 301
Mean read length 235.3 233.0 222.9 220.0 232.5 226.0 226.5 221.7 225.2 228.3 217.5
Read insert size 358.3 310.2 286.4 278.8 308.3 296.0 313.0 296.5 316.9 295.7 278.9
Insert size StdDev 130.0 117.4 103.9 104.1 111.7 110.8 115.9 103.8 116.6 109.2 102.0
N50 (kbp) 22.4 186.5 165.2 72.8 160.0 197.3 255.6 69.3 122.1 140.3 262.9
N75 (kbp) 11.4 96.8 98.0 35.1 95.3 91.8 98.7 43.1 84.9 99.8 235.6
Laboratory 142 Quali-/Quantitative Ranges* 2040 2330 2077 2385 2441 2408 2529 2977 2837 2670 2794
Number of genera detected {1} 1 1 1 1 1 1 1 1 1 1 1
Detected species {Lm} Lm Lm Lm Lm Lm Lm Lm Lm Lm Lm Lm
Unclassified reads (%) 1.03 0.93 1.04 1.2 0.87 1.39 1.23 0.81 0.97 1.2 1.0
Length at 25 x min. coverage (Mbp) {>2.8 ∧ <3.1} 2.9 2.9 2.9 2.9 2.9 3.0 2.9 2.9 2.9 3.0 2.9
Length [0-25] x min. coverage (Mbp) {<0.25} 0.0 0.0 0.0 0.0 0.0 0.0 0.0 0.0 0.0 0.0 0.0
Number of contigs at 25 x min. coverage {>0} 17 13 15 15 13 15 14 15 15 17 13
Number of contigs [0-25] x min. coverage {<1000} 2 0 0 1 0 0 0 0 0 0 0
Average coverage {>50} 46.5 53.9 57.4 44.6 40.2 53.8 56.6 54.1 48.1 58.1 54.6
Number of reads (x 1000) 313.7 359.6 384.8 299.2 260.6 357.5 375.8 351.1 318.6 384.2 358.3
Number of trimmed reads (x1000) 307.5 353.2 379.9 295.4 256.6 351.5 367.2 345.3 312.6 376.0 350.5
Maximum read length 251 251 251 251 251 251 251 251 251 251 251
Mean read length 224.7 227.3 225.4 225.4 233.2 230.9 231.0 230.5 229.2 233.9 232.6
Read insert size 367.1 378.4 362.9 361.1 393.5 385.4 389.5 377.7 379.0 399.0 392.6
Insert size StdDev 171.4 174.3 167.4 152.3 162.9 162.5 164.6 160.8 157.2 160.8 165.0
N50 (kbp) 261.7 556.2 510.2 515.2 551.4 353.2 413.6 320.8 324.3 306.7 515.2
N75 (kbp) 225.0 257.4 257.4 262.0 255.6 198.3 257.4 257.4 262.0 238.2 262.0
Laboratory 144 Quali-/Quantitative Ranges* 2143 2112 2490 2470 2626 2727 2814 2818 2964 2822 2892
Number of genera detected {1} 1 1 1 1 1 1 1 1 1 1 1
Detected species {Lm} Lm Lm Lm Lm Lm Lm Lm Lm Lm Lm Lm
Unclassified reads (%) 0.38 0.29 0.28 1.31 0.43 0.42 0.35 0.81 0.31 0.34 0.24
Length at 25 x min. coverage (Mbp) {>2.8 ∧ <3.1-} 2.9 2.9 2.9 3.0 2.9 2.9 2.9 2.9 2.9 2.9 2.9
Length [0-25] x min. coverage (Mbp) {<0.25} 0.0 0.0 0.0 0.0 0.0 0.0 0.0 0.0 0.0 0.0 0.0
Number of contigs at 25 x min. coverage {>0} 13 13 12 17 13 13 14 14 11 14 12
Number of contigs [0-25] x min. coverage {<1000} 0 0 0 0 0 0 0 0 0 0 0
Average coverage {>50} 110.0 78.4 87.4 76.3 86.4 85.5 106.5 75.4 97.4 127.8 112.3
Number of reads (x 1000) 766.0 546.5 596.3 590.8 609.2 588.9 724.0 525.9 685.1 881.3 774.2
Number of trimmed reads (x1000) 749.8 534.2 588.8 558.5 592.4 582.6 716.1 518.1 672.3 870.3 763.7
Maximum read length 251 251 251 251 251 251 251 251 251 251 251
Mean read length 224.1 218.8 225.6 210.3 220.8 223.1 227.3 222.7 220.9 226.2 225.7
Read insert size 320.4 296.4 315.9 279.6 306.2 307.9 326.7 309.6 303.6 317.6 322.0
Insert size StdDev 118.5 104.6 113.1 92.6 109.5 114.9 124.7 116.8 113.5 116.9 121.5
N50 (kbp) 515.4 510.1 515.0 406.6 510.1 515.2 558.1 353.2 556.2 510.3 556.2
N75 (kbp) 262.0 257.4 262.9 183.0 262.0 262.0 257.7 200.7 258.0 262.1 257.4

Fifth external quality assessment scheme for Listeria monocytogenes typing TECHNICAL REPORT
38
Laboratory 146 Quali-/Quantitative Ranges* 2160 2068 2726 2197 2463 2536 2377 2575 2553 2488 2655
Number of genera detected {1} 1 1 1 1 1 1 1 1 1 1 1
Detected species {Lm} Lm Lm Lm Lm Lm Lm Lm Lm Lm Lm Lm
Unclassified reads (%) 0.73 0.55 1.12 0.52 1.27 0.69 0.79 0.41 0.53 1.25 1.97
Length at 25 x min. coverage (Mbp) {>2.8 ∧ <3.1} 2.9 2.9 3.0 2.9 2.9 2.9 2.9 2.9 2.9 2.9 2.9
Length [0-25] x min. coverage (Mbp) {<0.25} 0.0 0.0 0.0 0.0 0.0 0.0 0.0 0.0 0.0 0.0 0.0
Number of contigs at 25 x min. coverage {>0} 21 17 25 19 20 20 21 20 17 20 23
Number of contigs [0-25] x min. coverage {<1000} 0 0 0 0 0 0 0 0 1 0 0
Average coverage {>50} 181.9 194.8 160.1 174.9 145.9 179.4 149.5 140.4 151.6 199.7 187.0
Number of reads (x 1000) 2786.9 3024 2537 2746 2346 2807 2330 2148 2301 3169 3066
Number of trimmed reads (x1000) 2786.8 3024 2537 2746 2346 2807 2330 2148 2300 3169 3066
Maximum read length 101 101 101 101 101 101 101 101 101 101 101
Mean read length 99.4 99.5 99.0 99.5 96.6 99.4 99.2 99.6 99.4 98.5 96.8
Read insert size 307.7 310.4 290.7 310.2 207.8 324.9 266.1 359.6 323.2 225.0 204.0
Insert size StdDev 160.2 138.9 158.0 139.5 81.1 167.9 120.7 162.7 168.8 108.4 85.2
N50 (kbp) 285.9 440.8 406.4 481.8 425.0 440.8 440.8 440.5 440.8 509.9 353.1
N75 (kbp) 154.7 261.8 200.4 257.3 254.8 257.3 237.9 257.3 255.0 257.9 144.2
Quality assessment made by the EQA-provider in-house quality control pipeline. * Indicative QC ranges Lm: L. monocytogenes N: Neisseria.

TECHNICAL REPORT Fifth external quality assessment scheme for Listeria monocytogenes typing
39
Annex 12. EQA-5 laboratory questionnaire This is a preview of all the fields and questions available.
Please keep in mind that, depending on your answers in the questionnaire, you will not necessarily have to answer all the questions.
1. Listeria EQA-5 2017 Dear Participant,
Welcome to the fifth External Quality Assessment (EQA-5) scheme for typing of Listeria in 2017–2018. Please note that most of the fields are required to be filled in before the submission can be completed. Any comments can be written at the end of the form. You are always welcome to contact us at [email protected].
Please start by filling in your country, your Laboratory name and your LAB_ID.
Available options in this submission form include:
• Click ‘Options’ and ‘Pause’ to save your results and finish at a later time (using the same link) • Click ‘Options’ and ‘Print’ to print your answers. This can be done at any time, but before pressing ‘Submit
results’ • Click ‘Previous’ to go back to the questions you have already answered • Click ‘Options’ and ‘Go to’ to go back to a specific page number
Note: After pressing ‘Submit results’ you will not be able to review your results.
2. Country Austria Belgium Czech Republic Denmark Estonia Finland France Germany Greece Hungary Ireland Italy Latvia Lithuania Luxembourg Malta Norway Portugal Romania Scotland Serbia Slovak Republic Slovenia Spain Sweden Netherlands Turkey UK
3. Laboratory name

Fifth external quality assessment scheme for Listeria monocytogenes typing TECHNICAL REPORT
40
4. Laboratory ID Consisting of country code (two letters) Lab ID on the vial e.g. DK_SSI
5. E-mail
6. Serotyping of Listeria
7. Submitting results Online here (please fill in the strain IDs in the following section) Did not participate in the serotyping part
8. Serotyping strain IDs Please enter the strain ID (4 digits)
Listeria
Strain 1 ___ Strain 2 ___ Strain 3 ___ Strain 4 ___ Strain 5 ___ Strain 6 ___ Strain 7 ___ Strain 8 ___ Strain 9 ___ Strain 10 ___ Strain 11 ___
9. Submitting results – serotyping of Listeria Both molecular and conventional serotyping Molecular serotyping Conventional serotyping
10. Results for serotyping Listeria – molecular serotyping Please select the serotype
Strain Serotype Strain 1 IIa IIb IIc IVb L Untypeable
Strain 2
Strain 3
Strain 4
Strain 5
Strain 6
Strain 7
Strain 8
Strain 9
Strain 10
Strain 11
11. Submitting results – conventional serotyping Listeria Online here (please fill in the results for conventional serotyping in the following section) Did not participate in conventional serotyping part for Listeria

TECHNICAL REPORT Fifth external quality assessment scheme for Listeria monocytogenes typing
41
12. Results for serotyping Listeria – conventional serotyping. Please select the serotype
Strain Serotype Strain 1 1/2a 1/2b 1/2c 3a 3b 3c 4a 4ab 4b 4c 4d 4e 7 Autoagglutinable Untypeable Strain 2 Strain 3 Strain 4 Strain 5 Strain 6 Strain 7 Strain 8 Strain 9 Strain 10 Strain 11
13. Submitting cluster results Cluster analyses based on PFGE and/or WGS Did not participate in the cluster part
14. Cluster strain IDs. Please enter the cluster strain ID (4 digits) Cluster strain ID
Strain 1 ___ Strain 2 ___ Strain 3 ___ Strain 4 ___ Strain 5 ___ Strain 6 ___ Strain 7 ___ Strain 8 ___ Strain 9 ___ Strain 10 ___ Strain 11 ___
15. Submitting cluster results Cluster analysis based on PFGE Do not wish to submit any cluster results based on PFGE analysis
16. Cluster analysis based on PFGE data
17. Please list the ID for the strains included in the cluster detected by PFGE combining ApaI and AscI results Please use semicolon (;) to separate the IDs
18. Select a representative strain with the cluster profile detected by PFGE Indicate the strain ID
19. ApaI – Total number of bands (>33kb) in the selected representative cluster strain

Fifth external quality assessment scheme for Listeria monocytogenes typing TECHNICAL REPORT
42
20. AscI – Total number of bands (>33kb) in the selected representative cluster strain
21. Results for cluster analysis – PFGE (ApaI and AscI) Please use ‘9999’ for ‘not analysed’
ApaI – Total number of
bands (>33kb)
ApaI – Number of bands with same/shared position as the profile of the selected cluster
strain (>33kb)
AscI – Total number of
bands (>33kb)
AscI – Number of bands with same/shared position as the profile of the selected cluster
strain (>33kb)
Strain 1
Strain 2
Strain 3
Strain 4
Strain 5
Strain 6
Strain 7
Strain 8
Strain 9
Strain 10
Strain 11
22. Submitting cluster results Cluster analysis based on WGS data Do not wish to submit any cluster results based on WGS data
23. Cluster analysis based on WGS data
24. Please select the analysis used to detect the cluster on data derived from WGS As basis for the cluster detection only one data analysis can be reported. If more than one analysis is performed, please report later in this submission
SNP-based Allele-based Other
25. If another analysis is used, please describe your approach
26. Please select the approach used for the SNP analysis Reference-based Assembly-based
27. Reference genome used Please indicate multilocus sequence type (e.g. ST8) and strain ID (e.g. one of the strains from the current cluster, ID of a public reference strain or an in-house strain)
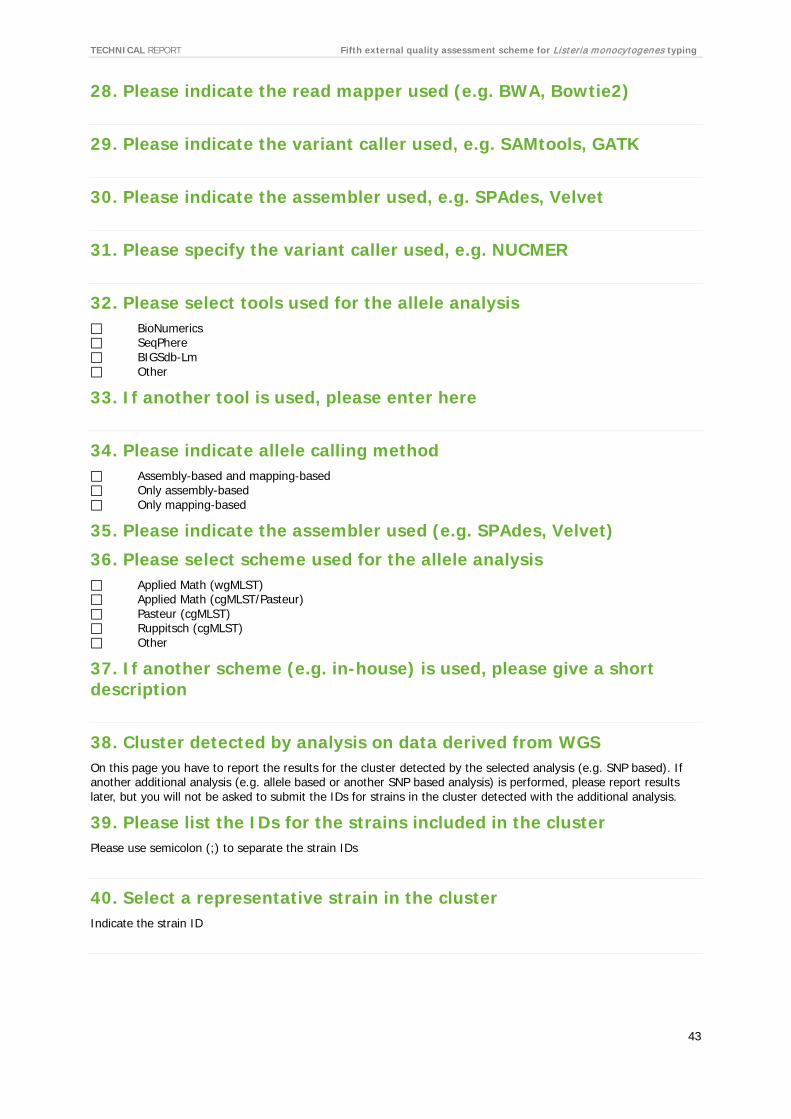
TECHNICAL REPORT Fifth external quality assessment scheme for Listeria monocytogenes typing
43
28. Please indicate the read mapper used (e.g. BWA, Bowtie2)
29. Please indicate the variant caller used, e.g. SAMtools, GATK
30. Please indicate the assembler used, e.g. SPAdes, Velvet
31. Please specify the variant caller used, e.g. NUCMER
32. Please select tools used for the allele analysis BioNumerics SeqPhere BIGSdb-Lm Other
33. If another tool is used, please enter here
34. Please indicate allele calling method Assembly-based and mapping-based Only assembly-based Only mapping-based
35. Please indicate the assembler used (e.g. SPAdes, Velvet)
36. Please select scheme used for the allele analysis Applied Math (wgMLST) Applied Math (cgMLST/Pasteur) Pasteur (cgMLST) Ruppitsch (cgMLST) Other
37. If another scheme (e.g. in-house) is used, please give a short description
38. Cluster detected by analysis on data derived from WGS On this page you have to report the results for the cluster detected by the selected analysis (e.g. SNP based). If another additional analysis (e.g. allele based or another SNP based analysis) is performed, please report results later, but you will not be asked to submit the IDs for strains in the cluster detected with the additional analysis.
39. Please list the IDs for the strains included in the cluster Please use semicolon (;) to separate the strain IDs
40. Select a representative strain in the cluster Indicate the strain ID

Fifth external quality assessment scheme for Listeria monocytogenes typing TECHNICAL REPORT
44
41. Results for cluster analysis (e.g. SNP or allele-based) Please use ‘9999’ for ‘not analysed’.
Distance (e.g. SNP) to the selected cluster strain
Strain 1 ___ Strain 2 ___ Strain 3 ___ Strain 4 ___ Strain 5 ___ Strain 6 ___ Strain 7 ___ Strain 8 ___ Strain 9 ___ Strain 10 ___ Strain 11 ___
42. Would you like to add results performed with another additional analysis on the data derived from the WGS? If SNP based results are submitted, you can also report allele based results or results from a second SNP analysis
Yes No
43. Please select the additional analysis used on data derived from WGS SNP-based Allele-based Other
44. If another analysis is used, please describe your approach:
45. Please select the approach used for the SNP analysis Reference-based Assembly-based
46. Reference genome used Please indicate multi locus sequence type (e.g. ST8) and strain ID (e.g. one of the strains from the current cluster, ID of a public reference strain or an in-house strain)
47. Please indicate the read mapper used (e.g. BWA, Bowtie2)
48. Please indicate the variant caller used (e.g. SAMtools, GATK)
49. Please indicate the assembler used (e.g. SPAdes, Velvet)
50. Please specify the variant caller used (e.g. NUCMER)

TECHNICAL REPORT Fifth external quality assessment scheme for Listeria monocytogenes typing
45
51. Please select tool used for the allele analysis BioNumerics SeqPhere BIGSdb-Lm Other
52. If another tool is used, please list here:
53. Please indicate allele calling method Assembly-based and mapping-based Only assembly-based Only mapping-based
54. Please indicate the assembler used (e.g. SPAdes, Velvet)
55. Please select scheme used for the allele analysis Applied Math (wgMLST) Applied Math (cgMLST/Pasteur) Pasteur (cgMLST) Ruppitsch (cgMLST) Other
56. If another scheme (e.g. in-house) is used, please give a short description
57. Additional analysis on data derived from WGS
58. Select a representative strain in the cluster detected by the additional analysis Indicate the strain ID
59. Results for the additional cluster analysis (e.g. SNP or Allele based) Please use ‘9999’ for ‘not analysed’
Distance (e.g. SNP) to the selected cluster strain
Strain 1 ___ Strain 2 ___ Strain 3 ___ Strain 4 ___ Strain 5 ___ Strain 6 ___ Strain 7 ___ Strain 8 ___ Strain 9 ___ Strain 10 ___ Strain 11 ___

Fifth external quality assessment scheme for Listeria monocytogenes typing TECHNICAL REPORT
46
60. Would you like to add results performed with a third analysis on the data derived from the WGS? If SNP based results are submitted, you can also report allele-based results or results from a second SNP analysis
Yes No
61. Please select the third analysis used on data derived from WGS SNP-based Allele-based Other
62. If another analysis is used, please describe your approach:
63. Please select the approach used for the SNP analysis Reference-based Assembly-based
64. Reference genome used Please indicate multilocus sequence type (e.g. ST8) and strain ID (e.g. one of the strains from the current cluster, ID of a public reference strain or an in-house strain).
65. Please indicate the read mapper used (e.g. BWA, Bowtie2)
66. Please indicate the variant caller used (e.g. SAMtools, GATK)
67. Please indicate the assembler used (e.g. SPAdes, Velvet)
68. Please specify the variant caller used (e.g. NUCMER)
69. Please select tool used for the allele analysis BioNumerics SeqPhere BIGSdb-Lm Other
70. If another tool is used, please enter here:
71. Please indicate allele calling method Assembly-based and mapping-based Only assembly-based Only mapping-based
72. Please indicate the assembler used (e.g. SPAdes, Velvet)

TECHNICAL REPORT Fifth external quality assessment scheme for Listeria monocytogenes typing
47
73. Please select scheme used for the allele analysis Applied Math (wgMLST) Applied Math (cgMLST/Pasteur) Pasteur (cgMLST) Ruppitsch (cgMLST) Other
74. If another scheme (e.g. in-house) is used, please give a short description
75. Third analysis on data derived from WGS
76. Select a representative strain in the cluster detected by the third analysis Indicate the strain ID
77. Results for the third cluster analysis (e.g. SNP or Allele based) Please use ‘9999’ for ‘not analysed’
Distance (e.g. SNP) to the selected cluster strain Strain 1 ___ Strain 2 ___ Strain 3 ___ Strain 4 ___ Strain 5 ___ Strain 6 ___ Strain 7 ___ Strain 8 ___ Strain 9 ___ Strain 10 ___ Strain 11 ___
78. Additional questions to the WGS part
79. Where was the sequencing performed? In own laboratory Externally
80. Protocol used to prepare the library for sequencing Commercial kits Non-commercial kits
81. Please indicate name of commercial kit
82. If relevant, please list deviation from commercial kit shortly in bullet points

Fifth external quality assessment scheme for Listeria monocytogenes typing TECHNICAL REPORT
48
83. For non-commercial kit, please indicate a short summary of the protocol
84. The sequencing platform used Ion Torrent PGM Ion Torrent Proton Genome Sequencer Junior System (454) Genome Sequencer FLX System (454) Genome Sequencer FLX+ System (454) PacBio RS PacBio RS II HiScanSQ HiSeq 1000 HiSeq 1500 HiSeq 2000 HiSeq 2500 HiSeq 4000 Genome Analyzer lix MiSeq MiSeq Dx MiSeq FGx ABI SOLiD NextSeq MinION (ONT) Other
85. If another platform is used, please list here
86. Quantitative criteria used to evaluate the quality of sequence data Please list up to 10 different criteria (e.g. coverage, N50, number of contigs)
87. Quantitative criteria 1
88. Threshold used for quantitative criteria 1
89. Quantitative criteria 2
90. Threshold used for quantitative criteria 2
91. Quantitative criteria 3
92. Threshold used for quantitative criteria 3
93. Quantitative criteria 4

TECHNICAL REPORT Fifth external quality assessment scheme for Listeria monocytogenes typing
49
94. Threshold used for quantitative criteria 4
95. Quantitative criteria 5
96. Threshold used for quantitative criteria 5
97. Quantitative criteria 6
98. Threshold used for quantitative criteria 6
99. Quantitative criteria 7
100. Threshold used for quantitative criteria 7
101. Quantitative criteria 8
102. Threshold used for quantitative criteria 8
103. Quantitative criteria 9
104. Threshold used for quantitative criteria 9
105. Quantitative criteria 10
106. Threshold used for quantitative criteria 10
107. Qualitative criteria used to evaluate the quality of sequence data Please list up to 10 different criteria (e.g. contamination, confirmation of genus)
108. Qualitative criteria 1
109. If relevant, threshold used for qualitative criteria 1
110. Qualitative criteria 2

Fifth external quality assessment scheme for Listeria monocytogenes typing TECHNICAL REPORT
50
111. If relevant, threshold used for qualitative criteria 2
112. Qualitative criteria 3
113. If relevant, threshold used for qualitative criteria 3
114. Qualitative criteria 4
115. If relevant, threshold used for qualitative criteria 4
116. Qualitative criteria 5
117. If relevant, threshold used for qualitative criteria 5
118. Qualitative criteria 6
119. If relevant, threshold used for qualitative criteria 6
120. Qualitative criteria 7
121. If relevant, threshold used for qualitative criteria 7
122. Qualitative criteria 8
123. If relevant, threshold used for qualitative criteria 8
124. Qualitative criteria 9
125. If relevant, threshold used for qualitative criteria 9
126. Qualitative criteria 10
127. If relevant, threshold used for qualitative criteria 10

TECHNICAL REPORT Fifth external quality assessment scheme for Listeria monocytogenes typing
51
128. Comment(s) (e.g. remarks to the submission, the data analyses or the laboratory methods)
129. Thank you for your participation Thank you for filling out the Submission form for the Listeria EQA-5. For questions, please contact [email protected] or phone +45 3268 8341 +45 3268 8372. We highly recommend that you save this submission form by printing it. You will find the print option after pressing the ‘Options’ button. Important: After pressing ‘Submit results’ you will no longer be able to edit or print your information. For final submission, remember to press ‘Submit results’ after printing.

ECDC is committed to ensuring the transparency and independence of its work
In accordance with the Staff Regulations for Officials and Conditions of Employment of Other Servants of the European Union and the ECDC Independence Policy, ECDC staff members shall not, in the performance of their duties, deal with a matter in which, directly or indirectly, they have any personal interest such as to impair their independence. Declarations of interest must be received from any prospective contractor(s) before any contract can be awarded.www.ecdc.europa.eu/en/aboutus/transparency
HOW TO OBTAIN EU PUBLICATIONSFree publications:• onecopy: viaEUBookshop(http://bookshop.europa.eu);
• morethanonecopyorposters/maps: fromtheEuropeanUnion’srepresentations(http://ec.europa.eu/represent_en.htm); fromthedelegationsinnon-EUcountries(http://eeas.europa.eu/delegations/index_en.htm); bycontactingtheEuropeDirectservice(http://europa.eu/europedirect/index_en.htm)or calling 00 800 6 7 8 9 10 11 (freephone number from anywhere in the EU) (*).
(*)Theinformationgivenisfree,asaremostcalls(thoughsomeoperators,phoneboxesorhotelsmaychargeyou).
Priced publications:• viaEUBookshop(http://bookshop.europa.eu).
European Centre for Disease Prevention and Control (ECDC)
Address: GustavIII:sboulevard40,SE-16973Solna,Sweden
Tel.+46858601000Fax+46858601001www.ecdc.europa.eu
An agency of the European Unionwww.europa.eu
Subscribe to our publications www.ecdc.europa.eu/en/publications
Contact us [email protected]
Follow us on Twitter @ECDC_EU
Like our Facebook page www.facebook.com/ECDC.EU