field survey report - newfoundland and labrador survey report blue-green alga blooms in cochrane...
TRANSCRIPT
Field Survey Report Blue-Green Alga Blooms in Cochrane Pond,
Paddy’s Pond, Three Arm Pond and Three Island Pond
Summer 2007
Water Resources Management Division Department of Environment and Conservation Government of Newfoundland and Labrador

Executive Summary Cyanobacteria are photosynthetic micro-organisms more commonly referred to as blue-green algae. They can live in a variety of habitats but are most often found in warm, shallow, slow-moving freshwater. A large mass of blue-green algae is known as a bloom. Blue-green algae are found throughout the entire water column, but can rise to the surface, creating an easily identifiable surface bloom. In the summer of 2007, blue-green algae blooms were detected in several ponds on the Northeast Avalon: Cochrane Pond, Paddy’s Pond, Three Arm Pond and Three Island Pond. In response to public concern, staff from the Water Resources Management Division of the Department of Environment and Conservation conducted site visits, water quality sampling, and consulted with other government agencies on how to address this emerging environmental issue. Some species of cyanobacteria produce a toxin known as microcystin-LR. Health Canada currently has a drinking water quality guideline of 1.5 µg/L for microcystin-LR, however no numerical recreational water use guideline is currently available. Health Canada recommends that in the event of a blue-green algae bloom resulting in reduced water clarity, recreational activities be avoided, particularly until the presence and quantity of microcystin-LR can be determined. Currently, there is no national protocol in place for determining if public notification or closure of water bodies is needed if a blue-green algae bloom is present. While there is no existing Canadian numerical cyanobacterial guideline value for livestock watering, it is recommended that water with heavy blue-green algae growths be avoided. The Water Resources Management Division was able to identify the presence of cyanobacteria and microcystin-LR in the waterbodies of concern through water quality testing at an accredited laboratory. All collected samples in the surveyed area had levels of microcystin-LR below the existing Health Canada drinking water quality guideline of 1.5 µg/L. On September 27th, 2007, after confirming the presence of cyanobacteria and microcystin-LR, the Department of Environment and Conservation issued a public advisory. The Newfoundland and Labrador Department of Environment and Conservation had no reports of previous blue-green algae blooms prior to the summer of 2007. Consultation is ongoing with relevant agencies including the Department of Fisheries and Oceans, Department of Government Services, Department of Health and Community Services, and Environment Canada to develop a protocol to deal with blue-green algae blooms in the future.
i

Table of Contents
Executive Summary ........................................................................................................... i Table of Contents .............................................................................................................. ii List of Tables .................................................................................................................... iii List of Figures................................................................................................................... iii List of Appendices............................................................................................................ iii 1.0 Introduction................................................................................................................. 1
1.1 Cyanobacteria (Blue-Green Algae)........................................................................... 1 1.2 Implications of Blue-Green Algae Blooms............................................................... 1 1.3 Blue-Green Algae Blooms in Canada....................................................................... 2 1.4 Blue-Green Algae Blooms in Newfoundland and Labrador.................................... 2
2.0 Field Investigation of Summer 2007 Blue-Green Algae Blooms ............................ 3 2.1 Field Sampling History ............................................................................................ 3
2.1.1 September 7th...................................................................................................... 9 2.1.2 September 13th.................................................................................................... 5 2.1.3 September 14th.................................................................................................... 9 2.1.4 September 18th.................................................................................................... 9 2.1.5 October 12th ..................................................................................................... 10
2.2 Sampling Analysis .................................................................................................. 11 3.0 Discussion................................................................................................................... 11
3.1 Spatial Distribution of Bloom................................................................................. 11 3.2 Nutrient Status ........................................................................................................ 11 3.3 Hydrological Influence ........................................................................................... 15 3.4 Physical and Chemical Water Quality Parameter Results ...................................... 15 3.5 Bacteriological Results ........................................................................................... 22 3.6 Microcystin Results ................................................................................................ 22
4.0 Conclusions and Recommedations .......................................................................... 25 4.1 Conclusions............................................................................................................. 25 4.2 Recommendations................................................................................................... 26
5.0 References .................................................................................................................. 27 Appendix A – Public Advisory Issued September 27th, 2007..................................... 28
ii
List of Tables
Table 1: List of water chemistry parameters analysed…………………………………….4 Table 2: Summary table of nutrient levels........................................................................ 12 Table 3: Physical and Chemical water quality parameters for September 7th at all four ponds ................................................................................................................................. 16 Table 4: Physical and Chemical water quality parameters for September 14th at all four ponds ................................................................................................................................. 17 Table 5: Physical and Chemical water quality parameters for September 18th at all four ponds ................................................................................................................................. 18 Table 6: Water quality results for the inputs to Paddy’s Pond on September 14th .......... 19 Table 7: Results of on site water quality measurements of physical parameters in the four ponds, September 18th (and inputs to Paddy’s Pond). ...................................................... 20 Table 8: Water quality results for the survey of Paddy’s Pond on October 12th (physical/chemical parameters) ........................................................................................ 21 Table 9: Bacteriological sample results ........................................................................... 22 Table 10: Microcystin-LR analysis results for September 14th, 2007 ............................. 23 Table 11: Microcystin-LR analysis results for September 18th, 2007 ............................. 23 Table 12: Microcystin-LR analysis results for October 12th, 2007.................................. 24
List of Figures
Figure 1: Map of sampling locations .................................................................................. 5 Figure 2: Picture of all four ponds sampled........................................................................ 6 Figure 3: September 18th, 2007 at Paddy’s Pond............................................................... 7 Figure 4: Sampling locations of survey - Paddy's Pond, October 12 ................................. 8 Figure 5: Contour map of nitrogen concentrations on the Avalon Peninsula................... 13 Figure 6: Contour map of phosphorous concentrations on the Avalon Peninsula............ 14 Figure 7: Anabaena type cyanobacteria............................................................................ 23
List of Appendices
Appendix A – Public Advisory Issued September 27th, 2007…………………………...30
iii
1.0 Introduction This report summarizes the field survey undertaken by the Water Resources Management Division, laboratory analysis results of water samples collected from all sites, and a path forward for dealing with blue-green algae blooms in the future. 1.1 Cyanobacteria (Blue-Green Algae)
Cyanobacteria are a phylum of bacteria that is commonly referred to as blue-green algae. Despite this common name, blue-green algae are in fact bacteria that can range in colour from olive-green to red. Cyanobacteria are photosynthetic – they use the energy of the sun for their own metabolism. In order to accomplish photosynthesis, they utilize chlorophyll-a, which is present in their cells (Earth Life Web, 2007). Blue-green algae are widely occurring throughout the world, and are a highly opportunistic organisms that will grow rapidly if conditions are suitable (Queensland Government, 2007).
Blue-green algae can be found throughout the entire water column, but can rise to the surface, creating a surface bloom, which is easily identifiable (Health Canada, 2007). A bloom can occur and dominate when: nutrient levels (particularly phosphorous and nitrogen) are sufficient to support population growth; water is still; weather patterns are stable and warm. Blooms can persist for several weeks or even months if weather and flow conditions remain stable and supportive of growth (Queensland Government, 2007).
Some cyanobacteria are made up of cells that store a naturally produced substance known as cyanobacterial toxins. There are many types of toxins produced by cyanobacteria, including hepatotoxins (which affect the liver), neurotoxins (which affect the nervous system), and more innocuous toxins that simply irritate the skin. The toxins are released into the water when the cyanobacteria cells rupture or die. A group of toxins known as microcystins are the most common form of cyanobacterial toxins found in water. Microcystins are very stable in water, and can survive a range of water temperatures and chemistries. It is important to note that the presence of a bloom does not necessarily mean that there are toxins in the water (Health Canada, 2007). 1.2 Implications of Blue-Green Algae Blooms If elevated levels of certain cyanobacterial toxins are found in water, ingestion of this water can cause headaches, fever, diarrhoea, abdominal pain, nausea and vomiting. Boiling water does not inactivate cyanobacterial toxins. Contact with the water through recreational activities (such as swimming) can result in itchy and irritated eyes and skin or other reactions that are very similar to hay-fever allergic reactions. The presence of a surface algae bloom does not necessarily indicate that cyanobacterial toxins are present. However, it is recommended that waters experiencing blue-green algae blooms not be
1

used for recreational activities as water clarity is often impaired and cyanobacterial toxins may be present in unknown quantities (Health Canada, 2007). Health Canada has a drinking water quality guideline for a common cyanobacterial toxin known as microcystin-LR (1.5µg/L). No numerical guideline for microcystin-LR is currently available from Health Canada for recreational water use. While there is no existing Canadian numerical cyanobacterial guideline value for livestock watering, it is recommended that water with heavy blue-green algae growths be avoided (Health Canada, 2007). 1.3 Blue-Green Algae Blooms in Canada Blue-green algae blooms occur frequently throughout Canada. Response to blue-green algae blooms varies across the country. In the summer of 2007, Québec posted public warnings for more than 70 waterways with blue-green algae blooms. Other provincial authorities including those in New Brunswick, Ontario and British Columbia reportedly did not post warnings despite the occurrence of blooms. 1.4 Blue-Green Algae Blooms in Newfoundland and Labrador Prior to 2007, there were no recorded occurrences of blue-green algae blooms in the Province. In the summer of 2007, blooms were detected in several ponds on the Northeast Avalon: Cochrane Pond, Paddy’s Pond, Three Arm Pond and Three Island Pond. In response to public concern, staff from the Water Resources Management Division of the Department of Environment and Conservation conducted site visits, water quality sampling, and consulted with other relevant government agencies. Once the presence of cyanobacteria and microcystin-LR was confirmed, the Department of Environment and Conservation issued a public advisory on September 27th, 2007 (see Appendix A).
2
2.0 Field Investigation of Summer 2007 Blue-Green Algae Blooms A resident of Three Island Pond first contacted the Department of Environment and Conservation on August 31st with concerns about water discolouration in Three Island Pond. On September 6th, another resident contacted the Department with a similar concern. An official from the Department (Martin Goebel) contacted staff from the Department of Fisheries and Oceans, who had already begun to investigate the incident. The Department of Fisheries and Oceans indicated that the discoloration was being caused by an apparent algae bloom. In response to the above-noted concerns, Water Resources Management Division staff collected several sets of samples from Cochrane Pond, Paddy’s Pond, Three Arm Pond and Three Island Pond. Samples were collected on September 7th, 13th, 14th and 18th. These samples were submitted to accredited laboratories for physical, chemical, and bacteriological analysis, including cyanobacterial and microcystin-LR identification. On October 12th, Water Resources Management Division staff, along with Department of Fisheries and Oceans staff, completed a survey of Paddy’s Pond in order to get a more complete picture of the distribution of blue-green algae in the pond and the water column. 2.1 Field Sampling History Water samples were taken on September 7th, 13th, 14th and 18th. Sampling locations are indicated in Figure 1. Samples collected from the four ponds on September 7th were analysed for water chemistry (see Table 1 for a list of parameters analysed). On September 13th, samples collected from the four ponds were analysed for the presence cyanobacteria and microcystin-LR. On September 14th samples were collected from six inputs that discharge water into Paddy’s Pond and analysed for water chemistry. On September 18th, samples from the four ponds were collected for water chemistry analysis, and cyanobacteria and microcystin-LR identification. In addition, on September 18th, bacteriological samples and physical data (collected using a water quality field probe) were collected at the six inputs to Paddy’s Pond. Photos of each sampling location can be seen in Figures 2 and 3. On October 12th, a survey of Paddy’s Pond was completed and water chemistry, cyanobacteria and microcystin-LR samples were collected. Figure 4 is a map of the locations of samples taken during this survey.
3

Table 1: List of water chemistry parameters analysed
Inorganics Elements Major Ions Total Alkalinity Mercury Calcium
Bromide Aluminum Magnesium Chloride Antimony Phosphorous Colour Arsenic Potassium
Fluoride Barium Sodium Hardness Boron
Nitrate Cadmium Nitrite Chromium
Nitrogen (ammonia) Copper Dissolved Organic Carbon Iron
pH Lead Reactive Silica Manganese
Sulphate Nickel Total Kjeldahl Nitrogen Selenium
Turbidity Uranium Conductivity Zinc
Calculated Total Dissolved Solids
4

Figure 1: Map of sampling locations
5

(a) (b)
(c) (d)
Figure 2: Picture of all four ponds sampled (a – Cochrane Pond; b – Paddy’s Pond; c –Three Arm
Pond; d – Three Island Pond) on September 13th, 2007.
6

(a) (b)
(c)
Figure 3: September 18th, 2007 at Paddy’s Pond (a – water quality probe at input to Paddy’s Pond; b – view of blue-green algae bloom on shoreline; c – dense mat of blue-green algae bloom)
7

Figure 4: Sampling locations of survey - Paddy's Pond, October 12
8

2.1.1 September 7th
Sampling locations were chosen at the outlet of each pond to provide representative values of water quality. The blue-green algae bloom was quite visible in the water column at Paddy’s Pond, Three Arm Pond and Three Island Pond, but was not visible at Cochrane Pond, the headwaters of the pond system. 2.1.2 September 13th Cochrane Pond: No algae were observed in the water column. Water appeared very clear from the surface to the bottom in shallow areas with low flow, as well as in areas with greater depth and flow (Figure 2). Paddy’s Pond: Algae appeared prevalent in the water column. High winds created rough water conditions with white cap waves, making it difficult to capture clear photos of algae (Figure 2). Three Arm Pond: Algae were easily visible, suspended throughout the water column. A green bloom was floating on the surface in low flow/stagnant and shallow areas. No bloom was visible in areas of greater depth and flow (Figure 2). Three Island Pond: Algae was easily visible, suspended throughout water column. No bloom could be seen floating on surface (Figure 2). Moderate to strong winds created water movement, likely preventing the bloom from forming on the surface. Algae appeared more prevalent in shallow areas and/or areas with less flow. 2.1.3 September 14th
Based on the extent of the blue-green algae bloom observed on September 13th, a decision was made to intensify the sampling program by collecting samples from all accessible inputs that discharge water into Paddy’s Pond. The bloom was not visible at any of these six input locations.
2.1.4 September 18th
Cochrane Pond: The water appeared clear, with no evidence of blue-green algae bloom. Paddy’s Pond: The bloom on Paddy’s Pond was significantly larger and more visibly evident. Thick blue-green algae “mats” extended for several metres across the water surface in some areas. There was little to no wind on this sampling day, and water temperature was warmer.
9

Three Island Pond: There appeared to be little change in the amount of blue-green algae growth. Three Arm Pond: It appeared that there was a slight increase in the amount of blue-green algae bloom at this site. The bloom was more visible on the surface than it was on September 13th. The water was very still due to low wind conditions. 2.1.5 October 12th Based on the extensive bloom observed at Paddy’s Pond on September 18th a survey was conducted with Department of Fisheries and Oceans staff on October 12th, in order to get a more complete picture of the distribution of cyanobacteria and microcystin-LR in the pond and the water column. The bloom appeared to be dissipating with cooler water temperatures.
10

2.2 Sampling Analysis Samples were delivered to Maxxam Analytics Incorporated in St. John’s for analysis of physical and chemical parameters. Physical data (temperature, pH, specific conductance, total dissolved solids, turbidity, chlorophyll-a and dissolved oxygen) was also collected using a water quality probe. Additional samples were shipped to HydroQual Labs in Calgary, Alberta for cyanobacteria identification and microcystin-LR detection and measurement. Bacteriological samples were sent to the provincial Public Health Laboratory in St. John’s. Results from all laboratories are discussed in the next section. 3.0 Discussion 3.1 Spatial Distribution of Bloom Results of the water quality sampling identified the presence of cyanobacteria (blue-green algae) in Paddy’s Pond, Three Arm Pond and Three Island Pond. The toxin microcystin-LR, which is produced by some species of cyanobacteria, was detected at all four sites, including Cochrane Pond where no cyanobacteria were detected in the grab sample. The highest concentration of microcystin-LR measured was 0.36 µg/L, which is about four times less than the recommended maximum concentration of 1.5 µg/L for Canadian drinking water safety. The highest concentrations of microcystin-LR were found in Cochrane Pond and Paddy’s Pond, which flow into Three Arm Pond and Three Island Pond. The blue-green algae bloom was clearly visible at sampling locations in Paddy’s Pond, Three Arm Pond and Three Island Pond. The visible bloom persisted at these three ponds for 4-6 weeks. Persistent sunny conditions and warm water temperatures in September may have prolonged the bloom. 3.2 Nutrient Status Algae require sunlight and nutrients, particularly nitrogen and phosphorous to flourish. Increased availability of these growth factors could lead to an algae bloom. The higher the nutrient concentration in a waterbody, the more likely it is to experience an algal bloom.ii Table 2 lists the phosphorous and nitrogen concentrations of all ponds for all sampling dates. Cholorphyll-a, nitrogen and phosphorous concentrations were highest in Paddy’s Pond, where the blue-green algae bloom was the most pronounced.
11

Table 2: Summary table of nutrient levels Pond Sep. 7 Sep. 14 Sep. 18 Oct. 12
P* N* P N P N Chl. a* P N
Cochrane Pond
<0.1 (LDL)*
1 <0.1 (LDL)
0.7 1.61
Paddy’s Pond
<0.1 (LDL)
0.7 LDL to
0.2**
0.2 0.3 25 1.84 to 18.18**
<0.1 (LDL)
Three Arm Pond
<0.1 (LDL)
0.5 <0.1 (LDL)
0.5 4.29
Three Island Pond
<0.1 (LDL)
0.5 <0.1 (LDL)
0.5 1.8
*(Phosphorous = P (mg/L); Total Nitrogen = N (mg/L); Chl. a = Chlorophyll-a(µg/L); LDL = Less than Detection Limit) of all four ponds.
** On September 18th, multiple samples were taken from the inputs to Paddy’s Pond There is no long-term water quality data available for the four ponds prior to the recent blue-green algae bloom. A review of historical water quality data from waterbodies in the general area was conducted. This review indicated that nitrogen levels found in the four ponds were near natural background levels with one exception (see Table 2). However, phosphorous levels at the four ponds could not be compared to historical data due to a difference in the analytical techniques used by the laboratories. As seen in Table 2, the majority of phosphorous concentrations measured during the investigation were below the less than detection limit of 0.1 mg/L. Figures 5 and 6 show contour maps of average ambient phosphorous and nitrogen concentrations over the past 20 years, from waterbodies across the Avalon Peninsula. In general, phosphorous levels in the area have been below 0.02 mg/L, and are generally experiencing a decreasing trend (Dawe, 2006). During the investigation, one sample (September 18th, Paddy’s Pond) was higher than the less than detection limit of 0.1mg/L, and had a measured value of 0.3mg/L. Phosphorous is considered to be the most limiting nutrient of blue-green algae growth, as these organisms can readily fix nitrogen from the atmosphere directly. Phosphorous and nitrogen can be increased in a waterbody as a result of various land use activities such as agriculture, livestock operations and septic tank effluent.
12

Figure 5: Contour map of nitrogen concentrations on the Avalon Peninsula
13

Figure 6: Contour map of phosphorous concentrations on the Avalon Peninsula
14

15
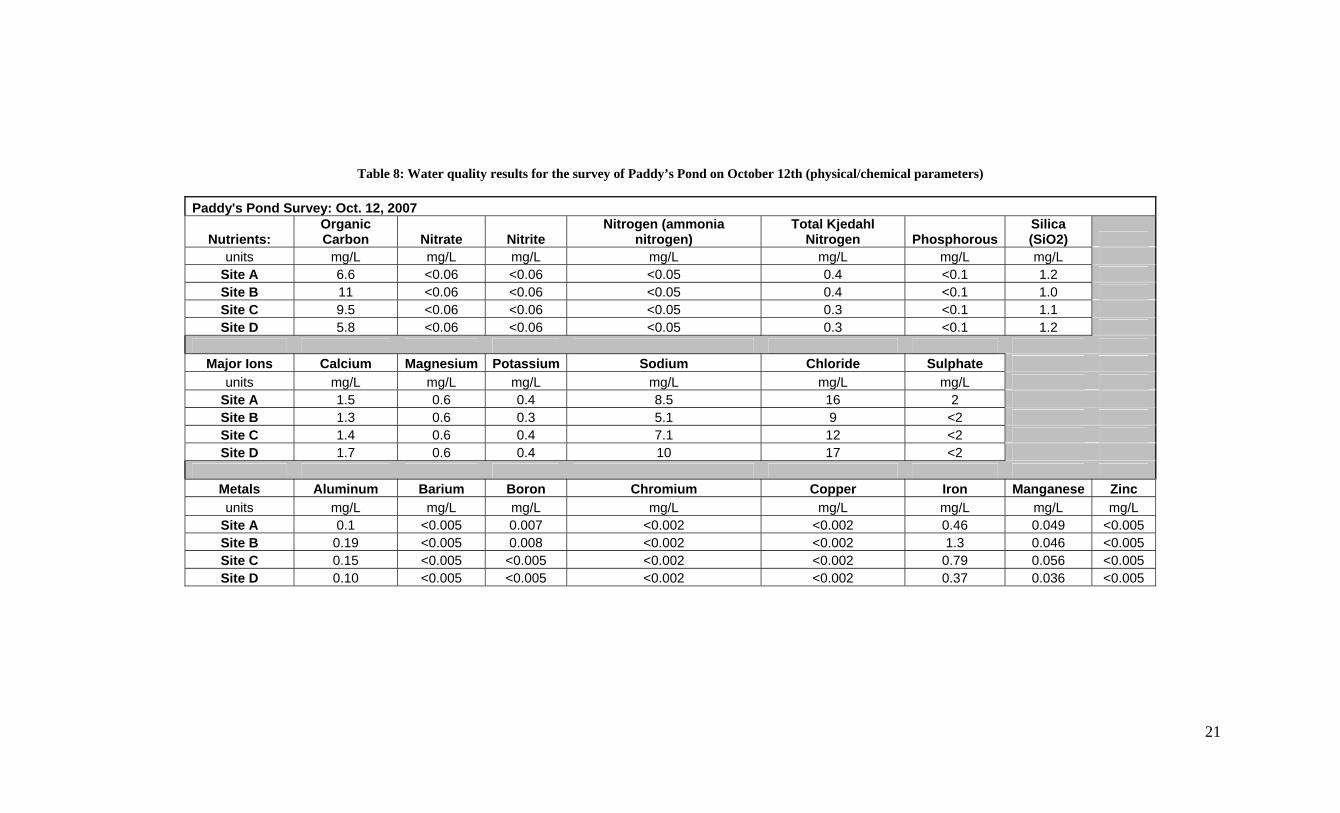
3.3 Hydrological Influence Nutrient levels in ponds, lakes and streams are naturally influenced by sediment and chemical loading resulting from storm runoff events (Internet Water Education Tool, 2007). The degree of loading is directly related to the intensity of the precipitation event. Physiographic characteristics such as soil type, land cover and slope also influence loading rates. On August 1st, 2007, Tropical Storm Chantal resulted in approximately 100 millimetres of rainfall in the St. John’s area. This unusually heavy rainfall event resulted in an increase in runoff that may have affected the nutrient status of the ponds that later experienced blue-green algae blooms. Nutrient levels immediately after Tropical Storm Chantal may have been high enough to trigger the blue-green algae bloom, however there is no direct data available to support this hypothesis. When the first round of water quality sampling was conducted on September 7th, 2007, nitrogen and phosphorous levels measured near natural background levels. This may be due to the fact that nutrients were consumed in order to sustain algal growth. 3.4 Physical and Chemical Water Quality Parameter Results Tables 2, 3 and 4 list the results of key water quality parameters in the four ponds sampled during this event. Table 5 lists the results of water quality parameters sampled at the inputs to Paddy’s Pond on September 14th. These inputs are culverts that act as drains for land based activities upstream of Paddy’s Pond. Table 6 lists the results of physical water quality parameters sampled using a water quality probe at the four ponds and at the inputs to Paddy’s pond on September 18th. Table 7 lists the results of the survey of Paddy’s Pond conducted on October 12th.

Table 3: Physical and Chemical water quality parameters for September 7th at all four ponds
Sep. 7, 2007
Nutrients: Organic Carbon Nitrate Nitrite
Nitrogen (ammonia nitrogen)
Total Kjedahl Nitrogen Phosphorus
Silica (SiO2)
units mg/L mg/L mg/L mg/L mg/L mg/L mg/L Cochrane Pond 4.7 0.03 0.03 0.05 0.4 <0.1 1 Paddy's Pond 5.5 0.03 0.03 0.025 1 <0.1 1.4
Three Arm Pond 6.1 0.03 0.03 0.025 0.7 <0.1 1.6 Three Island
Pond 4.4 0.03 0.03 0.025 0.5 <0.1
1
Major Ions Calcium Magnesium Potassium Sodium Chloride Sulphate units mg/L mg/L mg/L mg/L mg/L mg/L
Cochrane Pond 1.3 0.6 0.4 4.2 6 1 Paddy's Pond 2.1 0.7 0.4 15 19 2
Three Arm Pond 1.9 0.7 0.3 9.3 14 2 Three Island
Pond 2.3 0.7 0.5 12 16 3
Metals Aluminum Boron Chromium Copper Iron Manganese Zinc units mg/L mg/L mg/L mg/L mg/L mg/L mg/L
Cochrane Pond 0.06 <0.005 <0.002 0.001 0.12 0.019 0.0025 Paddy's Pond 0.1 <0.005 <0.002 0.001 0.46 0.17 0.0025
Three Arm Pond 0.14 <0.005 <0.002 0.001 0.44 0.19 0.0025 Three Island
Pond 0.07 0.005 <0.002 0.003 0.17 0.063 0.006
16

Table 4: Physical and Chemical water quality parameters for September 14th at all four ponds
Sep. 14, 2007
Nutrients: Organic Carbon Nitrate Nitrite
Nitrogen (ammonia nitrogen)
Total Kjedahl Nitrogen Phosphorus
Silica (SiO2)
units mg/L mg/L mg/L mg/L mg/L mg/L mg/L Cochrane Pond Paddy's Pond 3.5 <0.06 <0.06 0.07 0.2 <0.1 5.2
Three Arm Pond Three Island
Pond
Major Ions Calcium Magnesium Potassium Sodium Chloride Sulphate units mg/L mg/L mg/L mg/L mg/L mg/L
Cochrane Pond Paddy's Pond 6.2 1.1 0.6 67 81 5
Three Arm Pond Three Island
Pond
Metals Aluminum Boron Chromium Copper Iron Manganese Zinc units mg/L mg/L mg/L mg/L mg/L mg/L mg/L
Cochrane Pond Paddy's Pond 0.15 0.006 0.014 <0.002 4 2.3 0.01
Three Arm Pond Three Island
Pond
17

Table 5: Physical and Chemical water quality parameters for September 18th at all four ponds
Sep. 18, 2007
Nutrients: Organic Carbon Nitrate Nitrite
Nitrogen (ammonia nitrogen)
Total Kjedahl Nitrogen Phosphorus
Silica (SiO2)
units mg/L mg/L mg/L mg/L mg/L mg/L mg/L Cochrane Pond 5.7 <0.06 <0.06 <0.05 0.7 <0.1 1.2 Paddy's Pond 6.5 <0.06 <0.06 0.06 25 0.3 1.7
Three Arm Pond 6.8 <0.06 <0.06 <0.05 0.5 <0.1 1.9 Three Island
Pond 5.2 <0.06 <0.06 <0.5 0.5 <0.1 1.3
Major Ions Calcium Magnesium Potassium Sodium Chloride Sulphate units mg/L mg/L mg/L mg/L mg/L mg/L
Cochrane Pond 1.4 0.7 0.5 4.6 6 <2 Paddy's Pond 2.7 0.9 1.2 21 28 3
Three Arm Pond 2.2 0.7 0.5 10 9 2 Three Island
Pond 2.6 0.8 0.5 13 10 3
Metals Aluminum Boron Chromium Copper Iron Manganese Zinc units mg/L mg/L mg/L mg/L mg/L mg/L mg/L
Cochrane Pond 0.05 <0.005 0.007 0.004 0.1 0.016 0.007 Paddy's Pond 0.13 0.007 0.02 <0.002 0.59 0.3 0.016
Three Arm Pond 0.17 <0.005 <0.002 <0.002 0.53 0.22 0.007 Three Island
Pond 0.09 0.005 <0.002 <0.002 0.23 0.096 0.005
18

Table 6: Water quality results for the inputs to Paddy’s Pond on September 14th (physical/chemical parameters)
Paddy's Pond Inputs: Sep. 14, 2007
Nutrients: Organic Carbon Nitrate Nitrite
Nitrogen (ammonia nitrogen)
Total Kjedahl Nitrogen Phosphorus
Silica (SiO2)
units mg/L mg/L mg/L mg/L mg/L mg/L mg/L Input #1 12 <0.06 <0.06 0.25 0.8 0.2 7.5 Input #2 13 <0.06 <0.06 <0.5 0.4 <0.1 6.2 Input #3 15 <0.06 <0.06 <0.5 0.5 0.2 7 Input #4 6.8 <0.06 <0.06 <0.5 0.3 <0.1 1.3 Input #5 3.5 <0.06 <0.06 0.07 0.2 <0.1 5.2 Input #6 4.9 <0.06 <0.06 <0.5 0.4 <0.1 5.7 Major Ions Calcium Magnesium Potassium Sodium Chloride Sulphate
units mg/L mg/L mg/L mg/L mg/L mg/L Input #1 7 1.4 1.3 32 41 3 Input #2 4.1 0.9 0.4 35 48 2 Input #3 3.6 1.2 1.2 17 23 <2 Input #4 1.3 0.6 0.4 4.2 6 2 Input #5 6.2 1.1 0.6 67 81 5 Input #6 0.1 0.1 0.4 0.1 35 <2 Metals Aluminum Barium Boron Chromium Copper Iron Manganese Zinc
units mg/L mg/L mg/L mg/L mg/L mg/L mg/L mg/L Input #1 0.27 <0.005 0.007 0.002 <0.002 1.1 0.078 0.02 Input #2 0.3 0.005 <0.005 0.01 <0.002 0.79 0.12 0.008 Input #3 0.25 <0.005 0.007 <0.002 <0.002 0.86 0.036 0.009 Input #4 0.06 <0.005 0.005 <0.002 <0.002 0.18 0.054 <0.005 Input #5 0.15 0.014 0.006 0.014 <0.002 4 2.3 0.01 Input #6 0.14 0.005 0.005 <0.002 <0.002 1.3 0.31 <0.005
19

Table 7: Results of on site water quality measurements of physical parameters in the four ponds, September 18th (and inputs to Paddy’s Pond).
Site Name Hydrolab Time Temp pH SpC TDS Tur CHL DO % DO
Site 01 Datasonde 12:23:21 10 6.13 1049 0.6712 0.0 4.75 51.8* 5.83 Minisonde 12:25:14 10.42 5.78 1193 0.7635 56.9* 6.33
Site 02 Datasonde 12:41:56 11.2 5.96 351.5 0.225 0.0 2.75 21.7* 2.38 Minisonde 12:43:00 11 5.45 365 0.2336 41.9* 4.61
Site 03 Datasonde 12:50:13 12.58 6.39 126.5 0.081 0.4 6.92 91.3 9.71 Minisonde 12:52:06 12.46 5.83 127 0.0813 96.3 10.26
Site 04 Datasonde 13:03:44 15.43 6.56 32.2 0.0206 0.0? 1.84 91.7 9.16 Minisonde 13:05:36 15.34 5.94 33.8 0.0217 93.5 9.36
Site 05 Datasonde 11:59:56 18.09 6.29 238 0.1523 197.1 18.18 80.1 7.56 (Paddy's Pond) Minisonde 12:01:26 17.51 5.94 271.6 0.1738 86.1 8.22
Site 06 Datasonde 13:14:51 12.92 6.79 165.3 0.1058 0.2 1.26 89.8 9.47 Minisonde 13:16:47 13.08 6.23 166.9 0.1068 93.4 9.82
Three Arm Pond Datasonde 16:48:45 15.07 6.81 60.6 0.0388 1 4.29 89.5 9.01
Minisonde 16:51:04 15.25 6.61 62.9 0.0403 94.6 9.49 Three Island
Pond Datasonde 16:19:06 15.58 6.98 77.3 0.0494 14 1.8 91.5 9.11 Minisonde 16:21:47 15.51 6.5 78.1 0.05 96.5 9.62
Cochrane Pond Datasonde 15:50:58 16.74 6.94 31.5 0.0202 0.0? 1.61 99.9 9.71
* Low dissolved oxygen levels are likely the result of s ocation – samples w om stagnant pools at a low of the same culvert. (SpC = Specific Conductance; TDS = Total Dissolved Solids; Tur = Turbidity; CHL = Chlorophyll-a; DO = Dissolved
Oxygen)
ampling l ere taken fr the inflow nd outf Minisonde 15:52:50 17.04 6.6 32.8 0.021 105.8 10.22
20
21
Table 8: Water quality results for the survey of Paddy’s Pond on October 12th (physical/chemical parameters)
Paddy's Pond Survey: Oct. 12, 2007
Nutrients: Organic Carbon Nitrate Nitrite
Nitrogen (ammonia nitrogen)
Total Kjedahl Nitrogen Phosphorous
Silica (SiO2)
units mg/L mg/L mg/L mg/L mg/L mg/L mg/L Site A 6.6 <0.06 <0.06 <0.05 0.4 <0.1 1.2 Site B 11 <0.06 <0.06 <0.05 0.4 <0.1 1.0 Site C 9.5 <0.06 <0.06 <0.05 0.3 <0.1 1.1 Site D 5.8 <0.06 <0.06 <0.05 0.3 <0.1 1.2
Major Ions Calcium Magnesium Potassium Sodium Chloride Sulphate
units mg/L mg/L mg/L mg/L mg/L mg/L Site A 1.5 0.6 0.4 8.5 16 2 Site B 1.3 0.6 0.3 5.1 9 <2 Site C 1.4 0.6 0.4 7.1 12 <2 Site D 1.7 0.6 0.4 10 17 <2
Metals Aluminum Barium Boron Chromium Copper Iron Manganese Zinc units mg/L mg/L mg/L mg/L mg/L mg/L mg/L mg/L
Site A 0.1 <0.005 0.007 <0.002 <0.002 0.46 0.049 <0.005 Site B 0.19 <0.005 0.008 <0.002 <0.002 1.3 0.046 <0.005 Site C 0.15 <0.005 <0.005 <0.002 <0.002 0.79 0.056 <0.005 Site D 0.10 <0.005 <0.005 <0.002 <0.002 0.37 0.036 <0.005

3.5 Bacteriological Results At Paddy’s Pond, fecal coliform levels exceeded recreational water quality guidelines (see Table 8), but the magnitude of the exceedance does not indicate excessive land based input. It is important to note that these results are from one grab sample only, and do not follow the protocol of multiple samples recommended in cases of exceedance.
Table 9: Bacteriological sample results
Location Date Sampled TotalColiformFecalColiform
(E. coli) /100mL /100mL
Cochrane Pond Oct. 18, 2007 710 10 *Paddy's Pond Oct. 18, 2007 2600 310
Three Arm Pond
Oct. 18, 2007 430 <10
Three Island Pond
Oct. 18, 2007 360 <10
Site # 1 Oct. 18, 2007 3000 <10 Site # 2 Oct. 18, 2007 1600 <10 Site # 3 Oct. 18, 2007 4100 <10 Site # 4 Oct. 18, 2007 2500 20 *Site # 5 Oct. 18, 2007 2600 310 Site # 6 Oct. 18, 2007 1670 100
Site #5 is the same as the Paddy’s Pond sampling site, and is where fecal coliform levels exceeded the recreational water quality guideline.
3.6 Microcystin Results Water analysis results from the pond sites indicated the presence of cyanobacteria (with the exception of Cochrane Pond). The majority of the organisms were the Anabaena type of cyanobacteria, which produces microcystin-LR (Figure 7).
22

Figure 7: Anabaena type cyanobacteria (identified as the likely source of the measured microcystin-
LR) The results of the testing for cyanobacteria and microcystin-LR on September 14th are shown in Table 9. Table 10: Microcystin-LR analysis results for September 14th, 2007 (LDL = less than detection limit)
Pond Collection Date Microcystin-LR (µg/L)
Paddy’s Pond Sep. 13, 2007 0.36
Cochrane Pond Sep. 13, 2007 0.24 Three Arm Pond Sep. 13, 2077 <0.22 (LDL)
Three Island Pond Sep. 13, 2007 <0.22 (LDL) The results of the testing for cyanobacteria and microcystin-LR on September 18th are shown in Table 10. Table 11: Microcystin-LR analysis results for September 18th, 2007 (LDL = less than detection limit)
Pond Collection Date Microcystin-LR (µg/L)
Paddy’s Pond Sep. 18, 2007 <0.22 (LDL)
Cochrane Pond Sep. 18, 2007 0.35 Three Arm Pond Sep. 18, 2077 <0.22 (LDL)
Three Island Pond Sep. 18, 2007 0.29
23

The results of testing for cyanobacteria and microcystin-LR on October 12th are shown in Table 11.
Table 12: Microcystin-LR analysis results for October 12th, 2007 (LDL = less than detection limit) Site Collection Date Microcystin-LR
(µg/L) Paddy’s Pond A Oct. 12, 2007 0.30
Paddy’s Pond B Oct. 12, 2007 0.31 Paddy’s Pond C Oct. 12, 2077 0.28 Paddy’s Pond D Oct. 12, 2007 <0.22 (LDL)
All microcystin-LR results were below the drinking water quality guideline of 1.5 µg/L.
24

4.0 Conclusions and Recommendations 4.1 Conclusions In response to the presence of algae blooms in Cochrane Pond, Paddy’s Pond, Three Arm Pond and Three Island Pond, Water Resources Management Division staff initiated an investigation to identify the species of algae, and to determine the presence or absence of toxins associated with such blooms. It was confirmed that the bloom was made up of blue-green algae, and was dominated by a species that produces the toxin microcystin-LR. Once the presence of cyanobacteria and microcystin-LR was confirmed, the Department of Environment and Conservation issued a public advisory on September 27th, 2007. Detectable levels of microcystin-LR were found in Cochrane Pond, Paddy’s Pond, and Three Island Pond, with all levels measuring well below the Canadian drinking water guidelines. Currently, no numerical recreational water use guideline exists for microcystin-LR. Health Canada states that until the presence and level of cyanobacterial toxin is known, recreational water use is not recommended during a blue-green algae bloom due the potential dangers associated with reduced water clarity. No national protocol is in place for determining if public notification or closure of water bodies is needed. Nutrient levels in the four ponds were measured. One sample taken from Paddy’s Pond had an elevated concentration of phosphorous and nitrogen. Land based activities at the headwaters of this pond system have the potential to influence nutrient levels in the affected ponds. Distribution and levels of the nutrient concentrations suggest that a common event may have affected the four ponds, resulting in the increase in nutrients required to trigger the development of the blue-green algae bloom. It is possible that Tropical Storm Chantal and resulting sediment and chemical loadings in runoff may have resulted in increased nutrient levels in the ponds. The fact that most samples collected during this investigation did not show elevated concentrations of nitrogen and phosphorous may be attributed to nutrient consumption during the life of the bloom. Persistent sunny conditions and warm water temperatures in September may have prolonged the bloom. As observed in the October 12th survey of Paddy’s Pond, where the bloom was most pronounced, visible evidence of the blue-green algae bloom was noticeably dissipating, although microcystin-LR levels remained stable. The Newfoundland and Labrador Department of Environment and Conservation had no reports of blue-green algae blooms prior to 2007. Consultation is ongoing with relevant agencies to develop a protocol to deal with blue-green algae blooms in the future.
25

4.2 Recommendations
• Field test kits will be ordered so that on site detection of cyanobacteria and their toxins can be performed in a timely manner in future investigations.
• A blue-green algae sensor will be added to an existing water quality field probe to
assist in timely confirmation of the presence of blue-green algae.
• The Department of Environment and Conservation will continue to respond to reports of blue-green algae blooms on a case-by-case basis.
26

5.0 References Dawe, P. 2006. A statistical evaluation of water quality trends in selected water bodies of
Newfoundland and Labrador. J. Environ. Eng. Sci. 5: 59-73. Earth Life Web. Phylum 5 – Cyanobacteria. Accessed October, 2007.
http://earthlife.net/prokaryotes/cyano.html Health Canada. Blue Green Algae (Cyanobacteria) and their Toxins. Accessed October,
2007. http://www.hc-sc.gc.ca/ewh-semt/water-eau/drink-potab/cyanobacteria-cyanobacteries_e.html
Internet Water Education Tool. Nutrients from the Researcher Perspective. Accessed
October, 2007. http://www.interwet.psu.edu/index.htm Queensland Government , Natural Resources and Water. Blue-Green Algae. Accessed
October, 2007. http://www.nrw.qld.gov.au/water/blue_green/blue_green.html
27

Appendix A – Public Advisory Issued September 27th, 2007
28

Government Home Search Sitemap Contact Us Environment and Conservation September 27, 2007
Public Advisory: Blue-Green Algae Present in Avalon Area Ponds
The Department of Environment and Conservation advises that test results have confirmed the presence of blue-green algae in the following ponds: Three Island Pond, Paddy’s Pond, Cochrane Pond and Three Arm Pond. The department recently collected water samples from these ponds for analysis in response to concerns by area residents about the discolouration of the water.
The four ponds are frequently used for recreational activities such as boating and swimming. The Canadian Guidelines for Recreational Water Quality state that water with blue-green surface scum or blue-green algae should be avoided.
Blue-green algae blooms rely on elevated nutrient levels and sunlight to grow. Increases in any or all of these factors could lead to an algae bloom. Algae blooms typically occur late in summer when water temperatures are higher. The blooms in these ponds will dissipate as cooler water and seasonal temperatures persist.
Once the final report is available, it will be posted on the Water Resources Division Web site at www.env.gov.nl.ca/env/Env/water_resources.asp
For more information about blue-green algae, visit Health Canada’s Web site at www.hc-sc.gc.ca/ewh-semt/water-eau/drink-potab/cyanobacteria-cyanobacteries_e.html
-30-
Media contact:
Diane Hart Director of Communications Department of Environment and Conservation 709-729-2575, 685-4401 [email protected]
2007 09 27 3:55 p.m.
All material copyright the Government of Newfoundland and Labrador. No unauthorized copying or redeployment permitted. The Government assumes no responsibility for the accuracy of any material deployed on an unauthorized server. Disclaimer/Copyright/Privacy Statement
Page 1 of 1Public Advisory: Blue-Green Algae Present in Avalon Area Ponds
12/4/2007http://www.releases.gov.nl.ca/releases/2007/env/0927n05.htm