field study of an anchored sheet pile bulkhead hy fang ladislav lamboj2 thomas
TRANSCRIPT

-F
iN~~--'
FIELD STUDY OF AN ANCHORED SHEET PILE BULKHEAD
by.
1H. Y. Fang
Ladislav Lamboj2
Thomas D. Dismuke3
1Associate Professor of Civil Engineering and Director, GeotechnicalEngineering Division) Fritz Engineering Laboratory, Lehigh University.
2Research Assistant, Fritz Engineering Laborato~y, Lehigh University.
3Consulting Engineer, Bethlehem Steel Corporation, Bethlehem, Pennsylvania.

-i
ABSTRACT
This paper presents the field measuring technique and instru
mentation f~~ measuring the amount of shear transfer mobilized across .
the interlock at the neutral axis of steel arch web sheet piling~ Com-
parisons of tie rod force and positive maximum bending moment by various
existing m~thods together with field measured data are presented.
It is concluded, within the range of applied loads and soil
characteristics, that shear transfer takes place across the interlocks.
Thus, it is bel~eved that the European practice. of assuming that piles
-act as a unit more closely approximates the given field conditions than
the ~erican practice of assuming individual piling action. However,
since American· practice is based on use of sheet piling in all types of
soil, the designer cannot assume that shear transfer always takes place
when interlock crimping or welding is not used. For comparisons of tie
.rod force, it is indicated that there was a trend for the tie rod force.
to increase as the wall height increases. ~owever, the field results are
much smaller than theoretical results. No definite relation could be
found between theoretical and field results for the maximum moment. It
is thought that much of the scatter may be attributed tq composite action
between soil and the piling. Further investigation of the soil-structure
interaction is necessary in order to more clearly understand the phenomenon.

.-1
INTRODUCTION
The section modulus of a structural member is a measure of its
ability to resist bending. It is calculated by dividing the area moment
of inertia of the member about its axis of bending (the neutral axis) by
the distance' from that axis to the outermost fiber of the member cross~
section. The centroidal axis of an individual arch web' sheet piling sec
tion is located between the axis of the interlocks "and the web, (Fig.·l).
American design practice is to use this centroidal axis as,the neutral
axis for evaluating moment resistance. The location of the centroidal
axis of a wall composed of several interlocked sheet piling sections is
along the line of interlocks (Fig. 1). European design practice is to
use this axis, or an intermediate position, as the neutral axis to eval
uate the moment resistance. As is evident from Fig. 1, the resistance
of an individual section is about one half the resistance of the composite
group. Consequently, de&igns based on the European method are more eco
nomical than those based on the American method, when using arch web piling.
A review of literature concerning sheet pile structures were
made by Fang and Dismuke· (1973)." The reviewp indicated that,·
no information related to the amount of shear transfer across the interlock
and the location of the neutral axis of be~ding for a sheet pile wall were
available.
The objective of" this study was· to evaluate the behavior of
interlocked steel sheet piling in an actual field installation. More
specifically) the strain distribution across a sheet pile was measured

-2
in order to experimentally locate the neutral axis of bendi~g of the wall.
This paper presents a detailed description of the measuring technique
and instrumentation used to study shear transfer in a sheet pile wall.. . ~
In addition) the comparisons of tie rod forces and positive maximum
bending moment by various existing methods together with field data are
also presented •. The existing methods include Blum (1931)) free-earth
(Anderson,1956), Tschebotarioff (1951), and Rowe (1952). The results are
summarized in graphical form; discussion of test results and further in-
vestigation needed are also included.
TEST SITE, INSTRUMENTATION AND MEASURING TECHNIQUES
Test Site
The test site was located at Martins Creek, Pennsylvania.
The soil profile was determined from the results of wash borings
and from information supplied by the Pennsylvania Power and Light Company.
Boring logs recorded the surface conditions, the str~ta changes and thick-
ness, the standard penetration values for the soils, and the elevation of
the groundwater table. Figures 2 and 5 show the results of this soil pro-
file investigation. In general, the test site consisted of a thin layer
of sand and silt underlain by a thicker layer of sand, gravel, and boulders.
Instrumentation
The foil-type SR-4 strain gage was chosen as the primary means

-3
of measuring strain in the piling. As strain gages must be protected
during and after pile driving operations, an evaluation of the strain
gage system was undertak~n in the laboratory. Methods for attaching,,~
waterproofing, and protecting the gage were studied. In addition, the
behavior of the gage was observed under simulated field conditions.
In the laborat~ry, a gage was mounted on the outer portion of
a 2" x 2" angle to simulate the actual mounting of a gage on the sheet
piling and driven into soil. A protec~ive epoxy covering was placed
over the gage, but no attempt was made to keep the covering from touching
or adhering to the gage.
The soil was composed of equal amoullts of coarse sand, obtained
directly from the test site, and 3/4" to 1" crushed stone. It was believed
that' the laboratory soil would be more abrasive to the gage, and its covering,
than the soil at the field site. The soil mixture was placed in a 2'
diameter cylinder of 4' height. A drain spout was t~pped into the bottom·
and a manometer was attached so that the level of the water table could be
controlled and measured. The sand and stone mixture was soaked j vibrated,
and allowed to drain. This produced a very compact mixture for the test.
The laboratory testing of the foil-type· strain gage proved that
the gage could be successfully protected against abrasion under controlled
laboratory conditions, and no trouble would arise as long as the epoxy
covering remained unbroken and bonded to the steel. Therefore, care was

-4
taken to properly bond the epoxy to the steel in all subsequent gage
installations •
. After it was shown that the gages could be protected under
controlled laboratory conditions, it was decided to test them in the
field at a nearby construction project.
Two gages were attached to a sheet piling :in the· field and
driven 20' into a loose, silty sand having a high groundwater table.
Both gages were protected by the epoxy covering. One gage was given
additional protection by covering it with a ste~l shoe (Fig. 3) that was
welded to the sheet pile (Fig. 4). During and after driving, both gages
performed satisfactorily, thereby substantiating the results of the la
boratory' evaluation.
The field testing of the foil-type strain gage showed that the
gage could successfully withstand pile driving forces and the existence
of a high groundwater table. It was decided to protect all gages with
the steel shoe in order to offer prbtection agai~st ~tones that
might be encountered at the test site.
The strain gages were installed on the sheet piling at Fritz
Laboratory prior to delivering the piling to the test site. The piles
were cleaned with high speed grinders to obtain a smooth surface for the
gages. The ribbon wire was laid flat and clamped before the gage epoxy
was applied. After the wires were in place, the gages were attached and

-5
clamped while the epoxy was setting. Each gage was checked after in
stallation to insure adhesion of the gage to the piling. This was accom
plished by a "light bulb test" (D.al1y and 'Riley, 1965).
Because of the delicate nature of foil gages, it was necessary
to use low temperature solder to install the wires. Terminal tabs were
used to allow some play in the wires should they be accidentally pulled.
After the wires were installed, gage readings were taken and the p~otective
epoxy covering was applied (Fig. 4).
The strain gages were connected to the 'arch -piles near the in
terlocks in order to evaluate the shear transfer across the joints. This
information would, in turn, lead to the determination of the location of
the neutral axis of bending for the sheet pile wall. The layout of the
strain gages on the instrumented piling (piling nos. 10, 11, 12, and 13)
is shown in Figs. 6 and 10.
After the gages were installed on the piling, they were "zeroed"
at Fritz Laboratoty with the piling hanging in a vertical position. The
initial readings recorded in the laboratory were checked at random at the
site before driving was started on each pile. The comparison between the
-random checks and the laboratory reading was satisfactory.
Field Test Procedure
The length of the sheet pile wall was 30 feet which was believed.
to be '~ong enough to minimize undesirable end effects. The piling was 30
feet long and they were driven 25 feet below ground level. Consequently,

--6
once the arch piles ~vere in place, approxima~ely 5 feet of pile protruded
from the ground surface. A standard driving rig with a low energy double
action 9B3 steam hammer was used for the driving operations. A guide~
frame was used to insure plumbness of the wall. A transit and a six-foot
level were used to aid in positioning the piles. The wall was anchored
by two tie rods which were held back by H-piles driven vertically 20 feet
into the ground. The tie rods were attached to the wall by means of a
wale welded to the wall at ground level. The wale and tie rods were 10-"
cated at ground level to facilitate. instrumentation :and test .. procedures..
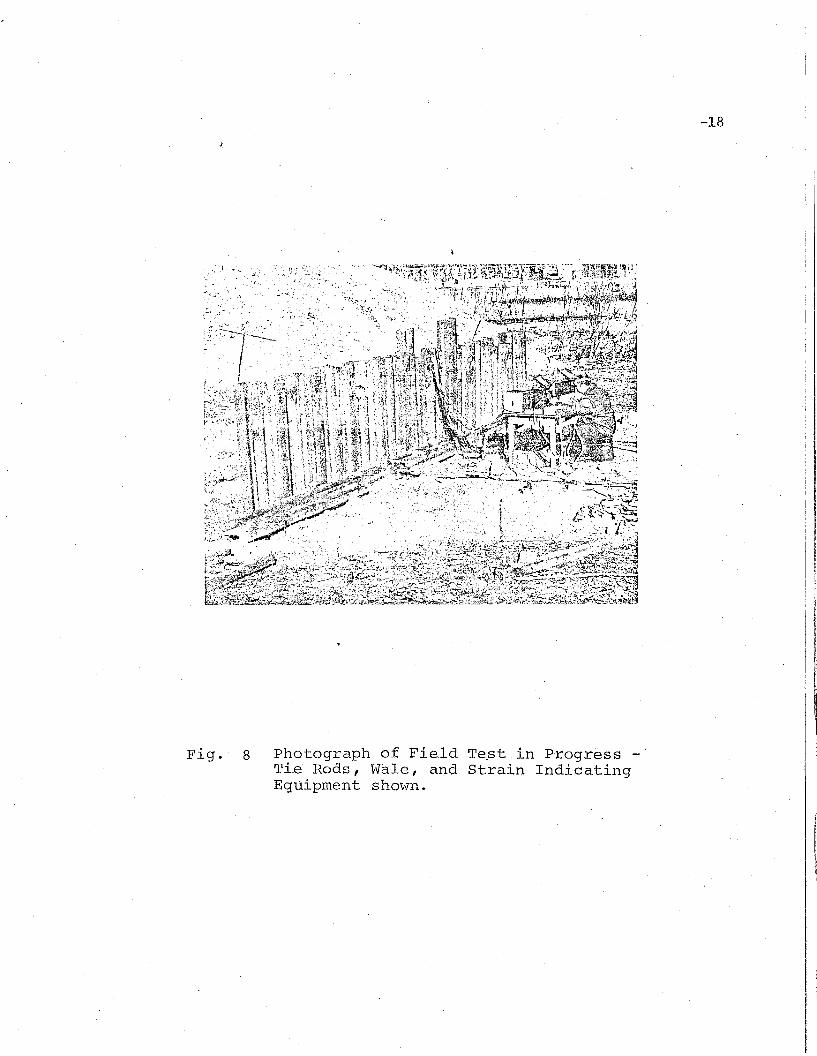
The entire test set-up is illustrated in Figs. 5, 6,.'~7 sand 8.
For all piling, the measured out-of-plumbness during the driving
never exceeded 1 in. in 30 feet in the X-Y plane (Fig. 5). The deviation
from the vertical in the Y-Z plane, however, did increase as the wall was
driven (Fig. 6). This attributed to the tendency 'of sheet piling to close
on themselves during drivJng. The maximum deviation in the Y-Z plane was
5 in. in 30 feet. It should be noted that piles No. 10 and No. 13 met
refusal and could not be driven to the required depth. For this reason
they protrude 15 in. above the other piles (Figs. 6 and 8).
The soil was excavated in front of the wall in four stages.
Each excavation was 5 feet deep as shown in Figs. 5 and 6. The readings
were taken, on all strain gages after the excavation and again one week
later, just prior to the next excavation sequence. Excavation time for·
each stage was one day. This sequence of events was repeated until the
excavation reached the 20 ft. level. The plan view excavation was approx-
imately 20' x 35' as shown in Figs. 7 and 9. In addition, wall deflections

-7
(measured by transit) were recorded for several wall locations. An
initial load of 2000 Ibs. was applied to each of the tie rods. De
tailed field data is summarized and given by Brewer and Fang (1968).
DISCUSSION OF RESULTS
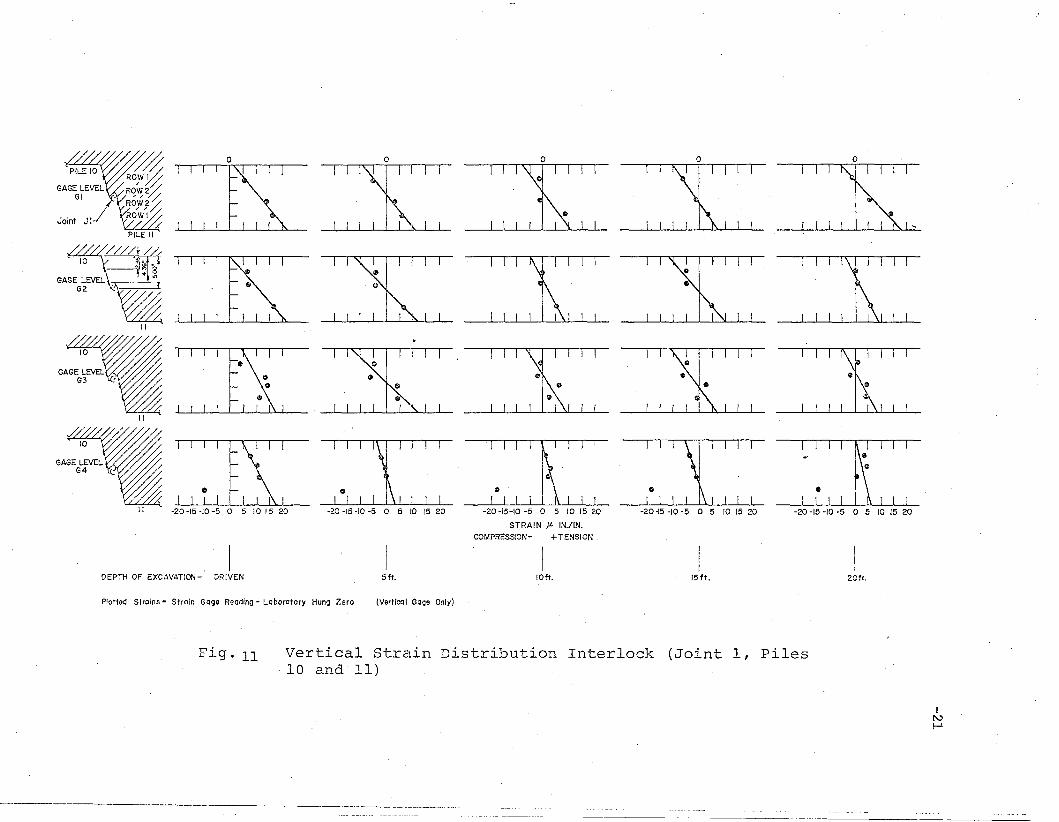
Figure 11 shows the pertinent date for shear transfer in
graphical form. The distribution of vertical strain across the sheet
pile interlocks is shown for all gage levels, and at all stages of ex
cavation.
Although there is considerable scatter in the data and a num-·
ber of the gages failed completely (see Fig. 10), the graphs suggest that
shear stress transfer across the interlocks between piles does occur. This
is apparent because the vertical strain distribution across the interlocks
may be reasonably approximated by a single continuous straight line atall stages of ~xcavation at which there is sufficient data.· If there was
only partial or no shear stress transfer across the interlocks, the ver
tical strain distribution across the piles would be shown by two discon
tinuous straight lines.
Figure '11 shows the vertical strain distribution interlock of
joint 1, piles 10 and 11. Other data on piles 11, 12, and 13 are given
by Brewer and Fang (1968, 1970).
It is pf interest to note from Fig. 11 that the location of
the neutral axis of bending for the sheet pile wall, given by the inter-

-8
section of the vertical strain curve with the line of zero strain, does
not 'al~ays lie within the pile cross-section. For discussion purposes,
consider the behavior of piling Nos. 10 and 11 at gage level Gl (Fig. 11).t
It can be seen that just prior to excavation, the neutral axis lies com-
pletely outside the piling cross-section toward the fill side of the wall.
This could indicate that the piling is in tension' due· to bend~ng induced
during driving, and the compressive bending stresses are carried by the
soil behind the piles. Such b,ehavior may be considered comp~site action,
with the wall and-the soil, acting as a unit, however, there is no further
substantiation of this.
Comparisons of tie rod forces versus wall height is shown in
Fig. 12. There is a trend that tie rod force increases as wall height
increases. However, the field results are much smaller than the theoret~
ical results and are less sensitive. This may be the result of the soil
strain conditions. It should be noted that the walls of the excavation.did not have to be shored to stand vertically for the full depth of the
excavation.
Comparison of the positive maximum bending moment is, carried ,out
in a graphical form in Figs. 13 and 14. Bending moment computations are
based on strain records. Sheet piles are considered as single acting units.
Numerical values of strain were obtained from reading of strain gages which
were located near interlocks. It is shown that there is no definite relation
between theoretical and experimental results. Possibly, much of the scatter
was attributable to composite action between soil and piling.

-9
Other comparisons include theoretical comparisons of tie rod
forces, embedment depth, and maximum moment with various existing methods
and internal friction angles are given by Lamboj and Fang (1970) togethert
with computation procedures.
SUMMARY AND CONCLUSIONS
The analysis of field study of an anchored sheet piling bulk-
head can be summarized as follows and conclusions presented considered
applicable within the limitations of the assumptions used:
1. Strain gage instrumentation installed on sheet piling prior
to driving may be successfully protected against damage during driving.
2. Within the range of applied loads and soil conditions en-
countered in this investigation, the available data suggests that shear
transfer takes place across the interlocks of arch web steel sheet piles.
3. Due to scatter in moment values evaluated from field measure-
menta it is believed that composite action between soil and the piling
occurs, however) further investigation of the soil-structure' interaction
is necessary in order to more clearly understand this phenomenon.
ACKNOWLEDGEMENTS
This paper is a part of the general investigation on the
tlBehavior of Soil-Pile Systems" currently being carried out at Fritz
Engineering Laboratory, Lehigh University. The investigation is sponsored
and financed by the American Iron and Steel Institute

-10
The authors express their thanks to Mr. R. J. Carle; Beth
lehem Steel Corporation and Mr. H. A. Lindahl, U. S. Steel Corporation
for their assisatnce in every phase of the investigation.
Thanks are also extended to Mr. C. Ee Brewer who conducted
the field test and Dr. T. J. Hirst who reviewed the manuscript.

-11
. N.A.
li.!~_._
U. S. PRACTICE
EUROPEAN PRACTICE
N.A.
I
Fig. 1 Location of Neutral Axis (U.-8. and European ,Practibe)

-Elev.235 i-Etev.235''<//1''"../j Y///',
---225 t225'
GWT v ~\\\\1--" 2]5' GWT v 2151
---"205' - 205 1
i95' 1951
185' ISS'
175' 175'J70 1
170'I-P~ 300' I-N
Section A-A .....: I
Plan View of Boring Locations
'Legend
~ Silt.a Sand
~ Sand, Gravel~a Boulders
I Soft Lime Stone
~~ Sand a Gravei
IBLimestone a- - t Soft Limestone
-Elev.235t
--225'
" 2151
--2051
112Section c-c
GV/T v
tIlj
J-N
~ of Bulkhead
1-0
cr>8
I
',r-Q
,A:=I
f II c ,Al41-P ~'#2
L--s
Data for Holes #l-N, '-0" ~-p, J.. Q Supplied by the
Pennsylvania Povler and laight Co.
Fig. 2 Soil Profiles and Location Diagrami
}-JN

Fig. 3 Steel Protective Shoe

Fig. 4 A Steel Sheet Pile being Equippedwith strain Rosettes
-14

Surface Temp.Gage
H Pile201
Long~
-0C\J
Anchored Weier
30·
Lx
Sheet Piling Wall~JII~rain· Gage ~Loading DevicesDatum
StrainRosettes
Soil Profile Determined During. Excavation
Coarse Sand a Boulders
Coarse SandSand a SiltCoarse Sand
Sand a Silt
""",,,,\).
.. " ,.o .. ,: 0 '
, '" ..~~~~m~~~l
5
25
& ... \) ".:.-
o ... -... ; : tl· 0··.. '\).
~'.>~~J--=-=- Ground Water Table \!ll...~ ..
:;::?'-·0"......... 0
LU··: .... ,·, ~ 10 • 0 .
30 · : ~::
,...:;:0...CD
°20
.....(1)
If 15
~~=:;:==:::::~=b£======-; 11vJt,'fir~;;~w'lj=i-"/TiiII~q,'litl~=/,W'j1Elev. 235 ~ ~ --l
Ground Surface~ r "i"'/lI,;.m"IJ/::>/II"I/i f tTie Rod~ AnchorageDrs" <'i 1?" I.""" ."" -" ",,, ""'" "" ",'-
" ",,, "" "'" ", ",,, "IOr-R>;\~·~.:7Ji
})Hf.~::~
Fig. 5 Cross-Section of Sheet Pile Wall If-1Vi
•.~~~:~~~~~ ---- ~dllit1K£:....:_ Qt:::t.::::e::&:f.>QZ~i.~::..:..:..:..;;~~_.;.~~~.'::...-

\.
-16
Excavation.
I
GroundSurface7Elev. / 235 t
- - //I;:;tll/;;,! ;E:.l1/G II~
oDODD
o
4/=10 ifF II :il:12 ~i=13
Wales
I» 23 PDA27 , Arch Web Sheet Piling, Nominal Width 16" Each
4 Sheets With
I Gages I Anch Vveb Sheet--.J~-I~-\.-J--3-- ,Piling 301 L<?ng
J"2
lO
10-
0 0DO 00
-00+
0 0-- - DO DO
0 0 -C\J
00 00-r<)
J-I J-2 J-3
o Locations Of Strain Rosettes (2 rosettes at each location)
Fig. 6 Front of Sheet Pile Wall Showing Location of StrainGages

-17
30·1~-----{---------1--------~
Loading Devices
(-rLlrnbucl{les)
---Left Tie Rod
~ Right Tie Rod
H- Piles
Fig. 7 Plan View of Sheet pile Wall
-18
Fig. 8 Photograph of,'- Field -Te.st . in P'rogressTL~ Rods, W~~e, ~and Strain IndicatingEquipment shown.

-19
· Fig. 9 Photogra~h of Excavation at the 10' Level

Wale
Ground ~Level
Level Gr
Level G2 -
Level G3
Level G4
~··T----l I --
I I-- --~- -~-------- -- --- .--. --........ .......... - ......-.-. ...... -...--.---..
~-~- --j- C\J N - to "~ C\l - to ~
:t ~ ~ ~ 3: 3: ~ :: 3: ~~ ~
0 0 0 0 0 0 0 0~
a 0a:: 0:: n:: 0:: 0::: 0: 0:: a:: 0: cr:
1971 ~4 34 19 43 48 24 f9 43 4B 24 1971 I' /1 f' ?I l' "?1 f' -(1 l\
20 2f 22 23 2322 2( 20 4445 46 47 2322 21 20 4445 46 47 23 22 21 20
13 18 18 13 . 37 42 18 13 37 42 f8 1371 1'\ 74 f' 71 f' C\J ~ t' Jt; 1" 7j f'
14 15 lSl7 - i7'6 15 14 3839 4041 17 16 15 14 38 5940 41 oro 17 16 15 14-:> -:> -,
.... ~ l-
I z ~ z6 0 0J ? ~
~ ~~
7"/1 12 12 ~7 31 36 12 7 31 36 12 7K 7i ?1 f' ~ ~8 ?I K Jl7f ~
8 9 10 'f 11 10 9 8 3233 34 35 II 10 9 32 33 34 35 "10 9 8
17} 1"6 6 f'1 25 30 6 I 125 30 6 15'7I ?l f' 5'1 f\\2 ~ ft 71 f22 :5 4 5 4 3 2 26 27 28 29 4 3 ~6 27 28 29 5 4
LC)
\0
to
Col
(\J
f'()
I
o.1oJ"{)
'''F~
Pile #'0
0:,"~~
Pile if/: I"'
~~~~
~~~~~
Fig ~ 10
"-=-"~
~"*~
Pile #12"
~~"J--
T..tocaticl1 (yf Strain Gages
4-~~
• Denotes Gages ThatFailed To Balance
Pile *13
~~
,~"*'
I~o
oo--n-
oo
PILE II
~~.10 \~~l~rGAGEG~f)JEL~
II
-20 ·15 -10·5 a 5 10 15 20-20·15 ·10 .. 5 0 5 10 15 20-20 ·15-10 -5 0 5 10 15 20
STRA IN JL IN.lIN.
COMPRESS10N- +TENSION
I I I
I I I
'" I I
-20 -15 ·10 -5 a 5 10 15 20-20-15 -10-5 0 5 10 15 20I
II
GAGE LEVELG4
DEPTH OF EXCAVATfCN- DRIVEN 5 ft. 10ft. 15ft. ZQft.
Pl-otted Strains - Strain Gagli! Reading - Laboratory Hung Zero (Vertical -Gage Only)
Fj.g. 11 Vertical Strain Distribution Interlock (Joint 1, Piles. 10 and 11)
IN~

,........
t. ~1II3eo
+->4-i
~.'3
110pcf'-'" ym~
E-t .1' ~~
J::~"'O<IJCJ T .- 2.H '(K/FT.)
4,... '.J..."i §:"
0 <.¢'~
~
'"d0~
OJ ~d Mea.u",menl'"rt :c...¢- __ ---o-----o
E-1
0 1O 20
H (FT.l
Wall Height above Dredge Line, H. ft.
-22
Fig. 12 Comparisons of Tie Rod Force for ~ = 38°

-20
40
- 23
~--_. Free Earth50 --- ----- Rowe's Method
.--. --:... - Anderson's Method------ -.-a Blum's Method·•. ~ ..•.......... Tschebotarioffls Method
~ Field Measurement.s
30
-10
i~ comparison of Theoretical Moment Curves withField Measurements for a wall 20 ft. high
Fig.
M( KIP-FI)

••
•
-24
Free EarthRowe's Method
Anderson's MethodBlum's MethodTschebotarioff's MethodField Measurements
....... ......
10
-to
-20
Figo '14 Comp~rison' of Theoreti9al Moment Curves withField Measurements for a' wall ·15 ft. high
M(~< IP-FT:) Ol;,·~--0---------'"1b---/-+-J-15---
2.....a-10--;;liiir.....
.,;';:r/' H (FT.)
{o
I

REFERENCES
Anderson, P. (1965). Substructure Analysis and Design, RonaldPress Company, New York.
Blum, H. (1931). Einspannungsverhaltnisse Bei Bohlwerken, WilhelmErnst and Sohn, Berlin.
Brewer, C. E. and H. Y. Fang (1968). Field Study of Shear Transferin Steel Sheet Pile Bulkhead, Fritz Engineering LaboratoryReport No. 342.2, Lehigh University.
Dally, J. W. and W. F. Riley (1965). Experimental Stress Analysis,McGra"tv Hill, p. 406.
Fang, H. Y. and C. E. Brewer (1968). Field Study of Sheet-PileBulkhead, ASCE Annual Meeting on Structural Engineering,Pittsburgh, Pennsylvania, September.
Fang, H. Y. and T. D. Dismuke (1973). Bibliography on Steel SheetPile Structures, Envo Publishing Co.
Lamboj, L. and H. Y. Fang (1970). Comparison of Ma~imum Moment,Tie Rod Force and Embedment Depth of Anchored Sheet Pile,Fritz Engineering Laboratory Report No. 365.1, Lehigh University.
Rowe, P. W. (1952). Anchored Sheet Pile Walls, Proe. Institutionof Civil Engineers, Vol. 1, No~ 1, London, January, pp. 27-70.
Tschebotarioff, G. P. (1951). Soil Mechanics, Foundations andEarth Structures, McGraw-Hill Book Company, N. Y. Chapters10 and 16.
-25