field office performance - social security administration ssa unified measurement system/managerial...
TRANSCRIPT

Audit Report
A-15-12-11290 | November 2013
Field Office Performance

MEMORANDUM
Date: November 8, 2013 Refer To:
To: The Commissioner
From: Inspector General
Subject: Field Office Performance (A-15-12-11290)
The attached final report presents the results of our audit. Our objective was to report on Social Security Administration field office performance for certain key workloads.
If you wish to discuss the final report, please call me or have your staff contact Steven L. Schaeffer, Assistant Inspector General for Audit, at (410) 965-9700.
Patrick P. O’Carroll, Jr.
Attachment

Field Office Performance A-15-12-11290
November 2013 Office of Audit Report Summary
Objective
To report on Social Security Administration (SSA) field office (FO) performance for certain key workloads.
Background
SSA FOs are the primary points of contact for in-person interaction with the public. SSA’s FO organizational structure comprises 10 regional offices, 6 processing centers, and approximately 1,260 FOs.
To assess SSA’s workload data reliability, we reviewed several data sources. Our review revealed several concerns related to the completeness, accuracy, and consistency of data obtained. We also noted that FO staff, supervisors, and managers had numerous workload reports available to monitor FO workloads. For our review, we were not able to determine which sources provided accurate and complete workload data. At the request of SSA management, we analyzed FO performance using the following sources: (1) District Office Workload Report, (2) Management Information (MI) Central Processing Time Reports, and (3) MI Central Customer Service Record Reports.
After discussions with SSA management, we chose the following workloads for review: (1) title II Old-Age and Survivors Insurance claims, (2) title II Disability Insurance claims, (3) title XVI Supplemental Security Income Disabled/Blind claims, (4) title II and XVI Status Changes and Benefit Verifications, and (5) Enumerations.
Our Findings
This report assesses workload data reliability and identifies instances of possible outlying performance within the Office of Operations’ FO structure. Given our findings, the Agency should examine these anomalies and implement corrective actions, where appropriate. This report focuses on five key workloads, processing times, visitor counts, and wait times. There are additional factors, beyond the numerical statistics we analyzed, that may provide a more comprehensive assessment of FO performance. The findings outlined in this report could help SSA identify performance trends and training needs as well as best practices that may be helpful nationwide.
During our analysis of FO performance on specific workloads, we noted that, in general, higher performing FOs cleared more claims and other services—in total and on a per-employee basis. Higher performing FOs also generally had larger volumes of visitors without appointments, but these customers had longer wait times than customers at lower performing FOs. Further, higher performing FOs had larger staff sizes than lower performing FOs.
SSA representatives stated that regional and area offices monitored individual FO performance through personal contact with office managers and the significant MI collected. Office of Operations executives stated that they monitored FO performance at a high level, rather than at an individual office level. We believe national level monitoring would assist the Agency with its increasing workloads and decreasing workforce.
Our Recommendations
1. Identify the most accurate, complete, and reliable data source(s) for Agency workload count and processing time data, and ensure that all Agency components are using the same source(s) for reporting purposes.
2. Develop a methodology for measuring and monitoring nation-wide FO performance to ensure accurate, consistent, and timely customer service.
SSA agreed with our recommendations.
Field Office Performance (A-15-12-11290)
TABLE OF CONTENTS Objective ..........................................................................................................................................1
Background ......................................................................................................................................1
FO Responsibilities ....................................................................................................................1
SSA Organizational Structure ....................................................................................................1
Data Reliability ..........................................................................................................................2
Measuring FO Performance .......................................................................................................3
Results of Review ............................................................................................................................5
Average Number of Employees to Workload Volume ..............................................................5
Comparison of FO Employees Versus Workload Cleared ........................................................6
Analysis of 1,177 FO Population ...............................................................................................8
Analysis of 32 FO Population ..................................................................................................10
Conclusions ....................................................................................................................................12
Recommendations ..........................................................................................................................14
Agency Comments .........................................................................................................................15
Appendix A – Social Security Administration Organizational Chart ........................................ A-1
Appendix B – Data Reliability ................................................................................................... B-1
Appendix C – Management Monitoring Reports ....................................................................... C-1
Appendix D – Scope and Methodology ..................................................................................... D-1
Appendix E – Field Office Analysis .......................................................................................... E-1
Appendix F – Agency Comments ............................................................................................... F-1
Appendix G – Major Contributors.............................................................................................. G-1

Field Office Performance (A-15-12-11290)
ABBREVIATIONS APP Annual Performance Plan
CDR Continuing Disability Review
D/B Disabled/Blind
DDS Disability Determination Services
DI Disability Insurance
DIB Disability Insurance Benefit
DOWR District Office Workload Report
DOWS District Office Work Sampling
FO Field Office
FY Fiscal Year
GAO Government Accountability Office
LI Limited Issue
MI Management Information
OASDI Old-Age, Survivors and Disability Insurance
OASI Old-Age and Survivors Insurance
ODCO Office of the Deputy Commissioner, Operations
ODS Operational Data Store
OES Office of Electronic Services
OIG Office of the Inspector General
OPSOS Office of Public Service and Operations Support
ORC Office of the Regional Commissioner
PAR Performance and Accountability Report
RIB Retirement Insurance Benefit
RO Regional Office
RS Resident Station RSHI Retirement, Survivors, and Health Insurance
RZ Redetermination
SSA Social Security Administration
SSI Supplemental Security Income
SUMS/MCAS SSA Unified Measurement System/Managerial Cost Accounting System

Field Office Performance (A-15-12-11290) 1
OBJECTIVE Our objective was to report on Social Security Administration (SSA) field office (FO) performance for certain key workloads.
BACKGROUND In Fiscal Year (FY) 2012, SSA provided approximately $810 billion in benefit payments to over 61 million Social Security and Supplemental Security Income (SSI) recipients. SSA FOs are the primary points of contact for in-person interaction with the public.
SSA’s FO organizational structure comprises 10 regional offices, 6 processing centers, and approximately 1,260 FOs. FOs range in size from large urban offices with 50 or more employees to very small offices in remote areas called resident stations (RS). FOs also offer services to the public through 57 contact stations. These stations provide limited functions and are staffed with one SSA FO employee who travels once a month to certain locations, such as a hospital, to provide service to customers who lack transportation or telephone access. As of September 2012, there were approximately 28,000 FO employees in the United States, Puerto Rico, American Samoa, Guam, the Northern Mariana Islands, and the U.S. Virgin Islands.
FO Responsibilities
In FY 2012, SSA assisted about 45 million visitors. FO workloads include1
· taking applications2 and updating records for Social Security numbers,
· taking applications and determining eligibility (nonmedical only) for Old-Age, Survivors and Disability Insurance (OASDI) and SSI benefit payments, and
· conducting continuing nonmedical eligibility reviews to ensure payment accuracy.3
SSA Organizational Structure
FO Operations Supervisors, Assistant District Managers, and District Managers plan, organize, direct, and control the operating procedures related to the workloads listed above.
All FOs report to an Area Director, who plans, directs, and coordinates the FOs’ activities and ensures FO District Managers are carrying out their assigned responsibilities fully and effectively. In response to an initial draft report, SSA stated,
1 The source for the types of work conducted by SSA FOs was a Government Accountability Office report, Social Security Administration Field Offices (GAO-08-737T), May 2008, p. 5. 2 SSA refers to these applications as its enumeration workload. 3 SSA refers to these reviews as its continuing disability review (CDR) and redetermination (RZ) workloads.

Field Office Performance (A-15-12-11290) 2
On a daily basis, the [Area Director] monitors FO performance using a variety of [Management Information] reports that help identify performance outliers. With this information, the Area Director discusses the outlier with the District Manager to determine if an office is addressing the performance with its own resources, or if the office needs assistance. In recent years, due to staffing imbalances, Area Directors commonly move work to where resources can meet the demand.
Area Directors provide executive leadership and guidance to District Managers by facilitating the establishment of long-range operating plans, schedules, and goals and emphasizing the attainment of regional workload goals.
Each Area Director is a member of the Office of the Regional Commissioner’s (ORC) executive staff and a key official in the Office of the Deputy Commissioner, Operations (ODCO). Ten ORCs provide regional program leadership and technical direction for the OASDI and SSI programs. Each ORC maintains a broad overview of administrative operations.
ODCO provides general supervision to its major components, including the ORCs. In addition, ODCO is directly responsible to the Commissioner of SSA for carrying out the ODCO mission, including (1) processing operations workloads effectively, efficiently, and accurately; (2) implementing improvements to the disability program; and (3) effectively stewarding programs and resources.
The Office of Public Service and Operations Support (OPSOS), a component within ODCO, provides broad operations support to FOs. OPSOS directs and coordinates internal management support functions to ensure effective position management, workforce utilization, and management analysis and planning. For an organizational chart of these offices, please refer to Appendix A.
SSA uses workload information from the FOs and other operational components to prepare a number of reports viewed by Congress and the public, including its Annual Performance Plan (APP) and Performance and Accountability Report (PAR), as well as information reported on data.gov,4 an official Website of the U.S. Government.
Data Reliability
To assess SSA’s workload data reliability, we reviewed several data sources, including (1) the number of SSA FOs, (2) Management Information (MI) workload counts and processing times, and (3) workload counts and processing times observed during visits to 14 FOs. Our review revealed several concerns related to the completeness, accuracy, and consistency of data obtained. For example, we noted
· several offices were incorrectly categorized as FOs,
4 https://explore.data.gov.

Field Office Performance (A-15-12-11290) 3
· several offices that were identified as closed before the beginning of FY 2011 had District Office Workload (DOWR) counts and other MI data as of the end of FY 2011, and
· workloads and employees were inconsistently tracked at resident stations.
For a comprehensive discussion of data reliability issues noted during our review, refer to Appendix B. In addition, we noted that FO staff, supervisors, and managers had numerous workload reports available to monitor FO workloads. According to SSA, “It is these reports that an Area Director uses to assess outliers as discussed above.” We provide an example of the names of approximately 100 reports available to management from 1 of the regional offices (RO) we visited in Appendix C. Because of the large number of reports available, we were unable to determine which report(s) provided the most complete and accurate data to analyze FO performance. We discussed data reliability issues with SSA managers. In response, Office of Operations executives stated the Agency was “. . . currently developing a standardized, national management information report to track established Public Service Indicators (PSIs) to ensure consistency and eliminate duplication of efforts.” In addition, these executives stated they were “. . . devising an integrated methodology to help management officials at the local, area, regional, and national levels identify and address performance anomalies, trends, and training needs. This approach will enable SSA’s regional executives to measure and monitor field office, area, and regional level performance of non-PSI workloads consistently nationwide.”
For our review, we were not able to determine which sources provided accurate and complete workload data. At the request of SSA management, we analyzed FO performance using the following sources: (1) DOWR, (2) MI Central Processing Time Reports, and (3) MI Central Customer Service Record Reports.
Measuring FO Performance
After discussions with SSA management and based on FY 2011 cleared workload counts, we chose the following workloads for review
1. Title II Old-Age and Survivors Insurance (OASI) claims,
2. Title II Disability Insurance (DI) claims,
3. Title XVI SSI Disabled/Blind (D/B) claims,
4. Title II and XVI Status Changes and Benefit Verifications, and
5. Enumerations.5
5 The three workloads—Status Changes, Benefit Verifications, and Enumerations—will be referred to as other services from here forward.

Field Office Performance (A-15-12-11290) 4
We chose to review these workloads because they represented approximately 76 percent of all cleared workloads in FY 2011. In addition, we examined workload processing times, the number of visitors at each FO, and the average wait time for visitors with(out) appointments. There were also a number of workloads, as well as other factors—including, but not limited to, composition of FO staff, workload sharing, workload accuracy and quality, and customer service—that we did not consider in our methodology for reporting FO performance. See Appendix D for further discussion.
Our initial review of the data determined there were 1,209 FOs during our review period. We determined that 32 FOs had low enumeration workloads because of their proximity to a card center. Since card centers assist these 32 FOs, we reviewed them separately. We based our final FO analysis on 2 populations: the 32 FOs that were aided with their enumeration workloads because of their proximity to a card center6 and the remaining 1,177 open FOs in the 50 United States (and Washington, D.C.).7
For each of the workloads described above, we measured the (1) volume of the workload at each FO compared to the volume in each population and (2) productivity of FO staff by computing the claim/service per average employee. For the processing and visitor wait times, we also used the time factor8 in our determination of an FO’s numerical score. We issued each FO a numerical score (for example, 1 represents the highest performing FO and 1,177 represents the lowest performing FO) based on the results of our volume, productivity, and processing time/wait time factors. For a complete discussion of our methodology as well as descriptions and sources of other information we obtained for each FO, refer to Appendix D.
We provided an initial draft report to SSA management for review. SSA provided the following comment:
. . . the relative lack of hiring authority over the past three years in the face of mounting attrition has created a number of challenges in meeting public service demands. These demands seem to be escalating at the very time that resources are diminishing without much hope for replacement hires on the horizon. For that reason offices and regions have had to be resourceful in looking beyond the traditional field office service areas to marshal resources. Through virtualization and centralization of the work we are filling in the gaps the loss of personnel has created. Since losses are uneven between offices, where even the viability of an office has been challenged, this approach is what has kept our heads above water in these very challenging time[s] . . . .
6 These FOs were in the (1) New York, (2) Atlanta, (3) Chicago, and (4) San Francisco Regions. 7 For a complete description of how we selected our populations, including which FOs we excluded, refer to Appendix D. 8 Factors of time were in minutes, days, and percentages.

Field Office Performance (A-15-12-11290) 5
RESULTS OF REVIEW This report assesses workload data reliability and identifies instances of possible outlying performance in the Office of Operations’ FO structure. Given our findings, the Agency should examine these anomalies and implement corrective actions, where appropriate. This report focuses on five key workloads, processing times, visitor counts, and wait times. There are additional factors, beyond the numerical statistics we analyzed, that may provide a more comprehensive assessment of FO performance. The findings outlined in this report could help SSA identify performance trends and training needs as well as best practices which may be helpful nationwide.
During our analysis of FO performance on specific workloads, we noted that higher performing FOs generally cleared more claims and other services—in total and on a per-employee basis. Higher performing FOs also generally had larger volumes of visitors without appointments, but these customers had longer wait times than customers at lower performing FOs. Further, higher performing FOs had larger staff sizes than lower performing FOs.
SSA representatives stated that regional and area offices monitor individual FO performance through personal contact with office managers and the significant management information collected. Office of Operations executives stated that they monitor FO performance at a high level, rather than at an individual office level. We believe national-level monitoring would assist the Agency with its increasing workloads and decreasing workforce. For example, through the Agency’s increasing capacity to shift workloads between offices, monitoring at a national level could better permit offices within a region to assist stressed offices in other regions. Accordingly, we encourage the Agency to consider developing a more extensive nationwide monitoring system. After our review, SSA provided the following comment to our draft report, “Operations executives indicated that managers, area directors, and regional office staff share best practices . . . on a regular basis at the local, area, and inter/intra-regional levels. Through this process, they foster communication and collaboration, promote better customer service, and maximize their limited resources.”
Average Number of Employees to Workload Volume
SSA FO service areas vary in size and demographic characteristics. For example, FOs in some service areas may receive more title XVI SSI claims than title II DI claims. Using DOWR workload count data, we determined the average claims/services per average employee in FY 2011. As shown in the ranges below, the average number of claims/services per average employee varied greatly by FO.

Field Office Performance (A-15-12-11290) 6
Table 1: Range of Average Claims/Services per Average Employee in FY 2011
Title II OASI Cleared Claims
Title II DI Cleared Claims
Title XVI SSI D/B Cleared
Claims
Title II and XVI Status
Changes and Benefit
Verifications Cleared
Enumerations Cleared
1,177 FO Population 30.52 - 347.60 40.85 - 278.74 26.17 - 233.03
460.63 - 6,417.73
113.29 - 1,210.43
32 FO Population 46.49 - 258.81 73.79 - 164.23 46.21 - 147.11
725.73 - 2,770.04 N/A
We also requested information on the average time9 to complete each of the tasks noted above. SSA provided the following information.
· Title II OASI: 84 minutes
· Title II DI: 125 minutes
· Title XVI SSI D/B: 85 minutes
· Title II and title XVI Status Changes and Benefit Verifications o Title II Status Changes: 4 minutes
o Title XVI Status Changes: 7 minutes
o Benefit Verifications: 3 minutes
· Enumerations (original/replacement Social Security Numbers): 15 minutes
Comparison of FO Employees Versus Workload Cleared
In addition, we observed that a larger number of employees in an FO may not always equate to higher clearance rates. Table 2 provides two examples where the claims/other services cleared were similar for two offices, but the number of FO staff was different.
9 SSA provided us the average time to complete the workloads discussed in this report for informational purposes only. We did not consider these times in our methodology for analyzing FO performance, as discussed on pp. 8 through 13 and Appendix D.

Field Office Performance (A-15-12-11290) 7
Table 2: Comparison of Employees Versus Claims/Services Cleared FY 2011
Average FO
Employees 2010 to
2011
FO Staff Average Years of Service
FY 2011
Title II OASI
Cleared Claims
Title II DI
Cleared Claims
Title XVI
SSI D/B Cleared Claims
Title II and XVI Status
Changes and Benefit
Verifications Cleared
Enumerations Cleared
Example 1 FO 1 22 14 1,204 1,860 2,126 25,249 18,186 FO 2 13 16 1,495 1,642 1,517 39,354 4,427 Differences10 9 (2) (291) 218 609 (14,105) 13,759
Example 2 FO 3 35 15 4,270 3,278 2,392 58,696 13,793 FO 4 26 22 3,818 3,463 2,585 59,783 12,748 Differences11 9 (7) 452 (185) (193) (1,087) 1,045
In the two examples above, the FOs cleared relatively the same number of claims and other services; however, one FO in each example had nine more employees than the other FO. We also noted in these examples that FOs with higher staff levels had fewer average years of service.
Table 3 provides two examples where the numbers of FO staff were similar, but the number of claims/other services cleared was different.
10 A positive amount represents the first FO listed as having more employees, claims and/or services than the second FO listed, while a negative amount represents the second FO having more claims and/or services than the first FO. 11 Id.

Field Office Performance (A-15-12-11290) 8
Table 3: Comparison of Employees Versus Claims/Services Cleared FY 2011
Average FO
Employees 2010 to
2011
FO Staff Average Years of Service
FY 2011
Title II OASI
Cleared Claims
Title II DI
Cleared Claims
Title XVI
SSI D/B Cleared Claims
Title II and XVI Status
Changes and Benefit
Verifications Cleared
Enumerations Cleared
Example 1 FO 5 49 16 7,097 5,384 3,414 108,121 7,819 FO 6 49 12 2,167 3,028 3,410 84,574 9,751 Differences12 -0- 4 4,930 2,356 4 23,547 (1,932)
Example 2 FO 7 55 10 9,276 6,300 4,297 261,523 28,328 FO 8 56 14 6,924 2,977 3,443 92,650 42,198 Differences13 (1) (4) 2,352 3,323 854 168,873 (13,870)
In the two examples above, the FOs had relatively the same number of employees; however, the number of claims and other services cleared varied greatly from one FO to the other.
Analysis of 1,177 FO Population
Based on the results of our methodology,14 we determined the highest and lowest 10 performing FOs in our population of 1,177 FOs. Refer to Table E–1 and Table E–2 in Appendix E, which display workload, processing time, visitor counts, wait times, and demographic information for each of the FOs in the highest and lowest 10 of our 1,177 FO population.
In addition to analyzing the average performance of the highest and lowest 10 FOs, we separated the 1,177 FO population into the following tiers.
1. Tier 1 – FOs in the top half of the population for all 3 data sources,15 which resulted in 300 FOs;
2. Tier 3 – FOs in the bottom half of the population for all 3 data sources, which resulted in 297 FOs; and
3. Tier 2 – the remaining 580 FOs.
12 Id. 13 Id. 14 Refer to Appendix D. 15 As previously stated, the three data sources were (1) DOWR, (2) MI Central Processing Time Reports, and (3) MI Central CSR Reports.

Field Office Performance (A-15-12-11290) 9
Table E–3 in Appendix E displays the average workloads, processing times, visitor counts, wait times, and demographic information for each of the tiers.
Table 4 presents our analysis of the 1,177 FO population’s highest 10 versus lowest 10 performing FOs, as well as the Top Tier versus the Bottom Tier.
Table 4: Analysis of 1,177 FO Population
Top 10 Versus Bottom 10 Top Tier Versus Bottom Tier
Location and Size
All top 10 performing FOs were Level 116 offices in 3 regions, while 9 of the bottom 10 performing FOs were Level 2 offices in 7 of SSA’s 10 regions.
In one region’s FOs, 47 percent was in the top tier, while in another region, only 9 percent of the FOs were in the top tier. One region had the largest percent of its FOs in the bottom tier at 43 percent.
Claims On average, top offices cleared seven times more claims and eight times more other services than the bottom offices.
Top performing offices in Tier 1 cleared approximately three times as many claims and other services as bottom performing FOs in Tier 3.
Processing Time
Processing time in the top FOs was better than the bottom FOs for title II Retirement, Survivors and Health Insurance (RSHI) and DI, SSI D/B, and Enumerations.
Average processing times for top and bottom FOs were similar except for DI, whereas Tier 1 FOs processed these claims faster by 2 days.
Visitor Counts and Wait Times
Visitors without an appointment waited approximately 6 minutes longer at a top 10 FOs. However, we noted the top 10 FOs had approximately 10 times more visitors without appointments than the bottom 10 FOs.
Visitors without an appointment waited approximately 4 minutes longer at a Tier 1 FO. We also noted that Tier 1 FOs had three times as many visitors as Tier 3 FOs.
Clearances per Employee
On average, top FOs cleared approximately 360 claims and 2,130 other services per employee, while bottom FOs cleared approximately 300 claims and 1,580 other services. This resulted in 60 more claims and 550 other services cleared per employee in the top FOs.
Top and bottom tier FOs cleared approximately 350 claims per employee; however, top tier FOs cleared approximately 1,940 other services per employee, while bottom tier FOs cleared approximately 1,670. This resulted in 270 more other services cleared per employee in the top tier FOs.
Demographic Information - Employees
On average, a top FO had 52 employees with 13 average years of service and a bottom FO had approximately 9 employees with 14 average years of service.
On average, a top tier FO had 35 employees with 14 average years of service and a bottom tier FO had approximately 14 employees with 16 average years of service.
Demographic Information – Population Served
Top FOs served an average population of 549,000, ranging from 386,000 to 730,000, while bottom FOs served an average population of 81,000, ranging from 40,000 to 115,000.
Top FOs served an average population of 379,000, while bottom FOs served an average population of 148,000.
16 An FO is classified as a Level 1, Level 2, or RS primarily based on the number of management staff in the office, and its service area.

Field Office Performance (A-15-12-11290) 10
We also noted that FOs in Tier 2 generally fell in the middle for all categories we analyzed, except for processing times for title II RSHI and title XVI SSI D/B. For these two areas, Tier 2 FOs performed better than Tier 1 and 3 FOs.
Analysis of 32 FO Population
We evaluated 32 FOs separately because a card center assisted with their enumerations workload. Based on the results of our methodology for our second population of 32 FOs, we determined the top and bottom 3 performing FOs. Refer to Table E–4 in Appendix E, which displays workload, processing time, visitor counts, wait times, and demographic information for each of the six FOs.
In addition to analyzing the average performance of the highest and lowest 10 FOs, we separated the 32 FO populations into the following tiers.
1. Tier 1 – FOs in the top half of the population for all 3 data sources,17 which resulted in 10 FOs;
2. Tier 3 – FOs in the bottom half of the population for all 3 data sources, which resulted in 11 FOs; and
3. Tier 2 – the remaining 11 FOs.
Refer to Table E–5 in Appendix E, which displays the average workloads, processing times, visitor counts, wait times, and demographic information for each of the tiers.
Table 5 presents our analysis of the 32 FO populations’ top 3 versus bottom 3 FOs as well as the Top Tier versus the Bottom Tier.
17 As previously stated, the three data sources were DOWR, MI Central Processing Time Reports, and MI Central Customer Service Record Reports

Field Office Performance (A-15-12-11290) 11
Table 5: Analysis of 32 FO Population
Top Three Versus Bottom Three Top Tier Versus Bottom Tier
Location and Size
The top three performing FOs were Level 1 offices located in two regions. Two of the three bottom performing FOs were Level 2 offices in one region.18
Approximately 45 percent of one region’s FOs was in the top tier. Two regions had 50 percent of their FOs in the bottom tier.
Claims
On average, top offices cleared three times more claims and four times more other services than the bottom offices.
Top performing offices in Tier 1 cleared approximately twice as many claims and other services as bottom performing offices in Tier 3.
Processing Time Title II DI processing times in top offices was better than the bottom offices by nearly 5 days.
Average processing times for top and bottom offices were similar except for DI, where Tier 1 offices processed these claims faster by approximately 3 days.
Visitor Counts and Wait Times
Visitors without an appointment waited approximately 4 minutes longer at a top three office. However, we noted the top three offices had approximately three times more visitors without appointments than the bottom three FOs.
Visitors with(out) an appointment waited approximately the same amount of time at a top or bottom tier office; however, top tier offices had approximately twice as many visitors as bottom tier offices.
Clearances per Employee
Top offices on average cleared approximately 390 claims and 2,000 other services per employee, while bottom office employees cleared approximately 310 claims and 1,200 other services. This resulted in 80 more claims and 800 more other services cleared per employee in the top offices.
Top offices on average cleared approximately 360 claims and 1,500 other services per employee, while bottom office employees cleared approximately 325 claims and 1,040 other services. This resulted in 35 more claims and 460 more other services cleared per employee in the top offices.
Demographic Information - Employees
On average, a top office had 48 employees with 14 average years of service, and a bottom office had approximately 21 employees with 15 average years of service.
On average, a top tier office had 48 employees with 13 average years of service, and a bottom tier office had approximately 31 employees with 17 average years of service.
Demographic Information – Population Served
Top offices served an average population of 587,000, ranging from 378,000 to 826,000, while bottom offices served an average population of 284,000, ranging from 158,000 to 509,000.
Top offices served an average population of 605,000, while bottom offices served an average population of 404,000.
We noted that FOs in Tier 2 generally fell in the middle for all categories we analyzed, except for title XVI SSI D/B processing time and the wait time for visitors without an appointment. For title XVI SSI D/B processing time, Tier 2 FOs took approximately 2 to 3 days longer to process a claim than Tier 1 or 3 FOs. Visitors without an appointment in Tier 2 FOs waited
18 One of these offices closed in Calendar Year 2012.

Field Office Performance (A-15-12-11290) 12
approximately 2 to 3 minutes less than in Tier 1 or 3 FOs. In addition, we noted that Tier 2 FOs processed approximately 147 OASI claims per employee, whereas Tier 1 and 3 FOs’ claims processed per employee were 127 and 126, respectively.
CONCLUSIONS Our review revealed several concerns related to the completeness, accuracy, and consistency of data obtained, as discussed in Appendix B, as well as numerous workload reports available to FO staff for monitoring workloads, as discussed in Appendix C. We believe SSA should review its workload monitoring reports and determine the best source(s) for measuring and monitoring FO performance.
SSA representatives stated that regional and area offices monitored individual FO performance through personal contact with office managers and the significant management information collected. Office of Operations executives stated that they monitored FO performance at a high level, rather than at an individual office level. We believe national level monitoring would assist the Agency with its increasing workloads and decreasing workforce. For example, through the Agency’s increasing capacity to shift workloads between offices, monitoring at a national level could better permit offices within a region to assist stressed offices in other regions. Accordingly, we encourage the Agency to consider developing a more extensive nation-wide monitoring system.
The number of individuals filing for benefits has increased, and SSA predicts it will continue increasing by the millions. The Agency estimates that 80 million individuals, most from the baby boomer generation, will file for benefits over the next 20 years. As workloads rise, a greater portion of SSA’s workforce will become eligible to retire. SSA predicts that 28 to 36 percent of its workforce will retire over the next 10 years. We believe SSA needs to develop a methodology for measuring and monitoring FO performance at the nation-wide level because of the degree of variance noted in our analysis of top- versus low-performing FOs. We also believe national level monitoring will assist the Agency with its increasing workloads and decreasing workforce.
In addition, in May 2013, the Government Accountability Office (GAO) published a report19 that identified four key management challenges at SSA.
· Human capital. SSA has not updated its succession plan since 2006 although the agency faces an ongoing retirement wave and hiring freeze which will make it difficult to respond to growing workload demands.
· Disability program issues. SSA faces ongoing challenges incorporating a more modern concept of disability into its programs, while balancing competing needs to reduce backlogs of initial and appealed claims and ensure program integrity.
19 GAO report, Social Security Administration, Long-Term Strategy Needed to Address Key Management Challenges (GAO-13-459), May 2013.

Field Office Performance (A-15-12-11290) 13
· Information technology (IT). SSA has made strides in modernizing its IT systems to address growing workload demands, but faces challenges with these modernization efforts and correcting internal weaknesses in information security.
· Physical infrastructure. SSA is moving toward centralized facilities management, but the agency lacks a proactive approach to evaluating its office structure that will identify potential efficiencies, such as consolidating offices.
GAO’s recommendations to SSA included (1) developing a long-term strategy for service delivery, (2) taking steps to update its succession plan, and (3) exploring the utility and feasibility of realigning its headquarters, regional, and FO structure. SSA agreed with GAO’s recommendations. We believe determining the best source(s) of data for measuring and monitoring FO performance and developing nation-wide FO performance monitoring would assist SSA in accomplishing the recommendations in the GAO report.
We provided an initial draft report to SSA management for review. They provided the following comments to our report.
· The three workload areas OIG selected can be useful indicators of FO capacity and production as well as staffing need; however, we still do not believe they are useful as criteria for ranking FOs. For years, Operations used similar methods of ranking FOs, and we discontinued this practice as we saw it lead to unintended behavior by employees and managers. Ranking FOs can create a climate of competition and one-upmanship, which is counterproductive to our priorities of quality, accuracy, and good public service.
· Operations does not employ any single, numeric formula for evaluating FO performance; rather, we use a balanced approach and consider such factors as uneven attrition, service area population demographics, unique workload challenges, etc., in addition to numeric indicators.
· We encourage workload sharing between FOs. In these instances, offices with additional capacity are asked to process work for other offices that may be inundated. We use the same practice at the regional level, as a means of balancing service levels across Operations.
· While Headquarters staff does not measure performance at the individual office level, we do continually monitor national performance goals and service indicators and look for outliers when they are not being met. There are qualitative as well as quantitative factors in the field that we may not be aware of at Headquarters. Management of individual offices is left to regional management.
· The statement, attributed to OPSOS representatives, that we, “. . . would never look at a single field office and that [we] rarely look at one region,” is taken out of context. We regularly analyze field office-level data, in the aggregate, in order to identify trends, outliers, and imbalances in staff and service. During these analyses, we often identify individual offices with questionable, noteworthy, or surprising data and refer the issues to the regional offices for investigation and explanation. What we don’t do is target individual offices for in-depth analysis at Headquarters. (After receiving SSA’s comments we deleted the reference statement from the draft report.)

Field Office Performance (A-15-12-11290) 14
· An FO that processes the most claims (or other work) per employee should not necessarily be considered a high performing office. Depending on other relevant factors, it may be an indication that the office is understaffed. If the employees in an understaffed FO are processing claims (or other workloads) at an unusually fast rate, it may raise concerns about quality and accuracy, rather than indicate outstanding performance.
· Even prior to the freeze, staffing imbalances have occurred over time, with less turnover in rural rather than urban offices, as OIG cited many of our employees have worked for SSA for a good number of years.
· To balance service, we continue to increase the number of services available online. We currently offer online claims filing to meet the changing needs of the public and address significant increases in our retirement and disability claims. In addition, we implemented My Social Security, a secure Website that authenticates the identity of people interested in conducting business with us via the Internet. In May 2012, we released the online Social Security Statement using My Social Security. In January 2013, we expanded My Social Security to allow individuals to request a benefit verification letter online, as well as change their address and direct deposit information. With our online services, we are making it easier for people to do their business with us from the comfort of their home, office, or a library, without the need to come into a field office.
· Due to our restrictive budget, Social Security instituted a staffing freeze at the beginning of FY 2011, and the Agency has since lost nearly 10,000 people overall, most of whom are from frontline service components. These losses are not balanced across FOs, as data show some offices have lost 50 percent of their employees while others have lost significantly fewer. We have implemented strategies to help struggling offices to maintain service levels. For instance, we are moving electronic workloads between offices, we employ video service delivery where feasible, and we have placed temporary employees in some offices. We have also consolidated offices where it made sense to do so and closed many of our contact and resident stations. Additionally, we continue to identify and share best practices across area and regional lines—we specifically look for opportunities to continue to leverage the portability of our work, promote collaboration, and maximize our employees’ knowledge and expertise.
· Generally, shifting employees between offices is not, and has not been, a viable strategy for the Agency. Within our current budget, we are limited in our ability to fund employee details or relocation actions (which is required by law when we ask people to move for the benefit of the government).
RECOMMENDATIONS Based on our review, we determined that SSA should
1. Identify the most accurate, complete, and reliable data source(s) for Agency workload count and processing time data, and ensure that all Agency components are using the same source(s) for reporting purposes.

Field Office Performance (A-15-12-11290) 15
2. Develop a methodology for measuring and monitoring nation-wide FO performance to ensure accurate, consistent, and timely customer service.
AGENCY COMMENTS SSA agreed with our recommendations. However, the Agency expressed concerns about (1) the overall concept of nationally ranking offices, and (2) our definition of “performance.” Specifically, SSA stated that we did not clearly define “performance” in the report, but that we appear to base performance on volume and speed of work produced. Additionally, SSA stated
The fact that you deemed larger offices as “higher performing” suggests that you defined high performance as a function of size and volume when there are many other factors involved. Instituting a national ranking approach would be counterproductive to the environment that we work to develop. In an era of staffing losses, without adequate replacement hires, we need to assess our resources and the capacity to perform work globally. Physical location and office size should not be factors when comparing performance. We do agree that managers, particularly new managers, should have an agreed upon primary source for workload tracking and performance reporting.
For the full text of the Agency’s comments, see Appendix F.
We are pleased SSA agreed with our recommendations, but continue to believe the methodology we used to evaluate FO performance successfully identified instances of outlying performance that may need Agency attention. We met with SSA officials often during the course of this review and obtained their concurrence on our methodology. Additionally, the Background section of our report and Appendix D provide detailed explanations about the SSA workloads we selected for review and how we defined FO performance. Although the SSA officials who originally agreed with this approach are no longer with the Agency, we did obtain their input on our audit. In fact, we tailored certain aspects of our audit to meet the requests of those Agency representatives. We understand the Agency’s reluctance in ranking its offices. However, we believe this approach provided valuable information on a national level that will help SSA identify performance trends and training needs as well as best practices that may be helpful nationwide.

Field Office Performance (A-15-12-11290)
APPENDICES

Field Office Performance (A-15-12-11290) A-1
– SOCIAL SECURITY ADMINISTRATION Appendix AORGANIZATIONAL CHART

Field Office Performance (A-15-12-11290) B-1
– DATA RELIABILITY Appendix B
Observations Noted During Field Office Count Reconciliation
We obtained a list of all Social Security Administration (SSA) field offices (FO) as of the end of Fiscal Year (FY) 2011, which identified whether the office was a Level 1, Level 2, or resident station (RS).1 We also obtained a list from the Office of Public Service and Operations Support (OPSOS) that showed the number of employees at the FOs as of the end of FYs 2010 and 2011. Using this information, we observed the following issues.
1. OPSOS originally informed us that 1 FO had 12 employees as of the end of FY 2011. Upon further review, we learned that this FO had closed in September 2006.
2. OPSOS originally classified one office as an FO/2 as of the end of FY 2011, but this FO actually closed in May 2007 and continued operating as a contact station until May 2011, when it permanently closed.
Observations Noted During Merger of Management Information Data
We obtained FO workload data sources, as of the end of FY 2011, from a number of the Agency’s Management Information (MI) systems, such the SSA Unified Measurement System/Managerial Cost Accounting System (SUMS/MCAS) MI Central System and the District Office Workload Report (DOWR). In addition, OPSOS also provided a list of closed FOs from the end of FY 2002 through FY 2012. Using these data and the listings obtained for the FO Count Reconciliation above, we used audit software to merge the data sources for each FO. Using this information, we observed the following issues.
1. For one FO, OPSOS stated that it had one employee as of the end of FY 2011. We were unable to find any DOWR or other MI workload data related to this office. Since this office did not close until September 2012, we expected there to be some workload count data related to this office in FY 2011.
2. We identified 33 FOs and 4 RSs, which OPSOS identified as closed before the beginning of FY 2011, that had DOWR counts and/or other MI data as of the end of FY 2011.
a. In 32 of the 33 closed FOs and all 4 of the RSs, we observed DOWR workload counts ranging from 1 to 75 cleared cases.
b. In 10 of the 33 closed FOs, we observed workload count information in the Agency’s MI Central system.
1 An FO is classified as a Level 1, Level 2, or RS primarily based on the number of management staff in the office.

Field Office Performance (A-15-12-11290) B-2
i. For example, in two FOs, we observed processing time counts related to title II DI claims for FY 2011. In one of these FOs, we identified a claim that had overall processing time in excess of 5,000 days (approximately 13.7 years).
ii. In another example, we identified four FOs reporting seven title XVI Blind/Disabled claims with average FO processing time in excess of 1,000 days (approximately 2.7 years).
In addition, SSA had over 30 RSs nationwide as of the end of FY 2011; however, workload information related to these offices was inconsistently applied and tracked in MI systems.
Observations Noted During Reconciliation Attempts at FOs
During the fieldwork phase of our review, we visited 14 FOs in 5 SSA regions.2 Before our visits, we extracted workload count information from SSA MI Central systems, such as SUMS/MCAS and DOWR. We used these data at each of the FOs and asked staff to provide reports from their systems that could be used to verify and validate the MI data. Some FOs were only able to provide us the same copies of MI reports, while other offices were able to provide data and reports from other systems. For example, to assist with verifying the number of visitors to the office, the majority of FOs was able to use the Visitor Intake Process system to pull a report that showed the number of visitors. Some of the other systems/reports that FO staff used to assist us, and the corresponding workload they supported, were as follows.
Table B–1: FO Workload Reports
Workload System/Report
Title II and XVI Claims · Workload Management Information Summary and Detail Reports
Redeterminations · MIVision: National RZ Volume Tracker · StaRZs and StriPEs
Continuing Disability Reviews (CDR)
· eWork · CDR 2000
iClaims
· Workload Management Information Daily Internet Claims Report
· Workload Management Information Detail Report · Kansas City National iClaim Report
For the enumeration workload, FO staff was not able to access any reports from their Social Security Number Application Process program that showed completed or cleared cases. Subsequent to our review, SSA stated, “The Social Security Number Application Process
2 We also visited the five corresponding regional offices (RO).

Field Office Performance (A-15-12-11290) B-3
(SSNAP) provides information to FO users for pending cases; that is, cases that have not been successfully processed through the batch process. Cases that are ready for batch processing are assigned a status of ‘cleared.’ These cases are available in SSNAP for online viewing. After successful overnight processing, cases are assigned a status of ‘cleared processed’ or ‘CP’ and are no longer available for online viewing. The Enumeration Application Retrieval System (EARS), which can be accessed through SSNAP, can provide information for ‘CP’ cases on an SSN or reference number basis.”
We also noted for the overpayment workloads, FOs did not have access to any reports that listed overpayment actions that had been completed or cleared. The systems used to work overpayments—NY Debt Management (for title II) and ChiNet SSI Diary Workload Control Application (for title XVI)—only showed FOs pending overpayments. Based on discussions with FO supervisors and managers, this made it difficult for them to review and provide feedback on their employees’ overpayment work.
When we compared DOWR and MI reports to reports provided in the 14 FOs, we noted a number of numerical differences between workload counts related to title II and XVI claims, RZs/LIs, CDRs, iClaims, and FO visitor counts. We asked staff at SSA Headquarters to assist us with reconciling these differences. Staff was able to reconcile the workload count differences for the following.
· Visitor counts and left without service counts at three FOs.
· Title II OASDI Claim completion and cleared cases counts at one FO.3
Management Reports Available to FOs, ROs, and Headquarters Staff
When we visited the five ROs, we met with Center for Automation staff. Staff members provided a list of the reports management used to monitor how offices were performing at the FO and RO levels. We have provided an example of the reports available to management from one of the ROs we visited in Appendix C.
We noted that the list of reports in Appendix C did not have a separate category for the Agency’s iClaims workload. Using information we obtained during visits to the FOs, ROs, and SSA Intranet sites, we compiled a list of the management reports available for monitoring the iClaims workload, as shown below4
3 SSA stated, “[Headquarters] HQ staff reconciled data for these few FOs only, in an effort to explain the data differences to the auditors. Due to resource constraints, HQ staff did not attempt to reconcile data for each of the FOs where auditors identified data differences.” 4 The list contains reports that we observed during our review and may or may not include all reports available to staff for iClaim monitoring.

Field Office Performance (A-15-12-11290) B-4
Table B–2: iClaims Workload Reports
Report Host eServices MI Report MI Central Title II DIB Internet Processing Time Philadelphia eService Initial Title II Claims Summary Boston
National eServices Report, Internet Disability Report Kansas
National iClaim Report Kansas RIB/SPO Internet and Non-Internet Receipts Chicago
First Party iClaim Workload Management Information Listing Chicago
Third Party iClaim Workload Management Information Listing Chicago
Non-Imported Internet Claims San Francisco Internet Receipts for the Week Ending San Francisco Evergreen Weekly Denver Title II Workload Management Information Initial Claims Reports New York
Localized MI Report (for Historical iClaims information FY 2011 and earlier)
Office of Electronic Services
Implemented nationally in January 2009, iClaims is a relatively new program to SSA. We have concerns that there are already a large number of different reports to track this workload.
During our review, we noted that the purpose of MI Central was to, “. . . facilitate access to management information and workload control reports by providing a Central location where employees can obtain information on SSA workloads and by presenting that information with a consistent look and feel.”5 As shown in Appendix C, SSA staff relied on a number of reports, developed outside MI Central, for workload information. We noted that workload count data may vary from report to report. We were not able to determine whether the differences between these reports had been documented or why there was a need for numerous reports related to one workload. In addition, we were unable to determine which report would give us the most complete and accurate data to analyze FO performance.
5 MI Central Online User Guide, Background.

Field Office Performance (A-15-12-11290) B-5
During discussions with various SSA components, there were disagreements over which reports showed “Official Agency Data.” One component stated that DOWR was the best source of data, while another component stated that Workload Management Information was the best source. Staff stated that workload processing data amounts could be different depending on which component is asked, when it is asked, and how the question is asked. Agency representatives stated that they would not expect FO or regional management to give the same answer to the same question about workload performance because different levels of management use different sources of information to fulfill their intended purpose.
In addition, we noted that workload counts in MI Central may conflict. For example, there are two enumeration performance reports in MI Central, one is the “Workload” report and the other is the “Issuance of Social Security Number” report. If a user were to look at the completed enumerations on each of the reports, they would get two different completed counts. While these reports are both classified as performance reports in MI Central, SSA stated, “. . . [they are] used to measure different things.” Since the reports measure and report different things, it can be confusing to users which amount is complete and accurate. Although SSA management requested we use specific sources of data, we were not able to determine if the data used were reliable, complete, and accurate. Further, if another source of data were used, the results may or may not have been different.
Field Office Performance (A-15-12-11290) C-1
Appendix C – MANAGEMENT MONITORING REPORTS
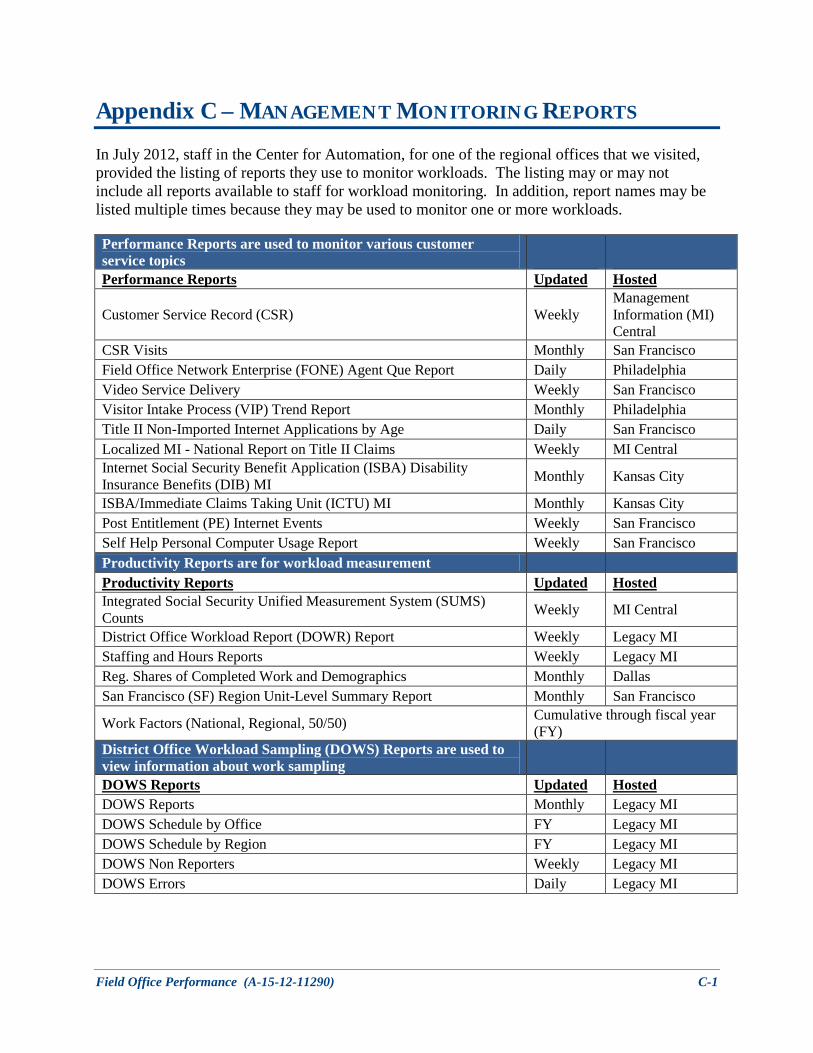
In July 2012, staff in the Center for Automation, for one of the regional offices that we visited, provided the listing of reports they use to monitor workloads. The listing may or may not include all reports available to staff for workload monitoring. In addition, report names may be listed multiple times because they may be used to monitor one or more workloads.
Performance Reports are used to monitor various customer service topics
Performance Reports Updated Hosted
Customer Service Record (CSR) Weekly Management Information (MI) Central
CSR Visits Monthly San Francisco Field Office Network Enterprise (FONE) Agent Que Report Daily Philadelphia Video Service Delivery Weekly San Francisco Visitor Intake Process (VIP) Trend Report Monthly Philadelphia Title II Non-Imported Internet Applications by Age Daily San Francisco Localized MI - National Report on Title II Claims Weekly MI Central Internet Social Security Benefit Application Insurance Benefits (DIB) MI
(ISBA) Disability Monthly Kansas City
ISBA/Immediate Claims Taking Unit (ICTU) MI Monthly Kansas City Post Entitlement (PE) Internet Events Weekly San Francisco Self Help Personal Computer Usage Report Weekly San Francisco Productivity Reports are for workload measurement Productivity Reports Updated Hosted Integrated Counts
Social Security Unified Measurement System (SUMS) Weekly MI Central
District Office Workload Report (DOWR) Report Weekly Legacy MI Staffing and Hours Reports Weekly Legacy MI Reg. Shares of Completed Work and Demographics Monthly Dallas San Francisco (SF) Region Unit-Level Summary Report Monthly San Francisco
Work Factors (National, Regional, 50/50) Cumulative through fiscal (FY)
year
District Office Workload Sampling (DOWS) view information about work sampling
Reports are used to
DOWS Reports Updated Hosted DOWS Reports Monthly Legacy MI DOWS Schedule by Office FY Legacy MI DOWS Schedule by Region FY Legacy MI DOWS Non Reporters Weekly Legacy MI DOWS Errors Daily Legacy MI

Field Office Performance (A-15-12-11290) C-2
Profile Reports are used to monitor field office visitor totals and service area beneficiaries and recipients Profile Reports Updated Hosted Recipient-in-force/Beneficiary-in-force Quarterly and Direct Deposit Monthly Reports
Quarterly/ Monthly San Francisco
Appointment/800 Number Monthly San Francisco Appointment Tracking System Weekly Chicago Appointments and Visitors Reports Weekly MI Central Title II Claims Reports are used to track processing times and claims status Title II Claims Reports Updated Hosted Title II Initial Claims Processing Time Reports Weekly MI Central Title II Disability Claims Status Report Weekly San Francisco Title II Disability Processes Monthly San Francisco Title II Unsigned Applications Report Monthly San Francisco Supplemental Security Income (SSI) Claims Reports are used to track processing times and claims status SSI Claims Reports Updated Hosted SSI Disability Process Indicators Monthly San Francisco SSI Initial Claims Report Weekly MI Central SSI Disabled/Blind (D/B) Claims Status Weekly San Francisco SSI Claims Returned from Disability Determination Services (DDS) Weekly San Francisco SSI Unsigned Applications Report Monthly San Francisco Title II Claims Listings provide lists of Title II processing times Title II Claims Listings Updated Hosted Title II Processing Time Listing Weekly MI Central Title II Processing Time Social Security Number Query Weekly MI Central The SSI Appeals report provides tracking of SSI appeals SSI Appeals Updated Hosted SSI Administrative Law Judge (ALJ) Reversals Atlanta

Field Office Performance (A-15-12-11290) C-3
Combined Reports consists of a variety of reports regarding workload and processing time for Title II and SSI Combined Reports Updated Hosted Area and Regional Comparative Trend for Initial Claims (I/C) Monthly San Francisco Monthly DIB Claims Processing Time and Shortfall Reports Monthly San Francisco Title II and Title XVI Initial Claims Workload Reports Weekly San Francisco SF Region Pending Appeals Report Weekly San Francisco Title II/SSI Claims Processing Time Tracker Monthly Denver Fast Track Disability Processing Time Weekly MI Central Strategic Performance Plan - Timeliness/Comb Processing Time Monthly Chicago Electronic Disability Collect System (EDCS) Action Items Report Weekly San Francisco Disability Determination Services Query (DDSQ) System Override (SO) - Y Weekly San Francisco
Department of Public Social Services (DPSS) Claims Status Report Monthly San Francisco Dallas Appeals Counter Daily Dallas Redetermination (RZ) and Limited Issue (LI) Reports provide information on RZ/LI counts RZ and LI Reports Updated Hosted RZ/LI Reports Legacy MI SSI RZ Agency Counts by Status for Sources Legacy MI National SSI RZ Volume Tracker Weekly Denver RZ and LI Listings provide lists of RZ/LI claims RZ and LI Listings Updated Hosted RZ/LI Listings Weekly MI Central RZ/LI Social Security Number, Internal Revenue Service (IRS), and Supplemental Security Income Display (SSID) Queries Daily MI Central
SSI Reports include a variety of reports related to SSI claims SSI Reports Updated Hosted SSI Diary Workload Weekly Chicago SSI Critical Diary Report Weekly San Francisco SSI Monthly Wage Reporting Report Monthly San Francisco SSI Monthly Wage Verification MI Reports Monthly New York SSI Terminated Windfall Offset Report Weekly San Francisco SSI Overpayment Diaries/Recipient in Force Report Weekly San Francisco SSI Representative Payee Suspense Report Monthly San Francisco SSI Telephone Wage Reporting MI Monthly New York SSI Unverified Wages Monthly San Francisco SSI Monthly Wage Verification Version 2.2 Monthly Boston

Field Office Performance (A-15-12-11290) C-4
SSI Listings provide lists for various SSI claims SSI Listings Updated Hosted SSI Force Pay Monthly San Francisco SSI Force Pay Quarterly New York SSI New Overpayment Control Listings Monthly San Francisco SSI Overpayment Diary Follow-up Listings Monthly San Francisco SSI Unpaid Start Date Records Monthly San Francisco SSI Age 62 Attainment Quarterly San Francisco Title XVI Priority Exception 5th Follow-up San Francisco Continuing Disability Review (CDR) Reports provide various reports on multiple CDRs CDR Reports Updated Hosted CDR-m Weekly Clearances to DDS Weekly San Francisco Age 18 CDRs Monthly San Francisco Low Birth Weight CDRs Monthly San Francisco Pending CDRs Weekly San Francisco Aged Work CDRs Weekly San Francisco Disability Control File (DCF) eWork Push Failed San Francisco eWork Effectuation of the Decision (DECEFFECT) Alerts Report San Francisco Pending Expedited Reinstatements (EXRs) Monthly San Francisco PC Enforcement Work CDRs San Francisco Special Release Title XVI Childhood CDRs San Francisco CDR Listings provide lists for CDR cases CDR Listings Updated Hosted Medical CDR Reports Weekly Philadelphia CDR Listings Daily MI Central CDR Social Security Number Query Daily MI Central Death Alerts tracks pending death alerts and cleared alerts Death Alerts Updated Hosted Death Alert Tracking System Philadelphia Debt Management reports include a link to the New York (NY) Debt Management Program, waivers and personal conferences, and earnings corrections
Debt Management Updated Hosted New York Debt Management Program Daily New York Waiver and Personal Conference Report Monthly San Francisco Earnings Modernization (EM) 2.8 Daily Philadelphia Title II Waivers and Personal Conference Report Weekly Philadelphia

Field Office Performance (A-15-12-11290) C-5
Other Reports cover a wide variety of reports for the region, such as payee suspense, special veterans benefits, centenarian, etc. Other Reports Updated Hosted Modernized Development Worksheet (MDW) Summary Report Weekly San Francisco Title II Rep Payee Suspense Report Monthly San Francisco
Prisoner Alerts Monthly
Executive and Management Information System (EMIS)
Prisoner Updated Processing System (PUPS)/Representative Payee System (RPS) Philadelphia
Single Payment System Monthly EMIS Special Veterans Benefits - Title VIII Weekly San Francisco Earned Income (EN) Ticket Payment Cases over 30 Days Old Monthly San Francisco
Widow(er)’s Insurance Benefit (WIB)/RIB SSI Project Semi-Annual San Francisco
WIB/RIB Project Semi-Annual San Francisco
Earnings Annual Wage Report (AWR) Counts Daily Legacy MI Earnings AWR Listings Daily Legacy MI Employer Identification Number (EIN) Query Request Daily Legacy MI National Centenarian Project Annual San Francisco Enumeration reports include processing time and performance Enumeration Updated Hosted Enumeration Processing Time Weekly MI Central Enumeration Performance Reports Weekly MI Central

Field Office Performance (A-15-12-11290) D-1
– SCOPE AND METHODOLOGY Appendix D
To accomplish our objective, we:
· Interviewed staff and gathered workload data from 14 SSA field offices (FO) and 5 regional offices (RO).
· Gathered workload information from Social Security Administration (SSA) sources for Fiscal Year (FY) 2011.
o From the District Office Workload Report (DOWR) cleared count report, we analyzed the following workloads (1) title II Old-Age and Survivors Insurance (OASI), (2) title II Disability Insurance (DI), (3) title XVI Supplemental Security Income (SSI) Disabled/Blind (D/B), (4) title II and XVI Status Changes and Benefit Verifications, and (5) Enumerations.
o From the Processing Time from Management Information (MI) Central report, we analyzed the following workloads (1) title II Retirement, Survivors and Health Insurance (RSHI) Timeliness percent, (2) title II Disability Insurance Beneficiary (DIB) FO Time in Days, (3) title XVI D/B FO Time in Days, and (4) Enumeration FO Time in Days.
o From the Visitor counts [provided by Office of Public Service and Operations Support (OPSOS) from the Customer Service Record (CSR) Operational Datastore (ODS)] and Wait Time (from MI Central) reports, we analyzed the following types of visitors (1) with appointment, and (2) without appointment.
o 2010 Population and Median Household Income from a Geospatial report produced by the Office of Electronic Services based on 2010 census data.
o Average Recipient/Beneficiary payment amounts for SSI and Old-Age, Survivors and Disability Insurance (OASDI) beneficiaries as of September 2011 from SSA’s Quarterly Recipient in Force/Beneficiary in Force reports.
o Number of SSI recipients and OASDI beneficiaries as of September 2011 from the Quarterly Recipient in Force/Beneficiary in Force reports.
o Staff demographics provided by OPSOS: (1) FYs 2011 and 2012 FO staff average years of service, (2) FYs 2011 and 2012 FO staff average salary, and (3) counts of FO staff as of the end of FYs 2010 and 2011. (Note: We computed the average number of FO staff in 2011 based on staff counts provided for FYs 2010 and 2011.)
Field Office Performance (A-15-12-11290) D-2
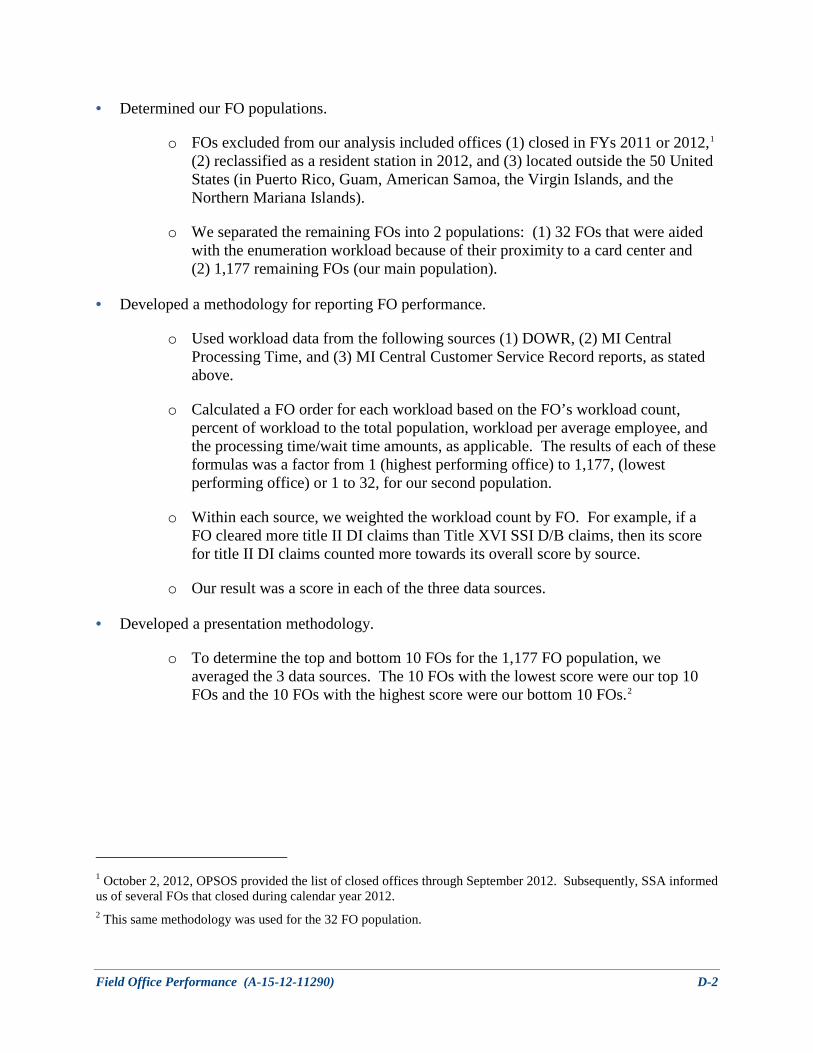
· Determined our FO populations.
o FOs excluded from our analysis included offices (1) closed in FYs 2011 or 2012,1 (2) reclassified as a resident station in 2012, and (3) located outside the 50 United States (in Puerto Rico, Guam, American Samoa, the Virgin Islands, and the Northern Mariana Islands).
o We separated the remaining FOs into 2 populations: (1) 32 FOs that were aided with the enumeration workload because of their proximity to a card center and (2) 1,177 remaining FOs (our main population).
· Developed a methodology for reporting FO performance.
o Used workload data from the following sources (1) DOWR, (2) MI Central Processing Time, and (3) MI Central Customer Service Record reports, as stated above.
o Calculated a FO order for each workload based on the FO’s workload count, percent of workload to the total population, workload per average employee, and the processing time/wait time amounts, as applicable. The results of each of these formulas was a factor from 1 (highest performing office) to 1,177, (lowest performing office) or 1 to 32, for our second population.
o Within each source, we weighted the workload count by FO. For example, if a FO cleared more title II DI claims than Title XVI SSI D/B claims, then its score for title II DI claims counted more towards its overall score by source.
o Our result was a score in each of the three data sources.
· Developed a presentation methodology.
o To determine the top and bottom 10 FOs for the 1,177 FO population, we averaged the 3 data sources. The 10 FOs with the lowest score were our top 10 FOs and the 10 FOs with the highest score were our bottom 10 FOs.2
1 October 2, 2012, OPSOS provided the list of closed offices through September 2012. Subsequently, SSA informed us of several FOs that closed during calendar year 2012. 2 This same methodology was used for the 32 FO population.

Field Office Performance (A-15-12-11290) D-3
o To determine the 3 tiers for the 1,177 FO population, we determined the mid-point for our population at FO number 588. Tier 1 was FOs in the top half of the population for all 3 data sources (588 or less). Tier 3 was FOs in the bottom half of the population for all 3 data sources (589 or more). The remaining FOs that were not in Tiers 1 or 3 were grouped into Tier 2.3
· There were a number of workloads and other factors that we did not consider in our methodology.4
o Workload count information for the following (1) Representative Payee transactions, (2) Redeterminations/Limited Issues, (3) Continuing Disability Reviews, (4) Medicare and Medicaid, (5) Earnings, (6) Overpayments/Waivers, (7) Appeals, etc.
o Composition of FO staff (that is, number of managers, Operations Supervisors, claims and service representatives, trainees, etc.).
o Workload sharing.
o Length of time (in minutes) to complete a workload.
o Staff time in office (regular hours, overtime, credit hours, etc.).
o Workload accuracy and quality.
o Customer service.
We conducted our audit between March 2012 and March 2013 at SSA Headquarters in Baltimore, Maryland, as well as at 14 FOs in 5 ROs—(1) Atlanta, (2) Denver, (3) Philadelphia, (4) San Francisco, and (5) New York. The principal entities audited were SSA's FOs under the Office of the Deputy Commissioner for Operations. We conducted this performance audit in accordance with generally accepted government auditing standards. Those standards require that we plan and perform the audit to obtain sufficient, appropriate evidence to provide a reasonable basis for our findings and conclusions based on our audit objective. We tested the data obtained for our review; please refer to Appendix B for our discussion on data reliability. We believe the evidence obtained supports our findings and conclusions based on our audit objective. However, if another source of data were used the results may or may not have been different.
3 This same methodology was used for our 32 FO population, except our mid-point was FO number 16. 4 There could be additional factors not listed that may affect FO performance.

Field Office Performance (A-15-12-11290) E-1
– FIELD OFFICE ANALYSIS Appendix E
Table E–1: Top 10 Field Offices (FO) in Population of 1,177
Office 1 Office 2 Office 3 Office 4 Office 5 Office 6 Office 7 Office 8 Office 9 Office 10 Average
Workload Counts1 Title II Old-Age and Survivors Insurance (OASI) Cleared Claims 8,102 8,037 5,934 6,165 6,924 7,170 5,416 5,235 7,130 5,413 6,553
Title II Disability Insurance (DI) Cleared Claims 7,090 9,628 6,876 6,773 2,977 7,765 4,341 6,246 6,972 5,864 6,453
Title XVI Supplemental Security Income (SSI) Disabled/Blind (D/B) Cleared Claims
5,690 7,437 7,074 6,300 3,443 6,382 3,705 7,107 6,218 5,830 5,919
Total Cleared Claims2 20,882 25,102 19,884 19,238 13,344 21,317 13,462 18,588 20,320 17,107 18,925
Status Changes and Benefit Verifications Cleared 109,707 81,814 110,629 79,456 92,650 85,396 55,891 63,381 54,740 83,944 81,761
Enumerations Cleared 27,044 25,144 33,061 32,920 42,198 33,603 21,145 23,407 26,707 29,331 29,456
Total Other Services Cleared3 136,751 106,958 143,690 112,376 134,848 118,999 77,036 86,788 81,447 113,275 111,217
Total Cleared Workload Counts4 157,633 132,060 163,574 131,614 148,192 140,316 90,498 105,376 101,767 130,382 130,142
Processing Time5 Title II Retirement, Survivors, and Health Insurance (RSHI) Timeliness Percent6
94.4% 92.4% 90.1% 90.9% 91.9% 87.9% 95.2% 93.9% 87.8% 92.5% 91.7%
Title II DI (Days)7 7.3 10.8 15.9 8.4 13.2 15.0 6.5 11.2 16.6 16.8 12.17
Title XVI SSI D/B (Days)7 8.0 9.6 19.1 9.5 7.4 20.5 5.8 10.5 10.4 18.8 11.96
Enumeration (Days)7 0.5 0.2 0.6 0.9 1.7 0.6 0.4 0.4 0.7 1.3 0.73

Field Office Performance (A-15-12-11290) E-2
Office 1 Office 2 Office 3 Office 4 Office 5 Office 6 Office 7 Office 8 Office 9 Office 10 Average
Visitors and Wait Time
Visitors with Appointment8 2,182 3,583 4,006 7,283 9,917 11,741 2,312 1,858 6,033 3,921 5,284
Wait Time with Appointment (Minutes)9 1.7 3.3 4.3 7.5 4.2 6.9 2.2 4.1 1.4 9.3 4.49
Visitors without Appointment8 60,191 71,743 86,789 117,508 106,571 95,750 49,065 63,395 66,240 77,063 79,432
Wait Time without Appointment (Minutes)9 6.3 10.5 24.1 18.7 22.6 27.5 8.2 14.1 18.7 13.6 16.43
FO Demographics
2010 Population10 730,040 591,948 521,990 577,682 386,056 665,100 494,603 391,029 598,511 530,467 548,743
2010 Median Household Income10 $55,981 $41,967 $48,220 $36,261 $45,584 $42,968 $58,331 $40,752 $51,317 $46,206 $46,759
Population per Average FO Employee11 12,270 10,033 9,757 9,709 6,894 10,232 13,551 8,501 14,250 11,532 10,673
Number of Title XVI SSI Recipients12 10,786 12,645 15,767 22,236 28,592 19,670 7,511 17,059 10,682 16,015 16,096
Number of Title II OASI Beneficiaries12 88,615 102,179 47,282 65,808 54,673 95,808 62,692 56,500 120,019 49,590 74,317
Number of Title II DI Beneficiaries12 20,012 28,678 13,528 19,917 7,770 25,175 12,877 15,372 19,281 11,691 17,430
FO Employees EOY 201113 59 56 54 58 54 64 35 44 43 46 51.3
Average FO Employees 2010 to 201114 59.5 59.0 53.5 59.5 56.0 65.0 36.5 46.0 42.0 46.0 52.3
FO Staff Average Years of Service 201113 10 14 14 11 14 14 16 12 12 14 13.1
FO Staff Average Salary 201113 $60,477 $62,300 $71,588 $60,102 $66,199 $61,602 $66,232 $63,185 $59,520 $69,871 $64,108

Field Office Performance (A-15-12-11290) E-3
Table E–2: Bottom 10 Field Offices in Population of 1,177
Office 1,168
Office 1,169
Office 1,170
Office 1,171
Office 1,172
Office 1,173
Office 1,174
Office 1,175
Office 1,176
Office 1,177 Average
Workload Counts1
Title II OASI Cleared Claims 1,573 1,218 946 1,647 1,211 686 1,448 1,001 864 765 1,136
Title II DI Cleared Claims 843 815 834 1,441 1,221 590 813 889 521 404 837
Title XVI SSI D/B Cleared Claims 573 561 737 750 1,001 457 545 556 263 431 587
Total Cleared Claims2 2,989 2,594 2,517 3,838 3,433 1,733 2,806 2,446 1,648 1,600 2,560
Status Changes and Benefit Verifications Cleared 13,037 8,305 15,985 14,690 15,098 6,694 7,096 11,835 10,196 7,088 11,002
Enumerations Cleared 2,845 3,488 1,645 2,595 2,584 793 3,146 3,798 2,862 2,386 2,614
Total Other Services Cleared3 15,882 11,793 17,630 17,285 17,682 7,487 10,242 15,633 13,058 9,474 13,616
Total Cleared Workload Counts4 18,871 14,387 20,147 21,123 21,115 9,220 13,048 18,079 14,706 11,074 16,176
Processing Time5
Title II RSHI Timeliness Percent6 91.5% 86.3% 95.0% 96.4% 93.2% 95.4% 89.8% 84.9% 93.7% 87.3% 91.4%
Title II DI (Days)7 15.4 22.4 7.5 11.2 12.0 7.7 14.7 33.1 25.6 20.2 16.98
Title XVI SSI D/B (Days)7 10.3 21.9 7.0 11.9 10.2 7.5 11.5 22.1 18.8 10.2 13.14
Enumeration (Days)7 1.0 1.1 0.8 0.8 1.5 0.1 1.0 1.6 0.5 2.3 1.07

Field Office Performance (A-15-12-11290) E-4
Office 1,168
Office 1,169
Office 1,170
Office 1,171
Office 1,172
Office 1,173
Office 1,174
Office 1,175
Office 1,176
Office 1,177 Average
Visitors and Wait Time
Visitors with Appointment8 879 853 506 1,069 1,649 53 696 1,415 204 190 751
Wait Time with Appointment (Minutes)9 4.4 7.0 2.6 5.4 4.3 0.9 2.7 6.7 4.9 2.1 4.10
Visitors without Appointment8 9,017 9,385 7,474 9,748 10,797 4,537 7,153 11,765 7,811 4,746 8,243
Wait Time without Appointment (Minutes)9 15.6 10.5 6.1 6.5 13.6 2.6 10.2 25.1 8.6 6.3 10.51
FO Demographics
2010 Population10 102,504 107,153 49,301 115,661 68,872 40,716 102,540 78,318 95,214 49,463 80,974
2010 Median Household Income10 $47,729 $44,431 $33,403 $42,634 $36,971 $33,934 $48,719 $48,085 $60,806 $70,125 $46,684
Population per Average FO Employee11 12,813 14,287 4,930 8,262 5,989 5,817 13,672 9,790 11,902 10,992 9,845
Number of Title XVI SSI Recipients12 1,248 1,543 1,299 2,812 2,915 726 1,277 2,816 685 943 1,626
Number of Title II OASI Beneficiaries12 18,177 16,373 8,607 26,052 14,497 7,709 15,830 13,458 12,652 5,724 13,908
Number of Title II DI Beneficiaries12 2,722 2,765 2,185 6,421 3,930 1,636 2,494 3,826 2,244 1,080 2,930
FO Employees EOY 201113 8 7 10 14 11 7 7 8 9 4 9
Average FO Employees 2010 to 201114 8.0 7.5 10.0 14.0 11.5 7.0 7.5 8.0 8.0 4.5 8.6
FO Staff Average Years of Service 201113 17 12 15 13 16 15 14 12 10 17 14
FO Staff Average Salary 201113 $70,248 $63,191 $71,001 $63,011 $68,373 $65,153 $60,364 $68,980 $63,624 $77,282 $67,123

Field Office Performance (A-15-12-11290) E-5
Table E–3: Population of 1,177 FOs in 3 Tiers
Tier 1 Tier 2* Tier 3**
Number of FOs 300 580 297
Workload Counts1
Title II OASI Cleared Claims 4,233 2,827 1,970
Title II DI Cleared Claims 4,260 2,644 1,693
Title XVI SSI D/B Cleared Claims 3,728 2,114 1,279
Total Cleared Claims2 12,221 7,585 4,942
Status Changes and Benefit Verifications Cleared 50,987 32,716 18,495
Enumerations Cleared 16,861 8,570 4,830
Total Other Services Cleared3 67,848 41,286 23,325
Total Cleared Workload Counts4 80,069 48,871 28,267
Processing Time5 Title II RSHI Timeliness Percent6 90.94% 91.77% 91.38%
Title II DI (Days)7 13.08 13.77 15.15
Title XVI SSI D/B (Days)7 13.45 13.13 14.05
Enumeration (Days)7 0.66 0.71 0.79

Field Office Performance (A-15-12-11290) E-6
Tier 1 Tier 2* Tier 3**
Visitors and Wait Time
Visitors with Appointment8 4,140 2,685 1,745
Wait Time with Appointment (Minutes)9 5.06 4.37 4.50
Visitors without Appointment8 49,530 27,402 15,861
Wait Time without Appointment (Minutes)9 18.09 15.47 14.36
FO Demographics
2010 Population10 379,067 226,974 147,761
2010 Median Household Income10 $50,266 $49,817 $50,001
Population per Average FO Employee11 10,830 10,317 10,554
Number of Title XVI SSI Recipients12 8,432 5,156 3,021
Number of Title II OASI Beneficiaries12 48,150 33,752 24,164
Number of Title II DI Beneficiaries12 11,532 7,980 5,542
FO Employees EOY 201113 34 21 13
Average FO Employees 2010 to 201114 35 22 14
FO Staff Average Years of Service 201113 14 15 16
FO Staff Average Salary 201113 $65,907 $67,027 $68,060
* Includes five FOs that closed during Calendar Year 2012. ** Includes two FOs that closed during Calendar Year 2012.

Field Office Performance (A-15-12-11290) E-7
Table E–4: Top and Bottom 3 FOs in Population of 32
Top FOs Bottom FOs
Office 1 Office 2 Office 3 Average Office 30 Office 31* Office 32 Average Workload Counts1
Title II OASI Cleared Claims 5,615 4,762 11,014 7,130 5,185 1,539 1,751 2,825
Title II DI Cleared Claims 7,184 3,780 8,518 6,494 3,490 904 2,133 2,176
Title XVI SSI D/B Cleared Claims 5,951 3,022 6,838 5,270 2,095 667 2,035 1,599
Total Cleared Claims2 18,750 11,564 26,370 18,895 10,770 3,110 5,919 6,600
Status Changes and Benefit Verifications Cleared 156,507 56,662 76,933 96,701 38,605 12,250 25,372 25,409
Enumerations Cleared - - - - - - - -
Total Other Services Cleared3 156,507 56,662 76,933 96,701 38,605 12,250 25,372 25,409
Total Cleared Workload Counts4 175,257 68,226 103,303 115,595 49,375 15,360 31,291 32,009
Processing Time5 Title II RSHI Timeliness Percent6 92.9% 89.6% 86.4% 89.63% 92.7% 93.4% 86.6% 90.90%
Title II DI (Days)7 7.1 10.5 14.6 10.73 19.3 7.1 20.1 15.50
Title XVI SSI D/B (Days)7 7.0 11.8 21.8 13.53 15.7 6.2 13.8 11.90
Enumeration (Days)7 - - - - - - - -

Field Office Performance (A-15-12-11290) E-8
Top FOs Bottom FOs
Visitors and Wait Time
Visitors with Appointment8 8,525 5,627 4,486 6,213 2,526 1,595 2,341 2,154
Wait Time with Appointment (Minutes)9 3.8 11.1 4.7 6.53 3.0 7.4 10.2 6.87
Visitors without Appointment8 59,914 51,958 68,439 60,104 22,966 16,248 29,758 22,991
Wait Time without Appointment (Minutes)9 20.1 24.1 24.7 22.97 14.0 13.6 28.2 18.60
FO Demographics
2010 Population10 377,798 557,197 826,443 587,146 509,063 158,085 187,320 284,823
2010 Median Household Income10 $50,279 $54,227 $57,146 $53,884 $62,811 $48,906 $39,621 $50,446
Population per Average FO Employee11 6,628 22,288 13,330 14,082 14,972 14,371 10,407 13,250
Number of Title XVI SSI Recipients12 18,902 19,006 14,889 17,599 4,398 3,455 10,089 5,981
Number of Title II OASI Beneficiaries12 45,257 39,646 110,108 65,004 76,210 14,833 16,537 35,860
Number of Title II DI Beneficiaries12 12,115 8,722 21,328 14,055 13,582 2,565 5,071 7,073
FO Employees EOY 201113 56 23 60 46 32 10 15 19
Average FO Employees 2010 to 201114 57 25 62 48 34 11 18 21
FO Staff Average Years of Service 201113 11 21 10 14 11 20 14 15
FO Staff Average Salary 201113 $64,308 $80,634 $60,142 $68,361 $61,538 $70,194 $78,249 $69,994
* This FO closed during Calendar Year 2012.

Field Office Performance (A-15-12-11290) E-9
Table E–5: Population of 32 FOs in 3 Tiers
Tier 1 Tier 2 Tier 3*
Number of FOs 10 11 11
Workload Counts1
Title II OASI Cleared Claims 6,104 5,434 3,921
Title II DI Cleared Claims 6,139 4,634 3,445
Title XVI SSI D/B Cleared Claims 5,111 3,673 2,687
Total Cleared Claims2 17,354 13,741 10,053
Status Changes and Benefit Verifications Cleared 73,836 50,284 32,344
Enumerations Cleared - - -
Total Other Services Cleared3 73,836 50,284 32,344
Total Cleared Workload Counts4 91,190 64,025 42,397
Processing Time5 Title II RSHI Timeliness Percent6 89.96% 89.31% 90.14%
Title II DI (Days)7 13.39 15.55 16.15
Title XVI SSI D/B (Days)7 13.18 16.00 14.02
Enumeration (Days)7 - - -

Field Office Performance (A-15-12-11290) E-10
Tier 1 Tier 2 Tier 3*
Visitors and Wait Time
Visitors with Appointment8 5,934 4,666 3,499
Wait Time with Appointment (Minutes)9 6.60 6.81 7.06
Visitors without Appointment8 56,769 38,663 30,410
Wait Time without Appointment (Minutes)9 23.76 20.98 22.76
FO Demographics
2010 Population10 604,647 551,708 403,563
2010 Median Household Income10 $53,991 $54,626 $52,201
Population per Average FO Employee11 12,597 14,911 13,018
Number of Title XVI SSI Recipients12 13,739 9,593 9,448
Number of Title II OASI Beneficiaries12 67,111 64,052 48,211
Number of Title II DI Beneficiaries12 15,956 13,144 10,099
FO Employees EOY 201113 46 37 29
Average FO Employees 2010 to 201114 48 37 31
FO Staff Average Years of Service 201113 13 15 17
FO Staff Average Salary 201113 $68,085 $68,507 $72,620
* Includes one FO that closed during Calendar Year 2012.

Field Office Performance (A-15-12-11290) E-11
Notes to all tables in this appendix
General – Unless otherwise noted above, amounts are for FY 2011.
1. Workload Count information was obtained from the District Office Workload Report (DOWR).
2. Total Cleared Claims represents the sum of Title II OASI, DI, and Title XVI SSI D/B Cleared Claims.
3. Total Other Services represents the sum of Status Changes and Benefit Verifications, and Enumerations.
4. Total Workload Counts represents the sum of Total Cleared Claims and Total Other Services Cleared.
5. Processing Time information was obtained from Management Information (MI) Central Processing Time Reports. We used FO processing time only in our calculations (instead of Overall processing time) so that a FOs was not affected by offices outside of its control (DDS, PSC, etc.).
6. Title II RSHI Timeliness Percent represents RSHI claims that meet timeliness criteria as a percentage of all RSHI claims included in timeliness counts. For example, in Table E–1 the Top Office in our 1,177 FO population processed 94.4% of its Title II RSHI claims timely.
7. The unit for these processing times is days. For example, in Table E–1 the Top Office in our 1,177 FO population, processed Title II DI claims in 7.3 days.
8. Visitor count information was provided by OPSOS and obtained from the Customer Service Record (CSR) Operational Data Store (ODS).
9. Visitor wait time information was obtained from the MI Central CSR.
10. Population and Median Household Income information by FO was obtained from a Geospatial Report prepared by the Office of Electronic Services (OES) based on 2010 Census data.
11. We computed the Population per Average FO employee by dividing the 2010 Population by Average FO Employees FY 2010 to 2011.
12. The number of Title II beneficiaries and Title XVI recipients was obtained from the Agency's Recipient in Force/Beneficiary in Force quarterly report as of September 2011.
13. Employee counts, average years of service and average salary by FO were provided by OPSOS.
14. We computed the average number of FO employees based on employee count information provided by OPSOS as of the end of FYs 2010 and 2011.

Field Office Performance (A-15-12-11290) F-1
– AGENCY COMMENTS Appendix F
SOCIAL SECURITY
MEMORANDUM
Date: September 30, 2013 Refer To: S1J-3
To: Patrick P. O’Carroll, Jr. Inspector General From: Kate Thornton /s/ Deputy Chief of Staff Subject: Office of the Inspector General Draft Report, “Field Office Performance” (A-15-12-11290) —
INFORMATION
Thank you for the opportunity to review the draft report. Please see our attached comments.
Please let me know if we can be of further assistance. You may direct staff inquiries to
Gary S. Hatcher at (410) 965-0680.
Attachment

Field Office Performance (A-15-12-11290) F-2
COMMENTS ON THE OFFICE OF THE INSPECTOR GENERAL DRAFT REPORT, "FIELD OFFICE PERFORMANCE" (A-15-12-11290)
As we noted throughout this review, we are concerned with any suggestion of nationally ranking field offices based on “performance.” You do not clearly define “performance” in your report, but you appear to base it on volume and speed of work produced. The fact that you deemed larger offices as “higher performing” suggests that you defined high performance as a function of size and volume when there are many other factors involved. Instituting a national ranking approach would be counterproductive to the environment that we work to develop. In an era of staffing losses, without adequate replacement hires, we need to assess our resources and the capacity to perform work globally. Physical location and office size should not be factors when comparing performance. We do agree that managers, particularly new managers, should have an agreed upon primary source for workload tracking and performance reporting.
Recommendation 1
Identify the most accurate, complete, and reliable data source(s) for Agency workload count and processing time data, and ensure that all Agency components are using the same source(s) for reporting purposes.
Response
We agree. In fiscal year 2014, we will use the Management Information National Indicators (MINI) report, which is a web-based application that tracks Public Service Indicators (PSI). The MINI report sets performance expectations and defines our collective operational priorities. The MINI will be the official report for tracking PSIs and, therefore, performance.
Recommendation 2
Develop a methodology for measuring and monitoring nationwide field office performance to ensure accurate, consistent, and timely customer service.
Response
We agree. We will use the MINI report referenced above to assist us in ensuring accurate, consistent, and timely customer service.

Field Office Performance (A-15-12-11290) G-1
– MAJOR CONTRIBUTORS Appendix G
Victoria Vetter, Director
Judith Kammer, Manager
Lori Lee, Senior Auditor
Ron Anderson, Senior Auditor
Brennan Kraje, Statistician

MISSION
By conducting independent and objective audits, evaluations, and investigations, the Office of the Inspector General (OIG) inspires public confidence in the integrity and security of the Social Security Administration’s (SSA) programs and operations and protects them against fraud, waste, and abuse. We provide timely, useful, and reliable information and advice to Administration officials, Congress, and the public.
CONNECT WITH US
The OIG Website (http://oig.ssa.gov/) gives you access to a wealth of information about OIG. On our Website, you can report fraud as well as find the following.
· OIG news
· audit reports
· investigative summaries
· Semiannual Reports to Congress
· fraud advisories
· press releases
· congressional testimony
· an interactive blog, “Beyond The Numbers” where we welcome your comments
In addition, we provide these avenues of communication through our social media channels.
Watch us on YouTube
Like us on Facebook
Follow us on Twitter
Subscribe to our RSS feeds or email updates
OBTAIN COPIES OF AUDIT REPORTS
To obtain copies of our reports, visit our Website at http://oig.ssa.gov/audits-and-investigations/audit-reports/all. For notification of newly released reports, sign up for e-updates at http://oig.ssa.gov/e-updates.
REPORT FRAUD, WASTE, AND ABUSE
To report fraud, waste, and abuse, contact the Office of the Inspector General via
Website: http://oig.ssa.gov/report-fraud-waste-or-abuse
Mail: Social Security Fraud Hotline P.O. Box 17785 Baltimore, Maryland 21235
FAX: 410-597-0118
Telephone: 1-800-269-0271 from 10:00 a.m. to 4:00 p.m. Eastern Standard Time
TTY: 1-866-501-2101 for the deaf or hard of hearing