field intensity
DESCRIPTION
field intensity magneticTRANSCRIPT
FIELD INTENSITY AND SIGNAL LEVEL
It is important to understand the relationship between field intensity and the signal level at the input to a receiver or other monitoring device. For example, pager sensitivity is usually expressed in terms of microvolts per meter (μV/m) or decibels referenced to 1μV/m (dBu). Field strength contours are often expressed in dBu or μV/m. But what does it mean in terms of actual signal level at the receiver input, that is, in terms of microvolts or dBm in 50Ω?
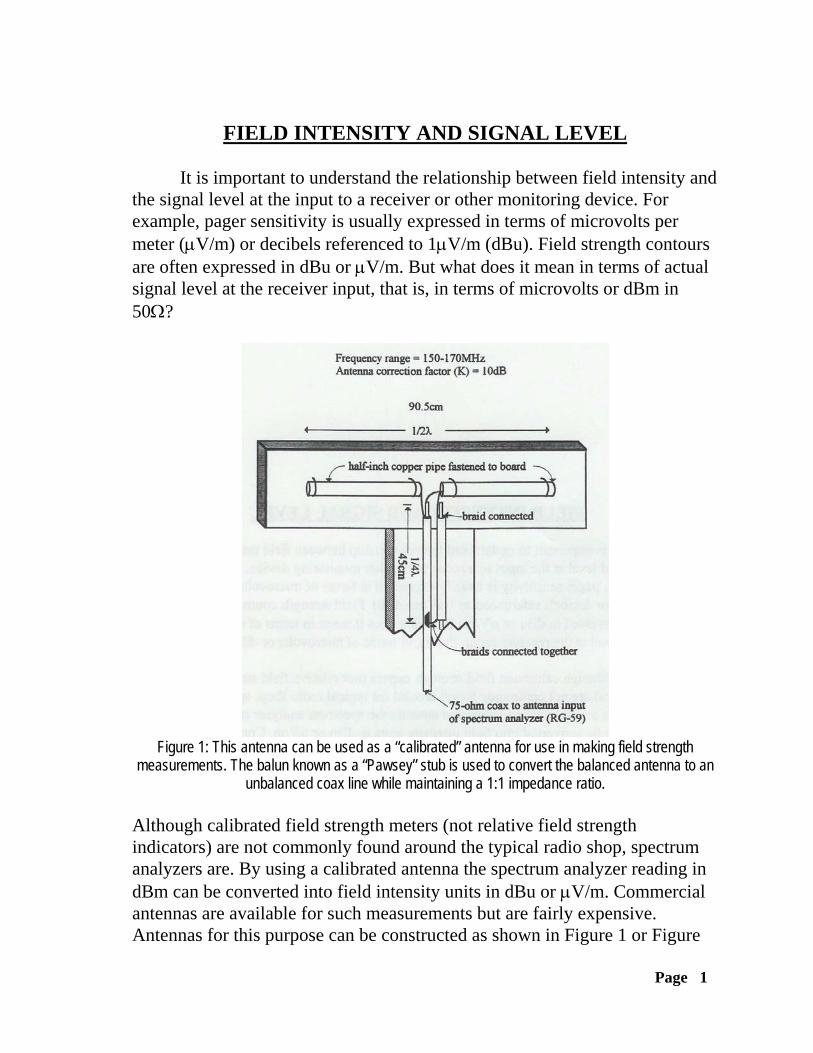
Figure 1: This antenna can be used as a “calibrated” antenna for use in making field strength
measurements. The balun known as a “Pawsey” stub is used to convert the balanced antenna to an unbalanced coax line while maintaining a 1:1 impedance ratio.
Although calibrated field strength meters (not relative field strength indicators) are not commonly found around the typical radio shop, spectrum analyzers are. By using a calibrated antenna the spectrum analyzer reading in dBm can be converted into field intensity units in dBu or μV/m. Commercial antennas are available for such measurements but are fairly expensive. Antennas for this purpose can be constructed as shown in Figure 1 or Figure
Page 1
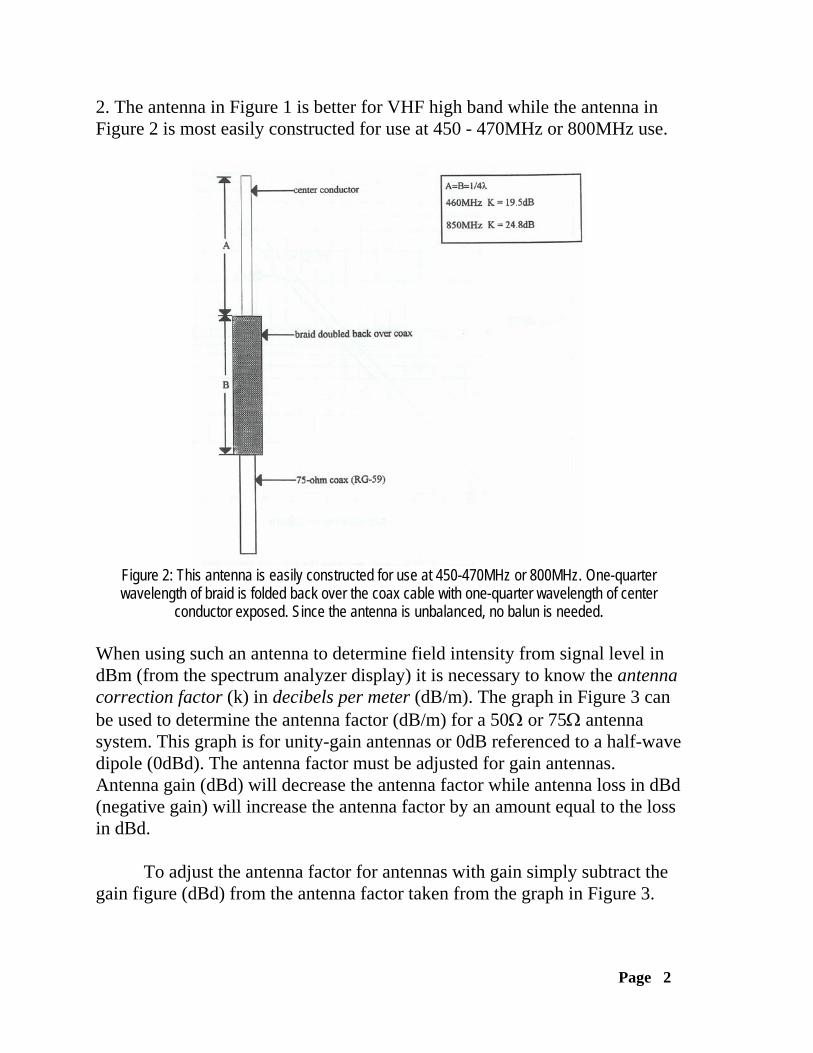
2. The antenna in Figure 1 is better for VHF high band while the antenna in Figure 2 is most easily constructed for use at 450 - 470MHz or 800MHz use.
Figure 2: This antenna is easily constructed for use at 450-470MHz or 800MHz. One-quarter wavelength of braid is folded back over the coax cable with one-quarter wavelength of center
conductor exposed. Since the antenna is unbalanced, no balun is needed. When using such an antenna to determine field intensity from signal level in dBm (from the spectrum analyzer display) it is necessary to know the antenna correction factor (k) in decibels per meter (dB/m). The graph in Figure 3 can be used to determine the antenna factor (dB/m) for a 50Ω or 75Ω antenna system. This graph is for unity-gain antennas or 0dB referenced to a half-wave dipole (0dBd). The antenna factor must be adjusted for gain antennas. Antenna gain (dBd) will decrease the antenna factor while antenna loss in dBd (negative gain) will increase the antenna factor by an amount equal to the loss in dBd. To adjust the antenna factor for antennas with gain simply subtract the gain figure (dBd) from the antenna factor taken from the graph in Figure 3.
Page 2
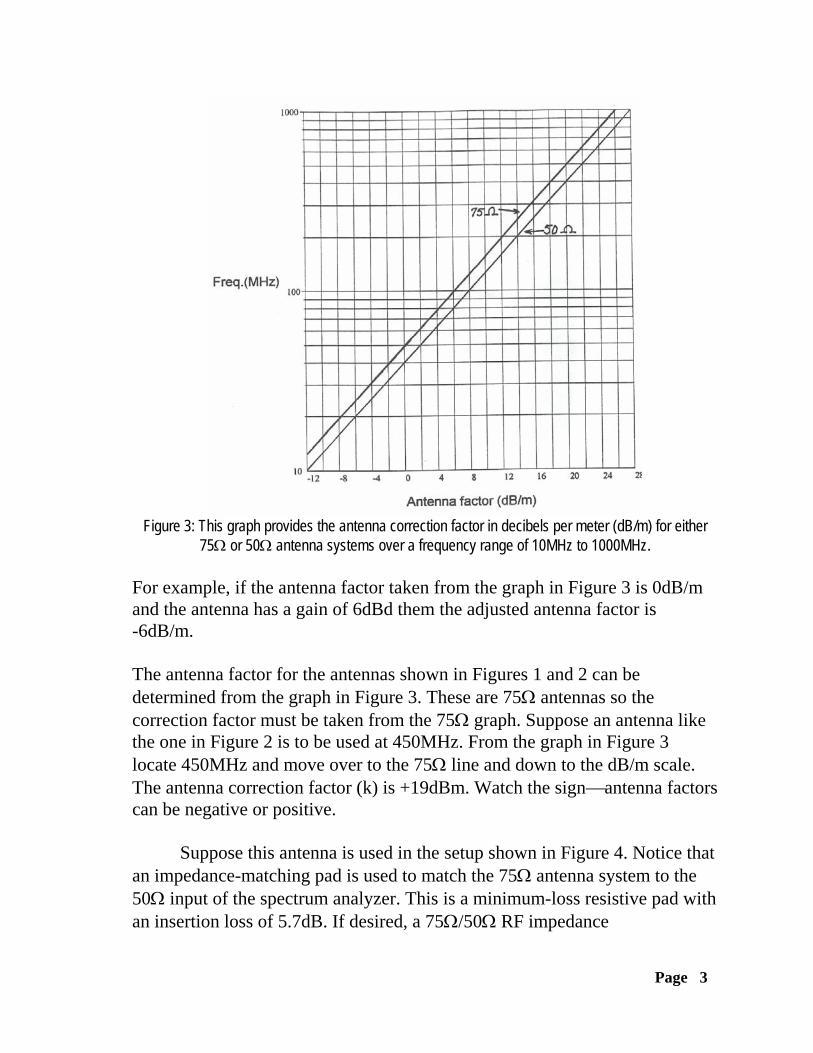
Figure 3: This graph provides the antenna correction factor in decibels per meter (dB/m) for either
75Ω or 50Ω antenna systems over a frequency range of 10MHz to 1000MHz. For example, if the antenna factor taken from the graph in Figure 3 is 0dB/m and the antenna has a gain of 6dBd them the adjusted antenna factor is -6dB/m. The antenna factor for the antennas shown in Figures 1 and 2 can be determined from the graph in Figure 3. These are 75Ω antennas so the correction factor must be taken from the 75Ω graph. Suppose an antenna like the one in Figure 2 is to be used at 450MHz. From the graph in Figure 3 locate 450MHz and move over to the 75Ω line and down to the dB/m scale. The antenna correction factor (k) is +19dBm. Watch the sign⎯antenna factors can be negative or positive. Suppose this antenna is used in the setup shown in Figure 4. Notice that an impedance-matching pad is used to match the 75Ω antenna system to the 50Ω input of the spectrum analyzer. This is a minimum-loss resistive pad with an insertion loss of 5.7dB. If desired, a 75Ω/50Ω RF impedance
Page 3
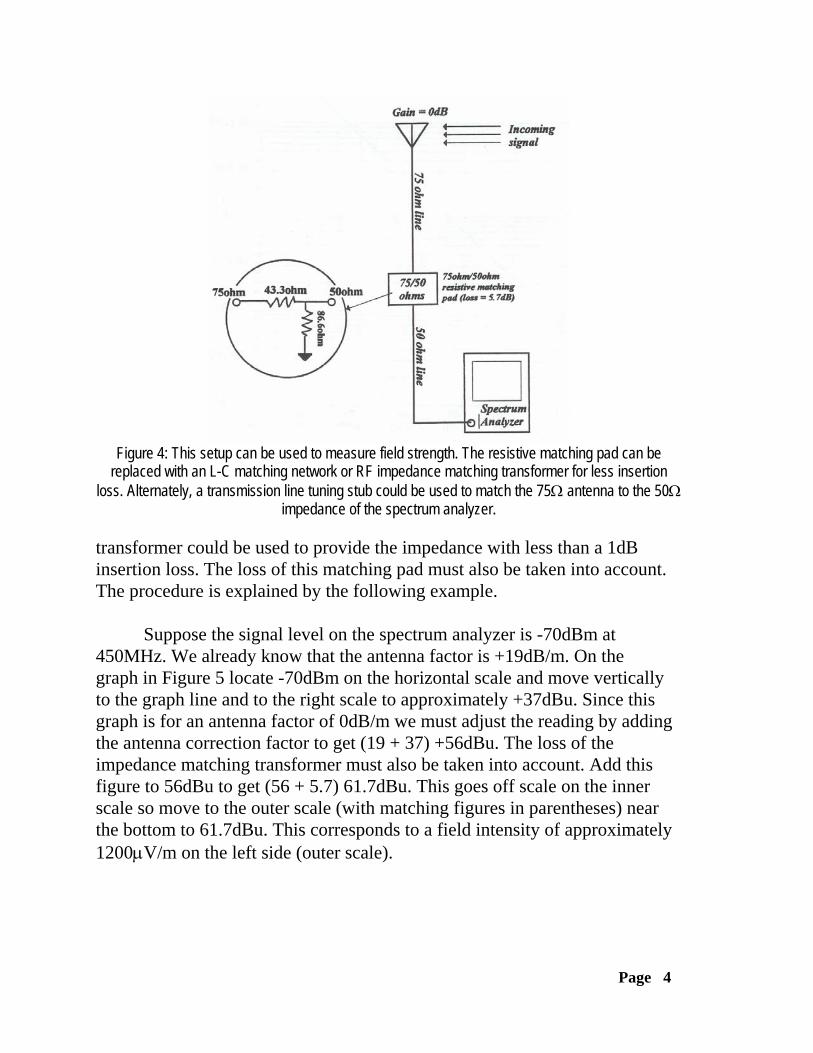
Figure 4: This setup can be used to measure field strength. The resistive matching pad can be
replaced with an L-C matching network or RF impedance matching transformer for less insertion loss. Alternately, a transmission line tuning stub could be used to match the 75Ω antenna to the 50Ω
impedance of the spectrum analyzer.
transformer could be used to provide the impedance with less than a 1dB insertion loss. The loss of this matching pad must also be taken into account. The procedure is explained by the following example. Suppose the signal level on the spectrum analyzer is -70dBm at 450MHz. We already know that the antenna factor is +19dB/m. On the graph in Figure 5 locate -70dBm on the horizontal scale and move vertically to the graph line and to the right scale to approximately +37dBu. Since this graph is for an antenna factor of 0dB/m we must adjust the reading by adding the antenna correction factor to get (19 + 37) +56dBu. The loss of the impedance matching transformer must also be taken into account. Add this figure to 56dBu to get (56 + 5.7) 61.7dBu. This goes off scale on the inner scale so move to the outer scale (with matching figures in parentheses) near the bottom to 61.7dBu. This corresponds to a field intensity of approximately 1200μV/m on the left side (outer scale).
Page 4
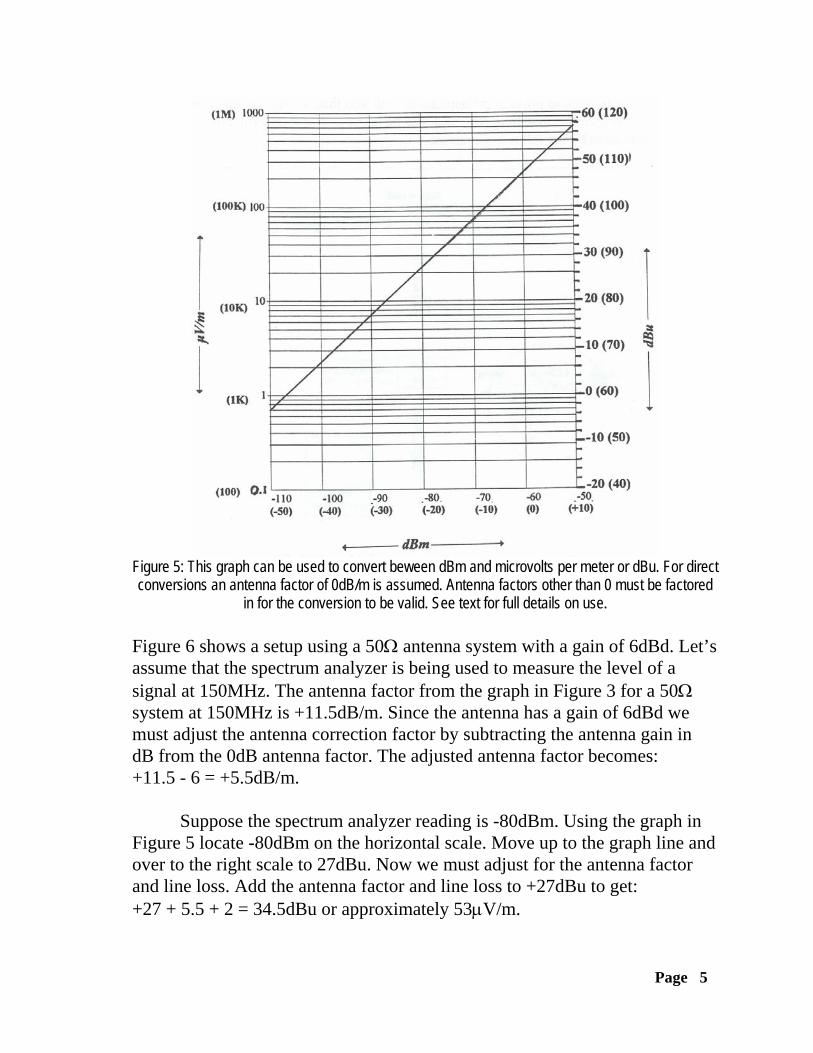
Figure 5: This graph can be used to convert beween dBm and microvolts per meter or dBu. For direct conversions an antenna factor of 0dB/m is assumed. Antenna factors other than 0 must be factored
in for the conversion to be valid. See text for full details on use. Figure 6 shows a setup using a 50Ω antenna system with a gain of 6dBd. Let’s assume that the spectrum analyzer is being used to measure the level of a signal at 150MHz. The antenna factor from the graph in Figure 3 for a 50Ω system at 150MHz is +11.5dB/m. Since the antenna has a gain of 6dBd we must adjust the antenna correction factor by subtracting the antenna gain in dB from the 0dB antenna factor. The adjusted antenna factor becomes: +11.5 - 6 = +5.5dB/m. Suppose the spectrum analyzer reading is -80dBm. Using the graph in Figure 5 locate -80dBm on the horizontal scale. Move up to the graph line and over to the right scale to 27dBu. Now we must adjust for the antenna factor and line loss. Add the antenna factor and line loss to +27dBu to get: +27 + 5.5 + 2 = 34.5dBu or approximately 53μV/m.
Page 5

Figure 6: A 50Ω antenna with a gain of 6dB is connected to the 50Ω input of a spectrum analyzer in
order to make signal strength measurements. The graph in Figure 5 can be used to convert from signal level at the receiver input to field intensity at the antenna or the reverse⎯field intensity at the antenna to signal level at the receiver input. In fact, the graph in Figure 5 has multiple uses. Some examples will illustrate the many uses. The specification states that the 20dB quieting sensitivity of a pager is 25μV/m in terms of field intensity or 0.5μV at the receiver RF input jack. The frequency is 150MHz. Since pager antennas are located inside the small unit they are necessarily very lossy. Compared to a half-wave dipole a pager antenna might have a gain of -25dBd or so. (Any way you look at it, a negative gain is a loss!) We don’t know the gain of the pager antenna compared to a half-wave dipole but we can determine this from the graph in Figure 5. The ratio of the required field intensity (μV/m) to the required signal level at the receiver input for 20dB quieting is 25μV/m to 0.5μV or 50:1. On the graph (Figure 5) locate 50 on the left side and move over to the dBu scale to approximately +34dBu. From Figure 3 the antenna factor for a 0dBd gain antenna at 150MHz (50Ω) is +11.5dB/m. Now, subtract the +34dBu reading from the antenna factor to yield: +11.5 - 34 = -22dB. This is the gain of the pager antenna in dBd.
Page 6

Remember, a negative gain is a loss and so the pager antenna has a loss of 22.5dB compared to a half-wave dipole. We might say that the pager antenna has a “handicap” of 22.5dB. Here is another example. Suppose that a receiver operating at 450MHz is connected to an antenna with a gain of 6dBd. The field intensity at the antenna is 10μV/m. The line loss is 2dB and the system impedance is 50Ω throughout. What is the signal level at the receiver input in dBm? First, find the antenna factor from Figure 3. At 450MHz the antenna factor is +21dB/m. The gain of the antenna (6dBd) must be subtracted to give an adjusted antenna factor of 21 - 6 = 15dB/m. Next, on the graph of Figure 5 locate 10μV/m on the left vertical scale and move over to +20dBu on the right vertical scale. Now, subtract the antenna factor and line loss to yield: 20 - 15 - 2 = 3dBu or approximately 1.42μV. To obtain the signal level in dBm move over to the graph line and down to the horizontal scale at approximately -104dBm. Thus, the scales can be used to convert between dBm and microvolts very easily. For example, 10μV = -87dBm. The scales can also be used to convert voltage ratios to decibels or vice versa. Suppose you want to convert a voltage ratio of 7:1 to decibels. Simply locate 7 on the μV/m scale and move over to the dBu scale to approximately 17. You can also convert decibels to voltage ratios by doing the reverse. Find the decibel figure on the dBu scale and move over to the μV/m scale to find the equivalent voltage ratio. For example, 20dB corresponds to a voltage ratio of 10:1. It is also very easy to find levels such as 15dB above 3μV. Locate 3 on the μV/m scale and move over to 9.5 on the dBu scale. Then move up 15dB to 24.5dBu and back over to approximately 17μV. Remember, when converting from field intensity units (dBu) to signal level units (dBm) subtract the antenna factor. Also, subtract any loss (line loss, etc.) between the antenna and receiver input. When converting from signal level units (dBm) to field intensity units (dBu) add the antenna factor and add any loss in dB between the antenna and receiver input. Be sure to do the adding and subtracting algebraically (observe
Page 7

signs). The accompanying formulas should cover about any conversion you will ever need to make concerning signal level and field intensity. The most frequently used of these formulas are included in the software package.
SIGNAL & FIELD STRENGTH CONVERSIONS
μμ
V antiV m G F LR=
+ − + −⎡⎣⎢
⎤⎦⎥
loglog( / ) log20 20 32
20 [1]
μμ
V m antiV G F LR/ log
log( ) log=
− + − +⎡⎣⎢
⎤⎦⎥
20 20 3220
[2]
μV antidBu G F LR=
+ − + −⎡⎣⎢
⎤⎦⎥
loglog20 32
20 [3]
dBu V G F LR= − + − +20 20 32log( ) logμ [4] dB V V m G F LRμ μ= + − + −20 20 32log( / ) log [5]
μμ
V m antidB V G F LR/ log
log=
− + − +⎡⎣⎢
⎤⎦⎥
20 3220
[6]
dB V dBu G F LRμ = + − + −20 32log [7] dBu dB V G F LR= − + − +μ 20 32log [8] dBm V m G F LR= + − − −20 20 75log( / ) logμ [9]
μV m antidBm G F LR/ log
log=
− + + +⎡⎣⎢
⎤⎦⎥
20 7520
[10]
Page 8

μ μV V mF
= ⎡⎣⎢
⎤⎦⎥
40( / ) for unity-gain antenna (0dBd) [11]
μ μV m V F/ ( )= ⎡⎣⎢
⎤⎦⎥40
for unity-gain antenna (0dBd) [12]
dBm V= 20 107log( ) −μ [13]
μV anti dBm=
+⎡⎣⎢
⎤⎦⎥
log 10720
[14]
dBW V m G F LR= + − − +20 20 105log( / ) logμ [15]
μV m antidBW G F LR/ log
log=
− + + +⎡⎣⎢
⎤⎦⎥
20 10520
[16]
dBm dB V= −μ 107 [17] dB V dBmμ = + 107 [18] dB V Vμ μ= 20log( ) [19]
μ μV anti dB V= ⎡
⎣⎢⎤⎦⎥
log20
[20]
dBu V m= 20log( / )μ [21]
μV m anti dBu/ log= ⎡⎣⎢
⎤⎦⎥20
[22]
Page 9
dBW V= 20 137log( ) −μ [23]
μV anti dBW=
+⎡⎣⎢
⎤⎦⎥
log 13720
[24]
dB V dBWμ = + 137 [25] dBW dB V= −μ 137 [26] dBm dBW= + 30 [27] dBW dBm= − 30 [28]
E anti dBR = ⎡
⎣⎢⎤⎦⎥
log20
[29]
P anti dBR = ⎡
⎣⎢⎤⎦⎥
log10
[30]
μV m anti dBm K L/ log=+ + +⎡
⎣⎢⎤⎦⎥
10720
[31]
dBm V m K L= − −20 107log( / ) −μ [32] dBu dBm G F LR= − + + +20 75log [33] dBm dBu G F LR= + − − −20 75log [34] K F GR= − −20 32log (for 50Ω antenna system) [35]
Page 10
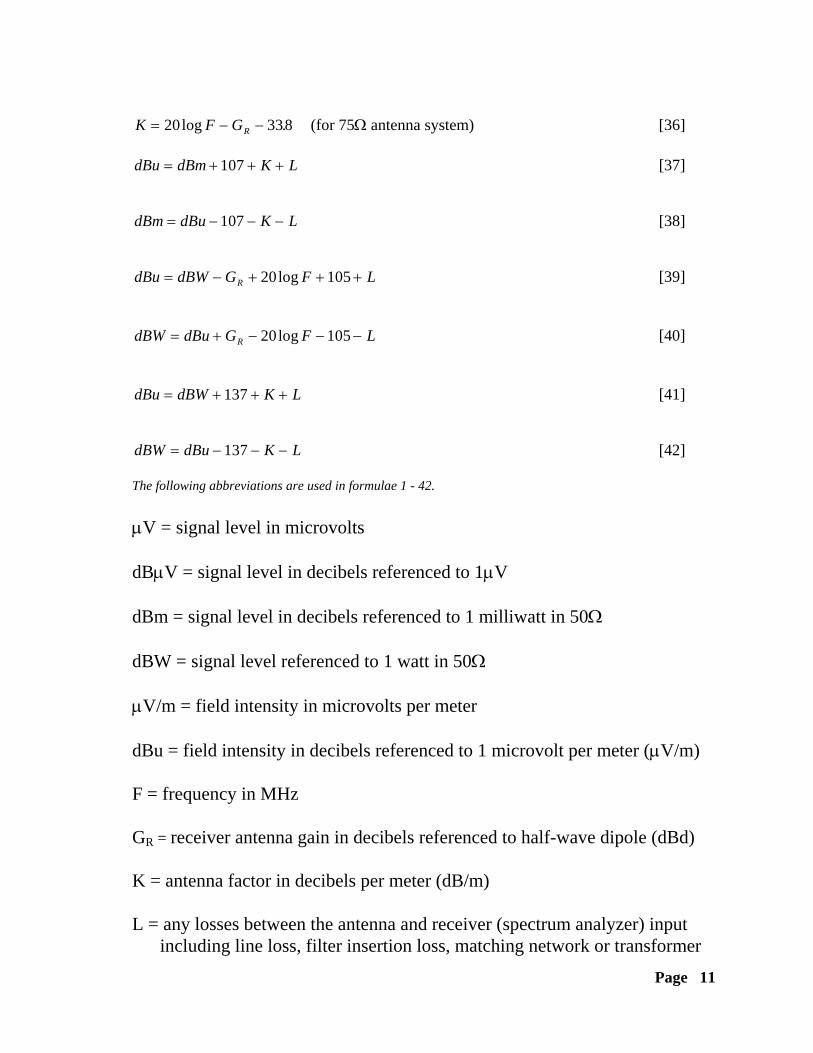
K F GR= − −20 338log . (for 75Ω antenna system) [36] dBu dBm K L= + + +107 [37] dBm dBu K L= − − −107 [38] dBu dBW G F LR= − + + +20 105log [39] dBW dBu G F LR= + − − −20 105log [40] dBu dBW K L= + + +137 [41] dBW dBu K L= − − −137 [42] The following abbreviations are used in formulae 1 - 42. μV = signal level in microvolts dBμV = signal level in decibels referenced to 1μV dBm = signal level in decibels referenced to 1 milliwatt in 50Ω dBW = signal level referenced to 1 watt in 50Ω μV/m = field intensity in microvolts per meter dBu = field intensity in decibels referenced to 1 microvolt per meter (μV/m) F = frequency in MHz GR = receiver antenna gain in decibels referenced to half-wave dipole (dBd) K = antenna factor in decibels per meter (dB/m) L = any losses between the antenna and receiver (spectrum analyzer) input including line loss, filter insertion loss, matching network or transformer
Page 11
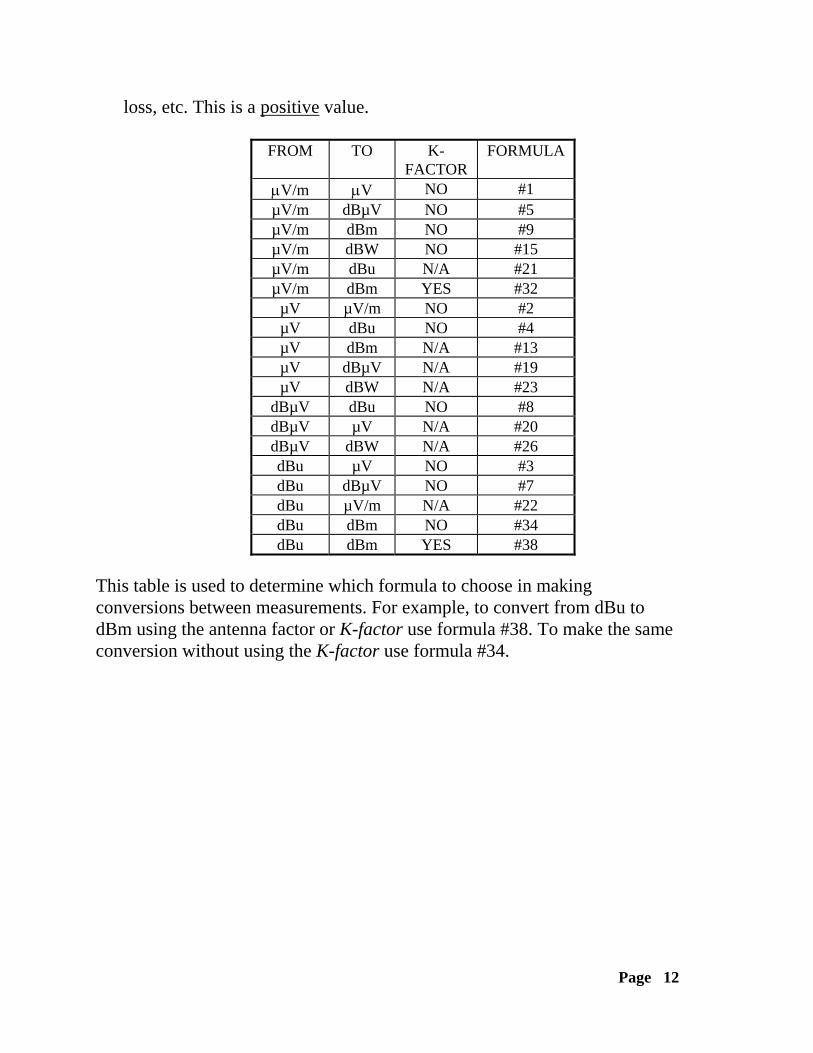
loss, etc. This is a positive value.
FROM TO K-FACTOR
FORMULA
μV/m μV NO #1 µV/m dBµV NO #5 µV/m dBm NO #9 µV/m dBW NO #15 µV/m dBu N/A #21 µV/m dBm YES #32
µV µV/m NO #2 µV dBu NO #4 µV dBm N/A #13 µV dBµV N/A #19 µV dBW N/A #23
dBµV dBu NO #8 dBµV µV N/A #20 dBµV dBW N/A #26 dBu µV NO #3 dBu dBµV NO #7 dBu µV/m N/A #22 dBu dBm NO #34 dBu dBm YES #38
This table is used to determine which formula to choose in making conversions between measurements. For example, to convert from dBu to dBm using the antenna factor or K-factor use formula #38. To make the same conversion without using the K-factor use formula #34.
Page 12