field electron emission properties of vertically aligned ...absuriani.my/journals/paper elsevier...
TRANSCRIPT

Microelectronic Engineering 108 (2013) 86–92
Contents lists available at SciVerse ScienceDirect
Microelectronic Engineering
journal homepage: www.elsevier .com/locate /mee
Field electron emission properties of vertically aligned carbon nanotubesdeposited on a nanostructured porous silicon template: The hidden roleof the hydrocarbon/catalyst ratio
N.A. Asli a,b,⇑, M.S. Shamsudin a,b,d, A.N. Falina e, M.S. Azmina e, A.B. Suriani e, M. Rusop a,c, S. Abdullah a,b
a Centre of Nanoscience and Nanotechnology (NANO-SciTech Centre), Institute of Science, Universiti Teknologi MARA, 40450 Shah Alam, Selangor D.E., Malaysiab School of Physics and Material Studies, Faculty of Applied Sciences, Universiti Teknologi MARA, 40450 Shah Alam, Selangor D.E., Malaysiac NANO-Electronic Centre, Faculty of Electrical Engineering, Universiti Teknologi MARA, 40450 Shah Alam, Selangor D.E., Malaysiad University of Southampton Malaysia Campus (USMC), No. 3, Persiaran Canselor 1, Kota Ilmu Educity@Iskandar, 79200 Nusajaya, Johor D.T., Malaysiae Department of Physics, Faculty of Science and Mathematics, Universiti Pendidikan Sultan Idris, 35900 Tanjung Malim, Perak D.R., Malaysia
a r t i c l e i n f o
Article history:Available online 14 March 2013
Keywords:Porous siliconCarbon nanotubesCatalyst ratioField emissionBotanical hydrocarbon
0167-9317/$ - see front matter � 2013 Elsevier B.V. Ahttp://dx.doi.org/10.1016/j.mee.2013.02.095
⇑ Corresponding author at: Centre of NanoscienceSciTech Centre), Institute of Science, Universiti TeknolSelangor D.E., Malaysia. Tel.: +60 172527436.
E-mail address: [email protected] (N.A. Asli).
a b s t r a c t
We report the observation of the field electron emission (FEE) of vertically aligned carbon nanotubes(VACNT) arrays grown on a nanostructured porous silicon template (NPSiT). VACNT were synthesisedby a simple method using modified floated carbon source-catalyst in a two-stage hot filament thermalchemical vapour deposition system. Ferrocene was used as a catalyst in varying amounts from 0.3 to0.8 g. An optimised NPSiT was used during the synthesis of VACNT. The surface morphology, latticedefects and graphitic structure of VACNT were analysed using a field emission scanning electron micro-scope and a high-resolution transmission electron microscope. The FEE performance of VACNT as syn-thesised is significantly affected by the hydrocarbon/catalyst ratio. The turn-on field required toextract a current density of 0.01 mA m�2 was 2.80 V lm�1. The threshold field corresponding to a currentdensity of 0.1 mA m�2 was 3.30 V lm�1. The maximum current density of 1.2 mA m�2 was detected froma sample exhibiting optimum growth conditions. The emission stability and field enhancement factor bare also discussed in this paper.
� 2013 Elsevier B.V. All rights reserved.
1. Introduction
From theoretical and experimental studies, we know that car-bon nanotubes (CNT) are an extraordinary material. CNT are com-monly described as a sheet of graphene rolled into a seamlesscylinder with a high aspect ratio. Since the landmark paper by Iij-ima that reported trials of a novel 1-dimensional (1-D) carbonnanostructure in the early 1990s [1], carbon nanotubes have at-tracted scientists, the business community and even the generalpublic. Numerous studies have shown that CNT possess manyextraordinary chemical, physical, electronic, and thermal proper-ties [2–4]. Consequently, CNT have been proposed for use in manypotential commercial applications including as electron field emit-ters [5,6], additives in lubricant [7,8], gas storage media [9,10] andmany other fields. These applications have been pursued vigor-ously [11,12]. In next-generation display technology, CNT may beused as bright elements to produce perfect visual displays, such
ll rights reserved.
and Nanotechnology (NANO-ogi MARA, 40450 Shah Alam,
as high-definition flat panel displays, flexible-thin-paper displaysand others.
A tremendous effort has been made to control the structure andcharacteristics of CNT by adjusting parameters such as their carbonprecursors [13,14], the methods and apparatus used for their gen-eration [15,16], the selection of a catalyst support [17,18], carbonand gas feeding rates [19,20] and other factors [21,22]. From thepoint of view of applications, a method to simply synthesisewell-ordered arrays of VACNT is highly desirable. Chemical vapourdeposition (CVD) methods (under certain conditions) are capableof producing better vertically aligned carbon nanotubes (VACNT)than other methods of nanotube production such as arc dischargeand laser ablation [23]. It has been suggested that VACNT are easierto obtain when bottom growth occurs during the growth reaction,although VACNT can also be grown through a tip growth mecha-nism. VACNT consisting of very dense and closely packed CNT growupwards, away from the substrate surface. This process is knownas self-assembly or oriented growth [23]. In certain applicationssuch as FEE, the synthesis of VACNT on a substrate is required.Growing VACNT with specified fine structure elements, includingdiameter, length, chirality and graphene layers, on a NPSiT is achallenging task. Fundamental questions remain regarding the

Table 1Specification of Si wafer used in this experimentalwork.
Type of Si P-type
Dopant BoronResistivity (X cm) 1–10Crystal orientation h100iDiameter (mm) 100Thickness (lm) 525 ± 25
N.A. Asli et al. / Microelectronic Engineering 108 (2013) 86–92 87
hydrocarbon/catalyst ratio process occurring during growth and itssuitability for FEE applications.
Recently, several groups have reported the successful growth ofVACNT on nanostructured templates. According to previous stud-ies, CNT have the ability to emit cold electrons at relatively lowvoltages due to their controllable properties such as high aspect ra-tios, nanometer tip sizes [24], high density and well-ordered orien-tation [25]. Several groups have reported electron field emissionfrom carbon nanotubes. The first reported field emission (FE) ofelectrons from isolated single multi-walled nanotubes (MWNT)wax by Rinzler et al. [26], who reported the FE when the nanotubetips were opened. This report was followed by Heer et al. [27], whoreported FE from MWNT film. According to Saito et al. [28], CNTpossess the following properties that make them favourable forFEE applications: (i) a high aspect ratio, (ii) sharp tips, (iii) highchemical stability and (iv) high mechanical strength. However,approximately 90% of the CNT literature still reports a lA cm�2 or-der of FE current density, and very few papers report CNT FE above10 mA cm�2 operating in ultrahigh vacuum conditions [29–31]. Inthis paper, we studied vertically aligned carbon nanotubes grownon a nanostructured porous silicon template that emit an FE cur-rent density on the order of mA cm�2 with significant stability overa 3000 s duration.
We systematically investigate the hidden role of the hydrocar-bon/catalyst ratio parameter on VACNT synthesis on an NPSiT. Bytuning the hydrocarbon/catalyst ratio parameter, we have foundoptimised conditions for the growth of VACNT that offer bettercontrol of the following issues: (i) structural properties, (ii) unde-sired impurities, and (iii) uniformity and improved FEE perfor-mance. These findings enhance our understanding of thestructural requirements of VACNT grown on a NPSiT and providefurther information on the properties of FEE, including the poten-tial to operate at low voltages, good emission stability and longeremitter lifetimes. We hope this article will provide guidance for fu-ture research.
2. Experimental methods and materials
2.1. Preparation of the nanostructured porous silicon template (NPSiT)
A detailed description of the preparation of a NPSiT is reportedelsewhere [32,33], and the specifications of the Si wafers used isshown in Table 1. Before beginning our experiments, as a standardprocess, Si templates were prepared by cutting Si wafers to an areaof 20 � 20 mm using a precision diamond cutter. The single-slidepolished Si templates were ultrasonically cleaned in a mixture ofacetone and methanol in a volume ratio of 1:1 for 5 min at 40 �C,and then thoroughly rinsed in de-ionised (DI) water several times.Si templates were kept at room temperature under controlledambient (vacuum) overnight to avoid [34] (i) unwanted chemicalimpurities such as native oxides and (ii) moisture from theenvironment.
The experimental procedure for the formation of a NPSiT hasbeen presented previously. In detail, the NPSiT was constructedthrough a custom-made photo-electrochemical anodisation setup,
as shown in Fig. 1. The electrochemical-based solution (also knownas an electrolyte solution) used in this approach was a mixture ofethanol and concentrated hydrofluoric acid (�48%) with a volumefraction of 1:1. The photo-electrochemical anodisation setup iscomposed of a highly acidic resistant polymer such as Teflon,which is subsequently filled with a prepared electrochemical solu-tion. To facilitate anodisation, (i) aluminium foil (serving as an an-ode) was sealed on the rear side of the Si template to form a goodohmic contact, and (ii) a tungsten electrode (serving as a cathode)was fixed at a 15 mm distance from the front surface of the Si tem-plate. An ‘o-ring’ was placed on the front side of the Si template toensure that only the selected area was exposed to the electrolytesolution. The etching process was assisted by the illumination ofa halogen lamp (120 W) and 20 mA/cm2 of current density for30 min. Finally, the NPSiT was rinsed in DI water and blown drywith nitrogen. As a result, the etched surface of the NPSiT appeared‘yellowish’ and demonstrated visible light emission under UV light.
2.2. Synthesis of vertically aligned carbon nanotubes (VACNT)deposited on a NPSiT
VACNT deposited on a NPSiT were synthesised using a labora-tory-scale method involving a two-stage hot filament thermalchemical vapour deposition (TCVD) system, as illustrated inFig. 2. The experimental setup/configuration of this approach is de-scribed in previous experimental work [35–39]. The samples wereprepared by varying the weight of ferrocene used (obtained fromSigma Aldrich) from 0.3 to 0.8 g, while maintaining the weight ofcamphor oil used at 5 g. The catalyst and the carbon source wereplaced in separate alumina boats and positioned side-by-side infurnace zone-1. The NPSiT was placed in the centre of furnacezone-2. Zone-2 was heated to 800 �C and was left to stabilise for10 min, after which it was purged with nitrogen gas (0.05–1.00 L min�1). Then, zone-1 was heated to 180 �C for the precursorvaporisation process. After zone-1 reached the required tempera-ture, the synthesis process continued for 60 min. Nitrogen gaswas continuously flowed before, during and after synthesis to pre-pare an ambient nitrogen environment. Zone-1 was turned off afterthe synthesis process was complete, and zone-2 was left on for30 min after the annealing process. The samples were removedfor characterisation after the furnaces cooled down to roomtemperature.
2.3. Characterisation process of VACNT deposited on a NPSiT
A field emission scanning electron microscope (FESEM; CarlZeiss SMT 40VP) was employed to examine the morphologicalstructure of VACNT. The graphitic and lattice structures of VACNTwere examined by a high-resolution transmission electron micro-scope (HRTEM; JEOL JEM 2100F). To obtain optimal FEE character-istics, FEE measurements were performed in a parallel-plateelectrode configuration with stainless steel electrodes(10 � 10 mm sample area), with a cathode-to-anode separationdistance of 0.25 mm and in a vacuum environment of 10�4 Torrworking pressure.
3. Results and discussion
Fig. 4 shows typical field emission scanning electron micros-copy (FESEM) top-view images for low and high magnificationsof carbon nanotubes with varying amounts of catalyst. The low-magnification images show uniform growth and vertical alignmentas the amount of ferrocene increases. The relationship between thegrowth rate of VACNT and the amount of ferrocene (Fe) used (from0.3 to 0.8 g with 5 g camphor oil) is shown in Fig. 3. The growth
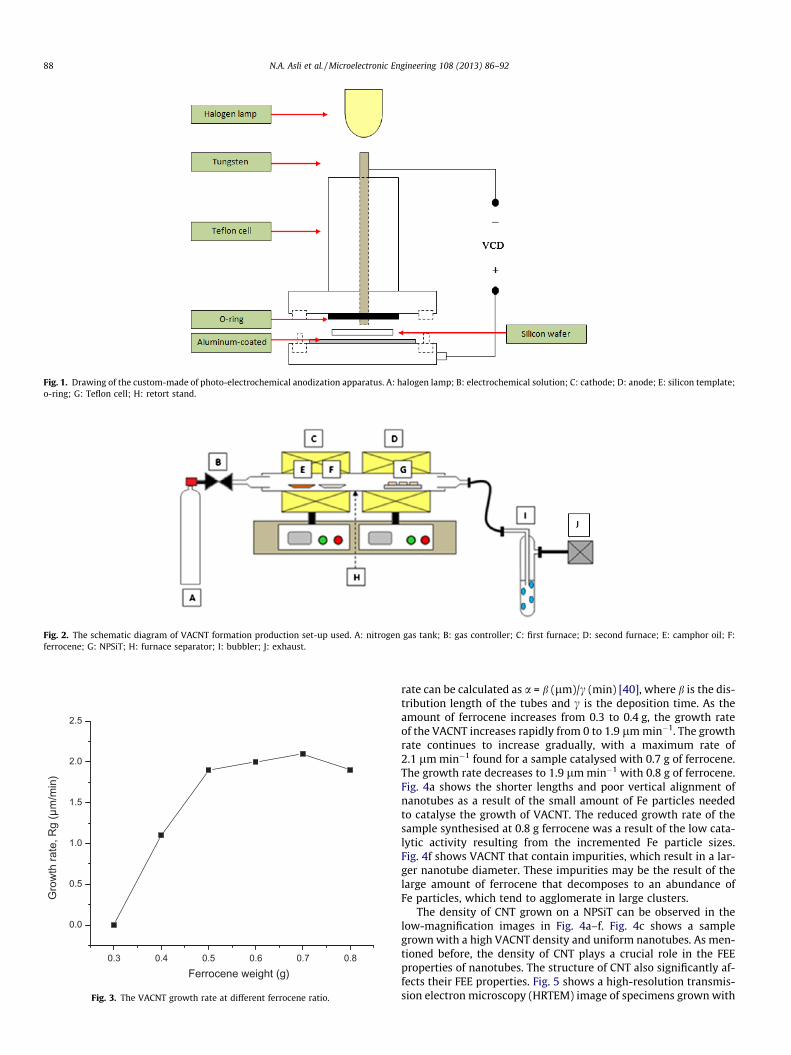
Fig. 1. Drawing of the custom-made of photo-electrochemical anodization apparatus. A: halogen lamp; B: electrochemical solution; C: cathode; D: anode; E: silicon template;o-ring; G: Teflon cell; H: retort stand.
Fig. 2. The schematic diagram of VACNT formation production set-up used. A: nitrogen gas tank; B: gas controller; C: first furnace; D: second furnace; E: camphor oil; F:ferrocene; G: NPSiT; H: furnace separator; I: bubbler; J: exhaust.
0.3 0.4 0.5 0.6 0.7 0.8
0.0
0.5
1.0
1.5
2.0
2.5
Gro
wth
rate
, Rg
(µm
/min
)
Ferrocene weight (g)
Fig. 3. The VACNT growth rate at different ferrocene ratio.
88 N.A. Asli et al. / Microelectronic Engineering 108 (2013) 86–92
rate can be calculated as a = b (lm)/c (min) [40], where b is the dis-tribution length of the tubes and c is the deposition time. As theamount of ferrocene increases from 0.3 to 0.4 g, the growth rateof the VACNT increases rapidly from 0 to 1.9 lm min�1. The growthrate continues to increase gradually, with a maximum rate of2.1 lm min�1 found for a sample catalysed with 0.7 g of ferrocene.The growth rate decreases to 1.9 lm min�1 with 0.8 g of ferrocene.Fig. 4a shows the shorter lengths and poor vertical alignment ofnanotubes as a result of the small amount of Fe particles neededto catalyse the growth of VACNT. The reduced growth rate of thesample synthesised at 0.8 g ferrocene was a result of the low cata-lytic activity resulting from the incremented Fe particle sizes.Fig. 4f shows VACNT that contain impurities, which result in a lar-ger nanotube diameter. These impurities may be the result of thelarge amount of ferrocene that decomposes to an abundance ofFe particles, which tend to agglomerate in large clusters.
The density of CNT grown on a NPSiT can be observed in thelow-magnification images in Fig. 4a–f. Fig. 4c shows a samplegrown with a high VACNT density and uniform nanotubes. As men-tioned before, the density of CNT plays a crucial role in the FEEproperties of nanotubes. The structure of CNT also significantly af-fects their FEE properties. Fig. 5 shows a high-resolution transmis-sion electron microscopy (HRTEM) image of specimens grown with
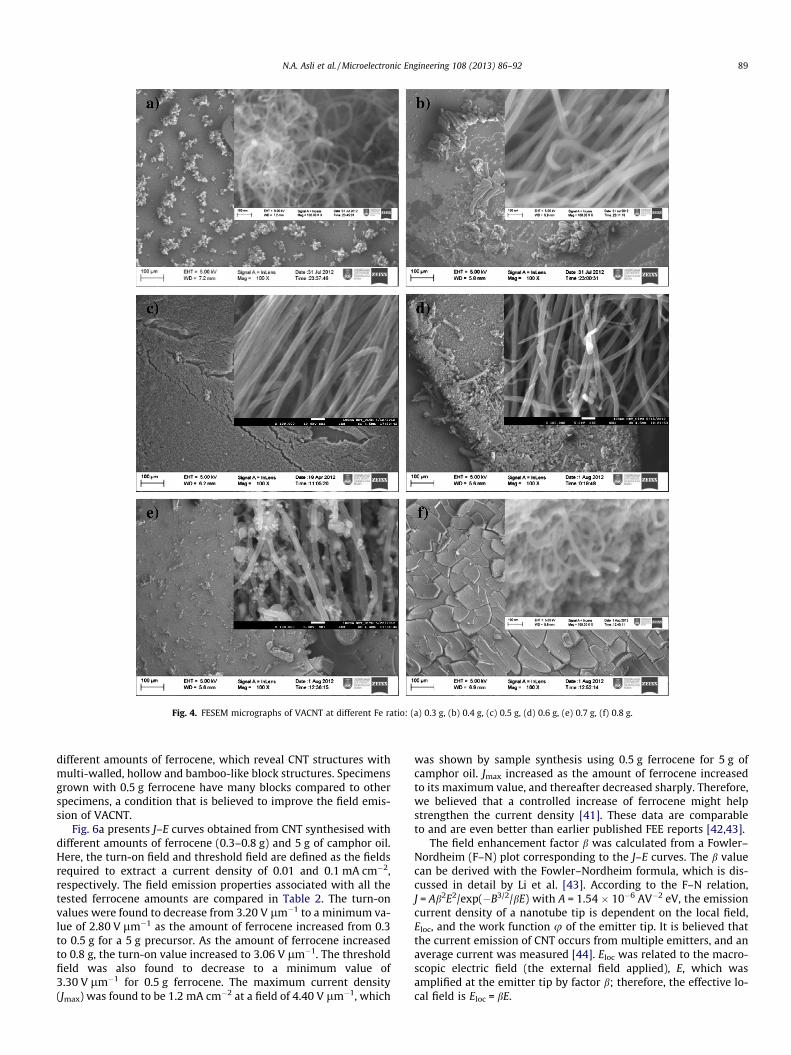
Fig. 4. FESEM micrographs of VACNT at different Fe ratio: (a) 0.3 g, (b) 0.4 g, (c) 0.5 g, (d) 0.6 g, (e) 0.7 g, (f) 0.8 g.
N.A. Asli et al. / Microelectronic Engineering 108 (2013) 86–92 89
different amounts of ferrocene, which reveal CNT structures withmulti-walled, hollow and bamboo-like block structures. Specimensgrown with 0.5 g ferrocene have many blocks compared to otherspecimens, a condition that is believed to improve the field emis-sion of VACNT.
Fig. 6a presents J–E curves obtained from CNT synthesised withdifferent amounts of ferrocene (0.3–0.8 g) and 5 g of camphor oil.Here, the turn-on field and threshold field are defined as the fieldsrequired to extract a current density of 0.01 and 0.1 mA cm�2,respectively. The field emission properties associated with all thetested ferrocene amounts are compared in Table 2. The turn-onvalues were found to decrease from 3.20 V lm�1 to a minimum va-lue of 2.80 V lm�1 as the amount of ferrocene increased from 0.3to 0.5 g for a 5 g precursor. As the amount of ferrocene increasedto 0.8 g, the turn-on value increased to 3.06 V lm�1. The thresholdfield was also found to decrease to a minimum value of3.30 V lm�1 for 0.5 g ferrocene. The maximum current density(Jmax) was found to be 1.2 mA cm�2 at a field of 4.40 V lm�1, which
was shown by sample synthesis using 0.5 g ferrocene for 5 g ofcamphor oil. Jmax increased as the amount of ferrocene increasedto its maximum value, and thereafter decreased sharply. Therefore,we believed that a controlled increase of ferrocene might helpstrengthen the current density [41]. These data are comparableto and are even better than earlier published FEE reports [42,43].
The field enhancement factor b was calculated from a Fowler–Nordheim (F–N) plot corresponding to the J–E curves. The b valuecan be derived with the Fowler–Nordheim formula, which is dis-cussed in detail by Li et al. [43]. According to the F–N relation,J = Ab2E2/exp(�B3/2/bE) with A = 1.54 � 10�6 AV�2 eV, the emissioncurrent density of a nanotube tip is dependent on the local field,Eloc, and the work function u of the emitter tip. It is believed thatthe current emission of CNT occurs from multiple emitters, and anaverage current was measured [44]. Eloc was related to the macro-scopic electric field (the external field applied), E, which wasamplified at the emitter tip by factor b; therefore, the effective lo-cal field is Eloc = bE.

Fig. 5. HRTEM image showing a detailed of multiwalled and bamboo-like structure of carbon nanotubes field emitters at different Fe ratio: (a) 0.3 g, (b) 0.4 g, (c) 0.5 g, (d)0.6 g, (e) 0.7 g, (f) 0.8 g.
90 N.A. Asli et al. / Microelectronic Engineering 108 (2013) 86–92
A linear F–N curve was obtained by plotting ln J/E2 as a functionof 1/E, indicating that the current was generated by field emittedelectrons [42]. The experimental F–N plots obtained for all ferro-cene ratios are shown in Fig. 6b. Table 1 shows b values as calcu-lated from the equation b = �Bu3/2/slope of F–N curve, where theCNT u value was �5 eV [45] and B = 6.83 � 109 eV�3/2 Vm�1. Thecalculated b for ferrocene amounts from 0.3 to 0.8 g were foundin the range 1235.9–1572.9. These ranges are acceptable for fieldemission devices where the literature reports b value for CNT pre-pared by chemical vapour deposition technique of 200–2000 inaligned CNT deposits [46]. Of the tested ferrocene amounts, 0.5 gresulted in the highest calculated b. This result shows that the Eloc
was strongly applied in the CNT catalysed at this ratio as comparedwith other samples [47]. We confirmed that the low turn-on andthreshold field values and the increase in the maximum emission
current density observed in this sample were caused by enhancedlocal electric fields due to the enhanced b on the nanotube tips.
Emission current stability tests were performed out on thesame sample. The current stability of VACNT on NPSiT synthesisedwith various ferrocene amounts (0.3–0.5 g) with 5 g of camphor oilare presented in Fig. 7. The display current of 0.01 mA as a functionof time with a 3000 s duration was plotted at various applied volt-ages. As shown in Fig. 7a, for a sample catalysed by 0.3 g of ferro-cene, obvious current emission degradation together with spikesand slight fluctuations in emission were detected. For a sample cat-alysed by 0.4 g of ferrocene (shown in Fig. 7b), the emissiondropped significantly after 250 s from approximately 0.40 to0.28 mA. The current emission degraded continuously to 0.20 mAafter 3000 s. These results indicate insufficient quality for flat paneldisplay technology.

0 1 2 3 4 5
0.0
2.0x10⁻⁴
4.0x10⁻⁴
6.0x10⁻⁴
8.0x10⁻⁴
1.0x10⁻³
1.2x10⁻³
1.4x10⁻³
Cur
rent
den
sity
(A/c
m2 )
Electric field (V/µm)
a b c d e f
3.0x10⁻⁷ 4.0x10⁻⁷ 5.0x10⁻⁷ 6.0x10⁻⁷ 7.0x10⁻⁷
-40
-35
-30
a b c d e f
ln(J
/E2 )
1/E(m/V)
(A)
(B)
Fig. 6. (A) Third cycle of J–E curves of VACNT as a function of ferrocene ratio, (B)Corresponding F–N plots as a function of ferrocene ratio: (a) 0.3 g, (b) 0.4 g, (c) 0.5 g,(d) 0.6, (e) 0.7 g, (f) 0.8 g.
Table 2FEE characteristic of VACNT as a function of ferrocene ratio (0.3–0.8 g).
Camphor oil:ferrocene ratio(g)
Turn on field(V lm�1) at0.01 mA cm�2
Threshold field(V lm�1) at0.1 mA cm�2
Jmax
(mA/cm2)
bValues
5:0.3 3.20 3.90 0.24 1235.95:0.4 3.09 3.65 0.70 1653.05:0.5 2.80 3.30 1.20 1758.85:0.6 2.94 3.60 0.56 1740.05:0.7 3.05 3.54 0.99 1653.15:0.8 3.06 3.47 0.92 1572.9
-500 0 500 1000 1500 2000 2500 3000 3500
1.2x10-41.4x10-41.6x10-41.8x10-42.0x10-42.2x10-42.0x10-42.5x10-43.0x10-43.5x10-4
2.0x10-44.0x10-46.0x10-48.0x10-41.0x10⁻³
1.5x10-42.0x10-42.5x10-43.0x10-4
1.5x10-42.0x10-42.5x10-43.0x10-4
7.0x10-48.0x10-49.0x10-41.0x10-3
-500 0 500 1000 1500 2000 2500 3000 3500
Cur
rent
(A)
Time (s)
a
b
c
d
e
f
Fig. 7. Current stability measurement done on CNT for 50 min as a function offerrocene ratio: (a) 0.3 g, (b) 0.4 g, (c) 0.5 g, (d) 0.6, (e) 0.7 g, (f) 0.8.
N.A. Asli et al. / Microelectronic Engineering 108 (2013) 86–92 91
As the amount of ferrocene used increased to 0.5 g (Fig. 7c), theemission loss gradually improved. The current sharply droppedfrom approximately 0.98 to 0.70 mA after 250 s and was then sta-bilised until 3000 s. For samples catalysed at 0.6, 0.7 and 0.8 g fer-rocene (Fig. 7d–f), emission loss and several current spikes weredetected approximately 250 s. These results reveal that an increasein the amount of ferrocene used aids the stability and improves thelifetime of field emission display effectively. Samples preparedwith 0.5 g ferrocene exhibited more stable current emission, lessdegradation, fewer spikes and a lower signal to noise ratio.
4. Conclusion
We have reported a simple method for growing verticallyaligned multi-walled carbon nanotubes by modified two-stage cat-alytic-nanotemplate thermal chemical vapour deposition. Weattribute the differences in the field emission properties observedto the amount of ferrocene used as a catalyst. All CNT samples cat-alysed from 0.3 to 0.8 g of ferrocene exhibited turn-on fields of lessthan 4 V lm�1 and their emission currents approach 1.2 mA cm�2
for a field of 4.5 V lm�1. Moreover, our well-aligned nanotubeshave stable emissions and are strong candidates for electron emit-ter applications.
Acknowledgements
This work was financially supported by the Malaysian Ministryof Higher Education through the Fundamental Grant ResearchScheme under contact no. 600-RMI/ST/FRGS 5/3/Fst 204/2010and Universiti Teknologi MARA through the Young LecturerScheme and Excellence Fund under contact no. 600-RMI/ST/DANA5/3/Dst 20/2011. We are thankful to the anonymous reviewerswho kindly give us valuable feedback to improve this manuscript.Thanks are also due to Prof. Roslan Md Nor from the University ofMalaya for very useful discussions on FEE theory.
References
[1] Sumio Iijima, Nature 354 (1991) 56–58.[2] Jan-Hendrik Pöhls, Michel B. Johnson, Mary Anne White, Rachit Malik, Brad
Ruff, Chaminda Jayasinghe, Mark J. Schulz, Vesselin Shanov, Carbon 50 (2012)4175–4183.
[3] Gilbert D. Nessim, Nanoscale 2 (2010) 1306–1323.[4] Rodney S. Ruoff, Donald C. Lorents, Carbon 33 (1995) 925–930.[5] Indranil Lahiri, Wonbong Choi, Acta Mater. 59 (2011) 5411–5421.
92 N.A. Asli et al. / Microelectronic Engineering 108 (2013) 86–92
[6] J.L. Kwo, Meiso Yokoyama, W.C. Wang, F.Y. Chuang, I.N. Lin, Diamond Relat.Mater. 9 (2000) 1270–1274.
[7] C.S. Chen, X.H. Chen, L.S. Xu, Z. Yang, W.H. Li, Carbon 43 (2005) 1660–1666.[8] C.S. Chen, X.H. Chen, J. Hu, H. Zhang, W.H. Li, L.S. Xu, Z. Yang, Trans. Nonferrous
Met. Soc. China 15 (2005) 300–305.[9] C.W. Tan, K.H. Tan, Y.T. Ong, A.R. Mohamed, S.H.S. Zein, S.H. Tan, Environ.
Chem. Lett. 10 (2012) 265–273.[10] K.L. Lim, H. Kazemian, Z. Yaakob, W.R.W. Daud, Chem. Eng. Technol. 33 (2010)
213–226.[11] S.M. Sanip, A.F. Ismail, P.S. Goh, T. Soga, M. Tanemura, H. Yasuhiko, Sep. Purif.
Technol. 78 (2011) 208–213.[12] N. Timizar, Info Chim. Mag. 43 (2006) 6–11.[13] Jianguo Zhao, Xiangyun Guo, Quangui Guo, Ling Gu, Yong Guo, Feng Feng,
Carbon 49 (2011) 2155–2158.[14] I. Suarez-Martinez, N.A. Marks, Carbon 50 (2012) 5441–5449.[15] S. Santangelo, M. Lanza, E. Piperopoulos, S. Galvagno, C. Milone, Mater. Res.
Bull. 47 (2012) 595–601.[16] A. Gohier, T.M. Minea, S. Point, J.-Y. Mevellec, J. Jimenez, M.A. Djouadi, A.
Granier, Diamond Relat. Mater. 18 (2009) 61–65.[17] M.Z. Hussein, S.A. Zakarya, S.H. Sarijo, Z. Zainal, J. Nanomater. 2012 (2012).
Article ID 525616, 9 pages.[18] Placidus B. Amama, Cary L. Pint, Francesca Mirri, Matteo Pasquali, Robert H.
Hauge, Benji Maruyama, Carbon 50 (2012) 2396–2406.[19] QiXin Liu, YuLu.Yin.Zhang. Ouyang, Lu Yin Zhang, Yan Xu, Yan Fang, Physica E
41 (2009) 1204–1209.[20] S. Porro, S. Musso, M. Giorcelli, A. Chiodoni, A. Tagliaferro, Physica E 37 (2007)
16–20.[21] Illayathambi Kunadian, Rodney Andrews, M. Pinar Mengüç, Dali Qian, Chem.
Eng. Sci. 64 (2008) 1503–1510.[22] Illayathambi Kunadian, Rodney Andrews, Dali Qian, M. Pinar Mengüç, Carbon
47 (2009) 384–395.[23] K.B.K. Teo, C. Singh, M. Chhowalla, W.L. Milne, Catalytic Synthesis of Carbon
Nanotubes and Nanofibers, in Encyclopedia of Nanoscience andNanotechology, vol. X, American Scientific Publisher, 2003. pp. 1–22.
[24] Jung Inn Sohn, Y.-H. Sohn, S.-Y. Choi, K.-I. Cho, K.-S. Nam, Appl. Phys. Lett. 78(2001) 901–903.
[25] J. Li, W. Lei, X. Zhang, B. Wang, L. Ba, Solid-State Electron. 48 (2004) 2147–2151.
[26] A.G. Rinzler, J.H. Hafner, P. Nikolaev, L. Lou, S.G. Kim, D. Tomanek, P.Nordlander, D.T. Colbert, R.E. Smalley, Science 269 (1995) 1550–1553.
[27] W.A.D. Heer, A. Châtelain, D. Ugarte, Science 270 (1995) 1179–1180.
[28] Y. Saito, S. Uemura, Carbon 38 (2000) 169–182.[29] S. Fan, M.G. Chapline, N.R. Franklin, T.W. Tombler, A.M. Cassel, H. Dai, Science
283 (1999) 512–514.[30] L. Gangloff, E. Minoux, K.B.K. Teo, P. Vincent, V.T. Semet, V.T. Binh, M.H. Yang,
I.Y.Y. Bu, R.G. Lacerda, G. Pirio, J.P. Schnell, D. Pribat, D.G. Hasko, G.A.J.maratunga, W.I. Milne, P. Legagneux, Nano Lett. 4 (2004) 1575–1579.
[31] S.H. Jo, D.Z. Wang, J.Y. Huang, W.Z. Li, K. Kempa, Z.F. Ren, Appl. Phys. Lett. 85(2004) 810–812.
[32] N.A. Asli, S.F.M. Yusop, M. Rusop, S. Abdullah, Ionics 17 (2011) 653–657.[33] S.F.M. Yusop, M. Rusop, S. Abdullah, Mater. Res. Innovations 15 (2011) 210–
212.[34] M. Grunder, H. Jacob, Appl. Phys. A 39 (1986) 73–82.[35] M.S. Shamsudin, A.B. Suriani, S. Abdullah, S.Y.S. Yahya, M. Rusop, J. Spectrosc.
2013 (2013). Article ID 167357.[36] M.S. Shamsudin, M.F. Achoi, M.N. Asiah, L.N. Ismail, A.B. Suriani, S. Abdullah,
S.Y.S. Yahya, M. Rusop, J. Nanomater. 2012 (2012) Article ID 972126, 5pages.
[37] M.S. Shamsudin, M. Maryam, N.A. Asli, S.A.M. Zobir, M.A. Johari, S.F.M. Yusop,A.B. Suriani, S. Abdullah, S.Y.S. Yahya, M. Rusop, Nano Hybrids 2 (2012) 25–42.
[38] M. S. Shamsudin, N. A. Asli, S. Abdullah, S. Y. S. Yahya, M. Rusop, Adv. Condens.Matter. Phys. 2012 (2012) Article ID 420619, 7 pages.
[39] M.S. Shamsudin, I.A. Lahori, A.B. Suriani, S. Abdullah, S.Y.S. Yahya, M. Rusop,Adv. Mater. Res. 576 (2012) 454–458.
[40] A.B. Suriani, A.A. Azira, S.F. Nik, R. Md Nor, M. Rusop, Mater. Lett. 63 (2009)2704–2706.
[41] Mukul Kumar, Tsugio Okazaki, Mineo Hiramatsu, Y. Ando, Carbon 45 (2007)1899–1904.
[42] S.P. Somani, P.R. Somani, M. Tanemura, S.P. Lau, M. Umeno, Curr. Appl. Phys. 9(2009) 144–150.
[43] W.L.J. Li, X. Zhang, B. Wang, L. Ba, Solid-State Electron. 48 (2004) 2147–2151.
[44] S.K. Srivastava, V.D. Vankar, D.V. Sridhar Rao, V. Kumar, Thin Solid Films 515(2006) 1851–1856.
[45] M. Kumar, K. Kakamu, T. Okazaki, Y. Ando, Chem. Phys. Lett. 385 (2004) 161–165.
[46] M. Sveningsson, R.E. Morajan, O.A. Nerushev, Y. Sato, J. Backstrom, E.E.B.Campbell, F. Rohmund, Appl. Phys. A 73 (2001) 409–418.
[47] J.H. Choi, S.H. Choi, J.H. Han, J.B. Yoo, C.Y. Park, J. Appl. Phys. 94 (2003) 487–490.