field demonstration of co
TRANSCRIPT


FIELD DEMONSTRATION OF CO2 INJECTION MONITORING USING KRAUKLIS AND OTHER
GUIDED WAVESDE-FE0028659
Shaughn A. BurnisonEnergy & Environmental Research Center
U.S. Department of EnergyNational Energy Technology Laboratory
Mastering the Subsurface Through Technology Innovation, Partnerships and Collaboration:Carbon Storage and Oil and Natural Gas Technologies Review Meeting
August 1–3, 2017
© 2017 University of North Dakota Energy & Environmental Research Center.

3
PRESENTATION OUTLINE• Project Background
– Study Area– Boundary and Guided Waves– Krauklis Wave (K-wave) Monitoring Concept
• Project Plan and Tasks• Field Hardware Test• Accomplishments and Lessons• Synergy and Summary

STUDY AREA AND TARGET
Muddy Fm~4500 ft deep
~30 ft thick
Stratigraphic Column for the Bell Creek Area with Lithology
Bell Creek Oil Field
K-waveStudyArea

5
BOUNDARY AND GUIDED WAVES• Rayleigh wave
– A surface wave • Lamb wave
– A Rayleigh wave guided in a layer
• Scholte wave– A boundary wave guided along a liquid–solid
interface– A tube wave
• Stoneley wave– A boundary wave guided along a solid–solid
interface– Has a large amplitude– Leaky Rayleigh wave
Note:- Rayleigh wave propagates
at a vacuum–solid interface- Stoneley wave propagates
at a solid–solid interface.- Scholte wave propagates at
a liquid–solid interface.
http://www.geo.mtu.edu/UPSeis/rayleigh_web.jpg
Symmetric
Antisymmetric
Muravin.com
Wikipedia.org
Lamb Wave

6
K-WAVE (1962)
K-Waves in Two Intersecting Fractureshttps://www1.ethz.ch/rockphysics/research/krauklis
Shigapov, R., and Kashtan, B. [2011] Oscillations of a Fluid Layer Sandwiched between Different Elastic Half-spaces. 73rd EAGE Conference, P046, Vienna, Austria.
Solid Fluid Solid

7
K-WAVE CONCEPT
Simplified K-wave system illustration showing two well pairs (one “source” well and two “receiver” wells) (image courtesy of Seismos, Inc.).
• Question: If K-waves travel in liquid-filled fractures, how does it work in a clastic reservoir that is not fractured?
• Answer: All guided waves that propagate laterally through the reservoir are monitored. – Includes Stoneley, Sholte,
Lamb, etc., that travel in the waveguide (the reservoir), and K-waves.
– In the enhanced oil recovery (EOR) application, an engineering approximation is used… a mix of guided waves, including K-waves.

8
K-WAVE COVERAGE MESH AND VISUALIZATION
K-wave ray paths monitored in a hypothetical well pattern (image courtesy of Seismos, Inc.).
Idealized CO2 saturation evolution generated by the K-wave system (image courtesy of Seismos, Inc.).
9
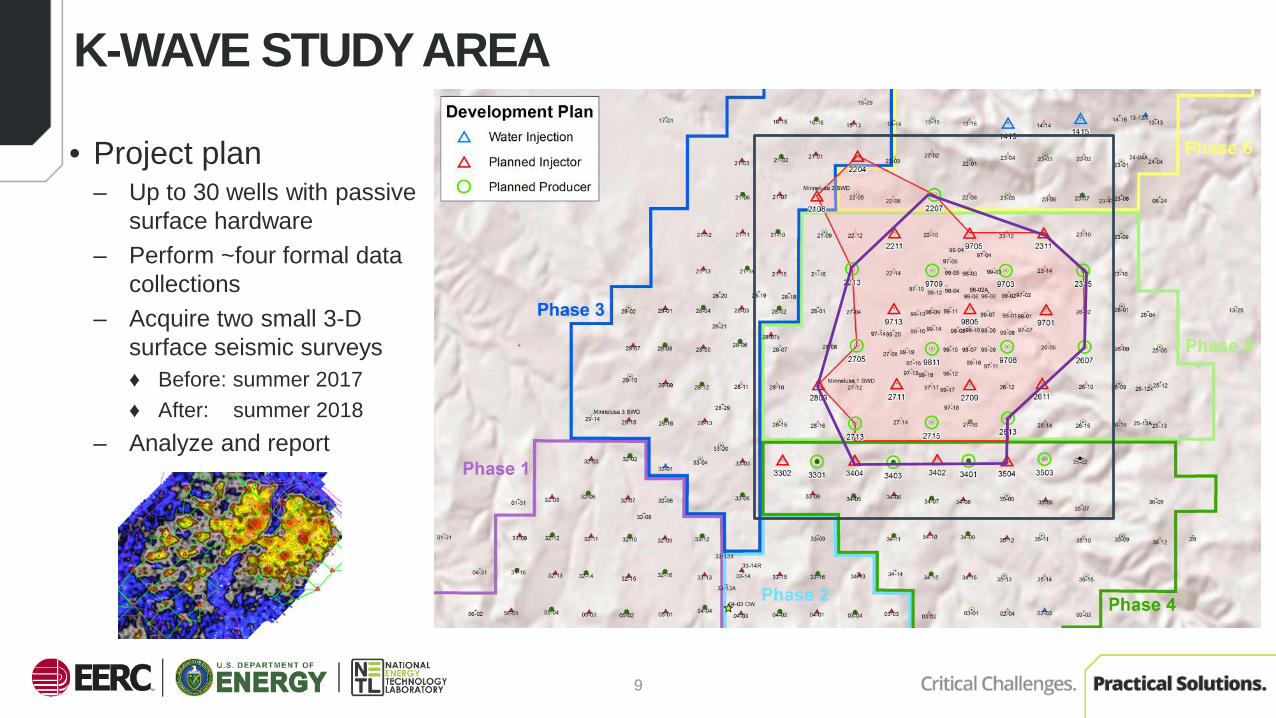
K-WAVE STUDY AREA
• Project plan– Up to 30 wells with passive
surface hardware – Perform ~four formal data
collections – Acquire two small 3-D
surface seismic surveys ♦ Before: summer 2017 ♦ After: summer 2018
– Analyze and report

10
TASK BREAKDOWN
• Task 1 – Project Management– Planning, Oversight, Reporting
• Task 2 – Field Data Collection– 2.1 Prestudy 3-D survey –
♦ Timestamp image of CO2 and pressure before K-wave monitoring– 2.2 K-Wave Monitoring –
♦ Baseline and three periodic monitoring surveys – 2.3 Poststudy 3-D survey –
♦ Timestamp image of CO2 saturation after K-wave monitoring.
• Task 3 – Data Analysis and Workflow– 3.1 Seismic Data Interpretation and Geologic Model Refinement– 3.2 Predictive Simulations and Comparisons to K-Wave Surveillance– 3.3 Review of Results, Integration Workflow Development, and Report Generation
♦ Develop a workflow that integrates the K-Wave data with 4-D seismic and dynamic simulations
Proposed Field Plan

11
DATA ANALYSIS: 3-D AND 4-D SEISMIC
• Task 3.1 – Seismic Data Interpretation and Geologic Model Refinement– 3-Ds – before and after K-wave.– 4-D images of CO2. Compare to the
K-wave results.– Calibrate where there was injection
prior to the K-wave survey.– Improve the geologic model – input
for dynamic reservoir modeling with CMG software.
Baseline 4-D Difference

12
DATA ANALYSIS: PREDICTIVE SIMULATIONS
• Task 3.2 – Predictive Simulations and Compare to K-Wave Results– Refine the geologic model– History match to known production
and CO2 injection volumes– Model CO2 saturation– Compare to K-wave images
CMG Simulation CO2 Map
History Match Production
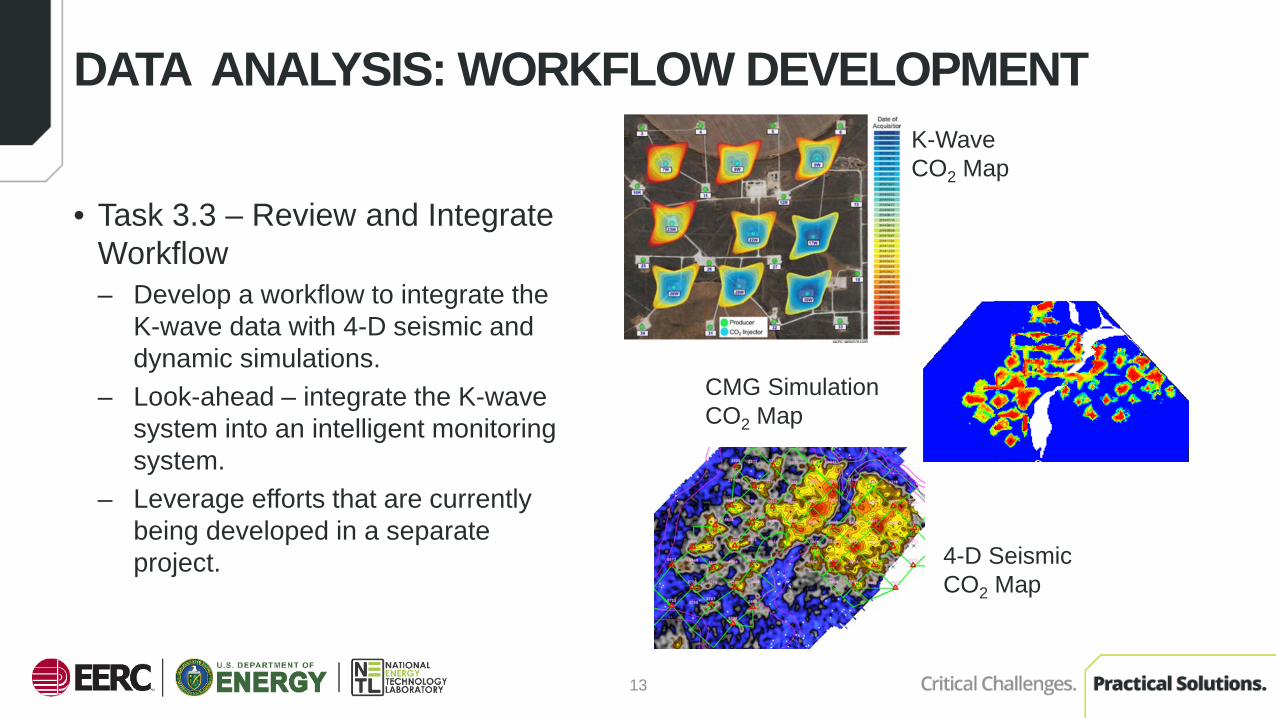
• Task 3.3 – Review and Integrate Workflow– Develop a workflow to integrate the
K-wave data with 4-D seismic and dynamic simulations.
– Look-ahead – integrate the K-wave system into an intelligent monitoring system.
– Leverage efforts that are currently being developed in a separate project.
13
DATA ANALYSIS: WORKFLOW DEVELOPMENTK-Wave CO2 Map
CMG Simulation CO2 Map
4-D SeismicCO2 Map

14
K-WAVE WELL SENSORSInjector
Producer

15
BELL CREEK WELLHEADS

16
TESTING AT BELL CREEK – TEMPORARY MOUNT
Flange
HammerUnion Receiver
Gauge
Source
Apparatus Flanged to Wellhead

17
INJECTOR SETUP
Receiver
SourceExhaustJet
Source actuation is powered by compressed nitrogen. The injector operates at ~1400 psi, so a 100-ms release of CO2 from the well induces the pulse in the well.

• Ch 1 and Ch 2 show a test shot showing tube wave returns, displayed with different gains.
• Ch 3 is the source impulse.• Note the tube wave returns have
alternating opposite polarity and attenuate to the noise level after five or six reflections.
18
TEST SHOT

19
ACCOMPLISHMENTS TO DATE
• Kickoff meeting with DOE completed.• Contracts are in place with partners: Denbury, Seismos, and CMG.• Field reconnaissance trip with Seismos and Denbury engineers;
instrumenting of three wells and acquiring test shots were completed. • Main study area, wells to be instrumented and project time line are
firmed up.• Attachment points for sensors and source to wellheads are engineered.• Modeling of guided wave energy in the Bell Creek reservoir is under
way.• Design, permitting, and contracting for both prestudy and poststudy
surface 3-D surveys are under way.
20
LESSONS LEARNED
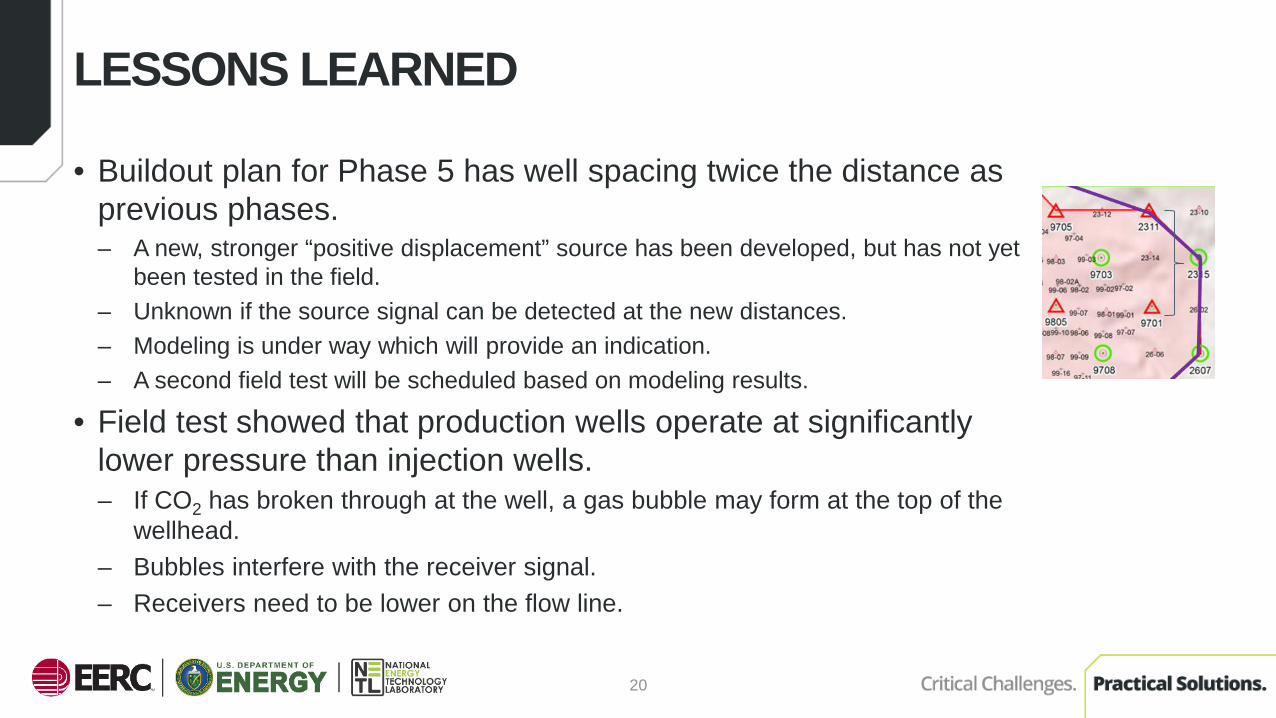
• Buildout plan for Phase 5 has well spacing twice the distance as previous phases. – A new, stronger “positive displacement” source has been developed, but has not yet
been tested in the field. – Unknown if the source signal can be detected at the new distances. – Modeling is under way which will provide an indication.– A second field test will be scheduled based on modeling results.
• Field test showed that production wells operate at significantly lower pressure than injection wells.– If CO2 has broken through at the well, a gas bubble may form at the top of the
wellhead.– Bubbles interfere with the receiver signal. – Receivers need to be lower on the flow line.

21
SYNERGY OPPORTUNITIES
• Geologic and simulation models used for SASSA (scalable, automated, semipermanent seismic array) can be extended into the K-wave study area.
• Reservoir characterization data gained from other Bell Creek projects can be input to the K-wave modeling.
• Colorado School of Mines project, Charged Wellbore Casing–Controlled Source Electromagnetics (CWC–CSEM) on Reservoir Imaging and Monitoring. – Same Phase 5 study area for K-wave. – Reservoir characterization information can be shared. – Results of the K-wave monitoring 4-D surface seismic results can
also help validate the CWC–CSEM method.
• A joint inversion project that uses the 3-D surface seismic and CSEM data together is a future possibility.

22
PROJECT SUMMARY• The EERC and its project partners will deploy and validate a prototype MVA (monitoring,
verification, and accounting) technology in an operational carbon capture, utilization, and storage (CCUS) field environment.
• Employs a new subsurface signal, the K-wave, and other guided waves in novel approach.• 3-year project, with ~15 months of data collection at Bell Creek Field.
– Up to 1 year of K-wave monitoring involving up to 30 wells.– Validation by two surface 3-D surveys – before and after K-wave monitoring.
• Raise the technology from the current TRL 4 to TRL 7.• The implementation is entirely surface-based and is not invasive or disruptive to operations.• May be suitable for long-term or permanent placement.• Expected to provide temporal and spatial monitoring of the CO2 distribution within the
reservoir. • Could eventually be cost-effective for monitoring future CO2 storage facilities and
incorporated into an intelligent monitoring system.• A “go/no go” decision point for project continuation: determine viability after the baseline and
first monitor survey.• Contracts in place – field recon complete – modeling in progress – first 3-D pending.

APPENDIX
Benefit to the ProgramProject Overview – Goals and Objectives
Organization ChartGantt ChartBibliography
AcknowledgmentContact Information
23

PROGRAM GOALS ADDRESSED1. Deploy and validate a prototype CCUS
MVA technology in an operational field environment.
2. Employ a new subsurface signal.3. Raise the current TRL 4 to TRL 7.4. Implementation is not invasive or
disruptive to operations.5. May be suitable for long-term deployment
or permanent placement.6. Provides temporal and spatial monitoring
of the CO2 distribution within the reservoir. 7. Could eventually be cost-effective for
monitoring future CO2 storage facilities and incorporated into an intelligent monitoring system.
24
BENEFITS STATEMENTThe project will address Area of Interest 1, “Field Demonstration of MVA Technologies,” by deploying and validating a prototype carbon storage monitoring, verification, and accounting (MVA) technology in an operational field environment. The method employs a new subsurface signal, the K-wave, to monitor the migration of injected CO2in a cost-effective, noninvasive way that is not disruptive to injection operations. Project goals will be accomplished by applying the technology, currently at TRL4, to an appropriately scaled subset of wells within a commercial-scale CO2 enhanced oil recovery project with associated CO2 storage and validating the resulting data with conventional seismic monitoring methods and dynamic reservoir simulation results, bringing the K-wave technology to TRL7. Potential exists for future upgrades to real-time monitoring that could feed data to an intelligent monitoring system. The proposed research supports the U.S. Department of Energy (DOE) Carbon Storage Program’s goal to “Develop and validate technologies to ensure 99 percent storage permanence.” Other DOE program goals supported by the proposed research include “develop technologies to improve reservoir storage efficiency while ensuring containment effectiveness” and “support industry’s ability to predict CO2 storage capacity in geologic formations to within ±30 percent.” Information produced will be useful for inclusion in DOE’s Carbon Storage best practices manuals for MVA, the development of which is also a DOE program goal.
BENEFIT TO THE PROGRAM
25
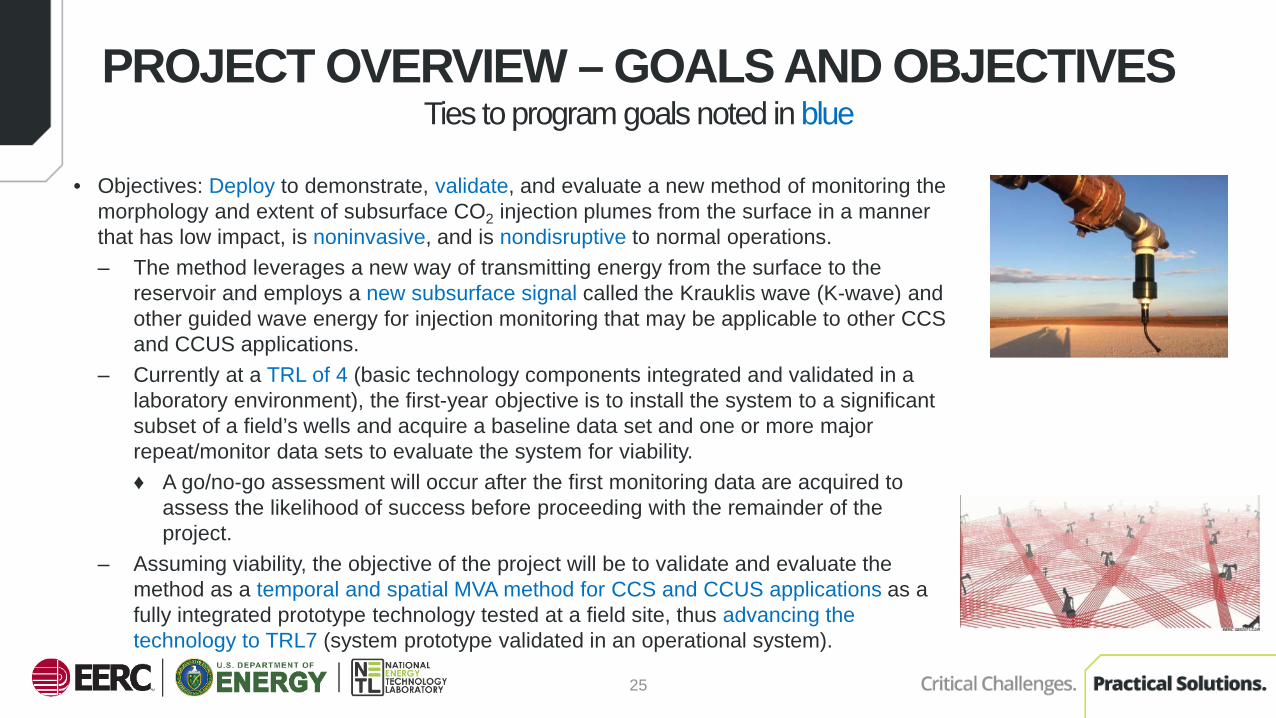
PROJECT OVERVIEW – GOALS AND OBJECTIVESTies to program goals noted in blue
• Objectives: Deploy to demonstrate, validate, and evaluate a new method of monitoring the morphology and extent of subsurface CO2 injection plumes from the surface in a manner that has low impact, is noninvasive, and is nondisruptive to normal operations.– The method leverages a new way of transmitting energy from the surface to the
reservoir and employs a new subsurface signal called the Krauklis wave (K-wave) and other guided wave energy for injection monitoring that may be applicable to other CCS and CCUS applications.
– Currently at a TRL of 4 (basic technology components integrated and validated in a laboratory environment), the first-year objective is to install the system to a significant subset of a field’s wells and acquire a baseline data set and one or more major repeat/monitor data sets to evaluate the system for viability. ♦ A go/no-go assessment will occur after the first monitoring data are acquired to
assess the likelihood of success before proceeding with the remainder of the project.
– Assuming viability, the objective of the project will be to validate and evaluate the method as a temporal and spatial MVA method for CCS and CCUS applications as a fully integrated prototype technology tested at a field site, thus advancing the technology to TRL7 (system prototype validated in an operational system).
26
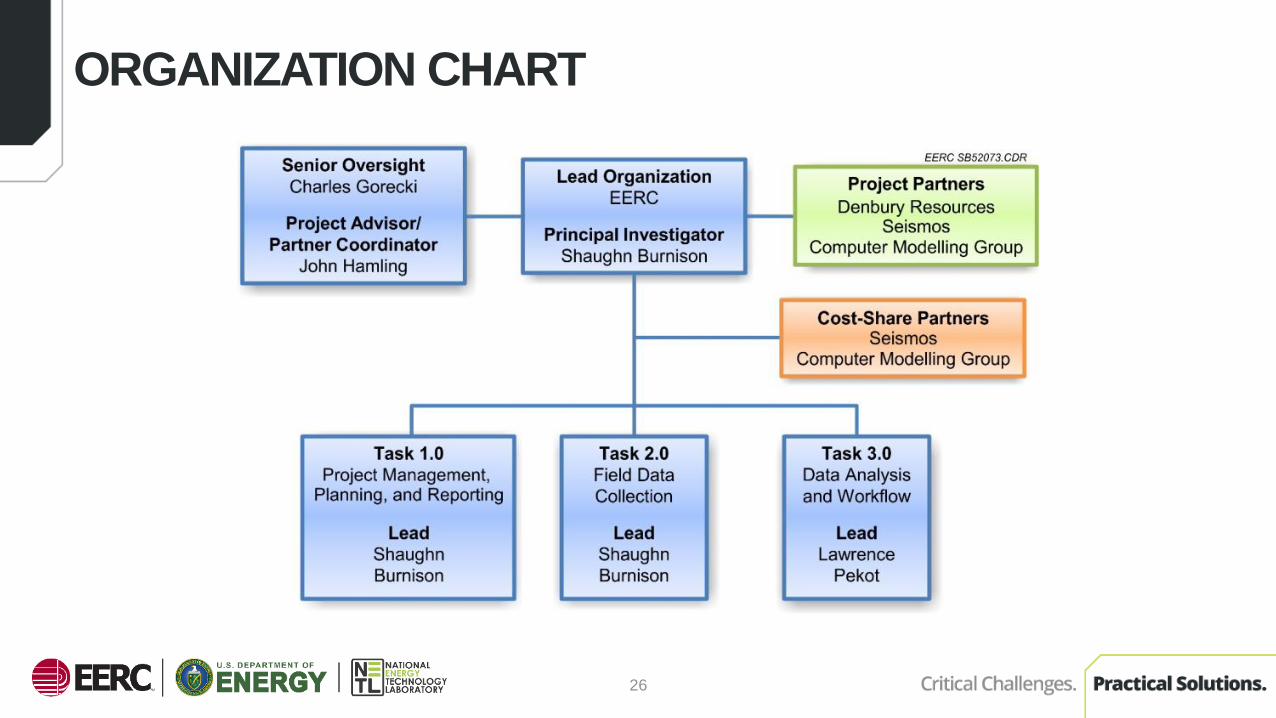
ORGANIZATION CHART

27
GANTT CHARTStart EndDate Date Oct Nov Dec Jan Feb Mar Apr May Jun Jul Aug Sep Oct Nov Dec Jan Feb Mar Apr May Jun Jul Aug Sep Oct Nov Dec Jan Feb Mar Apr May Jun Jul Aug Sep Oct Nov Dec Jan Feb Mar Apr May
10/1/16 5/31/20D1 M1
1.1 – Project Management and Planning 10/1/16 5/31/20 D2 & D3
1.2 – Project Reporting 10/1/16 5/31/20
Task 2.0 – Field Data Collection 12/1/16 3/31/19 M2
12/1/16 12/31/17
1/2/17 1/31/19
M46/1/18 6/30/19
Task 3.0 – Data Analysis and Workflow 12/1/17 5/31/20 M7
3.1 – Seismic Data Analysis and Geologic Model Refinement 12/1/17 10/31/19
6/1/18 10/31/19
M86/1/19 5/31/20
D1 – Project Management Plan (updated)D2 ‒ Technology Maturation Plan (updated) D3 ‒ Data Management Plan (updated)D4 ‒ Data Submitted to NETL EDX
Q152018 2019 2020
Budget Period 3
D4
M3
M6 ‒ Field Data Collection and Processing Completed
Q6 Q7 Q8 Q9 Q10
M7 ‒ Seismic Data Analysis CompletedM8 ‒ Integration Workflow Completed
Note: Critical path passes through sub-subtasks.
6.29.17 hmv
M1 ‒ Formal Kickoff Meeting HeldM2 ‒ Prestudy 3-D Survey Planning InitiatedM3 ‒ K-Wave Surveillance InitiatedM4 ‒ Poststudy 3-D Survey Planning InitiatedM5 ‒ K-Wave Surveillance Completed
M62.3 – Poststudy 3-D Survey Planning, Acquisition, and Processing
3.2 – Predictive Simulations and Comparisons to K-Wave Surveillance
3.3 – Review of Results, Integration Workflow Development, and Report Generation
Deliverables Key for Milestones (M)
TaskTask 1.0 – Project Management, Planning, and Reporting
2.1 – Prestudy 3-D Survey Planning, Acquisition, and ProcessingM5
2.2 – K-Wave Monitoring: Installation, Calibration, Baseline, and Surveillance
Q11 Q12 Q13 Q14
Budget Period 12016 2017
Budget Period 2
Q1 Q2 Q3 Q4 Q5

28
BIBLIOGRAPHY
• Frehner, M., 2013, Krauklis wave initiation in fluid-filled fractures by seismic body waves: Geophysics, v. 79, no. 1, T27–T35, http://dx.doi.org/10.1190/geo2013-0093.1
• Frehner M. and Schmalholz S.M., 2010: Finite-element simulations of Stoneley guided-wave reflection and scattering at the tips of fluid-filled fractures, Geophysics 75, T23–T36.
• Korneev, V., Danilovskaya, L., Nakagawa, S., Moridis, G., 2014, Krauklis wave in a trilayer. Geophysics, v. 79, no. 4, p. L33-L39, http://dx.doi.org/10.1190/geo2013-0216.1
• Korneev, V., A. Bakulin, and Ziatdinov, S., 2006, Tube-wave monitoring of oil fields. 76th Annual International Meeting, SEG, Expanded Abstracts, 374-378. http://dx.doi.org/10.1190/1.2370279
Note: These publications provide technical background. No publications have originated from the project at this time.

ACKNOWLEDGMENT
This material is based upon work supported by the U.S. Department of Energy National Energy Technology Laboratory under Award No. DE-FE0028659.
DisclaimerThis presentation was prepared as an account of work sponsored by an agency of the United
States Government. Neither the United States Government, nor any agency thereof, nor any of their employees, makes any warranty, express or implied, or assumes any legal liability or responsibility for the accuracy, completeness, or usefulness of any information, apparatus, product, or process disclosed or represents that its use would not infringe privately owned rights. Reference herein to any specific commercial product, process, or service by trade name, trademark, manufacturer, or otherwise does not necessarily constitute or imply its
endorsement, recommendation, or favoring by the United States Government or any agency thereof. The views and opinions of authors expressed herein do not necessarily state or
reflect those of the United States Government or any agency thereof.
30
CONTACT INFORMATION
Energy & Environmental Research CenterUniversity of North Dakota15 North 23rd Street, Stop 9018Grand Forks, ND 58202-9018
www.undeerc.org701.777.5366 (phone)701.777.5181 (fax)
Shaughn BurnisonPrincipal [email protected]

THANK YOU!
