field benchmarking and market development for audit ... · field benchmarking and market...
TRANSCRIPT

AUDITAC Final Report February 2007
1
Field benchmarking and Market development for Audit methods in Air Conditioning
auditAC Grant Agreement EIE/04/104/S07.38632
Final Report (January, 2005 to December, 2006)
CO-ORDINATOR: Jérôme ADNOT, ARMINES, France
PARTICIPANTS
Jérôme ADNOT, Daniela BORY, Dominique MARCHIO, Philippe RIVIERE, Maxime DUPONT ARMINES, France
Sule BECIRSPAHIC, Yamina SAHEB
EUROVENT CERTIFICATION
Jean LEBRUN, Philippe ANDRE, Cleide APARECIDA SILVA, Christophe ADAM Adelqui FISSORE, Jules DELVAUX, Corinne ROGIEST
Université de Liège (ULg), Belgium
José Luis ALEXANDRE, André POÇAS, Emanuel SÁ, Ana SILVA INEGI, University of Porto, Faculty of Eng., Portugal.
Georg BENKE, Gerhard HOFER, Klemens LEUTGOEB
Austrian Energy Angency, Austria
Ian KNIGHT, Andrew MARSH, Clarice Bleil de SOUZA Welsh School of Architecture, Cardiff, UK
Marco MASOERO, Chiara SILVI
Politecnico di Torino, Italy
Vincenc BUTALA, Simon MUHIC, Matjaz PREK University of Ljubljana, Slovenia
Gavin DUNN
Association of Building Engineers, UK
Roger HITCHIN BRE, UK
AUDITAC Final Report February 2007
2
CONTENTS
AUDITAC SUMMARY ........................................................................................................................ 4
1-INTRODUCTION: OBJECTIVES AND MEANS OF ACTION.................................................. 8 1.1 Presentation of the technical experts and qualification of the team .......................................... 8 1.2 Involvement of energy agencies, utilities, manufacturers and national experts in our work..... 8 1.3 Terminology, namely definitions of pre-audit, ECOs, audit(“TG 1: Are you sure you are not paying for inefficient cooling?” downloadable from http://www.eva.ac.at/projekte/auditac.htm ) 9 1.4 The rapidly developing context due to EPBD(“TG 2: Energy Auditing of Air Conditioning Systems and the Energy Performance in Buildings Directive : what does the new regulation say?” downloadable from http://www.eva.ac.at/projekte/auditac.htm)................................................... 13
2-RECOGNISING THE PROBLEMS OF EXISTING AIR CONDITIONING PLANTS.......... 17 2.1 The systems to be considered .............................................................................................. 17 2.2 What is the importance of faults and inefficiencies ?.......................................................... 20 2.4 Detailed analysis of pre-audit, generation of an ECO list and proposal of supporting tools for pre-audit ................................................................................................................................... 23 2.4 Study of the audit phase ...................................................................................................... 29 2.5 Study of the economics of renovation : basics .................................................................... 36 2.6 Performance maintenance on the field..................................................................................... 37 2.7 Economics of renovation on the field....................................................................................... 39
3-REALISATION OF TOOLS HELPING AC AUDIT FOR THE PROFESSIONALS ............. 45 3.1 Pre audit tools downloadable from http://www.eva.ac.at/projekte/auditac.htm................. 45 3.2Audit tools accessible from http://www.eva.ac.at/projekte/auditac.htm ................................... 46 3.3 Modelling for benchmarking, a tool accessible from http://www.eva.ac.at/projekte/auditac.htm .................................................................................... 53 3.4 Analysis of ways to implement the compulsory EU inspection ................................................ 60 3.4 Link between our deliverables and the new context generated byEU inspection .................... 68
4-CASE STUDIES OF AUDIT AND RENOVATION OF AC SYSTEMS ................................... 71 4.1Documentation of 26 case studies(“TG 10, Case studies of improvements in AC systems?” downloadable from http://www.eva.ac.at/projekte/auditac.htm ) .................................................. 71 4.2 making access to the case studies more easy ........................................................................... 72 4.3 Results of further analysis ........................................................................................................ 80 4.4Magnitude of possible energy gains.......................................................................................... 80
5-TOOLS FOR THE FINAL USER (OWNER, OPERATOR) ...................................................... 85 5.1 Awareness and Inventory tools (“TG 3: System recognition guideline for field visit?” downloadable from http://www.eva.ac.at/projekte/auditac.htm ) .................................................. 85 5.2 Is there a technical possibility of performance progress based on components replacement ?........................................................................................................................................................ 87 5.3 Tool for continuous improvement : what is behind AC-COST?......................................... 90
6-EU STRUCTURES AND ACTORS BEFORE AND AFTER AUDITAC DISSEMINATION EFFORTS ............................................................................................................................................ 94
6.1-European and National structures and frames for Qualification and Certification of Inspectors(“TG 9 : recommendations and competences for auditors and structures for training?” downloadable from http://www.eva.ac.at/projekte/auditac.htm ) .................................................. 94 6.2 Impact of Auditac in each country ..................................................................................... 96 6.3 Auditac website and main releases .................................................................................... 98 6.4 Common EIE work ........................................................................................................... 100

AUDITAC Final Report February 2007
3
6.5 Situation after Auditac ..................................................................................................... 102 REFERENCES .................................................................................................................................. 104
In charge of France and coordination
Legal disclaimer The sole responsibility for the content of this report lies with the authors. It does not represent the opinion of the European Community. The European Commission is not responsible for any use that may be made of the information contained therein.

AUDITAC Final Report February 2007
4
AuditAC SUMMARY Field benchmarking and Market development for Audit methods in Air Conditioning Grant Agreement EIE/04/104/S07.38632
In the coming decades, much of the current installed stock of Air Conditioning (A/C) systems in use in Europe will reach the end of its initial life. Most systems will be renovated for the first time after 10-15 years of operation and this presents an opportunity improve their efficiency. Out of the 2.200 Mm² of air-conditioned building area in use in 2010 in Europe, 800 Mm² will be more than 15 years old and will need urgent renewal. A SAVE Study (EECCAC) showed that there are potential energy savings of about 50 %.
0
500
1.000
1.500
2.000
2.500
3.000
stock1990 stock1995 stock2000 stock2005 stock2010 stock2015 stock2020
cool
ed a
rea
in M
m2
RAC RooftopsPACK&SPLITSlargeVRFChillers
Graph: Cooled area (Mm²) in Europe (source EECCAC)
The market for air-conditioning systems will be influenced by the Directive 2002/91/EC of the European Parliament and of the Council of 16 December 2002 on the energy performance of buildings (EPBD). The Directive means that all over Europe building legislation will be changed to create higher energy efficiency of buildings and building services systems. In particular, Article 9 of the Directive addresses existing air-conditioning systems, notably in terms Inspection Article 9- Inspection of air-conditioning systems With regard to reducing energy consumption and limiting carbon dioxide emissions, Member States shall lay down the necessary measures to establish a regular inspection of air conditioning systems of an effective rated output of more than 12 kW. This inspection shall include an assessment of the air-conditioning efficiency and the sizing compared to the cooling requirements of the building. Appropriate advice shall be provided to the users on possible improvement or replacement of the air-conditioning system and on alternative solutions. AuditAC is the short name for the project “Field Benchmarking and Market Development for Audit Methods in Air Conditioning”. While AuditAC has a bearing on the implementation of Article 9 of the EPBD, it has a much broader scope, dealing with energy auditing and improvement of air conditioning systems generally. Its aim is to provide practical support to all those who are in a position to improve the energy-efficiency of the European A/C market. . Inspectors and energy auditors are external or internal engineers (or qualified technicians) who are charged with assessing the condition of and proposing improvements to operating systems (as distinct from emergency measures following plant failure, which requires different but overlapping skills). In principle an inspection or audit should be carried out as part any of the following actions: starting or restarting operation of a plant, energy efficiency improvement, study of possible renovation, etc. The owner or operator of the system needs the results of such a process in order to address a number of

AUDITAC Final Report February 2007
5
questions: is there an opportunity for energy saving? How large could be the benefit and the cost? Which options are the best ? How can I check that the measures have been effective? AuditAC supplies the tools and advice to answer to these questions and thus to provide confidence that the appropriate decisions are being taken. PRE-EXISTING SITUATION In principle energy auditing should be part of a continuous process of energy monitoring and management. In practice it is usually triggered by an event of some sort. This might be some sort of failure (though this will require other more urgent actions) or, more typically, the prospect of major renovation or new ownership. We see immediately that the inspections required by the EPBD are likely to trigger more audits.. An initial review of existing pre audit (inspection) and audit methods for air conditioning systems showed that they were very few in number. In particular, there is very little practical experience of the sort of inspections required by the EPBD. AWARENESS AND CONFIDENCE-BUILDING So a first set of objectives for AuditAC is to disseminate information about the new measures and to raise awareness of the benefits of an audit A set of deliverables in the form of relatively plain language technical guides explain the key points of energy efficiency in an AC plant (TG1 Are you sure you are not paying for inefficient cooling?), explain the new EPBD requirements (TG2 Energy Auditing of Air Conditioning Systems and the Energy Performance in Buildings Directive: what does the new regulation say?) and help building owners and manager to recognise what system they actually have in their buildings (TG 3 System recognition guideline for field visit). A training package (TP) containing much of this information has also been released. This TP contains 150 slides in simple and non-technical language. There are two version for different types of users. The “open” version is intended as source material for all those involved in training inspectors and auditors, while the “default” version is for more direct use by anyone with an interest in the issues. It starts with the basics of air conditioning systems, followed by guidance on measures, and finally through more comprehensive audit processes and energy conservation opportunities. The training package has been tested internally within the participants before being published. AUDIBAC is a database that allows users to identify actual case studies that best match their own situations. The inputs a number of basic parameters (system type, building type etc.) and the software selects the most appropriate case studies. A brochure TG 10 contains information on the case studies in a more traditional format. All these documents aim to reduce the barriers to audits by improving awareness of the potential improvements and to give the user confidence that real improvements are possible SUPPORT FOR AUDITS AND INSPECTIONS The project made a distinction between two levels of audit: “pre-audits” (which are essentially inspections as envisaged by the EPBD) and. “audits” (in the traditional energy auditing sense) PRE AUDIT A pre audit is a preliminary procedure, consisting of: making an inventory of the equipment in place and its documentation, and an analysis of electricity bills – including the dis-aggregation of AC consumption. We found no existing tools for the pre-audit of air conditioning, apart from some check lists, which were often outdated or mainly adapted to US practice. That led us to the definition within Auditac of a recommended pre-audit procedure (TG 4). One aim of the procedure is to make preliminary assessment of possible energy conservation opportunities (ECOs). We have produced detailed list of such ECOs, divided into different types of action: improvement of the building envelope and internal heat loads; better O&M, effective use of Building Energy Management System

AUDITAC Final Report February 2007
6
(BEMS), system performance improvements. Analysis of electricity consumption can be an important element of the pre-audit and TG 7 provides simplified methods for use by non professional auditors.. A simple spreadsheet calculator tool, called AC-cost, enables initial estimates to be made of potential financial savings from four common actions. FULL AUDIT Following a pre-audit, the plant manager may decide that the potential justifies a full audit which entails looking more carefully at the ECOs identified in the previous procedure. While there are tools to support the detailed audit of heating plants, we have found no tools for auditing air conditioning. Effective tools are very desirable since the cost of an audit depends on the time needed to identify, assess and filter out the options. Several tools were developed. Firstly the Customer advising tool (CAT) allows the rapidly assessment of measures applied to the existing envelope, taking into account the building structure and the climate and location. It has a link allow to AUDIBAC to identify appropriate case studies. Secondly, the AuditAC-EES model is a simplified load calculation tool that defines the consumption of an ideal system with the same comfort demands. This allows to the auditor to investigate the likely impact of different ECOs. The model is accompanied by a user guide, while the other tools have simpler interfaces in which the use is explained step by step. Further help is provided by the Eurovent-Certification database created in the AuditAC project. This database includes the Eurovent certified directories of air-conditioning products from 1995 until 2006. These directories include certified performance values of for AC conditioners which may no longer be on the market but will be found in existing systems. As a result, the auditor can compare the performance with that of current products and assess the case for replacement. The use of this database is illustrated in the TG 6 “How to benefit from the Eurovent- Certification database and to retrieve past equipment data in the audit process”. The auditor will often lack information that he would like to have. Sometimes it would be possible to obtain extra information by using extra data from system components. TG 8 “How manufacturers could help the unfortunate energy auditor”, directed to manufacturers, explains how a component can be used as measuring device in an inexpensive way by just adding some measurement points in catalogues and how they can help audit improving the documentation of the equipment and their nomenclature. PROCESSES AND TRAINING TG 9 “How to integrate Energy Efficiency and AC inspection with full benefit in the structures in place” explores the relationships between the various actors in the AC market. It also considers the different benefits and how they might most effectively be combined. The issue of certification and training of inspectors is also addressed. The guide also comments on the economic cost and savings likely to result from mandatory inspection. It addersses such questions as: Saving running costs, reliability, what are the decision factors? How to give an energy efficiency dimension to the renovation of AC? How to integrate inspection and audit into the life cycle of a plant? DISSEMINATION ACTIVITIES Throughout the project the group employed dissemination activities at international and national level, especially to obtain feedback from practitioners and those implementing the EPBD. This included internal workshops and open national dissemination meeting with professionals of the host country: this allowed us to recognise specific national problems and situations, and also to be aware of the views of the professional (installers, manufacturers, operators etc). Feedback included information on the level of dissemination and implementation of the new EPBD inspection and certification measures (no country implemented the AC inspection measures in the 2006, all asked for three years of delay). The group met an international public by participating actively in international events and conferences, promoting results and tools throughout their development (AICARR congress 2006, ICEEB 06, Klimaforum’06 etc.).

AUDITAC Final Report February 2007
7
All the presented papers and posters are available on the AuditAC project web site and can be freely downloaded. The group also periodically produced a newsletter (6 in total during the project) reporting progress and aims of the project and of Directive implementation. EIE participants outside the project have also been invited to cooperate Each participant country was responsible for creating a contact list and delivering the newsletter to the national list. The total mailing list of Auditac was around 20 000, including direct and indirect readers.

AUDITAC Final Report February 2007
8
1-Introduction: objectives and means of action
1.1 Presentation of the technical experts and qualification of the team The AUDITAC project allowed to :
- To accelerate the adoption of Air Conditioning inspection as described in the EPB Directive on the Energy Performance of Buildings,
- To generate a sufficient number and variety of field demonstrations and benchmarks of inspection and AUDITs in Air Conditioning (hence the name AUDITAC),
- To promote best practice examples and procedures in such audits and consequent retrofits,
- And finally to put in place a real outcome into high quality audits, namely investment-grade audits and actual works on the existing Air Conditioning facilities in EUR-25. 1.2 Involvement of energy agencies, utilities, manufacturers and national experts in our work Some project partners were permanently in charge of some aspects of the problem in their normal activity, making more easy the flux of information from and to the stakeholders. Austrian Energy Agency mandate is to make "energy savings" an energy source which can success-fully compete with conventional sources of energy, and to advocate boundary conditions under which market forces can act in favour of renewables and improved energy efficiency. Faculty of Mechanical Engineering is a department of the University of Ljubljana- UL-FME- are recognized national experts on HVAC. Beside teaching and research activities are taken in charge by the laboratory, mainly in the field of heat and mass transfer in buildings, HVAC, indoor environment, and renewables energy. Supporting the implementation of the EPBD in national regulations.. BRE is the R&D center for the building industry in the UK. Its Energy and Environment Divisions work closely with UK building energy regulators, including activities supporting the implementation of the Energy Performance of Buildings Directive. ABE- Association of Building Engineers, a direct relay with the professions in the UK. EUROVENT-Cecomaf is a European Association of Air Handling and Refrigerating Equipment Manufacturers, actually includes fifteen National Associations from eleven countries. EUROVENT-Certification develops a certification programme based on a voluntary initiative of the industry, which aim is to certify the performance ratings of refrigeration and a/c equipment by independent tests according to European and international standards. Other project partners are laboratories, with links to the national bodies in charge. The project partners are close to their national policy makers & energy agencies that they have associated with their local dissemination and investigation efforts. Université de Liège, Belgium, are recognised international experts on AC. Both teaching and research activities are taken in charge by the laboratory, mainly in the fields of applied thermodynamics, thermal machineries, thermal systems, combustion, re-frigeration and HVAC. Armines - Mines de Paris, has been the coordinator of previous and similar studies on Room Air Conditionners (EERAC) and Central Air Conditioning (EECCAC).

AUDITAC Final Report February 2007
9
Politecnico di Torino : modellers and researchers on energy systems, well integrated into the UNI and AICARR networks related with Air Conditioning. University of Porto INEGI, Portugal, experts on AC systems, and supporting their national Directorate for Energy. The group of energy and building Thermal Physics, that includes HVAC group, of Mechanical Engineering of University of Porto, concentrates on research for modelling and experimental activities in connection with the thermal behaviour of building construction components and HVAC systems. WSA- Welsh School of Architecture, part of University Cardiff an institution with years of experience on the subject, including modelling, and a practical knowledge of field problems thanks to more than thirty monitoring campaigns in the UK. Consultants, experts and national HVAC associations have been a special target of the Auditac workshops as well as regional and local energy agencies attached to local public authorities. Standardisation experts are associated with the team through some key members (Armines, BRE, Inegi). Federations of maintainers and operators have been informed by the Newsletter, but did not establish a specific contact. Owners of existing and new facilities are frequently in contact with agencies or consultants that we are informing indirectly, but a sufficient sample were associated through the case studies, and the messages can be “tested” on them. For a complete list of papers and oral communications see our web site Currently, all papers are available on the homepage (http://www.eva.ac.at/projekte/auditac). All public deliverables have been made available on this web-site as soon as it became possible. 1.3 Terminology, namely definitions of pre-audit, ECOs, audit(“TG 1: Are you sure you are not paying for inefficient cooling?” downloadable from http://www.eva.ac.at/projekte/auditac.htm ) Inspectors or auditors are external or internal engineers (or qualified technicians) in charge of establishing the status and proposing improvements on a plant which is not in failure mode. In case of failure, a maintainer should be called, not an auditor… Inspection or audit will be the initial stage of any of the following actions: starting or restarting operation of a plant, re- or retro-commissioning, continuous commissioning (if not yet in way), study of possible renovation, etc. A simple diagram like the following one indicates that the human mind (or a company organisation) has to go through various stages to reach Energy Efficiency: is there an opportunity? (Pre audit) how large could be the benefit and the cost of my action? (audit) then decisions, and detailed costing, then checking the results. The equipment and the operational mode cannot progress separately: both have to be improved together. See figure 1.

AUDITAC Final Report February 2007
10
Figure 1: progress in operations and progress of equipment are both necessary
What can lead these different actors to have a given building audited?
· A building owner who is also the occupant and the operator of his building manages his energy consumption and makes benchmarking on the comfort level or total costs. The detection of a problem during that phase can lead to a pre-audit by an independent expert. May be followed by a real audit or not. · A building owner who is not the occupant of his building is interested by the value of his building in case of a possible sale. Any action that could improve that asset value is profitable so that he can have his building pre-audited by an independent expert. May be followed by a real audit or not. · An occupant, who is not the owner of the building he uses, pays attention to comfort problems or running costs, because he pays the energy bill. Occupants can also be interested in a pre-audit of the building they use, in order to have their bill decreased. May be followed by a real audit or not. - It is obviously profitable for an integrated operator, who is a third party, to make a pre-audit of a building before signing a contract with the building owner. Indeed, he can have information on the status of the installation in order to predict the possible operating costs. May be followed by a real audit or not. · Finally, every actor linked to a building can in theory be interested in a pre-audit. After that, each actor is free to invest in a detailed audit before any investment. However, there is often a factor giving birth to an audit close to the end of the life of a plant . In the normal life of the plant it can only be a significant failure. We will see later that EU inspection from EPBD aims at introducing other audit opportunities. Normally an audit occurs only once in the life of a plant : large failure, or ownership change, or deep retrofit.
Energy Efficient design or renovation
Energy Efficient operation
Deciding pre audit of equipment and operations
Deciding full Audit on equipment and operations
Hardware improvements
POOR DESIGN ORPOOR STATUS
POOR OPERATIONALSTANDARD
Software (control and managementstrategies) improvement
+
The three steps of performance improvement

AUDITAC Final Report February 2007
11
Figure 2 the life cycle of the plant in absence of any Energy Efficiency objective
The normal life of an HVAC plant leaves no room for Energy oriented retrofit : availability (avoidance of failure) is the only objective, as shown on figure 2.
Modelling the audit process Auditac identified the following four processes that can be called “audit”:
• Benchmarking • Pre audit • Audit • Investment grade audit
1. Benchmark the energy consumption(“TG 7: A benchmarking guide for owners and energy
managers adapted to air conditioning based on electricity bills?” downloadable from http://www.eva.ac.at/projekte/auditac.htm )
Benchmarking with yourself and with others is a good management practice. When maximizing the operating efficiency of a system, a number of factors must be considered including fuel source and cost, electrical consumption, air filtration, equipment life, maintenance costs and more. These costs are often very visible. Controlling them has a direct impact on the day-to-day cost of building operation and can impact a company's profitability. Reducing HVAC operating costs to a point where occupants are dissatisfied has other costs associated with it, including increased costs due to absenteeism, loss of people due to employee turnover, recruiting, training and decreased productivity to name but a few. So it is important to balance comfort against cost so that both are optimised. Benchmarking or analysis of consumption considers specific consumption per square meter and compares with other buildings with similar characteristics (use, size, etc.) to decide if it is necessary to launch a true audit. The benchmarking is based on all forms of energy consumption. But some think that benchmarking is impossible due to too much noise in the data and disaggregation uncertainties, and that only the documentation validated by the visit leads to a causal reasoning, and so leads to the targeting of some improvements.
2. Inspection (“pre-audit”) One type of pre audit becomes mandatory under EPBD : however it will be different according to Member States and so it is urgent to generate good practice recommendations for pre audit. Pre audit is a quick investigation of possible faults correction or improvements, typically within 0.5-1-2 days, with no permanent instrumentation. Potentially there is room for short duration monitoring. It is meant to identify problems or subsystems worth further investigation.
Preventive MaintenancePreventive
Maintenance
Audit
CurativeMaintenance
AuditAudit
CurativeMaintenance
CurativeMaintenance
Design & Construction Occupancy and operation…Design & Construction Occupancy and operation…Design & Construction Occupancy and operation…
FailureFailure

AUDITAC Final Report February 2007
12
In a pre-audit procedure one detects the faults in the AC systems with visual detection and with measurements. Pre-audit involves minimal interviews with site operating personnel, a review of facility utility bills and other operating data, and a walk-through of the facility to become familiar with the building operation and identify glaring areas of energy waste or inefficiency. Typically, only major problem areas will be uncovered during this type of audit. This level of detail, while not sufficient for reaching a final decision on implementing proposed measures, is adequate to prioritize energy efficiency projects and determine the need for a more detailed audit. Pre-audit activities, in general order, should include:
• Identify HVAC system • Evaluate the condition of the system • Find out and describe the possible impact of improvements to those system • Write up a pre-audit report
Pre-audit is a less costly audit, but a pre-audit should yield a judgement about savings potential and a list of energy conservation opportunities through improvements in operational and maintenance practices. The pre-audit information should be used for a more detailed audit later if the preliminary savings potential appears to warrant further auditing activity. Figure 3 gives an overview of the process.
3. Audit Now the real audit should estimate potential costs and savings and give a quantitative determination of potential improvements. It can take 1-10 days according to building size. Can be spread out over 1-6 month. Possible monitoring can extend over weeks. The audit builds on the pre audit. This last one has defined a short list of ECOs that one has to study further. They are “ticked” in figure 3. Some actions can be applied readily during or just after the pre audit; they are indicated with a “red star” here.
Figure 3: our model of preaudit and audit process
Easy to implement actions, no need for detailed audit, operational
Checking the envelope use and
structure
Visual inspect the plant
Check for thepresence of O&M
activities and contract
Activating the detailed audit tasks
Considering a list of energy conservation opportunities (ECOs)
Actions taking place during
preliminary audit
Reduce internal loads
Improve insulation
Add solar shading
Install BEMS
Change the setpointtemperatures
Calculate the savings from load reductionthrough replacement with EnergyStar facilities
Use better filters
Optimise the filter replacement frequency
Feasibility, need for details
Yes No
Yes No
Yes No
Yes No
Yes No
Yes No
Yes No
Assess the investmentfor envelope changes
Calculate the investment
Asses the impact on solar loads reduction
Calculate the best investment with savings

AUDITAC Final Report February 2007
13
4. Investment grade audit The Investment grade audit should justify expenditure. It is an audit of costs and benefits based on careful engineering study, necessary to justify investment. Typically carried out for the owner by a company or expert consultant, cannot be given to a simple “inspector”. ESCOs are integrating such audits with funding and operation services The budget for such an audit can be obtained more easily at the time of systems and building refurbishment. 1.4 The rapidly developing context due to EPBD(“TG 2: Energy Auditing of Air Conditioning Systems and the Energy Performance in Buildings Directive : what does the new regulation say?” downloadable from http://www.eva.ac.at/projekte/auditac.htm) The review of existing audit methods proved they were very scarce. A number of measures in the EPBD don’t benefit from experience feedback. The status of future field implementation of Article 9 and of the CEN draft for inspection is still unclear and we had to decide to help the process by gathering potential amendments and users’ views. We should remind a few important texts here: article 9 of EPBD , and the draft CEN standard. We have also to say something about the interactions between building certification and building audit.
Article 9 of DIRECTIVE 2002/91/EC of the EUROPEAN PARLIAMENT and of the COUNCIL
of 16 December 2002 on the energy performance of buildings (EPBD). “With regard to reducing energy consumption and limiting carbon dioxide emissions, Member States shall lay down the necessary measures to establish a regular inspection of air conditioning systems of an effective rated output of more than 12 kW. This inspection shall include an assessment of the air-conditioning efficiency and the sizing compared to the cooling requirements of the building. Appropriate advice shall be provided to the users on possible improvement or replacement of the air-conditioning system and on alternative solutions.”
Figure 4: the EU directive on Energy Performance of Buildings is directed to MS

AUDITAC Final Report February 2007
14
There is still much uncertainty about the effects expected from the implementation of the inspection of AC facilities The Member States are exploring the weight to give to the various aspects: things seem so simple for the heating side(article 8) in comparison with Air Conditioning! The basic difference between heating and air-conditioning is the following: in air conditioning it is enough to check frequently the state of the main equipment (the boiler for heating, in our case the compressor) and to think about the system at the end of its lifetime. For air-conditioning, the system is the problem! We could even say that the compressor is not the most sensitive part of the system in terms of Energy Efficiency, although it breaks when poorly maintained. Due to accumulated knowledge about heating efficiency, the Member States introduced a reasonable level of flexibility in the heating inspection section (Article 8 of the EPBD). As a result the difference between heating and cooling systems inspection is in the other direction that one could expect: flexibility decided in common for heating and an ambitious and wide inspection for Air Conditioning, left to Member States.. The real purpose of article 9 is not to decide bureaucratically on what is correct or not but to initiate a continuous improvement process that will set up higher quality standards in Air Conditioning: either diagnosis and correction of existing systems operation (on short term) or audits followed by investments and improvement works (on a longer term). There is still a big demand for field evidence about that issue from the MS. So the Member states are working for the national implementation of inspection in a challenging context. Nobody has tested on field the measures of inspection. Nobody has solved yet the problems of creating and maintaining a file of installation to be inspected at low cost. The Member States still have to decide. The MS can expect many things from an inspection, but it will not be the same inspection depending on the wording they give to their expectations:
• Objective of safety (see Italian inspection of boilers) • Objective of reliability and cleanness: one wants to check maintenance, not the performance. • Objective of energy efficiency assessment, similar to what we define as a pre audit.
Due to the constraints, the CEN draft prEN 15240 is more centred on the second perspective In many countries the standard prepared by the CEN will be taken into account for the methodology of inspection scheme but very simplified, for cost reasons. In a regulatory impact assessment we cannot compare the price of a pure checking of maintenance, simplified compared with the CEN draft and the benefit of a real energy audit. It is this distorted comparison which is often made, unfortunately.
Guidelines for inspection of air-conditioning systems (prEN 15240) It is not the intention of the standard to have a full audit of the air conditioning system but a correct assessment of its functioning and main impacts of the state of the plant (maintenance, control) on energy consumption. The results that you can expect of a complete CEN type inspection (figure 5) are : advice in case of outdated, incomplete or missing documentation, state of inspected refrigeration equipment, of outdoor heat rejection of heat exchangers, of delivery systems in treated spaces , of ductwork, of building system controls and control parameters, index of energy consumption meters in place.

AUDITAC Final Report February 2007
15
Figure 5: the CEN draft under review
The inspection described is intended to include all types of comfort cooling and air conditioning systems that provide a total cooling output for the building above the specified 12 kW which is in turn taken to mean the rated cooling capacity of the included refrigeration systems. The term “air conditioning system” is used to represent any of the systems described below, which may heat and cool, and includes the associated water and air distribution and exhaust systems that form a necessary part of the system. It also includes the controls that are intended to regulate the use of these systems. It excludes mechanical ventilation systems that provide no mechanical cooling and components that, although they may be co-located in air conditioning systems, are dedicated to providing heating and ventilation only.
Interactions between building certification and building audit. There are market imperfections that make energy efficiency of buildings not taken into account. One of the main reasons for this is the fact that the owner and renter of a building, dwelling or office have different interests. As the renter normally pays the energy bill, the incentive for the owner to invest in energy efficiency is weak. The best way to make these investments more attractive is to provide clear and reliable information to prospective renters. Clear information will influence the rent that can be asked and therefore will be an incentive for owners to make investments in the energy efficiency of buildings and houses. Therefore, to facilitate the transfer of this information on the energy performance of buildings and apartments, energy certificates for new and existing buildings and dwellings should be available when these are constructed, sold or rented out (EPBD, Article 7). This certification should be based on the same integrated approach as used for the minimum standards for new buildings and should include accompanying advice on how to improve the energy performance of the building. “Article 7 Item 2.The energy performance certificate for buildings shall include reference values such as current legal standards and benchmarks in order to make it possible for consumers to compare and assess the energy performance of the building. The certificate shall be accompanied by recommendations for the cost-effective improvement of the energy performance.”
Figure 6: a projected format of Building Certificate

AUDITAC Final Report February 2007
16
If the certificates are based on actual building status, they will request some kind of Audit or Pre Audit. For the existing AC plants, it will be like the inspection (or less than the inspection). However there is a big stake in comfort auditing. The introduction of AC in existing and uncomfortable premises is a big motor of growth, and these plants are not the most efficient because of the constraints. One decision of importance is to enter the world of artificial air conditioning in existing buildings : did we try the various options to improve comfort by other means, in which zone AC is needed, which types etc.? This has an enormous energy impact (our estimate is that 40% of new equipment is in existing buildings). In the case of public authority buildings and certain privately owned or occupied buildings frequented by the public, energy certificates must be prominently and permanently displayed for the public. Public authority buildings and buildings frequented by the general public are able to demonstrate efficient technology and to set examples by incorporating energy efficiency measures into the renovation of such buildings. Appropriate measures can make the public aware of the energy performance of these buildings and also provide recommendations to improve them. This is best done by means of a certification procedure. In the frame of EPBD one could desire a consistency between energy performance certification and inspection: consistent advice, possibility of improving actually the grading by doing what the inspection recommends. In that case the inspection has to be tailored to the methods used to certify performance.

AUDITAC Final Report February 2007
17
2-Recognising the problems of existing Air Conditioning plants
2.1 The systems to be considered Despite the lack of knowledge and previous experience in the inspection of air conditioning, the introduction of article 9 was opportune and timely. Over the last 20 years, the scale of application of air-conditioning in European buildings has greatly increased and, consequently, so has the importance of the associated energy consumption and carbon emissions. The age structure of the stock is such that a growing number of systems now need to be renovated or replaced (after 10-15 years of operation). This presents an opportunity to upgrade their efficiency. This can be seen from figure 7. By comparing the stock of systems in use in a given year (expressed in square meters served) with that 10 or twenty years before the number of such systems can be inferred . Out of the 2.200 Mm2 of air conditioned building area in use in 2010 in Europe, 800 Mm2 will be more than 15 years old
Figure 7. Cooled area (Mm2) in Europe (source EECCAC)
The age of installations is not a problem in itself, if they are of good performance and well maintained and efficiently operated. Unfortunately this cannot be guaranteed, since AC is still a relatively recent innovation and many professionals are not as familiar with the technology as they are with other building services. Building owners are often not as aware of the potential for energy savings as they could be. In addition to savings from better operation and maintenance, the availability of systems and equipment today with much better performance than those on the market 10 years ago provides a substantial saving potential. A SAVE Study (EECCAC) showed that this potential was of the order of 50 % of current consumption. We have to describe all configurations of Air conditioning systems capable of controlling one, two or all of the following items: 1) the air quality (by renewing and filtering the air);

AUDITAC Final Report February 2007
18
2) the environmental temperature; 3) the air humidity content Air conditioning systems are fully described if we describe first how we provide the cooling function, which is the function present in all circumstances, and then if we describe how –for a given cooling system- we provide also air quality, humidity control and heating. Most large plants have to combine a number of systems, each of them addressing different parts of the space having different loads, occupation scenarios, load levels. In this study we have considered only generic systems (one system for one zone) and not the combinations of various systems in such larger plants. Among the many systems to consider (50 or so), some are obviously too complicated, some are infrequent and costly and only half a dozen deserve real interest for their low initial cost or for their comfort or adequacy to the needs. The structure of a CAC system (and consequently its name) results from the accumulation of a number of decisions on the essential components. The first choice determining a system is the choice of the fluid being refrigerated centrally and circulated. The most frequent (and really dominant option) is the use of a chiller that generates cold water (typically at 7°C), which is used to transfer "cold" to the building space partly through a centrally treated flow of air and partly through a water distribution network. Even in this predominant CAC system a choice must be made regarding how to transfer “cold” to the air. There are, for instance, (old) “induction systems” or (old or new) “fan-coil systems” and these can be used with a water distribution network including two, three, or four pipe assemblies. Other systems are applicable to a series of rooms and their application depends on the number of rooms and the general situation of the building. In many cases large Unitary Air Conditioners (or Packages), which are self-contained, direct-expansion (without water) apparatus can be applied as well as Multi Split systems, a particular assembly of residential “split systems”. The VRF (Variable Refrigerant Flow rate) system (also sometimes called a “modulated capacity” system) is a relatively new development on the CAC market that is based on the “split system” and has the potential to produce some interesting energy savings. These descriptions lead to the idea of a tree, of which some significant branches are presented in Figure 8.

AUDITAC Final Report February 2007
19
Figure 8: CAC system description tree showing the most common CAC systems
Two thirds of the cooled area uses one of the Centralised A/C (CAC) technologies as seen from EECCAC. We call centralised technologies all the following (where all system pieces are connected in some way and reaching more than 12 kW): large single or multi-split systems, packaged air conditioning units, either roof-top or not, close control or control cabinets, either using variable flow or constant flow or refrigerant. .
In which sector the systems are used?
We do not use the same air conditioning systems in the various economic sectors, for reasons which are technical and economical. Figure9 gives the best existing estimate of these market shares, which will help us in targeting the audits in some directions.
LOCAL OR CENTRAL
?
LOCAL CENTRAL
ROOM BY ROOM
PACKAGE Roof top
SERIES OF ROOMS BUILDING
R A C Other CAC
FLUID: AIR ONLY FLUID: AIR AND WATER FLUID: REFRIGERANT
A.H.U.s and DUCTWOR K
INDUCTION UNITS
FAN - COIL UNITS
2 pipes 3 pipes 4 pipes
MULTI - SPLIT
V R F
Mixing Displacement
CAV
VAV
Chilled ceiling
WLHP

AUDITAC Final Report February 2007
20
Figure 9: Estimated market shares of techniques used for air conditioning various types of buildings
Conclusions about air conditioning audits main focus in year 2010 The relative importance of the central systems using chillers makes them the most important focus point for audits. They are mostly used in Offices, Hospitals and Hotels (1000 Mm2). The systems using AHU (389 Mm2) deserve more urgently auditing methods because of a larger sensitivity to defects and operations than the FCU based systems. The second focal point would be the “niche” of packaged systems and large splits used in Trade and some offices (297 Mm2). Their unitary capacity is enough to pay back the audit from expected gains. Finally, provided some simplified audit methods are found, it would be interesting to have ways to address tens and hundreds of small air conditioning units used in one same office building (143 Mm2). 2.2 What is the importance of faults and inefficiencies ? Unfortunately, most statistics are based on faults occurring, not on inefficiencies. The fault makes the customer loose the main function: cooling and generates a business for the maintainer. Statistics exist. The inefficiencies on the other hand are usually not detected. No systematic pre audit is made in Europe. When a maintainer corrects a defect at the origin of efficiencies, it Is not specifically reported, no statistics can be found. Occurrence of defaults for rooftop systems has been studied by Braun and Baker in the article “Common Faults and Their Impacts for Rooftop Air Conditioners” (VOL. 4, NO. 3 HVAC&R research July 1998). A database was analysed from a service company that primarily services rooftop air conditioners for stores (table 1). The database contains over 6000 separate fault cases from 1989 to 1995. Frequency of occurrence information helps to expose the “nuisance” faults, those faults that are not expensive to fix, but cause a periodic loss of comfort and frequent visits from service technicians.

AUDITAC Final Report February 2007
21
Table 1Occurrences of faults seen by a service company
Causes for loss of comfort
% Total Occurrences
Controls error 21% Electrical problem 20% Refrigerant leak 12%
Condenser 7% Air handling 7% Evaporator 6% Compressor 5%
Cooling water loop 4% Plugged filters 2% Personnel error 2%
Expansion device 2% Can’t classify 12%
Starting from these statistics, Braun tested in laboratory six types of “soft faults” (faults that don’t stop the system functioning but cause discomfort and breakdown in the long term). This work is centred on rooftop and it is just a starting point for our study because it speaks of faults, not defects. Anyway it shows very well that two of the objectives of the CEN draft, if they are kept in the simplified versions of the MS, have a real field frequency : the errors in setting the controls, the refrigerant leaks. That’s why we will consider hereunder that there is a significant benefit of realising completely the CEN inspection (40% of savings in 25% of plants : 10% of savings on average).
Defects: general terminology Our proposal is to categorise the defects according to: - sources or causes of problems - effects, not in terms of consumption, but mechanical or electrical - energy effects (consumption) - possible observations (not important effects but easy to determine or to measure) - the specific effect, called “failure”. It is difficult very often to measure and to interpret the energy consumption of individual equipment, because it acquires only a certain meaning when related with duties and conditions, leading then to expensive measurements, except when a reliable BEMS is in place. The possible observations are often non-energy quantities, easy to measure, but related with the causes or effects of energy consumption. So we propose the following frame (figure 10).

AUDITAC Final Report February 2007
22
Figure 10: causal reasoning on defects with energy performance degradation
In Auditac, we analyse sources of defects and effects on consumption, not really the sources of complete failure: our main objective is to detect problems which may be solved in order to lower the energy consumption, not to improve the part of the maintenance having only an effect on life duration. Usually owners react in case of failure, but we want them to react also to poor behaviour of a system without failure. So “complete failure” is a part of the tree that will not be analysed in the following.
Defects description A method proposal for describing defects in chillers operation is given hereunder. Only the defects on the hardware (equipments components) are described. Starting from the origin of the defect, we can follow its external consequences on energy and its observable consequences on measurable quantities. Let us take the simple example of the defects related with the case of a worn compressor. (Legend: LP: low pressure / HP: high pressure) described in figure 11.
Origin ofdefect
Energyeffect
Effects of defect
Possible observations Complete
failure
OtherEffects
(HSQE)

AUDITAC Final Report February 2007
23
Figure 11: example of causal reasoning on defects : the compressor
Most defects generate over consumption of electricity but not a fault. We developed completely defect analysis for many pieces of equipment : RAC, chillers, AHU. For air cooled chillers, for instance, the faults considered are: 1. Worn compressor 2. Low refrigerant level (due to refrigerant leakage) 3. Excessive Refrigerant charge 4. Corrosion of the condenser on the air side 5. Defects on fan 6. Fouling of air ductwork 7. Evaporator fouling on chilled water side 8. Evaporator corrosion on the chilled water side 9. Presence of non condensable gazes in the refrigerant circuit 10. Obstruction in the chilled water circuit outside the evaporator 11. Defects on the expansion component TXV (too open /too close) 12. Defective pump outside the evaporator 13. Water filter outside the evaporator 2.4 Detailed analysis of pre-audit, generation of an ECO list and proposal of supporting tools for pre-audit The first step of the pre-audit process should be a collection of information, on site or off site. The information may be collected on the structural and mechanical components that affect building energy use and the operational characteristics of the facility. Much of this information can be collected prior to the site visit. Evaluating energy use and systems before going on-site helps identify potential savings and makes best use of time spent on-site. Pre-Audit by itself includes: Discovering of the actual building, its actual HVAC system, its actual use and its actual occupancy. Determination of the existence or not of faults or possible improvements within the following limits: 1 day on-site, visual verifications, analysis of as built records, system manual, possible complaints and operating costs. Potentially room for short tests of functional performances, but without, or with very limited additional instrumentation (may be just a few checks
Worncompressor
LeaksLP HP
Lower operating efficiency
MeasurePressions
Possible observations
Energyeffect
Effects of defect
Origin ofdefect
Losses At no load
Larger operating duration
Lowercapacity
MeasureCapacity

AUDITAC Final Report February 2007
24
in order to verify that the main equipment is in “normal” use and that the control system is “normally” active).
The elements of a pre audit Within pre-audit various steps can be defined. Prior considering possible improvements of the air conditioning system of industrial, commercial or residential sites, it is necessary to realize an inventory of thermal equipment in place and collect information about it. Some building owners or facility managers have a well documented description of their plants. In other cases, a detailed tour in the building can allow to obtain the necessary information about the installation in order to determine the type of equipment in place. The existence of certain components implies a certain functioning of the installation. People prefer (need) two or more phases of pre-audit: the first one is collection of the information and evaluation of the collected data the second phase is site visit (walk-trough) and the third phase is analysis and reporting. According to situations some think that a certain operation should come first, others select another one. This depends on size, documentation, instruments in place. A possible list of objectives to be considered is:
1. Inventory of thermal equipment in place and documentation 2. Description of planned control leading to a definition of actually cooled area (necessary for
benchmarking) 3. Walk-through audit or quick inspection seen as a way to check or complete those two aspects
and to determine possible faults 4. Field check of maintenance 5. Collection and treatment of electricity consumption data if any 6. Disaggregation of AC data from others 7. Survey of discomfort and air quality and other observations either by users or professionals 8. Collection and treatment of run hours data 9. Local measurement allowing to determine some key parameters (condensing temperature,
e.g.) 10. Benchmarking either on total consumption or on disaggregated AC data, which is not covered
by CEN standard 11. List of ECOs, suggestive of a world of Energy Conservation Opportunities
In some countries the order of chosen operations of audits is the result of a cost effectiveness analysis : first benchmarking from distance giving an indication of the cost effectiveness of the coming for pre-audit, then the pre-audit itself, including not only the potential directions for improvement but also a cost estimate of a detailed audit, then the detailed audit if decided. In our analysis of pre-audit we suggested three distinct steps, a more classic and less discussable approach:
1. preliminary data collection and evaluation, 2. site visit, 3. analysis and reporting.
We describe hereunder a typical approach, but we define at the same time needs for supporting tools that Auditac has tried to satisfy.
Step1: Preliminary Data Collection and Evaluation A pre-site review of documentation about building systems and their operation should generate a list of specific questions and issues to be discussed during the actual visit to the facility. This preparation will help ensure the most effective use of on-site time and minimize disruptions to building personnel. A thorough pre-site review will also reduce the time required to complete the on-site portion of the audit. The first task is to collect and review two years worth of utility energy data for electricity. The
AUDITAC Final Report February 2007
25
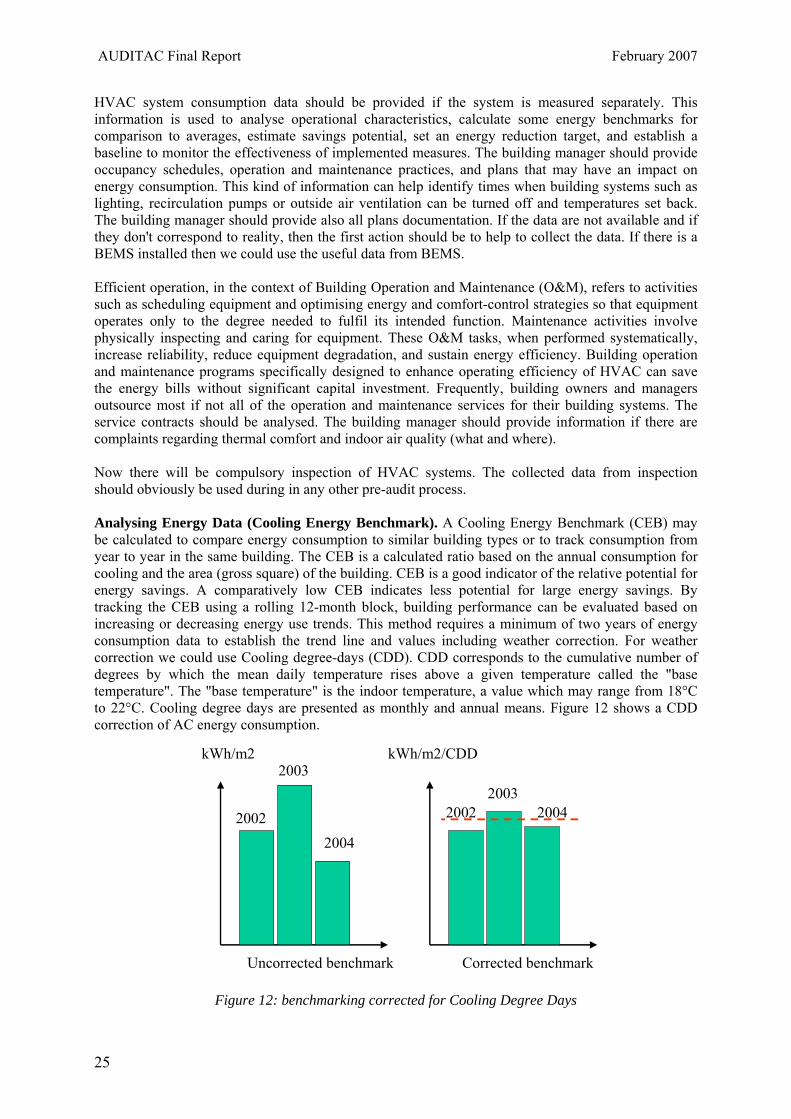
HVAC system consumption data should be provided if the system is measured separately. This information is used to analyse operational characteristics, calculate some energy benchmarks for comparison to averages, estimate savings potential, set an energy reduction target, and establish a baseline to monitor the effectiveness of implemented measures. The building manager should provide occupancy schedules, operation and maintenance practices, and plans that may have an impact on energy consumption. This kind of information can help identify times when building systems such as lighting, recirculation pumps or outside air ventilation can be turned off and temperatures set back. The building manager should provide also all plans documentation. If the data are not available and if they don't correspond to reality, then the first action should be to help to collect the data. If there is a BEMS installed then we could use the useful data from BEMS. Efficient operation, in the context of Building Operation and Maintenance (O&M), refers to activities such as scheduling equipment and optimising energy and comfort-control strategies so that equipment operates only to the degree needed to fulfil its intended function. Maintenance activities involve physically inspecting and caring for equipment. These O&M tasks, when performed systematically, increase reliability, reduce equipment degradation, and sustain energy efficiency. Building operation and maintenance programs specifically designed to enhance operating efficiency of HVAC can save the energy bills without significant capital investment. Frequently, building owners and managers outsource most if not all of the operation and maintenance services for their building systems. The service contracts should be analysed. The building manager should provide information if there are complaints regarding thermal comfort and indoor air quality (what and where). Now there will be compulsory inspection of HVAC systems. The collected data from inspection should obviously be used during in any other pre-audit process. Analysing Energy Data (Cooling Energy Benchmark). A Cooling Energy Benchmark (CEB) may be calculated to compare energy consumption to similar building types or to track consumption from year to year in the same building. The CEB is a calculated ratio based on the annual consumption for cooling and the area (gross square) of the building. CEB is a good indicator of the relative potential for energy savings. A comparatively low CEB indicates less potential for large energy savings. By tracking the CEB using a rolling 12-month block, building performance can be evaluated based on increasing or decreasing energy use trends. This method requires a minimum of two years of energy consumption data to establish the trend line and values including weather correction. For weather correction we could use Cooling degree-days (CDD). CDD corresponds to the cumulative number of degrees by which the mean daily temperature rises above a given temperature called the "base temperature". The "base temperature" is the indoor temperature, a value which may range from 18°C to 22°C. Cooling degree days are presented as monthly and annual means. Figure 12 shows a CDD correction of AC energy consumption.
Figure 12: benchmarking corrected for Cooling Degree Days
Uncorrected benchmark Corrected benchmark
kWh/m2 kWh/m2/CDD
2002
2003
2004
20042003
2002

AUDITAC Final Report February 2007
26
Caution has to be used in benchmarking in order to compare comparable values between different buildings. The best benchmark method would take into account different parameters (weather, sector, air control factors etc.). Actually, there are few air conditioning benchmark references and often general benchmarks are most commonly used and available. Looking at Loads for cooling. Cooling loads include lighting, office equipment, appliances, solar gains and specific processes. The base load can be established by drawing a horizontal line across a graph of energy consumption or cost at the average point of lowest consumption for each energy type. The base load is that portion of consumption or cost below the line. High loads are in general easy to detect and the energy management efforts should be focused on these areas. High loads may reveal opportunities to reduce consumption by making improvements to the air conditioning equipment, temperature controls, the building envelope, or to other systems which are affected by operation. Seasonal loads are identified as the portion of consumption or cost located above the line used to establish base loads on a graph like figure 13. Seasonal loads can be the result of changes in weather or operation of the building. High seasonal loads may reveal opportunities to reduce consumption by making improvements to the heating and air conditioning equipment, temperature controls, the building envelope, or to other systems which are affected by seasonal operation.
Figure 13: example of extraction of likely air conditioning electricity demand from the rest of
consumption
After utility use has been allocated, the pre-auditor should prepare a list of the major energy-using systems in the building and estimate the time when each system is in operation throughout the year. The list will help for identification how each system uses energy and potential savings. Building systems can then be targeted for more detailed data collection. One of the easiest ways to evaluate energy data is to watch for the trends in use, demand, or costs over time. Either graphing two or more years of monthly data on one graph or graphing only the annual totals for several years can help. Another useful method for evaluating monthly data is a rolling summary where a new 12-month total is calculated each month by dropping the oldest month and adding the newest. This curve will remain relatively flat if there are no significant changes in energy use. Even though each monthly figure is an annual total, any sudden change is the result of that month's operation. This is a good graph to see the overall consumption trends of the facility. A gradual increase, for example, may indicate that occupancy or production has increased, or that system efficiency is slowly degrading. Another useful method for evaluating monthly data is a rolling summary where a new 12-month total is calculated each month by dropping the oldest month and adding the newest.
Monthly electricity bill in Summer
kWh/m2
AIR CONDITIONING ?

AUDITAC Final Report February 2007
27
Building Profile. Review of architectural, mechanical, and electrical drawings and specifications for the original building as well as for any additions or remodelling work that may have been done is the first step to creating a building profile. Any past energy audits or studies should be reviewed. The auditor can use this information to develop a building profile narrative that includes age, occupancy, description, and existing conditions of architectural, mechanical, and electrical systems. The profile should note the major energy-consuming equipment or systems and identify systems and components that are inherently inefficient. A site sketch of the building should also be made. The sketch should show the relative location and outline of each building; name and building number of each building; year of construction of each building and additions; dimensions of each building and additions; location and identification numbers of utility meters; central plants; and orientation of the complex. While completing the pre-site review, the auditor should note areas of particular interest and write down any questions about the lighting systems and controls, HVAC zone controls, or setback operation. Other questions may regard equipment maintenance practices. At this point the auditor should discuss preliminary observations with the building manager or operator. The building manager or operator should be asked about their interest in particular conservation projects or planned changes to the building or its systems. The audit should be scheduled when key systems are in operation and when the building operator can take part. General list of ECOs (Energy Conservation Opportunities) could be used for preparation of specific questions or list of specific check points, which should be marked on the floor plans.
Step2: The Site Visit The site visit will be spent inspecting actual systems and answering specific questions released from the preliminary review. The amount of time required will vary depending on the completeness of the preliminary information collected, the complexity of the building and systems, and the need for testing equipment. Having several copies of a simple floor plan of the building will be useful for notes during the site visit. A separate copy should be made for noting information on locations of HVAC equipment and controls, heating zones, light levels, and other energy-related systems. If architectural drawings are not available, emergency fire exit plans are usually posted on each floor; these plans are a good alternative for a basic floor plan. Prior to touring the facility, the auditor and building manager should review the auditor's energy consumption profiles. The auditor and building manager should check (prior to touring) that the equipment described in the documentation is present in place and it corresponds to system specification. Possible deviations should be marked on the floor plans. Description of planned control leading to a definition of actually cooled area should be verified. Pre-auditor should check if the thermal equipment in place corresponds to the plans during the walk-trough the object. The documentation of the components (adjusting belts, dirt cleaning on the evaporator coils, dirt cleaning on the condenser coils, filters replacement intervals, fans maintaining, outside-air dampers cleaning…) should be checked. Some simple measurements could be taken to check functionality of the installed HVAC system (remote temperature measurements on thermal units, air humidity of indoor air, CO2 concentration…). Pre-audit, Indoor Air Quality and Thermal Comfort. The indoor air quality (IAQ) and thermal comfort must be evaluated if we want to have comparable results between various objects. We don't have this information in the case of energy benchmarks. So if we could have information about energy use with weather correction regarding to IAQ ant thermal comfort, then we could have very good benchmark, which could be used to compare buildings by types (office, hospital…). Pre-auditor should be familiar at least with base level theory of thermal comfort and indoor air quality. Only in such case some possible complaints about thermal comfort and IAQ could be evaluated (some measurements could be taken to check IAQ and thermal comfort). The purpose of HVAC systems is to provide a comfortable indoor environment with a low health risk for the occupants in such a way that the energy consumption is low. The perception of indoor environment is composed from the perception of the thermal environment, of the indoor environment humidity, of the air quality, of the acoustic environment and the illumination, and from individual perception of the other environment parameters (colours, health…). Although the indoor environment

AUDITAC Final Report February 2007
28
is dealt separately, it should be considered as a whole. Thermal comfort also included behavioural actions initiated by the conscious of mind. So the evaluation of thermal comfort is very difficult because the thermal comfort is psychological factor! The quality of the indoor environment may be expressed as the extent to which human requirements are met. But there are quite large differences between the requirements of individuals. However the document: CEN CR 1752. 1998. Ventilation for Buildings: Design Criteria for the Indoor Environment, Brussels: European Committee for Standardization could be used for evaluation of indoor air quality to be comparable between the objects. There are presented three categories of environmental quality.
Step3: Analysis and Reporting Post-site work is a necessary and important step to ensure the pre-audit will be useful. The auditor needs to evaluate the information gathered during the site visit, research possible energy conservation opportunities (ECOs) from generic list of ECOs, organize the audit into a comprehensive report, and make recommendations on improvements with list of specific ECOs. Report from pre-audit with possible ECOs should be used as input for further audit phases. The ECOs list is given in annex
Need for supporting tools There are tools to support the pre-audit of heating plants. We have found no real tool for pre-audit of air conditioning, except some check lists, outdated in some cases or only adapted to US practice. That lead us to the definition of new tools within Auditac to support the pre-audit process. About inventory of thermal equipment in place and documentation we think there was a real need : we developed a tool. Description of planned and actual control is a real need on which we have not brought specific support. Field check of maintenance is well supported by the CEN draft. Collection and treatment of electricity consumption, disaggregation of AC data from others, benchmarking of such data is a real need for which we developed a guide. Survey of discomfort and air quality and other observations on comfort is a real need on which we have not been active. Collection and treatment of run hours data may be a complement to electricity bill analysis that we have not developed. Local measurement allowing to determine some key parameters (condensing temperature, e.g.) would be useful, we have not developed that type of tool. A better list of ECOs, suggestive of a world of Energy Conservation Opportunities was needed, we worked on that. Figure 14 shows the location of our new tools in the process.

AUDITAC Final Report February 2007
29
Figure 14: Some Auditac tools may get included in pre audit process
EU Inspection is a mandatory but truncated Pre Audit
How good a pre audit it will be depends on each Member State. Non-mandatory CEN guidance exists. How inspection can become a real pre audit?
• Inspection can identify candidates systems and equipment for renewal • Based on age and condition • But inspection alone cannot assess the potential for savings or the economic case for
improvement • Benchmarking of energy ratios and costs (somewhere between certification and inspection)
would be needed to transform inspection into a targeting pre audit 2.4 Study of the audit phase We enter the audit phase with a list of selected ECOs (Energy Conservation Opportunities) , grouped by families. Each family of potential savings has specific study needs and constraints. We will say a few words about each : Improvement through actions aimed at Envelope and Loads, Improvement through O&M, Improvement through BEMS, Performance enhancement through adequate improvement works.
Improvement through actions aimed at Envelope and Loads Significant energy savings may be achieved by implementing actions aimed at reducing the building cooling load through an improvement of the envelope performance or a better management of the internal heat gains. Such ECOs cover a broad variety of actions, including purely operational / maintenance measures, as well as partial or total replacement of components and systems. Solar gain reduction / Daylight control improvement. One of the main contributions to the cooling load of a building, particularly in the commercial sector, is the solar radiation gain through glazed envelope components. The adoption of largely glazed external envelopes in commercial buildings is justified both by architectural reasons and by daylighting. The optimal selection of the solar-optical properties of glazing, as well as the provision of effective shading devices, is the key factor in achieving a satisfactory balance between the potentially conflicting goals of limiting summer solar
Better lists of ECOsSimplified inventoriesCost evaluation methodsPerformance of past equipmentAC benchmarking tools
TOOLS NEEDED FOR PRE AUDIT

AUDITAC Final Report February 2007
30
gains without penalising the availability of daylight. A reduction in day light availability, in fact, not only determines a direct increase in lighting energy consumption, but may also indirectly increase the space cooling load, since the luminous efficacy of most artificial lighting systems is usually lower than that of natural light. Building retrofits involving the replacement of the whole window system or some of its components (glass, external / internal shades or curtains, shutters, etc.) provide an excellent opportunity to implement such ECOs. With this respect, it is worth mentioning that, due to the high cost of window replacement, usually such actions may not be justified purely on energy savings: therefore, the retrofit should normally be justified on the basis of material degradation, excessive air leakage, poor acoustic insulation , etc. Solar control may also be achieved by acting on landscaping, i.e. through the use of vegetation. Ventilation / Air movement / Air leakage improvement. Natural ventilation in buildings may be an effective energy conservation strategy, based on the proper interaction between building envelope characteristics (air permeability, presence of operable windows, etc.) and internal layout of the building (presence of convective paths). But natural ventilated buildings with poor air tightness may be converted to artificial air conditioning and become huge energy consumers. It is important to control natural ventilation: excessive envelope leakage in fact may be detrimental (both in winter and summer condition) when it implies excessive infiltration of untreated outdoor air; on the other hand, natural ventilation of buffer spaces such as attics is an effective way of removing solar heat gains before they enter the air conditioned space. Free cooling strategies, such as night time over ventilation, is another typical application of this concept since it helps reducing the cooling load in the morning hours. Envelope insulation improvement. This group of ECOs concern actions aimed at increasing the thermal resistance of the building envelope by adding proper insulating material to opaque components such as external walls, basement walls and roofs or by installing low-U-value glazing (double, triple, low-emittance, low conductivity gas cavity, etc.). Such actions have a significant impact on winter heat losses, due to the high indoor-outdoor temperature difference, but may also be beneficial in terms of cooling load reduction, provided that the insulation position does not negatively alter the transient response of the structure, which is a crucial factor in the summer energy balance of the building. The economical attractiveness of these ECOs greatly depends on the possibility of application in conjunction with major building renovation work (e.g. roof or facade refurbishment, window substitution, etc.). Other actions aimed at load reduction. Under this generic heading, miscellaneous ECOs are listed that do not fall into the previous categories. Most of these ECOs are related to the use of lighting (high efficiency lighting sources, optimised lighting management based on effective occupancy or daylight availability) and electrical equipment (use of high efficiency equipment , load management, etc.). These ECOs have a dual energy efficiency significance: they contribute to cooling load reduction, and directly reduce the electrical energy use of the building. The other ECOs in this category (exterior colour selection, evaporative cooling, reduced volume of conditioned space) are building-related.
Improvement through O&M O&M diagnosis and assessment. Building Operation and Maintenance (O&M) is the ongoing process of sustaining the performance of building systems according to design intent, the owner’s or occupants’ changing needs, and optimum efficiency levels. The O&M process helps sustain a building’s overall profitability by addressing tenant comfort, equipment reliability, and efficient operation. Efficient operation, in the context of O&M, refers to activities such as scheduling equipment and optimising energy and comfort-control strategies so that equipment operates only to the degree needed to fulfil its intended function. Maintenance activities involve physically inspecting and

AUDITAC Final Report February 2007
31
caring for equipment. These O&M tasks, when performed systematically, increase reliability, reduce equipment degradation, and sustain energy efficiency. Building operation and maintenance programs specifically designed to enhance operating efficiency of HVAC can save 5 to 20 percent of the energy bills without significant capital investment.
The O&M assessment is a systematic method for identifying ways to optimise the performance of an existing building. It involves gathering, analysing, and presenting information based on the building owner or manager’s requirements. Owners generally have an O&M assessment performed by an independent consultant for the following reasons:
• To identify low-cost O&M solutions for improving energy efficiency, comfort, and indoor air quality (IAQ);
• To reduce premature equipment failure;
• To insure optimal equipment performance;
• To obtain an understanding of current O&M practices and documentation.
O&M assessments identify low-cost changes in O&M practices that can improve building operation. The O&M assessment may be performed first of all in an energy audit because it offers ways to optimise the existing building systems, reducing the need for potentially expensive retrofit solutions, besides because implementing the low-cost savings identified in the assessment can improve the payback schedule for capital improvements resulting from the energy audit.:
• Identifying operational improvements that capture energy and demand savings;
• Identifying operational improvements that positively affect comfort and IAQ;
• Improving building control;
• Developing a baseline report on the condition of major HVAC equipment;
• Developing an updated and complete equipment list (nameplate data);
• Identifying issues contributing to premature equipment failure;
• Identifying ways to reduce staff time spent on emergencies;
• Increasing O&M staff capabilities and expertise;
• Determining whether staff require additional training;
• Identifying and gathering any missing critical system documentation;
• Developing a complete set of sequences of operation for the major HVAC systems;
• Evaluating the BEMS for opportunities to optimise control strategies;
• Developing an operating plan and policy to maintain optimal building performance over time.
The best benefits keep on giving long after the process is completed. For example, the final master log of recommended improvements along with the estimated savings allows an owner or building manager to prioritise and budget accurately for the implementation process. Also, minor problems that could be solved during the assessment may begin to reduce energy costs and improve comfort immediately; equipment life may be extended for equipment that may have failed prematurely due to hidden problems, short-cycling, or excessive run time.
Inclusion of proper clauses in O&M service contracts. Frequently, building owners and managers outsource most if not all of the O&M services for their building systems. Several factors contribute to increasing business opportunities for O&M service providers in commercial buildings. These include:
• Growing interest in indoor air quality (IAQ) issues;
• Phase-out of CFC refrigerants;

AUDITAC Final Report February 2007
32
• Building owners’ and managers’ desire to reduce operating costs and assure reliability;
• Building owners’ and managers’ desire to be environmentally responsible.
The research required to design and obtain a good O&M service contract is often too confusing and time-consuming for the typical owner or manager to pursue. The purpose of this section is to provide some information on service contract options and trends to building owners, facility managers, property managers, and chief building engineers.
In the service companies, there is no standard or set of definitions for the various kinds of service contracts. Each mechanical or maintenance service contractor puts together a unique package of contracts. The package often consists of three or four types of contracts: full-coverage, full-labour, preventive-maintenance, and inspection contracts. The newer concept of an end-use or end-results contract is also briefly discussed. There can be many variations within a contract type, depending on owner needs and contractor willingness to modify or customize service offerings. Most of the contract types discussed below can encompass either the entire mechanical system or just one piece of major equipment such as a chiller. Also, owners may have more than one type of contract in place at any given time. Full-Coverage Service Contract. A full-coverage service contract provides 100% coverage of labour, parts, and materials as well as emergency service. Owners may purchase this type of contract for all of their building equipment or for only the most critical equipment, depending on their needs. This type of contract should always include comprehensive preventive maintenance for the covered equipment and systems. If it is not already included in the contract, for an additional fee the owner can purchase repair and replacement coverage (sometimes called a “breakdown” insurance policy) for the covered equipment. This makes the contractor completely responsible for the equipment. However this responsibility is limited to availability, and does not include energy efficiency guarantees. Full-Labour Service Contract. A full-labour service contract covers 100% of the labour to repair, replace, and maintain most mechanical equipment. The owner is required to purchase all equipment and parts. Although preventive maintenance and operation may be part of the agreement, actual installation of major plant equipment such as a centrifugal chillers, boilers, and large air compressors is typically excluded from the contract. Same remark. Preventive-Maintenance Service Contract. The preventive-maintenance (PM) contract is generally purchased for a fixed fee and includes a number of scheduled and rigorous activities such as changing belts and filters, cleaning indoor and outdoor coils, lubricating motors and bearings, cleaning and maintaining cooling towers, testing control functions and calibration, and painting for corrosion control. With this type of contract the owner takes on most of the risk. Energy efficiency not included either. Inspection Service Contract. An inspection contract is purchased by the owner for a fixed annual fee and includes a fixed number of periodic inspections. Inspection activities are much less rigorous than preventive maintenance. Low cost is the main advantage to this contract, which is most appropriate for smaller buildings with simple mechanical systems. Obviously there will be a tendency to combine this “inspection” with the new EU “inspection”. End-Results Contracting. End-results or end-use contracting is the newest concept in service contracting and is not yet widely available. The outside contractor takes over all of the operational risk for a particular end result, such as comfort. In this case, comfort is the product being bought and sold. The owner and contractor agree on a definition for comfort and a way to measure the results. If comfort defined by dry-bulb temperature is the only end result required, then the owner takes on the risk for ameliorating other problems such as indoor air quality, humidity, and energy use issues. Maximum contract price is tied to the amount and complexity of the end results purchased. Some of these end-use contracts include the purchase of electricity by the service company. Then, they may put a pressure on the service company to realise energy savings.

AUDITAC Final Report February 2007
33
Energy Performance Contract . An Energy Performance Contract (EPC) is an agreement by an Energy Service Company (ESCO) for the provision of energy services in which energy systems are installed, maintained, or managed to improve the energy efficiency of, or produce energy for, a facility in exchange for a portion of the energy savings. A preliminary project scope should be included in the Request For Proposals so that a more effective comparison can be made of proposals used in selecting an ESCO. The project scope must be directly related to energy savings. Projects that do not reduce energy use are not appropriate. Classification of O&M ECOs. The ECOs of the O&M type have been subdivided into four sub-categories:
• Facility Management: energy-related recommendations to building owner or manager. • General HVAC system: may be implemented irrespectively of the type of HVAC system or
subsystem being addressed. • Cooling equipment: concerning chillers and cooling towers, as well as their components • Fluid handling and distribution: concerning Air Handling Units, fans, ductwork, pumps,
piping, etc.
Automated O&M (through a BEMS : Building Energy Management System) is a way of giving permanent application to some of O&M ECOs. The possibility of BEMS implementation is indicated with a Y in the ECO list third column of the table in our ECO list, like in the extract hereunder – figure 15.
Figure 15 Extract of the ECO list (full list to be downloaded from http://www.eva.ac.at/projekte/auditac.htm)
Improvement through BEMS
Once a Building Energy Management System (BEMS) is in place and fully operational, the facility manager who will supervise its operation may look towards optimisation. Before trying to optimise a system, it is important to understand basic BEMS capabilities. Features may vary widely from model to model, but some basic capabilities are almost universal. In this document the interest is focused upon energy management. The standard BEMS capabilities are:
ENVELOPE AND LOADS CODE ECO BEMS
control
SOLAR GAIN REDUCTION / DAYLIGHT CONTROL IMPROVEMENT E1.1 Install window film or tinted glass E1.2 Install shutters, blinds, shades, screens or drapes E1.3 Operate shutters, blinds, shades, screens or drapes Y E1.4 Replace internal blinds with external systems E1.5 Close off balconies to make sunspace/greenhouse E1.6 Modify vegetation to save energy E1.7 Maintain windows and doors
VENTILATION / AIR MOVEMENT / AIR LEAKAGE IMPROVEMENT E2.1 Generate possibility to close/open windows and doors to match climate Y/N E2.2 Ensure proper ventilation of attic spaces Y E2.3 Optimise air convective paths in shafts and stairwells E2.4 Correct excessive envelope air leakage E2.5 Roll shutter cases: insulate and seal air leaks E2.6 Generate possibility of night time overventilation

AUDITAC Final Report February 2007
34
• Scheduling
• Set-points
• Alarms
• Safeties
• Basic monitoring and trending
With each of these features, there are opportunities to move beyond minimal utilization without significant effort or complexity. Selected control strategies that can save energy or reduce demand are listed in the following table2.
Table 2 What you can expect from a BEMS
Scheduling Lockouts Miscellaneous • Holiday scheduling • Zonal scheduling • Override control and tenant billing • Night setup/setback • Optimum start • Optimum stop • Morning warm-up/cool-down
• Boiler system • Chiller system • Direct expansion compressor cooling • Resistance heat
• Simultaneous heating/cooling control • Zone-based HVAC control • Dual duct deck control • Chiller staging • Boiler control • Building space pressure • Variable speed drive control • Heat recovery
Ventilation Control Energy Monitoring Lighting • Carbon dioxide • Occupancy sensors • Supply air volume/OSA damper compensation routines • Exhaust fans
• Whole building or end-use • kWh or demand
• Lighting sweep • Occupancy sensors • Daylight dimming • Zonal lighting control
Air-Side Economizers Resets Demand Control • Typical air-side • Night ventilation purge
• Supply air/discharge air temperature • Hot deck and cold deck temperature • Mixed air temperature • Heating water temperature • Entering condenser water temperature • Chilled water supply temperature • VAV fan duct pressure / flow • Chilled water pressure
• Demand limiting or load shedding • Sequential start-up of equipment • Duty cycling
Evaluating the current Building Energy Management System. In addition to clearly defining a building’s BEMS needs, an owner or facility manager must also evaluate the state of the current system. Is the current system operating to its maximum capability? If not, why not? Are there energy management strategies the current system cannot perform? For example, an BEMS may not be able to implement strategies because it cannot interface with DDC terminal equipment controllers (VAV boxes, fan coil units, unit ventilators, etc.).
Performance enhancement through adequate improvement works

AUDITAC Final Report February 2007
35
The ECOs of the “Plant” type always imply some modification or replacement work on the HVAC system; they are subdivided into six sub-categories:
• BEMS and Controls / Miscellaneous: ECOs implying an improvement in control strategies at the hardware level.
• Cooling equipment / Free cooling: ECOs concerning chillers and cooling towers; energy-efficient cooling strategies (such as free cooling, cold storage, use of ground eater, etc.)
• Air handling / Heat recovery / Air distribution: ECOs concerning air handling and distribution equipment; energy-efficient air treatment strategies.
• Water handling / Water distribution: ECOs concerning water handling and distribution equipment; energy-efficient water distribution strategies.
• Terminal units. • System replacement (in specific limited zones)
The possibility of BEMS implementation is indicated with a Y in the ECO list third column.
Need for supporting tools There are tools to support the detailed audit of heating plants. We have found no real tool for auditing air conditioning. That lead us to the definition of new tools within Auditac to support the pre-audit process. The detailed study of selected ECOs is subject of one of our guides. Customer Advice may be performed based on experience but also on modelling the situation : either CAT when you start from the existing envelope and equipment or EES (Simplified load calculation tool defining the consumption of ideal system with the same comfort demands). Using a component as measuring device is an inexpensive way of getting rapidly quantitative information (namely extensive quantities like flows, which are too expensive to measure in many cases). In all cases performance data of past equipment should be retrieved and documented case studies are useful. Figure 16 shows the localisation of some necessary new tools in the audit process.
Figure 156: Some Auditac tools may get included in the detailed audit process
More about ECOs.Customer AdvicePerformance data of past equipmentCase studiesLow cost measurement
TOOLS NEEDEDFOR AUDIT

AUDITAC Final Report February 2007
36
2.5 Study of the economics of renovation : basics Each family of potential savings has specific study needs and constraints. We will say a few words about each.
Methods for the cost-effectiveness evaluation of ECOs
To evaluate the cost – effectiveness of energy retrofit projects, several evaluation tools can be considered. The basic concept of all these tools is to compare among the alternatives the net cash flow that results during the entire lifetime of the project. The evaluation methods most adapted to renovation projects are described in the following sections.
Net Present Value (or Worth)
The present worth of the cash flows that occur during the lifetime of the project is calculated as follows:
where: SPPW (d,k) [Single Payment Present Worth after N years] = P/F = (1+d)-k = value of the cash flow P needed to attain a needed cash flow F after k years N = lifetime d = discount rate CF = cash flow
The initial cash flow is negative (a capital cost for the project), while the cash flows for the other years are generally positive (revenues). For the project to be economically viable, the net present worth has to be positive or at worst zero (NPW ≥ 0). Obviously, the higher the is the NPW, the more economically sound is the project. This method is often called the net savings method since the revenues are often due to the cost savings from implementing the project.
Payback Period (or Pay Back Time PBT)
In this evaluation method, the period Y (years) required to recover an initial investment is determined. Y is the solution of the following equation:
If the payback period Y is less than the lifetime of the project (Y<N), then the project is economically viable and the obtained value of Y is called discounted payback period (DBP) since it includes the value of money. If, as in the majority of applications, the time value of money is neglected, y is called simple payback period (SBP) and is solution of the following equation:
The methods described above provide an indication of whether or not a single alternative of a retrofit project is cost – effective.
∑=
+−=N
kk kdSPPWCFCFNPW
10 ),(*
∑=
=Y
kk kdSPPWCFCF
10 ),'(*
∑=
=Y
kkCFCF
10

AUDITAC Final Report February 2007
37
2.6 Performance maintenance on the field
There are always several actors on customer side in the way to success, even if they belong to the same company : the owner (and usually investor, except in case of TPF), the operator (making short term decisions on functioning), the maintainer, the occupant, etc. None of these has the same information and interest.
There are also various actors on the professional side, installers (contractors, fitters), designers, maintainers, manufacturers, with zones where they are in competition, and others not. We try to provide some “modelling” of the objective for each actor : comfort at lowest immediate cost for occupant, low investment and high asset value for owner, contract renewal for maintainer without energy consideration, some kind of total cost for integrated operators, etc. We will discuss now the objectives not in general, but as far as they can be used to reach the positive goal we have.
On total we have a chain with stronger and weaker links, not the same in each country. Each of the professionals in the following chain can make more or less what its immediate neighbours are supposed to do.
On the paper we can differentiate the objectives. The manager should think in Euros per unit of function (comfortable square meter of office) but he cannot usually reconstitute the cost and make improvement decisions. He may contract an operator or have the operational work done locally by somebody not qualified technically. Professional operation may be more expensive but may provide efficiency indicators. Maintenance takes place on a regular basis or after a breakdown, and aims at availability, not usually thermodynamic performance. The operator can be a maintainer or not. Now the legislation has brought the inspector into the system, but this periodic inspection is subject to cost constraints and may become more a supervision of maintenance than an energy and cost audit. So a real audit remains necessary, and has to be performed by a real HVAC consultant, in conjunction with inspection or not.. The difference between Inspection and Audit remains precisely in the commercial action : an audit is offered by somebody wanting to “sell” something : an improvement in equipment, an improvement in design, an improvement in control. An inspection is supposed to be a legal obligation performed by non-profit people. We would like to suggest that they may be performed by people “already paid” like the maintainers. AREA is a federation of installers’ associations in refrigeration . It has presently 21 Member Associations from 19 European countries. HVAC Designers societies have either a purely intellectual role (like AICVF in France, AICARR in Italy, etc.) or a certain regulatory power about qualification (like CIBSE in the UK, “Ordem dos Engenheiros” in Portugal, etc.). They are all gathered in REHVA at EU level.
Manager
OperatorMaintainer InspectorAuditor / consultant

AUDITAC Final Report February 2007
38
Manufacturers of HVAC equipment are gathered both nationally and at (more and more) at EU level. The European Association of Air Handling and Refrigerating Equipment Manufacturers “Eurovent-Cecomaf” includes fifteen National Associations from eleven countries. HVAC installers have specific techniques, not only the refrigeration aspect (like AREA members). Some installers provide maintenance as well as some manufacturers. However in many countries there are also independent maintainers. Traditionally there are two links between HVAC installers that tackle also some maintenance issues : CEEBTP (COMITE EUROPEEN DES EQUIPEMENTS TECHNIQUES DU BATIMENT) and GCI (Génie Climatique International), association created in 1937. A new link among operators is the recent federation called EFIEES. EFIEES purpose is to promote the activities of Energy Efficiency Service Companies (EESC) in the European Union. These are companies that implement programs to improve energy efficiency in the frame of a maintenance activity, in the wide sense. Building owners and managers are seldom coordinated at national level, even less at EU level. They could have common interests, like good ratios of costs, management tools, advice about BEMS use, etc. It seems not to be the case. Maintenance maintains or restores the main function (cooling), not good control and efficiency (a secondary function). However maintenance people know very well the plant and their action has usually a positive effect on performance. In many cases it seems easy to ask them to do as well “operation” (decisions about set-points, tuning, etc). The nature of maintenance actions depends on the contractual terms chosen : no contract (correction only), contract of means (prevention only), contract of results (availability level for instance). Maintenance is usually paid by the occupant, while works are paid by the owner and increase asset value. The occupant will try to obtain a lower cost maintenance, and this can be seen as one root of the necessity of outside inspection, requested to the owner in the directive : the owner is the only part thinking about future costs and asset value. The existing standards about maintenance do not cover specifically Air Conditioning. EN 13 306, the closest to the subject is a terminology standard for maintaining anything (but software). The profession of maintenance is split and not unified, either nationally or at EU level. Installers capture part of the maintenance market (which part??). Manufacturers capture another part (which part??). A corrective maintenance (after a fault or failure) will just re-launch operation. A preventive maintenance will avoid lack of main function. However the presence of professionals leads to stricter comfort definitions : they may be motivated to adjust comfort levels to meet more strictly the demand. The obligation of maintenance, cleaning, balancing and control of the equipment is a factor of better output of the installations and a guarantee of better energy efficiency. Further to this, the contracting party wants to preserve his market, by offering a range of improvement proposals and measurements intended for the satisfaction of the customer and also proposing attached work, all of those being able to have energy efficiency contents and to contribute to ’continuous progress’. One way of action would be thus to establish a standard of energy efficient maintenance. We see that the “minimum” inspection that most MS will undertake will be a subset of the CEN standard. We are not interested in the frame of this work in insisting on the inclusion of many maintenance checks, very often, and with a large cost. We are interested in the introduction of a few key checks (may be some temperatures, interpretation of meters readings) with a significant energy efficiency content. The maintenance on one site may be split between various firms or concentrated on a single one, depending on complexity and cost. Who maintains what (which systems, which parts of systems)? Today the compressors have very tight tolerances, minimum of friction and high efficiency. Even if

AUDITAC Final Report February 2007
39
mechanical defects on the compressor itself (such as wearing of valves) are relatively frequent and costly, it is often the result of problems outside of the compressor, overloading, lack of balancing, contradictions in control, etc. Unlike other parts, maintenance of the compressor by the manufacturers is really essential. Moving to a contract of operations gives more possibilities to the professional than maintenance only. More risks as well. Good operation is signalled by absence of complaints and a control of running costs. However routine installs itself. The professional has to “materialise” the action in some way. One way is the decrease of consumption with a financial benefit (another one being a survey of comfort). Strong profit sharing can take the form of a target price for service and energy, or for energy alone. As soon as service and energy are integrated in the same bill (that we will call full cost), this gives origin to rationalization, internal to the service provider : increasing investment in time (or small equipment) and saving on energy. A less risky contract will envisage the sharing of energy savings, or excesses of consumption, in relation to a previously defined basic consumption during one given whole season, adjusted according to the period and the climate during the given season. We speak more and more about “Energy services” including in a recent EU directive. The terminology ’Energy Service’ appeared relatively recently, as a generic name to designate a quite broad scope of activities in the energy sector. However, before this name was used, various services in the energy field had been already proposed for a long time by many companies, all more or less based on the concept of ’Energy Performance Contract’. The problem lies mainly with self standing air conditioners including small splits, which don’t deserve a maintenance contract (the only action being the cleaning or change of the filters) but that the owner does not maintain himself either. We can outline three approaches of success from this analysis :
1. the establishment of a voluntary high standard level of maintenance that may be more costly but may include energy efficiency (in other words for instance transferring the EU inspection to a yearly routine for the maintainer)
2. The establishment of a standard of inspection higher than the “minimum core of CEN standard” that is likely to emerge from CA by including a few targeted efficiency checks not only maintenance checks
3. the development of Energy Performance Contracts for operation and the writing of significant clauses proposed for inclusion in contracts, not necessarily to give them a financial motivation for a better commissioning and tuning, through one form or another of profit sharing, like full cost contracting.
2.7 Economics of renovation on the field Since the owner is the only part thinking about future costs and asset value, one success path starting from “inspection” is a clear understanding by the owner of the costs. One significant barrier is that the immediate benefits go to another part : the occupant. So a revision of rental or service agreements should be able in case of significant improvement of the equipment. Depending on legislation about such agreements in each country, there may be a need for a legislative measure.
Let’s assume in the following there are no obstacles : the owner has a perfect information on costs, and there is a contract allowing cost recovery from the occupant.
When does decision take place?
There are several mechanisms by which the owner reaches the conclusion that a new equipment should be ordered and installed. It can be a complete failure (in that case we are close to the situation of first installation). It can be a replacement due to high maintenance costs of an ageing equipment, or lacking availability (which is a similar situation if we use the concept of failure cost). It can be also a
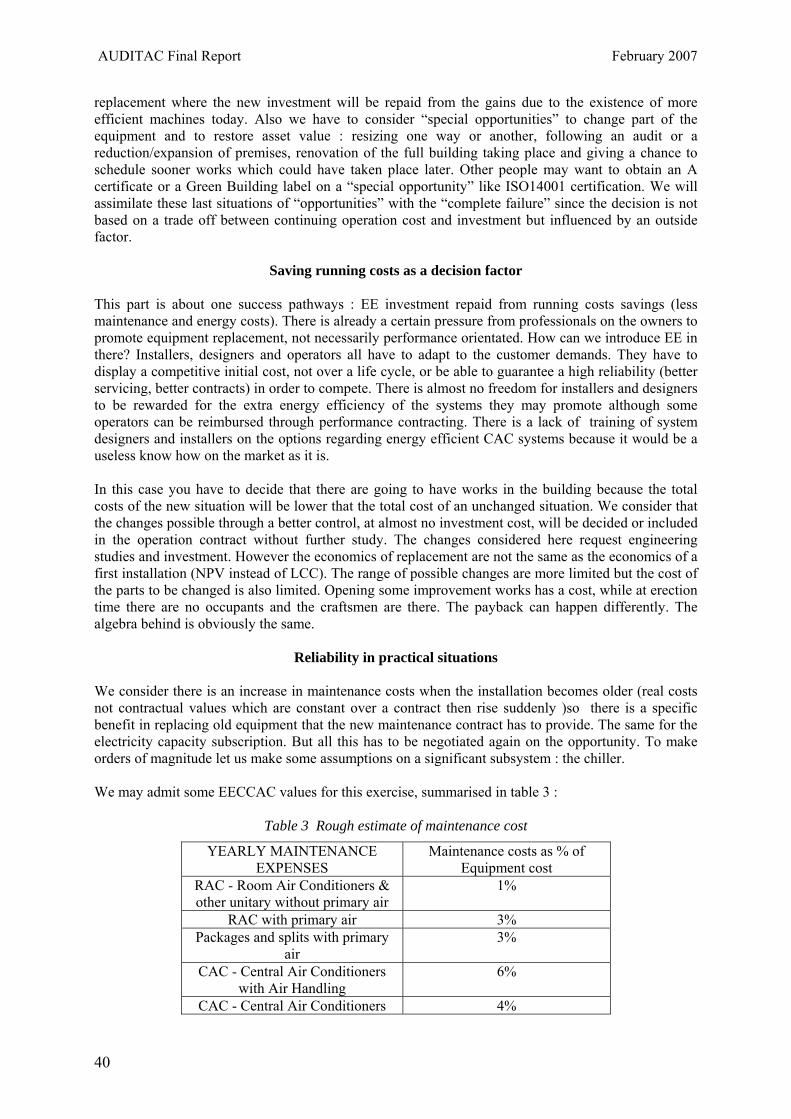
AUDITAC Final Report February 2007
40
replacement where the new investment will be repaid from the gains due to the existence of more efficient machines today. Also we have to consider “special opportunities” to change part of the equipment and to restore asset value : resizing one way or another, following an audit or a reduction/expansion of premises, renovation of the full building taking place and giving a chance to schedule sooner works which could have taken place later. Other people may want to obtain an A certificate or a Green Building label on a “special opportunity” like ISO14001 certification. We will assimilate these last situations of “opportunities” with the “complete failure” since the decision is not based on a trade off between continuing operation cost and investment but influenced by an outside factor.
Saving running costs as a decision factor This part is about one success pathways : EE investment repaid from running costs savings (less maintenance and energy costs). There is already a certain pressure from professionals on the owners to promote equipment replacement, not necessarily performance orientated. How can we introduce EE in there? Installers, designers and operators all have to adapt to the customer demands. They have to display a competitive initial cost, not over a life cycle, or be able to guarantee a high reliability (better servicing, better contracts) in order to compete. There is almost no freedom for installers and designers to be rewarded for the extra energy efficiency of the systems they may promote although some operators can be reimbursed through performance contracting. There is a lack of training of system designers and installers on the options regarding energy efficient CAC systems because it would be a useless know how on the market as it is. In this case you have to decide that there are going to have works in the building because the total costs of the new situation will be lower that the total cost of an unchanged situation. We consider that the changes possible through a better control, at almost no investment cost, will be decided or included in the operation contract without further study. The changes considered here request engineering studies and investment. However the economics of replacement are not the same as the economics of a first installation (NPV instead of LCC). The range of possible changes are more limited but the cost of the parts to be changed is also limited. Opening some improvement works has a cost, while at erection time there are no occupants and the craftsmen are there. The payback can happen differently. The algebra behind is obviously the same.
Reliability in practical situations We consider there is an increase in maintenance costs when the installation becomes older (real costs not contractual values which are constant over a contract then rise suddenly )so there is a specific benefit in replacing old equipment that the new maintenance contract has to provide. The same for the electricity capacity subscription. But all this has to be negotiated again on the opportunity. To make orders of magnitude let us make some assumptions on a significant subsystem : the chiller. We may admit some EECCAC values for this exercise, summarised in table 3 :
Table 3 Rough estimate of maintenance cost
YEARLY MAINTENANCE EXPENSES
Maintenance costs as % of Equipment cost
RAC - Room Air Conditioners & other unitary without primary air
1%
RAC with primary air 3% Packages and splits with primary
air 3%
CAC - Central Air Conditioners with Air Handling
6%
CAC - Central Air Conditioners 4%

AUDITAC Final Report February 2007
41
without Air Handling (except primary)
VRF with primary air 6% This table gives only an average, while we want to study the evolution over the plant lifetime. Let’s admit the maintenance percentage increases from 50% of its average value at the beginning to 150% at the end. What is the maintenance benefit associated with making a substitution of equipment after 15 or 20 years of operation (the conventional duration)? before 15 years ? For an air cooled chiller at 100 Euros/kW, the application of the maintenance rate leads to a yearly maintenance cost of 3 Euros/kW/year at the beginning of lifetime. This is for an air cooled chiller used in a classic air system. Close to the conventional end of life of the chiller its maintenance may rise to 9 Euros/kW/year according to our assumptions. The overcost of an ageing chiller could thus be computed as 6 Euros/kW/year. If we substitute the amortized chiller 5 years earlier, the NPV of 5 years of avoiding that overcost is not negligible, something like 25% of the cost of the new chiller. The anticipation of change costs us the NPV of 5 years of borrowing money, which can be something like 15% of initial cost. The gain would be amplified by the influence of the more expensive fluid of old chillers. However it does not pay for the change.
The role of technical progress in the decision process Now, let’s see what if the energy gain brought by a new chiller can pay for the anticipation of change before break up. There is a trend towards performance improvement with time, still very small. There is a large energy saving potential with some improved equipment but no reward on the market : we can presently buy a top runner almost at the same price as a poor performer (there are trade mark effects which represent imperfectly EE ratings). So we can consider that the substitution of a poor performance equipment by a ”top-runner” on the basis of Eurovent ratings has no specific overcost today. If we base ourselves on the large data base of full load EECCAC data (chapter 3 of report) we find typically a 1.4 EER difference between the highest and the lowest (from 1.9 to 3.29). If we use the smaller data base of ESEER (chapter 8 of EECCAC report) we find a 1.5 SEER difference (from 2.66 to 4.12). The figures are given here for air cooled chillers. Based on the ESEER values difference (which seem to be confirmed by the EER values) a high performance chiller operating 1000h/year installed in lieu of a poor performer would save 133 kWh/year, typically 13.3 Euros. The NPV over 5 years is not negligible, something like 50% of the cost of the new chiller. A better calculation would include the detailed analysis of capacity costs and cost of fluid. We will determine soon the availability gains. It is difficult for a plant owner to decide the substitution of an existing equipment on the grounds of potential savings, except if it is a large equipment and the owner has the know how. So the essential partner for such a change would be an operator having a full cost contract or an installer ready to guarantee savings.
How to give an energy efficiency orientation to renovation of AC? The trade associations of manufacturers are strong enough, either nationally or at EU level Eurovent, to be partners in the process of improvement through renovation. They can analyze the renovation as a new market :
• For better equipment and more sales • For a better satisfaction with their products and wellness of their installers • For new types of products including features making checking and “inspection” easier.
We can outline three approaches of success from this analysis : 4. the revision of laws and regulations to allow cost recovery from owners on occupants, and similar
measures in public markets (like Intracting)

AUDITAC Final Report February 2007
42
5. The establishment of a best practice standard of replacement, some kind of charter, possibly based on Eurovent class A equipment and additional measures, an easily recognisable sign of quality
6. the development of a tool allowing the owner or manager to reconstruct bottom up the full cost of its AC, capacity, maintenance contract, auxiliaries, and to generate variants; the parameters absolutely necessary for such a tool would be obtained through methods to be described or elaborated in preaudit; a preliminary method will be found hereunder.
Combination of EE with reliability improvement or comfort improvement
This is the case of a replacement due to unavailability or discomfort originated by an ageing equipment, two aspects that can be represented by the concept of failure cost. There is the “simple” situation of equipment where some parts are no longer maintainable. The manufacturers have a limited compromise to run a stock of parts for maintenance. Among compressors, some are clearly outdated and parts and expertise are just completely missing : it’s the case of rotary vane compressors (palettes). The other pieces of equipment are just ageing and will experience more failures and generate more maintenance and unavailability costs, more discomfort and complaints. The best paper available on this subject seems to be “Survey of reliability and availability information” by Hale and Arno, ASHRAE Trans, 2001, v107, part 2, paper 4489. The data gathered are rather unique but don’t provide distinct values of MTBF and MTTR according to age. They allow however comparisons between types of equipment from previous generations (like the reciprocating piston compressors) and today dominant types (like the screw and scroll compressors). The quantity with the most significance for comparison seems to be the Operational Availability. As opposed to Inherent Availability, operational availability takes into account all sources of stopping, maintenance or failure. The table 4 gives the OA of various chillers types, according to the nature of the compressor.
Table 4Typical operational availability
Type of compressor
Operational availability
Absorption 99.51% Centrifugal 99.76%
Reciprocating 99.89% Rotary 99.62% Screw 99.66%
There is a reliability benefit in changing from one category to another. We estimate it per kWc as the loss of the value of one working hour (100 Euros invoicing) per failure hour (the total of working hours being 2000h/year). Moving from a rotary to a reciprocating would save 0.54 Euros per kW and per year, around 10 Euros/kW after actualisation, to be compared to 100 Euros/kW for the new reciprocating chiller (in fact the anticipation cost may be only 25 Euros/kW). Reliability by itself does not justify chiller renovation; there should be another source of savings : economies in refrigerant, energy savings. Note that ageing compressors do display a far larger loss of availability than assumed here, but we have no evidence. The CAC system is not only a chiller. It may include one chiller and one AHU (if we see the world from the point of view of one customer). For an AHU the OA is 99.99%. No difference in unavailability! We can outline three more approaches of success from this analysis :
7. Auditing methods should include availability audit and inspection methods should include the treatment of existing failure data on site

AUDITAC Final Report February 2007
43
8. The establishment of a better data base of unavailability costs, namely with ageing would be useful and Eurovent could help, to be used as default values in audit methods when the real parameters cannot be estimated
9. the tool allowing the owner or manager to reconstruct bottom up the full cost of its AC should explicitly include unavailability costs.
Combination of EE with general retrofit
There are “special opportunities” to change part of the equipment and to restore asset value : resizing one way or another, following an audit or a reduction/expansion of premises, renovation of the full building taking place and giving a chance to schedule sooner works which could have taken place later. Other people may want to obtain an A certificate or a Green Building label on a “special opportunity” like ISO14001 certification. We will assimilate these last situations of “opportunities” with the “complete failure” since the decision is not based on a trade off between continuing operation cost and investment but influenced by an outside factor. So we are in the following situation : at a certain time, there will be works in the building. The costs of replacement are lower because the occupants are not here, because the technicians are here with their equipment. The building owner has to decide on the adequate perimeter of changes. The decision will be to change every equipment with a limited reliability, including availability of parts, in the coming 10 years. The owner wants to reconstitute the asset value at a reasonable level. The partial replacement can include obsolescence reasoning : we want up-to-date equipment, even if we could run further the obsolete equipment. The first existing approach is to take into account an expected life duration of the equipment, whatever the maintenance is. These could be :
Type of equipment Conventional life duration (in years) CAC main equipment (not the
weakest parts substituted in maintenance plans)
20
Roof tops and part of split systems exposed to outside
10
Other autonomous systems or system parts inside
15
With such an approach, when a refurbishment takes place for whichever reason, one is going to replace all equipment that have survived more than the conventional value, or (an alternative approach) that are going to reach their conventional value in the coming 5-10 years. In some countries a renovated system has to reach the levels of a new equipment. At least the EPB directive requests MS to ensure that when buildings with a total useful floor area over 1 000 m 2 undergo major renovation, their energy performance is upgraded in order to meet minimum requirements in so far as this is technically, functionally and economically feasible.
Member States shall derive these minimum energy performance requirements on the basis of the energy performance requirements set for new buildings. The requirements may be set either for the renovated building as a whole or for the renovated systems or components when these are part of a renovation to be carried out within a limited time period, with the abovementioned objective of improving the overall energy performance of the building.(Article 6) We can outline two more approaches of success from this analysis :
10. there should be tools for the owner engaged in a deep renovation process, in our deliverables, and in inspection.

AUDITAC Final Report February 2007
44
11. If such results are convincing enough, they could influence national rules deriving from article 6 by representing a best practice standard of renovation. Article 6 of EPBD “Existing buildings” says : “Member States shall take the necessary measures to ensure that when buildings with a total useful floor area over 1 000 m2 undergo major renovation, their energy performance is upgraded in order to meet minimum requirements in so far as this is technically, functionally and economically feasible.”
Various links between EPBD and audits may provide success
Other aspects of EPBD lead to Audits on top of Inspection. As we have seen the introduction of thermal regulation for any renovation will certainly generate more demands for Audit Article 6 Existing buildings Member States shall take the necessary measures to ensure that when buildings with a total useful floor area over 1 000 m2 undergo major renovation, their energy performance is upgraded in order to meet minimum requirements in so far as this is technically, functionally and economically feasible. But also Energy Performance Certification is a good frame for audit. Article 7 Item 2.The energy performance certificate for buildings shall include reference values such as current legal standards and benchmarks in order to make it possible for consumers to compare and assess the energy performance of the building. The certificate shall be accompanied by recommendations for the cost-effective improvement of the energy performance. If the certificates are based on actual building status, they will request some kind of Audit or Pre Audit. For the existing AC plants, it will be like the inspection (or less than the inspection). However there is a big stake in comfort auditing. The introduction of AC in existing and uncomfortable premises is a big motor of growth, and these plants are not the most efficient because of the constraints. One decision of importance is to enter the world of artificial air conditioning in existing buildings : did we try the various options to improve comfort by other means, in which zone AC is needed, which types etc.? This has an enormous energy impact (our estimate is that 40% of new equipment is in existing buildings). Solutions allowing to come back to the comfortable situation before some usage change or passive solutions forgotten in design but still feasible may be less expensive than the introduction of AC in a building not designed for it. We can outline one more approaches of success from this analysis : the inclusion of comfort audit in energy certification before the introduction of artificial AC.

AUDITAC Final Report February 2007
45
3-Realisation of tools helping AC audit for the professionals
3.1 Pre audit tools downloadable from http://www.eva.ac.at/projekte/auditac.htm
We have proposed some new tools :
• A guide based on a list of ECOs (“TG 4: The AUDITAC method of preliminary audit for airconditioning facilities. ?”)
• A simplified inventory method designed to prepare and make easier the audit procedure. This simple inventory method for AC systems can be performed by non technical person, even before pre audit
• AC cost: a simple tool for running costs calculation and savings estimation for some energy improvement measures.
• A benchmarking guide adapted to Air Conditioning based on electricity bills • Using a component as measuring device • The Eurovent database for past equipment could also be used at this stage. Available at http://www.eurovent-certification.com/
AC-COST is a simple tool for running costs calculation and savings estimation for some energy improvement measures (figures 16&17). The questions (green cells) are very few and ratios are used if people don’t know the exact value. The strength of AC-cost is to speak about total cost (running+ investment).
Figure 16: Main AC cost input screen
It was essential for us that the user could input the exact amounts of some running costs when they were known, despite of the availability of a default value.
Figure 17:Possibility to substitute some defaults values by specific values
Years 0 1 2 3 4 5Energy costs(€/year)Water costs (€/year)
Maintenance (€/year)
NPV of the future running costs on x years 0
Running costs calculation for the present plant
If you dont' have any cos t recorded you can es tim ate
your energy and water cos ts clicking here
OREnter your maintenance cost (at least two different years)
then click
If you don't have any maintenance cost recorded you can estimate your maintenance
cost clicking here
OREnter som e energy and water cos ts (at leas t for two different
years ) then click hereThen
Graph of the costs
Project 1: Replacement with same capacity equipment better efficiency
Do you know the EER of the present equipment**? If unknown a default value can
be obtained clicking here
Do you know the EER of the new equipment**? If unknown a default value can be obtained
clicking here
Additional investment (€): if you don't know this value it will be automatically estimated
Total actualised Savings on x years including the new investment paying off (€) on 20 years 0 Average Savings for
running costs (€/year) 0Average savings
for running costs (% per year)
0%
EnergyWater
MaintenancePay back time (=20 if higher than 20 years) 0
Second step: we propose a certain number of measures in order to calculate possible savings, choose one or more projects you can implement on your system to improve its efficiency or reduce its consumption and follow the instructions in the green cells in order to calculate the NPV of the future
running cost and the subsequent savings.
Enter the values in the blue cells then click here
**You can check or obtain the EER of the present and new equipment from the Eurovent database clicking
here in the Consultants tab: http://www.eurovent-certification.com/
or if the system is not included in the certified products you can find default values in the AuditAC technical
guide 6!
AC-costs The sole responsibility for the content of this publication lies with the
authors. It does not represent the opinion of the European Communities. The European Commission is not responsible for any use
that may be made of the information contained therein.
Only for air conditioning systems
2/14/2007
Conditioned area (m²)Default Discount rate for the future costs 8,0%
Climate (choice an item from the list)
System type (choice an item from the list)
Do you know the Installed cooling capacity (kW)?
The system includes a wet tower condenser? (y/n)
In which year the present plant has been installed?Plant age 2007
In which year do you plan to stop the existing plant for complete renovation ?**
Number of years used for calculation -1987,0
**If you don't have planned any date for renovation a default plant lifetime is used (20
years)20
What was the initial cost of the plant (€)?
This tool will allow you to estimate your AC running costs and to assess the effects on these costs of some energy saving measures in two steps. Please follow the instructions in the green cells, fill the blue cells, the yellow cells will show the results of the calculation. When you have finished, before to
begin another calculation please reset and renter the parameters.First step: define what are the running cost of the present equipment
Present plant and calculation characteristics
Reset All
If you don't know it click here to estimate
If you don't know it click here to estimate it
Reset projectsVersion and contact

AUDITAC Final Report February 2007
46
What is behind the interface is described in more details in part 5.3 of the present report.
3.2Audit tools accessible from http://www.eva.ac.at/projekte/auditac.htm We have proposed some new tools
• A guide developing the treatment of selected ECOs. (“TG 5 : Analysis of Energy Conservation Opportunities (ECOs) for air-conditioned buildings?” downloadable from http://www.eva.ac.at/projekte/auditac.htm )
• A computer tool (Customer Advising Tool) to be available on WSA website. • A database of data on the equipment in service on Eurovent website in an easy to use form. • Simplified load calculation software.
The computer tool CAT (Customer Advising Tool) to be available on WSA website. This deliverable is presented as a website at http://www.cardiff.ac.uk/archi/research/auditac/advice_tool.html. This website provides the interface to a searchable database derived from the results of findings from research into both real case studies and simulated forms. The database however includes only the modelled data and has been derived for Office type situations, though may be applicable to other end uses. The modelled data has been derived using version 1.3 of the EnergyPlus software programme. Its basis is to allow users to describe the building they are assessing in terms of geographical location and other easy to assess factors. Guidance is provided on the site for each parameter or criteria for which data should be entered. The CAT then uses the entered building criteria and parameters to provide the user with a range of graphs showing the potential % savings from altering a range of building parameters. The CAT requires the user to enter either building criteria or building parameters. The building criteria are those items that define the building that are unlikely to be alterable by the assessor. The criteria that the CAT requires to be entered are:
• Location / Region – requires the selection of the nearest appropriate weather location from a selection of Vienna, Berlin, Madrid, Paris, London, Athens, Rome, Lisbon, Stockholm.
• Glazing Ratio – All Facades – requires the selection of the approximate area of windows or transparent apertures compared to the overall area of external vertical facades, averaged over the entire building.
• Thermal Mass – requires estimation of the relative amount of thermal mass exposed to the internal air within the building. Choice from lightweight, mediumweight or heavyweight.
• Plan Depth – Choose from shallow, medium or deep plan depths. The relative plan depth, being the ratio of floor-ceiling height compared to the distance between opposing external walls, averaged over all zones within the building. A shallow plan will normally allow daylight and natural ventilation to be used over the entire floor area. A deep plan building will usually be fully mechanically ventilated.
• Number of Storeys – not implemented in the tool but known to have an effect • Building Form – not implemented in the tool but known to have an effect • Internal Layout of Spaces – not implemented in the tool but known to have an effect
Building parameters refer to those aspects of the building which are under control of the occupants or can be varied in some way without major costs. Entering actual values for each parameter for the building being assessed is desirable as the CAT will use this value as a reference in the relevant graph shown on the results page. If no value is entered, the graphs default to a value the authors have taken to represent an average for that particular parameter. The building parameters included in the CAT tool are:

AUDITAC Final Report February 2007
47
• Fabric U-Value - This element refers to the average thermal conductivity of the opaque elements in the external building envelope. The effects of this parameter have been modelled between 0.1 and 4.0 W/m2K, which represents the vast majority of the range of U-values likely to be encountered in actual buildings.
• Window U-Value - This element refers to the average thermal conductivity of the windows and transparent elements in the external building envelope. The effects of this parameter have been modelled between 0.5 and 6.0 W/m2K.
• Solar Heat Gain Coefficient (SHGC) - This is the fraction of incident beam (direct) solar radiation that enters the building. This includes the transmitted solar radiation and the inward flowing heat from the solar radiation that is absorbed by the glazing. The effects of this parameter have been modelled for SHGC’s ranging from 0.1 to 0.9, where 0.1 is highly shaded, i.e. little solar gain, and 0.9 means there is no effective shading – the reduction from 1.0 is simply due to the normal properties of glass.
• Infiltration Rates – This refers to the uncontrolled exchange of air between internal spaces and outside air due to gaps in the building fabric linked to design details. This value is given as the number of complete air changes per hour. The effects of this parameter have been modelled between 0.1 and 4.0 ac/hr, where a well detailed, well-sealed building would be around 0.1 and a very leaky shallow plan building in an exposed and windy location would be around 4.0 ac/hr.
• Internal Gains – This refers to the contribution of small power, lighting and people loads per metre squared floor area. The effects of this parameter have been modelled between 10 and 160 W/m2, where 10 W/m2 represents a very low density of occupation and equipment use, and 160 W/m2 would represent a very high density of equipment and occupancy, such as a call centre.
• Cooling Demand Setpoint Temperature – This parameter allows the assessor to alter the setpoint at which cooling is provided between 21 and 25°C in 1°C intervals. Heating is assumed to be always provided at 21°C.
The search results from the website show graphs of the percentage variation in energy use due to changes in each modelled parameter. Figure 19 shows a typical output page showing the sensitivity of the cooling demand to variations in a given parameter.

AUDITAC Final Report February 2007
48
FiFigure 19 A sensitivity study with CAT
The graphs in the results section can be used to obtain a first estimate of which building parameters are likely to have the greatest effects on the building heating and cooling demand, and therefore where the Inspector/Auditor should concentrate their attention during the site visit when looking for potential means for reducing the cooling loads. The green line on the graphs indicates the parameter value that has been entered. The heating and cooling lines shown in the graphs represent the percentage variation in the total building demand in the time period shown. A positive percentage value shows the predicted percentage increase in demand relative to the demand at the reference specified parameter value. A negative value shows a reduction in demand. The carbon dioxide emissions line shown on each graph is based on average values and is shown only to provide an indication of the overall effects of an action on this metric. It is very dependent on the system efficiencies and emissions factors entered. The annual data shown on the initial results page can be viewed by month for each parameter by clicking on the "monthly data" link by each graph. Similarly clicking on the "Options for Improvement" link will take you to the relevant ECO's Tables for that particular parameter. The percentage savings shown for a particular parameter assume that all other parameters are set to their AVERAGE value, as shown in each graph. To model all possible combinations of parameters was beyond the resources available to this project.

AUDITAC Final Report February 2007
49
Figure 20 Reduction of specific building to its main characteristics Figure 20 shows a part of the criteria entry page of the CAT. The modelling work undertaken to support the CAT covered: - a methodology to provide confidence in the modelling results. - a matrix of scenarios were modelled involving occupancy issues, building fabric issues (such as solar shading, etc), building location issues, and AC system temperature setpoints. Other aspects were covered as well, but this is the essence of the modelling work. Having undertaken this modelling, the matrix of results has been translated into the Customer Advising Tool (CAT) to provide information in a manner such that users can go to the WSA AUDITAC website, located at http://www.cf.ac.uk/archi/research/auditac/advice_tool.html and rapidly obtain a basic overview of the building behaviour. The modelling methodology used was validated by assessing the predictions from the modelling against the real data from the UK’s Office buildings monitoring. The database of Case Studies produced in WP6 complements the Customer Advising Tool. The Tool and advice structure is simple to understand for each country in accordance with the general range of Auditing and Inspection methods being proposed. The advice in the CAT also reflects the list of Energy Conservation Opportunities as published in AUDITAC Technical Guide 5. Clearly, the more accurate the detail that is provided to describe the situation, the more accurately the CAT will tailor the information provided. It was anticipated that the CAT would enable the user to print off a checklist to take on site, but instead the time was spent developing a version of the CAT that allows it to be run on a laptop, thus simply allowing the assessor to take the laptop to site with the details. A printable version of the outputs is being worked on to allow the assessor to simply take paper to site if desired.

AUDITAC Final Report February 2007
50
Once this checklist has been filled in, the user can then return to the CAT and fill in what the situation actually is, or simply update the CAT while onsite. Noting that certain actions have already been undertaken, or are not feasible enables the auditor/inspector to be left with a range of potentially applicable actions along with an indication of the range of energy savings likely to be achieved by each action in their particular location. These potential energy savings can be corroborated by reference to the Case Studies in WP6 as well if any are applicable.
Eurovent website The Eurovent website for past equipment is meant for consultants, auditors. The database allows comparing data and performances of old equipment (from 1990 certified products) with equipment in sale today, avoiding the waste of time often due to the lack of accessible information on old equipment and reliable information of new equipment. It is likely that most users will be professionals in the audit phase. Available at http://www.eurovent-certification.com/
Figure 21: Welcome screen of Auditac data base on Eurovent web site
Eurovent is publishing, since 1995, each year a paper directory of certified products. In addition, a CD-ROM is published since 2002. At the same time, the certified products of the current year are available on Eurovent website, www.eurovent-certification.com. The objective is to give to the market and consultants instantaneous information. As a partner of Auditac project, Eurovent has decided to publish on the website the old directories in order to help auditors to find easily performances of installed certified products. The products available on Eurovent website from old directories are listed in table 5 below. From the home page, www.eurovent-certification.com, auditors have to go to Consultants heading and for the concerned year, a list of certified products of certified manufacturers is available. AC1: Comfort Air Conditioners up to 12 kW AC2: Comfort Air Conditioners between 12 kW and 45 kW AC3: Comfort Air Conditioners between 45kW and 100 kW CC: Close controls FC: Fan Coils FCP: Ducted Fan Coils LCP: Liquid Chilling Packages.

AUDITAC Final Report February 2007
51
Table 5 Number of certified units per year and programme
AC1 AC2 AC3 CC FC FCP LCP 1995 1528 383 26 429 702 1996 1127 320 72 232 847 125 1997 1563 455 66 238 1168 459 1998 1979 528 125 213 1630 552 1999 2070 566 140 257 1816 564 2000 1898 458 126 203 1106 764 2001 3107 708 145 250 2415 1079 2002 4005 816 172 187 3098 1777 2003 4944 1256 118 169 4100 4003 2004 4732 911 220 185 4373 3435 2005 4448 904 236 108 3942 386 5409
Although the certification of some products and/ or some characteristics has been introduced later, like Ducted Fan coils programme or EER and COP , we decided to use 2006 format for the old directories. This is the typical form that is given to performance of past equipment:
Figure 182 Results of a search on Auditac data base on Eurovent web site
Based on that knowledge, there can be a replacement strategy based on Energy Efficiency of key components.
Default performance values(“TG 6: How to benefit from the Eurovent- Certification database
and to retrieve past equipment data in the audit process?” downloadable from http://www.eva.ac.at/projekte/auditac.htm )
The Eurovent directory does not cover all equipment : older equipment (only from 1995 on certified products), equipment without plate or when the manufacturer did not accept an independent check, etc. are not covered. There was a need for default values for unknown equipment that the group generated statistically. The result is the following tables 6&7 :
Table 6 default EERmin
Splits and multi splits
PF<12Kw 12kW<PF<45kW 45kW<PF<100kW

AUDITAC Final Report February 2007
52
Air cooled Water cooled Air cooled Water cooled Air cooled Water cooled
2.21 2.50 2.21 x 2.22 x
Packaged units PF<12Kw 12kW<PF<45kW 45kW<PF<100kW
Air cooled Water cooled Air cooled Water cooled Air cooled Water cooled
2.01 2.91 2.01 2.90 2.01 3.06
Chillers Air cooled Air cooled for
for cooling floor
Water cooled With cooling tower
Water cooled for cooling
floor 1.80 2.45 2.90 2.90 4.10
Table 7 : default COP min Splits and multi splits
PF<12Kw 12kW<PF<45kW 45kW<PF<100kW Air cooled Water cooled Air cooled Water cooled Air cooled Water cooled
2.29 x 1.8 x 2.28 x
Packaged units PF<12Kw 12kW<PF<45kW 45kW<PF<100kW
Air cooled Water cooled Air cooled Water cooled Air cooled Water cooled
2.23 3.32 2.03 2.46 2.16 x
Chillers Air cooled Air cooled for
for cooling floor
Water cooled Water cooled for cooling
floor 2.00 3.3 2.79 3.25
Using a component as measuring device(“TG 8 : recommendations to manufacturers to make
audit easier?” downloadable from http://www.eva.ac.at/projekte/auditac.htm ) Measurements of air flow rates are difficult to make in existing distribution networks: long enough straight lines are seldom available or accessible and velocity profiles are usually not uniform enough. A large series of measuring points is required and the final accuracy is often disappointing. A much better solution consists in using the fan as an air flow measuring device. It just requires the use of a classical “phi-psi” model to be tuned on the basis of manufacturer data. The air flow rate then can be determined as function of rotation speed and measured supply - exhaust static pressure difference.
The “phi-psi” model uses the fan similarity laws to normalize the flow rate and the pressure rise. Polynomials representing the normalized pressure rise (psi) and the efficiency as functions of the normalized flow rate (phi) are fitted to manufacturer’s performance data. Attention is paid to the distinction between total and static pressures: manufacturers present fan performance in terms of total

AUDITAC Final Report February 2007
53
pressure rise, whereas the measurements are usually made in terms of static pressures. Attention is also paid to the effects of both atmospheric pressure and air humidity. The air-flow rate is defined in “specific” value (i.e. in kg of dry air per second). Isentropic power and isentropic heating of the air stream can also be calculated to provide additional consistency checks. The use of the model is illustrated in Figure 23.
Figure23: Example of fan curve reduced under the phi-psi form
Manufacturers should be encouraged to sell their fans already equipped with required sensors or at least with sensor locations well identified and easily accessible.
3.3 Modelling for benchmarking, a tool accessible from http://www.eva.ac.at/projekte/auditac.htm
A prototype of a benchmarking tool based on a detail model (in the EES software) has been developed in the frame of the AUDITAC project.
Hourly or sub-hourly simulation is a must when having to predict the energy consumption of a given HVAC-Building system. This simulation must include realistic considerations to :
- Building (static and dynamic) behaviour; - Weather and occupancy loads; - Comfort requirements and achievements; - Full air conditioning process actually performed (air renovation, air circulation, temperature
and humidity control); - Characteristics of all HVAC components (terminal units, Air Handling units, air distribution,
hot and cold water distributions and plants); - Control strategies.
Priority focus is given here to cooling energy consumption, but possible cooling – heating interactions cannot be ignored. Both cooling and heating needs are taken therefore into account in the present model. Other requirements are considered: - The tool must be easy to use; it has to provide the auditor with a maximum of practical information, allowing him to identify all potential retrofits. - The number of parameters to introduce in the model must be reduced to a minimum; these parameters must be easy to understand and easy to estimate.

AUDITAC Final Report February 2007
54
-The calculation itself must be as transparent, robust and quick as possible.
Equation solvers as EES offer such possibilities; they make the equations of simulations models readable as in a reference book. They also make the models easy to adapt for new applications.
The Modelled Building
A very simplified building model is used in the present benchmarking tool : it corresponds to an open plan floor of a rectangular building with light "curtain" walls. Heat transfer dynamics are here taken into account by only two thermal masses: - One for the indoor air and the furniture - One for the floor/ceiling slab. Moisture dynamics are taken into account by only one indoor water capacity.
The sensible heat balance of the building zone is very easy to establish with the help of the second order RC equivalent network (Figure 24). The water balance is even simple.
Figure 24: The building R-C equivalent network
The HVAC system
The system includes almost all the classical HVAC components currently available : In the zone: heating and cooling terminal units, characterized by supposed-to-be constant heat
transfer coefficients (AU); At the level of the air handling unit (AHU): heat recovery loop, return fan, economizer, filter,
pre-heating coil, adiabatic humidifier, cooling coil, post-heating coil, mains fan and steam humidifier (all these components, except the recovery loop, are presented in Figure 25); At plant level: boiler, chiller and water pumps.
Figure25: The air handling unit
The development of such application oriented model is performed by giving up-steam from the outputs to the inputs and, finally to the parameters (Figure 26).

AUDITAC Final Report February 2007
55
Figure 26: Information flow diagram
The outputs
The main outputs expected by the user are:
1) Air quality and thermal comfort requirements:
- Air quality information is not yet explicit on the present prototype; it could be estimated thanks to the information actually provided on occupancy rate and on fresh air flow rate;
- Thermal comfort information could also be made more explicit through classical "PPD" estimates. Only environmental temperature and air humidity are given in this prototype.
2) Power and energy consumptions:
- Fuel and electricity consumptions are given hour by hour, all along the simulation periods (1 to 8760 h);
- These terms are integrated and also split into separated components (terminal units, air handling units, fans, pumps, boilers, chillers, lighting, appliances);
- AHU subcomponents (pre-heating, cooling and post-heating coils, adiabatic and stream humidifiers) and heating/cooling components (sensible/latent) are also distinguished.
3) Some more information about the actual performances of the different components (efficiencies, COP…) and about the way they are used (flow rates, temperature pressures…).
The inputs
The main inputs required concern:

AUDITAC Final Report February 2007
56
1) The weather: Hourly in temperature, global and diffuse solar radiation on horizontal surfaces and air humidity are actually used in this model. This information is provided in a "look-up" table. Any other set of weather data could be used in the same way. 2) The occupancy loads: Occupancy loads are defined in nominal values; hourly occupancy rates also provided in a "look-up" table. This table might be much more developed, with detailed data about actual use of all (HVAC and non-HVAC) systems. 3) The requirements: - Air quality requirements are supposed to be met, thanks to fresh air rates; - Thermal comfort requirements are expressed by upper and lower set points of environmental temperature and of relative humidity in the occupancy zone. Upper set points are used to run the cooling and dehumidification subsystems. Lower set points are used for heating and humidification.
4) The control laws: Proportional control is used almost at each level: a standard law is applied with the help of a non dimensional control variable X, varying between 0 and 1 in proportion to the difference observed between the set point and the controlled variable. The proportionality constant (the "gain") is arbitrarily fixed as a realistic compromise between control accuracy and (computation) stability. This parameter is not directly accessible in the present model. But the user may also play with some limits (among others, the outdoor air temperature), in order to control the actual use of each component. Of course, the simplest way to deactivate one HVAC component is to move its set point outside its current domain of use.
The parameters A few parameters have to be selected in order to fit the Building-HVAC system simulation model with the real system considered: Building parameters In the present model, only a very few parameters are directly accessible. They allow the user to fix the dominant thermal characteristics of the building envelope: - Floor, frontage and windows areas in different orientations; - Solar factors and heat transfer coefficients. HVAC system parameters They allow the user to size the main components in a very simple way, by defining their nominal capacities or effectiveness’s. Other parameters are not made directly accessible in the present model.
Example of simulation results Some examples of yearly simulation results are presented in Figures 27 to 32.

AUDITAC Final Report February 2007
57
Figure 27: Indoor air temperature
Figure 28: Indoor air humidity

AUDITAC Final Report February 2007
58
Figure 29: Pre-heating coil output
Figure 30: Cooling coil output

AUDITAC Final Report February 2007
59
Figure 31: Output of the heating terminal unit
Figure 32: Output of the cooling terminal unit
This tool allows the auditor to establish a seasonal energy analysis of the HVAC system considered. The simulator model was developed with the help of the "EES" software. It can be used as an EES file or as a directly executable file. This file can be downloaded from the AUDITAC website by any user, without any restriction of use.

AUDITAC Final Report February 2007
60
3.4 Analysis of ways to implement the compulsory EU inspection
Auditac is not in charge of implementation of article. However Auditac devoted some time to three questions :
• Implementation issues for mandatory inspection: how to integrate inspection in the life cycle of a plant?
• Comparing costs and benefits of the inspection according to type and size of system and qualification of staff needed
• Inspection only succeeds if it results in an audit: how to connect both processes? We prepared a brochure for plant managers about inspection and audit to air conditioning plants: what does it bring you? See figure 33.
Figure34: Auditac brochure 1
How to integrate inspection in the life cycle of a plant?
Let’s incorporate Inspection in the life cycle of an HVAC plant!

AUDITAC Final Report February 2007
61
Figure35: Integration of inspection
We see on figure 35 that there is some kind of contradiction between the periodic inspection and the periodic maintenance.
Certifiers, Operators, Maintainers, Inspectors, many people on the same field!
For instance there are potential benefits from sharing the information collected in fulfilment of the Directives inspection and certification requirements, and reducing the total workload. A good logbook would be also useful for both measures. It seems reasonable to require building owners create, use and update a logbook in order to facilitate the application of any existing or future building and energy related regulations. (In the UK, for example, Building Regulations compliance already requires the provision of a building logbook). Who is expecting inspection results? One of the most cost effective outputs of the inspection is to question (thanks to an outside view) the way the AC system is managed and operated. On the one hand nobody knows the plant better than the operator (notably determining controls, modes and set points) or the maintainer (increasing reliability). On the other hand nobody is less interested in energy performance, reducing capacity, limiting equipment operation, etc. (except when an Energy Performance Contract has been signed, with profit sharing or fixed price arrangements). So part of (all?) the inspection recommendations are to be transmitted by the owner to the operator, and a direct dialogue between the operator and the independent inspector is an opportunity for real world follow up. It is therefore very desirable for this direct dialogue to take place. Collaboration between the inspector and operators/maintainers is essential for another reason. Should inspection certificates be issued for installations that we have not seen operating -and maybe cannot operate? No! So there is a need to put the plant ON even for a short time. If we want to inspect in Summer, the operator has to be present and generate an artificial cooling demand, (something that is not possible with all systems). Some systems cannot be technically inspected outside of the cooling season, but most can. One of the outputs of the inspection, maybe the only one that the owner will always understand, is the implicit or explicit judgement on the O&M in place. As we have already discussed, there should be an obligation to maintain the “as-built” documentation and the log-book to avoid extra costs in the inspection process. The inspection report should say whether the maintenance regime in place appears

AUDITAC Final Report February 2007
62
to correspond to the contract or not. A good Inspection report will say where the contract can be improved. It is important to adjust Inspection time step to maximise this benefit (for instance one year after the start of a new O&M contract, one year before its end). A number of technical actions (benchmarking, checking of equipment references, checking of maintenance contracts, etc) could well be made at distance, via phone and fax. Inspection infers presence and visualisation, but the degree should be commensurate with the potential for savings, and it may not be cost effective to visually inspect all equipment.
• Visible O & M errors, certainly. A 5-10% potential is quoted by « experts » for such errors, easy to correct if the diagnosis is expressed in the terms of the operator and takes into account the real operational constraints that the operator withstands.
• Invisible O & M errors, difficult without short-term monitoring or use of BEMS data , and
without some kind of modelling of the ideal behaviour of the plant to be compared with the real one. A 10-40% potential is quoted by « experts » for such errors, but the effort to (possibly) achieve this is clearly beyond that envisaged by compulsory inspection.
• Benchmarking with other plants of the same type and age. This is certainly information that
the owner would appreciate, and that only an independent inspector can bring. The knowledge is dramatically missing.
• Improvements that can be made to the hardware. This needs a lot of expertise and engineering
even to produce raw estimates. The (probably conservative ) estimate of the potential for savings made in EECCAC is 50% of present energy consumption.
The only direct and certain benefits of implementation of article 9 are the discovery of visible operational errors. Beyond this, compulsory inspection can provide indirect help to the next stages towards achieving savings, by systematically documenting what has been inspected. It would be valuable for national implementations to require standardised documentation. According to savings potential it may not be cost effective to visually inspect all equipment, or not. However there is an opportunity missed when corrections are not made immediately. This should be allowed, or even promoted, the “inspector” coming very frequently to the plant could be the maintainer.
Suggested amendments to the standard
A dozen amendments have been transmitted to national standardisation bodies with various objectives :
• Wording more consistent with usual terminology. Only Air Conditioning with a cooling function is covered.
• Flexibility. It is better that the national regulations choices are completely compatible with a “soft” standard rather than totally incoherent with a “rigid” standard.
• help the MS in obtaining compliance with national regulations deriving or not from EPBD. • The national regulations can adjust the inspection frequency but subjective judgements of
inspectors about “actions” and “urgent actions” should be banished : • Separation of objectives from practical decision allowing to take into account technical
progress ; only the real over sizing effects with an energy impact should be corrected. Modern chillers may improve performance at Part Load.
The final text of the standard is not known at the time of closing the present report.
Scenarios for MS implementation
Four scenarios have been imagined for national transposition

AUDITAC Final Report February 2007
63
• Implicit scenario 1 : to generate continuous awareness of owner of more or less complex and correct AC plants. Evidence of degradated performance : a dysfunction, a lack of operation or maintenance, poor control. It’s the most common scenario, because most people see the problem of air conditioning as a problem of maintenance + over sizing, by analogy with heating.
• Scenario 2 : inspection targeted at expenditure ; the regular inspection could create the economics of renovation of the air-conditioning installation or the change of mode of operation. Energy Certification is unlikely to bring a god breakdown of energy consumption by service. To be benchmarked with “service” contracts by outside operators (or intractors).
• Scenario 3 : if Inspection is the start of a real Audit it should start by comparing the specific plant with state-of-the-art plants. Requires real engineers.
• Scenario 4 : preparation of a refurbishment (scenario 4). The methods and staff should in that case be adequate.
In any case, due to requirement that inspection is independent of installers, operators, etc.. the owners that have already optimised their HVAC with good energy service contracts will pay again for something already done.
Discussion of scenarios Let’s go into the details of the scenarios. The first benefit of the regular inspection for the building owner will be to generate a continuous awareness that there is one (or various) more or less complex AC plants, a source of some potential problems (scenario 1). Indeed, most of owners need evidence that the performance of their building is degradated before taking actions. The poor performance of an installation compared to its initial (or expected) efficiency can be due to: • a dysfunction of air-conditioning induced by a fault on one piece of equipment • a lack of operation or maintenance • a control problem • an improper action of the operating staff or occupants • poor (obsolete) equipment compared with present standards If we target the inspection at expenditure (scenario 2) the regular inspection could create the economics of the possible complete or partial renovation of the air-conditioning installation or the change of mode of operation. If this looks significant it would become relevant for the building owner to pay for an energy audit. But in order to enter into that circle the inspection report should identify the share of total costs (energy, O&M, investment) corresponding to the AC function. One could imagine that this is part of the Energy Certification of Buildings in the same EPBD, but it is unlikely to be (a breakdown of energy consumption by service is likely to be provided in some Member States, but is not a requirement). So only the inspection could start this financial approach. Any reference to costs will naturally increase the relevancy, the interest and the impact of inspection for building owners. The total cost can be benchmarked with “service” contracts proposed by outside operators (or intractors). At the same time, the requirement that the inspection is independent of installers, operators, etc in the Directive is not helpful to the provision of “energy services” as it seems to require the (few) owners that have already optimised their HVAC with good energy service contracts to pay again for something already done. This would be addressed if the requirement can be a satisfied by a system of independent auditing and checking of registered inspectors – who could be existing O&M or energy service contractors. If Inspection is the real start of an equipment Audit (scenario 3) it should start by comparing the specific plant with state-of-the-art plants. An installation can work perfectly and be correctly operated and maintained without being energy-efficient. Actually, the term “energy-efficient” is absolutely relative and depends on comparison with a reference or level of performance.

AUDITAC Final Report February 2007
64
The inspection will thus highlight potential savings and – where economically justified - accelerate the replacement of air-conditioning systems or components by more efficient new ones. The inspection may focus on sizing that has to be closer to cooling requirements, on the appropriate choice of equipment, based on life-cycle costs (purchase + operation), on possible improvement of both process and building and finally on best available technologies on the market. There is a fourth possible view on the benefits of a compulsory Inspection: preparation of a refurbishment (scenario 4). The methods should in that case also be adequate to the objective.
Extent of EPBD inspection is not known First issue : extent. The EPBD defines an air-conditioning system as “a combination of all components required to provide a form of air treatment in which temperature is controlled or can be lowered, possibly in combination with the control of ventilation, humidity, and air cleanliness”. Moreover, “the effective rated output (expressed in kW) is the maximum calorific output specified and guaranteed by the manufacturer as being deliverable during continuous operation while complying with the useful efficiency indicated by the manufacturer”. However, even after defining those terms, article 9 remains unclear because the 12-kilowatt limit can be defined in several ways. Member States will have to define the meaning of the 12-kilowatt limit through a cost/benefit analysis. That limit is associated on the one hand to an energy saving potential and on the other hand to a workload (number of inspections). It can be :
• 12 kW per cooling system. Lower workload, smaller target of savings. • 12 kW per zone. • 12 kW per building. Higher workload, larger target.
The first definition is really simple and any building owner can easily determine eligible equipments by looking at nameplates. Indeed, any central air-conditioning (CAC) system is necessarily taken into account. However, most of room air-conditioning (RAC) systems and certain distributed air-conditioning systems (such as water loop heat pump systems) are not included in the scope, thus reducing the energy saving potential of such a measure. The third definition assumes somebody knows that there are 12kW in the same building. Globally, the inspection must avoid introducing distortions into the air-conditioning market. Indeed, too heavy, too long, too frequent and thus in short too constraining and expensive procedures for the building owner could lead him to buy equipment not covered by inspection. Second issue : the exigency. An inspection could be a “pass or fail” test or an inspection that you always “pass”. It seems to be the second case in the directive. The CEN draft standard tries to define conditions for repetitions of the inspection when the results are unsatisfactory, but this is not an easy task. In that case, the penalty would not be to “fail” but to have to pay more frequently the auditor who would come again and report about the same thing. Obviously Member States are allowed to develop better, less arbitrary or more productive approaches. This could be the case for defects which existed at the time of initial installation and were prohibited by regulations at that time. In the existing projects, non compliance with regulations is not always reported. Third issue : are thermal regulations useless when we move to inspection? Neither the CEN draft nor national drafts on inspection rules make reference to any regulations in force at the time of inspection or, previously at the time of construction. Obviously, regulations applied to buildings differ from one Member States to another so that it is impossible to quote them all in the text. However it seems logical that such an inspection should check if the building and technical installations included respect the regulation in force or not (at the time of installation or/and now). As these regulations are improved regularly, the inspection should also regularly propose improvements to owners in order their buildings reach the latest and stricter energy and environment standards. These verifications should in theory be part of the technical basis of the regular inspection in order that future regulations will be applied more quickly to the existing stock. The same EPB directive requires Member States to introduce a thermal regulation of building renovations and an energy certification of existing buildings

AUDITAC Final Report February 2007
65
that may require pre-audits. Shouldn’t we look for a synergy when applying both articles of the same directive? Fourth issue : compliance. Many inspections will not be realised, should we just ignore that fact? Local authorities have the list of buildings on their area and it could be possible to crosscheck it with local taxes in order to determine the ownership. The existence of an air-conditioning system and the determination of the quantity in a building would need a costly local survey. After that, the update of the equipment database must also be made in real-time. This systematic approach may be too costly so that a simpler system will be used. A possible approach is to require proof of inspection at the time of the time of sale or lease, as for Energy Performance Certification. Some countries like France have AC as one item in the IPPC list. By changing the threshold (presently 50 kW elec. In the case of France) this powerful tool would help to provide a better coverage of inspection measures.
Comparing costs and benefits of the inspection according to scenarios
EPBD Inspections could be submitted to a regulatory impact assessment: Resources, Costs and Benefits, what is the total benefit? This goes through various steps : • How many inspections? • How many inspectors? • Which unit and total cost? • What benefits?
Inspection of air-conditioning installations is quite different from, for example, car safety inspection because it is focused on efficiency. Although good maintenance is part of good performance, there are other factors (behaviour, operation, adjustments, control system, equipment) that have large consequences on the efficiency of the system. All these factors must be analysed and the inspector should give advice on possible improvements. The CEN draft focuses on visual observations without quantitative tests. We do not yet have standard procedures such as exist for car safety inspections. A balance has to be struck between the level of expertise required of inspectors and the scope of the advice that they can be expected to give. To maximise energy-efficiency benefits, they need to be experts in air-conditioning and building. If the requirement for independence is interpreted to exclude installers and maintainers this will restrict the pool of possible inspectors, probably to HVAC consultants. We can imagine two scenarios concerning the people in charge of inspecting air-conditioning installations. On the one hand, if inspection requires "energy experts" or “air-conditioning experts”, Member-States will have to certify consultants for doing it. However, they will not be able to spend all their time on that activity. On the other hand, if inspection requires only “simple inspectors" without engineering expertise, it is possible that they spend the majority of their time on the periodic inspection. We can then make the following illustrative assumptions: · 1 day on average to inspect a building · 200 inspections per year on average for a “simple inspector” · 100 inspections per year on average for a consultant with a real expertise in air-conditioning or energy · Inspection every 3 years The number of persons necessary for the inspection resulting of our assumptions is given in the following table 8 per Member-State
Table 8 Number of staff for inspection 2007 2012 2017 Inspectors Experts Inspectors Experts Inspectors Experts
IT 4 050 8 100 5 325 10 650 6 210 12 420 SP 2 650 5 300 3 210 6 420 3 565 7 130 FR 1 880 3 760 2 450 4 900 2 885 5 770
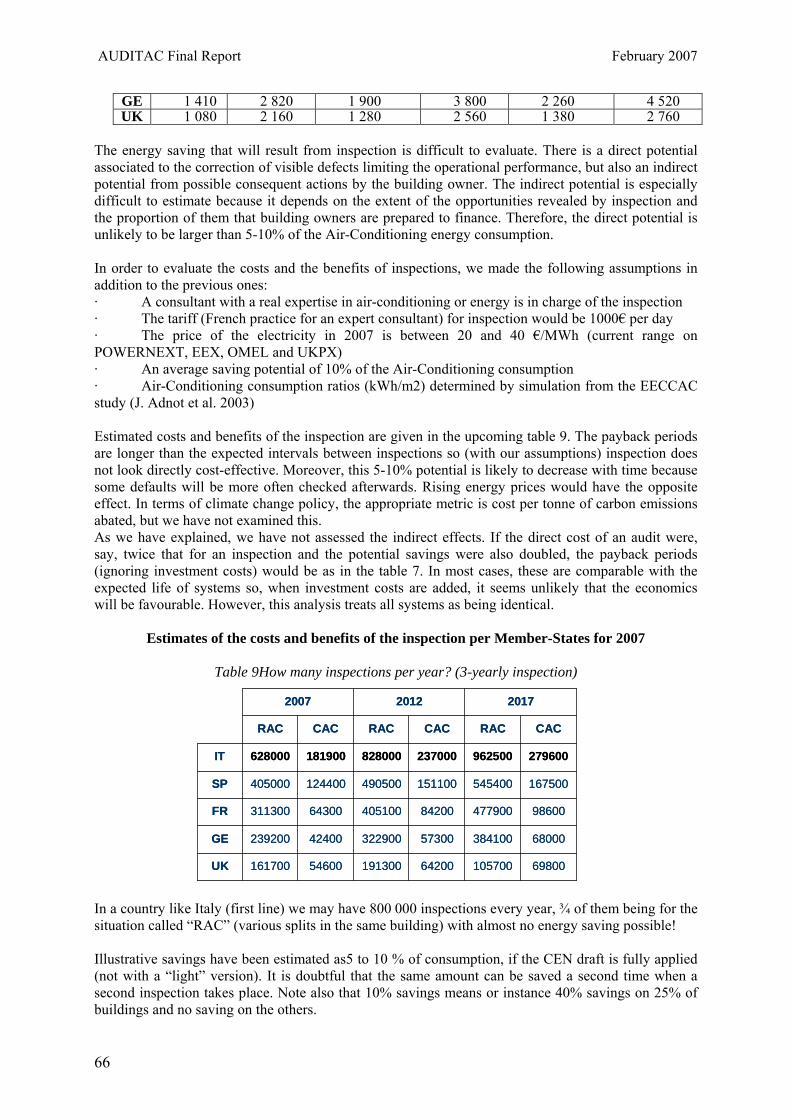
AUDITAC Final Report February 2007
66
GE 1 410 2 820 1 900 3 800 2 260 4 520 UK 1 080 2 160 1 280 2 560 1 380 2 760
The energy saving that will result from inspection is difficult to evaluate. There is a direct potential associated to the correction of visible defects limiting the operational performance, but also an indirect potential from possible consequent actions by the building owner. The indirect potential is especially difficult to estimate because it depends on the extent of the opportunities revealed by inspection and the proportion of them that building owners are prepared to finance. Therefore, the direct potential is unlikely to be larger than 5-10% of the Air-Conditioning energy consumption. In order to evaluate the costs and the benefits of inspections, we made the following assumptions in addition to the previous ones: · A consultant with a real expertise in air-conditioning or energy is in charge of the inspection · The tariff (French practice for an expert consultant) for inspection would be 1000€ per day · The price of the electricity in 2007 is between 20 and 40 €/MWh (current range on POWERNEXT, EEX, OMEL and UKPX) · An average saving potential of 10% of the Air-Conditioning consumption · Air-Conditioning consumption ratios (kWh/m2) determined by simulation from the EECCAC study (J. Adnot et al. 2003) Estimated costs and benefits of the inspection are given in the upcoming table 9. The payback periods are longer than the expected intervals between inspections so (with our assumptions) inspection does not look directly cost-effective. Moreover, this 5-10% potential is likely to decrease with time because some defaults will be more often checked afterwards. Rising energy prices would have the opposite effect. In terms of climate change policy, the appropriate metric is cost per tonne of carbon emissions abated, but we have not examined this. As we have explained, we have not assessed the indirect effects. If the direct cost of an audit were, say, twice that for an inspection and the potential savings were also doubled, the payback periods (ignoring investment costs) would be as in the table 7. In most cases, these are comparable with the expected life of systems so, when investment costs are added, it seems unlikely that the economics will be favourable. However, this analysis treats all systems as being identical.
Estimates of the costs and benefits of the inspection per Member-States for 2007
Table 9How many inspections per year? (3-yearly inspection)
In a country like Italy (first line) we may have 800 000 inspections every year, ¾ of them being for the situation called “RAC” (various splits in the same building) with almost no energy saving possible! Illustrative savings have been estimated as5 to 10 % of consumption, if the CEN draft is fully applied (not with a “light” version). It is doubtful that the same amount can be saved a second time when a second inspection takes place. Note also that 10% savings means or instance 40% savings on 25% of buildings and no saving on the others.
698001057006420019130054600161700UK
680003841005730032290042400239200GE
986004779008420040510064300311300FR
167500545400151100490500124400405000SP
279600962500237000828000181900628000IT
CACRACCACRACCACRAC
201720122007
698001057006420019130054600161700UK
680003841005730032290042400239200GE
986004779008420040510064300311300FR
167500545400151100490500124400405000SP
279600962500237000828000181900628000IT
CACRACCACRACCACRAC
201720122007
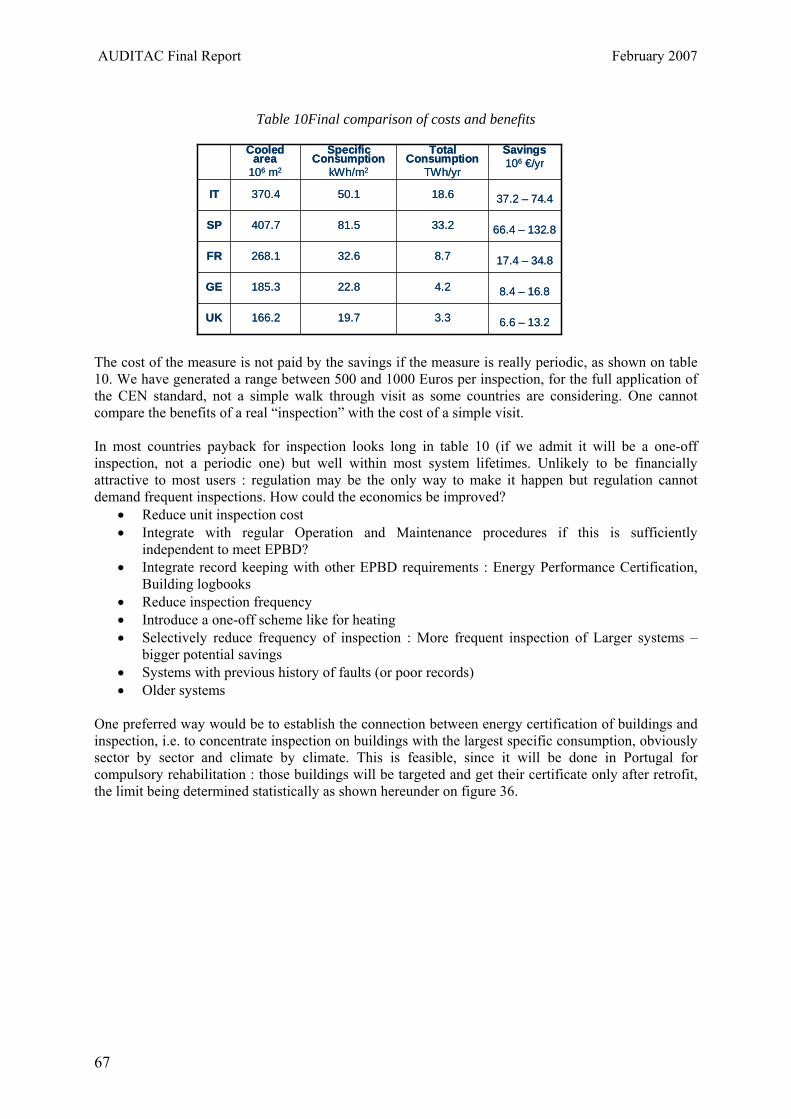
AUDITAC Final Report February 2007
67
Table 10Final comparison of costs and benefits
The cost of the measure is not paid by the savings if the measure is really periodic, as shown on table 10. We have generated a range between 500 and 1000 Euros per inspection, for the full application of the CEN standard, not a simple walk through visit as some countries are considering. One cannot compare the benefits of a real “inspection” with the cost of a simple visit.
In most countries payback for inspection looks long in table 10 (if we admit it will be a one-off inspection, not a periodic one) but well within most system lifetimes. Unlikely to be financially attractive to most users : regulation may be the only way to make it happen but regulation cannot demand frequent inspections. How could the economics be improved?
• Reduce unit inspection cost • Integrate with regular Operation and Maintenance procedures if this is sufficiently
independent to meet EPBD? • Integrate record keeping with other EPBD requirements : Energy Performance Certification,
Building logbooks • Reduce inspection frequency • Introduce a one-off scheme like for heating • Selectively reduce frequency of inspection : More frequent inspection of Larger systems –
bigger potential savings • Systems with previous history of faults (or poor records) • Older systems
One preferred way would be to establish the connection between energy certification of buildings and inspection, i.e. to concentrate inspection on buildings with the largest specific consumption, obviously sector by sector and climate by climate. This is feasible, since it will be done in Portugal for compulsory rehabilitation : those buildings will be targeted and get their certificate only after retrofit, the limit being determined statistically as shown hereunder on figure 36.
6.6 – 13.23.319.7166.2UK
8.4 – 16.84.222.8185.3GE
17.4 – 34.88.732.6268.1FR
66.4 – 132.833.281.5407.7SP
37.2 – 74.418.650.1370.4IT
Savings106 €/yr
Total Consumption
TWh/yr
SpecificConsumption
kWh/m2
Cooledarea
106 m2
6.6 – 13.23.319.7166.2UK
8.4 – 16.84.222.8185.3GE
17.4 – 34.88.732.6268.1FR
66.4 – 132.833.281.5407.7SP
37.2 – 74.418.650.1370.4IT
Savings106 €/yr
Total Consumption
TWh/yr
SpecificConsumption
kWh/m2
Cooledarea
106 m2

AUDITAC Final Report February 2007
68
Figure 19: Portuguese solution to associate a certain value of energy consumption (from certificates) with an obligation of inspection or works
In Germany a 2 step solution is examined as an answer to the same constraints : • yearly inspections by trained craftsmen (e. g. state of filters, proper function of controls...)
combined with • at longer intervals (3 years? 5 years?) inspection by expert engineers focussed on proper
dimensioning and system performance There is an urgent task for Member States : exchange about implementation, focus it to avoid counter performance, draw lessons from good experience.
3.4 Link between our deliverables and the new context generated byEU inspection
The chain is complex. So our tools have been designed in order to integrate the chain smoothly either to support the productivity or quality of work of one of the professionals, or to ease the interfaces. We are not prescriptive, we don’t say what an EPBD inspection should be (see Concerted Action for that). We try to help…. On total we have put on the web eleven downloadable guides (under a classic presentation) but also five software supporting tools :
• A training package on AC inspection, audit and renovation; : what you should know if you own or manage an AC plant : 160 slides? (downloadable from http://www.eva.ac.at/projekte/auditac.htm )
• A database of case studies; A large number of detailed success case studies with different A/C systems and climate references with possible solutions evaluation(downloadable from http://www.eva.ac.at/projekte/auditac.htm )

AUDITAC Final Report February 2007
69
• Services allowing retrieval of past performance of equipment when Eurovent certified and default values for others; The database allows comparing data and performances of old equipment (from 1995 certified products) with equipment in sale today, avoiding the waste of time often due to the lack of accessible information on old equipment and reliable information of new equipment. Available at http://www.eurovent-certification.com/
• A Customer Advising tool, CAT, provides information on the potential savings in AC system energy consumption that may be achieved through certain actions on the building shell; (follow indications from from http://www.eva.ac.at/projekte/auditac.htm )
• A quantitative audit tool EES-Auditac, based on the calculation of loads and energy consumption with a customized dynamic simulation package EES and its user manual; (downloadable from http://www.eva.ac.at/projekte/auditac.htm )
• A tool for profitability computation called AC-Cost. ACcost allows you also to calculate the AC running costs when they are not separated from the rest of your bill (downloadable from http://www.eva.ac.at/projekte/auditac.htm ).
The Technical Guides (downloadable from http://www.eva.ac.at/projekte/auditac.htm ) are the following: TG 1: Are you sure you are not paying for inefficient cooling? TG 2: Energy Auditing of Air Conditioning Systems and the Energy Performance in Buildings Directive : what does the new regulation say? TG 3: System recognition guideline for field visit TG 4: The AUDITAC method of preliminary audit for airconditioning facilities. Preliminary audit involves an interview of the site operating staff, a review of facility utility bills and other operating data, and a walk-through of the facility Only major problem areas will be discovered – qualitative estimation of possible savings TG 5 : Analysis of Energy Conservation Opportunities (ECOs) for air-conditioned buildings TG 6: How to benefit from the Eurovent- Certification database and to retrieve past equipment data in the audit process TG 7: A benchmarking guide for owners and energy managers adapted to air conditioning based on electricity bills TG 8 : recommendations to manufacturers to make audit easier TG 9 : recommendations and competences for auditors and structures for training TG 10, Case studies of improvements in AC systems TG11: a model-supported audit method The guides and the computer tools can be integrated in the productivity, quality, and management of interfaces of the chain that we have described in the following way:

AUDITAC Final Report February 2007
70
Manager
OperatorMaintainer InspectorAuditor / consultant
AuditAC offers more competence:Training packageCase studiesCAT, AC -costTechnical guides 1 2 3 7
AuditAC offers tools for better audit:Technical guides 4 5 6 8 9 10 11

AUDITAC Final Report February 2007
71
4-Case studies of audit and renovation of AC systems
4.1Documentation of 26 case studies(“TG 10, Case studies of improvements in AC systems?” downloadable from http://www.eva.ac.at/projekte/auditac.htm )
Like on other subjects we discovered that the state of the art was not as high as we thought initially. We had to document from scratch 26 case studies, as shown in the table 11 and figures 37&38 hereunder Figure 37 geographic location of case studies
Table 11 the final selection of case studies No Name and Location
Off
ice
Hos
pita
l
Info
rmat
ics
Aud
itoriu
m
Libr
ary
Labo
rato
ry
Res
earc
h C
ente
r
Com
mer
cial
Arc
hive
Cul
tura
l Dpt
.
1 ACS-1 Salzburg, Austria ● 2 ACS-2 Linz, Austria ● 3 BCS-1 Namur, Belgium ● 4 BCS-2 Brussels, Belgium ● 5 BCS-3 Liège, Belgium ● 6 FCS-1 Orleans, France ● 7 FCS-2 Paris, France ● 8 ICS-1 Turin, Italy ● 9 ICS-2 Vercelli, Italy ● 10 ICS-3 Oderzo, Italy ● 11 ICS-4 Bologna, Italy ●

AUDITAC Final Report February 2007
72
12 PCS-1 Porto, Portugal ● 13 PCS-2 Porto, Portugal ● 14 PCS-3 Porto, Portugal ● 15 PCS-4 Porto, Portugal ● 16 PCS-5 Porto, Portugal ● 17 SCS-1 Maribor, Slovenia ● 18 UKCS-1 Leicester, UK ● 19 UKCS-2 Westminster, UK ● 20 UKCS-3 Cardiff, UK ● 21 UKCS-4 Cardiff, UK ● 22 UKCS-5 Cardiff, UK ● 23 UKCS-6 Oxford, UK ● 24 UKCS-7 London, UK ● 25 UKCS-8 London, UK ● 26 UKCS-9 London, UK ●
Figure 38 illustration of variety of case studies
4.2 making access to the case studies more easy
AudiBAC: a database of successful audit case studies for air conditioned buildings is available on the internet au: http://paginas.fe.up.pt/~auditac/index.php
• A large number of detailed success case studies with different A/C systems and climate references with possible solutions evaluation
• From the database, best practices are individuated and different advising methods considered. Quantitative indicators will help in the assessment for the efficacy of the methods taking into account the specific economical context.
• The database is accessible for users through a simple interface. The user can than search in the database the case more similar to its problem with the more adapted solution.

AUDITAC Final Report February 2007
73
The "cases" in our data base are real installations which are described under almost the same format in order to make them comparable. For part of the existing case studies it will be necessary to supplement information available by complementary measurements and by calculations so that all the aspects of Audit become applicable. Besides their use in further work packages, the case studies in the data base will allow for the first time to estimate on a statistical basis the magnitude of the gain possible on European A/C installations. We have generated a proforma that all participants are using in finding the final case studies. The status is the following:
Office Buildings
BCS 1 – Namur Case: This case aimed at assessing and managing the HVAC system installed in an office building located in the center of the town of Namur. Installed HVAC system: Heating – three gas boilers with variable flow to feed radiators and AHU’s. Cooling – two chillers with reciprocating compressors and air condensers with variable flow to feed AHU’s and fan-coils. HVAC system modifications: During the audit phase the cooling and ventilation performances were not as expected. Alteration of the control strategy, the implementation of new parameters and administration rules, the regulation of the set points and of the VAV boxes thermostats were some of the modifications for this case. Lessons learned: After commissioning, most of the errors were eliminated but some of the problems continue to exist. Modeling some retrofit opportunities can increase further more the heating and cooling performances of the installed system.
BCS 2 – Brussels Case: This case is about a 13 story office building. Installed HVAC system: The installed HVAC system is composed by 4-pipe terminal units, AHU’s, Chiller, boiler, cooling towers and circulation pumps. HVAC system modifications: There are some suggestions made in order to improve the system performance. The AHU’s were partially renovated and all induction units and thermostatic valves were replacement. The replacement of existing induction units by more efficient devices (other induction units or fan coils), should make possible to run the system with higher chilled water temperature and therefore better COP. Lessons learned: Other options can always be considered to improve the systems efficiency; even small ones can produce a big effect when you have a big building with a large system.
NO PHOTO AVAILABLE
FCS 1 – Orleans Case: This case is about a refrigeration plant of a commercial company. They started having problems with the high energy bills, so the target to start reducing the energy consumption was the cooling production unit. Installed HVAC system: The system installed was composed by centrifugal compressors groups functioning in stages. This system was oversized and used forbidden refrigerant according with the actual regulations. HVAC system modifications: The modifications consisted on the substitution of the cold production unit by one other, adapted to the cold demand and modulated in stages. Lessons learned: The real saving reached 56 % of the electricity from the cold production groups.
FCS 2 – Paris Case: audit preformed to an office building located in the Paris suburbs. The building has one floor and a basement. Its overall clear surface is 1140 m ². The building can be divided into three types of spaces: circulation zones, conference offices and rooms. Installed HVAC system: The five conference rooms are climatized by an AHU and a group of cold water production. About thirty offices have AC based

AUDITAC Final Report February 2007
74
on 2-pipe fancoils and natural ventilation. The cold water that feeds the loop of the AHU and the fancoil is produced in a non-reversible alternative Chiller. The system operates 24 h /24 and 7 days/7. HVAC system modifications: Two main improvement scenarios were foreseen: the first scenario consist in keeping air conditioning in summer and the heating with Joule effect in winter; the second scenario would be the replacement of the refrigeration unit by a reversible heat pump with an average seasonal COP of 2,5. Associated with these two scenarios other measures were proposed in order to reduce the energy consumption: Change the water loop set points, change the functioning schedules, reduce the internal gains etc. Lessons learned: This study shows that the improvement scenarios combined with other measures can result in a decrease from 30% to 77% of the HVAC system energy consumption.
SCS 1 – Maribor Case: This case relates a high efficient system for an office building. At minimal energy consumption, thermal comfort and good work conditions are achieved. The investment costs are similar with the traditional buildings. Installed HVAC system: The building is heated with a combined heat-pump (water-water) which provides heating and cooling energy. As a support for heating there is also a low temperature condensing gas boiler. Whole space is ventilated with high energy efficient ventilation / air conditioning units with energy recovery more than 90%. There is also a possibility of direct cooling with ground water. In summer period, it has a temperature of 15 – 16ºC. HVAC system modifications: This study only intents to present a case of good performance, so there are no modifications. Lessons learned: It is possible to have a high efficient HVAC and obtain good levels of comfort without much more than an usual building.
NO PHOTO AVAILABLE
UKCS 1 – Leicester Case: This case illustrates an exceptionally energy efficient/low energy air conditioning system. This is a 4 storey office building. Installed HVAC system: The HVAC cooling system consists on chilled beams. The cold water production unit is a package air cooled chilled using R407c as refrigerant. HVAC system modifications: There are no modifications suggested Lessons learned: This building seems to be very energy efficient according to is overall annual energy consumption/m2 when compared to national benchmarks.
NO PHOTO AVAILABLE
UKCS 2 – Westminster Case: This case study aimed at assessing the energy performance and its potential for improvement, of a comfort cooling system installed in a UK office building. The building comprises six-storeys (Ground plus 5) of mainly small cellular offices and a lower ground containing support and storage areas. Installed HVAC system: The basic system configuration features passive chilled ceilings and perimeter passive beams with night-time ice storage and some DX systems serving computer rooms and conference suites. Ventilation is provided mechanically via centralised AHU’s and heating is provided by perimeter radiators. HVAC system modifications: This case study focus on the actual system analysis, thus no modifications were implemented. Lessons learned: Detail thermal simulation tool can be very helpful to predict HVAC system consumption and consequently avoid some errors in the project or correcting them during an Audit.

AUDITAC Final Report February 2007
75
UKCS 3 – Cardiff Case: This case study compares the energy consumption values obtained using thermal simulation tools such as EnergyPlus with real energy measurements. Installed HVAC system: The HVAC system installed is a 2-pipe Multi-Split DX system. This system has the possibility to free cool the spaces. HVAC system modifications: This study focus on the actual system analysis, thus no modifications were tested. Lessons learned: Detailed thermal simulation tool can be very helpful to predict HVAC system consumption and consequently avoid some errors in the project.
NO PHOTO AVAILABLE
UKCS 5 – Cardiff Case: This case study aimed at assessing the energy performance and its potential for improvement, of a comfort cooling system installed in a small administrative office, located in a historic building of Cardiff University. Installed HVAC system: The office has a DX split comfort cooling system with a roof mounted condenser and a 4-way ceiling mounted cassette. HVAC system modifications: This case study focus on the actual system analysis, thus no modifications were implemented. Lessons learned: Detail thermal simulation tool can be very helpful to predict HVAC system consumption and consequently avoid some errors in the project or correcting them during an Audit.
NO PHOTO AVAILABLE
UKCS 6 – Oxford Case: This case study aimed at assessing the energy performance and its potential for improvement, of a comfort cooling system installed in a light industrial building on a small rural estate near Oxford. The conditioned area consists of a large open plan office, 3 cellular spaces of executive offices, a conference room and a production area room. Installed HVAC system: This area is serviced by VRF indoor units, ceiling mounted, from external condensers on a 2-pipe heating and cooling “change over” only basis. The supply AHU consist of an in-duct axial fan, filter pack and electric heater battery. The system has plenum return ventilation with ducted supply and partial recirculation in the fan-coil units. HVAC system modifications: This case study focus on the actual system analysis, thus no modifications were implemented. Lessons learned: Detail thermal simulation tool can be very helpful to predict HVAC system consumption and consequently avoid some errors in the project or correcting them during an Audit.
NO PHOTO AVAILABLE
UKCS 7 – London Case: This case study aimed at assessing the energy performance and its potential for improvement, of a comfort cooling system installed in the ground floor of a 2 storey office block. The conditioned area consists of open plans and cellular office rooms, meeting rooms, training rooms and a reception. Installed HVAC system: The conditioned area has a 2-pipe fan-coil system with the electrical reheat, supplied by two reverse cycle air-cooled chillers. The indoor units are a 2-pipe ceiling mounted cassettes with multi-speed fans and electrical reheat in the perimeter units. HVAC system modifications: This case study focus on the actual system analysis, thus no modifications were implemented. Lessons learned: Detail thermal simulation tool can be very helpful to predict HVAC system consumption and consequently avoid some errors in the project or correcting them during an Audit.
NO PHOTO AVAILABLE
UKCS 8 – London Case: This case study aimed at assessing the energy performance and its potential for improvement, of a comfort cooling system installed in the first floor of a 2 storey office block. The conditioned area consists of open plans and cellular office rooms, meeting rooms. Installed HVAC system: 3 pipe heat recovery VRF units with roof mounted

AUDITAC Final Report February 2007
76
condensers and internal ceiling mounted cassettes. The cassettes draw air from the ceiling void that is also supplied with fresh tempered air from the mechanical ventilation system. The entire building is mechanically ventilated with a 2-duct supply and return system, within the air handling unit located in the roof top plant room. HVAC system modifications: This case study focus on the actual system analysis, thus no modifications were implemented. Lessons learned: Detail thermal simulation tool can be very helpful to predict HVAC system consumption and consequently avoid some errors in the project or correcting them during an Audit.
NO PHOTO AVAILABLE
UKCS 9 – London Case: This case study aimed at assessing the energy performance and its potential for improvement, of a comfort cooling system installed in a 2 storey office block. The conditioned area consists of open plans and cellular office rooms, meeting rooms. Installed HVAC system: The conditioned area has a custom Built AHU. The packaged roof top units are VRV condensers with 3 pipe Heating/Cooling and heat-recovery unit, believed to be operating as modular banks of 7 per floor. The ground and first floor ceiling voids contain in total 56 Daikin VRV 3-pipe heat and cooling ceiling cassettes. HVAC system modifications: This case study focus on the actual system analysis, thus no modifications were implemented. Lessons learned: Detail thermal simulation tool can be very helpful to predict HVAC system consumption and consequently avoid some errors in the project or correcting them during an Audit.
PCS 5 – Porto Case: This case is about the INESC building located in the campus of Porto’s faculty of engineering. This is a typical 4 stories service building. Installed HVAC system: The HVAC system is centralized and composed by a boiler, a chiller and two ice storage tanks. The air distribution is done by using fan coil units. HVAC system modifications: The main tested alteration consists on the reprogramming of the central control unit in order to provide the use of free cooling whenever possible. Lessons learned: The use of free cooling is estimated to offer an energy saving potential by the order of 28% year.
Hospital Buildings
ACS 2 – Linz Case: This case concerns with the optimization of the refrigeration plant existent in the central hospital of Linz. Installed HVAC system: The refrigeration plant is equipped with a 6-cilynder 2-stage compressor. The heat rejected can be collected and used for heating water. HVAC system modifications: The modification was basically the replacement of the 6-piston compressor for a 6 screw compressor with 40% more of cooling capacity. Lessons learned: The saving potential was even higher than estimated, achieving 30-35%.

AUDITAC Final Report February 2007
77
ICS 2 – Vercelli Case: This case intents to show the optimization of a hospital AHU that treats the air from a surgery room. Measurements were done and the data collected will be used to assess the system’s efficiency. Installed HVAC system: The actual installed HVAC is a centralized system (with AHU, chiller and water loops). HVAC system modifications: In order to improve the system’s efficiency several solutions were studied, such as the substitution of the chiller, the capability to use free cooling and the heat recovery from the condenser units. Lessons learned: Several economic and energetic analyses were done. The use of two new chillers in partial load instead of three installed ones can achieve savings on the order of 1460 €/yr. Savings associated to a one degree variation in the limit temperature at which the chillers are shut off and free cooling is adopted (23°C vs 22°C) are approximately equal to 50000 kWh/yr (with negligible differences between existing and new chillers), i.e. on the order of 12%.This demonstrates that there is an opportunity for cost effective energy saving measures.
NO PHOTO AVAILABLE
ICS 3 – Oderzo Case: This case is about a 3-storey hospital building. Installed HVAC system: 100% external air AHU. This unit has humidifier, fans, HEPA filters, cooling coil and heating coil. HVAC system modifications: In order to improve the system’s efficiency several solutions were studied such as free-cooling with an achieved energy reduction of 16% and heat recovery. The average thermal effectiveness of the intermediate-fluid heat recovery system turned out to be on the order of 58% (based on measurements) and for an air-to-air heat exchanger 65%. Lessons learned: This case study has allowed a quantification of the impact of AHU operation on the electrical energy consumption of an all-air AC system for a hospital. It shows as well that some energy saving measures can be implemented with good results.
Computer Center
PCS 1 – Porto: Case: This case is about a computer center existing in the Faculty of Engineering of Porto University. The rooms in analysis are 4 and are in function all year to guarantee the functioning of the faculty’s computer network and internet. Installed HVAC system: the system installed is not centralized. Each room has independent cooling units. The units existent are basically DX close control and single split units. HVAC system modifications: The proposed modification for this case consists on the substitution of the actual DX units for a centralized system, being the chilled water loop fed by a chiller and the hot water loop fed by a boiler. One other fundamental change was the introduction of the possibility for the system to free cool the spaces given favorable outdoor temperature conditions. Lessons learned: The main achievement was the use of free cooling as well as the savings due to the increase of the chiller efficiency (EER). These measures result in a 70 % decrease of the compressors functioning hours and in an overall 30% electric energy reduction.

AUDITAC Final Report February 2007
78
Auditorium
PCS 2 – Porto: Case: This is the case of three auditoriums existent on the Faculty of engineering. These auditoriums are equipped with an Air-Air type system. The analysis done to this rooms was merely acoustic. Installed HVAC system: This air-to-air system is composed by roof-top units (one per room) and heat pumps to provide the heating and cooling energy. This unit mixes fresh air with return air. Given favorable conditions, the control strategy is prepared to allow free-cooling. HVAC system modifications: The proposed modifications are focused on the ventilation system. Some modifications were done in order to reduce the noise level inside the rooms. Modifications like the displacement of the mixing box or the placement of acoustic attenuators were tested. Lessons learned: The acoustic comfort can be achieved with parallel improvements on the indoor air quality and energy efficiency.
Library
PCS 3 – Porto: Case: This case relates to library in the Porto’s faculty of engineering. This is an 8 stories building that works from Monday to Friday. This case study intents to assess and resolve a comfort problem reported by the library users. Installed HVAC system: the system installed is centralized. There’s a boiler and a chiller on the roof that feed the chilled and hot water loops respectively. The air loop is handled by an air handling unit. HVAC system modifications: The proposed modification for this case consists on the use of CO2 as the fresh air control indicator, the change of the lighting density to 8 W/m2, use of vertical and horizontal shading devices on the south facing windows and the alteration of the set-point temperatures. Lessons learned: All these measures resulted in energy savings. By combining some of these actions the building can archive 43 % energy reduction.

AUDITAC Final Report February 2007
79
Laboratory/ Research Center
PCS-4 – Porto: Case: These case intents to study the influence of the AHU filters conditions on the ventilation energy consumption in a laboratory room located within FEUP. Installed HVAC system: The studied AHU is composed by two fans, electric resistances for heating and a DX system for cooling. The filters tested were placed on the fresh air inlet side. HVAC system modifications: The modification done was basically to substitute a dirty filter by a new one, and monitor the fan motor energy consumption. Lessons learned: The lack of the filters maintenance reduces the indoor air quality, and leads to energy waste by the fan motors.
BCS 3 – Liège Case: This case is about a laboratory located in Liege, Belgium. The conditioned floor area is 4000 m2. This building contents a set o offices, meeting rooms, dinning hall and laboratories. Installed HVAC system: The installed HVAC system is composed by Terminal Units such as Fan coils and a AHU that supplies conditioned fresh air using textiles diffusers. The AHU and the Fan coil units are fed by water loops. The hot water is produced by a boiler and the cold water by chillers. HVAC system modifications: This study only indicates retrofit opportunities no modifications were made in the installed system. Lessons learned: Better distribution of the hot water temperature to the actual space heating demand and another mode of sanitary hot water production seems to provide reduce de gas consumption. A recovery heat pump could be used with extracted air as cold source in order to enhance heat recovery from AHU.
ICS 4 – Bologne Case: This case study was aimed at analyzing the performance of a water-to-water reversible heat pump installed in a research center located in Apennine mountain. Installed HVAC system: The AC is an air-and-water system type (primary air and two-pope fan coils). Hot and chilled water is produced with a water-to-water reversible heat pump, using treated lake water that feeds the AHU and FCU’s. HVAC system modifications: This study focus on the actual system analysis, thus no modifications were implemented. Lessons learned: The presence of a BEMS makes it possible to monitor and record the main system operational parameters. The seasonal average COP for the installed system is equal to 3.9 and a good correlation between daily cooling energy and outdoor dry-bulb air temperature was identified.
Commercial Building
NO PHOTO AVAILABLE
UKCS 4 – Cardiff Case: This case study aimed at assessing the energy performance and its potential for improvement, of a comfort cooling system installed in a small commercial architectural practice operating as part of the Welsh School of Architecture (WSA). Installed HVAC system: DX splits were installed for comfort cooling. The system has roof mounted condensers and wall mounted slim-line cassettes. HVAC system modifications: This case study focus on the actual system analysis, thus no modifications were implemented. Lessons learned: Detail thermal simulation tool can be very helpful to predict HVAC system consumption and consequently avoid some errors in the project or correcting them during an Audit.
Archive

AUDITAC Final Report February 2007
80
ACS 1 – Salzburg Case: This case relates the energy consumption changes in a new archive building along with the years and with several interventions in the system in order to decrease the energy consumption. Installed HVAC system: There’s no pertinent information about the cooling system. HVAC system modifications: The modifications done were mainly on the system control and management. Lessons learned: A good management of the system can, without further equipment modification, achieve much higher energy efficiency. In this case energy savings achieved 70%.
Cultural Department
ICS 1 – Turin Case: This case is about an office building in Turim that renewed the HVAC system. However this new system seemed to be inadequate. Thermal simulation tools were used to assess other HVAC equipments in terms of energy consumption and thermal comfort. Installed HVAC system: The HVAC system installed is composed by embedded floor radiant panels and AHU’s. HVAC system modifications: The most important simulated modification were basically the use of AHU with fan-coil units instead of radiant floor and the substitution of the heating oil burner for a natural gas boiler connect the system to the gas network. Lessons learned: The results obtained using simulation show that a 25% of the HVAC energy saving can be spared.
4.3 Results of further analysis
We have to put some limitations on the advice due to climatic zoning. We chose here the Koppen classification and we consider that the user should be warn when he tries to use a case not belonging to the same Koppen climate zone. Here on table 12, the Koppen climate zones of our case studies:
Table 12 - Detail information of AUDITAC climatic zones
Country KOPPEN Class Location Latitude Longitude Altitude
Dfb Innsbruck 47º 16' 11º 21' 593m Austria
Dfb Vienna 48º 7' 16º 34' 190m
Cfb Brussels 50º 54' 4º 31' 58m Belgium
Cfb Oostend 51º 12' 2º 52' 5m
Cfa Nice 43º 39' 7º 11' 10m France
Cfb Paris 48º 43' 2º 24' 96m
Cfb Berlin 52º 28' 13º 23' 49m Germany
Dfb Munich 48º 7' 11º 41' 529m
Cfa Milan 45º 37' 8º 43' 211m Italy
Csa Campobasso 41º 34' 14º 38' 793m
Csa Lisboa 38º 43' 9º 8' 71m Portugal
Csb Porto 41º 13' 8º 40' 73m
Bsk Granada 37º 10' 3º 46' 559m Spain
Cfa Madrid 40º 27' 3º 32' 582m
Cfb London 51º 9' 0º 10' 62m United Kingdom
Cfb Aberdeen 57º 12' 2º 13' 65m
4.4Magnitude of possible energy gains
4.4.1General energy Improvements

AUDITAC Final Report February 2007
81
In general overview, the observed potential energy savings in different real examples can be subdivided in a few audit strategies, such as:
1. management system control optimization 2. efficiency control of the equipment energy consumptions 3. lighting efficiency control 4. new strategies of recovery energy 5. free-cooling strategy implementation 6. simply chiller equipment replace
To achieve a good Potential Energy savings strategy the building’s owner (or auditor) must to know well the energy utilization such as:
• running hours of AC and the length of pre-cool period; • internal comfort conditions, ie temperature, humidity, lighting levels; • localization of the unnecessary AC and lighting, I e unoccupied zones; • chillers/pumps schedules and settings; • specific equipment energy consuming • lighting energy consuming • the areas of high energy consumptions
In Europe, and in particular countries, it is possible to have an idea of the energy utilization for the office building sector. Therefore, the auditor know, in the first approach, how is the potential energy saving that can achieve if applied different strategies that presented above. The figure 39 shows the average energy end-user breakdown typical for the European office building sector. Figure 39 some statistics on CS
Lights33%
Equipments40%
HVAC27%
Energy end-user breakdown from Belgium CS1
HVAC 25% - 30%LIGHT 30% - 45%Equip 25% - 40% Average Energy end-user breakdown for EU office building
Some audit cases had energy improvements only with a new lighting strategy control, for example the PCS-31 the reduction the light to 8 W/m2 it had have double effect on the energy consumption, first in direct electricity consumption and second in the reduction of internal loads, ie peak cooling power. At the end, with global strategy control for the AC system, the global system achieves 43% of energy reduction. Of course it is not only the lighting effect but all control strategy.
1 AuditAC Case Studies Brochure: Case studies: Portuguese, n3

AUDITAC Final Report February 2007
82
Good control and management of the system in same cases can reaches a high save energy. This was happen in the ACS-12 case study when the total save energy it was up to 70%. This is an excellent example but in average the control management has less energy efficiency indeed. The use of free potential energy (free-cooling) is used in some cases with excellent results in those cases the energy profits can achieve from 30% up to 60% reduction of the total energy consumption. This solution is well dependent from the weather conditions and countries with cool climates and high internal loads are more suitable for this kind of solution. 4.4.2Equipment Replacement There are a significant number of examples, in AudiBAC, based in replacement cool equipment, ie change the old chiller by a new one with high efficiency. The CS shows some examples were the energy saves can be up to 35% of total energy (ACS-2)4, and other when the energy saves reach 56% of the energy used for the cooling system (FRCS-1)3. It is quite possible to make an idea how energy we can save if we make chiller equipment replacement, in average point of view. Based upon the EER evolution in the last ten years, that means ± 30% increase efficiency on average (EECCAC), therefore it is possible to forecast the potential energy save for the next days in the AC systems. 4.4.3 Case Study : one example of possible energy gains
We have selected here the new City Archive of the city of Salzburg as an example of good Audit practice. The new city archive was built in 2003/2004 and started to “operate” in March 2004. As all building owned by the city of Salzburg, the energy consumption was measured online by an energy monitoring system (EMS), which is able to measure the consumption of energy and water all 15 minutes. In the first months (until End of July) it was thought, that the high energy consumption was due to the situation, that the building was new and the materials was just brought in. In this way the doors were open and hot air was able to come in the storage rooms. In the last week of July 2004 the installers of the ventilation systems were order to optimize the systems. It was possible to reduce the consumption by about 40 %. During August and September the both companies (one for the regulation system and one for the cooling system) tried to optimize the system but only achieved at the beginning of November. In this cooperation it was possible to reduce about 60 % more. The year 2005 brought the evidence that it was possible to reduce the consumption by more than 70 %. Building Description The Building was built in the year 2003-2004 to be the official Archive for all the information, documents and papers of the City of Salzburg. It is situated in the north – west of the hill Kapuzinerberg and is usually in the shadow of this small hill. About 20 people are working in the building. The building is heated by the district heating system. The working places are situated in front of the four floors high storage area (see last graph).
Figure 40 the City of Salzburg archive building
2 Auditac Case Studies Brochure: Case studies : Austrian, nº 1and nº2 3 Auditac Case Studies Brochure: Case Studies: French , nº1
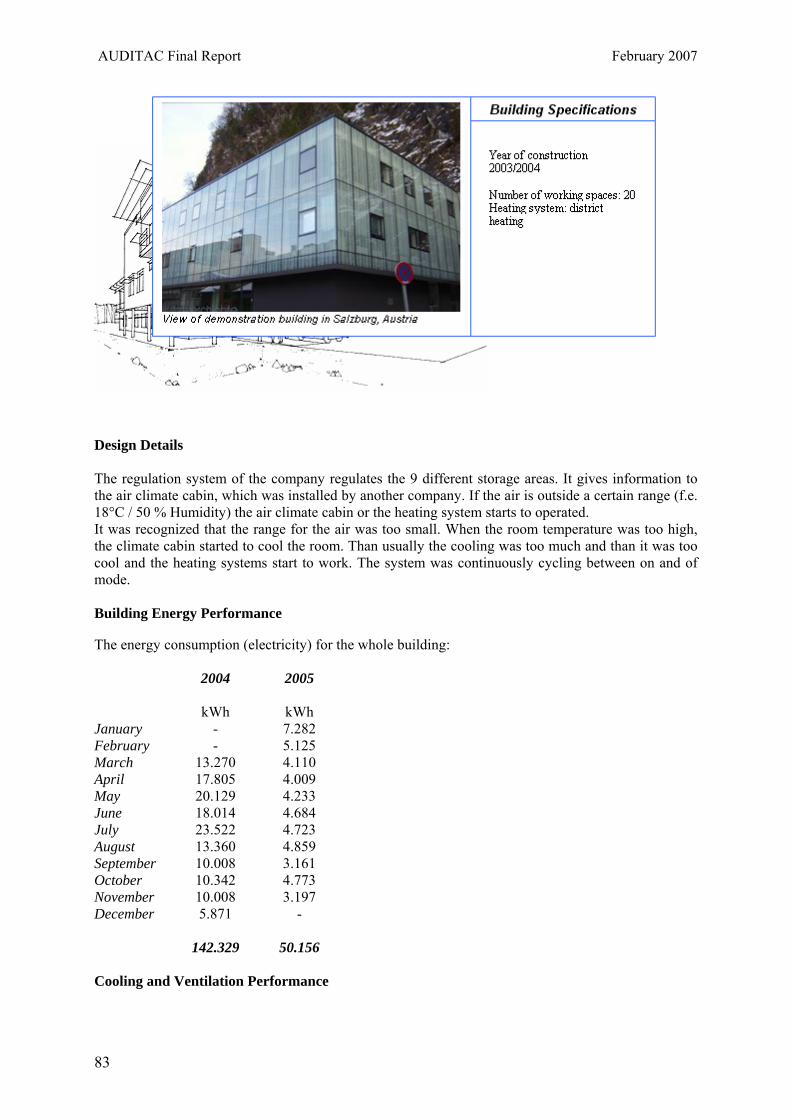
AUDITAC Final Report February 2007
83
Design Details The regulation system of the company regulates the 9 different storage areas. It gives information to the air climate cabin, which was installed by another company. If the air is outside a certain range (f.e. 18°C / 50 % Humidity) the air climate cabin or the heating system starts to operated. It was recognized that the range for the air was too small. When the room temperature was too high, the climate cabin started to cool the room. Than usually the cooling was too much and than it was too cool and the heating systems start to work. The system was continuously cycling between on and of mode. Building Energy Performance The energy consumption (electricity) for the whole building:
2004 2005 kWh kWh
January - 7.282 February - 5.125 March 13.270 4.110 April 17.805 4.009 May 20.129 4.233 June 18.014 4.684 July 23.522 4.723 August 13.360 4.859 September 10.008 3.161 October 10.342 4.773 November 10.008 3.197 December 5.871 -
142.329 50.156
Cooling and Ventilation Performance

AUDITAC Final Report February 2007
84
There is a Central Ventilation system – situated on the roof which brings the air to the nine Climate storage areas, each have a different temperature (between 14-21°C). The heating / cooling is done decentralise for each area, which have also 9 heat exchangers. The humidity should be 50% (45% - 55%). According the legislation the air exchange rate in the storage has to be two per day. There is no CO2 sensor in the storage area. Summary It was not so easy to solve the problem previously described because at the beginning the companies did not try to solve the problem together. Each company tried to find a solution on his part. When the start to cooperate, it was realized that the range for the quality of the air was too small. The range was made larger at the consumption could be reduced by about 70 %.

AUDITAC Final Report February 2007
85
5-Tools for the final user (owner, operator)
5.1 Awareness and Inventory tools (“TG 3: System recognition guideline for field visit?” downloadable from http://www.eva.ac.at/projekte/auditac.htm )
The first tool describes the issues behind the new national legislation deriving from EPBD.
The second tool is a guide for field visit and system recognition. In many cases, when documentation is missing, a detailed tour in the building can allow to obtain the necessary information about the installation in order to determine the type of equipment in place. The existence of certain components implies a certain functioning of the installation. In order to help managers starting their office to determine the components and then the functioning of the A/C system, this document asks several questions to be answered during the tour on the installation. The objective of the first method proposed is to determine the kind of cold generating equipment and the ventilation mode. Then, the aim of the following method is to determine the kind of heat rejection of the cold generating equipment.

AUDITAC Final Report February 2007
86
The questions are as simple as: • Is the cold generating system used for several zones? (locate the compressor and relate them to
zones) • Is there a “fluid link” between each cold generating equipments?
• What is the nature of the link between the cold generating equipment and the rest of the equipment?
• What kind of fluid is distributed to cooled areas?
• Where is located the cold generating equipment? This can be summarised on the first graph. Other similar graphs follow. A more detailed description of the air conditioning systems that can result from more precise methods is showed with diagrams in an Annex.

AUDITAC Final Report February 2007
87
5.2 Is there a technical possibility of performance progress based on components replacement ? In this section, it can be showed the key points on which a new AC equipment is better than equipment in place and replacement recommendations for different systems.
Chillers Statistically there is no relationship between chiller EER and its cooling capacity; however, on average there is significantly higher EER for chillers which are cooled with water compared with those that use air (table 13). In fact this improvement is not inherent to the chiller, but rather represents the temperature regime found in cooling towers. The values used for testing the two types of system are somehow arbitrary and it may be that the apparent benefit from water-cooling is not fully realised in practice.
Table 13- Summary of average and extreme EER values by chiller category on the EU market EER
Categories Type Condenser Application min ave max Complete unit cooling air conditioning 1.9 2.53 3.29
reversible air conditioning 1.9 2.48 2.96Floor 3.31 3.34 3.39
cooling water conditioning 2.9 3.73 4.09reversible water conditioning 2.9 3.57 4.09
Condenserless cooling water conditioning 2.76 3.21 3.69
For medium capacities, there has been large progress, but we cannot document it yet (treatment of Eurovent directories over years).

AUDITAC Final Report February 2007
88
For the highest capacities (centrifugal chillers) progress has been large –here ARI data show the evolution through the time of the average efficiency of centrifugal chillers.
Packaged units Performance is as dispersed with these large packages as it was for Multi Splits or RAC in moving from worst on market to best on market.
Figure 41 Rooftops with percentage of models on EU market for each EER class (from EUROVENT database 1998)
Many opportunities exist for this type of system by replacing systems at lower EER with more efficient units. The average EER is 2.46 with large difference between the less and the most efficient system efficiency value (min = 1.58, max = 3.78).

AUDITAC Final Report February 2007
89
RAC For individual air conditioners many progress have been done on international products (as for Japan and USA, figure 41.
Figure 41 Evolution of EER (red line) and energy consumption (blue line) for Japanese (left) and
American (right) room air conditioners.
EUROVENT CERTIFICATION directory shows a positive evolution too of efficiency of split, non ducted, air cooled Air conditioners up to 12 kW on the EU market (result of internal rules of performance improvement) since labeling was not yet in operation.
Figure 42 Evolution of efficiency of split, non-ducted, air cooled Air conditioners up to 12kW on the EU market (EUROVENT CERTIFICATION)
EER Min EER Max EER Mean Number of units
2001 1,64 3,63 2,547 25972002 1,76 3,97 2,552 32512003 1,75 3,85 2,577 30782004 2,2 4,55 2,682 2081
0
100
200
300
400
500
600
700
800
900
1973 1975 1977 1979 1981 1983 1985 1987 1989 1991 1993
Fiscal year
Ave
rage
pow
er (W
)
0.00
0.50
1.00
1.50
2.00
2.50
3.00
3.50
4.00
4.50
Ava
rage
EER
(W/W
)
Power EER
0
100
200
300
400
500
600
700
800
900
1000
1972
1973
1974
1975
1976
1977
1978
1979
1980
1981
1982
1983
1984
1985
1986
1987
1988
1989
1990
1991
1992
1993
1994
1995
1996
Uni
t ene
rgy
cons
umpt
ion
(kW
h/ye
ar)
0.0
0.5
1.0
1.5
2.0
2.5
3.0
EER
(W/W
)
Energy consumption (532.5 hours/year)
EER
00,5 ,5 ,533,5 ,5500 00 003 00
EER MinEER MaxEER Mean
2001 2002 2003 2004
1.5
3.5
2.5

AUDITAC Final Report February 2007
90
5.3 Tool for continuous improvement : what is behind AC-COST?
The best policy is to integrate all AC aspects in a continuous improvement plan like ISO 14001, EMAS or GreenBuilding. For this some tools have to be put in place. The best solution is when the owner/manager understands that the expenses in Euros can be lowered by lowering the consumption in kWh. This is what is done behind AC-COST, but can be done by the owner/manager without the softaware offered by Auditac. This is why we describe here the details of calculation.
A global approach to existing plants: the running costs estimation
Very often, the task of an auditor or inspector is the assessment of the status of the existing plant through the documentation analysis and the site visit require a very big effort and a lot of time. Owners and operators seldom follow and record the operation of the existing plant, but this task can be easily performed through the collection and analysis of the documents more available for a plant: the bills. The yearly or monthly bills show the operation mode of the system through its consumption in terms of energy and water and its cost in term of maintenance and repair. Speaking in terms of “bills” and “money” allow us to directly communicate with user in a simpler and more understandable way than speaking in energy terms: kWh of kJ are terms less familiar and the translation in € measure is easier and more appreciable for a common owner who is looking for advise for reduce its running costs and improve its plant. We developed a global approach of the running costs of an air-conditioning plant that starts from the past bills, this allow us to understand the evolution of the operation of the plant from its installation until today and to estimate the development of its future operation. On the other hand, this estimation can be used to propose different improvements of the system and estimate the money savings related to the energy savings. This quantities showed as interval of € savings are comparable and ready to use. For the economic calculations the use of the net present value of the costs is used.
The existing system characteristics In a first step the running costs of the existing plant is evaluated, we speak only of running costs because if some action is profitable in terms of running costs it should be done, even if the existing plant can still run sometime or even if present plant is not amortized from this point of view. In order to do that a number of elements are required. At the beginning a short description of the system is asked through a preliminary list of system choice, the specific parameters required for calculations are: the cooled area, the climate type (three choices are proposed as representative of three European different climate: London, Milano and Seville), the nominal capacity of the system (if not available a button allow to estimate it on a basis of 120 W/m² installed), if the system is water cooled. At this state the calculation s are independent from the type or use of the building. The time frame is required to establish the period over which the calculation will be performed. We consider the remaining life of the plant as time basis and in order to calculate it, we would need the installation year and the lifetime of the plant. Great uncertainty exists in the determination of the lifetime of an AC plant and many factors can influence it, so it is in general very difficult to establish a real value. The lifetime of the plant can depend on the type of the system, on the maintenance level, on the climate, on the economic possibilities, on the design and on the wishes of the owner. To establish the time basis for the calculation we have to consider different possibilities. If the owner has already forecasted a date for renovation, the number of remaining years of life of the plant can be used as time frame.

AUDITAC Final Report February 2007
91
If no renovation is envisaged and no precise renovation time is specified, a fault value of conventional lifetime of the plant is considered (for central systems ~20 years) and the time basis is calculate as the difference of this period and the existing years. In this case, if this time basis is too short a default value of 20 years is used.
The energy and water costs The energy costs are mainly the electricity costs for the AC plant all over the plant lifetime. This value is rarely available to the owner because is not measured or indicated in the electricity bill separately from other usages and is quite difficult to find a precise benchmark or a technique that allows to disaggregate it from the total. For buildings equipped with BEMS, data can be extrapolated from the data logger of the BEMS if the consumption of the plant is measured then a cost can be obtained with an average electricity cost. Despite these problems, we keep the possibility that the user enters directly his energy costs. He eventually can enter just some values he possess (at least two different years are required) then an average is calculated and used as constant energy cost for the entire time basis. If the consumption of the system is reference values from the EECCAC results for offices reported in the annex of the Ac-cost user’s guide can be used. The output is an estimation of the electricity consumption (kWh/year) and, using average electricity cost (0.15 €cents/kWh as default value) the energy cost (€/year). Thereby, we underline that we consider an optimistic forecasting of energy consumption and we don’t consider factors that normally increase it such as the overheating of the planet or the degradation of the system due to ageing. In the case of the presence of a condensing wet tower, the cost of the annual water consumption is also required in order to complete the running cost assessment. As for the energy, the owner can fill some year from available water bills (if a separate counter exist for the tower) and an average value is considered for the rest of the time frame. If water consumption is unknown, the same button for energy case (wet tower condenser? Yes) perform water consumption calculation following the climate and the system. The condensing energy is calculated as:
* * _ *(1 )WaterConsumptionYearWaterConsumption Area Power Compressor SEERHeatRejected
= +
The water consumption-heat rejected ratio is evaluated in the worst case at 4 kg/kWhcondens. The water consumption year obtained is in kg/year. The year cost is then calculated with a default unitary cost of water of 2 €/m3. We do not consider cases where water costs are available and not energy or vice versa.
Maintenance costs In a first case, a contract of maintenance is available and the maintenance costs are fixed (for normal and preventive maintenance) and constant. In that case the user enters the contract values, a button allows to calculate a mean value considered for the incoming years maintenance costs. In a second case, the user doesn’t have subscribed for a continuous maintenance programme but he has just some costs for the last years (two years would be enough) for repairs, then the tool calculates an average cost that it considers constant for the entire time basis but realistically it would be increasing. When no costs are available at all, a formula is supplied that allows calculating maintenance costs as a percentage of the initial investment following the system type. The hypothesis are that in the middle of the life plant the maintenance costs are about x% (different value following the system type as in the
AUDITAC Final Report February 2007
92
table 3) of the installation investment while at the end of life its maintenance cost is 3 times the initial value due to the ageing of the plant. The trend can be assumed linear with the time. When the initial cost is not available, a simple tool in the sheet 2 estimates it from the system type and the conditioned area (investment cost from EECCAC).
Net present value of the existing plant Once all these values are entered, a net present value (NPV) of the future cost of running the existing plant is computed as the sum of the main terms energy, water and maintenance cost, with a discount rate of 8% (legal discount rate). This value is necessary and will be compared to the value computed in case of plant improvement to measure the interest of a retrofitting measure.
Net present value of four projects of renovation for energy improvement The opportunity to introduce better energy efficiency in air conditioning is presented here through four major measures:
1) Project 1: replacement the cooling system with a same capacity system, better efficiency 2) Project 2: replacement with lower capacity system 3) Project 3: convert a constant air volume system (CAV) to a variable air volume system (VAV) 4) Project 4: introduce free cooling
In order to evaluate the interest of each solution the user can fill another table to calculate the present value of the costs for the modified plant. The difference between the present cost of the modified plant and the cost of the present plant “as it is” will be a measure of the opportunity of savings (€). The hypothesis is that the duration of the project is equivalent to the remaining life of the plant with the condition of the 20 years minimum last . Moreover, the plant cost can be calculated for different measures in order to compare them and determine the most interesting measure. The energy cost and maintenance costs and the additional investment for the renovated plant are assessed from the results of the EECCAC project. Project 1: replacement with same capacity system, better efficiency Important energy savings can be achieved simply by the replacement of the existing cooling system with a newer system of the same capacity but with better efficiency. The replacement can be estimated for the same technology but improved system (i.e. newer product of the same manufacturer with better control). This improvement can be translated through the increase of the efficiency of the system EER. If we would be more precise, a seasonal energy efficiency would be more representative including the partial load behaviour of the system, but whereas EER can be easily found on manufacturer documentation or on the Eurovent database (link to the site of Eurovent Certification in he sheet), SEER even if calculated during laboratory tests is not yet included and available for public. It is possible to use default values for the EER, where the present EER is from the EECCAC project and the improved value is the best market value in the 2004 Eurovent certification directories. If the additional investment is unknown it will be automatically estimated. For replacement project, the NPV is calculated over a period of 20 years, whereas the savings are estimated for the remaining life of the present system and include the investment as a paying off quantity (1/20 of initial additional investment per year). Project 2: replacement with lower capacity system In this case, we compensate the oversizing of the system replacing it with a new system of lower capacity adapted to the real need of the building. The reduction of the capacity is represented as a

AUDITAC Final Report February 2007
93
percent of the initial capacity. Both energy and maintenance costs are considered proportional to the system capacity and the savings are directly proportional to the capacity reduction. More than simply reduce the capacity, the possibility to improve the efficiency at the same time is left to the user, and is developed as in the previous case. It is possible to use default values for the EER, where the present EER is from the EECCAC project and the improved value is the best market value in the 2004 Eurovent certification directories. If the additional investment is unknown it will be automatically estimated. As for the previous case, the NPV of the costs of the project is calculated over a period of 20 years, whereas the savings are estimated for the remaining life of the present system and include the investment as a paying off quantity (1/20 of initial additional investment per year). Project 3: convert a constant air volume system (CAV) to a variable air volume system (VAV) This action consists transform the system from constant air volume to variable air volume system. In this case, the possibility of savings is strongly related to the climate. The EECCAC results are used to evaluate the energy savings where:
- For Sevilla the final consumption is 58% of the CAV consumption - For Milano: the final consumption is 41% of the CAV consumption - For London: the final consumption is 24% of the CAV consumption
Notice that the maintenance costs are the same for both cases. Project 4: add free cooling The option of the free cooling represent a very interesting opportunity because of its low cost respect its potential. In this case an overcost of 2% of the overall system cost is considered in order to assess the additional investment when not available. Following the climate, the global energy reductions are:
- For Sevilla the final consumption is reduced of 88% - For Milano: the final consumption is reduced of 86% - For London: the final consumption is reduced of 87%.
The maintenance increase proportionally to the additional investment if it has been estimated through the formula for the initial system, or increase of 10% if it has been just calculated from real maintenance costs entered by the user.

AUDITAC Final Report February 2007
94
6-EU structures and actors before and after Auditac dissemination efforts
6.1-European and National structures and frames for Qualification and Certification of Inspectors(“TG 9 : recommendations and competences for auditors and structures for training?” downloadable from http://www.eva.ac.at/projekte/auditac.htm )
For efficiency and customer confidence, all MS should try to make more homogeneous the definitions of “an independent manner” a “qualified and/or accredited expert, whether operating as sole trader or employed by a public or private enterprise” in the various countries. Some legislation can still be harmonised. We do not forget the link with Energy certification article 6.
Our proposed definitions. A certification institution must be accredited. The accreditor may be themselves accredited by a higher body or the State. An association, a person or a company may be certified for a certain activity. When an association or a company or scheme runs certification, they may license a company or a person to put it in practice, but bear the responsibility. Persons may have to prove their qualification (obtained from training) or competence (obtained from experience). One of the conditions of company certification may be the presence of staff with a certain qualification or certified competence. One understands rapidly that the MS will try to use a system where their accreditation board accredits companies, far less costly than trying to certify individuals. Eurovent-certification can certify components performance by being accredited to do so by the Belgian accreditor, BELCERT. They reach by the use of well calibrated laboratories (that they “certify” in some way), tolerances on certified performances of the order of 4-5% instead of 15% Legal basis : « An independent body having a quality system for the specified type of equipment in conformity with the ISO-IEC / Guide 65:1996, General requirements for bodies operating product certification systems. » There are standards about all this, unfortunately not so unified as the 9000 or 11000 series. Let’s mention other standards, not related with products but with “inspection”. Standard 17020:1998 is called: "General criteria for the operation of various types of bodies performing inspection", and seems applicable ISO/IEC 17011:2004 specifies general requirements for accreditation bodies assessing and accrediting conformity assessment bodies (CABs). It is also appropriate as a requirements document for the peer evaluation process for mutual recognition arrangements between accreditation bodies. Accreditation bodies operating in accordance with ISO/IEC 17011:2004 do not have to offer accreditation to all types of CABs. For the purposes of ISO/IEC 17011:2004, CABs are organizations providing the following conformity assessment services: testing, inspection, management system certification, personnel certification, product certification and, in the context of this document, calibration. It seems to be applicable. There is a CEN standard about maintenance, CEN 13313”Refrigeration systems and heat pumps- Competence of staff, but we have found no reference to it, in terms of inspection being made by a competent staff, except the f-gas directive.

AUDITAC Final Report February 2007
95
Bodies in charge of educational system and technical training
Who trains whom? How? This depends largely on the type of work to be done. HVAC engineers capable of a real energy audit are trained with concepts. If we promote a scheme similar in level with HVAC maintenance, technicians are trained by understanding examples and acquiring know how. If we base inspection on chimney sweeps and the ventilation aspect, the cost will be lower, as the training and the results : only definition of dirty or corroded zones. Note that with modern technology, audit or inspection can be a team work : inspectors can diagnose a number of things and transfer by video a number of images so as to receive orientation from a distant HVAC engineer. In a survey reported by AREA in Europe, the people in charge of ODS or F gases have generally less than one year of training in air conditioning but most of them are “engineers” (50 to 80% except Germany and France, two countries having diplomas of “higher technician” comparable to some other countries “engineers”. The training resources should be tailored according to the needs of the intermediate target groups who can lower the barriers to inspection, audits and actual improvement works. Federations of trade and Manufacturers can provide training resources to their members. AREA has run a 3-year training project supported by the EC (Leonardo da Vinci programme - Vocational Training) : The Refrigeration Craftsman; the aim was to establish an AREA industrial European standard for craftsmanship in the field of refrigeration with the objective of securing a uniform and proper level of education and training throughout Europe. The outcomes are unknown to us. There could be a link with our existing Training Package since they dealt with other subjects arising from ODS (Ozone Depleting Substances) like containment. Consultants, experts and national HVAC associations are a special target. The educational committee of REHVA meets once a year at the General Assembly. The chairman of the committee is Prof. Dr.-Ing. Michael Schmidt. The educational committee of REHVA is involved in the following actions :
• Student Competitions at REHVA`s CLIMA-conferences • Directory of Educational Institutions • Directory of National Contact Persons
It could be the promoter of common educational materials.
Monitoring of progress of application of some other directives in EU Ozone Depleting substances Past experience about qualification and certification of staff for new measures is not satisfactory. AREA reports a study conducted by the consultants ICF in 2004/2005 about qualification following the REGULATION (EC) No 2037/2000 OF THE EUROPEAN PARLIAMENT AND OF THE COUNCIL of 29 June 2000 on substances that deplete the ozone layer. Article 17 states :” In particular, fixed equipment with a refrigerating fluid charge of more than 3 kg shall be checked for leakages annually. Member States shall define the minimum qualification requirements for the personnel involved. By 31 December 2001 at the latest, Member States shall report to the Commission on the programmes related to the above qualification requirements. The Commission shall evaluate the measures taken by the Member States. In the light of this evaluation and of technical and other relevant information, the Commission, as appropriate, shall propose measures regarding those minimum qualification requirements.” AREA and ICF say that very few MS comply with this requirement.

AUDITAC Final Report February 2007
96
F-gas The next requirement is in REGULATION (EC) No 842/2006 OF THE EUROPEAN PARLIAMENT AND OF THE COUNCIL of 17 May 2006on certain fluorinated greenhouse gases. By 4 July 2008 the Member States must establish certification and training programmes for personnel involved in leakage inspections and the recovery, recycling, reclamation and destruction of fluorinated gases. These programmes must comply with the minimum requirements and conditions laid down by the Commission, by 4 July 2007 at the latest. In that case the directive requires both the certification of companies and staff. The circulation of workers has been taken into account explicitly , which is not the case of EPBD : “Member States shall notify the Commission of their training and certification programmes. Member States shall give recognition to the certificates issued in another Member State and shall not restrict the freedom to provide services or the freedom of establishment for reasons relating to the certification issued in another Member State.” The standards EN 45012 for companies and EN 45013 for staff are used. In the reference terms, there are many things similar to EPBD inspection (looking for leaks, etc.) and the knowledge and application of standards EN 378 and EN 13313.
Our global view of Inspection implementation in the EU We identified in the preceding chapter s that there is a serious shortage of publicly available independent information on the main factors affecting the efficient operation of A/C systems in practice. The final outputs of the AUDITAC project, which are guidelines and new tools to assist in Inspections and Audit, were therefore produced from a synthesis of the limited information publicly available and some new information generated by the AUDITAC participants. However they only started to integrate in MS organisations at the end of the contractual period. We identified in this part why there will be a shortage of trained personnel throughout Europe to undertake the number of Inspections and Audits that will be required by the EPBD. The accumulation of measures that could be harmonised but that arise from various texts that can be subject to national interpretation makes training difficult.
6.2 Impact of Auditac in each country
National Workshops
During each project meeting(after the necessary kick off time) we invited the national AC Industry to speak with us about AUDITAC. On the one hand we wanted to inform them about our project, on the other hand we wanted to get a feedback what they think about : EPBD, article 9, air conditioning improvement.
Date Place Participants
July, 7th, 2005 Vienna, Austria 10 national experts from installers, administrations, federations
October, 27th, 2005 Brussels / Belgium, Ministry of economic
affairs
12 national experts from ATIC (The Belgian Association of HVAC engineers)
March, 1st, 2006 Milan, AICARR 100 experts in HVAC April 25th 2006 Frankfurt/ Germany 12 national experts September, 28th,
2006 Ljubljana/ Slovenia 80 national experts in HVAC

AUDITAC Final Report February 2007
97
December 19th, 2006 London, UK, BRE 60 national experts in HVAC
National conferences
Each participant proposed to speak about Inspection and Audit in National conferences. . Details to be found in the management report or on our web site.
Country Place and date Participants
Austria Apr-05 Annual meeting of the Austrian association of Air conditioning and Refrigeration
Slovakia Apr-05 Concerted Action-Inspection section Italy June 05 AICARR
Workshop Italian experts
Slovenia
September 05 National conference: Buildings, Energy and Environment
Slovenian experts
Belgium sept-05 AIVC Brussels Belgian experts Portugal oct-05, 25 Ordem dos
Engenheiros (certification body)
5th. HVAC Annual Conference, Climatisation Committee, 2 oral presentations
Austria nov-05 Annual meeting of the VKOE, Windischgarsten, Upper Austria
Austrian experts
Slovenia déc-05 Slovenian annual HVAC designers meeting
Slovenian HVAC designers and experts
France janv-06 Forum Interclima (large exhibition and conference)
half of day of studies on AC Inspection and Audit organised by the AFF, 80 engineers
UK June 2006 EPBD and Room Air Conditioners Conference
UK experts
Slovenia febr-06 National seminar: The news in buildings regulation
Slovenian HVAC designers
Austria May 2006 Conference”Intelligente Gebäude und Wohnungen die Praxis“ (Vienna)
Austrian experts
Slovenia sept-06 Klimaforum 06 6 presentations at Klimaforum 06 UK dec-06 Inspection and
Audit of Air-Conditioning in the UK and Europe
. BRE Seminar (5 presentations)
Belgium déc-06 SSB 2006 international conference
European experts and modelers
Ireland January 2007 SEI seminar "European Perspective on the EPBD"
Irish experts and decision makers
Let’s note the importance of Klimaforum 06 both because it was at the same time the launching of a new local institute, Hidria Institurte Klima, and the result of two years of connection efforts by our Slovenian partners between the “older” participants and this new MS with a strong HVAC industry. The following papers were presented : Some AuditAC project results: the air-conditioning running costs tool and the system recognition guide

AUDITAC Final Report February 2007
98
Example of audit of an air conditioning system HVAC System Efficiencies for EPBD Calculations Implementacija direktive o energijski učinkovitosti stavb v slovensko regulativo in OPK EPBD implementation in Slovenian regulation and HVAC Audits of the air conditioning systems by article 9 of Energy Performance of Buildings Directive
Other dissemination activities : EU conferences
Three press releases were planned and realised (at beginning, at the interim report phase and at the end). A poster was realised on the opportunity of AIVC 2005 and reused. One paper released was released early at ECCEEE conference in June 2005 : “Inspection and auditing of air-conditioning facilities in Europe – A new efficiency target” by Maxime Dupont and Jérôme Adnot The following paper was presented at AIVC2005 in September 2005 in Brussels : Inspection of air-conditioning facilities in Europe in EPBD : partial ex-ante regulatory impact assessment. Papers presented at AICARR conference during MostraConvegno on March, 1st, 2006 Overall on Auditac Project: Field benchmarking and Market development for Audit methods in Air Conditioning project The potential impacts on energy efficiency in Air Conditioning systems of the inspection requirements in the Energy Performance in Buildings DirectiveIssues of the implementation of the EPBD article 9: how and why to inspect all air conditioning systems all over Europe? Papers presented at IEECB06Selection of procedures for air conditioning audit and definition of the associated training package About the audit of air conditioning systems: Customer advising with the help of case studies and benchmarks, modelling and simulation Effect of the Certification on Chillers Energy Efficiency National and EU wide efforts to increase Energy Efficiency of installed Air Conditioners Measured Buildings and Air Conditioning Energy Performance: An empirical evaluation of the energy performance of air conditioned office buildings in the UK The Components Of Heating And Cooling Energy Loads In UK Offices, With A Detailed Study Of The Solar Component Modelling Buildings For Energy Use: A Study Of The Effects Of Using Multiple Simulation Tools And Varying Levels Of Input In France in march-06 Auditac and its results were presented at the Eurovent AC group, annual meeting with all EU manufacturers.
Other countries Some papers were introduced in non EU conferences
Date Country Conference China sept-05 Indoor Air 2005 Conference China Brasil oct-06 Mercofrio 2006
Tunisia déc-06 ICAMEM06 6.3 Auditac website and main releases
The Austrian Energy Agency takes care for the project Web Site, which is part of the Web Site of the Austrian Energy Agency.

AUDITAC Final Report February 2007
99
http://www.energyagency.at/(en)/projekte/auditac.htm
Website follow up The web side includes all newsletter as well as the press release in the different languages and papers given to conferences. This is the language availability of press releases : Press release Nr. 1: Air conditioning systems have to become more efficient! EC Building Directive (EPBD) ask for regular inspection, EIE project AUDITAC will support the conversion(April 2005, 2 pages), available in english german french italian slovenian Press release Nr. 1 (short): New project AUDITAC aims to improve the energy efficiency of existing air-conditioning systems (April 2005, 1 page) , available in english french italian Press release: AUDITAC for the UK from the Association of Building Engineers (ABE) (August 2005) , available in english Press release Nr. 2: New documents and tools released by the AuditAC project(May 2006) , available in english german french italian slovenian One by one the deliverables have been added to the web site and at the time of this report they are all available.
• During the months of September, October and November 2005 about 450 person/ month have visited the AUDITAC Web-site, about 60 times / month the AUDITAC press release was downloaded and about 50 times / month the newsletter was downloaded. • During the months of September to December 2006 about 1260 person/ month have visited the AUDITAC Web-site. The gain in audience is really significant
The British partner Cardiff had also a Project webpage, where to find CAT (Customer advising tool): on internet at : http://www.cardiff.ac.uk/archi/research/auditac/advice_tool.html or access general Auditac information at http://www.cardiff.ac.uk/archi/research/auditac/wsa_and_auditac.html The statistics of this second site are the following :
Month Auditac hits 05 Sept 351 05 Oct 1539 05 Nov 844 05 Dec 748 06 Jan 858 06 Feb 791 06 Mar 750 06 Apr 798 06 May 886 06 June 894 06 July 796 06 Aug 494 06 Sept 871 06 Oct 835 06 Nov 851 06 Dec 2 711 07 Jan 2 413 07 Feb 1 033

AUDITAC Final Report February 2007
100
Newsletters
Six newsletter were produced and mailed from the national partners to their clients as well as to international partners. The newsletter are also offered on both project webpages. It is released nationally with the following diffusion (the direct diffusion is given first, the total diffusion through mailing lists after) :
Austria Austrian Energy Agency Between 27 and 200
Belgium Université de Liège Between 25 and 500
France Armines - Mines de Paris Between 27 and 300
Italy Politecnico di Torino Between 25 and 100
Portugal University of Porto Between 5 and 100
Slovenia University of Ljubljana Between 5 and 100
United Kingdom WSA-BRE-ABE Between 34 and 12000
All members of the Concerted Action Project mailing list get the newsletter per Email. The CIBSE members were informed of the newsletter and downloaded it from the website directly by a simple click in their electronic newsletter. Only through Eurovent-Certification we were able to add 500 contacts!! A real interaction took place with the readers through tens of e-mails after each issue.
Other dissemination activities : EU conferences The three press releases and all papers were made available on the web site.
Use of software tools The Training package has been tested recognised in two countries : the Netherlands (SenterNovem) and Austria (ÖNORM). Thousands of users have accessed the new Eurovent service. The other computer tools (AudiBAC, CAT, AC-COST) are too new and have not yet found their public. A continuation of dissemination efforts is still needed.
6.4 Common EIE work
Concerted Action Links are established with the concerted action of MS on EPB. all members of the Concerted Action Project mailing list get the newsletter per Email. There was a short article about AUDITAC in the EPBD-CA newsletter Webzine nr. 5: http://www.epbd-ca.org/Webzine5.htm Moreover we attended directly the meetings in Bratislava, Budapest and Dublin, each time well received and with a dedicated time in the agenda.

AUDITAC Final Report February 2007
101
Many Auditac originated ideas circulated in the CA, obviously not all accepted and not all original! The AUDITAC project recommendations were taken into account like the fact that the frequency of inspections should not be to frequent, they could be carried out after the 1st year and then every 4-5 years, service personnel should be allowed to inspect systems to minimise costs, though this may be prejudicial to independence, that any investigation of system sizing should be very simple unless system replacement was being contemplated. We can report strong interactions with the EPBD interaction process in Portugal, in the Netherlands, in Slovenia and in Austria. However since all countries attended the meetings, we may have a stronger impact than we imagine.
Online information systems under EC management. Summary of project and link were generated for the site. Coordination with some neighbouring projects like Keepcool and EPlabel allowed presentations of the two projects in the two newsletter. Keepcool project also released the Auditac newsletter to its dissemination targets. Auditac introduced Keepcool objectives and contact point at the AICARR conference during Mostraconvegno on March, 1st, 2006.
Commission conferences At the time of AIVC (and EPBD conference), September, 22 2005 in Brussels, , both a paper at the conference and a presentation during the EIEA half-day allowed exchange of views. At the time of the next AIVC-EPIC, in Lyon, November, 21, 2006, the slides were presented by the EIEA representative.
Common presentation material related to EIE actions. Auditac space on CA web site. Poster made available to EIEA.
Article in the EIE – newsletter: http://europa.eu.int/comm/energy/intelligent/library/doc/ien_1.pdf

AUDITAC Final Report February 2007
102
6.5 Situation after Auditac
The awareness of the issues is now a reality. Our tools are available and will remain available at least two years on the web site. The final outputs of the AUDITAC project, which are guidelines and new tools to assist in Inspections and Audit, were however produced from a synthesis of the limited information publicly available and some new information generated by the AUDITAC participants. The AUDITAC project also identified that there will be a shortage of trained personnel throughout Europe to undertake the number of Inspections and Audits that will be required by the EPBD. There is yet a lot to do to implement a rational chain of maintenance and improvement actions targeting energy performance of air conditioning facilities : · Significantly improve the recorded information available on the energy efficiency of A/C systems in practice, and the ‘in-use’ factors that affect this. · Produce a field-tested set of Inspection and Audit procedures based on the AUDITAC guidelines and tools. This will be achieved through undertaking significant numbers of Field Trials and Case Studies of these procedures on A/C systems in a number of key sectors across Europe, specifically Education; Retail; Hospitals, Hotels and Offices. The information derived from undertaking these studies will enable the evolution of robust Inspection and Audit procedures. · Assess the Energy Conservation Opportunities (ECO’S) identifiable from applying various levels of inspection and audit to a number of A/C systems. Through this measure the proposal should assist in the reduction of the cost and effort of future Inspections and Audits in the Member States.

AUDITAC Final Report February 2007
103
This will provide significant insights into the issues affecting energy efficiency in real A/C systems as Member States start to implement such activities. One of the key aspects of the real inspections and audits will be establishing that satisfactory indoor air quality is also being achieved. Let us note also the importance of comfort diagnosis in avoiding or resizing air conditioning in existing buildings suffering temporary discomfort in Summer. This activity could also influence the emerging National and EU standards and guidance in this area through maintaining close contact with other European and MS activities and by linking with other efforts related to Article 9, including providing information needed for future revisions of the EPBD.
AUDITAC Final Report February 2007
104
References Most documents are available from : http://www.eva.ac.at/projekte/auditac.htm.
Christophe Adam, Philippe André, Corinne Rogiest-Lejeune, Cleide Hannay, Jules Hannay, Vincent Lemort, Jean Lebrun, Vlad Teodorese A contribution to the audit of an air-conditioning system: modelling, simulation and benchmarking 12/2006 SSB 2006 international conference Liège J. Adnot et al., 2003, Energy Efficiency and Certification of Central Air Conditioners (EECCAC) for the Directorate General Transportation-Energy of the Commission of the European Union, May 2003 J. Adnot et al., 1999, Energy Efficiency of Room Air-Conditioners (EERAC) for the Directorate General Transportation-Energy of the Commission of the European Union, May 1999 Jérôme Adnot, Maxime Dupont, Roger Hitchin National and EU wide efforts to increase Energy Efficiency of installed Air Conditioners 04/2006 IEECB 06 Alexandre José Luís, Knight Ian, Andre Philippe, Hannay Cleide, Lebrun Jean About the audit of air conditioning systems: Customer advising with the help of case studies and benchmarks, modelling and simulation 04/2006 IEECB 06 CEN, 2004, Preliminary drafts for a Standard about Ventilation for buildings – Energy performance of Buildings – Guidelines for inspection of Air-Conditioning systems, October 2004 Clarice Bleil de Souza , Ian Knight, Gavin Dunn, Andrew Marsh Modelling Buildings For Energy Use: A Study Of The Effects Of Using Multiple Simulation Tools And Varying Levels Of Input, 04/2006 IEECB 06 Daniela Bory, Jérôme Adnot Overall on Auditac Project: Field benchmarking and Market development for Audit methods in Air Conditioning project 03/2006 AICARR Conference 2006 Daniela Bory, Jérôme Adnot, Maxime Dupont, Marco Masoero Chiara Silvi Simon Muhic Vincenc Butala Matjaz Prek Selection of procedures for air conditioning audit and definition of the associated training package 04/2006 IEECB 06 Gavin Dunn, Mrs Clarice Bleil de Souza, Andrew Marsh, Ian Knight, Welsh Measured Buildings and Air Conditioning Energy Performance: An empirical evaluation of the energy performance of air conditioned office buildings in the UK, 04/2006 IEECB 06 M. Dupont et al. 2005, Inspection and auditing of air-conditioning facilities in Europe – A new efficiency target – ECEEE Summer study, June 2005 Maxime Dupont, Jérôme Adnot, Patrice Drapier, Bruno Georges Experimentation of the CEN standard on inspection of air-conditioning systems 04/2006 IEECB 06 M. Dupont, J. Adnot, 2004, Investigation of actual Energy-Efficiency content of “Energy Services” in France, Proceedings of the International Conference on Improving Electricity Efficiency in Commercial Buildings (Frankfurt), April 2004 European Parliament, 2003, Directive 2002/91/EC of the EP and of the Council of 16 December 2002 on the

AUDITAC Final Report February 2007
105
Energy Performance of Buildings, Official Journal of the European Communities, L 1/65, Vol. 46, 4 January 2003 Roger Hitchin, Jérôme Adnot, Maxime Dupont Issues of the implementation of the EPBD article 9: how and why to inspect all air conditioning systems all over Europe? 03/2006 AICARR Conference 2006 Ian Knight, Andrew Marsh, Gavin Dunn, Clarice Bleil de Souza The Components Of Heating And Cooling Energy Loads In UK Offices, With A Detailed Study Of The Solar Component 04/2006 IEECB 06 Ian Knight, Gavin Dunn The potential impacts on energy efficiency in Air Conditioning systems of the inspection requirements in the Energy Performance in Buildings Directive 03/2006 AICARR Conference 2006 Yamina Saheb, Sulejman Becirspahic, Jérôme Simon, Effect of the Certification on Chillers Energy Efficiency, 04/2006 IEECB 06