fibre properties affecting the softness of wool and other ... · keratin fibres, with cashmere and...
TRANSCRIPT

Fibre Properties affecting the Softness of
Wool and other Keratins
by
Linda Karen Hillbrick
B Sc (Honours)
Submitted in fulfilment of the requirements for the degree of
Doctor of Philosophy
Deakin University
November, 2012


ACKNOWLEDGEMENTS
This research was made possible by the Cooperative Research Centre (CRC) for Sheep
Industry Innovation for granting a Ph.D scholarship, and my employer, Commonwealth
Scientific and Industrial Research Organisation (CSIRO), Division of Materials Science
and Engineering (CMSE) for their generous and sustained financial support and
providing the facilities required to carry out this study.
I would like to express my sincere gratitude and appreciation to my supervisors, Dr
Mickey Huson (CSIRO) and Professor Xungai Wang (Deakin University), for their
valuable guidance, advice and encouragement during the course of this research.
I am deeply grateful to the many CSIRO staff that provided technical assistance, advice
and friendship throughout the research period. In particular I would like to thank Jan
Hair and Sue Horne; CSIRO mill and workshop staff; Laurie Staynes and Frank Dean
for their knitwear expertise; Marg Pate and Colin Veitch for SEM images and assistance
with fibre sectioning and David Fox for writing data acquisition software for the fibre
friction tester. I would like to express a special thanks to Dr Bruce McGregor (Deakin
University) for cashmere samples, Dr Trevor Mahar (former CRC project leader) for
providing INF samples and access to the CRC database, Karori Merinos for fleece
samples, Dr Peter Kaplin (Textile Research Institute, Princeton, USA) for torsion
measurements and to Dr Henry Wang (AWTA) for the many valued and useful
discussions on handle and access to the PhabrOmeter.
Finally I wish to thank my family, my husband Gordon and my children, Michael and
Rebecca, for their understanding and enduring support throughout this study.

ii
This thesis is dedicated to the loving memory of my
parents, Lothar and Slawi Mazurkiewicz.
iii
ABSTRACT
Expanding the use of wool to meet the emerging market for next-to-skin knitwear
requires wool to satisfy the consumer’s tactile requirements for softness. Fibre diameter
is known to be the most important fibre parameter influencing softness of wool fibre
and fabric. Crimp and compression properties are also significantly related to fibre
softness, yet there is still a lack of knowledge on the contribution of other fibre
properties to the softness of wool. This study examines the influence of the fibre’s
surface and physical properties other than diameter and curvature, on the softness of
fibres and of fabrics knitted from them.
A positive association between the handle of greasy wool and its resistance to
compression is demonstrated for Merino wool from the Cooperative Research Centre
for Sheep Industry Innovation (Sheep CRC) Information Nucleus Flocks (INF). Pairs of
INF fleece wools with extremes in resistance to compression at constant diameter and
curvature, along with wool, cashmere and alpaca tops, are used in this study to gain a
better understanding of the contribution of secondary fibre properties to softness.
Results show that when the effects of contaminants such as grease and dirt are removed
by scouring, significant differences in the loose wool softness can be detected in wool
samples with different compression properties. Wool fibres with a lower resistance to
compression are consistently and significantly assessed as being softer than wool fibres
of the same fibre diameter and curvature that have a higher resistance to compression.
Similarly the specialty fibres, cashmere and alpaca, have a lower resistance to
compression compared to wool, and are also significantly softer than wool in loose fibre
form. This study also demonstrates that loose wool felting is not related to the softness
of fibres as demonstrated by alpaca felting more readily than both cashmere and wool.
iv
Fibre tensile and bending moduli, and fibre ellipticity, do not account for the differences
in loose fibre softness of the samples. Results show that the soft specialty fibres are
actually slightly stiffer in tension and bending than wool fibres of a similar diameter. In
a limited study however, the shear modulus is shown to vary significantly for different
keratin fibres, with cashmere and alpaca fibres having a much lower shear modulus than
wool of a similar diameter. Shear modulus is dominated by the matrix of the fibres
suggesting that there are some inherent differences in the matrices of the different
fibres, which may in turn contribute to the differences in their softness.
Whilst significant differences in the cuticle spacing, hardness and smoothness were
found for the different keratin fibres, no trends were found in relation to fibre softness.
Similarly there were no significant differences in the frictional properties of the cuticle
surface of cashmere, alpaca and wool fibres when measured at the nano-scale. However
at the macro-scale level, cashmere and alpaca fibre were shown to have significantly
lower ‘with’ and ‘against’ scale coefficients of fibre to metal friction and a lower
directional friction effect (DFE) than wool fibres of a similar diameter. Although these
results suggest that fibre to metal frictional properties could be an indicator of softness,
it was not found to be reliable for all samples. For instance judges could reliably
distinguish the difference in the fibre softness of the soft and harsh Turretfield wool
samples, yet these samples did not show any differences in their fibre to metal frictional
properties. Macro-scale friction is likely to be heavily influenced by cuticle step heights
and indeed the soft alpaca and cashmere fibres were shown to have significantly lower
cuticle step heights than those from wool fibres of a similar diameter. The soft
Turretfield wool sample also showed a small but significantly lower cuticle step height
than the harsh Turretfield wool sample. Whilst it is acknowledged that the sample size
is small in this study, cuticle step height appears to be the secondary fibre property that

v
is most influential in affecting fibre softness, probably by changing the frictional
properties of the fibre.
Although cashmere, alpaca and wool fibres, matched for diameter and as closely as
possible for fibre curvature, were spun and knitted under identical conditions, the
different keratin fibres produced fabrics that differed in weight, thickness and softness.
Alpaca fibre was more difficult to process on the worsted system than wool and resulted
in uneven yarns and cockled fabrics. The severity of the fabric cockle was reduced by
boiling the fabrics under tension for 15 minutes. This anticockle treatment was also
applied to the fabrics knitted from wool so that the processing of the different keratin
fibres was kept identical. The mechanical action during the anticockle treatment
enhanced the hairiness of the alpaca fabrics compared to the wool fabrics and
consequently judges found the alpaca fabrics to be pricklier and harsher feeling than the
wool fabrics. Judges found cashmere fabrics, knitted from yarns spun on the short-
staple cotton system, to be softer than those knitted from wool. The cashmere fabrics
were lighter, thinner and had lower bending rigidity than the wool fabrics. Interestingly
when wool and cashmere fabrics of similar fabric weight and thickness were compared,
judges were unable to reliably distinguish any differences in fabric softness. This
highlights the importance of fabric construction parameters on the perception of
softness.
The PhabrOmeter, developed by Nu Cybertek Inc, USA, was used to objectively assess
the softness characteristics of the knitted fabrics made from the different keratin fibres.
Softness predictions determined from PhabrOmeter force-displacement data are shown
to be significantly correlated with the judges’ softness rankings for the cashmere and
wool fabrics. However, these correlations were not found to be significant when the
alpaca fabrics were included in the analysis.
vi
PUBLICATION LIST
Journal Hillbrick, L.K and Huson, M.G, ‘Merino fibres with low cuticle step height and reduced surface roughness have a softer loose wool handle’, ANIMAL PRODUCTION SCIENCE, Volume: 50, Issue: 11-12, Pages: XXII-XXII, 2010
Journal publication in preparation Hillbrick, L.K and Huson, M.G, ‘Fibre Properties affecting the Softness of Wool and other Keratins’
Conference Hillbrick, L.K and Huson, M.G, ‘Preliminary study on relating Young’s modulus to wool handle’, 86th Textile Institute World Conference, Vol 1, Conference proceedings, Nov 18-21, 2008, Hong Kong
vii
TABLE OF CONTENTS
ACKNOWLEDGEMENTS ......................................................................................................................... i
ABSTRACT ............................................................................................................................................... iii
PUBLICATION LIST ................................................................................................................................ vi
TABLE OF CONTENTS ......................................................................................................................... vii
LIST OF TABLES .................................................................................................................................. xiii
LIST OF FIGURES .................................................................................................................................. xv
LIST OF ABBREVIATIONS ................................................................................................................. xix
CHAPTER 1 GENERAL INTRODUCTION ..................................................................................... 2
1.1 PRELIMINARY REMARKS ................................................................................................................. 2
1.2 GENERAL BACKGROUND ................................................................................................................. 3
1.3 THE RESEARCH OBJECTIVES AND APPROACH OF THIS STUDY .......................................................... 7
1.4 THE OUTLINE OF THE REPORT ......................................................................................................... 8
CHAPTER 2 LITERATURE REVIEW ........................................................................................... 10
2.1 INTRODUCTION ............................................................................................................................. 10
2.2 HANDLE AND SOFTNESS ................................................................................................................ 10
2.2.1 Subjective evaluation of handle and softness ..................................................................... 12
2.2.2 Objective evaluation of handle and softness ...................................................................... 13
2.2.2.1 The KESF and SiroFAST systems for objective measurement of fabrics ................ 14
2.2.2.2 PhabrOmeter ............................................................................................................. 16
2.3 WOOL, CASHMERE AND ALPACA APPAREL FIBRES ........................................................................ 19
2.3.1 Wool ................................................................................................................................... 20
2.3.2 Cashmere ............................................................................................................................ 21
2.3.3 Alpaca ................................................................................................................................ 22
2.3.4 Processing of wool, cashmere and alpaca .......................................................................... 23
2.3.5 Softness of wool, cashmere and alpaca .............................................................................. 27

viii
2.3.6 Growth, chemical and physical structure of wool, cashmere and alpaca fibre ................... 29
2.3.6.1 Growth of animal fibres ............................................................................................ 30
2.3.6.2 Chemical structure of animal fibres .......................................................................... 32
2.3.7 Physical structure of mammalian hair fibres ...................................................................... 33
2.3.7.1 Cortical Cells ............................................................................................................ 34
2.3.7.2 Cuticle Cells (scales) ................................................................................................ 36
2.3.7.3 Cuticle patterns ......................................................................................................... 38
2.4 SCANNING PROBE MICROSCOPY ................................................................................................... 40
2.4.1 AFM of keratin fibres ......................................................................................................... 41
2.5 INFLUENCE OF PHYSICAL AND MECHANICAL FIBRE PROPERTIES ON SOFTNESS .............................. 42
2.5.1 Fibre diameter .................................................................................................................... 43
2.5.2 Fibre ellipticity (cross sectional shape) .............................................................................. 46
2.5.3 Fibre crimp and fibre curvature .......................................................................................... 47
2.5.4 Resistance to Compression (RtC) ....................................................................................... 51
2.5.5 Friction ............................................................................................................................... 55
2.5.6 Felting ................................................................................................................................ 58
2.5.7 Mechanical properties ........................................................................................................ 61
2.5.7.1 Tensile modulus ........................................................................................................ 62
2.5.7.2 Bending modulus ...................................................................................................... 64
2.5.7.3 Shear modulus .......................................................................................................... 68
2.6 CONCLUSION ................................................................................................................................ 70
CHAPTER 3 RESISTANCE TO COMPRESSION, SOFTNESS AND FELTABILITY OF
WOOL, CASHMERE AND ALPACA FIBRES ................................................................................... 72
3.1 INTRODUCTION ............................................................................................................................. 72
3.2 MATERIALS AND EXPERIMENTAL METHODS ................................................................................. 75
3.2.1 Greasy wool from the Information Nucleus flock (INF) .................................................... 75
3.2.1.1 Selection of samples (matched pairs) from INF mid-side samples ........................... 76
3.2.1.2 Diameter and curvature of selected INF samples...................................................... 77
3.2.1.3 Fibre diameter profiles of selected INF samples ....................................................... 77
3.2.1.4 Subjective evaluation of the softness of selected INF samples ................................. 78
ix
3.2.1.5 Felting propensity of selected INF samples .............................................................. 80
3.2.2 Wool, alpaca and cashmere tops ........................................................................................ 81
3.2.2.1 Stretch breaking to reduce the fibre length of fine wool ........................................... 81
3.2.2.2 Top dyeing to permanently reduce the fibre curvature of coarse wool ..................... 82
3.2.2.3 Diameter, curvature and length of wool and specialty fibre tops .............................. 83
3.2.2.4 Resistance to compression of wool and specialty fibre tops ..................................... 83
3.2.2.5 Subjective evaluation of the softness of wool and specialty fibre tops ..................... 83
3.2.2.6 Felting propensity of wool and specialty fibre tops .................................................. 84
3.3 RESULTS AND DISCUSSION ............................................................................................................ 84
3.3.1 Information Nucleus flock (INF) ........................................................................................ 84
3.3.1.1 The Information Nucleus Flock ................................................................................ 84
3.3.1.2 Analysis of objective data for INF wool samples ..................................................... 85
3.3.1.3 Relationships between fibre diameter, curvature and RtC ........................................ 88
3.3.1.4 Analysis of visual data for INF wool samples .......................................................... 93
3.3.1.5 Greasy hand score ..................................................................................................... 95
3.3.2 Samples (matched pairs) from INF mid-side samples ...................................................... 100
3.3.2.1 Diameter and curvature of selected INF samples.................................................... 101
3.3.2.2 Fibre diameter profiles of selected INF samples ..................................................... 103
3.3.2.3 Subjective evaluation of the softness of selected INF samples ............................... 104
3.3.2.4 Felt ball propensity of selected INF samples .......................................................... 107
3.3.3 Wool, alpaca and cashmere top ........................................................................................ 112
3.3.3.1 Stretch breaking to reduce the fibre length of fine wool ......................................... 112
3.3.3.2 Top dyeing to permanently reduce the fibre curvature of coarse wool ................... 113
3.3.3.3 Fibre diameter and curvature of wool and specialty fibre tops ............................... 114
3.3.3.4 Resistance to compression (RtC) of tops ................................................................ 116
3.3.3.5 Subjective evaluation of the softness of tops .......................................................... 116
3.3.3.6 Felting propensity of tops ....................................................................................... 118
3.4 CONCLUSION .............................................................................................................................. 120
CHAPTER 4 CHARACTERISATION OF THE PHYSICAL PROPERTIES OF WOOL,
CASHMERE AND ALPACA FIBRES ................................................................................................ 123

x
4.1 INTRODUCTION ........................................................................................................................... 123
4.2 MATERIALS AND METHODS ......................................................................................................... 126
4.2.1 Fibres from INF greasy mid-side samples (matched pairs) .............................................. 126
4.2.2 Fibre samples from wool, alpaca and cashmere tops........................................................ 126
4.2.3 Single fibre tensile testing ................................................................................................ 126
4.2.4 Ellipticity of fibre cross-sections (fibre shape) ................................................................. 129
4.2.4.1 Ellipticity of single fibres using SIFAN 3 .............................................................. 129
4.2.4.2 Cross-sections from heat-shrink tubing .................................................................. 130
4.2.4.3 Cross-sections from fibres embedded in epoxy resin and sectioned with an
ultramicrotome ........................................................................................................................... 130
4.2.5 Calculation of the bending rigidity of fibres..................................................................... 131
4.2.6 Preliminary study on the shear modulus of single fibres .................................................. 131
4.3 RESULTS AND DISCUSSION .......................................................................................................... 132
4.3.1 Single fibre tensile properties ........................................................................................... 132
4.3.1.1 Karori Impact Sire .................................................................................................. 138
4.3.2 Ellipticity of fibre cross-sections ...................................................................................... 139
4.3.2.1 Ellipticity of single fibres using SIFAN 3 .............................................................. 139
4.3.2.2 Cross-sections from heat-shrink tubing .................................................................. 140
4.3.2.3 Cross-sections from fibres embedded in epoxy resin and sectioned with an
ultramicrotome ........................................................................................................................... 142
4.3.3 Bending rigidity of single fibres ....................................................................................... 144
4.3.4 Preliminary study on the shear modulus of single fibres .................................................. 146
4.4 CONCLUSION .............................................................................................................................. 147
CHAPTER 5 CHARACTERISATION OF THE SURFACE PROPERTIES OF WOOL,
CASHMERE AND ALPACA FIBRES ................................................................................................ 149
5.1 INTRODUCTION ........................................................................................................................... 149
5.2 MATERIALS AND METHODS ......................................................................................................... 154
5.2.1 Fibre samples for surface analysis .................................................................................... 154
5.2.2 Sample preparation for surface analysis ........................................................................... 154
5.2.3 Scanning probe microscopy ............................................................................................. 155

xi
5.2.3.1 Fibre surface characterisation by SPM ................................................................... 155
5.2.3.2 Cuticle penetration and surface stiffness characterisation by SPM ........................ 157
5.2.3.3 Cuticle surface friction characterisation by SPM .................................................... 158
5.2.4 Fibre to metal friction characterisation using a capstan friction tester ............................. 159
5.3 RESULTS AND DISCUSSION .......................................................................................................... 160
5.3.1 Scanning probe microscopy ............................................................................................. 160
5.3.1.1 Cuticle step height, cuticle interval (frequency) and surface roughness ................. 160
5.3.1.2 Cuticle Penetration and surface stiffness – force volume mode ............................. 171
5.3.1.3 Cuticle surface friction – nanoscale friction ........................................................... 178
5.3.2 Capstan friction tester – macroscale friction .................................................................... 180
5.4 CONCLUSION .............................................................................................................................. 184
CHAPTER 6 SOFTNESS OF SINGLE JERSEY FABRICS KNITTED FROM WOOL,
CASHMERE AND ALPACA FIBRE .................................................................................................. 188
6.1 INTRODUCTION ........................................................................................................................... 188
6.2 MATERIALS AND METHODS ......................................................................................................... 192
6.2.1 Wool, alpaca and cashmere tops ...................................................................................... 192
6.2.2 Yarn Production ............................................................................................................... 193
6.2.2.1 Cashmere and stretch broken wool on the cotton ring spinning system ................. 193
6.2.2.2 Alpaca, wool and dyed wool on the worsted ring spinning system ........................ 194
6.2.2.3 Yarn testing, setting and folding ............................................................................. 196
6.2.3 Knitting ............................................................................................................................ 198
6.2.3.1 Anticockle treatment for alpaca and wool single jersey knitwear ........................... 199
6.2.3.2 Finishing of knitted fabrics ..................................................................................... 200
6.2.4 Fabric testing .................................................................................................................... 200
6.2.4.1 Fabric mass per unit area (weight), thickness and spirality .................................... 200
6.2.4.2 Bending of knitted fabrics ....................................................................................... 201
6.2.4.3 Objective evaluation of knitted fabric handle using the PhabrOmeter.................... 201
6.2.4.4 Subjective (sensory) evaluation of the knitted fabric softness ................................ 203
6.2.4.5 Statistical analysis ................................................................................................... 204
6.3 RESULTS AND DISCUSSION .......................................................................................................... 205
xii
6.3.1 Processing and yarn properties ......................................................................................... 205
6.3.1.1 Cashmere and wool –processed on the cotton system ............................................ 205
6.3.1.2 Alpaca and wool – processed on the worsted system ............................................. 208
6.3.2 Physical properties of the single jersey fabrics................................................................. 211
6.3.3 KESF bending properties of knitted fabrics ..................................................................... 218
6.3.4 PhabrOmeter softness evaluation ..................................................................................... 226
6.3.5 Subjective evaluation of the softness of knitted fabrics ................................................... 236
6.4 CONCLUSION .............................................................................................................................. 241
CHAPTER 7 CONCLUSIONS ........................................................................................................ 245
7.1 SUMMARY .................................................................................................................................. 245
7.2 FUTURE WORK ............................................................................................................................ 253
APPENDICES .............................................................................................................................................I
REFERENCES ..................................................................................................................................... LIII
xiii
LIST OF TABLES
Table 2-1 Extraction curve parameters used in handle prediction models 18
Table 2-2 PhabrOmeter handle prediction scores for eight fabric handle characteristics 19
Table 2-3 Coefficients of against scale friction (μa) and DFE of various keratin fibres measured by
a capstan method 57
Table 3-1 Descriptive statistics for the objectively measured fibre properties of the INF Merino
progeny 85
Table 3-2 Variation in the objectively measured fibre properties of the Merino progeny at the
individual INF sites 87
Table 3-3 Influence of tip shearing (tipping) on the objectively measured fibre properties of the
INF Merino progeny and at Struan (IN06) 88
Table 3-4 Correlation matrix for mean fibre diameter (MFD), curvature (MFC) and resistance to
compression (RtC) for the INF Merino progeny 88
Table 3-5 Correlation matrix for mean fibre diameter (MFD), curvature (MFC) and resistance to
compression (RtC) for the Merino progeny at the individual INF sites 93
Table 3-6 Descriptive statistics for visual fibre traits of the INF Merino progeny 94
Table 3-7 Variation in visual fibre traits of the Merino progeny at the individual INF sites 95
Table 3-8 Variation in the objectively measured fibre properties at the INF sites that assessed
‘hand’ 96
Table 3-9 Average fibre diameter of the various hand score categories at the INF sites 97
Table 3-10 Correlation matrix for INF sites which scored fibre hand 100
Table 3-11 Relationship between greasy hand and the objective and visual fibre properties 100
Table 3-12 Properties of selected INF mid-side samples obtained from the CRC database 102
Table 3-13 Solvent extractable matter and dirt content of the selected INF mid-side samples 105
Table 3-14 Softness rankings of the selected INF mid-side samples 106
Table 3-15 Effect of INF fibre type on felt ball diameter (Anova α=0.05) 111
Table 3-16 Inference about the feltball diameter of the Katanning INF samples (α=0.05) 111
Table 3-17 Almeter fibre lengths (<50 mm) in cashmere, wool and stretch broken wool 113
Table 3-18 Changes in fibre properties as a result of setting fibres during top dyeing 114
Table 3-19 Properties of wool and specialty fibre tops 115

xiv
Table 3-20 Softness ranking of wool and specialty fibre tops (HSD α 0,05 = 22.1) 117
Table 4-1 Tensile properties of INF mid-side samples and speciality tops 134
Table 4-2 Fibre ellipticity of INF mid-side samples and speciality tops 144
Table 4-3 Bending rigidity of INF mid-side samples and speciality tops 145
Table 5-1 Average AFM cuticle properties for INF Turretfield samples and speciality tops 165
Table 5-2 Average tip penetration for wool, cashmere and alpaca fibres 176
Table 5-3 Relative coefficient of friction (μ), standard errors and average correlation coefficients
for wool, cashmere and alpaca fibres 179
Table 5-4 Average fibre-metal coefficient of friction for wool, cashmere and alpaca fibres 182
Table 6-1 PhabrOmeter curve parameters used in handle prediction models 203
Table 6-2 Drawn sliver and roving evenness 206
Table 6-3 Average yarn properties of wool and cashmere singles yarns spun on the cotton system 208
Table 6-4 Sliver and roving evenness (worsted system) 210
Table 6-5 Average yarn properties of wool and alpaca singles yarns spun on the worsted system 211
Table 6-6 Average fabric weight and thickness for the single jersey fabrics knitted from worsted
spun alpaca and wool yarns 214
Table 6-7 Average fabric weight and thickness for the single jersey fabrics knitted from cotton
spun cashmere and wool yarns 215
Table 6-8 Average fabric bending rigidity and hysteresis for the single jersey fabrics knitted from
worsted spun alpaca and wool yarns 220
Table 6-9 Average fabric bending rigidity and hysteresis for the single jersey fabrics knitted from
cotton spun cashmere and wool yarns 221
Table 6-10 PhabrOmeter curve parameters obtained for the experimental fabrics 234
Table 6-11 Predicted handle characteristics calculated by Wang (2011) for the single jersey fabrics 236
Table 6-12 Softness ranking of single jersey fabrics produced from cotton spun cashmere and
stretch broken wool 238
Table 6-13 Softness ranking of single jersey fabrics produced from worsted spun alpaca and wool 240
Table 6-14 Comparison between the PhabrOmeter and subjective softness ranking of five single
jersey fabrics knitted to a machine tightness factor of 14 tex½/cm 241

xv
LIST OF FIGURES
Figure 2-1 Schematic diagram of the PhabrOmeter Fabric Evaluation system 16
Figure 2-2 PhabrOmeter fabric extraction curve and curve parameters 17
Figure 2-3 Woollen processing route 24
Figure 2-4 Worsted processing route 25
Figure 2-5 Short staple (cotton system) processing route 25
Figure 2-6 Complex structure of a fine Merino wool fibre Cortical Cells 34
Figure 2-7 Schematic diagram of the cuticle structure of a merino fibre 36
Figure 2-8 Scanning electron micrograph of the cuticle of a Merino fibre 38
Figure 2-9 Schematic of AFM measurement principle 41
Figure 3-1 Relationship between resistance to compression (RtC) and mean fibre diameter (MFD) 89
Figure 3-2 Relationship between mean fibre curvature (MFC) and mean fibre diameter (MFD) 89
Figure 3-3 Relationship between resistance to compression (RtC) and fibre curvature (MFC) 90
Figure 3-4 Relationship between mean fibre diameter (μm) and hand score 99
Figure 3-5 Relationship between fibre curvature and RtC for the various diameter slices 103
Figure 3-6 Diameter profiles of staples from selected INF mid-side samples 104
Figure 3-7 Turretfield mid-side samples-before and after solvent extraction in dichloromethane. 105
Figure 3-8 Effect of wool staple length and agitation time on feltball diameter in the Mathis
Labomat @ 40°C and rotating at 60 rpm 109
Figure 3-9 Effect of wool sliver ‘cut’ length and agitation time on feltball diameter in the Mathis
Labomat @ 40°C and rotating at 60 rpm 109
Figure 3-10 Average feltball diameter of selected INF samples tested in a Mathis Labomat @
40°C and rotating at 60 rpm 110
Figure 3-11 Feltballs formed by the INF samples 110
Figure 3-12 Relationship between resistance to compression and softness rank sum for wool tops 118
Figure 3-13 Feltball diameter of top samples after 30 minutes of agitation 119
Figure 3-14 Rate of felt ball formation in 26 μm wool and alpaca 120
Figure 4-1 Stress-strain curves of wool, cashmere and alpaca single fibres tested in air at 20°C and
65% relative humidity at a strain rate of 25%/min 133

xvi
Figure 4-2 Variation in Young’s modulus with resistance to compression (Error bars are the
standard error of the mean) 135
Figure 4-3 The broken end of a wool fibre 137
Figure 4-4 Young’s modulus of single wool fibres from Karori and CRC flocks (n=983) 138
Figure 4-5 Diameter profile of nominally round, 10 μm calibration wire measured at orientations
of 60 degrees and 150 degrees with a SIFAN 3 instrument 140
Figure 4-6 Maximum diameter ratio (ellipticity) of nominal 10 μm wire obtained from SIFAN 3 at
an orientation of 60 degrees and 150 degrees. 140
Figure 4-7 SEM images of typical fibre cross-sections obtained from the heat-shrink tubing
method 141
Figure 4-8 Variation in fibre ellipticity shown in transverse cross-sections. A) “soft” Turretfield
wool fibres, B) alpaca top fibres stained with methylene blue and C) cashmere top
fibres 143
Figure 5-1 Schematic of apparatus used to measure fibre to metal friction 160
Figure 5-2 Typical AFM flattened height image (60 μm x 15 μm) of a single wool fibre from
Turretfield (high RtC) – showing a 5 μm wide section analysis band used to determine
cuticle step height (A) and cuticle interval (B) 162
Figure 5-3 Typical AFM flattened height image (60 μm x 15 μm) of a single fibre from cashmere
top – showing a 5 μm wide section analysis band used to determine cuticle step height
(A) and cuticle interval (B) 163
Figure 5-4 Typical AFM flattened height image (60 μm x 15 μm) of a single fibre from alpaca top
– showing a 5 μm wide section analysis band used to determine cuticle step height (A)
and cuticle interval (B) 164
Figure 5-5 Histogram showing the cuticle step height distribution of the low and high RtC
Turretfield samples 166
Figure 5-6 SEM images of a wool fibre from top showing the scale frequency and a cuticle edge 167
Figure 5-7 SEM images of an alpaca fibre from top showing the scale frequency and a cuticle
edge 168
Figure 5-8 SEM images of a cashmere fibre from top showing the scale frequency and a cuticle
edge 168

xvii
Figure 5-9 Typical 3D AFM flattened height image (5 μm x 5 μm ) of the cuticle surface of A)
wool fibre from 17 μm wool top and B) cashmere fibre from 17 μm cashmere top 170
Figure 5-10 Typical 3D AFM flattened height image (5 μm x 5 μm) of the cuticle surface of A)
wool fibre from 27 μm wool top and B) alpaca fibre from 26 μm alpaca top (Z scale is
100 nm/division) 170
Figure 5-11 Typical 3D AFM flattened height image (5 μm x 5 μm) of the cuticle surface of A)
wool fibre from the Turretfield Low RtC sample and B) wool fibre from the
Turretfield High RtC sample (Z scale is 100 nm/division) 170
Figure 5-12 Typical f-d measurement using a silicon point probe (k~42 N/m) on A) wool fibre
from 17 μm wool top and B) cashmere fibre from 17 μm cashmere top 172
Figure 5-13 Typical f-d measurement using a silicon point probe (k~42 N/m) on A) wool fibre
from 27 μm wool top and B) alpaca fibre from 26 μm alpaca top 173
Figure 5-14 Typical f-d measurement using a silicon point probe (k~42 N/m) on A) wool fibre
from the Turretfield Low RtC sample and B) wool fibre from the Turretfield High RtC
sample 174
Figure 5-15 Tapping mode images of residual indents after f-v experiment on alpaca fibre A)
height image, B) phase image and C) amplitude image 175
Figure 5-16 Typical Amonton’s Law plots of friction force versus applied load for fibres from
alpaca, cashmere and fine and coarse wool tops 179
Figure 5-17 Single fibre friction tester 180
Figure 5-18 Single fibre friction trace showing the initial tension (T0) and the output tension (T1)
generated by a fibre from the coarse wool top rubbing on a stainless steel capstan
rotating at 50 rpm 181
Figure 6-1 Alpaca fabric A) not anti-cockle treated B) anti-cockle treated 199
Figure 6-2 Dirt build-up on GN 6 roller 209
Figure 6-3 Single jersey fabrics from cotton spun fibres (A) mass per unit area and (B) fabric
thickness 216
Figure 6-4 Single jersey fabrics from worsted spun fibres (A) mass per unit area and (B) fabric
thickness 217
Figure 6-5 Bending directions of single jersey fabrics. The solid line represents the axis about
which the fabric is bent 219

xviii
Figure 6-6 Single jersey fabrics from worsted spun fibres - (A) fabric bending rigidity and (B)
fabric bending hysteresis 222
Figure 6-7 Single jersey fabrics from cotton spun fibres - (A) fabric bending rigidity and (B)
fabric bending hysteresis (error bar ± standard error of sample mean) 223
Figure 6-8 Relationship between fabric bending rigidity and fabric weight 226
Figure 6-9 PhabrOmeterTM Model 3 (A) and an insertion/extraction curve for a single jersey
wool fabric (B) 227
Figure 6-10 PhabrOmeter single jersey fabric fingerprints (A) cotton spun cashmere and stretch
broken wool and (B) the worsted spun alpaca and ecru wool 229
Figure 6-11 Insertion/extraction curves for single jersey fabrics knitted from worsted-spun wool
and alpaca yarns 230
Figure 6-12 Insertion/extraction curves for single jersey fabrics knitted from cotton-spun stretch
broken wool and cashmere yarns 231
Figure 6-13 Effect of cover factor, fibre type and processing route on the shape of the
insertion/extraction curve 232
Figure 6-14 Fabric surface A) top dyed wool (26 μm) and B) alpaca (26 μm) 240
xix
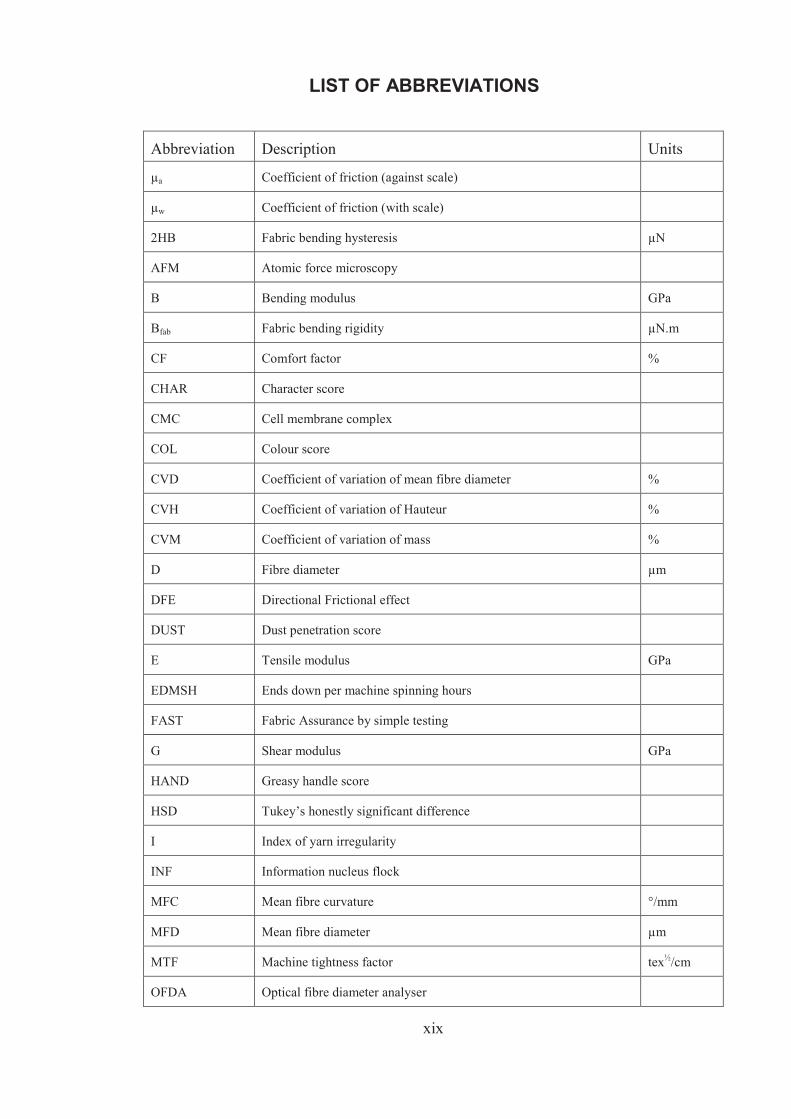
LIST OF ABBREVIATIONS
Abbreviation Description Units
μa Coefficient of friction (against scale)
μw Coefficient of friction (with scale)
2HB Fabric bending hysteresis μN
AFM Atomic force microscopy
B Bending modulus GPa
Bfab Fabric bending rigidity μN.m
CF Comfort factor %
CHAR Character score
CMC Cell membrane complex
COL Colour score
CVD Coefficient of variation of mean fibre diameter %
CVH Coefficient of variation of Hauteur %
CVM Coefficient of variation of mass %
D Fibre diameter μm
DFE Directional Frictional effect
DUST Dust penetration score
E Tensile modulus GPa
EDMSH Ends down per machine spinning hours
FAST Fabric Assurance by simple testing
G Shear modulus GPa
HAND Greasy handle score
HSD Tukey’s honestly significant difference
I Index of yarn irregularity
INF Information nucleus flock
MFC Mean fibre curvature °/mm
MFD Mean fibre diameter μm
MTF Machine tightness factor tex½/cm
OFDA Optical fibre diameter analyser
xx
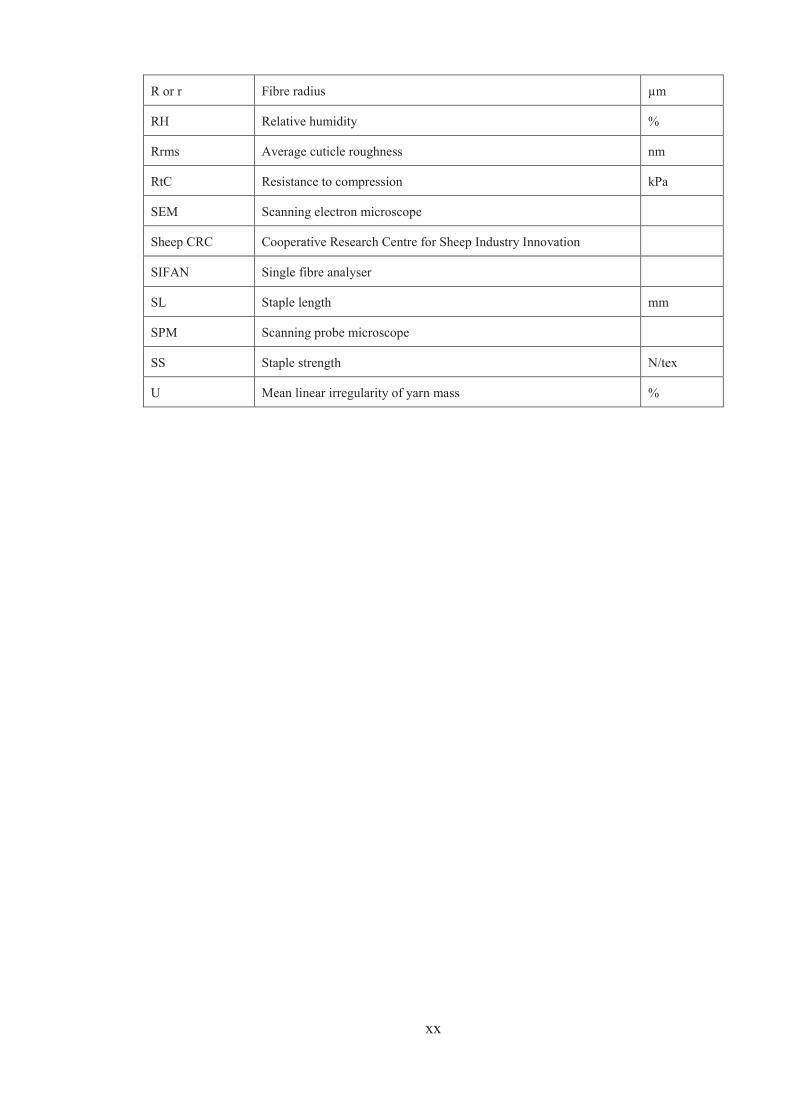
R or r Fibre radius μm
RH Relative humidity %
Rrms Average cuticle roughness nm
RtC Resistance to compression kPa
SEM Scanning electron microscope
Sheep CRC Cooperative Research Centre for Sheep Industry Innovation
SIFAN Single fibre analyser
SL Staple length mm
SPM Scanning probe microscope
SS Staple strength N/tex
U Mean linear irregularity of yarn mass %


2
CHAPTER 1 GENERAL INTRODUCTION
1.1 Preliminary remarks
Traditionally wool is used in tailored, mid and outer layer clothing and jumpers to
provide warmth during the cooler seasons of the year. However active lifestyles and
climate-controlled living environments have shifted the global clothing consumption
towards casual, lighter weight garments that are trans-seasonal and can be worn
throughout the year. Future growth for Australian merino wool depends on expanding
the use of wool into markets where it currently has little to no representation such as the
rapidly growing trans-seasonal, next-to-skin knitwear market. This market is currently
dominated by cotton and synthetic fibres. The Sheep CRC for “Transforming the sheep
industry” has identified this as an important emergent apparel market, and since
Australia produces over 90% of the world’s super-fine wool, it is seen as an important
growth opportunity for the Australian wool industry (Rowe 2010; Swan 2010).
Wool’s intrinsic properties such as moisture absorption (Christoe et al. 1998) and odour
reduction (McQueen et al. 2007; McQueen et al. 2008) make it an ideal substrate for
clothing that is worn against the skin. However demand in this knitwear sector is driven
by the ability to pay rather than willingness to pay and hence the functional qualities of
wool are only appreciated if the garment has the desired comfort and handle qualities
(Rowe 2010). Hedonic attributes associated with tactile stimulation are important and
materials that are pleasant to touch are generally soft and smooth (Essick et al. 2010). In
knitwear, soft touch (softness) implies compressibility, suppleness and quality and is
typically associated with premium quality products constructed from luxurious animal
fibres, most notably cashmere and vicuna, but also alpaca and superfine merino wool
(De Boos 2005a; Wang, Wang & Liu 2003). Expanding the use of wool to meet the
3
emerging market for next-to-skin knitwear requires wool to possess an appealing, if not
luxurious handle to satisfy the consumer’s tactile requirements for softness.
Fibre diameter, crimp and compression properties are known to influence the softness of
wool fibre and fabric. Yet these fibre properties cannot explain all the variations
observed in fibre softness (Shah & Whiteley 1971). It is reasonable to expect that other
secondary fibre properties may also play a role, for example, fibre friction and how
easily fibres can slip past one another or slide against the skin and also the ease which
fibres can bend and twist.
In view of the importance of softness in knitwear, this study aims to build on and
contribute to work in gaining a better understanding of the contribution of secondary
fibre properties to softness. The desired outcome of this research is the identification of
a wool fibre characteristic(s), other than diameter, that is important in making fibres feel
soft to the touch. This topic is selected because identification of the characteristics
responsible for softness may help the Australian wool growers to target their wool
production to ensure that the most appropriate wool fibres are used for the construction
of the next-to-skin knitwear garments.
1.2 General background
Several landmark studies have already confirmed the significant role of fibre diameter
on the softness of loose wool (Ali, Whiteley & Chaudri 1971; Roberts 1956; Shah &
Whiteley 1971; Smuts & Slinger 1972; Sumner 2009). Fibres become less soft as fibre
diameter increases and this softness is also reflected in the handle of fabrics (Madeley,
Mahar & Postle 1995; Stevens 1994; Stevens & Mahar 1995). Although the
overwhelming influence of fibre diameter on softness may explain the paucity in the
literature on the influence of other fibre properties on softness, it has been

4
acknowledged that fibre diameter alone cannot always explain the differences in the
perceived softness of wool samples (Shah & Whiteley 1971). Resistance to compression
(RtC), which is primarily a function of fibre crimp, was found to be the most important
secondary factor influencing the softness of loose wool and fibre became less soft as
their resistance to compression increased (Madeley, Postle & Mahar 1998b; Shah &
Whiteley 1971; Stevens 1994). However debate currently exists on the usefulness of
RtC as an indicator of softness, particularly for wool fibres of varying diameters where
it has been shown that some coarse wools actually have a lower RtC than fine, softer
handling wool (Liu, Wang & Wang 2004a).
The diameter of the Australian wool clip has become significantly finer over the last
decade, and now about 20% of the clip is less than 18.5 μm (Rowe 2010). It is
important to examine the fundamental relationships between how soft fibres feel
(handle) and their objectively measured fibre properties such as fibre diameter,
curvature and RtC on the wools that are now more typical of the current finer Australian
Merino flock.
Can any variations in softness of wool be explained by the physical properties of the
fibre bulk or surface when the fibre diameter and crimp are kept constant? Stevens
(1994) listed a number of fibre properties other than diameter and crimp that may play
an important role in softness, particularly in cases where samples deviate from the
strong diameter handle relationship and suggested that the fibre surface may be
important, but did not provide any evidence for this suggestion.
Cuticle properties influence the felting properties of wool fibres (Kenyon, Wickham &
Blair 1999; Ladyman, Greeff & Schlink 2004; Rippon 2008), but the relationship
between felt ball diameter and fibre softness is not clear due to conflicting data from
5
Kenyon, Wickham and Blair (1999) and Sumner (2009). Kenyon, Wickham and Blair
(1999) found significant correlations between feltball diameter and softness for
Romneys and Quarter Merinos, whilst Sumner (2009) found that feltball diameter was
not significantly correlated to the fibre softness of different breeds of sheep.
Cuticle properties such as scale frequency and scale height are traditionally obtained by
scanning electron microscope (SEM) and light microscope methods. Although these
methods have provided invaluable information on scale frequency and scale height of
various keratin fibres, the scanning probe microscopy (SPM) presents an opportunity to
provide further quantitative information regarding cuticle properties at the sub-micron
level such as hardness and friction. These properties have not been reported for animal
fibres that have been assessed for softness and are of similar fibre diameter.
The mechanical properties of the fibres are thought to impact significantly on the tactile
properties of fabrics (De Boos 2005a; Kawabata 1996; Realff & Cascio 2005), however
the forces associated with deforming single fibres are small and difficult to measure
(Kawabata 1996). Early researchers could not demonstrate a significant relationship
between Young’s modulus and softness (Roberts 1956) or bending rigidity and softness
(Shah & Whiteley 1971) for wool, yet a recent study on human hair has shown that
handle is perceived as being inferior when hair is thick, bending stiffness and friction in
the tip region is high (Wortmann & Schwann-Jonczyk 2006).
Compared to wool, there is little scientific or technical information available in relation
to textile processing and spinning of specialty fibres such as cashmere and alpaca.
Although details of their specialist processing are usually kept as closely guarded
secrets (McGregor & Postle 2004; Wang, Wang & Liu 2003), it is known that alpaca is
mainly processed on the worsted system (Wang, Liu & Wang 2004; Wang, Wang &

6
Liu 2005; Wang, Wang & Liu 2003) and the majority of cashmere is processed on the
woollen system (McGregor 2001). The woollen system is renowned for producing soft,
lofty yarns with a layer of easily compressed surface fibres (Madeley 1994). The short
fibre length of cashmere makes it ideal for processing on the cotton system (short
staple) which is the most widely used processing system in the world. However there
have been no reports for the successful production of pure cashmere yarns on the cotton
system.
Cashmere and alpaca are acclaimed for their superior softness and anecdotal evidence
suggests that cashmere and alpaca fibres are softer than wool of the same fibre diameter.
Yet to date there have been only a limited number of scientific studies and these have
compared the softness of cashmere to wool (McGregor 2001,2007a,b; Teasdale et al.
1985) and alpaca to wool (Finn, Vuckovic & Miller 1999; Liu, Wang & Wang 2004a;
Wang, Wang & Liu 2005; Wang, Wang & Liu 2003). Also conflicting results on the
subjective softness of alpaca and wool fabrics knitted from worsted yarns have been
reported (Finn, Vuckovic & Miller 1999; Wang, Wang & Liu 2003).
Much of the early research on fabric softness has focussed on studying the relationships
between the subjective handle of fabrics and their measurable mechanical deformation
properties. This led to the development of instruments for the objective evaluation of
fabric handle, such as the Kawabata evaluation system for fabrics (KESF), Fabric
Assurance by Simple Testing (FAST) and most recently the PhabrOmeter. While
scientific literature is plentiful on the use of KESF and FAST for the assessment of
handle and low stress mechanical properties of woven fabrics, there are fewer articles
on using the KESF to measure the mechanical properties of knitted fabrics and in
particular comparing the properties of wool knits to those made from cashmere and
alpaca. Similarly there are only a few reports on the use of the newly developed

7
PhabrOmeter for assessing the handle of knitwear (Lam & Wong 2011; Mahar & Wang
2010; Wang et al. 2008) and none of these studies have compared cashmere, wool and
alpaca single jersey fabrics. The PhabrOmeter provides a unique opportunity to study
and compare the softness and handle characteristics of light weight knitwear from
different keratin fibres including wool, cashmere and alpaca.
1.3 The research objectives and approach of this study
Softness of handle is of great importance for next-to-skin knitwear and despite its
importance very little has been done to investigate the factors contributing to it. In
particular, the contribution of a fibre’s bulk and surface properties to fibre softness
warrants further research. Hence the objective of this research is to elucidate the effect
of secondary fibre properties on the softness of wool. The unifying hypothesis tested in
this thesis is that fibre properties, other than diameter and curvature, can influence the
softness of wool and other keratin fibres such as cashmere and alpaca. The Cooperative
Research Centre for Sheep Industry Innovation (Sheep CRC) Information Nucleus
Flocks (INF) are representative of the current Australian Merino flock and affords an
opportunity to examine the relationships between the various fibre properties and in
particular resolve some of the discrepancies associated with previous findings. Hence
this study focuses on:
i. Investigating the resistance to compression (RtC) of current Australian Merino
wool flocks and its relationship to objectively measured fibre properties such as
fibre diameter and curvature and subjectively assessed greasy fibre softness. Is
RtC a good indicator of softness of wool?
ii. Accepting that mean fibre diameter (MFD) and mean fibre curvature (MFC) are
the main determinants of RtC (Shah & Whiteley 1971; Swan 1993; Van Wyk
1946) and that RtC measures loose wool softness (Madeley, Postle & Mahar
1998a), the main aim of this study is to determine if secondary fibre properties

8
other than diameter and curvature are associated with softness (RtC). Merino
wools that show marked deviation in RtC, when the effects due to fibre diameter
and curvature are removed, are selected for study. Bulk fibre properties such as
subjective softness and feltball formation and single fibre properties such as
fibre shape, Young’s tensile modulus, cuticle properties and fibre friction are
compared to ascertain whether any of these properties influence softness.
iii. In addition to the assessment of raw Merino wool fibres, wools from tops were
selected so they are matched as closely as practicable to that of commercial
cashmere and alpaca top. The physical and surface properties of these top fibres
are also compared. The tops are processed on the short staple (cotton) and
worsted systems and knitted into single jersey fabrics. The handle of these
fabrics were assessed subjectively by judges and objectively using the KESF and
PhabrOmeter instruments. Are cashmere and alpaca fibres and fabric softer than
wool of the same diameter?
It is hoped that these fundamental studies described above can add to the existing
knowledge of fibre properties associated with fibre and fabric softness and may allow
appropriate management and genetic strategies to be implemented for the production of
soft wool for next-to-skin knitwear markets.
1.4 The outline of the report
The literature review in chapter two encompasses a range of issues related to
understanding the contribution of the fibre properties of Merino wool, cashmere and
alpaca on their tactile softness. Fibre properties of the CRC Information Nucleus Flocks
(INF) are discussed in Chapter 3 and the selected INF samples pairs, and wool,
cashmere and alpaca tops used in this thesis are presented. A novel method for
measuring feltball formation is also described in this chapter along with the felting
propensity and subjective softness of the selected samples. Chapter 4 focuses on the
characterisation of the physical properties of the fibres including Young’s modulus, the
ellipticity of the fibre cross-sections, and estimations of the bending rigidity and

9
torsional modulus. Chapter 5 describes the surface characteristics of the selected fibres
such as cuticle topography, roughness and friction that are measured using the scanning
probe microscope (SPM). Chapter 6 describes the production of single jersey fabric
from the wool, cashmere and alpaca top along with objective and subjective fabric
handle evaluations. The concluding chapter, Chapter 7, provides a brief summary of the
conclusions derived from this research. Some suggestions for future research are also
given in this chapter.

10
CHAPTER 2 LITERATURE REVIEW
2.1 Introduction
Softness is believed to depend largely on the mechanical, physical and surface
properties of fibres (Kawabata 1982; Kawabata et al. 2004; Kim & Slaten 1999; Liu,
Wang & Wang 2004b; Lundgren 1969; Niwa & Ishida 1978; Van Wyk 1946). Several
researchers have already shown that softness is closely associated with fibre diameter
and crimp, and is influenced by surface friction and resistance to compression (Ali,
Whiteley & Chaudri 1971; Christoe et al. 1998; Hunter et al. 1982; Madeley, Postle &
Mahar 1998a,b; Roberts 1956,1961; Shah & Whiteley 1971; Smuts & Slinger 1972;
Stevens 1994; Sumner 2009; Van Wyk 1946). The current understanding of these fibre
properties is reviewed in this chapter, particularly in relation to wool, cashmere and
alpaca, as these are the fibre substrates used in this research. It is acknowledged that
there are a wide range of other factors that may influence softness of knitted fabric, such
as yarn and fabric structures, finishing techniques, shrink-proofing chemicals and the
application of chemical softeners. These however are considered beyond the scope of
this thesis and are not discussed in this review.
2.2 Handle and softness
Handle is the assessment of the tactile properties of a textile. Handle has been described
in various ways, all referring to the sense of touch or the sensory response that arises
when fabrics are touched (Bishop 1996; Denton & Daniels 2002; Hoffman & Beste
1951; Pan 2007; Raheel & Liu 1991; Sular & Okur 2007). Attempts to discriminate
fibres and fabrics by their tactile properties (sense of touch) first commenced in 1926
(Binns 1926). Handle is now routinely judged at all stages of the wool processing
pipeline from fibre on the animal to raw and semi processed fibre and as well as to yarn
and fabric (De Boos 2005b; Shah & Whiteley 1971).
11
Handle encompasses a number of tactile sensations that include stiffness, softness,
smoothness, stiffness, silkiness, firmness, fullness, crispness, hardness, roughness and
thickness (Behery 2005; De Boos et al. 2002; Denton & Daniels 2002; Ellis &
Garnsworthy 1980; Howorth & Oliver 1958; Liu, Wang & Wang 2004b; Shah &
Whiteley 1971). Of all the terms used to describe handle, the word softness is most
frequently equated with handle (McGregor 2001,2007a; McGregor & Postle 2006),
particularly in the assessment of the handle of loose Merino wool (Shah & Whiteley
1971) and to describe fabric hand (Finnimore & Konig 1986; Li 2001; Niwa & Ishida
1978).
Softness is a tactile property that is difficult to define. Stevens (1994) described
‘softness’ as “a wonderfully imprecise but evocative term to convey general tactile
impression’. De Boos (2005a) also paradoxically pointed out that out of the handle
descriptor terms, softness was the least understood scientifically, and defined softness in
terms of ‘lack of resistance to deformation, the ease with which a garment compresses,
bends and flexes under the hands of the wearer’. Softness has also been described as
‘the combined effect of smooth and soft feelings’ (Niwa & Ishida 1978), being easily
deformed (yielding) under pressure (Elder et al. 1984; Finnimore & Konig 1986;
Stevens 1994) and/or having a smooth/fine textured surface (Stevens 1994). To add
complexity, the term ‘softness’ has multiple meanings that depend on the end-use or
application (Elder et al. 1984; Finnimore & Konig 1986; Li 2001). For example, the
softness of silk relates to smoothness and flexibility, whilst the softness of eiderdown
relates to compression (Elder et al. 1984). In premium knitwear, softness is the most
important handle attribute and it implies compressibility, suppleness and quality (De
Boos 2005a).

12
Handle evaluations carried out by people or subjects are usually referred to in the
literature as subjective evaluations, whilst those made on instruments are called
objective measurements (Bishop 1996). The terms subjective and objective are used
throughout this thesis to indicate whether handle and softness determinations are made
by sensory methods (people) or by instruments. It should also be noted that the use of
sensory methods does not imply that the results are subjective.
2.2.1 Subjective evaluation of handle and softness Traditionally, fabric handle was evaluated using sensory methods where manufacturers,
retailers and consumers would handle fabrics by touching, rubbing and squeezing
(Bishop 1996). The touch sensation results from the stimulation of the tactile sensors
that are located in clusters and distributed all over the skin (Dargahi & Najarian 2004;
Militky 2005) and hand and finger movements allow information to be gained about
both texture and compressional properties (Stevens 1994). The tactile sensations
enabled judgements to be made on the quality, desirability and suitability of fabric for
specific end uses (Aliouche & Viallter 2000; Behery 2005; Hoffman & Beste 1951;
Stevens 1994). Consumers use tactile judgements, along with a variety of other factors
that include fashion, price, functionality, sustainability, personal, cultural and social
factors to make purchasing decisions (Behery 1986; Binns 1926,1934; Dargahi &
Najarian 2004; Ellis & Garnsworthy 1980; Ly 2004; Mahar & Postle 1983; Na & Kim
2001; Pan 2007; Peirce 1930; Russell 2009).
According to Brand (1964), the aesthetic characteristics of fabrics are people’s
preferences and should be evaluated by people. Sensory or subjective evaluation is the
most direct method for evaluating softness and it has been shown that untrained judges
are also able to make valid and reliable judgements of handle (Binns 1926,1934; Bishop
1996; Ellis & Garnsworthy 1980; Fritz 1990; Harlock & Ramkumar 1997; Howorth &

13
Oliver 1958; Kawabata 1980; Niwa & Ishida 1978). Ordinal scales are used to rank
samples relative to one another and have been applied to studies on fibre softness (Shah
& Whiteley 1971; Smuts & Slinger 1972; Stevens 1994; Teasdale et al. 1985;
Wortmann & Schwann-Jonczyk 2006) and to knitted fabric softness (Aliouche &
Viallter 2000; De Boos et al. 2002; Finnimore 1985; Jeguirim et al. 2010; Sular & Okur
2008; Zhang et al. 2006). The paired comparison test has been used by Harlock and
Ramkumar (1997) and Naylor et al. (1997) and is an example of an ordinal scale where
some information on the relative distance between samples as well as their order can be
obtained for a small number of samples (Meilgaard, Guille & Carr 1987; Stevens 1994).
However it has been argued that the perception of fabric hand is based on human
sensitivity, mood and experience so the judgements made by individuals can differ. This
human element adds complexity and restricts the scientific understanding of fabric hand
and an instrumental or objective approach becomes desirable (Kawabata & Niwa 1996;
Pan 2007).
2.2.2 Objective evaluation of handle and softness Many studies have sought to relate subjective handle to specific fabric dimensional,
physical and mechanical properties (Howorth & Oliver 1958; Hunter et al. 1982;
Kawabata 1980,1982; Kim & Slaten 1999; Peirce 1930). The principle that fabric
handle is associated with properties such as fabric flexibility, thickness and surface
properties has led to the development of instruments to measure these specific
properties in fabrics (Kawabata 1982; Mahar & Wang 2010; Stylios 2005). The first
comprehensive objective measurement system for fabrics was the Kawabata Evaluation
System for Fabrics (KESF) (Kawabata 1982; Kawabata & Niwa 1996). This was
followed by a simpler and cheaper alternative called the Fabric Assurance by Simple
Testing (SiroFAST) (Ly et al. 1991) and most recently, the PhabrOmeter (Pan
14
2006,2007). Unlike the KESF and FAST, the PhabrOmeter system acquires multiple
fabric properties from one instrument and one extraction test (Bishop 1996; Mahar &
Wang 2010; Pan 2007; Wang, Mahar & Hall 2012; Wang et al. 2008).
2.2.2.1 The KESF and SiroFAST systems for objective measurement of fabrics The Kawabata Evaluation System, KESF, is based on four instruments that measure 16
low-stress mechanical and surface properties that are related to Japanese hand
preference, and primary and total hand values koshi (fabric stiffness), numeri (fabric
smoothness and fukurami (fabric softness and fullness) are predicted (Kawabata 1980).
Detailed information on the 16 parameters measured by the KESF and the calculation of
the total hand values are presented elsewhere (Bishop 1996; De Boos 2005b; Kawabata
1980; Smuts, Lee & Hunter 1991).
Objective assessment of handle and softness using the KESF has mostly been conducted
on woven fabrics (Choi & Ashdown 2000; Finnimore 1985; Finnimore & Bereck 1987;
Finnimore & Konig 1986; Hunter et al. 1982; Madeley & Postle 1999). Considering that
handle is an important aspect of the quality of knitwear, it is interesting to note that
there are only a few studies reporting on handle assessment of knitted fabrics on the
KESF. Experimental difficulties associated with the high extensibility of knitted
structures and edge curl (Finnimore 1985; McGregor & Postle 2008) and the loop
structure of knitted fabrics interfering with sensors for surface friction measurements
(McGregor & Postle 2008) have contributed to the low number of studies. KESF has
been used to measure the mechanical properties of knitted outerwear fabrics (Choi &
Ashdown 2000; Finnimore 1985), and softness was associated with a reduction in shear
and bending hysteresis (Finnimore 1985). Softness of weft knitted single jersey T-shirts
was related to surface friction (Chen et al. 1992). McGregor and Postle (2008) used
KESF to study the mechanical properties of wool and cashmere knitted fabrics and

15
associated softness to fabrics with higher compressibility and lower shear and bending
stiffness and hysteresis. Alimaa et al. (2000) investigated the bending and compression
of plain and rib knitted fabrics produced from woollen spun cashmere yarn and
concluded that the bending property is largely determined by the fabric weight, whereas
the compression property is determined by the loop length. Cassidy, Weedall and
Harwood (1989) found that bending stiffness and hysteresis were the only mechanical
properties to vary in fabrics constructed from mule-spun and ring-spun woollen yarns
that had different subjective hand.
The shear property of a fabric is a reflection of the yarn properties, whilst bending
rigidity of a fabric is mainly determined by the stiffness of its component fibres and
structural variables such as the tightness of the fabric construction, fabric thickness and
the fabric’s mass per unit area (Gibson, Dhingra & Postle 1979), whereas the bending
hysteresis is influenced by the frictional forces between fibres that restrict their
movement relative to one another (Finnimore & Konig 1986). Frictional forces between
fibres in bending are believed to also result from the fabric construction, the nature of
the fibre surface and its coefficient of friction (Finnimore & Konig 1986). Hence the
KESF bending properties of knitted fabrics are relevant when comparing the softness of
knitted fabrics produced from different fibres, particularly when the construction of the
yarn and fabric is kept constant.
Fabric Assurance by Simple Testing or SiroFAST was developed to predict tailoring
performance and garment appearance in wear (Ly et al. 1991). It also comprises of a set
of integrated instruments designed to measure compression, bending, extension and
dimensional stability of woven fabrics (Ly et al. 1991). Data from the KESF and FAST
systems are strongly correlated (Ly et al. 1991; Yick et al. 1996). Both the KESF and
FAST systems have been comprehensively reviewed (Bishop 1996; Smuts, Lee &

16
Hunter 1991), and the general consensus is that they are suited to the testing of woven
fabrics rather than knitwear (Mahar & Wang 2010).
2.2.2.2 PhabrOmeter Several alternative approaches based on pulling or extracting a fabric through a series of
parallel pins (Zhang et al. 2006) or through a nozzle or ring have also been developed to
predict fabric hand (Alley & McHatton 1978; Behera & Shakyawar 2000; Behery 1986;
Bishop 1996; Grover, Sultan & Spivak 1993; Kim & Slaten 1999; Pan & Yen 1992;
Pan, Zeronian & Ryu 1993). A similar technique is used in the hair industry to assess
the bulk of a hair assembly and involves pulling a hair tress through a succession of
circular plates (Robbins & Crawford 1984). This extraction technique was first
practiced by women centuries ago where the tactile qualities of luxury fabrics and
scarves were tested by pulling a scarf or fabric through a ring (Pan 2007). The
PhabrOmeter, developed by Nu Cybertek Inc, USA, is based on this ancient technique
(Pan 2006,2007) and uses a sensing (force) rod to push a circular fabric through a metal
nozzle, as illustrated in Figure 2-1 (Mahar & Wang 2010; Pan 2007; Pan, Zeronian &
Ryu 1993; Wang, Mahar & Hall 2012; Wang et al. 2008).
Figure 2-1 Schematic diagram of the PhabrOmeter Fabric Evaluation system (Source: Wang et al. 2008)
The force-displacement data is used to produce an extraction curve for the fabric
(Mahar & Wang 2010; Pan 2006,2007; Pan, Zeronian & Ryu 1993; Wang, Mahar &
Hall 2012; Wang et al. 2008). From the extraction curve, Mahar Wang, Mahar and Hall
17
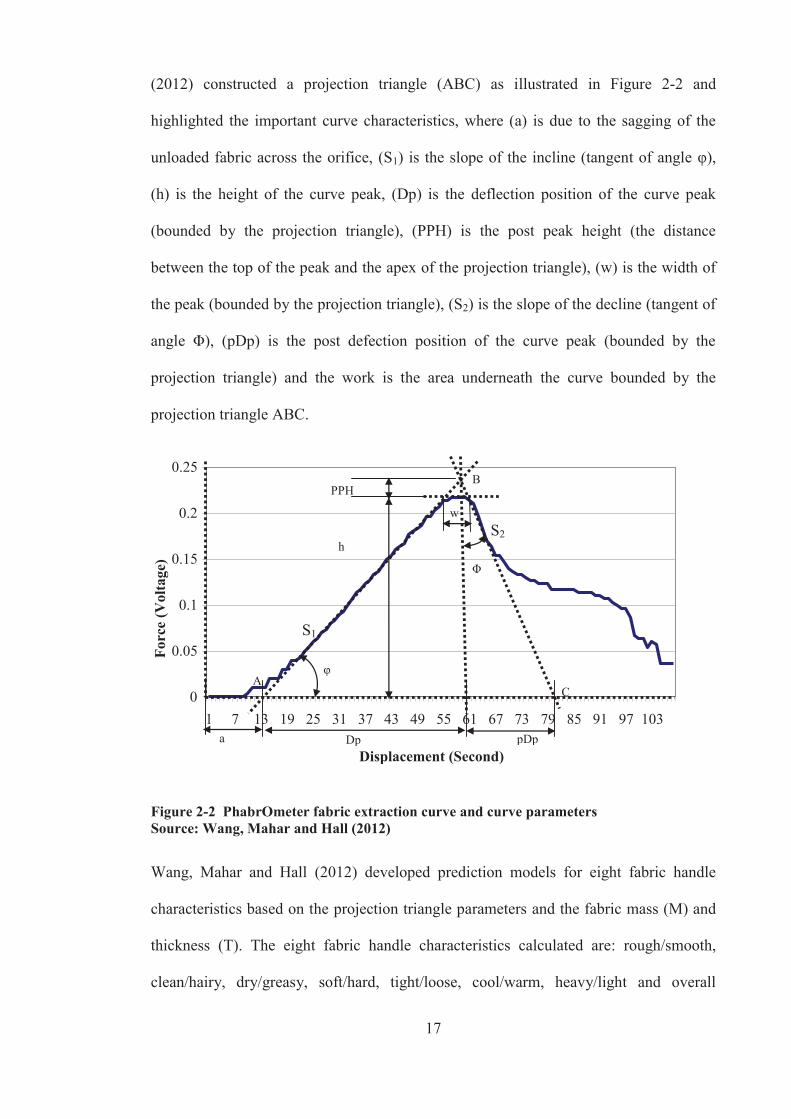
(2012) constructed a projection triangle (ABC) as illustrated in Figure 2-2 and
highlighted the important curve characteristics, where (a) is due to the sagging of the
unloaded fabric across the orifice, (S1) is the slope of the incline (tangent of angle φ),
(h) is the height of the curve peak, (Dp) is the deflection position of the curve peak
(bounded by the projection triangle), (PPH) is the post peak height (the distance
between the top of the peak and the apex of the projection triangle), (w) is the width of
the peak (bounded by the projection triangle), (S2) is the slope of the decline (tangent of
angle Φ), (pDp) is the post defection position of the curve peak (bounded by the
projection triangle) and the work is the area underneath the curve bounded by the
projection triangle ABC.
0
0.05
0.1
0.15
0.2
0.25
1 7 13 19 25 31 37 43 49 55 61 67 73 79 85 91 97 103
Displacement (Second)
Forc
e (V
olta
ge)
PPH
h
a Dp pDp
w
φ
Φ
A
B
C
Figure 2-2 PhabrOmeter fabric extraction curve and curve parameters Source: Wang, Mahar and Hall (2012)
Wang, Mahar and Hall (2012) developed prediction models for eight fabric handle
characteristics based on the projection triangle parameters and the fabric mass (M) and
thickness (T). The eight fabric handle characteristics calculated are: rough/smooth,
clean/hairy, dry/greasy, soft/hard, tight/loose, cool/warm, heavy/light and overall
S1
S2

18
handle. Table 2-1 shows the actual parameters used for the prediction of each handle
characteristic. The precision of the prediction models was found to be significantly
better than the precision of an experienced individual assessor (Wang, Mahar & Hall
2012). Table 2-2 provides a description of the PhabrOmeter prediction scores.
Although Mahar and Wang (2010), Wang, Mahar and Hall (2012) and Lam and Wong
(2011) have used the PhabrOmeter to evaluate knitwear, no one has used the
PhabrOmeter to objectively assess the softness of fabrics knitted from wool and other
specialty animal fibres.
Table 2-1 Extraction curve parameters used in handle prediction models (Source: Wang, Mahar et al., 2012)
Handle characteristic Curve parameters used in the handle
prediction models
Rough – smooth h, pDp, Work, T, w, PPH
Hard – soft Dp, S2 , Work, T, w
Loose – tight S1, pDp, T
Heavy – light h, pDp, T, M, w
Hairy – clean S1, pDp, M, w, PPH
Warm – cool S2 , T
Greasy – dry h, pDp, Work, T
Overall Handle pDp, S2 , T, w, PPH

19
Table 2-2 PhabrOmeter handle prediction scores for eight fabric handle characteristics (Source: H. Wang, personal communication, 20 September 2011)
Rating Rough - smooth Hard – soft Loose - tight Light - Heavy
10 Extremely smooth Extremely soft Extremely tight Extremely heavy
9 Very good smoothness Very good softness Very tight Very heavy
8 Very smooth Good softness Tight Above average heaviness
7 Good smoothness Neutral softness Above average tightness Heavy
6 Average Neutral softness Average tightness Neutral weight
5 Average Neutral softness Average tightness Neutral weight
4 Average Moderately hard Below average tightness Neutral weight
3 Rough Hard Loose Light
2 Very rough Very hard Very loose Very light
1 Extremely rough Extremely hard Extremely loose Extremely light
Hairy - clean Warm – cool Greasy - dry Overall Handle
10 Brushed/raised Extremely warm Extremely dry Excellent
9 Extremely hairy Very warm Dry Very good
8 Hairy Warm Slightly dry Above average
7 Fuzzy Moderately warm Neutral Average
6 Moderately fuzzy Neutral warm Neutral Average
5 Clean Neutral warm Neutral Average
4 Clean Moderately cool Slick Below average
3 Clean Cool Slick to sleazy Well below average
2 Very clean Very cool Sleazy Poor
1 Extremely clean Extremely cool Excessive finish Unsuitable
2.3 Wool, cashmere and alpaca apparel fibres
Wool, cashmere and alpaca are some of the main mammalian hair fibres that are used as
apparel fibres in today’s textile industry. Wool is the most commercially important
20
animal fibre used in the textile industry. The global annual production of clean apparel
wool is approximately 552 million kilograms (Oerlikon 2010). Cashmere and alpaca are
largely classified as specialty or luxury fibres because of their softness, rarity, price,
exclusivity and image (Franck 2001; McGregor 2002; Von Bergen & Krauss 1949;
Wang, Wang & Liu 2003). The annual global production of alpaca is approximately 5
million kilograms greasy (Valbonesi et al. 2010; Wang, Singh & Wang 2008a) while
the global annual production of cashmere is estimated to be approximately 15 to 20
million kilograms greasy (IYNF 2009; Phan, Rutten & Popescu 2008). The global
consumption of manmade fibres reached 50 million tons, but has slowed down since the
world financial crisis in 2008 (Sung 2011).
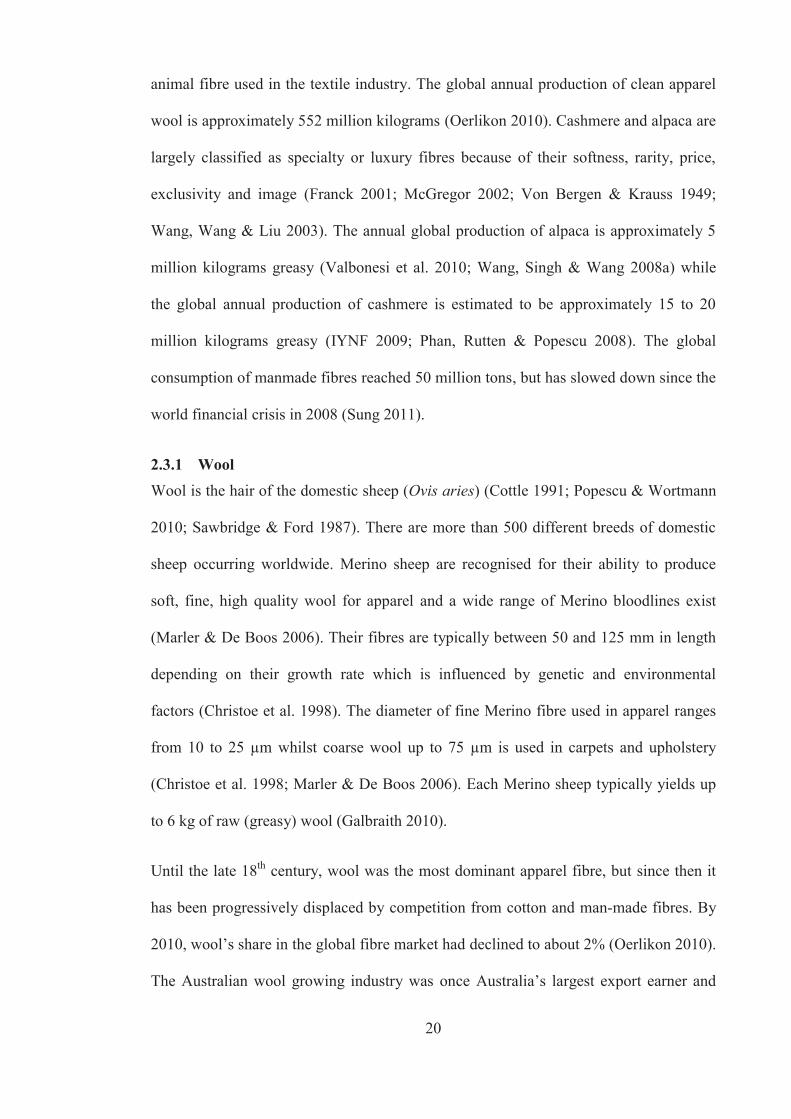
2.3.1 Wool Wool is the hair of the domestic sheep (Ovis aries) (Cottle 1991; Popescu & Wortmann
2010; Sawbridge & Ford 1987). There are more than 500 different breeds of domestic
sheep occurring worldwide. Merino sheep are recognised for their ability to produce
soft, fine, high quality wool for apparel and a wide range of Merino bloodlines exist
(Marler & De Boos 2006). Their fibres are typically between 50 and 125 mm in length
depending on their growth rate which is influenced by genetic and environmental
factors (Christoe et al. 1998). The diameter of fine Merino fibre used in apparel ranges
from 10 to 25 μm whilst coarse wool up to 75 μm is used in carpets and upholstery
(Christoe et al. 1998; Marler & De Boos 2006). Each Merino sheep typically yields up
to 6 kg of raw (greasy) wool (Galbraith 2010).
Until the late 18th century, wool was the most dominant apparel fibre, but since then it
has been progressively displaced by competition from cotton and man-made fibres. By
2010, wool’s share in the global fibre market had declined to about 2% (Oerlikon 2010).
The Australian wool growing industry was once Australia’s largest export earner and
21
‘riding on the sheep’s back’ was the backbone of the Australian economy for about 120
years. However the crash of the Australian wool industry in 1991 had significant
consequences on the value and scale of the Australian wool industry and the support
industries (Massey 2011; Rowe 2010). Despite this decline in the wool industry,
Australia is still the largest producer of apparel wool and accounts for approximately
50% of the world’s apparel wool production (Oerlikon 2010). In 2009, Australia
produced 260 million kilograms of clean weight wool (Oerlikon 2010) and wool
production is still one of Australia’s important agricultural industries, with wool exports
worth about $2.0 billion to Australia (ACWEP 2009).
2.3.2 Cashmere Cashmere is the fine inner-coat (down) produced from domesticated goats (Capra
hircus Laniger) (Franck 2001; Sumner & Bigham 1993; Tucker et al. 1985) and is
considered one of the most luxurious and softest of the animal fibres in textile use
(Leeder, McGregor & Steadman 1998; McGregor & Postle 2006; von Bergen &
Stevens 1963). It’s softness of handle, gives cashmere garments their luxury appeal
(McGregor 2007a; McGregor & Postle 2006; Teasdale et al. 1985). The main producers
of cashmere are China, Mongolia, Afghanistan and Tibet with smaller quantities
produced in Iran, central Asia, Australia and New Zealand (Franck 2001). Chinese
cashmere is considered to be the best quality fibre and has a narrow diameter range
between 14 to 16 μm (Franck 2001). Traditionally cashmere down is harvested in the
spring by combing after the annual moult or picking up the moulted fibre from the
ground (Franck 2001). In Australasia, the entire fleece is shorn mid-winter and the
coarse guard hair has to be removed by dehairing (Leeder, McGregor & Steadman
1998; Wang, Singh & Wang 2008b). Wang, Singh and Wang (2008b) reported that
some cashmere raw fleece produced in Australia has around 70% coarse hair content.

22
The cashmere goat typically yields between 0.06 and 1 kg of cashmere (Galbraith
2010). Cashmere fibre length varies from less than 35mm to 80mm (Teasdale et al.
1985) and its fineness ranges between 14-17 μm for fine cashmere and the coarser
cashmere from Iran ranges in diameter from 17-20 μm (Sawbridge & Ford 1987).
Cashmere is a rare and expensive fibre because of its limited supply and high
processing costs (Wang, Singh & Wang 2008b). Surreptitious substitution of cashmere
with cheaper fibres is a major problem and much of the research effort has focussed on
developing fibre identification techniques (IWTO-58-00 Test Method. 2000).
2.3.3 Alpaca Alpaca fibre is grown by the alpaca (Lama Pacos or Vicugna pacos) which is a member
of the South American camelid family (Kadwell et al. 2001; Tuckwell 1994). The
alpaca is indigenous to the high altitude Andean region of South America and is the
most important fibre producing member of the camelids. Peru has 75% of the world’s
alpaca population (Morante et al. 2009). Alpaca fibre is prized for its softness, light
weight, exceptional warmth, natural colour and strength, and alpaca garments are
claimed to be free from pilling and have good shape retention (Stapleton 1992; Wang,
Wang & Liu 2003).
There are two types of alpaca, the Huacaya and the Suri. Huacaya is characterised by a
dense fleece that has a uniform crimp along the length of the staple and it makes up
about 90% of the total alpaca population (Morante et al. 2009; Tuckwell 1994). Suri
produces a more lustrous, silky, finer and softer handling fibre that has little or no crimp
(Allain & Renieri 2010; Tuckwell 1994).
Alpaca fibre is also known as wool and its staple length typically ranges between 80 to
120 mm and its fineness ranges between 20 to 36 μm (Dalton & Franck 2001; Galbraith
2010; Petrie 1995), although a superfine classing line of less than 20 μm is also
23
produced (Galbraith 2010; Wang, Singh & Wang 2008a). The diameter of alpaca
reported in the literature is very broad, ranging between 12 to 47 μm, with an average
mean fibre diameter of 29 μm (Leeder, McGregor & Steadman 1998; McGregor &
Butler 2004). The extent of medullation in alpaca fibre is related to fibre diameter
(Stapleton 1992; Villarroel 1959).
Alpacas are shorn annually in spring (Wuliji et al. 1992) and each alpaca can yield up to
8 kg of raw (greasy) fleece every year (Wang, Singh & Wang 2008a) although
Galbraith (2010) reported the raw fibre yield of alpaca to be between 1.5 and 5.5 kg.
Tuckwell (1994) and Leeder, McGregor and Steadman (1998) suggest that adult alpacas
can produce between 0.9 and 4 kg of fibre annually and the fibre diameter ranges
between 12 to 30 μm.
2.3.4 Processing of wool, cashmere and alpaca The conversion of raw wool to fabric is a complex process that has been refined over
many hundreds of years to form the basis of today’s wool textile industries. A
considerable volume of information exists on the processing of wool, however the
processing of rarer animal fibres such as cashmere and alpaca are generally kept
confidential (McGregor & Postle 2004; McGregor & Postle 2008; Wang, Wang & Liu
2003).Wool fibre processing machinery and procedures are generally used to process
these other fibres, however they are adjusted to maximise the processing efficiency of
these other fibres (Finn, Vuckovic & Miller 1999; McGregor 2001; Wang, Wang & Liu
2003).
Converting raw animal fibres into yarn is complex and involves a number of processes.
Initially fibres are scoured to remove fibre impurities such as grease, suint (water
soluble material), dirt, vegetable matter and soluble protein (Bateup 1986; Dominguez
et al. 2004; MacLaren & Milligan 1981; Rippon 1992; Stewart 1983). Dusty fleeces

24
such as alpaca may require dust removal prior to scouring (Wang, Wang & Liu 2003).
Following scouring, fibres are dried, opened and if required blended, lubricated and
moistened to reduce problems with static electricity and fibre breakage in subsequent
mechanical processing. Cashmere and alpaca that contain guard hair are dehaired. The
dehairing process removes the coarse guard hair from the finer and more valuable fibres
produced by the secondary follicles (McGregor & Butler 2008; Wang, Singh & Wang
2008a,b; Wang, Singh & Wang 2006).
There are three main systems for converting these scoured staple fibres into yarns for
apparel; woollen, worsted and cotton (short staple) systems (Grosberg & Iype 1999;
Hunter 2002; Iype et al. 2000; Oxtoby 1987). A summary of the processing operations
are provided in Figure 2-3, Figure 2-4 and Figure 2-5 for the woollen, worsted and
cotton systems respectively. The main differences in these processing systems are the
levels of short fibres and the alignment of the fibres in the yarn (Hunter 2002).
Scouring
Drying
Blending
Carding
Ring spinning
Mule spinning Figure 2-3 Woollen processing route (adapted from Grosberg and Iype 1999)
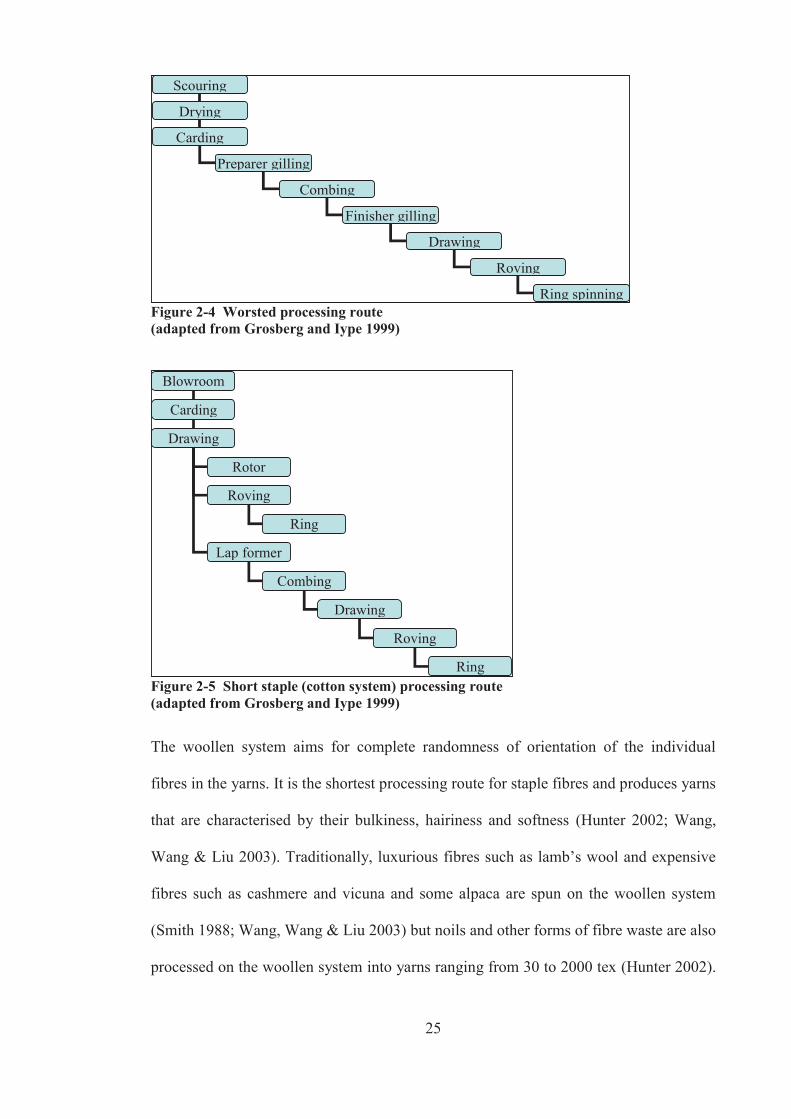
25
Scouring
Drying
Carding
Preparer gilling
Combing
Finisher gilling
Drawing
Roving
Ring spinning Figure 2-4 Worsted processing route (adapted from Grosberg and Iype 1999) Blowroom
Carding
Drawing
Rotor
Roving
Lap former
Ring
Combing
Drawing
Roving
Ring Figure 2-5 Short staple (cotton system) processing route (adapted from Grosberg and Iype 1999) The woollen system aims for complete randomness of orientation of the individual
fibres in the yarns. It is the shortest processing route for staple fibres and produces yarns
that are characterised by their bulkiness, hairiness and softness (Hunter 2002; Wang,
Wang & Liu 2003). Traditionally, luxurious fibres such as lamb’s wool and expensive
fibres such as cashmere and vicuna and some alpaca are spun on the woollen system
(Smith 1988; Wang, Wang & Liu 2003) but noils and other forms of fibre waste are also
processed on the woollen system into yarns ranging from 30 to 2000 tex (Hunter 2002).
26
This system is thought to exploit the perceived natural softness of these fibres by
producing yarns and fabrics with lofty, easily compressed surface fibres (Madeley
1994). McGregor (2001) estimated that approximately 90% of the dehaired cashmere is
processed on the woollen system.
The worsted system has several steps designed to align the fibres in a parallel manner
prior to spinning. Typically wool fibres of lengths ranging from 40 to 100mm are
processed on the worsted system and a key step is the combing operation which
removes short fibres, neps and any remaining vegetable matter from the sliver and
arranges the remaining fibres into a parallel formation. This enables finer, stronger,
more uniform, smoother and less hairy yarns to be spun (Hunter 2002; Wang, Wang &
Liu 2003). The worsted system is used to process fibres with lengths greater than 40mm
and about 80% of Australian wool is processed on the worsted system (Wang, Wang &
Liu 2003). Alpaca and their blends (Cruthers et al. 2010; Finn, Vuckovic & Miller
1999; Wang, Wang & Liu 2005; Wang, Wang & Liu 2003) and longer fibre length
cashmere (McGregor 2001,2005; McGregor & Postle 2004; McGregor & Postle 2007)
have also been processed on the worsted system. Some Australian cashmere and
cashmere blends have also been processed on the worsted system (McGregor
2001,2005; McGregor & Postle 2004; McGregor & Postle 2007).
The cotton system of yarn manufacture includes ring, rotor and air jet spinning and the
majority (60%) of cotton and cotton blends are spun on the ring spinning system (van
der Sluijs., Gordon & Long 2008). Fibres must be less than 50mm for processing on the
cotton ring spinning system. Generally more fibres are required in the yarn cross section
of a cotton spun yarn than in a worsted yarn because of the short fibre length used in
cotton spun yarns. To spin a reasonable quality ring spun yarn on the cotton system, the
recommended minimum number of fibres in the yarn cross section is at least 80 (van der
27
Sluijs., Gordon & Long 2008). Wool fibre is typically too long for the cotton processing
equipment and its length is reduced by stretch-breaking or cutting (Eley et al. 1980;
Iype et al. 2000). Stretch-breaking is the preferred method because it reduces the
variability of the fibre distribution, whilst cutting typically produces more short fibre
(AWI 2006). For processing on the cotton system, short wool fibre is generally blended
with at least 20 – 25 % cotton to prevent problems in lap production, but 100% wool
has been processed on the cotton system (Iype et al. 2000). McGregor (2001) showed
that it is feasible to spin yarns of greater than 36 tex from blends of cashmere noil and
cotton on the cotton system, provided that the ratio of cashmere noil did not exceed
30%. He was unable to spin 100% cashmere yarns. Madeley (1994) was able to spin a
very small quantity of lamb’s wool and cashmere on a Platt’s miniature cotton spinning
plant using a slip drafting method, but according to McGregor (2001) the cashmere yarn
exhibited a CVm of 34.8% and a high incidence of faults. Other yarn properties were
not reported and it is unknown whether sufficient yarn was produced to knit and
compare fabrics.
2.3.5 Softness of wool, cashmere and alpaca Much of the peer-reviewed literature on cashmere and alpaca has focussed on the on-
farm areas (Cruthers et al. 2010; McGregor 2004,2007b; Stapleton 1992) or fibre
identification (Chernova 2002; Phan 1991; Phan, Wortmann & Arns 1995; Phan et al.
1988; Phan, Wortmann & Wortmann 2000; Valbonesi et al. 2010; Wortmann & Arns
1986). There are many unsubstantiated reports in the ‘grey literature’ claiming the
superior softness of cashmere and alpaca over wool of the same fibre diameter. Only a
few scientific studies have compared the softness of cashmere and wool (McGregor
2001,2007a,b; Teasdale et al. 1985) and alpaca (Liu, Wang & Wang 2004a; Stapleton
1992; Wang, Wang & Liu 2005; Wang, Wang & Liu 2003).

28
Alpaca fibre was found to be softer than wool even when it was a few microns coarser
than wool (Liu, Wang & Wang 2004a; Stapleton 1992; Wang, Wang & Liu 2005;
Wang, Wang & Liu 2003). Liu et al., (2004b) developed a method of assessing fibre
softness by pulling fibre bundles through a series of pins and suggested that alpaca fibre
could have the same softness as wool that is up to 12 μm finer.
A study has found that the superior softness of alpaca fibres persisted in knitwear
(Wang, Wang & Liu 2003) where it was shown that fabrics knitted from 26 μm alpaca
were judged as being softer than fabrics knitted from 25 μm wool and also softer than
alpaca-wool blend fabrics containing 40% of 22 μm wool. Alpaca-wool blend fabrics
containing high crimp wool were softer than alpaca-wool blend fabrics containing low
crimp wool (Wang, Wang & Liu 2005). In contrast, Finn, Vuckovic and Miller (1999)
found that fabrics knitted from 25 μm alpaca were not as soft as alpaca-wool blends
containing 50% of 18 μm wool. Similarly Swinburn, Laing and Niven (1995) found
plain jersey fabrics knitted from 100% alpaca (32.5 μm) were not as soft as blends
containing 70% alpaca (32.5 μm) and 30% wool (22 μm). These conflicting results on
the subjective softness of alpaca and wool fabrics knitted from worsted yarns warrant
clarification.
Cashmere fibres with the same mean fibre diameter, similar diameter variability and
resistance to compression are known to exhibit widely different handle and Teasdale et
al. (1985) suggested that some other fibre property must influence the softness of
cashmere. The study also compared the softness of cashmere fibre with the softness of
wool fibre. The judges found that coarse diameter cashmere fibre (19.8 μm) was softer
than 17.2 μm wool fibre (Teasdale et al. 1985). McGregor (2007a) suggested that the
softness of cashmere is related to its low resistance to compression which is due to its
uniplanar crimp form and low fibre crimp frequency.

29
Fabric woven from cashmere was perceived as smoother and superior in handle to that
made from superfine wool (Tester et al. 1986). Similarly fabrics knitted from cashmere
were found to be softer than fabrics knitted from wool (McGregor & Butler 2008). The
mechanical properties of wool and cashmere single jersey fabrics were studied using the
KESF and the softness of the cashmere fabrics was associated with their higher
compressibility and lower shear and bending stiffness and hysteresis (McGregor &
Postle 2008). However the cashmere fabrics tested were lighter in weight than the wool
fabrics. Other studies have shown that the fabric weight influences the perception of
handle and lighter weight fabrics are preferred by judges (Haigh & Robinson 2002;
Stevens & Mahar 1995).
The softness of loose wool has mainly been attributed to its diameter (Sumner 2009)
and also resistance to compression (RtC) (Shah & Whiteley 1971). There is an increase
from soft to harsh with an increase in mean fibre diameter and also with an increase in
resistance to compression which is primarily a function of fibre crimp (Stevens 1994).
Softness in human hair has been attributed to low bending stiffness and low friction
(Wortmann & Schwann-Jonczyk 2006) whilst softness in alpaca has been attributed to
low friction (Yu & Liu 2006).
2.3.6 Growth, chemical and physical structure of wool, cashmere and alpaca fibre
Hair fibres are unique to mammals (Chernova 2002) and are believed to have evolved
during the transition from the Triassic Period to the Jurassic Period about 200 million
years ago (Gerken 2010; Langbein, Schweizer & Kwang 2005). Hair protects the animal
against harsh environmental conditions, protects the skin from abrasion, provides
camouflage, helps to regulate temperature and prevents cutaneous loss of water
(Bradbury 1973; Franck 2001; Galbraith 2010; Gerken 2010). All mammalian hair

30
shares a common chemistry, structure and morphology which occurs before the fibre
even emerges from the skin (Popescu & Wortmann 2010).
2.3.6.1 Growth of animal fibres All mammalian hair grows from hair follicles located in the skin. The passage through
the follicle takes about one week (Fraser 1954) and eventually fully grown fibres are
shed according to the hair cycle. The hair cycle involves a period of active cell growth
(anagen), a period where cell growth stops and the follicle shorten (catagen) and a
resting period (telogen) where exogen or moulting occurs and a new anagen commences
(Galbraith 2010). The activity of individual follicles can change during the lifetime of
the animal (Galbraith 2010; Rogers 2006; Thompson et al. 2007).
There are two types of follicles, primary follicles and secondary follicles. They are
differentiated by their accessory structures; an arrector pili muscle, a subiferous (sweat)
gland that secretes suint and a sebaceous gland that coats the fibre with wax before it
emerges from the skin (Orwin 1979; Rippon 1992; Rogers 2006; Ryder 2001; Stapleton
1992). Primary follicles have all three accessory structures and produce the long coarse
outer-coat of medullated fibres (kemp or hair or guard hair). Secondary follicles only
have a sebaceous gland associated with them and produce the finer diameter inner-coat
fibres (down or wool) (Allain & Renieri 2010; Chapman & Ward 1979; Hardy & Lyne
1956; Orwin 1979,1989; Rogers 2006; Ryder & Stephenson 1968; Sumner & Bigham
1993; Wood 1999). The number of secondary follicles is of commercial importance
because this influences the amount of fine, soft fibre produced (Galbraith 2010).
The Merino strain is the result of selective breeding and is regarded as single-coated
because the fibres produced by their two follicle types are indistinguishable (Sumner &
Bigham 1993). Merino sheep have high follicle density which ranges from 60 to 92
follicles/mm2. Their follicles cycle independently of one another (Panaretto 1979) and
31
the average length of the anagen cycle or active growth is about eight years (Williams
1991).
Alpaca are also single coated; predominantly secondary follicle single coat although
some very coarse fibres similar to guard hair may be found (Galbraith 2010; Gerken
2010; Leeder, McGregor & Steadman 1998). The follicle density of alpaca is much
lower than wool and ranges between 17 and 20 follicles/mm2 (Ferguson, Behrendt &
McGregor 2000).
Cashmere goats are double-coated and their primary follicles produce the outer-coat
called guard hair and their secondary follicles produce the inner-coat or down known as
cashmere (Holst, Clarke & Maddocks 1982). Guard hair fibres are coarse and their
diameter varies from about 40 μm to over 200 μm with an average of about 70 μm
(Teasdale et al. 1985). The follicle density of Australian cashmere is around 23
follicles/mm2 (Parry, Norton & Restall 1992). Follicle activity of the cashmere goat is
synchronised causing the animal to undergo a moult, and traditionally at this time the
cashmere down is combed from the fleece (Galbraith 2010).
The amount of grease and suint present on a fleece can vary widely according to the
species of animal and their densities of primary and secondary follicles. Merino sheep
have high grease content ranging from 10% to 25% (McGregor 2003; Onions 1962).
Alpaca and Australian cashmere have lower grease contents, with values up to 5%
reported for alpaca (Fan et al. 2008; Gerken 2010) and up to 4.5% reported for
Australian cashmere (McGregor 2003). The presence of grease and suint is thought to
influence the perceived softness of raw fibre (McGregor & Tucker 2010; Roberts 1956;
Shah & Whiteley 1971).
32
2.3.6.2 Chemical structure of animal fibres Wool, cashmere and alpaca belong to the family of proteins known as keratin. Keratin is
also found in tissue such as hooves, horns, nails, claws, feathers and the epidermis of
the skin (Chapman 1986; Christoe et al. 1998; Williams, Edwards & Barry 1994).
Keratins are classified as α- or ß- keratin, according to their x-ray diffraction pattern and
keratin fibres are the α- type (MacLaren & Milligan 1981; Popescu & Wortmann 2010;
Rippon 2008).
Keratin fibres are comprised mainly of proteins. Clean wool consists of approximately
82% keratinous proteins (high cystine content), 17% non-keratinous protein (low
cystine content, <3% ) and about 1% by mass of non-protein material that includes
lipids, polysaccharides, trace elements and melanin in coloured fibres (Christoe et al.
1998). The proteins of the cuticle and matrix regions of the fibre are stabilized by a
number of covalent and non-covalent interactions. The most important of these are the
strong, covalent, disulphide bonds that crosslink the peptide chains. These are formed
by the amino acid, cystine (Bradbury 1973; Christoe et al. 1998; MacLaren & Milligan
1981; Popescu & Hocker 2007; Rippon 2008; Williams, Edwards & Barry 1994).
Hydrolysis of these keratin fibres yields eighteen amino acids (Arai et al. 1993; Christoe
et al. 1998; MacLaren & Milligan 1981; McGregor & Tucker 2010; Popescu & Hocker
2007; Popescu & Wortmann 2010; Tucker et al. 1988; Villarroel 1959). The relative
amounts of amino acids in animal fibres can vary between breeds, within breeds and
even from the same animal and these variations are largely due to genetic origin and
nutrition which also effects growth rate and crimp frequency (Campbell, Whiteley &
Gillespi.Jm 1972; Christoe et al. 1998; Leeder, McGregor & Steadman 1998; McGregor
& Tucker 2010; Tucker et al. 1988). Tucker et al. (1988) showed that Australian
cashmere and pen-grown Merino wool could not be distinguished by their amino acid

33
composition and the variability in composition observed in wool was also apparent in
cashmere. McGregor and Tucker (2010) found differences in the amino acid
composition of cashmere down and guard fibre, however they did not find any
significant differences in their cystine contents. Alpaca contains more cystine than wool
or cashmere (Tucker et al. 1988; Villarroel 1959) and Cruthers et al. (2010) also
supported this result for alpaca. High crimp wools contain more cystine than low crimp
wools (Menkart & Detenbeck 1957).
The lipids in wool include sterols (~40%), polar lipids (~30%) and fatty acids (~25%)
(Rivett 1991). The lipid compositions of cashmere, alpaca and wool differ slightly
(Logan et al. 1989) and it has been suggested that differences in fatty acid may be a
possible reason for the renowned softness of cashmere (Leeder, McGregor & Steadman
1998).
2.3.7 Physical structure of mammalian hair fibres Hair fibres are made up of an assembly of cuticle and cortical cells that are held together
by a continuous phase known as the cell membrane complex (CMC) (Christoe et al.
1998; Leeder, McGregor & Steadman 1998; MacLaren & Milligan 1981; Popescu &
Hocker 2007; Robbins 2009). The different constituent cell types found in a wool fibre
is shown in Figure 2-6. Variants of this schematic diagram have been drawn for other
specialty fibres including cashmere and alpaca (Smith 1988). Fine diameter fibres have
a higher cuticle-to-cortex ratio compared to coarse diameter fibres (Persaud & Kamath
2004).

34
Figure 2-6 Complex structure of a fine Merino wool fibre Cortical Cells (Christoe et al. 1998)
2.3.7.1 Cortical Cells The cortex accounts for almost 90% of the fibre and influences many of the mechanical
properties of the fibre (Bradbury 1973; Feughelman 1997; Huson 2009). Each cortical
cell contains several macrofibrils which in turn consist of water-impenetrable,
crystalline intermediate filaments that are embedded in a hydrophilic, crosslinked
protein matrix (Bradbury 1973; Christoe et al. 1998; Harland et al. 2011; MacLaren &
Milligan 1981; Popescu & Hocker 2007; Robbins 1994). The intermediate filaments are
regarded as the basic mechanical unit of the wool fibre and provide wool with its
flexibility, elasticity and resilience (Feughelman 1959; Postle, Carnaby & DeJong
1988).
Based on the packing density of the intermediate filaments, three different types of
cortical cells have been identified; tightly packed orthocortical cells, less densely
packed paracortical cells and mesocortical cells that have a structure between ortho- and
para- (Harland et al. 2011; Kaplin & Whiteley 1978; Li et al. 2009; MacLaren &
Milligan 1981; Orwin, Woods & Ranford 1984; Plowman, Paton & Bryson 2007;
Tester 1987). Fibres rich in orthocortical cells are thought to be mechanically weaker
CSIRO Textile & Fibre Technology Graphics by H.Z. Roe, 1992 based on a drawing byR.D.B. Fraser, 1972.
c
35
due to the poor organization of their intermediate filaments and their lower sulphur
content (Feughelman & Haly 1960; Rao & Gupta 1991).
The cortical cells of fine, high crimp Merino wool fibres have a bilateral arrangement
and the paracortex is always located on the inside of the crimp. In Lincoln wool, the
cortical cells are arranged as concentric cylinders and the core is comprised of
orthocortical cells (MacLaren & Milligan 1981). This bilateral arrangement of the
Merino cortical cells was believed to be responsible for the crimp of fine wool fibres
(Horio & Kondo 1953; MacLaren & Milligan 1981; Plowman, Paton & Bryson 2007),
however more recently Hynd et al. (2009) has suggested that the bilateral cortical
arrangement may simply be associative and not causative of crimp and proposed a new
mechanism of crimp based on mitotic asymmetry and rate of keratinisation. Huacaya
alpaca fibre is reported to have bilateral ortho-para segmentation whilst Suri alpaca
comprises of only paracortical cells (Phan 1991; Shim 2003; Villarroel 1959). Other
fibres that comprise of only paracortical cells are straight fibres like merino felting
lustre mutant (Li et al. 2009) and straight Mongolian human hair (Shim 2003). Mohair
comprises of mostly orthocortical cells (Leeder, McGregor & Steadman 1998), but
some radially differentiated ortho/para distributions for mohair have been reported
(Fraser & Macrae 1956). Various cortical compositions have also been reported for
cashmere (Leeder, McGregor & Steadman 1998; Somvanshi, Koul & Biswas 1994;
Tucker et al. 1988), but using a high magnification transmission electron microscope,
Tester (1987) showed that cashmere fibres exhibited bilateral asymmetry of ortho- and
mesocortical cells. Brady and Wang (2005) extracted the cortical cells from cashmere
down fibre and wool fibre by enzymatic digestion, but could not reliably distinguish
between the cortical cells from the cashmere down and those obtained from wool fibres
of comparable diameter.

36
2.3.7.2 Cuticle Cells (scales) The cuticle cells (scales) have an amorphous character and are located on the outer
surface of the hair fibres and account for about 10% of the mass of the fibre (Chen et al.
1992; Marti et al. 2004; Rippon 2008; Wagner & Joekes 2007). They overlap around
and along the fibre in one or more layers to produce a ratchet-like profile on the surface
(Dobb et al. 1961; Rippon 2008) and provide a protective barrier between the cortex of
the fibre and the environment (Chernova 2002; MacLaren & Milligan 1981). The scales
edges point towards the tip end of the fibre. This helps to anchor the fibre into the skin
of the animal and helps to expel dirt and foreign matter from the fleece and is also
responsible for the greater resistance to motion in the tip-to-root direction (against scale)
(Dobb et al. 1961; MacLaren & Milligan 1981; Makinson 1979; Rippon 2008; Smith &
Swift 2002). In addition to the true scale edges, shoulders or ‘false’ scale edges are also
imprinted during contact with the inner root sheath in the follicle (Swift 1997), and are
reported to occur on about 25% of merino cuticle cells (Bradbury & Leeder 1970).
The cuticle cells comprise of three main laminar layers; (i) the non-keratinous
endocuticle (ii) the central, sulphur-rich layer called the exocuticle and (iii) the
chemically resistant outer layer known as the epicuticle, as shown in Figure 2-7
(Feldtman, Leeder & Rippon 1983; Rippon 2008).
Figure 2-7 Schematic diagram of the cuticle structure of a merino fibre (Source: Feldman et al., 1983)

37
The exocuticle is cystine rich and thus has extensive disulphide bonding which is
thought to have a dominant influence on the bending properties of a fibre (Bradbury &
Ley 1972; Feughelman 1997; Jones, Horr & Kaplin 1994; Parbhu, Bryson & Lal 1999;
Rippon 2008; Swift 1995,2000). The epicuticle covering the outer surface of each
cuticle cell is composed of protein and an external lipid layer of 18-methyleicosanoic
acid (18-MEA) that is covalently bound to cysteine rich proteins via a thioester bond
(Evans et al. 1985; Huson et al. 2008; LaTorre & Bhushan 2005a; Leeder & Rippon
1985; Meade et al. 2008; Negri, Cornell & Rivett 1993). This lipid layer imparts the
hydrophobic nature to the surface of the fibre (Leeder, McGregor & Steadman 1998). It
has been suggested that the surface lipid is not present as a discrete layer, but is
intimately associated with other surface proteins and is able to change its concentration
at the surface in response to environmental conditions (Huson et al. 2008). The
endocuticle is the weakest part of the cuticle (Bradbury & Ley 1972; Bringans et al.
2007; Feughelman 1997; Fraser et al. 1980). The endocuticle and intercellular cement
weakly attach the cuticle cells to the fibre cortex (Feughelman 1997; Huson 2009).
The surface properties of the cuticle are thought to influence the handle (softness),
friction, chemical and physical processing and the shear and bending moduli of fibres
(Evans, Denning & Church 2002; Huson et al. 2008; Kawabata et al. 2004; Kawabata et
al. 1995; Leeder 1986; Parbhu, Bryson & Lal 1999; Powell & Rogers 1997; Rippon
2008; Swift 1995; Wortmann & Zahn 1994). The external lipid, 18-MEA is thought to
reduce the frictional resistance of the surface (LaTorre & Bhushan 2006; Smith & Swift
2002). Removal of this lipid layer has been shown to make the surface of the fibre
hydrophilic and increases the frictional coefficient which results in a harsher handle
(Breakspear, Smith & Luengo 2005; Huson et al. 2008; Leeder & Rippon 1985; Meade
et al. 2008; Rippon 2008).

38
2.3.7.3 Cuticle patterns The presence of a medulla, topographical features such as scale shape, height and
frequency, and the distribution of cuticle and cortical cells are considered unique to each
mammal and are often used to identify hair fibres from different mammals (Chernova
2002; Leeder, McGregor & Steadman 1998; Tonin et al. 2002). An example of the
cuticle pattern of Merino wool is provided in Figure 2-8. The shape of the cuticle cell is
genetically determined (Chernova 2002) and depends on biomechanical patterns of cell
deformation that are imprinted on the fibre during differentiation and keratinisation in
the hair follicle as the fibre passes through the inner root sheath (Bradbury & Leeder
1970; Chernova 2002; MacLaren & Milligan 1981; Rippon 2008).
In fine wool and cashmere fibres (16-20 μm) the cuticle is commonly only one cell
thick (Dobb et al. 1961; Rippon 2008), whilst human hair has between six and ten layers
of cuticle cells (Swift 1997), alpaca has approximately five cuticle cell layers (Fan et al.
2008) and goat guard hair can have up to ten cuticle layers surrounding the cortex of the
fibre (Leeder, McGregor & Steadman 1998). The cuticle is generally thicker on the
paracortical side than on the orthocortical side of wool fibres (Makinson 1978; Tester
1987).
Figure 2-8 Scanning electron micrograph of the cuticle of a Merino fibre (Rippon, 2008)

39
Scale intervals vary along the length of a fibre and finer fibres tend to have more widely
spaced scales (Langley & Kennedy 1981; Villarroel 1959; Wildman 1954). Scale
frequencies ranging between 6 and 12 scales per 100 μm have been reported for wool
(Liu & Wang 2007; Robson 1997; Valbonesi et al. 2010; Wildman 1954; Wortmann,
Wortmann & Greven 2000), 10 to 11 scales per 100 μm have been reported for alpaca
(Liu & Wang 2007; Valbonesi et al. 2010) and for cashmere, scale frequencies ranging
between 6 to 8 scales per 100 μm have been reported (Robson 1997; Valbonesi et al.
2010; Wildman 1954; Wortmann, Wortmann & Greven 2000). Clearly significant
overlap exists between wool and cashmere and wool and alpaca in their scale spacing.
Specialty fibres are typically distinguished from wool by examining scale height
(thickness) with a scanning electron microscope (SEM) (Wortmann & Arns 1986). The
technique developed at the Deutsches Wollforschungsinstitut Aachen (DWI) is
currently used by the textile industry for quantitative analyses of different fibre blends
(IWTO-58-00 Test Method. 2000) and defines wool as an animal fibre with a scale
height greater than 0.55 μm. Average scale heights of 0.7 to 1 μm have been reported
for wool, whilst specialty fibres have scale heights of less than 0.4 μm (Chernova 2002;
Liu & Wang 2007; Phan 1991; Phan, Wortmann & Arns 1995; Phan et al. 1988; Phan,
Wortmann & Wortmann 2000; Valbonesi et al. 2010; Wortmann 1991; Wortmann &
Arns 1986; Wortmann & Augustin 2004; Wortmann, Phan & Augustin 2003a,b;
Wortmann & Wortmann 1992; Wortmann, Wortmann & Arns 1989; Wortmann,
Wortmann & Greven 2000). Varley (2006) proposed mounting the fibres vertically in
the SEM to improve the numbers of scale edges visible and allow for a more objective
measurement of a number of sequential scales. This technique revealed a greater
overlap in cuticle scale height than was previously published, and the average scale
40
heights reported for cashmere, wool and alpaca were 0.56, 0.74 and 0.27 μm
respectively.
Although the cuticle length, height and width can vary significantly, a recent study has
shown that cuticle dimensions of fibres from different breeds of sheep were not strongly
related to fibre softness (Sumner 2009) or felting Whiteley (1963). This is surprising
because Kenyon, Wickham and Blair (1999) found a significant negative correlation
between the fibre handle (softness) and feltball diameter for Quarter merinos (r = -0.44)
and Ladyman, Greeff and Schlink (2004) indicated that feltball diameter may be an
indirect indicator of scale height for low curvature wools.
The scanning electron microscope (SEM) has been a standard means of investigating
the surface topography of keratin fibres and offers higher resolution than optical
microscopy (Bradbury & Leeder 1970; Swift 1991; Wortmann & Arns 1986). The
accuracy of these methods is dependent on the skill and experience of the operators
(Langley & Kennedy 1981; Varley 2006). SEM techniques require samples to be coated
with a conductive metal and examined under a vacuum. It has been suggested that these
processes could potentially influence the surface details (Poletti et al. 2003). In contrast,
Scanning Probe Microscopy (SPM) is an ideal technique for examining wool and other
hair fibres because it is non-invasive and imaging can be conducted in air, under
atmospheric pressure without any preparation of the samples (Poletti et al. 2003).
2.4 Scanning Probe Microscopy
Scanning probe microscopes (SPMs) image the surface by “feeling” rather than
“looking” (Morris, Kirby & Gunning 1999) and measure a range of physical and
chemical properties on the nanometer scale (Bhushan 2008a; Bhushan & Marti 2008;
Binnig et al. 1982; Butt, Cappella & Kappl 2005). One of the most important SPMs is

41
the atomic force microscope or AFM which is capable of obtaining 3-D images of
sample surfaces with nanometer resolution (Bhushan 2008a; Bhushan & Marti 2008;
Butt, Cappella & Kappl 2005; Huson et al. 2008). The lateral resolution in AFM is
limited by the tip size, which is typically in the range of 5 to 40 nm and the vertical
resolution is in the sub-nanometer range (You & Yu 1997).
The tip, attached to the free end of a flexible cantilever, is scanned across the surface of
the sample in a raster pattern in the x–y plane. A laser diode beam is focused onto the
back of the cantilever and the position of the reflected beam is monitored by a position
sensitive detector as depicted in Figure 2-9 (Bhushan 2008a; Bhushan & Marti 2008;
Butt, Cappella & Kappl 2005; Morris, Kirby & Gunning 1999). The feedback loop from
detector drives the piezo in the z direction to maintain a constant deflection to generate
a topographic image of the sample surface.
Figure 2-9 Schematic of AFM measurement principle (Source: Bhushan and Marti, 2008)
2.4.1 AFM of keratin fibres SPM can be considered a complementary technique to optical and electron microscopy.
The AFM can be operated in various modes including contact, tapping, force and lateral
force mode to provide valuable information on sample topography, imaging forces and
42
frictional forces (Bhushan 2008a,c; Bhushan & Marti 2008; Butt, Cappella & Kappl
2005; Huson et al. 2008; Maxwell & Huson 2005; Morris, Kirby & Gunning 1999).
Early work focused on imaging the surface topography of these keratin fibres (Phillips
et al. 1995; Smith 1997; Swift & Smith 2000) and the cellular details of wool fibre cross
sections (Titcombe, Huson & Turner 1997). Parbhu, Bryson and Lal (1999) studied the
mechanical properties of wool fibre cross sections using the AFM and found the exo-
cuticle to be much stiffer than the internal cellular components. Others have used the
AFM to study the surface and mechanical properties of wool in air and in water, after
chemical (Crossley et al. 2000; Gibson et al. 2001; Maxwell & Huson 2005) and plasma
treatments (Meade et al. 2008). The AFM has been used extensively in the hair care
industry (Bhushan 2008c; Blach et al. 2001; LaTorre & Bhushan 2005a; Ruetsch et al.
2003; Smith 2004; You & Yu 1997), particularly for monitoring the effects of hair
treatments and hair care products on the frictional properties of virgin and chemically
damaged hair (Bhushan 2008b; Blach et al. 2001; Breakspear & Smith 2004;
Breakspear, Smith & Luengo 2005; LaTorre & Bhushan 2005a,b). Breakspear, Smith
and Luengo (2005) found a difference in the relative coefficient of friction between
Caucasian and African hair and suggested that this may be due to a difference in the
composition of lipids at the cuticle surface. Huson et al. (2008) used the AFM to show
that the lipid layer of wool acts as a lubricating layer reducing the coefficient of friction
and removal of the lipid layer increased the coefficient of friction for wool.
2.5 Influence of physical and mechanical fibre properties on softness
De Boos (2005a) proposed a simplified model that fabric softness results from the
response of the individual fibres to bending and tensile stress and the interaction
between the fibres during deformation. When fibre movement is restricted, deformation
is inhibited reducing the softness and suppleness (De Boos 2005a).
43
Some of the most important fibre properties that influence the behaviour of an assembly
of fibres are the diameter, frictional characteristics, cross-sectional shape and moduli
(Yin et al. 1977) and the stiffness or resistance to bending (Scott & Robbins 1978) and
surface topography (Bahi et al. 2007; Makinson 1979; Rippon 1992,2008).
2.5.1 Fibre diameter Diameter of animal fibres varies not only from fibre to fibre, but also along the fibre
length as the fibre grows. The first fibre grown on a lamb is finer and softer than that on
an ageing sheep due to the taper at one end (Warner 1995). These tapered tips are
similar in appearance to those of cashmere down (Madeley, Postle & Mahar 1998b).
Subsequent growth is influenced by physiological and environmental stresses such as
nutrition, pregnancy, lactation, health, age and climate and these stresses cause
variations in fibre diameter along the length of a fibre (Brown, Crook & Purvis 2000;
Deng, Wang & Wang 2007; Hansford, Emery & Teasdale 1985; Naylor 1998; Reis et
al. 1990). These diameter variations along single fibres have been measured on a Single
Fibre Analyser (SIFAN, BSC Electronics Pty Ltd) (Peterson et al. 1998; Wang et al.
2007). Diameter profiles of staples have been measured using an Optical Fibre Diameter
Analyzer 2000 (OFDA 2000, BSC Electronics Pty Ltd) (Smith, Purvis & Lee 2006) or
by a technique developed by Hansford, Emery and Teasdale (1985) that measures the
diameter of sequential, 2 mm staple snippets in a Sirolan Laserscan. Time of shearing
influences the diameter profiles of staples (Hansford 1994). ‘Effective fibre fineness’ or
‘spinning fineness’ is used to describe the fibre diameter when it has been adjusted to
take into account the coefficient of variation of fibre diameter (CVD) (Behrendt et al.
1996). It is calculated according to Equation 2-1 and CVDref is usually taken as 24%.

44
2
2
10051
10051
*ref
effectiveCVD
CVD
DD 2-1
Wool and other keratin fibres undergo radial swelling in the presence of moisture
(Huson, Titcombe & Lawrence 1996; Makinson 1979) so fibre diameter and other
measurements that are affected by temperature or humidity are made in a conditioned
atmosphere according to (IWTO-52-06 Test Method. 2006). For wool testing this
atmosphere is usually a temperature of 20±2°C and a relative humidity of 65±3%.
Fibre diameter or fineness is the most important factor in determining the market value
of wool (Christoe et al. 1998; Madeley & Postle 1994; Pattinson 1981; Teasdale 1995;
Wang et al. 2007). It is thought to be responsible for between 70% and 80% of the price
of Australian wool (Behrendt et al. 1996; Wood 2003). Fibre diameter determines the
processing performance and the suitability of wool for certain end-uses and ultimately,
the quality of the processed product (Naylor 1998; Teasdale 1995; Wang et al. 2007;
Wood 2003). For example, finer fibres allow the spinning of finer and more regular
yarns and the production of lighter fabrics with softer, smoother handle (De Boos et al.
2002; Roberts 1956,1961; Rolando & Townend 1962; Teasdale 1995).
Several studies have concluded that fibre diameter is the most important fibre property
influencing softness of handle of loose wool (Ali, Whiteley & Chaudri 1971; Christoe et
al. 1998; Hunter et al. 1982; Madeley, Postle & Mahar 1998a; Roberts 1956,1961; Shah
& Whiteley 1971; Smuts & Slinger 1972; Stevens 1994; Sumner 2009; Van Wyk 1946).
Studies have shown that diameter alone accounts for between 66 - 85% of the variation
in the handle scores (Ali, Whiteley & Chaudri 1971; Shah & Whiteley 1971; Smuts &
Slinger 1972). Fibre diameter is the dominant fibre characteristic in determining fabric
45
stiffness and handle value of summer suits (Hunter et al. 1982) and the softness and
smoothness of knitted wool fabrics (De Boos et al. 2002). It has also been shown that
compressional energy and bending and shear rigidity of knitted fabrics increases as fibre
diameter increases (Finnimore 1985; Roberts 1961). Fibre diameter influences the
mechanical properties of fibres and even a small change in diameter can produce a
noticeable change in flexibility because both the bending and torsional rigidity vary
with fibre radius to the fourth power (Warner 1995). This means that if the diameter of
the fibre is halved, the fibre becomes 16 times more flexible. Fibre diameter also
influences the tensile behaviour of fibres, with tensile stress defined as the applied load
normalised to the original cross-sectional area (Warner 1995).
Fibre diameter has a significant effect on the skin comfort, and prickle, which is also a
key feature of handle in next-to-skin clothing (De Boos et al. 2002). Prickle is related to
the percentage of fibre ends greater than 32 μm that come in contact with the skin
(Naylor 1998,2010). These coarse fibres ends do not bend as easily when in contact
with the skin and are able to trigger nerve endings in most consumers and hence evoke
the prickle sensation. Both the OFDA and Laserscan fibre diameter measurement
techniques provide a comfort factor (CF) value which is a measure of the percentage of
fibres less than 30 micron. The comfort factor relates to the feel of a fabric on a wearer's
skin and fibres with a high comfort factor (>95%) are thought to be less prickly because
they are able to bend more readily.
Although it is generally accepted that fibre diameter plays a major role in determining
softness, some marked deviations have been reported for wool (Campbell & Lang 1965;
Menkart & Detenbeck 1957; Menkart & Joseph 1958; Shah & Whiteley 1971),
cashmere (Teasdale et al. 1985) and alpaca (Wang, Wang & Liu 2003).

46
2.5.2 Fibre ellipticity (cross sectional shape) The term fibre diameter implies the fibre has a circular cross-section but in reality most
animal fibres are elliptical in cross-section rather than circular (Warner 1995). The term
ellipticity is used to describe the deviation from the circular shape and it is measured as
the ratio of the major axis to the minor axis of the fibre.
As with fibre diameter, ellipticity can vary along the fibre length and this variation
occurs due to physiological and environmental changes (Champion & Robards 2000).
Ellipticity is related to fibre diameter with coarse fibres being more elliptical
(Blankenburg et al. 1992; Villarroel 1959) and hence fine Merino fibres are typically
more circular than carpet wools (Champion & Robards 2000). The ellipticity of wool is
usually between 1.1 and 1.3 (Champion & Robards 2000; Postle, Carnaby & DeJong
1988) although medullated wools can have ellipticity values up to 1.54 (Onions, 1962).
Villarroel (1959) found no major differences in the ellipticity of Huacaya and Suri
alpaca and observed ellipticity ranging between 1.05 for very fine alpaca fibres to 1.87
for coarse alpaca fibres. Cashmere cross sections are almost circular (Somvanshi, Koul
& Biswas 1994).
Several studies have shown that the shape of the fibre’s cross section can influence
many fibre, yarn and fabric properties including their tactile properties (Alston, Hansen
& Duncan 2002; Bueno, Aneja & Renner 2004; Dhamija, Kothari & Varshney 2011;
Fukuhara 1993; Kyungwoo Lee 2003; Matsudaira, Tan & Kondo 1993; Varshney,
Kothari & Dhamija 2011; Warner 1995). Studies on melt-spun polyester fibres have
shown that the softest fabrics are produced from fibres that have cross sectional shapes
with low moments of inertia (Bueno, Aneja & Renner 2004). Elliptical fibres have a
lower moment of inertia in one direction relative to the fibre axis and will bend or flex
preferentially around their minor axis (Bueno, Aneja & Renner 2004; Swift 1995).

47
Ribbon like fibres are softer than round fibres by virtue of their lower moment of inertia
(Warner 1995).
Fibre cross-sectional shape also affects the cohesion and bulkiness of fibre assemblies
(Kyungwoo Lee 2003). Dhamija (2011) supported these findings and showed that
polyester fibres with non-circular cross sections were bulkier, and these fibres produced
yarns with more imperfections than circular fibres. Varshney, Kothari and Dhamija
(2011) used the FAST system to show that stiff tri-lobal fibres produced fabrics with
higher bending and shear rigidity than scalloped oval shaped fibres.
2.5.3 Fibre crimp and fibre curvature Fibre crimp is the waviness of a fibre (Denton & Daniels 2002) and in wool, crimp
appears as the waviness seen in staples as the fibres grow on the sheep. Traditionally
crimp in wool was a prime indicator of wool quality where it was assumed that high
staple crimp and fibre fineness were correlated (Duerden 1929; Madeley & Postle 1994;
Robinson 2000). However this correlation was actually found to be low for fine to
superfine Merinos (Brown 2005; Hansford 1999; Madeley, Mahar & Postle 1995;
Madeley & Postle 1994; Stevens 1994) and alpaca (Holt 2006).
Various theories including the bilateral arrangement of the cortical cells have been
proposed to account for the crimp in wool fibre (Caldwell et al. 2005; Horio & Kondo
1953; Kaplin & Whiteley 1978; MacLaren & Milligan 1981; Nagorcka 1981; Nay &
Johnson 1967; Plowman, Paton & Bryson 2007; Ryder 2001; Whiteley et al. 1975).
Most recently, Hynd et al. (2009) proposed that fibre crimp is caused predominantly by
asymmetric cell division in curved follicles and the rate of keratinsation of the migrating
cortical cells rather than bilateral segmentation of the ortho and paracortical cells. This
theory seems plausible and can account for the ‘steely’ fibres observed in zinc or copper
48
deficient wool, the variation in crimp along the length of a felting lustre mutant Merino
and the existence of crimp in fibres that don’t have a bilateral structure.
Staple crimp refers to the crimp form of fibres as they grow in the confines of the
closely packed fleece. The definition of the crimp depends on how well the fibres curve
together or align in the staple (Lamb, Robinson & Mahar 1996). In the staple, the fibres
are held in a state of strain. When a single fibre is withdrawn from the staple and is
relaxed, it reverts to its single fibre crimp form where the curvature exists in three
dimensions and describes the space filling properties of wool (Fish, Mahar & Crook
1999; McGregor 2007a; McGregor & Postle 2009; Menkart & Detenbeck 1957; Woods
1935). Crimp frequency is the number of crimp wavelengths per centimetre (Hansford
1996; Lamb, Robinson & Mahar 1996; Madeley, Postle & Mahar 1998b). Crimp forms
ranging from helical to sinusoidal or planar have been reported for wool (Fish, Mahar &
Crook 1999; Whiteley & Balasubramaniam 1965) and cashmere (McGregor 2007a).
Crimp frequency and crimp form influences the cohesion of fibrous assemblies which is
important for processing of staple fibres (Wang, Liu & Wang 2004; Wang, Chang &
McGregor 2006). Processing reduces the fibre crimp (Matsudaira, Kawabata & Niwa
1984b; Wang, Liu & Wang 2004) and about half of this crimp is recovered during
steam relaxation (Fish, Mahar & Crook 1999; Lamb 1997; Lobb et al. 1997).
The staple crimp frequency for wool typically ranges between 3 and 7 crimps per
centimetre (Robinson 2000) and curvature ranges from 60 to 150°/mm, with an average
of 94°/mm (Curtis & Stanton 2002). The crimp frequency of Huacaya is much lower
than wool and ranges between 1 to 4 crimps/cm and its curvature ranges from 25 to
60°/mm whilst the curvature of Suri ranges between 15 to 35°/mm (Holt 2006). The
crimp frequency of cashmere ranges between 1.5 to 7 crimps per centimetre, and the
curvature as measured on the OFDA ranges from 27 to 84°/mm (McGregor 2007a).

49
Fibre curvature of greasy wool has been shown to be positively correlated with crimp
frequency (Brown 2005; Liu, Wang & Wang 2004a; Madeley & Postle 1999; Madeley,
Postle & Mahar 1998b; Stevens & Mahar 1995; Swan 1994; Whiteley et al. 1986).
Curvature of the top is also related to the curvature and crimp frequency of the greasy
wool (Lamb, 2000). Although the correlation between staple crimp and fibre fineness is
low for fine to superfine Merinos (Brown 2005; Madeley, Mahar & Postle 1995;
Madeley & Postle 1994; Stevens 1994), it was observed that tip shearing influences
curvature measurements and results in even poorer relationships between fibre diameter,
fibre curvature and crimp frequency for those wools that have been tipped (Brown
2005). Liu, Wang and Wang (2004a) observed a negative relationship (R2 =0.81)
between fibre curvature and diameter for their relatively small set of wools. These
researchers also observed a weaker, negative relationship between fibre curvature and
diameter for alpaca (R2 =0.44).
Crimp has been reported to have a lowering effect on the tensile modulus of fibres and
this has been explained in terms of the geometry of the crimp (Evans 1954; Huson
1993; Menkart & Detenbeck 1957; O'Connell & Yeiser 1954). Interestingly, Madeley,
Postle and Mahar (1998b) plotted some selected data points from Shah and Whiteley
(1971) and suggested that for a given fibre diameter, bending modulus increases with
fibre crimp. However when all of the crimp frequency and bending modulus data from
Shah and Whiteley (1971) is plotted there appears to be no relationship between crimp
frequency and fibre bending modulus. Fibres with a helical crimp did not felt as readily
as those with a sinusoidal crimp (Whiteley & Balasubramaniam 1965) and they required
more load for compression (Chaudri & Whiteley 1968).
Low crimp fibres are associated with improved processing performance and better
spinning efficiency. They produce top with longer Hauteur, lower noil, fewer neps, and
50
form stronger, more even yarns with fewer ends-down during spinning (Behrendt et al.
1996; Fish, Mahar & Crook 1999; Hunter, Smuts & Gee 1985; Kurdo, Whiteley &
Smith 1986; Lamb 1997; Lamb, Robinson & Mahar 1996; Madeley & Postle 1999;
McGregor & Postle 2002; Roberts 1961; Smith, Purvis & Haigh 2005; Stevens &
Crowe 1994; Stevens & Mahar 1995). Yarns spun from higher curvature fibres were not
as hairy as yarns spun from low curvature fibres (Wang, Chang & McGregor 2006).
Fabrics knitted from high crimp frequency fibres were less inclined to pill (Smith,
Purvis & Haigh 2005).
Crimp characteristics play a significant but minor role in the softness of loose wool and
the effect of crimp on softness is thought to be due to the influence of crimp on the
compression properties (Shah & Whiteley 1971). Fleeces chosen for being softer than
average and harsher than average for a given fibre diameter differed in their crimp and
compressional properties (Roberts 1956; Stevens 1994; Stevens & Mahar 1995). Soft
samples had a lower crimp than expected for their diameter and harsh samples had a
higher crimp than expected for their diameter. As fibre curvature or crimp increases at a
constant diameter, the wool becomes increasingly hard to compress and feels
increasingly harsh (Ali, Whiteley & Chaudri 1971; Campbell & Lang 1965; Shah &
Whiteley 1971; Smith, Purvis & Haigh 2005; Stevens 1994). Crimp frequency and
crimp form have accounted for up to 89% of the variation in compression properties of
wool (Chaudri & Whiteley 1968). Wool fibres with a helical crimp feel harsher than
wool fibres with sinusoidal crimp (Whiteley & Balasubramaniam 1965) and the softness
of lamb’s wool is also attributed to the lower crimp in the distal portion of the staples
(Madeley, Mahar & Postle 1995; Madeley, Postle & Mahar 1998b).
An increase in crimp frequency was associated with an improvement in the softness of
handle of both greasy wool and finished fabrics (Roberts 1956,1961). Greater fibre

51
crimp gave rise to bulkier yarns and resulted in thicker woven fabric with a softer and
smoother handle (Madeley & Postle 1999; Matsudaira, Kawabata & Niwa 1984a;
Menkart & Detenbeck 1957; Smith, Purvis & Haigh 2005; Stevens 1994). In contrast,
other judges preferred fabric produced from low crimp fibres rather than high crimp
fibres for trousers (Stevens 1994) and Stevens and Mahar (1995) also reported that
lower crimp wools produced smoother, leaner fabrics with a preferred handle in finished
fabric than do higher crimp wools of the same diameter.
For knitwear, where diameter and yarn parameters were carefully matched, lower crimp
wools produced smoother fabric with a preferred soft handle (Lamb 1997; Madeley,
Mahar & Postle 1995; McGregor & Postle 2002). High crimp fabrics bulked up more
during wet or steam relaxation, thereby increasing the fabric weight and thickness
(Robinson 2000). The amount of bulking during relaxation was dependent on whether
the fibres were permanently set in a straightened configuration by dyeing or finishing.
Knitted fabrics from low curvature wools were found to have similar mechanical and
physical attributes to fabrics knitted from cashmere, and were classed as softer because
they were more compressible than fabrics knitted from high curvature wool (McGregor
& Postle 2008). Madeley, Mahar and Postle (1995) also found that knitted fabric
stiffness decreased with decreasing staple crimp.
2.5.4 Resistance to Compression (RtC) Resistance to compression (RtC) of loose wool is an objective test of fibre
compressibility (Teasdale 1986) and is defined as the force per unit area required to
compress a fixed mass of wool to a fixed volume (Australian Standard AS-3535. 2004).
The RtC instrument measures the resistance to compression as the pressure (kPa)
required for compressing a 2.5 g sample contained in a 50 mm internal diameter
cylinder to a thickness of 12 mm. Although RtC is regarded as a characteristic of

52
secondary importance in wool textile processing, it has been demonstrated that low
RtC/crimp wools have superior topmaking and spinning performance (Hunter, Smuts &
Gee 1985; Kurdo, Whiteley & Smith 1986; Madeley & Postle 1999; Roberts 1961;
Stevens & Mahar 1995), but are more prone to felting (Australian Standard AS-3535.
2004; Chaudri & Whiteley 1970; Whiteley & Balasubramaniam 1965; Whiteley,
Watson & Wilkins 1978; Whiteley et al. 1986).
The primary mechanism involved in compression of loose fibres is considered to be the
deformation of the crimped structure and the bending and twisting of fibres as they are
forced to occupy less space (Chaudri & Whiteley 1968; Watson, Jackson & Whiteley
1977). Various theoretical models based on Van Wyk’s pioneering work have been
developed to explain the compressive behaviour of fibre masses (Beil & Roberts
2002a,b; Carnaby & Pan 1989; Stankovic 2008; Van Wyk 1946).
The three dimensional or spatial configuration of crimp influences the observed
variation in the RtC of different wools; fibres with a helical crimp have higher RtC than
fibres with a sinusoidal crimp (Chaudri 1966; Chaudri & Whiteley 1968; Teasdale
1986), although in contrast Scheepers and Slinger (1968) found that crimp form had a
negligible influence on the RtC of Merino wool.
Wilkins, Whiteley and Stanton (1981) conducted a large study on 43 mobs of Australian
superfine sheep and found that staple crimp frequency was the principle determinant of
the RtC of Merino wool. This result was confirmed in a later study on Merino fleece
sale lots (Whiteley et al. 1986). RtC and crimp are highly correlated and are often
considered together. In Merino wool, they are moderately to highly heritable and could
be improved by genetic selection (Brown 2005; Watson, Jackson & Whiteley 1977).
Strong positive relationships between RtC and crimp frequency, curvature and follicle
53
curvature have also been reported for wool (Ali, Whiteley & Chaudri 1971; Brown
2005; Chaudri & Whiteley 1968; Fish, Mahar & Crook 1999; Liu, Wang & Wang
2004a; Madeley, Mahar & Postle 1995; Madeley & Postle 1994; Madeley, Postle &
Mahar 1998a,b; Shah & Whiteley 1971; Slinger 1965; Whiteley, Watson & Wilkins
1978; Wilkins, Whiteley & Stanton 1981). A weak correlation between RtC and fibre
curvature was observed for a small range of alpaca fibre (Liu, Wang & Wang 2004a)
and both poor and strong positive correlations between RtC and curvature have been
reported for cashmere (McGregor 2007b; McGregor & Postle 2004).
Positive correlations between RtC and fibre diameter have been demonstrated for wool
(Madeley, Mahar & Postle 1995; Madeley & Postle 1994). Madeley (1994) also
demonstrated that increasing crimp frequency at constant fibre diameter resulted in an
increase in RtC. Wilkins, Whiteley and Stanton (1981) observed weak positive and
negative correlations between RtC and fibre diameter for within and among mobs of
sheep respectively and suggested the weak, negative correlation between RtC and fibre
diameter among flocks confirmed the insignificance of fibre diameter compared to
crimp frequency in contributing to the variation in RtC among breed and strains of
sheep. Data from Whiteley Shah and Whiteley (1971) also shows a weak negative
relationship between RtC and fibre diameter. Liu, Wang and Wang (2004a) observed a
stronger, negative correlation (r = 0.74) between RtC and fibre diameter. These apparent
contradictions most likely arise from the different ranges of wools used by the
researchers, and the decrease in RtC with increasing fibre diameter is most likely a
reflection of the decrease in fibre curvature/crimp frequency. Positive correlations
between RtC and fibre diameter have been demonstrated for alpaca (Liu, Wang & Wang
2004a) and for cashmere, RtC was observed to be independent of fibre diameter
(Madeley 1994; Teasdale et al. 1985).
54
Large variations in RtC occur and are primarily due to the crimp structure of individual
fibres. The reported RtC values range from approximately 4 to 15 kPa for Merino wool
(Brown 2005; Kurdo, Whiteley & Smith 1986; Liu, Wang & Wang 2004a; Madeley,
Mahar & Postle 1995; Teasdale 1986), 3 to 8 kPa for alpaca (Liu, Wang & Wang
2004a; Lupton, McColl & Stobart 2006; McGregor 2006) and between 4 to 7 kPa for
cashmere (McGregor 2004; Teasdale et al. 1985). For a given fibre diameter, the RtC
value for wool was shown to be significantly higher than alpaca (Liu, Wang & Wang
2004a) and cashmere (Teasdale et al. 1985).
Compression is an important characteristic of loose wool fibre, particularly in the
assessment of handle, where a subjective bulk compression is achieved by squeezing the
wool in the hand (deMaCarty & Dusenbury 1955; Shah & Whiteley 1971; Stevens
1994). Within the hair care industry, resistance to compression is considered a reflection
of the tactile component of hair (Robbins & Crawford 1984). For wool, good correlation
was found between the subjective finger-pressure assessments of softness and objective
measurements of compression made on an Instron Tensile tester (Elder et al. 1984).
Handle (softness) deteriorated with increasing RtC and low RtC/crimp wools are
generally considered to be softer (Ali, Whiteley & Chaudri 1971; Australian Standard
AS-3535. 2004; Madeley, Mahar & Postle 1995; McGregor 2004; Shah & Whiteley
1971; Stevens 1994; Whiteley et al. 1986). Researchers have suggested that RtC is the
most important variable after fibre diameter in determining the softness of loose wool
(Ali, Whiteley & Chaudri 1971; Madeley & Postle 1999; Madeley, Postle & Mahar
1998a; Shah & Whiteley 1971) with diameter and crimp or compression properties
accounting for up to 87% of the variation in handle. Interestingly, Van Wyk (1946)
found only a weak association between handle and compression and suggested that
handle was associated with fibre diameter, crimp and influenced by surface friction and
55
resistance to compression. Liu, Wang and Wang (2004a) observed a strong negative
correlation between RtC and fibre diameter and in view of the fact that softness of loose
wool is heavily dependent on fibre diameter, have suggested RtC is a poor indicator of
fibre softness, particularly for wool fibres of varying diameters.
There is also evidence however, that RtC of loose wool can be translated into the handle
of fabrics. Madeley, Mahar and Postle (1995) observed that the softness rankings of
knitted woollen fabrics were related to RtC, with softness ranking decreasing as loose
wool RtC increased from approximately 7 kPa to 15 kPa. Fabric compressibility
decreased and fabric bending stiffness increased with increasing RtC (Madeley, Mahar
& Postle 1995; Madeley & Postle 1994) leading these authors to conclude that RtC of
loose wool is the best single parameter that explains the softness of fabric knitted from
woollen spun yarn. For woven worsted fabrics, subjective assessments have shown that
low RtC samples were significantly smoother in handle than high RtC samples of
similar diameter (Stevens & Mahar 1995). However, Madeley and Postle (1999) found
no difference in the KESF smoothness of woven fabrics made from woollen yarns spun
from high and low RtC wool. High RtC fibres produced woven fabrics that were
thicker, lighter in weight, had higher bending rigidity and lower air-permeability, felting
shrinkage, breaking strength and extension at break. High RtC fibres reduced knitted
fabric softness, compressibility and bursting strength (Hunter, Smuts & Gee 1985;
Madeley, Mahar & Postle 1995; Madeley & Postle 1994; Whiteley et al. 1986).
2.5.5 Friction The scales of wool and keratin fibres point from root to tip and cause the frictional
characteristics of the fibre to differ according to the direction of rubbing. The friction is
greater when the fibre is rubbed from the tip to root (against scales direction) than when
it is rubbed from the root to tip (with scales direction). Friction is typically measured in
56
both directions and the directional frictional effect (DFE) is generally expressed as the
arithmetic difference between the against scale and with scale friction (Christoe et al.
1998; Huson 1996; MacLaren & Milligan 1981; Rippon 2008). There has been common
agreement that the DFE, under wet conditions, is largely responsible for the felting
behaviour of wool, so most studies on fibre friction have been conducted in conjunction
with the development of shrink-proofing treatments of wool (Rippon 2008). Surface
friction of fibres has been extensively reviewed by Langston and Rainey (1954),
Makinson (1975), Morton and Hearle (1993) and more recently by Rippon (2008).
Fibre friction influences all stages of the conversion of fibre into fabrics and in
particular, the friction of dry wool is believed to be a factor in determining the handle of
wool fabric (Dobb et al. 1961; Feughelman 1997; MacLaren & Milligan 1981;
Makinson 1979; Rippon 2008). Treatments on wool such as alcoholic potash (Lipson &
Howard 1946; Van Wyk 1946) and removal of the external, covalently bound lipid with
methanolic potassium hydroxide, t-butoxide in t-butanol, aqueous hydroxylamine or
plasma treatments have increased the coefficient of friction and caused the handle to
deteriorate (Breakspear, Smith & Luengo 2005; Leeder & Rippon 1985; Meade et al.
2008; Rippon 2008). However Shah and Whiteley (1971) could not confirm a
significant relationship between the frictional properties of fibres and their handle. This
was largely confirmed by Smuts and Slinger (1972), however they also found that the
against scale frictional force accounted for some of the variation in handle of loose
wool, but only when samples with extreme frictional properties were included in the
regression analysis.
A range of different methods have been employed to measure fibre friction including
the violin bow method, the twisted fibre method and the capstan method and these are
summarised by Morton and Hearle (1993) and Rippon (2008). The capstan method has

57
been used widely to study the effects of chemical treatments on wool and common
reference materials are ebonite, glass and horn (Rippon 2008) and steel (Eley et al.
1985; Henshaw 1961; Wang et al. 2005; Yu & Liu 2006). The values of the coefficient
of friction published in the literature vary widely and clearly the magnitude of the
friction depends on the technique and conditions of measurement. Some examples of
published data are given in Table 2-3. The coefficient of against scale friction is
significantly lower for alpaca than wool when steel capstans are used. This is thought to
be due to the higher scale frequency and lower scale height of alpaca (Wang et al. 2005;
Yu & Liu 2006). However, when horn was used as the rubbing surface, the frictional
coefficients were greater for alpaca (Villarroel 1959) compared to wool (Lipson &
Howard 1946) although it should be noted that no direct comparison was made by the
same researcher. Values for the coefficient of friction of cashmere fibres could not be
found in the literature. Little is known about the friction of the fibre surface between the
scales, and this thesis investigates this ‘between scale’ friction using the atomic force
microscope and is referred to as nano-scale friction in this thesis.
Table 2-3 Coefficients of against scale friction (μa) and DFE of various keratin fibres measured by a capstan method
Source Capstan reference Fibre type μa DFE
(Wang et al. 2005) Steel broad wool 0.30 0.06 Lambswool 0.19 0.03 Alpaca 0.16 0.02 (Yu & Liu 2006) Steel Wool 0.35 0.04 Alpaca 0.28 0.04 (Lipson & Howard 1946) Horn Wool 0.34 0.20 (Villarroel 1959) Horn huacayo alpaca 0.42 0.14 suri alpaca 0.41 0.11 (Smuts & Slinger 1972) Ebonite Wool 0.43 Mohair 0.25 (Shah & Whiteley 1971) Horn Wool 0.08
Note μa is against scale coefficient of friction, and DFE is the arithmetic difference between against-scale and with scale friction (μa- μw).
58
2.5.6 Felting Felting is a complex process and is unique to keratin fibres. When felting is a desirable
feature it is referred to as milling. The basic mechanism of felting in wool is believed to
be due to the directional frictional effect (DFE). Felting results from the progressive
fibre compaction and entanglement that occurs when an assembly of fibres are agitated
in the presence of water (Makinson 1975; Schlink et al. 2009) The ratchet-like
behaviour of the scales, with results in a lower with-scale friction, causes the fibres to
irreversibly migrate towards their root ends resulting in the formation of a compact
structure (Feughelman 1997; Gupta, Agarwal & Pant 2007; Huson 1996; Liu & Wang
2007; MacLaren & Milligan 1981; Makinson 1979; Rippon 2008). Several mechanisms
have been proposed to explain the role of DFE in felting and these have been
comprehensively reviewed by Rippon (2008), Makinson (1979) and Gupta (2007).
Although it is clear that the unique scale structure of wool contributes to its felting,
felting is not determined solely by the DFE. Wool fibres with weathered tips, which
have a low DFE, were observed to felt more readily than high DFE fibres (Zahn &
Blankenburg 1962). Similarly, samples whose scale structure was severely damaged or
destroyed by photochemical degradation still had a high felting power (Blankenburg
1969). Traditionally fine fibres are associated with increased felting (Makinson 1979),
although some coarse wools such as Wensleydale have excellent felting power
suggesting that felting is not heavily dependent on fibre diameter (Chaudri & Whiteley
1970; Speakman & Stott 1931). A number of other bulk fibre properties have been
shown to influence felting, namely elasticity, length and crimp (Feldtman & McPhee
1964; Gupta, Agarwal & Pant 2007; Makinson 1979; Rippon 2008). The capacity of
fibres to recover from extension during felting has been correlated with felting ability
(Rippon 2008; Whiteley 1963). Temperature influences the elastic properties of fibres
59
and their felting power (Gupta, Agarwal & Pant 2007; Rippon 2008; Speakman, Stott &
Chang 1933). Temperature along with regain influences the glass transition temperature
of wool, and it has been shown that the rapid onset of felting coincides with the glass
transition temperature (Pierlot 1997). Increasing temperature also reduces the DFE of
wool, yet felting is increased (Lindberg & Gralen 1948). Some researchers have found
that fibre length has a significant influence on fabric felting (Speakman, Stott & Chang
1933) and loose wool felting (Liu & Wang 2007), whilst others have concluded that
fibre length does not have any significant effect on felting (Chaudri & Whiteley 1969;
Schlink et al. 2009). Researchers agree that crimp and crimp form plays an important
role in felting (Australian Standard AS-3535. 2004; Chaudri & Whiteley 1970; Kenyon,
Wickham & Blair 1999; Schlink et al. 2009; Veldsman & Kritzinger 1960; Whiteley &
Balasubramaniam 1965; Whiteley, Watson & Wilkins 1978; Whiteley et al. 1986).
Wools with high RtC and crimp are less susceptible to felting and do not become
entangled as easily. Their geometry allows them to resist the compressive forces more
readily and hence fibres are not brought into intimate contact as readily as fibres that
have a low resistance to compression. Chaudri and Whiteley (1970) confirmed that 84%
of the variation in loose wool felting could be accounted for by compressional load
alone. Wools with sinusoidal crimp configurations felted more readily than those with
helical crimp (Whiteley & Balasubramaniam 1965). Veldsman and Kritzinger (1960)
found that wools with a low degree of crimp in relation to fibre diameter, particularly
exemplified by under-crimped, copper-deficient wools, felted more than wools with a
high crimp/diameter ratio. Fraser and Pressley (1958) also showed that crimpless fibres
from a mutant merino felted more readily than normal wool.
Most studies on wool felting have been carried out on yarn or fabric assemblies
(Schlink et al. 2009). However in studies concerning the influence of fibres
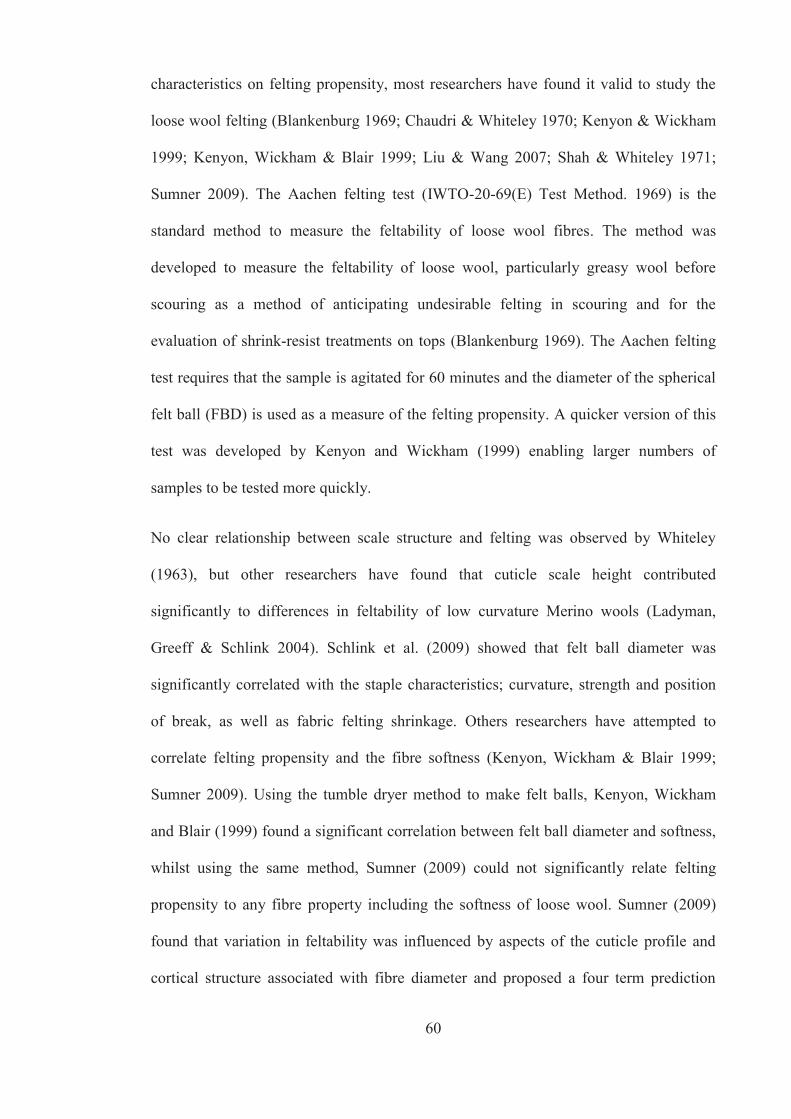
60
characteristics on felting propensity, most researchers have found it valid to study the
loose wool felting (Blankenburg 1969; Chaudri & Whiteley 1970; Kenyon & Wickham
1999; Kenyon, Wickham & Blair 1999; Liu & Wang 2007; Shah & Whiteley 1971;
Sumner 2009). The Aachen felting test (IWTO-20-69(E) Test Method. 1969) is the
standard method to measure the feltability of loose wool fibres. The method was
developed to measure the feltability of loose wool, particularly greasy wool before
scouring as a method of anticipating undesirable felting in scouring and for the
evaluation of shrink-resist treatments on tops (Blankenburg 1969). The Aachen felting
test requires that the sample is agitated for 60 minutes and the diameter of the spherical
felt ball (FBD) is used as a measure of the felting propensity. A quicker version of this
test was developed by Kenyon and Wickham (1999) enabling larger numbers of
samples to be tested more quickly.
No clear relationship between scale structure and felting was observed by Whiteley
(1963), but other researchers have found that cuticle scale height contributed
significantly to differences in feltability of low curvature Merino wools (Ladyman,
Greeff & Schlink 2004). Schlink et al. (2009) showed that felt ball diameter was
significantly correlated with the staple characteristics; curvature, strength and position
of break, as well as fabric felting shrinkage. Others researchers have attempted to
correlate felting propensity and the fibre softness (Kenyon, Wickham & Blair 1999;
Sumner 2009). Using the tumble dryer method to make felt balls, Kenyon, Wickham
and Blair (1999) found a significant correlation between felt ball diameter and softness,
whilst using the same method, Sumner (2009) could not significantly relate felting
propensity to any fibre property including the softness of loose wool. Sumner (2009)
found that variation in feltability was influenced by aspects of the cuticle profile and
cortical structure associated with fibre diameter and proposed a four term prediction

61
model using loge transformed prediction variables for mean fibre diameter, mean fibre
curvature, scale height and scale length that could explain 70% of the variation in
feltball diameter. Using a dyeing machine similar to a Laundrometer as a source of fibre
agitation, Liu and Wang (2007) showed that alpaca fibre has a higher felting propensity
than wool, whilst cashmere has a lower felting propensity than wool fibres of a similar
diameter. They also showed that fibre length had a significant influence on fibre
feltability, with longer fibres felting more than shorter fibres. They also found that
fibres cut to 10mm in length would not felt.
2.5.7 Mechanical properties The mechanical properties of fibres describe the responses of fibres to applied forces,
and are important in processing and also to the properties of the final product
(Kawabata, Niwa & Yamashita 2002; Morton & Hearle 1993; Warner 1995).
Textile fibres experience stretching, compression, bending and twisting forces. The
mechanical properties due to these forces are usually described in terms of six factors;
strength, elasticity, extensibility, resilience, toughness and stiffness. Information on
these mechanical properties is calculated from the load-deformation curves that are
recorded as the fibres are deformed by tensile, bending, compressive or shearing
stresses in a controlled or specified atmosphere. Due to the geometric shape and
dimensions of fibres, the mechanical properties most commonly evaluated are the
tensile properties. The ratio of stress to strain is referred to as the modulus and is used to
measure the stiffness or rigidity of materials. The stiffness describes the extent to which
a material resists being deformed by the applied force. Materials with a high modulus
are stiffer and deform less in the presence of stress than materials with a low modulus
(Warner 1995). The elastic modulus for stretching is commonly called Young’s
modulus or the initial modulus and describes a materials tendency to deform elastically

62
when a force is applied to it. The bending modulus, also called the flexural modulus
describes the ratio of maximum stress to maximum strain within the elastic limits of a
stress-strain diagram obtained in a flexure test. The shear modulus, also known as the
torsional modulus or modulus of rigidity, describes the material’s response to shearing
strains and is defined as the ratio of shear stress to the shear strain (Morton & Hearle
1993; Robbins 1994; Warner 1995). Bending and torsion properties of fibres are
thought to be more important than tensile properties in the evaluation of handle (Cassie
1946; Chapman 1973a,b; Guthrie, Morton & Oliver 1954; Khayatt & Chamberlain
1948; Roberts 1956; Warner 1995; Yu & Liu 2006). The bending and torsion properties
are more difficult to measure because of the small forces involved in flexion (Chapman
1973a,b; Khayatt & Chamberlain 1948).
2.5.7.1 Tensile modulus When a wool fibre is stretched, its load-extension curve shows three distinct regions
(Chapman 1969b; Feughelman 1997). Following the removal of the fibre crimp, there is
a rapid increase in load as the fibre is stretched to about 2%. This linear region of the
curve is often referred to as the Hookean region, although Bendit (1980) prefers to
describe this region as the pre-yield region. Beyond this linear region, the fibre begins
to yield and there is little increase in load with increasing extension up to about 30%.
The post yield region commences when the load rises rapidly with further extension
until the fibre breaks. The load/extension data is usually converted to stress and strain
values to allow comparisons between different fibres by removing the influence of the
fibre dimensions. The stress-strain responses of fibres commonly reported in the
literature include the stress and extension at the break and the stress at 15% and 30%
extension (Chapman 1969b; Collins & Chaikin 1971; James 1963; Shah & Whiteley
1966).
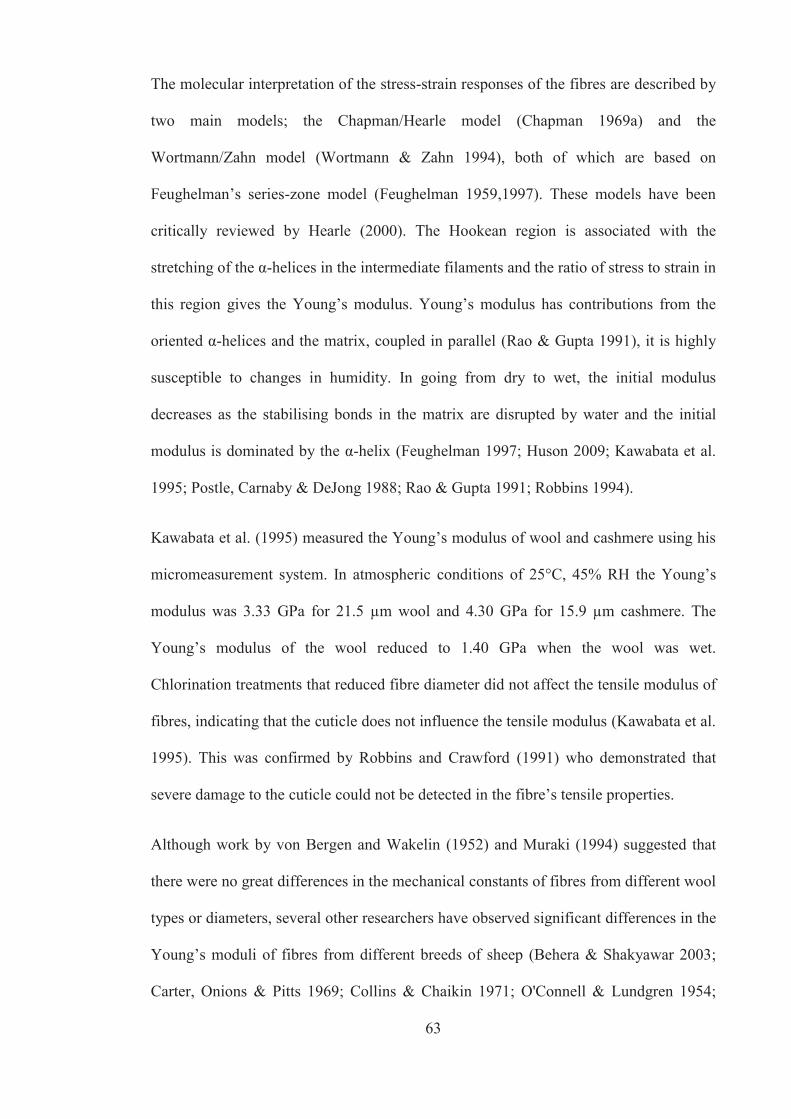
63
The molecular interpretation of the stress-strain responses of the fibres are described by
two main models; the Chapman/Hearle model (Chapman 1969a) and the
Wortmann/Zahn model (Wortmann & Zahn 1994), both of which are based on
Feughelman’s series-zone model (Feughelman 1959,1997). These models have been
critically reviewed by Hearle (2000). The Hookean region is associated with the
stretching of the α-helices in the intermediate filaments and the ratio of stress to strain in
this region gives the Young’s modulus. Young’s modulus has contributions from the
oriented α-helices and the matrix, coupled in parallel (Rao & Gupta 1991), it is highly
susceptible to changes in humidity. In going from dry to wet, the initial modulus
decreases as the stabilising bonds in the matrix are disrupted by water and the initial
modulus is dominated by the α-helix (Feughelman 1997; Huson 2009; Kawabata et al.
1995; Postle, Carnaby & DeJong 1988; Rao & Gupta 1991; Robbins 1994).
Kawabata et al. (1995) measured the Young’s modulus of wool and cashmere using his
micromeasurement system. In atmospheric conditions of 25°C, 45% RH the Young’s
modulus was 3.33 GPa for 21.5 μm wool and 4.30 GPa for 15.9 μm cashmere. The
Young’s modulus of the wool reduced to 1.40 GPa when the wool was wet.
Chlorination treatments that reduced fibre diameter did not affect the tensile modulus of
fibres, indicating that the cuticle does not influence the tensile modulus (Kawabata et al.
1995). This was confirmed by Robbins and Crawford (1991) who demonstrated that
severe damage to the cuticle could not be detected in the fibre’s tensile properties.
Although work by von Bergen and Wakelin (1952) and Muraki (1994) suggested that
there were no great differences in the mechanical constants of fibres from different wool
types or diameters, several other researchers have observed significant differences in the
Young’s moduli of fibres from different breeds of sheep (Behera & Shakyawar 2003;
Carter, Onions & Pitts 1969; Collins & Chaikin 1971; O'Connell & Lundgren 1954;

64
Rao & Gupta 1991). Banky and Slen (1955) found that increases in cross sectional area
variability reduced the slope of the Hookean region. Others have observed that the
Young’s modulus decreases with increasing levels of crimp and this has largely been
explained in terms of an uneven distribution of stress that occurs when fibres, set in a
curved configuration, are subjected to a tensile strain (Bendit 1980; Collins & Chaikin
1968; Dusenbury & Wakelin 1958; Evans 1954; Huson 1992; O'Connell & Yeiser
1954). Huson (1992) showed that secondary bonds play a significant role in the stiffness
of wool fibres.
The Young’s modulus of fibres increases during processing but fabric finishing causes
the modulus of wool fibres to decrease to a value less than the unprocessed fibre
(Muraki 1994). Young’s modulus also decreases with increasing temperature and is
lower for wool than human hair because of its lower cross-link density (Robbins 1994).
Villarroel (1959) reported Young’s moduli of 2.31x10⁸ and 2.22x10⁸ Dynes/cm2 for
Huacayo and Suri alpaca respectively tested at 21°C and 65% relative humidity.
Although he only tested 28 Huacayo alpaca and 11 Suri alpaca, these Young’s moduli
values are very low and equivalent to approximately 0.023 and 0.022 GPa respectively.
Liu, Hurren and Wang (2005) obtained a Young’s modulus of 28.22 cN/tex for 24.29
μm alpaca.
Roberts (1956) was unable to demonstrate a significant relationship between Young’s
modulus and subjectively assessed handle of either greasy or cleaned loose wool,
however he doubted the accuracy with which he determined the Young’s modulus.
2.5.7.2 Bending modulus Fibre bending involves simultaneous tensile and compressive stresses around a neutral
plane. When a fibre is bent into a curve or arc, the outside of the curve is stretched while
the inside of the curve is compressed. The bending or flexural rigidity (stiffness) of a

65
fibre is a measure of the bending resistance of the fibre and is the property that is
thought to dominate fibre softness (Morton & Hearle 1993; Warner 1995; Yu & Liu
2006). The bending rigidity (B) of a fibre relative to an axis can be expressed as
Equation 2-2 (Bueno, Aneja & Renner 2004; Wortmann & Schwann-Jonczyk 2006)
IEB 2-2
where E is the Young’s modulus of the fibre in bending and I is the moment of inertia
of the cross section relative to the axis.
It can be assumed that elliptical fibres will preferentially bend about their minor elliptic
axis (Robbins 1994; Swift 1995; Wortmann & Schwann-Jonczyk 2006), so the moment
of inertia of an elliptical fibre can be expressed as Equation 2-3 (Wortmann &
Schwann-Jonczyk 2006), where a and b represent the radius of the long axis and short
axis respectively.
4
3abI 2-3
Therefore the bending rigidity becomes:
4
3abEB 2-4
Clearly the bending rigidity of a fibre depends heavily its shape, size and Young’s
modulus (Equation 2-4). Diameter is the most important parameter because it is to the
fourth power, and only a very small change in diameter can produce a noticeable change
in the fibre’s flexibility. Reducing the fibre diameter by a factor of 2 reduces the
bending rigidity by a factor of 16 (Warner 1995).
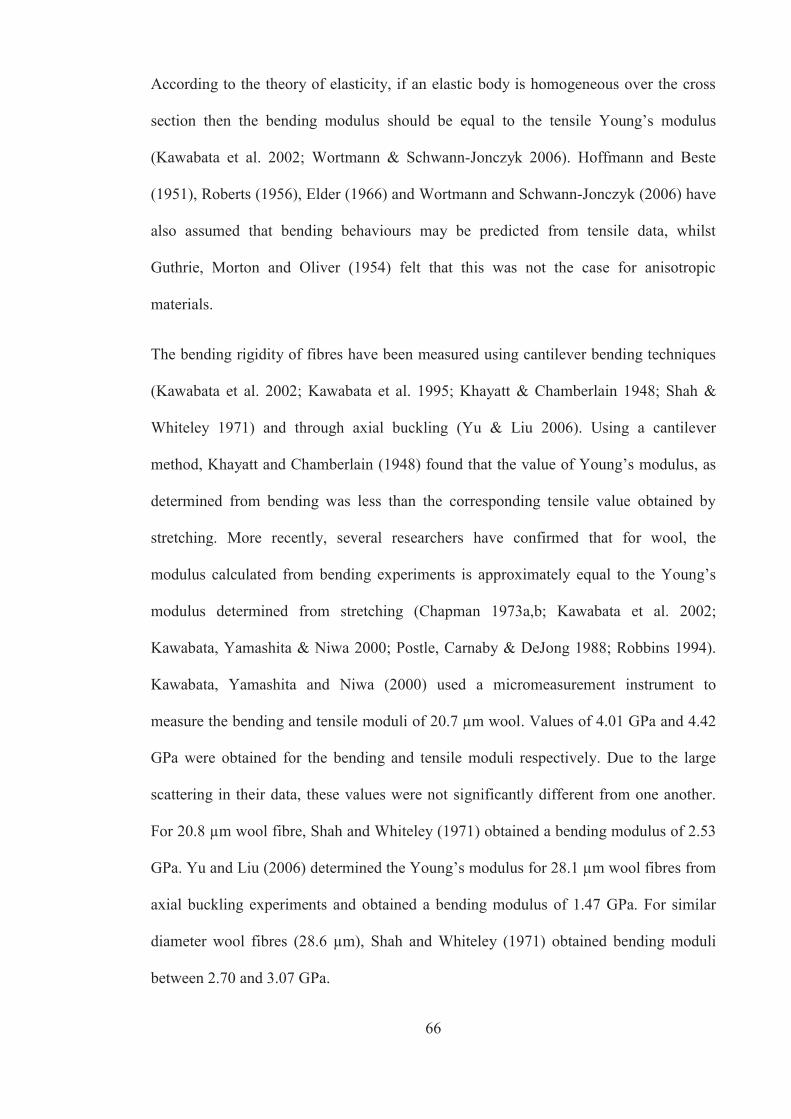
66
According to the theory of elasticity, if an elastic body is homogeneous over the cross
section then the bending modulus should be equal to the tensile Young’s modulus
(Kawabata et al. 2002; Wortmann & Schwann-Jonczyk 2006). Hoffmann and Beste
(1951), Roberts (1956), Elder (1966) and Wortmann and Schwann-Jonczyk (2006) have
also assumed that bending behaviours may be predicted from tensile data, whilst
Guthrie, Morton and Oliver (1954) felt that this was not the case for anisotropic
materials.
The bending rigidity of fibres have been measured using cantilever bending techniques
(Kawabata et al. 2002; Kawabata et al. 1995; Khayatt & Chamberlain 1948; Shah &
Whiteley 1971) and through axial buckling (Yu & Liu 2006). Using a cantilever
method, Khayatt and Chamberlain (1948) found that the value of Young’s modulus, as
determined from bending was less than the corresponding tensile value obtained by
stretching. More recently, several researchers have confirmed that for wool, the
modulus calculated from bending experiments is approximately equal to the Young’s
modulus determined from stretching (Chapman 1973a,b; Kawabata et al. 2002;
Kawabata, Yamashita & Niwa 2000; Postle, Carnaby & DeJong 1988; Robbins 1994).
Kawabata, Yamashita and Niwa (2000) used a micromeasurement instrument to
measure the bending and tensile moduli of 20.7 μm wool. Values of 4.01 GPa and 4.42
GPa were obtained for the bending and tensile moduli respectively. Due to the large
scattering in their data, these values were not significantly different from one another.
For 20.8 μm wool fibre, Shah and Whiteley (1971) obtained a bending modulus of 2.53
GPa. Yu and Liu (2006) determined the Young’s modulus for 28.1 μm wool fibres from
axial buckling experiments and obtained a bending modulus of 1.47 GPa. For similar
diameter wool fibres (28.6 μm), Shah and Whiteley (1971) obtained bending moduli
between 2.70 and 3.07 GPa.

67
Clearly accurate fibre diameter and sample length measurements are critical for the
bending tests and these are thought to contribute to the large scattering of the bending
data.
Khayatt and Chamberlain (1948) observed that removing the cuticle from fibres only
reduced the bending modulus by 4% and suggested that the cuticle did not play a
preferential role in bending. However more recently, theoretical studies suggest that the
cuticle may contribute up to 25% of the bending stiffness (Liu & Bryson 2005; Swift
1995,2000).
Shah and Whiteley (1971) also used Guthrie et al’s (1954) cantilever technique to
measure bending properties of single fibres. They found considerable variation in the
bending modulus and attributed it to the variability of fibre cross-sectional area along
the length of the fibre segments. They were unable to demonstrate a relationship
between subjectively assessed handle of scoured, carded loose wool and bending
modulus. Madeley, Postle and Mahar (1998b) plotted bending modulus against crimp
frequency for a few selected fibre diameters from Shah and Whiteley’s (1971) data set
and found a reasonable correlation (r2=0.56). However if they had plotted the other data
points that lay within the same diameter range, no correlation was evident between
Young’s modulus and crimp frequency (r2=0.05).
Yu and Liu (2006) used axial compression experiments to determine the bending
modulus of single fibres and obtained values of 1.47, 2.15 and 4.58 GPa for wool,
alpaca and silk respectively. The bending rigidity of these fibres, calculated from the
bending modulus and the fibre dimensions, were 4.46 x 10⁻¹¹ Nm2, 43.55 x 10⁻¹¹ Nm2
and 0.29 x 10⁻¹¹ Nm2 for wool, alpaca and silk respectively. They concluded that the
soft handle of silk was due to its low bending rigidity which resulted from its very fine
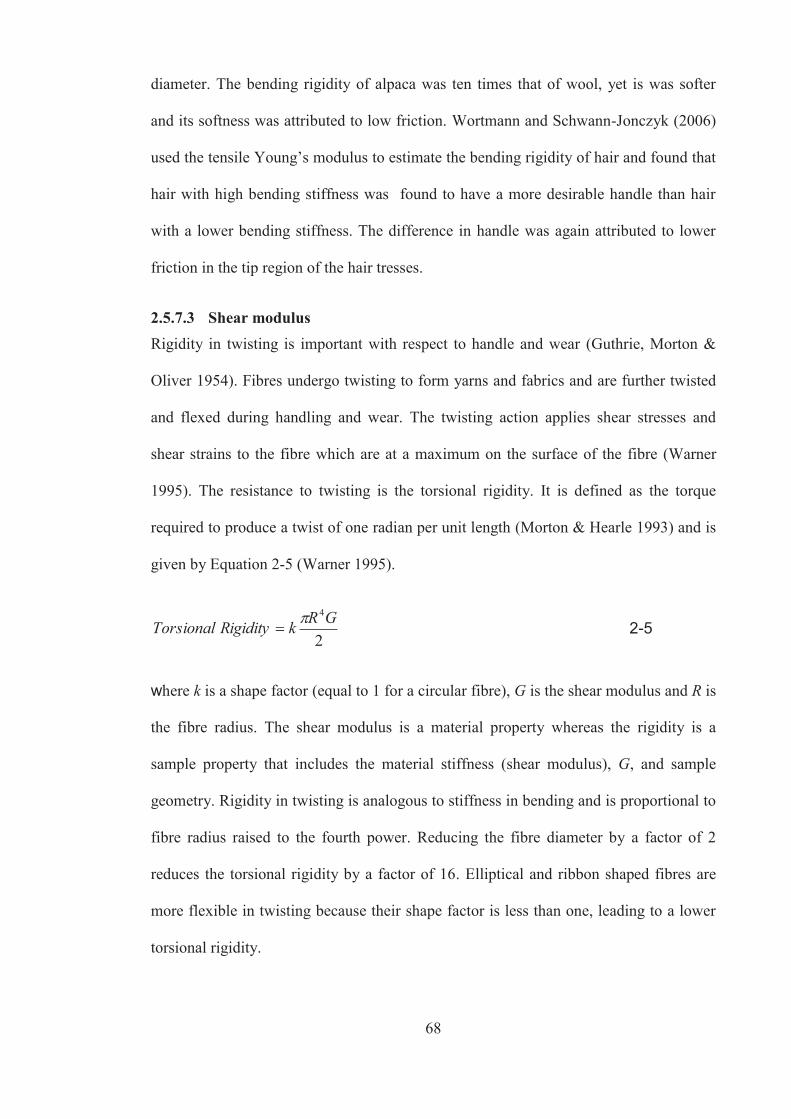
68
diameter. The bending rigidity of alpaca was ten times that of wool, yet is was softer
and its softness was attributed to low friction. Wortmann and Schwann-Jonczyk (2006)
used the tensile Young’s modulus to estimate the bending rigidity of hair and found that
hair with high bending stiffness was found to have a more desirable handle than hair
with a lower bending stiffness. The difference in handle was again attributed to lower
friction in the tip region of the hair tresses.
2.5.7.3 Shear modulus Rigidity in twisting is important with respect to handle and wear (Guthrie, Morton &
Oliver 1954). Fibres undergo twisting to form yarns and fabrics and are further twisted
and flexed during handling and wear. The twisting action applies shear stresses and
shear strains to the fibre which are at a maximum on the surface of the fibre (Warner
1995). The resistance to twisting is the torsional rigidity. It is defined as the torque
required to produce a twist of one radian per unit length (Morton & Hearle 1993) and is
given by Equation 2-5 (Warner 1995).
2
4GRkRigidityTorsional 2-5
where k is a shape factor (equal to 1 for a circular fibre), G is the shear modulus and R is
the fibre radius. The shear modulus is a material property whereas the rigidity is a
sample property that includes the material stiffness (shear modulus), G, and sample
geometry. Rigidity in twisting is analogous to stiffness in bending and is proportional to
fibre radius raised to the fourth power. Reducing the fibre diameter by a factor of 2
reduces the torsional rigidity by a factor of 16. Elliptical and ribbon shaped fibres are
more flexible in twisting because their shape factor is less than one, leading to a lower
torsional rigidity.

69
As with the bending measurement, the measurement of shear modulus of fibres is
difficult and methods based on a torsional pendulum and the torque-balance have been
described in the literature (Chapman 1971; Harper & Kamath 2007; Kawabata et al.
1995; McCord & Ellison 1996; Meredith 1954; Persaud & Kamath 2004; Rao,
Parthasarathy & Chopra 1984; Robbins 1994; Warner 1995). Rao and Gupta (1991)
used the torsional pendulum method to compare the torsional modulus of Lincoln,
Chokla and Merino wool and found that in the dry state, the torsional modulus was the
highest in Merino fibres, followed by Chokla and Lincoln. This was the opposite of the
Young’s tensile modulus findings for these fibres. The torsional properties of untreated
and treated human hair have also been studied using a torsional pendulum technique
(Harper & Kamath 2007; Persaud & Kamath 2004). McCord and Ellison (1996) built an
instrument to characterise the torsional properties of polypropylene filaments. Kawabata
(1995; 2002) used a micromeasurement system to measure the torsional properties of
various fibres including wool and cashmere and obtained a shear modulus of 0.25 GPa
for 15.9 μm cashmere fibre measured at 25°C and 45% RH. No torsional data for alpaca
could be found in the literature.
Studies have shown that the cuticle layer has a major influence on the torsional modulus
of fibres. Harper and Kamath (2007) abraded the cuticle from hair and observed that the
shear modulus reduced by 40%. Kawabata et al. (1995) used chlorination as a diameter
reducing treatment for wool and also observed a reduction in shear modulus of up to
27%. Torsional rigidity is much more sensitive to moisture changes than the tensile
modulus (Phillips 1987; Robbins 1994) and since moisture is preferentially absorbed in
the matrix, torsional properties are highly dependent on matrix properties. Moisture is
preferentially absorbed in the matrix and dry wool fibres have a shear modulus of
approximately 1.8 GPa, whilst wet wool fibres have a shear modulus of approximately

70
0.14 GPa (Kawabata et al. 1995; Postle, Carnaby & DeJong 1988). This 13x increase is
considerably higher than the three fold increase of tensile modulus under the same
conditions (Huson 1998).
The response of fibres to deformation is thought to significantly impact on the tactile
properties of fabrics (De Boos 2005a; Kawabata 1996; Realff & Cascio 2005).
Although softness is generally associated with flexibility, compression and smoothness
(Finnimore & Konig 1986), it is important to understand the role of the fibre’s material
properties on softness.
2.6 Conclusion
This chapter has provided a background to the current understanding of the softness of
wool, cashmere and alpaca fibres. Particular reference has been given to the physical
properties of wool, cashmere and alpaca fibres that may influence their softness.
It appears reasonable to conclude from this review that despite the importance of
softness for next-to-skin garments very little has been done to investigate the fibre
factors that contribute to imparting a luxurious soft handle to the fibres and the knitwear
they produce. General consensus has established that the softness of loose wool is
heavily dependent on diameter and is influenced by crimp and resistance to
compression, but basic questions concerning the relationship between softness and
various secondary parameters, particularly the mechanical properties and surface
properties of fibres remain unanswered. Most previous studies focussed on establishing
relationships between softness and fibre properties across a broad sample base. Any
effects associated with secondary fibre properties are rendered insignificant because of
the dominating influence of diameter and crimp on softness. In this present study,
particular emphasis has been placed on matching wools so that they do not vary

71
significantly in any important textile property other than resistance to compression
(RtC). A comparative study of the physical, mechanical and surface properties of these
samples is conducted in this study.
To improve our understanding of fibre softness further research is warranted on the
contribution of these secondary fibre properties to softness, particularly in situations
where there is a departure from the strong diameter-softness relationship. A summary of
the objectives of the present study is provided in Section 1.3 above.

72
CHAPTER 3 RESISTANCE TO COMPRESSION, SOFTNESS AND FELTABILITY OF WOOL, CASHMERE AND ALPACA FIBRES
3.1 Introduction
Softness is important for the value of wool and is heavily dependent on fibre diameter
(Roberts 1956; Shah & Whiteley 1971; Stevens 1994; Sumner 2009). Crimp
characteristics play a minor but significant role through their influence on
compressibility (Shah & Whiteley 1971). However controversy exists over whether
resistance to compression, RtC, is a good indicator of the subjectively assessed softness
of loose wool. Some researchers suggest that RtC is the most important variable after
fibre diameter in determining the softness of loose wool (Ali, Whiteley & Chaudri
1971; Madeley & Postle 1999; Madeley, Postle & Mahar 1998a; Shah & Whiteley
1971), whilst others have concluded that RtC is actually a poor indicator of fibre
softness, particularly for wool fibres of varying diameters (Liu, Wang & Wang 2004a).
RtC is also thought to influence felting (Australian Standard AS-3535. 2004; Chaudri &
Whiteley 1970; Whiteley & Balasubramaniam 1965; Whiteley, Watson & Wilkins
1978; Whiteley et al. 1986) and felt ball diameter, determined by the Aachen felting test
(IWTO-20-69(E) Test Method. 1969), is used as an indicator of the felting propensity of
loose wool. Debate currently exists over the relationship between feltball diameter and
loose wool handle. Kenyon, Wickham and Blair (1999) reported a significant negative
relationship between felt ball diameter and loose wool handle, whilst Sumner (2009)
found that felting is not significantly related to any single wool or fibre characteristic
and is best predicted from a combination of fibre diameter, curvature, scale height and
scale length.
The relationships between RtC, softness and felting behaviour of wool and other keratin
fibres is investigated in this chapter.

73
The first objective of this chapter is to investigate the relationships between RtC, fibre
diameter, curvature and visual traits including greasy handle, for sheep that are
representative of the current Australian Merino flock.
The Sheep CRC runs eight research flocks at different locations around Australia, and
they are referred to as Information Nucleus Flocks (INF) (Forgarty et al. 2007). These
flocks represent the broad range of bloodlines and strains of sheep in the Australian
flock. The genetic diversity of Merino progeny born in the INF, and access to records
containing the visual (subjective) and objective data, provided a unique opportunity to
survey the extent to which RtC, diameter and curvature vary across the INF Merino
flock. Greasy handle is a newly measured visual trait and has been recorded for some of
the INF flock. This chapter reports on the data collected from the 2008 shearing of the
Merino progeny born to the INF dams in 2007.
The second objective of this chapter is to establish the relationships between RtC,
softness and the feltability of INF wools, when the effects of fibre diameter, curvature
and interference from contaminants such as grease and dirt are removed.
Accepting that mean fibre diameter (MFD) & mean fibre curvature (MFC) are the main
determinants of RtC, the INF allows selection of pairs of samples, such that diameter
and curvature of samples in a pair are as closely matched as possible but their RtCs are
different. The selected INF samples are cleaned by solvent and aqueous scouring and
evaluated subjectively for softness using a multiple paired comparison technique. The
results are analysed using the Friedman Ranked Sum and Tukey’s methods (Meilgaard,
Guille & Carr 1987; Naylor et al. 1997). The felting of the selected INF wools is
measured using a Labomat laboratory dyeing machine. The Labomat dyeing machine is
used to investigate felting because an Aachen felting apparatus, which is the standard

74
instrument for the measuring the feltability of loose wool fibres in the IWTO-20-69(E)
Test Method. (1969) was not available.
Luxury animal fibres such as cashmere and alpaca are renowned for their superior
softness of hand compared to wool of an equivalent diameter (Liu, Wang & Wang
2004a; McGregor 2007a,b; Stapleton 1992; Tester 1987; Tester et al. 1986; Wang,
Wang & Liu 2005; Wang, Wang & Liu 2003). Therefore the final objective in this
chapter is to investigate the resistance to compression (RtC), diameter, curvature,
subjective softness and felting propensity of cashmere and alpaca fibre taken from
commercial tops and compare them to wool fibres taken from tops of similar diameter.
These tops are used to make knitted fabrics and the processing and fabric softness
details are described in Chapter 6.
Although wool tops can be selected to have a similar diameter to cashmere and alpaca,
there are still some basic differences between the fibres. Wool typically has a longer
fibre length compared to cashmere and wool generally has a higher fibre curvature
compared to both cashmere and alpaca (McGregor 2007a; Wang, Liu & Wang 2004).
To match the short fibre length of cashmere, wool top is stretch broken. However it is
much more difficult to match the curvature of wool with the low curvature of the
specialty fibres. Instead, an attempt is made to reduce the amount of crimp in wool that
is recovered during relaxation by setting the fibres in a top dyeing process. Normally
during the top making process, fibre curvature gradually reduces as some fibre crimp is
pulled out because of the strains imposed on the fibres during processing. But
subsequent relaxation procedures can restore about half of the fibre crimp that is lost in
processing to top (Fish, Mahar & Crook 1999; Lamb 1997; Lobb et al. 1997).
Obviously the recovery of crimp will be restricted by setting procedures or by the
constraints imposed by the yarn or fabric structure (Matsudaira, Kawabata & Niwa

75
1984b; Robinson 2000). It was thought worthwhile to investigate permanently setting
top, to limit the recovery of crimp that can occur during the relaxation processes.
In summary, this chapter:
Investigates the relationships between RtC, diameter, curvature and greasy
handle data collected from the 2008 shearing of the 2007 INF drop.
Compares the softness and felt ball formation of pairs of INF wools that differ in
RtC.
Compares the softness and feltball formation of loose fibres from wool,
cashmere and alpaca tops.
3.2 Materials and experimental methods
3.2.1 Greasy wool from the Information Nucleus flock (INF) Eight Sheep CRC research flocks were run across a wide range of sheep environments
in Australia. The research flocks are known as IN01 (Kirby, New South Wales), IN02
(Trangie, New South Wales), IN03 (Cowra, New South Wales), IN04 (Rutherglen,
Victoria), IN05 (Hamilton, Victoria), IN06 (Struan, South Australia), IN07 (Turretfield,
South Australia) and IN08 (Katanning, Western Australia). The Merino progeny born to
the dams of the INF were tested for a large number of objective and subjective wool
quality traits at the time of shearing which ranged from April through to September
(Hatcher et al. 2010).
Prior to shearing, a suite of visual assessments were made on the quality of the mid-side
fleece for each sheep. The mid-side comprises a 250 x 250mm area half way from the
mid line of the back and the mid line of the belly along the third last rib and the visual
assessments included greasy colour, character, dust, and greasy handle. As with the
other subjective or visual traits, the main difficulty lies in describing the feature with a
numerical dimension (Stevens 1994). A five-point scoring system was used to score the

76
visual traits of the INF sheep. A score of one represents a desirable attribute and a score
of five represents an undesirable attribute. The assessed score represents the position of
the individual animal relative to its flock (Hatcher et al. 2010). The protocol used for the
assessment of hand of the fleece whilst on the sheep was also described by Hatcher et
al. (2010) and involved stroking a mid-side staple from the base to the tip. A mid-side
wool sample (~100 g) was removed from each sheep for objective testing. Objective
testing was conducted by the Australian Wool Testing Authority Limited (AWTA)
using Australian (AS) and International Wool Textile Organisation (IWTO) standard
test methods. Atlas staple strength (SS) and staple length (SL) (ASTM D 3822-07 Test
Method. 2007), Sirolan Laserscan (water based) mean fibre diameter (MFD), the
coefficient of variation of fibre diameter (CVD) and mean fibre curvature (MFC)
(IWTO-12-03 Test Method. 2003) and resistance to compression (RtC) (Australian
Standard AS-3535. 2004) were documented for all sheep in the INF.
The objective and visual data for the 2008 shearing of the first Merino progeny born in
2007 was made available in August 2009 for the purpose of studying the relationships
between subjectively assessed fibre handle and fibre diameter, curvature and RtC and
using this information to select fleeces for subsequent critical comparisons. Microsoft
Office Access 2003 was used to manage data and Microsoft Office Excel 2003 was used
for correlation and regression studies.
3.2.1.1 Selection of samples (matched pairs) from INF mid-side samples Emphasis was placed on selecting paired wool samples so that within each pair the
wools selected are as alike as possible in their diameter and curvature characteristics but
differ in their RtC values. Each pair of samples were sourced from the same flock and
therefore had been exposed to the same environmental challenges with similar levels of
vegetable and dust contamination and their visual scores were made by the same

77
assessor. In view of the large number of single fibre tests planned in the subsequent
chapters, only three pairs (six INF samples) were selected for critical comparisons; one
pair each from IN01 (Kirby), IN07 (Turretfield) and IN08 (Katanning). The selected
greasy mid-side samples had 10-11 months of wool growth.
3.2.1.2 Diameter and curvature of selected INF samples A Sirolan Laserscan (iso-propanol based) (IWTO-12-03) was used to confirm the
diameter and curvature data provided in the INF database for the six selected INF
wools. The diameter and curvature recorded in the INF database were measured on a
water based Laserscan. Random staples were extracted from the greasy mid-side
samples and guillotined into snippets, 2 mm long in length. These segments were
scoured by soaking in tetrachloroethylene for 2 minutes. The solvent was removed in
the Sirolan-SD snippet drier and snippets were dried overnight in an oven set at 50 °C,
then conditioned in a standard atmosphere of 20°C and 65% RH for 24 hours before
testing on the Laserscan. One Laserscan measurement was performed on each sample,
and a total of 2000 counts were collected for each sample.
3.2.1.3 Fibre diameter profiles of selected INF samples Fibre diameter profile refers to the variation in fibre diameter over one year of wool
growth. The fibre diameter profiles of mid-side staples of the selected INF samples were
assessed using the technique developed by Hansford, Emery and Teasdale (1985) where
staples were cut into sequential 2 mm snippets from the base of the staple to the tip. The
diameter of each 2 mm snippet was measured on a Sirolan-Laserscan (iso-propanol
based) and the fibre diameter was plotted against its position along the staple to produce
diameter profiles.

78
3.2.1.4 Subjective evaluation of the softness of selected INF samples Six INF wools, selected on their extremes in RtC, were appraised subjectively for
softness by a panel of ten judges. The samples were first thoroughly cleaned to prevent
any interference from grease, suint, dust and vegetable matter. The cleaning procedure
involved solvent scouring 10g of INF wool in 180 ml of dichloromethane for 3 hours at
105°C using a Soxtherm (Gerhardt) extraction unit. The non-polar solvent,
dichloromethane, was selected for solvent scouring because it is a commonly used
solvent for determining the residual grease in wool (Leeder, Treloar & Tsatsaronis
1988) and is an effective solvent for removing wool grease, detergents, processing oils
and finishing agents (TM 136 Woolmark Test Method. 2000). Samples were air dried
and washed in tap water at room temperature containing 0.05% w/v Lissapol TN450
(ICI), then rinsed in two beakers containing water only. The non-ionic detergent
Lissapol TN450 was used in this study because it has been recommended as one of the
most appropriate detergents for scouring wool (Stewart 1983). The degreased samples
were air dried again and carded by a Shirley Analyser. The Shirley analyser removed
residual dust and vegetable matter and effectively carded the sample, untangling the
fibres and produced opened webs of randomised fibres.
The softness of the cleaned 1g INF wool samples was tested using a multiple paired
comparison by ten judges. Four males and six females were invited to act as judges and
were chosen from a group of CSIRO staff members that participated in previous prior
prickle and comfort evaluation studies (Naylor, Oldham & Stanton 2004). Hence the
judges were already familiar with handling fabrics and subjective testing protocols.
Samples were conditioned in a standard atmosphere of 20°C and 65% RH for 24 hours
and subjective assessments were also conducted under the same atmospheric conditions.
It has been shown that visual stimuli relating to fabric construction, surface detail and
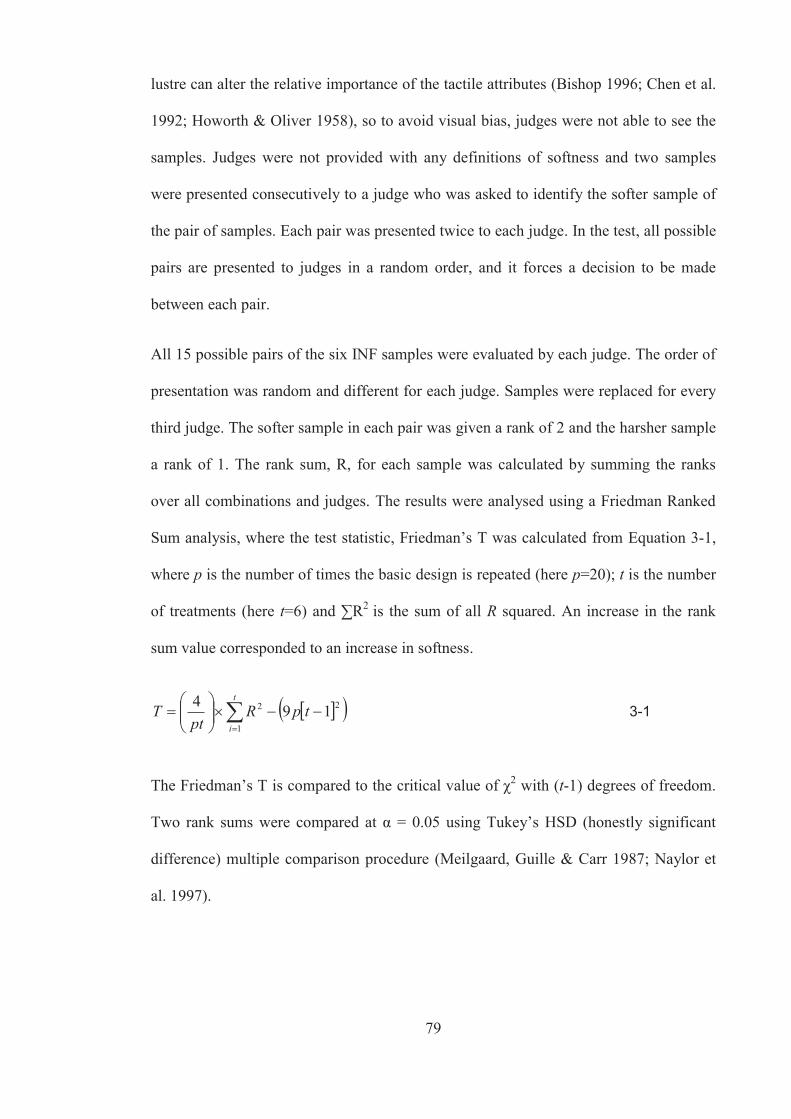
79
lustre can alter the relative importance of the tactile attributes (Bishop 1996; Chen et al.
1992; Howorth & Oliver 1958), so to avoid visual bias, judges were not able to see the
samples. Judges were not provided with any definitions of softness and two samples
were presented consecutively to a judge who was asked to identify the softer sample of
the pair of samples. Each pair was presented twice to each judge. In the test, all possible
pairs are presented to judges in a random order, and it forces a decision to be made
between each pair.
All 15 possible pairs of the six INF samples were evaluated by each judge. The order of
presentation was random and different for each judge. Samples were replaced for every
third judge. The softer sample in each pair was given a rank of 2 and the harsher sample
a rank of 1. The rank sum, R, for each sample was calculated by summing the ranks
over all combinations and judges. The results were analysed using a Friedman Ranked
Sum analysis, where the test statistic, Friedman’s T was calculated from Equation 3-1,
where p is the number of times the basic design is repeated (here p=20); t is the number
of treatments (here t=6) and ∑R2 is the sum of all R squared. An increase in the rank
sum value corresponded to an increase in softness.
t
itpR
ptT
1
22 194 3-1
The Friedman’s T is compared to the critical value of χ2 with (t-1) degrees of freedom.
Two rank sums were compared at α = 0.05 using Tukey’s HSD (honestly significant
difference) multiple comparison procedure (Meilgaard, Guille & Carr 1987; Naylor et
al. 1997).
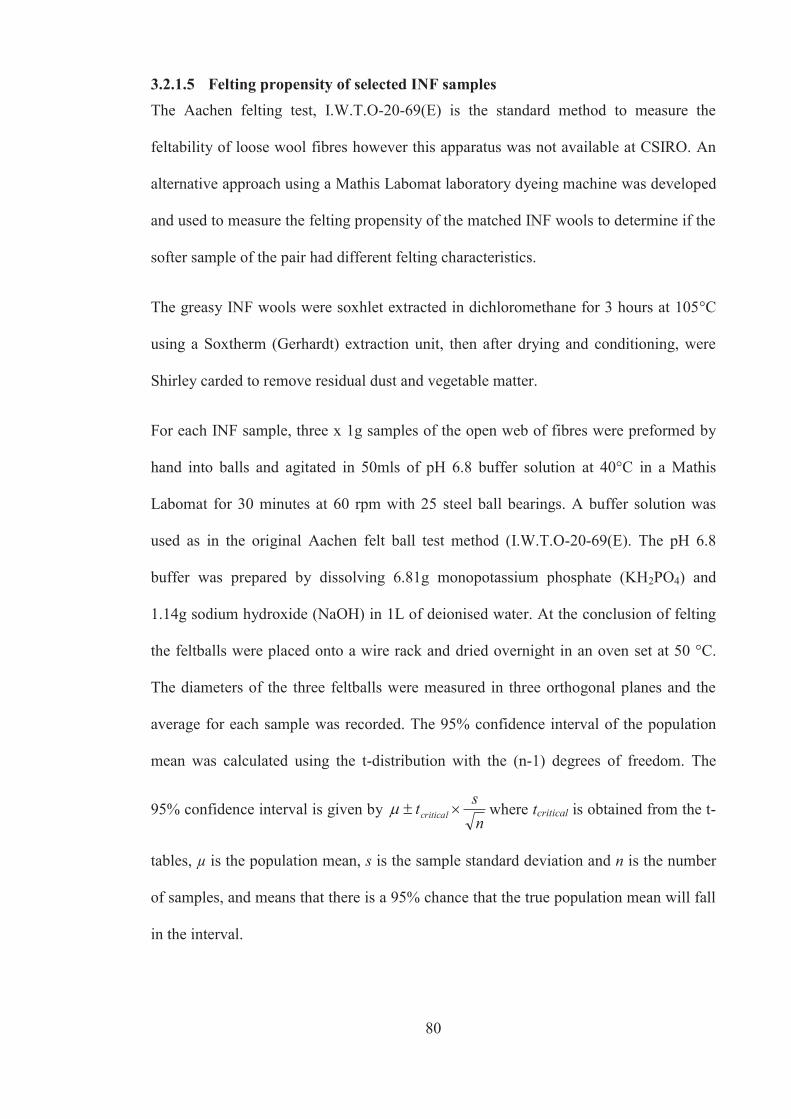
80
3.2.1.5 Felting propensity of selected INF samples The Aachen felting test, I.W.T.O-20-69(E) is the standard method to measure the
feltability of loose wool fibres however this apparatus was not available at CSIRO. An
alternative approach using a Mathis Labomat laboratory dyeing machine was developed
and used to measure the felting propensity of the matched INF wools to determine if the
softer sample of the pair had different felting characteristics.
The greasy INF wools were soxhlet extracted in dichloromethane for 3 hours at 105°C
using a Soxtherm (Gerhardt) extraction unit, then after drying and conditioning, were
Shirley carded to remove residual dust and vegetable matter.
For each INF sample, three x 1g samples of the open web of fibres were preformed by
hand into balls and agitated in 50mls of pH 6.8 buffer solution at 40°C in a Mathis
Labomat for 30 minutes at 60 rpm with 25 steel ball bearings. A buffer solution was
used as in the original Aachen felt ball test method (I.W.T.O-20-69(E). The pH 6.8
buffer was prepared by dissolving 6.81g monopotassium phosphate (KH2PO4) and
1.14g sodium hydroxide (NaOH) in 1L of deionised water. At the conclusion of felting
the feltballs were placed onto a wire rack and dried overnight in an oven set at 50 °C.
The diameters of the three feltballs were measured in three orthogonal planes and the
average for each sample was recorded. The 95% confidence interval of the population
mean was calculated using the t-distribution with the (n-1) degrees of freedom. The
95% confidence interval is given by nstcritical where tcritical is obtained from the t-
tables, μ is the population mean, s is the sample standard deviation and n is the number
of samples, and means that there is a 95% chance that the true population mean will fall
in the interval.
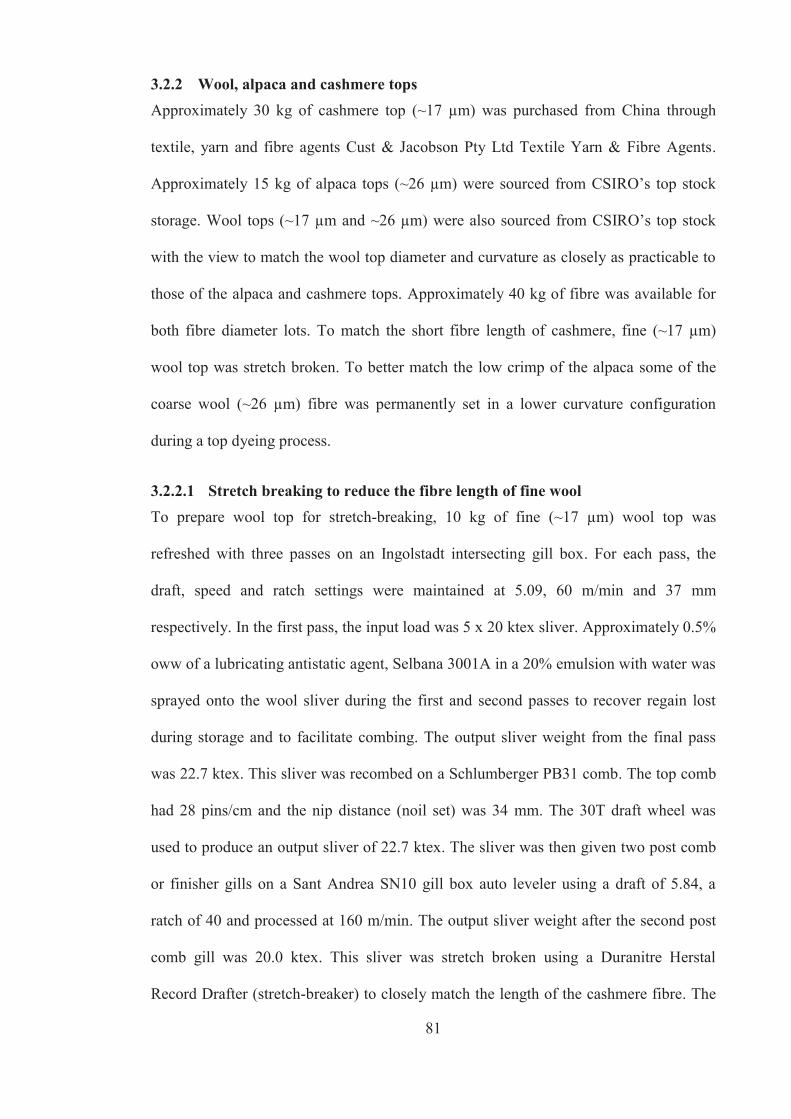
81
3.2.2 Wool, alpaca and cashmere tops Approximately 30 kg of cashmere top (~17 μm) was purchased from China through
textile, yarn and fibre agents Cust & Jacobson Pty Ltd Textile Yarn & Fibre Agents.
Approximately 15 kg of alpaca tops (~26 μm) were sourced from CSIRO’s top stock
storage. Wool tops (~17 μm and ~26 μm) were also sourced from CSIRO’s top stock
with the view to match the wool top diameter and curvature as closely as practicable to
those of the alpaca and cashmere tops. Approximately 40 kg of fibre was available for
both fibre diameter lots. To match the short fibre length of cashmere, fine (~17 μm)
wool top was stretch broken. To better match the low crimp of the alpaca some of the
coarse wool (~26 μm) fibre was permanently set in a lower curvature configuration
during a top dyeing process.
3.2.2.1 Stretch breaking to reduce the fibre length of fine wool To prepare wool top for stretch-breaking, 10 kg of fine (~17 μm) wool top was
refreshed with three passes on an Ingolstadt intersecting gill box. For each pass, the
draft, speed and ratch settings were maintained at 5.09, 60 m/min and 37 mm
respectively. In the first pass, the input load was 5 x 20 ktex sliver. Approximately 0.5%
oww of a lubricating antistatic agent, Selbana 3001A in a 20% emulsion with water was
sprayed onto the wool sliver during the first and second passes to recover regain lost
during storage and to facilitate combing. The output sliver weight from the final pass
was 22.7 ktex. This sliver was recombed on a Schlumberger PB31 comb. The top comb
had 28 pins/cm and the nip distance (noil set) was 34 mm. The 30T draft wheel was
used to produce an output sliver of 22.7 ktex. The sliver was then given two post comb
or finisher gills on a Sant Andrea SN10 gill box auto leveler using a draft of 5.84, a
ratch of 40 and processed at 160 m/min. The output sliver weight after the second post
comb gill was 20.0 ktex. This sliver was stretch broken using a Duranitre Herstal
Record Drafter (stretch-breaker) to closely match the length of the cashmere fibre. The

82
length of the fibres was progressively reduced until the desired length was achieved by
changing the roller spacing of zones 1 to 4 to 200 mm, 185 mm, 170 mm and 62 mm
respectively. The output sliver weight was 5.4 ktex. The fibre length distributions were
measured before and after stretch breaking using a Peyer texLab AL100 Almeter
according to the IWTO-17-04 Test Method. (2004).
3.2.2.2 Top dyeing to permanently reduce the fibre curvature of coarse wool Three x 3 kg tops from the coarse wool (~26 μm) were tightly wound on a Bernhardt
R73 gill box / top maker. A dyeing protocol recommended by experienced dyers was
used to set the fibres during top dyeing (F. Dean and C. Brackley, personal
communication, March 2010). Top dyeing was conducted in a JC Brown 20 kg package
and top pressure dyeing machine. The dyeing recipe comprised of 450g sodium
sulphate, 90g Lyogen MF, 90g Sandolan Blue MF2RLA and 90g Cibaflow Jet. The pH
was adjusted to 7 with sodium carbonate and acetic acid. The top dyeing commenced at
40°C and the temperature was raised to 98°C at 1°C/min. This temperature was held for
45 minutes, and then cooled to 60°C at a rate of 5°C/min. The residual dye liquor was
drained and the wool tops were rinsed twice with cold water. The pH of the dyeing
liquor was 7.09 at the start of dyeing and 7.12 at the end of dyeing. At the conclusion of
dyeing the dye liquor was still very blue, indicating incomplete exhaustion. To test the
effectiveness of the dyeing process on permanently setting the fibre curvature, the
curvature of the top dyed wool and its parent were measured using a Sirolan-Laserscan
(iso-propanol based) before and after tops were steam relaxed. Tops were steam relaxed
by steaming for 40 seconds on an open Hoffman press, followed by a vacuum cooling
for 30 seconds. The top fibre samples were allow to dry in an oven at 50°C overnight
before reconditioning and testing.
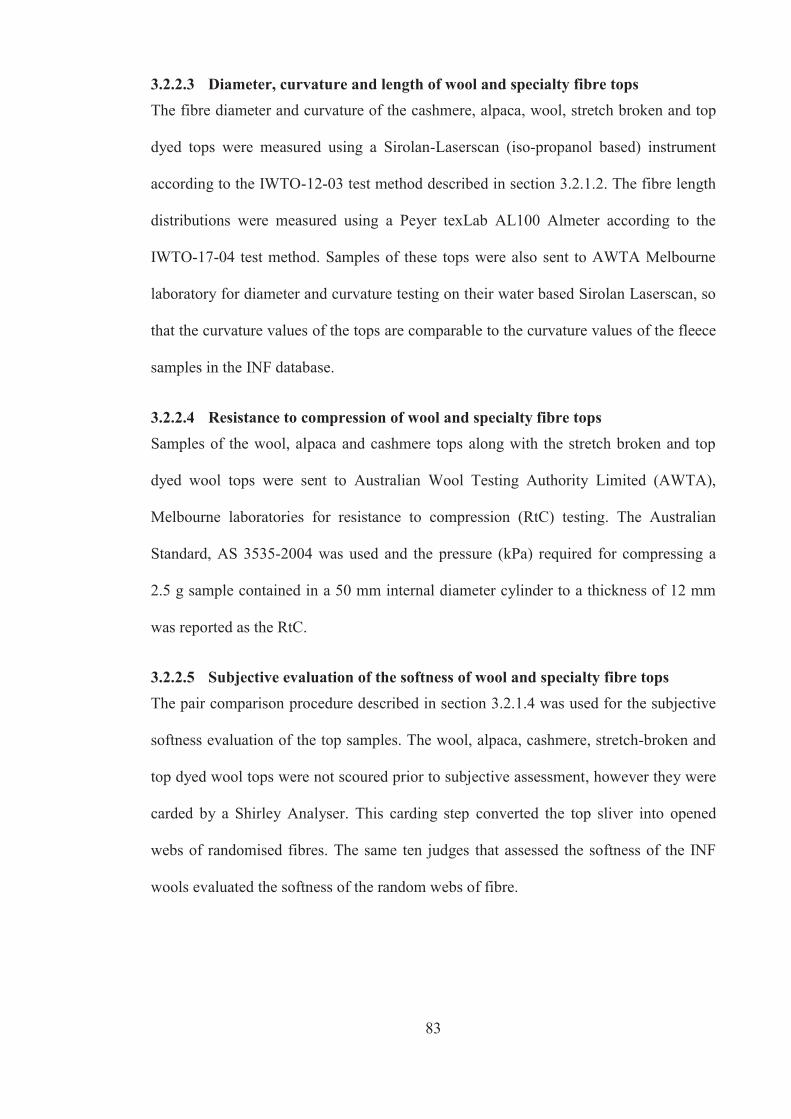
83
3.2.2.3 Diameter, curvature and length of wool and specialty fibre tops The fibre diameter and curvature of the cashmere, alpaca, wool, stretch broken and top
dyed tops were measured using a Sirolan-Laserscan (iso-propanol based) instrument
according to the IWTO-12-03 test method described in section 3.2.1.2. The fibre length
distributions were measured using a Peyer texLab AL100 Almeter according to the
IWTO-17-04 test method. Samples of these tops were also sent to AWTA Melbourne
laboratory for diameter and curvature testing on their water based Sirolan Laserscan, so
that the curvature values of the tops are comparable to the curvature values of the fleece
samples in the INF database.
3.2.2.4 Resistance to compression of wool and specialty fibre tops Samples of the wool, alpaca and cashmere tops along with the stretch broken and top
dyed wool tops were sent to Australian Wool Testing Authority Limited (AWTA),
Melbourne laboratories for resistance to compression (RtC) testing. The Australian
Standard, AS 3535-2004 was used and the pressure (kPa) required for compressing a
2.5 g sample contained in a 50 mm internal diameter cylinder to a thickness of 12 mm
was reported as the RtC.
3.2.2.5 Subjective evaluation of the softness of wool and specialty fibre tops The pair comparison procedure described in section 3.2.1.4 was used for the subjective
softness evaluation of the top samples. The wool, alpaca, cashmere, stretch-broken and
top dyed wool tops were not scoured prior to subjective assessment, however they were
carded by a Shirley Analyser. This carding step converted the top sliver into opened
webs of randomised fibres. The same ten judges that assessed the softness of the INF
wools evaluated the softness of the random webs of fibre.

84
3.2.2.6 Felting propensity of wool and specialty fibre tops The procedure described in section 3.2.1.5 was used to assess the felting propensity of
the top samples. The tops were solvent scoured to remove any processing oils that could
potentially influence the felting propensity of the top fibres.
3.3 Results and discussion
3.3.1 Information Nucleus flock (INF)
3.3.1.1 The Information Nucleus Flock The 2007 Information Nucleus Merino drop was comprised of 1265 Merino progeny
born on seven of the eight INF sites and represented 32 sires (Smith 2009). Hatcher et
al. (2010), who reported the heritability estimates for the wool traits, reported on only
1263 Merino progeny. Trangie (IN02) did not participate because of drought conditions
(Hatcher et al. 2010; Smith 2009). Shearing protocols varied between sites. Time of
shearing was dependent on the environmental conditions (Hatcher et al. 2010) and some
sites conducted tipping to remove the staple tip of the lamb’s coat during its first few
months of growth.
The sites that tipped their sheep were IN03 (Cowra), IN04 (Rutherglen), IN06 (non-
slaughter group) and IN08 (Katanning). Sheep at IN03 (Cowra) and IN04 (Rutherglen)
were tip shorn at weaning and mid-side wool samples were taken from the yearlings
with only 6 - 7 months of wool growth. Sheep at IN06 (Struan, non-slaughter group)
and IN08 (Katanning) were also tip shorn, but mid-side wool samples were taken with
11 – 12 months of wool growth.
The sites that did not tip shear their sheep were IN01 (Kirby), IN05 (Hamilton), IN06
(Struan, slaughter group) and IN07 (Turretfield). At these sites, the sheep were shorn at
10 – 11 months of age and the mid-side wool samples had about 10 – 11 months of
wool growth (Hatcher et al. 2010; Smith 2009).

85
3.3.1.2 Analysis of objective data for INF wool samples The only objective measurements conducted on all 1265 INF sheep were mean fibre
diameter, mean fibre curvature and resistance to compression. Staple length and
strength were measured on 508 animals. Descriptive statistics for the objective data for
the 1265 INF Merino progeny are provided in Table 3-1. The breakdown of the
objective data for the individual INF sites is provided in Table 3-2.
The average fibre diameter of the sheep (2007 drop) was 17.0 μm and the average RtC
of the wool was 7.8 kPa (Table 3-1). These results are in good agreement with those of
Brown (2005) who reported the average fibre diameter and resistance to compression of
the 2003 progeny of twelve Australian superfine flocks as 16.8 μm and 7.9 kPa
respectively. The average diameter and resistance to compression of the Australian
superfine flocks has decreased in recent decades. In the early 1980’s, the average fibre
diameter and resistance to compression of Australian superfine flocks was 18.5 μm and
11.1 kPa respectively (Wilkins, Whiteley & Stanton 1981).
Table 3-1 Descriptive statistics for the objectively measured fibre properties of the INF Merino progeny (2007 drop, 2008 shearing, n=1265)
All INF sites MFD CVD MFC RTC SS SL
(μm) (%) (°/mm) (kPa) (N/ktex) (mm)
Mean 17.0 18.2 57.6 7.8 36.7 75.6
Standard Deviation 1.7 2.7 8.6 0.8 11.9 10.1
Minimum 12.5 12 35 4 5 47
Maximum 27.7 29.8 98 12 72 104
Count 1265 1265 1265 1265 508 508
Confidence Level (95%) 0.09 0.15 0.47 0.04 1.04 0.88
MFD is mean fibre diameter, CVD is the coefficient of variation of fibre diameter, MFC is mean fibre curvature, RTC is the resistance to compression, SS is the staple strength and SL is the staple length. The confidence level refers to the 95% confidence interval of the mean.
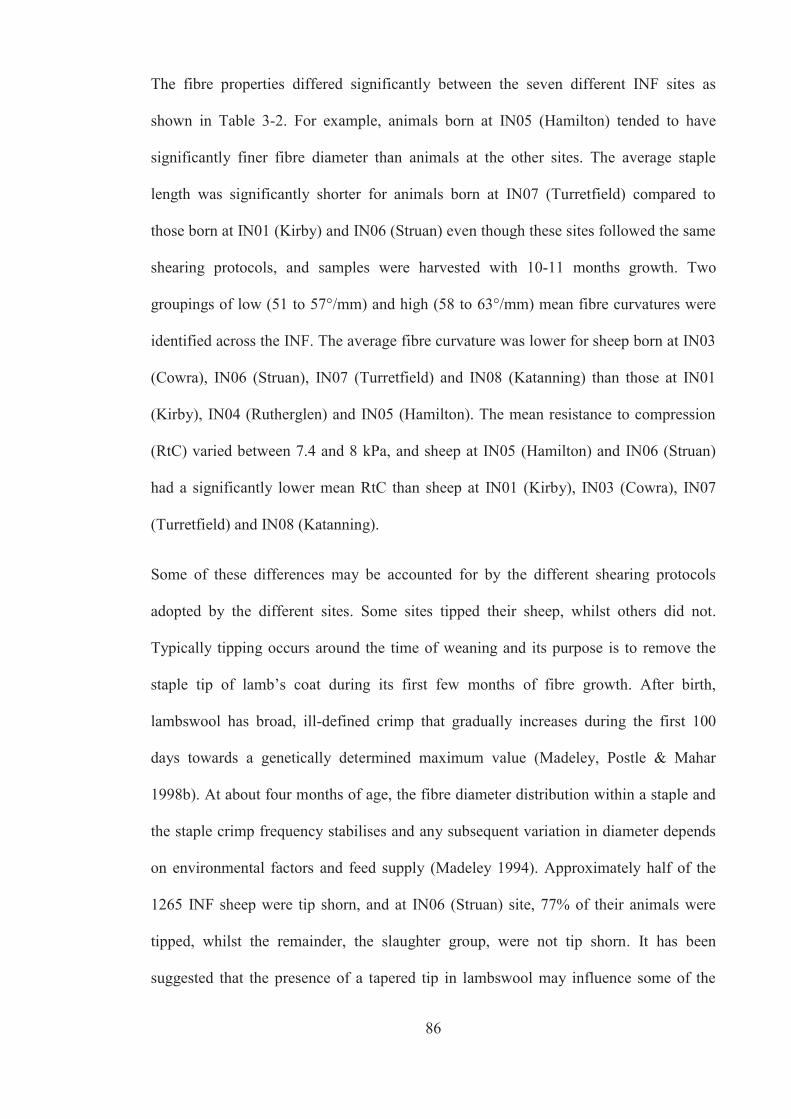
86
The fibre properties differed significantly between the seven different INF sites as
shown in Table 3-2. For example, animals born at IN05 (Hamilton) tended to have
significantly finer fibre diameter than animals at the other sites. The average staple
length was significantly shorter for animals born at IN07 (Turretfield) compared to
those born at IN01 (Kirby) and IN06 (Struan) even though these sites followed the same
shearing protocols, and samples were harvested with 10-11 months growth. Two
groupings of low (51 to 57°/mm) and high (58 to 63°/mm) mean fibre curvatures were
identified across the INF. The average fibre curvature was lower for sheep born at IN03
(Cowra), IN06 (Struan), IN07 (Turretfield) and IN08 (Katanning) than those at IN01
(Kirby), IN04 (Rutherglen) and IN05 (Hamilton). The mean resistance to compression
(RtC) varied between 7.4 and 8 kPa, and sheep at IN05 (Hamilton) and IN06 (Struan)
had a significantly lower mean RtC than sheep at IN01 (Kirby), IN03 (Cowra), IN07
(Turretfield) and IN08 (Katanning).
Some of these differences may be accounted for by the different shearing protocols
adopted by the different sites. Some sites tipped their sheep, whilst others did not.
Typically tipping occurs around the time of weaning and its purpose is to remove the
staple tip of lamb’s coat during its first few months of fibre growth. After birth,
lambswool has broad, ill-defined crimp that gradually increases during the first 100
days towards a genetically determined maximum value (Madeley, Postle & Mahar
1998b). At about four months of age, the fibre diameter distribution within a staple and
the staple crimp frequency stabilises and any subsequent variation in diameter depends
on environmental factors and feed supply (Madeley 1994). Approximately half of the
1265 INF sheep were tip shorn, and at IN06 (Struan) site, 77% of their animals were
tipped, whilst the remainder, the slaughter group, were not tip shorn. It has been
suggested that the presence of a tapered tip in lambswool may influence some of the

87
measured objective and subjective traits (Brown 2005; Madeley 1994). The results in
Table 3-3 clearly show that INF sites where tipping was practiced had a significantly
higher average fibre diameter than sites that did not tip sheep. Tipped animals at IN04
(Rutherglen) had significantly lower average fibre diameters than the tipped animals
(Table 3-2). There were no other significant differences in the mean coefficient of
variation of diameter, mean fibre curvature or the mean resistance to compression
(P>0.05).
Table 3-2 Variation in the objectively measured fibre properties of the Merino progeny at the individual INF sites (2007 drop, 2008 shearing)
Mean and 95% confidence level in ( )
INF site No. of sheep tested
MFD CVD MFC RTC SS SL
(μm) (%) (°/mm) (kPa) (N/ktex) (mm)
IN01 Kirby
293 16.2 17.1 62.4 8.0 41.5 78.0
(0.14) (0.26) (0.91) (0.09) (1.30) (1.13)
IN03 Cowra
145 18.1 18.4 52.9 7.8
(0.26) (0.45) (1.23) (0.14)
IN04 Rutherglen
122 16.8 16.6 59.8 7.6
(0.23) (0.36) (1.38) (0.11)
IN05 Hamilton
119 15.3 19.9 60.7 7.4
(0.22) (0.46) (1.38) (0.12)
IN06 Struan
148# 17.8 19.4 54.1 7.4 30.0 78.4
(0.23) (0.38) (1.17) (0.09) (3.0) (4.4)
IN07 Turretfield
181 16.5 19.9 55.3 7.7 30.1 71.3
(0.19) (0.40) (1.03) (0.10) (1.3) (1.27)
IN08 Katanning
257 18.2 17.3 55.8 7.9
(0.21) (0.30) (1.12) (0.10)
# Staple strength and length were tested for 34 sheep. MFD is mean fibre diameter, CVD is the coefficient of variation of fibre diameter, MFC is mean fibre curvature, RTC is the resistance to compression, SS is the staple strength and SL is the staple length. The confidence level refers to the 95% confidence interval of the mean.

88
Table 3-3 Influence of tip shearing (tipping) on the objectively measured fibre properties of the INF Merino progeny and at Struan (IN06) (2007 drop, 2008 shearing)
Mean and 95% confidence level in ( )
Shearing protocol No. of sheep tested
MFD CVD MFC RTC
(μm) (%) (°/mm) (kPa)
INF (all - tipped) 638 17.9 17.8 55.7 7.7
(0.13) (0.20) (0.67) (0.06)
INF ( all - not tipped) 627 16.1 18.6 59.5 7.8
(0.10) (0.22) (0.64) (0.06)
IN06 Struan (tipped) 114 18.1 19.4 54.6 7.4
(0.25) (0.44) (1.44) (0.11)
IN06 Struan (not tipped) 34
16.7 19.4 52.6 7.2
(0.36) (0.79) (1.69) (0.15)
MFD is mean fibre diameter, CVD is the coefficient of variation of fibre diameter, MFC is mean fibre curvature, and RTC is the resistance to compression. The confidence level refers to the 95% confidence interval of the mean.
3.3.1.3 Relationships between fibre diameter, curvature and RtC The correlation matrix for the key objective traits of mean fibre diameter, curvature and
RtC for the 1265 Merinos from the 2007 Merino drop is shown in Table 3-4.
Table 3-4 Correlation matrix for mean fibre diameter (MFD), curvature (MFC) and resistance to compression (RtC) for the INF Merino progeny (2007 drop, 2008 shearing, n=1265)
Correlation Matrix across all INF sites MFD MFC μm °/mm
MFC (°/mm) -0.18*
RTC (kPa) 0.28* 0.49*
* P<0.001, MFD is mean fibre diameter, MFC is mean fibre curvature, RTC is the resistance to compression.

89
The Pearson correlation (r) between RtC and curvature, RtC and diameter and curvature
and diameter were 0.49 (P<0.001), 0.28 (P<0.001) and -0.18 (P<0.001) respectively.
RtC is more highly correlated with curvature than diameter and, across all animals, a
weak negative relationship between fibre diameter and fibre curvature was observed
(see Figure 3-1, Figure 3-2 and Figure 3-3).
y = 0.1227x + 5.6634R2 = 0.0779
0
2
4
6
8
10
12
14
16
10 12 14 16 18 20 22 24 26 28 30
Mean fibre diameter (μm)
Res
ista
nce
to c
ompr
essi
on
(KPa
)
Figure 3-1 Relationship between resistance to compression (RtC) and mean fibre diameter (MFD)
y = -0.916x + 73.181R2 = 0.0333
0
20
40
60
80
100
120
10 12 14 16 18 20 22 24 26 28 30
Mean fibre diameter (μm)
Mea
n fib
re c
urva
ture
(°/m
m)
Figure 3-2 Relationship between mean fibre curvature (MFC) and mean fibre diameter (MFD)

90
y = 0.043x + 5.2747R2 = 0.2418
0
2
4
6
8
10
12
14
16
20 30 40 50 60 70 80 90 100 110
Mean fibre curvature (°/mm)
Res
ista
nce
to c
ompr
essi
on
(KPa
)
Figure 3-3 Relationship between resistance to compression (RtC) and fibre curvature (MFC)
The results shown in Table 3-4 are in good agreement with values reported as early as
1946, when staple crimp frequency and fibre diameter had been identified as the main
determinants of RtC (Van Wyk 1946). The results are also consistent with other early
studies on superfine flocks where the relationship between resistance to compression
and staple crimp frequency rather than fibre curvature was studied. Correlations
between resistance to compression and crimp frequency, between resistance to
compression and diameter and between diameter and staple crimp frequency have been
reported; 0.47, 0.39 and -0.16 (Wilkins, Whiteley & Stanton 1981) and 0.68, 0.32 and -
0.17 (Madeley & Postle 1994) respectively. Rather than examine the relationship
between fibre diameter and staple crimp frequency, Brown (2005) examined the
relationship between fibre diameter and fibre curvature across a number of superfine
flocks and obtained a similar correlation coefficient of -0.17. A good agreement was
expected for the correlation between staple crimp frequency and curvature with RtC,
purely because of the strong relationship between fibre curvature and staple crimp
frequency (Brown 2005; Fish, Mahar & Crook 1999). Hansford (1999) found no

91
association between fibre diameter and fibre curvature (r = 0.08). Kurdo, Whiteley and
Smith (1986) reported a low correlation between resistance to compression and fibre
diameter of 0.25. This is similar to the correlation obtained in this study.
In contrast to the above studies, a recent study found very significant correlations
between fibre diameter and fibre curvature (r = -0.90), between fibre diameter and
resistance to compression (r = -0.74) and between resistance to compression and fibre
curvature (r = 0.95) (Liu, Wang & Wang 2004a). However in that study only five wool
samples were used and the negative correlation between fibre diameter and resistance to
compression led the authors to conclude that resistance to compression is not a good
indicator of fibre softness for fibres of varying diameter.
Clearly significant variation exists within these relationships, suggesting that they are
very much dependent on the wool types or flocks used in each study.

92
Table 3-5 illustrates the variability in the correlation coefficients for the INF sites. The
Pearson’s correlation coefficient between fibre curvature and fibre diameter was just
significant at the Hamilton site (IN05) (P<0.05). No association between fibre diameter
and curvature was evident at the other sites, confirming that it is not effective to use
fibre curvature to class sheep for fibre diameter. The correlation coefficients between
RtC and fibre diameter and RtC and fibre curvature were statistically significant for all
sites (P<0.05) and suggest that high values of RtC are associated with coarser fibres and
higher curvatures.
93
Table 3-5 Correlation matrix for mean fibre diameter (MFD), curvature (MFC) and resistance to compression (RtC) for the Merino progeny at the individual INF sites
Correlation coefficients for flock
characteristics
INF site
(n = no. of sheep)
MFD MFC
μm °/mm
r R
MFC (°/mm)
IN01 Kirby (n=293) 0.08
IN03 Cowra (n=145) -0.06
IN04 Rutherglen (n=122) -0.13
IN05 Hamilton (n=119) -0.21
IN06 Struan (n=148) 0.03
IN07 Turretfield (n=181) 0.02
IN08 Katanning (n=257) 0.04
RtC (kPa)
IN01 Kirby (n=293) 0.32 0.68
IN03 Cowra (n=145) 0.36 0.60
IN04 Rutherglen (n=122) 0.38 0.45
IN05 Hamilton (n=119) 0.26 0.50
IN06 Struan (n=148) 0.30 0.38
IN07 Turretfield (n=181) 0.42 0.47
IN08 Katanning (n=257) 0.31 0.47
MFD is mean fibre diameter, MFC is mean fibre curvature, and RTC is the resistance to compression.
3.3.1.4 Analysis of visual data for INF wool samples The visual traits (fleece colour, character, dust and hand) were scored using a sliding
scale, where a score of one represented a highly desirable trait and a score of five
represented a highly undesirable trait. This technique puts characteristics into specific
categories but does not provide any information on the relative size of differences
between grades (Hatcher et al. 2010; Stevens 1994).

94
Visual assessments of colour, character and dust were made on 1207 animals from the
INF, whilst hand, which was not a compulsory visual trait, was scored on only 597
animals at only three sites; IN01(Kirby), IN07 (Turretfield) and IN08 (Katanning). Each
site used different judges to score the visual traits.
Descriptive statistics for the visual quality scores are provided in Table 3-6 and since
different judges were used at the different sites, the breakdown of the visual data for the
individual INF sites is provided in Table 3-7. All possible scores from 1 to 5 were
represented for all of the visual traits, and the average scores for colour, crimp character
and hand were slightly greater than 2.5, whilst the average score for colour was in the
middle of the range. The results in Table 3-7 show that animals born at IN04
(Rutherglen) had on average the whitest wool with good crimp character.
Table 3-6 Descriptive statistics for visual fibre traits of the INF Merino progeny (2007 drop, 2008 shearing)
All INF sites COLOUR CHARACTER DUST HAND
score score score Score
Mean 2.5 2.6 2.7 2.7
Standard Deviation 0.9 0.9 0.7 0.8
Minimum 1 1 1 1
Maximum 5 5 5 5
Count 1207 1207 1207 597
Confidence Level (95%) 0.05 0.05 0.04 0.06
Score 1 = desirable attribute, Score 5 = undesirable attribute

95
Table 3-7 Variation in visual fibre traits of the Merino progeny at the individual INF sites (2007 drop, 2008 shearing)
Mean and 95% confidence level in ( )
INF site No. of sheep tested
COLOUR CHARACTER DUST HAND
score score score Score
IN01-Kirby (all) 293 3.1 3.1 2.2 2.4
(0.07) (0.08) (0.05) (0.09)
IN01-Kirby (with hand score)
214 3.2 3.1 2.2 2.4
(0.08) (0.09) (0.06) (0.09)
IN03-Cowra 145 2.0 3.2 3.0
(0.11) (0.11) (0.09)
IN04-Rutherglen 122 1.5 1.8 2.4
(0.10) (0.12) (0.09)
IN05-Hamilton 119 2.6 2.6 3.2
(0.17) (0.14) (0.08)
IN06-Struan 145 2.7 1.9 2.4
(0.12) (0.13) (0.16)
IN07-Turretfield 181 2.0 2.5 3.3 2.9
(0.05) (0.09) (0.07) (0.09)
IN08-Katanning 202 2.6 2.7 2.4 2.8
(0.12) (0.13) (0.11) (0.13)
Score 1 = desirable attribute, Score 5 = undesirable attribute
Animals born at IN07 (Turretfield) and IN08 (Katanning) also had good crimp character
but judges at these sites gave lower scores for hand compared to judges at IN01 (Kirby).
The sheep at IN01 (Kirby) were judged to have slightly inferior crimp character but a
better handle. Animals that were tip shorn at IN06 (Struan) were significantly less
dusty, but not significantly different in colour or crimp character than animals that were
not tip shorn. Clearly using different judges at the sites makes comparison of the visual
traits difficult. The question arises are the differences in the visuals traits at the different
sites real or just due to the different judges.
3.3.1.5 Greasy hand score Only three sites scored the subjective hand (softness) of greasy wool: IN01 (Kirby),
IN07 (Turretfield) and IN08 (Katanning) totalling only 597 assessments. Different

96
judges were used at each site. Hand was assessed on all sheep at Turretfield, but only
some sheep at Kirby or Katanning were assessed for greasy hand. Therefore a summary
of the objective properties for the subset of sheep that were assessed for hand is
provided in Table 3-8. Comparing the objective data in Table 3-8 to the objective data
in Table 3-2 it is clear that no bias was shown and the group of animals selected for
hand assessments at each site were representative of all sheep based at the site.
Table 3-9 shows the mean fibre diameter for each hand score at each site. IN08
(Katanning) was the only site where some sheep received a hand score of five, but 43%
of sheep at this site received a hand score of three.
Table 3-8 Variation in the objectively measured fibre properties at the INF sites that assessed ‘hand’
Mean and 95% confidence level in ( )
INF site No. of sheep tested
MFD CVD MFC RTC SS SL
(μm) (%) (°/mm) (kPa) (N/Ktex (mm)
IN01Kirby (with hand)
214 16.1 17.3 62.6 8.0 39.8 78.9
(0.16) (0.33) (1.12) (0.11) (1.58) (1.37)
IN07 Turretfield
181 16.5 19.9 55.3 7.7 30.1 71.3
(0.19) (0.40) (1.03) (0.10) (1.3) (1.27)
IN08 Katanning (with hand)
202 18.2 17.3 55.5 7.9
(0.23) (0.33) (1.26) (0.11)
MFD is mean fibre diameter, CVD is the coefficient of variation of fibre diameter, MFC is mean fibre curvature, RTC is the resistance to compression, SS is the staple strength and SL is the staple length. The confidence level refers to the 95% confidence interval of the mean.

97
Table 3-9 Average fibre diameter of the various hand score categories at the INF sites
Hand Score
INF site 1 2 3 4 5
IN01Kirby (with hand)
Mean fibre diameter (μm) 15.6 15.9 16.2 17.4
Standard Deviation 1.0 1.1 1.3 1.1
Minimum diameter 14.1 12.9 13.5 15.9
Maximum diameter 17.2 19.2 20.3 19.0
Count 16 116 72 10
Confidence Level (95.0%) 0.53 0.19 0.31 0.77
IN07 (Turretfield)
Mean fibre diameter (μm) 16.55 16.22 16.32 17.9
Standard Deviation 1.34 0.99 1.13 1.59
Minimum 15.6 14.3 13.1 14.7
Maximum 17.5 19.1 20 21.8
Count 2 34 117 28
Confidence Level (95.0%) 12.07 0.34 0.21 0.62
IN08 (Katanning)
(tipped)
Mean fibre diameter (μm) 16.59 17.46 18.3 18.78 21.84
Standard Deviation 1.14 0.88 1.27 1.41 3.7
Minimum 14.8 15.3 14.5 15.2 18
Maximum 18.8 19.2 21.4 23.4 28
Count 15 54 87 39 7
Confidence Level (95.0%) 0.63 0.24 0.27 0.46 3.42
Score 1 = very soft hand (desirable attribute), Score 5 = very harsh hand (undesirable attribute)
At Turretfield, 65% of sheep were given a hand score of three, whilst at Kirby 54% of
sheep received a hand score of two. It is clear that out of the three hand scoring sites,
IN01 (Kirby) had the finest average fibre diameter (16.1 μm) and it was judged to be
significantly softer than IN07 (Turretfield) and IN08 (Katanning) (P<0.001). IN01
98
(Kirby) also had a significantly higher curvature and poorer crimp character, but its
compression properties were not significantly different from the other two sites.
Interestingly, the average greasy hand scores and the average fibre curvature of
Turretfield and Katanning were not significantly different (P=0.23 and P=0.78
respectively) (Table 3-7), yet their average fibre diameters were 16.6 μm and 18.2 μm
respectively and their average RtC values were significantly different (P=0.03) (Table
3-8). On face value, comparison between Turretfield and Katanning would suggest that
greasy handle is not influenced by fibre diameter, which is contradictory to most of the
reported literature. However, it is possible that scorers, who did not have any
information on the average fibre diameter made available to them, used the crimp level
to indicate the wool quality (Duerden scale). The correlation between fibre diameter and
staple crimp frequency is low for superfine wool (around -0.2) (Madeley & Postle 1994;
Wilkins, Whiteley & Stanton 1981) and therefore selection based on traditional visual
assessment of crimp alone does not necessarily result in the selection of a wool that is
fine (Madeley & Postle 1994).
The correlation matrix for the key objective and visual traits for the hand assessed
animals (n=597) is provided in Table 3-10. The results show weak but significant
correlations between greasy hand and MFD, RtC and dust across the three hand scoring
INF sites. The correlations between greasy hand and the objective/visual traits were
calculated for the individual sites that scored for greasy hand (Table 3-11). MFD and
RtC were positively associated with greasy hand at all hand scoring sites. A simple plot
of mean fibre diameter against hand score confirmed the trend that as fibre diameter
increases, the hand of fibres becomes harsher (Figure 3-4). In the figure the solid
symbols indicate the average fibre diameter MFD for each hand score.
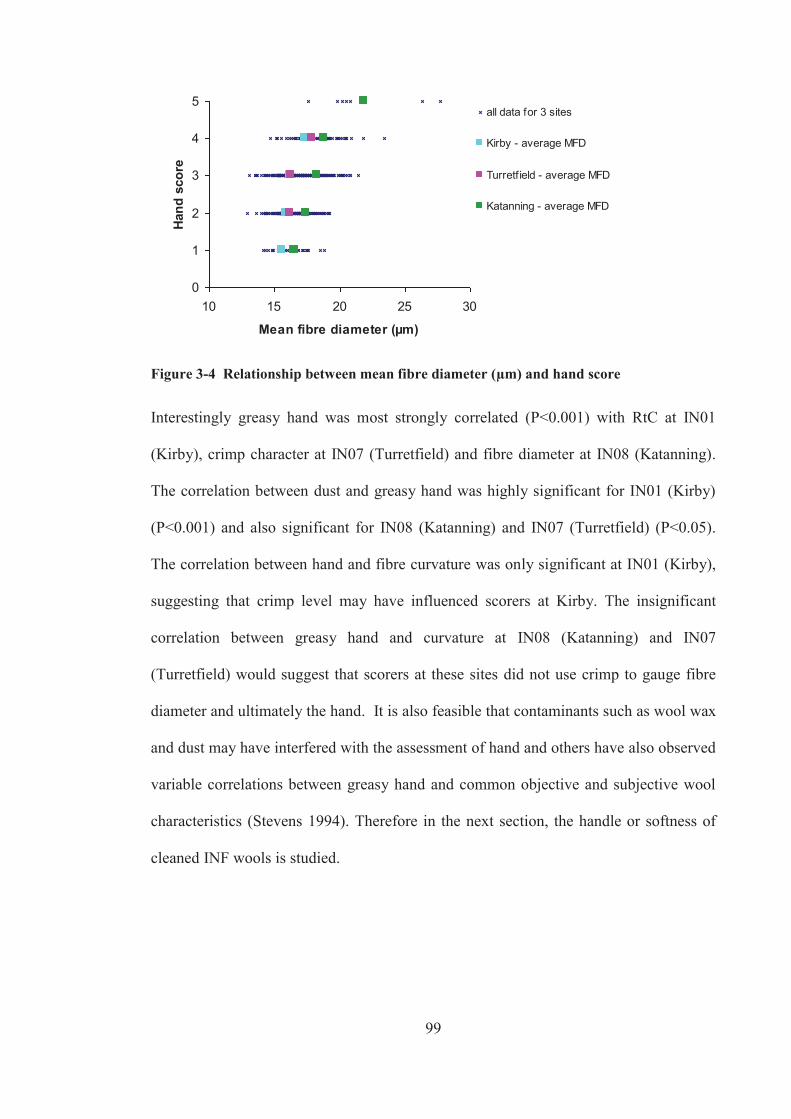
99
0
1
2
3
4
5
10 15 20 25 30
Mean fibre diameter (μm)
Hand
sco
re
all data for 3 sites
Kirby - average MFD
Turretf ield - average MFD
Katanning - average MFD
Figure 3-4 Relationship between mean fibre diameter (μm) and hand score
Interestingly greasy hand was most strongly correlated (P<0.001) with RtC at IN01
(Kirby), crimp character at IN07 (Turretfield) and fibre diameter at IN08 (Katanning).
The correlation between dust and greasy hand was highly significant for IN01 (Kirby)
(P<0.001) and also significant for IN08 (Katanning) and IN07 (Turretfield) (P<0.05).
The correlation between hand and fibre curvature was only significant at IN01 (Kirby),
suggesting that crimp level may have influenced scorers at Kirby. The insignificant
correlation between greasy hand and curvature at IN08 (Katanning) and IN07
(Turretfield) would suggest that scorers at these sites did not use crimp to gauge fibre
diameter and ultimately the hand. It is also feasible that contaminants such as wool wax
and dust may have interfered with the assessment of hand and others have also observed
variable correlations between greasy hand and common objective and subjective wool
characteristics (Stevens 1994). Therefore in the next section, the handle or softness of
cleaned INF wools is studied.
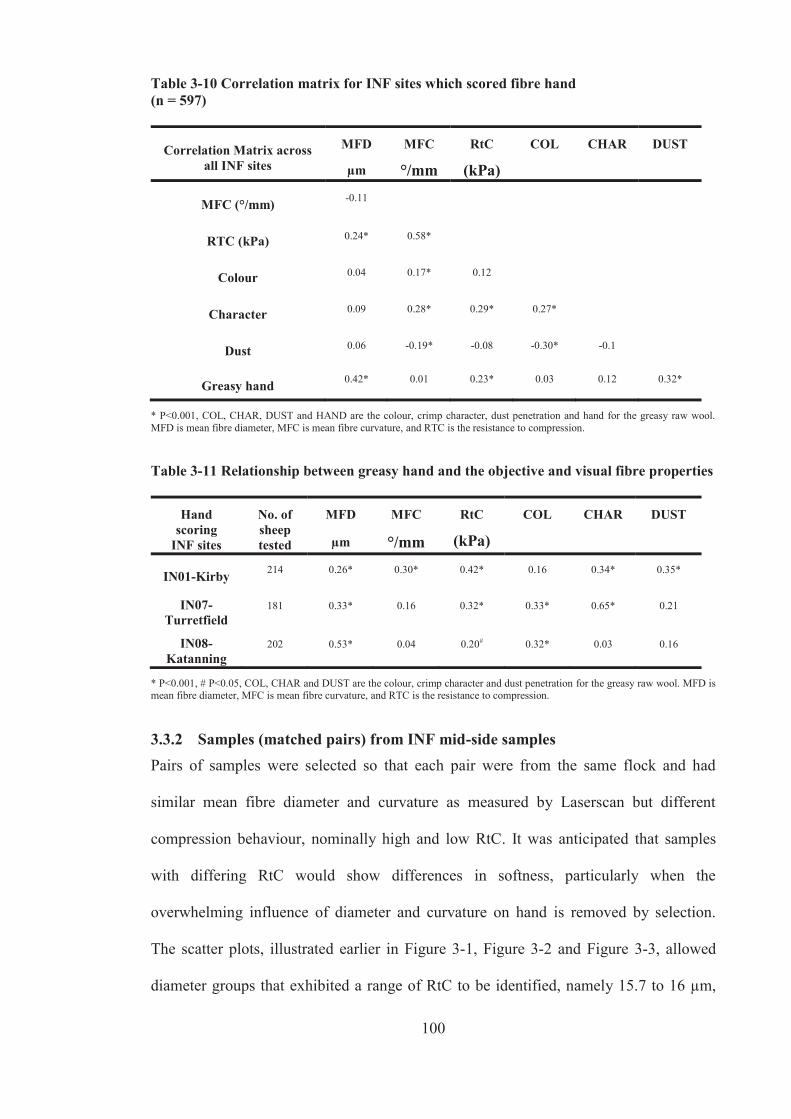
100
Table 3-10 Correlation matrix for INF sites which scored fibre hand (n = 597)
Correlation Matrix across all INF sites
MFD MFC RtC COL CHAR DUST
μm °/mm (kPa)
MFC (°/mm) -0.11
RTC (kPa) 0.24* 0.58*
Colour 0.04 0.17* 0.12
Character 0.09 0.28* 0.29* 0.27*
Dust 0.06 -0.19* -0.08 -0.30* -0.1
Greasy hand 0.42* 0.01 0.23* 0.03 0.12 0.32*
* P<0.001, COL, CHAR, DUST and HAND are the colour, crimp character, dust penetration and hand for the greasy raw wool. MFD is mean fibre diameter, MFC is mean fibre curvature, and RTC is the resistance to compression.
Table 3-11 Relationship between greasy hand and the objective and visual fibre properties
Hand scoring
INF sites
No. of sheep tested
MFD MFC RtC COL CHAR DUST
μm °/mm (kPa)
IN01-Kirby 214 0.26* 0.30* 0.42* 0.16 0.34* 0.35*
IN07- Turretfield
181 0.33* 0.16 0.32* 0.33* 0.65* 0.21
IN08-Katanning
202 0.53* 0.04 0.20# 0.32* 0.03 0.16
* P<0.001, # P<0.05, COL, CHAR and DUST are the colour, crimp character and dust penetration for the greasy raw wool. MFD is mean fibre diameter, MFC is mean fibre curvature, and RTC is the resistance to compression.
3.3.2 Samples (matched pairs) from INF mid-side samples Pairs of samples were selected so that each pair were from the same flock and had
similar mean fibre diameter and curvature as measured by Laserscan but different
compression behaviour, nominally high and low RtC. It was anticipated that samples
with differing RtC would show differences in softness, particularly when the
overwhelming influence of diameter and curvature on hand is removed by selection.
The scatter plots, illustrated earlier in Figure 3-1, Figure 3-2 and Figure 3-3, allowed
diameter groups that exhibited a range of RtC to be identified, namely 15.7 to 16 μm,
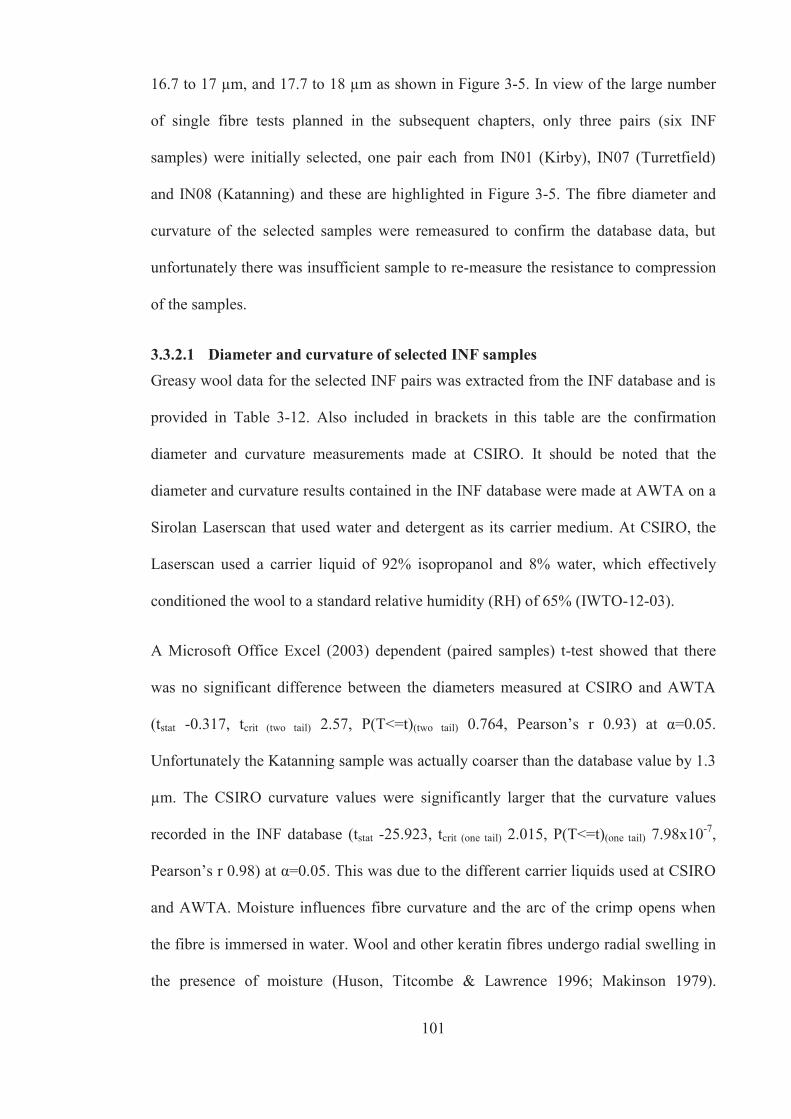
101
16.7 to 17 μm, and 17.7 to 18 μm as shown in Figure 3-5. In view of the large number
of single fibre tests planned in the subsequent chapters, only three pairs (six INF
samples) were initially selected, one pair each from IN01 (Kirby), IN07 (Turretfield)
and IN08 (Katanning) and these are highlighted in Figure 3-5. The fibre diameter and
curvature of the selected samples were remeasured to confirm the database data, but
unfortunately there was insufficient sample to re-measure the resistance to compression
of the samples.
3.3.2.1 Diameter and curvature of selected INF samples Greasy wool data for the selected INF pairs was extracted from the INF database and is
provided in Table 3-12. Also included in brackets in this table are the confirmation
diameter and curvature measurements made at CSIRO. It should be noted that the
diameter and curvature results contained in the INF database were made at AWTA on a
Sirolan Laserscan that used water and detergent as its carrier medium. At CSIRO, the
Laserscan used a carrier liquid of 92% isopropanol and 8% water, which effectively
conditioned the wool to a standard relative humidity (RH) of 65% (IWTO-12-03).
A Microsoft Office Excel (2003) dependent (paired samples) t-test showed that there
was no significant difference between the diameters measured at CSIRO and AWTA
(tstat -0.317, tcrit (two tail) 2.57, P(T<=t)(two tail) 0.764, Pearson’s r 0.93) at α=0.05.
Unfortunately the Katanning sample was actually coarser than the database value by 1.3
μm. The CSIRO curvature values were significantly larger that the curvature values
recorded in the INF database (tstat -25.923, tcrit (one tail) 2.015, P(T<=t)(one tail) 7.98x10⁻⁷,
Pearson’s r 0.98) at α=0.05. This was due to the different carrier liquids used at CSIRO
and AWTA. Moisture influences fibre curvature and the arc of the crimp opens when
the fibre is immersed in water. Wool and other keratin fibres undergo radial swelling in
the presence of moisture (Huson, Titcombe & Lawrence 1996; Makinson 1979).

102
Analogous to the bimetallic strip theory, the degree of curvature change is thought to
depend upon the diameter of the fibre, but it has also been suggested that the curvature
change in water is due to differential length changes in the cortical cells and the
proportions of ortho and para cortex (Baird 1963; Brown & Onions 1961).
Table 3-12 Properties of selected INF mid-side samples obtained from the CRC database (Data in brackets represent the CSIRO Laserscan MFD results)
INF site pairs
MFD CVD MFC RtC COL CHAR DUST HAND
μm % °/mm (kPa) Score Score Score Score
IN07- Turretfield
(low RtC)
15.8 24.1 65 7 1 1 3 3
(15.9) (23.1) (101)
IN07- Turretfield
(high RtC)
15.8 29.8 63 9 2 3 3 3
(15.2) (27.2) (102)
IN01- Kirby
(low RtC)
16.8 14.3 81 9 4 4 2 3
(16.7) 14.3) (119)
IN01- Kirby
(high RtC)
16.7 20.4 79 11 3 4 3 4
(16.7) 18.7) (116)
IN08-Katanning
(low RtC)
17.9 16.2 50 4 1 1 4 3
(19.2) (16.5) (95)
IN08-Katanning
(high RtC)
17.7 14.1 50 8 2 2 2 2
(17.5) (15.2) (94)
MFD is mean fibre diameter, CVD is the coefficient of variation of fibre diameter, MFC is mean fibre curvature, RTC is the resistance to compression, and COL, CHAR, DUST and HAND are the colour, crimp character, dust penetration and hand scores respectively for the greasy raw wool. Score 1 = desirable attribute, Score 5 = undesirable attribute.

103
3
5
7
9
11
13
30 40 50 60 70 80
RtC
(kPa
)
Fibre curvature (°/mm)
15.7 to 16 μm subset (n=107)
Turretfield
3
5
7
9
11
13
30 40 50 60 70 80 90
RtC
(kPa
)
Fibre curvature (°/mm)
17.7 to 18 μm subset (n=91)
Katanning
3
5
7
9
11
13
30 40 50 60 70 80 90
RtC
(kPa
)
Fibre curvature (°/mm)
16.7 to 17 μm subset (n=109) Kirby
Figure 3-5 Relationship between fibre curvature and RtC for the various diameter slices (Data points in red represent samples selected for testing)
3.3.2.2 Fibre diameter profiles of selected INF samples Fibre diameter profiles represent the response of the sheep to nutritional, physiological
and environmental demands, and large seasonal variation can occur (Hansford 1994;
Hansford, Emery & Teasdale 1985). Therefore, fibre diameter profiling was used on the

104
selected INF samples to establish whether the samples had any large variations in
diameter along their lengths. Figure 3-6 shows the profiles of the six selected INF mid-
side samples. Clearly there are no major diameter fluctuations for the selected INF mid-
side samples.
810
12141618
2022
0 10 20 30 40 50 60 70 80
Distance from tip (mm)
Fibr
e D
iam
eter
(μm
)
Katanning low RtC Katanning high RtC Kirby low RtCKirby high RtC Turretfield low RtC Turretfield high RtC
Figure 3-6 Diameter profiles of staples from selected INF mid-side samples
3.3.2.3 Subjective evaluation of the softness of selected INF samples Wool grease and dust could potentially influence subjective handle evaluations on the
animal (Shah & Whiteley 1971). Therefore samples were thoroughly cleaned prior to
testing their softness. The dichloromethane extraction removed the solvent extractable
wool wax and some of the dust from the wool sample, whilst the aqueous scour
removed the water soluble suint and dirt. The amount of solvent extractable matter and
dirt that was extracted from each sample was expressed as a percentage of the greasy
weight of the wool and the results are listed in Table 3-13. The samples from Turretfield
were the dustiest (Ave. 8% dust c.f. 5% for others). There was no significant correlation
between the dust removed and the on-farm subjective dust score. An example of the
Tip Base
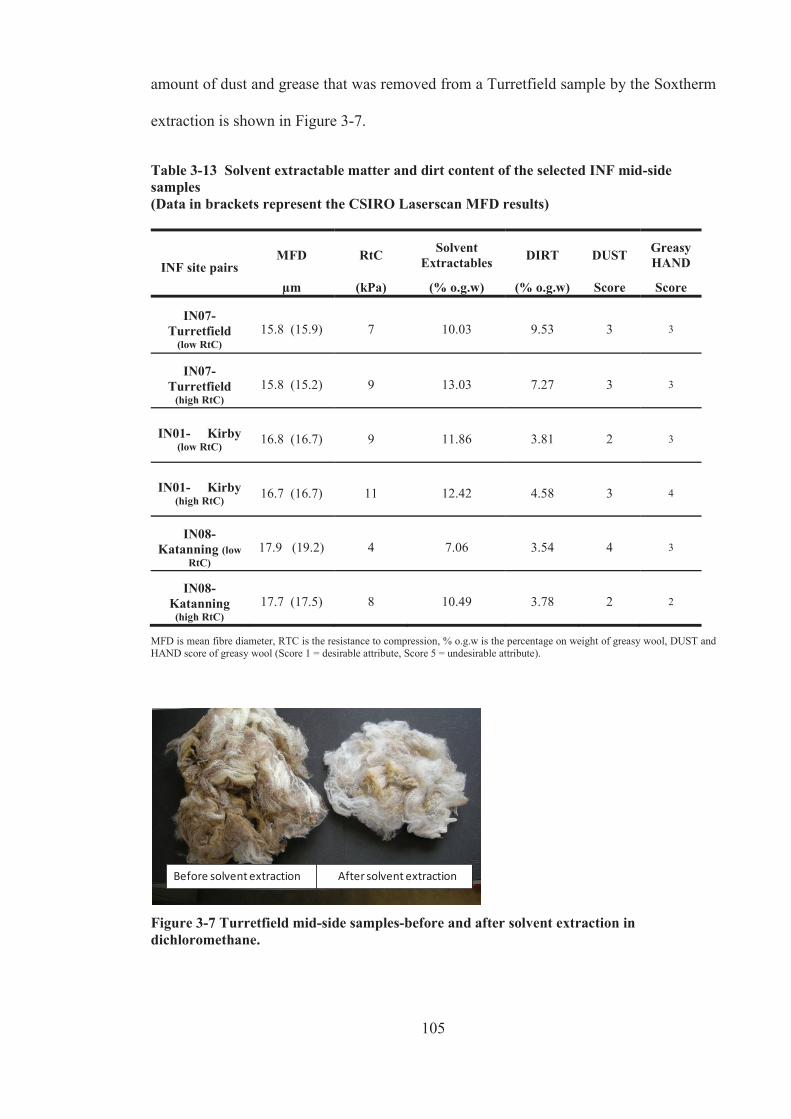
105
amount of dust and grease that was removed from a Turretfield sample by the Soxtherm
extraction is shown in Figure 3-7.
Table 3-13 Solvent extractable matter and dirt content of the selected INF mid-side samples (Data in brackets represent the CSIRO Laserscan MFD results)
INF site pairs MFD RtC Solvent
Extractables DIRT DUST GreasyHAND
μm (kPa) (% o.g.w) (% o.g.w) Score Score
IN07- Turretfield
(low RtC) 15.8 (15.9) 7 10.03 9.53 3 3
IN07- Turretfield
(high RtC) 15.8 (15.2) 9 13.03 7.27 3 3
IN01- Kirby (low RtC) 16.8 (16.7) 9 11.86 3.81 2 3
IN01- Kirby (high RtC) 16.7 (16.7) 11 12.42 4.58 3 4
IN08-Katanning (low
RtC) 17.9 (19.2) 4 7.06 3.54 4 3
IN08-Katanning
(high RtC) 17.7 (17.5) 8 10.49 3.78 2 2
MFD is mean fibre diameter, RTC is the resistance to compression, % o.g.w is the percentage on weight of greasy wool, DUST and HAND score of greasy wool (Score 1 = desirable attribute, Score 5 = undesirable attribute).
Before solvent extraction After solvent extraction
Figure 3-7 Turretfield mid-side samples-before and after solvent extraction in dichloromethane.
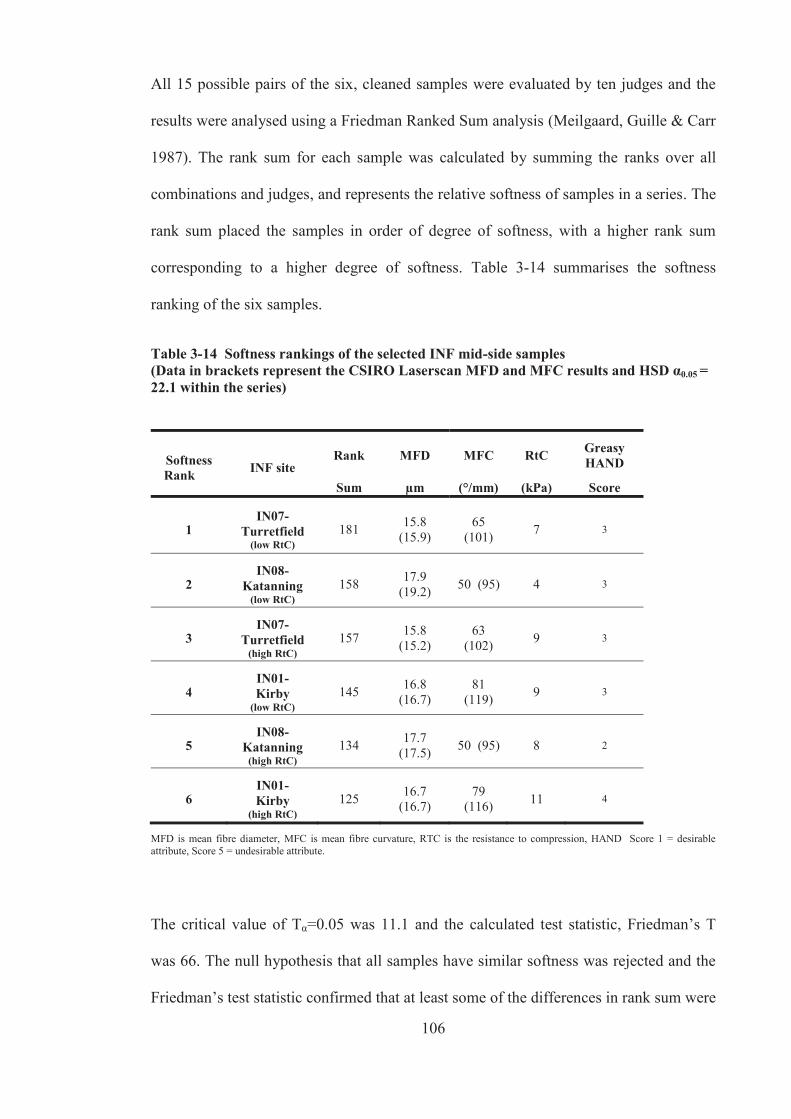
106
All 15 possible pairs of the six, cleaned samples were evaluated by ten judges and the
results were analysed using a Friedman Ranked Sum analysis (Meilgaard, Guille & Carr
1987). The rank sum for each sample was calculated by summing the ranks over all
combinations and judges, and represents the relative softness of samples in a series. The
rank sum placed the samples in order of degree of softness, with a higher rank sum
corresponding to a higher degree of softness. Table 3-14 summarises the softness
ranking of the six samples.
Table 3-14 Softness rankings of the selected INF mid-side samples (Data in brackets represent the CSIRO Laserscan MFD and MFC results and HSD α0.05 = 22.1 within the series)
Softness Rank INF site
Rank MFD MFC RtC Greasy HAND
Sum μm (°/mm) (kPa) Score
1 IN07-
Turretfield (low RtC)
181 15.8 (15.9)
65 (101) 7 3
2 IN08-
Katanning (low RtC)
158 17.9 (19.2) 50 (95) 4 3
3 IN07-
Turretfield (high RtC)
157 15.8 (15.2)
63 (102) 9 3
4 IN01- Kirby
(low RtC) 145 16.8
(16.7) 81
(119) 9 3
5 IN08-
Katanning (high RtC)
134 17.7 (17.5) 50 (95) 8 2
6 IN01- Kirby
(high RtC) 125 16.7
(16.7) 79
(116) 11 4
MFD is mean fibre diameter, MFC is mean fibre curvature, RTC is the resistance to compression, HAND Score 1 = desirable attribute, Score 5 = undesirable attribute.
The critical value of Tα=0.05 was 11.1 and the calculated test statistic, Friedman’s T
was 66. The null hypothesis that all samples have similar softness was rejected and the
Friedman’s test statistic confirmed that at least some of the differences in rank sum were

107
statistically significant. Tukey’s HSD (honestly significant difference) multiple
comparison procedure (Meilgaard, Guille & Carr 1987) was used to compare the rank
sums. The HSD α=0.05 was 22.1.
The difference in the rank sum of the two softest samples Turretfield-low RtC (rank
sum 181) and Katanning-low RtC (rank sum 158) was larger than the HSD. Hence the
Turretfield sample (rank sum 181) was significantly softer than Katanning and all other
samples.
Interestingly the Turretfield sample that was ranked the softest (softness rank 1) of the
solvent scoured wools did not have the softest hand score when assessed on farm in the
raw/greasy state. The dust content of this sample was high (Table 3-13) which may have
affected the greasy wool softness. Similarly, the Katanning sample with a greasy hand
score of 2 was judged to be harsher (softness rank 5) than most of the other samples
after the solvent cleaning process. The dust content of this sample was low, but in
comparison to the other Katanning sample, it had a high grease content which may have
affected the greasy hand assessment (Table 3-13). It was also noted that this Katanning
sample compacted easily and formed large clumps during the subjective testing of the
solvent cleaned sample. The lumpiness of the sample may have adversely affected the
subjective softness assessment. Should this trial be repeated, the suggestion is that a
fresh sample be used for each judge. The correlation between the greasy hand score and
the softness rank of the solvent cleaned samples was not significant (P=0.79).
3.3.2.4 Felt ball propensity of selected INF samples The Aachen felting test I.W.T.O-20-69(E) was developed to measure the feltability of
loose wool, particularly greasy wool before scouring. The test was used to check for any
undesirable felting that may occur in scouring and also for the evaluation of shrink-
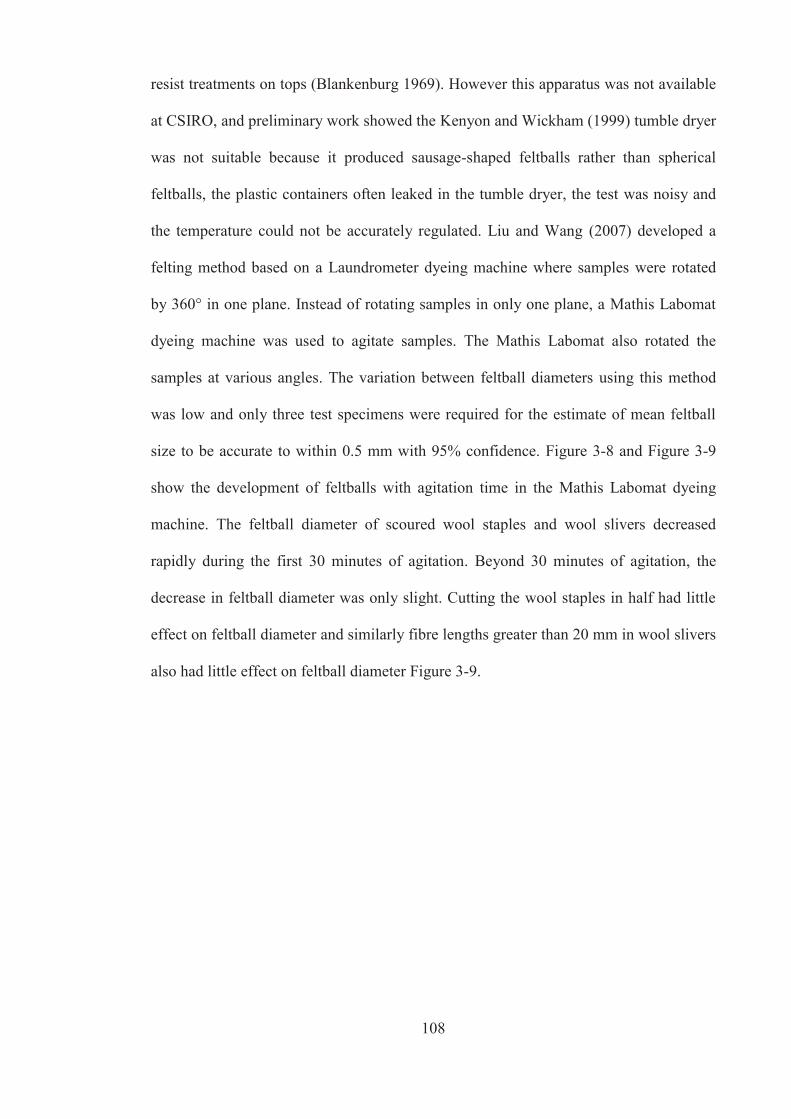
108
resist treatments on tops (Blankenburg 1969). However this apparatus was not available
at CSIRO, and preliminary work showed the Kenyon and Wickham (1999) tumble dryer
was not suitable because it produced sausage-shaped feltballs rather than spherical
feltballs, the plastic containers often leaked in the tumble dryer, the test was noisy and
the temperature could not be accurately regulated. Liu and Wang (2007) developed a
felting method based on a Laundrometer dyeing machine where samples were rotated
by 360° in one plane. Instead of rotating samples in only one plane, a Mathis Labomat
dyeing machine was used to agitate samples. The Mathis Labomat also rotated the
samples at various angles. The variation between feltball diameters using this method
was low and only three test specimens were required for the estimate of mean feltball
size to be accurate to within 0.5 mm with 95% confidence. Figure 3-8 and Figure 3-9
show the development of feltballs with agitation time in the Mathis Labomat dyeing
machine. The feltball diameter of scoured wool staples and wool slivers decreased
rapidly during the first 30 minutes of agitation. Beyond 30 minutes of agitation, the
decrease in feltball diameter was only slight. Cutting the wool staples in half had little
effect on feltball diameter and similarly fibre lengths greater than 20 mm in wool slivers
also had little effect on feltball diameter Figure 3-9.
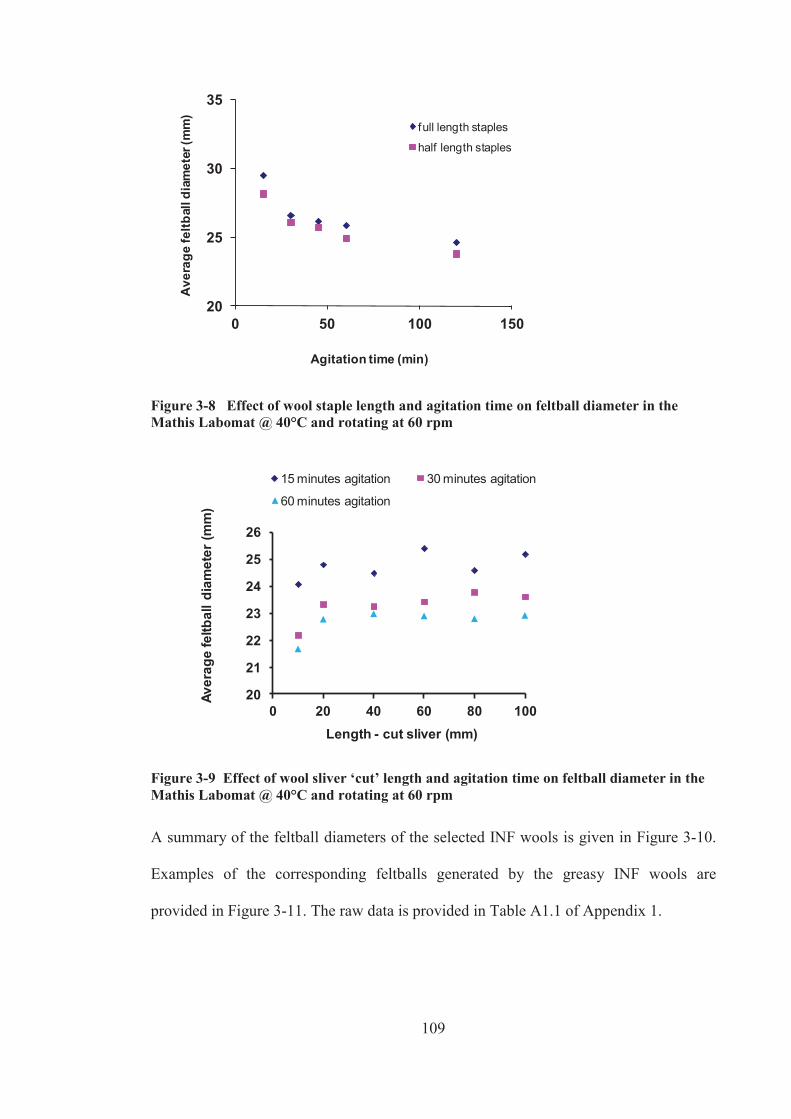
109
20
25
30
35
0 50 100 150
Ave
rage
feltb
all d
iam
eter
(mm
)
Agitation time (min)
full length staples
half length staples
Figure 3-8 Effect of wool staple length and agitation time on feltball diameter in the Mathis Labomat @ 40°C and rotating at 60 rpm
20
21
22
23
24
25
26
0 20 40 60 80 100
Aver
age
feltb
all d
iam
eter
(mm
)
Length - cut sliver (mm)
15 minutes agitation 30 minutes agitation
60 minutes agitation
Figure 3-9 Effect of wool sliver ‘cut’ length and agitation time on feltball diameter in the Mathis Labomat @ 40°C and rotating at 60 rpm
A summary of the feltball diameters of the selected INF wools is given in Figure 3-10.
Examples of the corresponding feltballs generated by the greasy INF wools are
provided in Figure 3-11. The raw data is provided in Table A1.1 of Appendix 1.

110
2022242628303234
RtC
715
.9 μ
m
101°
/mm
RtC
915
.2 μ
m
102°
/mm
RtC
916
.7 μ
m
119°
/mm
RtC
1116
.7 μ
m
116°
/mm
RtC
419
.2 μ
m
94°/m
m
RtC
817
.4 μ
m
90°/m
m
15.8 μm 65°/mm
Turretfield
16.8 μm 80°/mm
Kirby
17.8 μm 50°/mm
Katanning
Feltb
all d
iam
eter
(mm
)
Figure 3-10 Average feltball diameter of selected INF samples tested in a Mathis Labomat @ 40°C and rotating at 60 rpm (error bar ± 95% confidence interval)
Figure 3-11 Feltballs formed by the INF samples (largest on the left to smallest on the right - see Figure 3-10 for legend)
Analysis of variance (single factor Anova, Excel) was used to test the hypothesis that
varying INF fibre type had no effect on the feltball diameter (mean feltball diameters
are equal for the fibre types). The Anova output data provided in Table 3-15 showed
that the null hypothesis is rejected (P<0.05) in favour of the alternative hypothesis that
varying INF fibre type did have an effect on mean feltball diameters and not all feltball
diameters are equal.
A B C D E F
A B D C E F

111
Table 3-15 Effect of INF fibre type on felt ball diameter (Anova α=0.05)
Source of Variation SS df MS F P-value F crit
Between groups 40.700 5 8.140 25.647 5.135E-06 3.106
Within groups 3.809 12 0.317
Total 44.508 17
An Excel t-test (two-sample with equal variance) was used to test the null hypothesis
that the mean feltball diameters of the two Katanning samples were the same, Table
3-16. The analysis shows that the null hypothesis is rejected and it is 95% certain that
the two Katanning samples have different mean felt ball diameters (P<0.05).
Table 3-16 Inference about the feltball diameter of the Katanning INF samples (α=0.05)
Source of Variation Katanning RtC 4 Katanning RtC 8
Mean 26.37 24.69 Variance 0.15 0.07
Observations 3 3 Pooled Variance 0.11
Hypothesized mean difference 0 Df 4
t stat 6.150 P(T<=t) one tail 0.002 t Critical one tail 2.132 P(T<=t) two tail 0.004 t Critical two tail 2.776
It is clear that the felting propensity of one sample from Katanning (sample F) was
significantly greater than all other samples (P<0.05) and this sample formed the smallest
felt ball as illustrated by the felt ball on the far right of Figure 3-11. This INF sample
had the lowest fibre curvature (90°/mm - CSIRO), a fine fibre diameter, but a high RtC
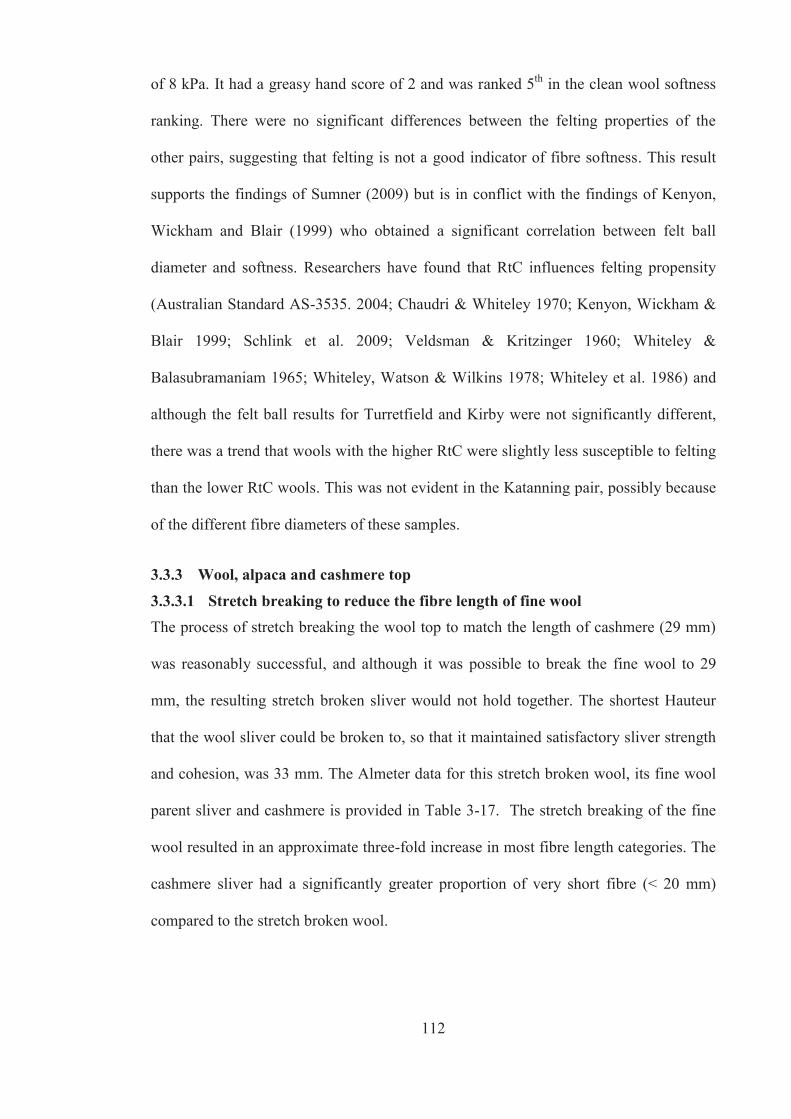
112
of 8 kPa. It had a greasy hand score of 2 and was ranked 5th in the clean wool softness
ranking. There were no significant differences between the felting properties of the
other pairs, suggesting that felting is not a good indicator of fibre softness. This result
supports the findings of Sumner (2009) but is in conflict with the findings of Kenyon,
Wickham and Blair (1999) who obtained a significant correlation between felt ball
diameter and softness. Researchers have found that RtC influences felting propensity
(Australian Standard AS-3535. 2004; Chaudri & Whiteley 1970; Kenyon, Wickham &
Blair 1999; Schlink et al. 2009; Veldsman & Kritzinger 1960; Whiteley &
Balasubramaniam 1965; Whiteley, Watson & Wilkins 1978; Whiteley et al. 1986) and
although the felt ball results for Turretfield and Kirby were not significantly different,
there was a trend that wools with the higher RtC were slightly less susceptible to felting
than the lower RtC wools. This was not evident in the Katanning pair, possibly because
of the different fibre diameters of these samples.
3.3.3 Wool, alpaca and cashmere top
3.3.3.1 Stretch breaking to reduce the fibre length of fine wool The process of stretch breaking the wool top to match the length of cashmere (29 mm)
was reasonably successful, and although it was possible to break the fine wool to 29
mm, the resulting stretch broken sliver would not hold together. The shortest Hauteur
that the wool sliver could be broken to, so that it maintained satisfactory sliver strength
and cohesion, was 33 mm. The Almeter data for this stretch broken wool, its fine wool
parent sliver and cashmere is provided in Table 3-17. The stretch breaking of the fine
wool resulted in an approximate three-fold increase in most fibre length categories. The
cashmere sliver had a significantly greater proportion of very short fibre (< 20 mm)
compared to the stretch broken wool.

113
Table 3-17 Almeter fibre lengths (<50 mm) in cashmere, wool and stretch broken wool
Hauteur CVH
% Fibres less than
< 10 < 15 < 20 < 30 < 40 < 50
Mm % mm mm mm mm mm mm
Cashmere 29.3 59.5 13.0 23.9 36.9 58.6 75.3 86.6
Fine wool (parent) 57.6 39.1 0.0 1.7 4.1 13.8 25.2 38.4
Stretch broken
fine wool 33.3 34.1 0.3 5.3 13.9 40.9 70.5 92.6
3.3.3.2 Top dyeing to permanently reduce the fibre curvature of coarse wool Wool tops were top dyed in an attempt to permanently set a reduced fibre curvature into
the wool. The effectiveness of this dyeing process on permanently setting the top fibre’s
curvature was tested by measuring the fibre curvature before and after dyeing and after
the fibres were relaxed by steaming on an open Hoffman press. The results presented in
Table 3-18 show that top dyeing only reduced the overall fibre curvature by 5%. The
curvature recovered during steam relaxation was 14% for the ecru and 6% top dyed
wool.

114
Table 3-18 Changes in fibre properties as a result of setting fibres during top dyeing
Ecru fibre Dyed fibre
MFD CVD MFC MFD CVD MFC
μm % °/mm μm % °/mm
Before steam relax
26.9 22.7 66
27.0 22.8 67
After steam relax
26.8 22.5 75
26.8 22.8 71
MFD is mean fibre diameter, CVD is the coefficient of variation of fibre diameter, and MFC is mean fibre curvature
3.3.3.3 Fibre diameter and curvature of wool and specialty fibre tops The results for the fibre properties of the tops measured at CSIRO and AWTA are given
in Table 3-19. The fibre diameter and CVD (coefficient of variation of mean fibre
diameter) measurements made at CSIRO and AWTA were not significantly different
(P>0.05), however the curvature measurements (MFC) were significantly different
(P<0.05). The CSIRO curvature values were much larger than the AWTA curvature
values and were due to the different carrier liquids used in the two Laserscans as
discussed in 3.3.2.1.
The mean fibre diameters of the fine wool top and cashmere top were well matched and
not significantly different from one another (P>0.05). However the coarse wool and top
dyed wool diameters were significantly larger than the alpaca diameter (P<0.05), hence
the tops were not well matched in terms of fibre diameter. The coefficient of variation
of fibre diameter (CVD) obtained for the cashmere and alpaca tops was slightly larger
than values previously reported in the literature (McGregor & Postle 2004; Wang,
Wang & Liu 2003). As expected, the comfort factor of the coarse group of fibres was
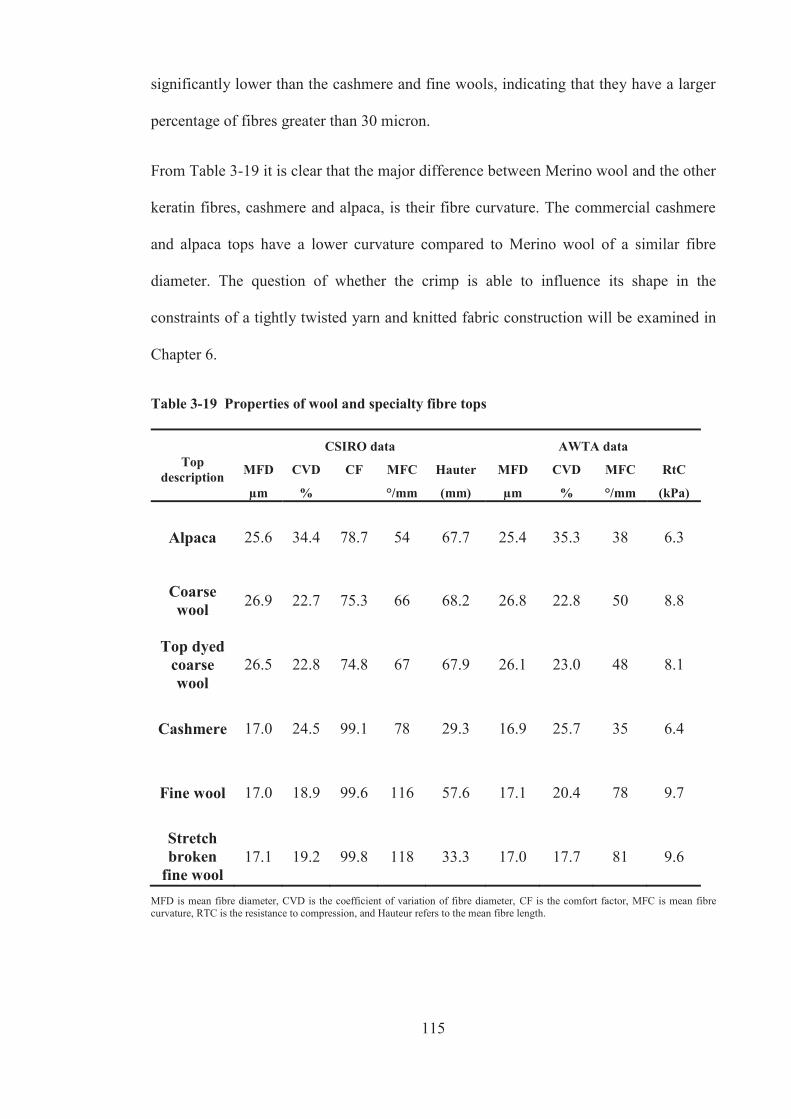
115
significantly lower than the cashmere and fine wools, indicating that they have a larger
percentage of fibres greater than 30 micron.
From Table 3-19 it is clear that the major difference between Merino wool and the other
keratin fibres, cashmere and alpaca, is their fibre curvature. The commercial cashmere
and alpaca tops have a lower curvature compared to Merino wool of a similar fibre
diameter. The question of whether the crimp is able to influence its shape in the
constraints of a tightly twisted yarn and knitted fabric construction will be examined in
Chapter 6.
Table 3-19 Properties of wool and specialty fibre tops
Top description
CSIRO data AWTA data
MFD CVD CF MFC Hauter MFD CVD MFC RtC
μm % °/mm (mm) μm % °/mm (kPa)
Alpaca 25.6 34.4 78.7 54 67.7 25.4 35.3 38 6.3
Coarse wool 26.9 22.7 75.3 66 68.2 26.8 22.8 50 8.8
Top dyed coarse wool
26.5 22.8 74.8 67 67.9 26.1 23.0 48 8.1
Cashmere 17.0 24.5 99.1 78 29.3 16.9 25.7 35 6.4
Fine wool 17.0 18.9 99.6 116 57.6 17.1 20.4 78 9.7
Stretch broken
fine wool 17.1 19.2 99.8 118 33.3 17.0 17.7 81 9.6
MFD is mean fibre diameter, CVD is the coefficient of variation of fibre diameter, CF is the comfort factor, MFC is mean fibre curvature, RTC is the resistance to compression, and Hauteur refers to the mean fibre length.

116
3.3.3.4 Resistance to compression (RtC) of tops It was not possible to establish the significance of the differences in RtC because
AWTA only provided the average for each sample. The results in Table 3-19 show a
low RtC for cashmere and alpaca compared to wool and this is consistent with the
findings of others (Liu, Wang & Wang 2004a; Madeley 1994; Teasdale et al. 1985).
The stretch broken sliver had a similar compression property to its parent fibre.
3.3.3.5 Subjective evaluation of the softness of tops All 15 possible pairs of the six top samples were evaluated by ten judges and the results
were analysed using a Friedman Ranked Sum analysis (Meilgaard, Guille & Carr 1987)
as described in 3.3.2.3. The rank sum for each sample was calculated by summing the
ranks over all combinations and judges and represents the relative softness of samples in
a series. The rank sum placed the samples in order of degree of softness, with a higher
rank sum corresponding to a higher degree of softness. Table 3-20 summarises the
softness ranking of the six top samples. The critical value of Tα=0.05 was 11.1 and the
calculated test statistic, Friedman’s T was 199. The null hypothesis that all samples had
similar softness was rejected and the Friedman’s test statistic confirmed that at least
some of the differences in rank sum were statistically significant. Tukey’s HSD
(honestly significant difference) multiple comparison procedure (Meilgaard, Guille &
Carr 1987) was used to compare the rank sums. The HSD α=0.05 was 22.1. Cashmere
was significantly softer than the other fibres. During the subjective testing some judges
commented on the apparent smoothness or silkiness of the alpaca fibre and related this
feeling to being soft. Some others associated softness with loftiness. Clearly individuals
have different expectations of ‘soft’, but regardless of their definition of softness,
cashmere top was judged to be significantly softer than all other top samples.
Interestingly, alpaca top was found to be significantly softer than wool of an equivalent
diameter (26 μm). The softness of the alpaca top was not significantly different from the

117
softness of the 17 μm fine wool and this supports the findings of Liu, Wang and Wang
(2004b) who suggested that alpaca fibre could have the same softness as wool that is up
to 12 μm finer.
Table 3-20 Softness ranking of wool and specialty fibre tops (HSD α 0,05 = 22.1)
Softness Rank INF site Rank Sum
1 (softest) Cashmere 198
2 Fine wool 166
3 Stretch broken fine wool 160
4 Alpaca 156
5 Coarse wool 116
6 (least soft) Top dyed coarse wool 104
The relationship between resistance to compression (RtC) of wool tops and their
softness rank is illustrated in Figure 3-12 and shows that the softness rank sum (the
larger, the softer) increased with resistance to compression. Low RtC wools are
generally considered to be softer than higher RtC wools (Madeley, Mahar & Postle
1995), but these results in Figure 3-12 support the findings of Liu, Wang and Wang
(2004a) that suggest RtC is a poor indicator of fibre softness, particularly for wool
fibres of varying diameters. Here the fine (17 μm) wool tops had higher resistance to
compression than the coarse (26 μm) wool tops, but the fine wool tops were judged as
being softer.
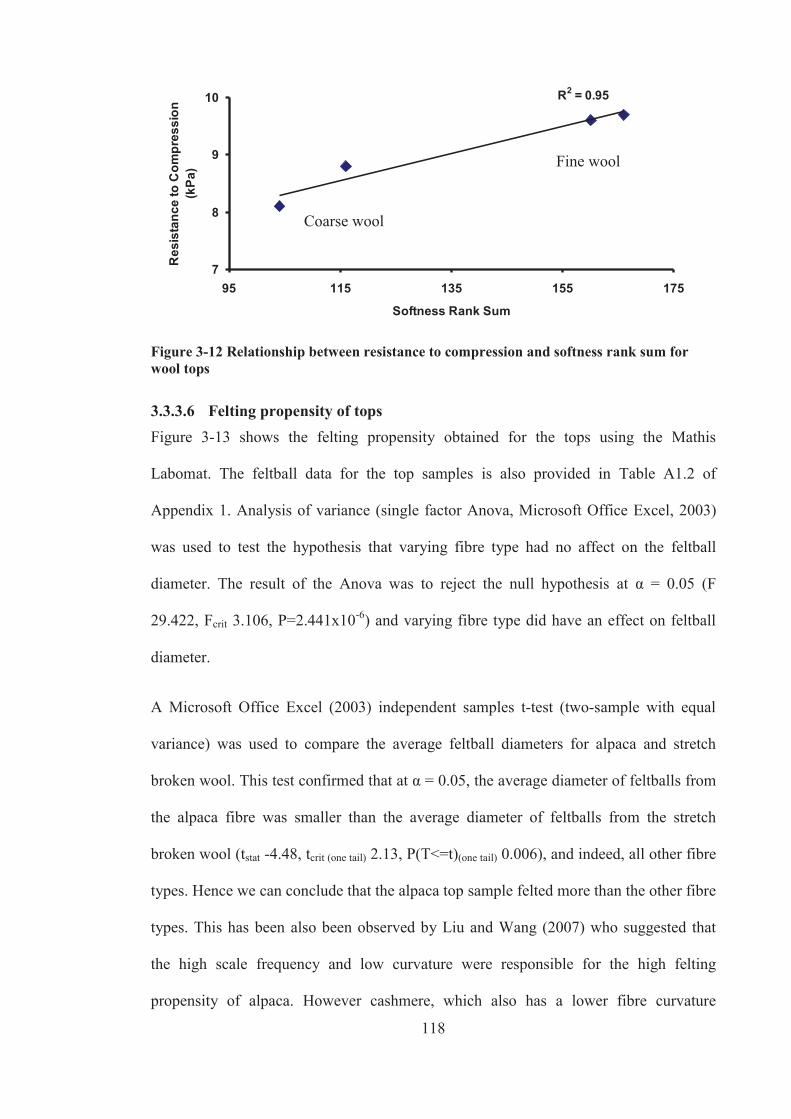
118
R2 = 0.95
7
8
9
10
95 115 135 155 175
Softness Rank Sum
Res
ista
nce
to C
ompr
essi
on
(kPa
)
Figure 3-12 Relationship between resistance to compression and softness rank sum for wool tops
3.3.3.6 Felting propensity of tops Figure 3-13 shows the felting propensity obtained for the tops using the Mathis
Labomat. The feltball data for the top samples is also provided in Table A1.2 of
Appendix 1. Analysis of variance (single factor Anova, Microsoft Office Excel, 2003)
was used to test the hypothesis that varying fibre type had no affect on the feltball
diameter. The result of the Anova was to reject the null hypothesis at α = 0.05 (F
29.422, Fcrit 3.106, P=2.441x10⁻⁶) and varying fibre type did have an effect on feltball
diameter.
A Microsoft Office Excel (2003) independent samples t-test (two-sample with equal
variance) was used to compare the average feltball diameters for alpaca and stretch
broken wool. This test confirmed that at α = 0.05, the average diameter of feltballs from
the alpaca fibre was smaller than the average diameter of feltballs from the stretch
broken wool (tstat -4.48, tcrit (one tail) 2.13, P(T<=t)(one tail) 0.006), and indeed, all other fibre
types. Hence we can conclude that the alpaca top sample felted more than the other fibre
types. This has been also been observed by Liu and Wang (2007) who suggested that
the high scale frequency and low curvature were responsible for the high felting
propensity of alpaca. However cashmere, which also has a lower fibre curvature
Coarse wool
Fine wool

119
compared to wool and similar compression properties to alpaca, did not felt as readily as
alpaca. This result suggests that another parameter other than curvature has a greater
influence on feltability.
Cashmere top was judged to be significantly softer than all the other top samples, yet its
felt ball diameter was not significantly different to the other fibres except for alpaca.
Hence the results of the present study support the findings in 3.3.2.3 that felt ball
diameter cannot be used as a measure of fibre softness.
We thought it would be worthwhile to understand how wool and alpaca felt balls
develop with felting time and measured a felt ball diameter every fifteen minutes during
the felting process. The results illustrated in Figure 3-14 show that alpaca felts more
rapidly than wool so that after 30 minutes it has formed a smaller felt ball, however
after 60 minutes of agitation the felt ball sizes of alpaca and wool are not significantly
different.
151820232528
Coa
rse
woo
l
Coa
rse
dyed
woo
l
Alp
aca
Cas
hmer
e
Fine
woo
l
Stre
tch
brok
enfin
e w
oolFe
lt ba
ll di
amet
er (m
m)
Figure 3-13 Feltball diameter of top samples after 30 minutes of agitation (Error bar ±95% confidence interval)

120
1517192123252729
0 10 20 30 40 50 60Agitation time (min)
Feltb
all d
iam
eter
(mm
)
Wool (26 μm)
Alpaca (26 μm)
Figure 3-14 Rate of felt ball formation in 26 μm wool and alpaca (±95% confidence interval)
Further tests on the mechanical properties of these fibres in water and also the influence
of medullation on felting are required to understand why alpaca felts more rapidly with
this felt ball test method. However these tests are beyond the scope of this thesis.
3.4 Conclusion
In total 1265 data records from the 2008 shearing of the 2007 Information Nucleus
Flock merino drop were analysed to establish the relationships that existed between
RtC, diameter, curvature and greasy handle.
Firstly the fibre diameter, curvature and resistance to compression properties of the INF
Merino flocks are in agreement to those reported recently for a super fine merino flock.
This indicates that the Information Nucleus flocks are typical of the Australian sheep
population.
Across all INF flocks there was a weak but significant negative relationship between
fibre diameter and fibre curvature. Fibre diameter and fibre curvature make positive
contributions to the resistance to compression values of the INF Merino flocks. The

121
influence of fibre curvature on resistance to compression is the more important of the
two.
Both fibre diameter and resistance to compression were positively associated with
greasy hand at all hand scoring sites, suggesting that RtC may be used as an indicator of
softness in greasy fine Merino.
The strong negative correlations obtained between fibre diameter and resistance to
compression and fibre curvature, which were observed by some researchers, were not
evident in the wool from the Information Nucleus Merino flock. Incorporating a range
of different wool types from different breeds of sheep may result in different
relationships between these objective parameters.
When the effects of fibre diameter, curvature and interference from contaminants such
as grease and dirt are removed by scouring, significant differences in the loose wool
softness were detected. Within the matched pairs, wools with lower resistance to
compression were significantly softer than wools with higher resistance to compression.
Judges perceived cashmere fibre (17 μm) to be significantly softer than all of the other
fibres tested including the 17 μm fine wool top. Judges also found alpaca fibre (26 μm)
to be significantly softer than 26 μm wool. The softness of alpaca fibre could not be
distinguished from the softness to the fine Merino wool (17 μm).
There were no significant differences in the felting properties for the majority of the
INF samples even though they differed significantly in their clean wool softness. This
result supports Sumner’s (2009) suggestion that felting is not likely to be a good
indicator of fibre softness. Alpaca felted significantly more than the other fibres in the
Labomat felting test. There was no significant difference in the felting behaviour of
wool and cashmere even though the cashmere fibre was significantly softer than the

122
wool samples. These results also confirm that felt ball diameter is not a good indicator
of fibre softness.

123
CHAPTER 4 CHARACTERISATION OF THE PHYSICAL PROPERTIES OF WOOL, CASHMERE AND ALPACA FIBRES
4.1 Introduction
The mechanical properties of fibres describe the responses of fibres to applied forces.
Speciality hair fibres and wool fibres from different breeds of sheep, and even fibres
from the same sheep show variations in their mechanical properties (Behera &
Shakyawar 2003; Carter, Onions & Pitts 1969; Collins & Chaikin 1971; Dusenbury &
Wakelin 1958; Evans 1954; Kawabata et al. 1995; Khayatt & Chamberlain 1948;
O'Connell & Lundgren 1954; O'Connell & Yeiser 1954; Rao & Gupta 1991; Shah &
Whiteley 1966,1971; Watson & Martin 1966).
Although these mechanical properties are important in processing and to the properties
of the final product (Kawabata, Niwa & Yamashita 2002; Morton & Hearle 1993;
Warner 1995) there have only been a few studies that have examined the relationship
between the elastic or Young’s modulus of fibres and their handle (Roberts 1956; Shah
& Whiteley 1971; Wortmann & Schwann-Jonczyk 2006; Yu & Liu 2006). The Young’s
modulus describes a materials tendency to deform elastically when a force is applied to
it and Roberts (1956) and Shah and Whiteley (1971) were unable to find a significant
relationship between hand and the tensile and bending moduli respectively. Although
the bending rigidity of a fibre is believed to dominate fibre softness (Morton & Hearle
1993; Warner 1995), Yu and Liu (2006) have recently shown that alpaca has a larger
bending modulus and bending rigidity than wool, yet alpaca is considered to be softer
than wool. They concluded that the softness of alpaca is due to its smooth surface and
low friction rather than it’s bending properties. Wortmann and Schwann-Jonczyk (2006)
also speculated that lower friction in the tip region of human hair could outweigh the

124
contribution of bending rigidity on the softness of coarser hair fibres and result in an
improved handle.
The greatest torsional stress occurs at the fibre periphery (Persaud & Kamath 2004) and
therefore can provide valuable information about the fibre’s cuticle. Torsional
measurements are sensitive and can distinguish between treatments that reinforce the
cuticle from those that affect the cortex, whilst standard tensile tests often can’t
distinguish between these treatments (Harper & Kamath 2007; Kawabata et al. 1995;
Persaud & Kamath 2004). Kawabata et al. (1995) obtained shear moduli for wool
ranging between 1.11 and 1.53 GPa and an extremely low shear modulus of 0.25 GPa
for 16 μm cashmere. Using a torsional pendulum, Persaud and Kamath (2004) obtained
shear moduli between 4.5 and 5 GPa for untreated hair. Also using the torsional
pendulum, Harper and Kamath (2007) obtained a much lower shear modulus for
untreated hair of around 1 GPa. Values for the shear moduli of alpaca fibre could not be
found in the literature.
Subjective appraisal of the softness of INF wool fibre and speciality fibre tops in
chapter 3 showed that differences in perceived softness did exist between fibres. In this
chapter the Young’s tensile modulus of fibres from the INF fleece samples and the
specialty tops are studied to determine whether the differences in their softness can be
explained by differences in their Young’s moduli. Wortmann and Schwann-Jonczyk
(2006) assumed that fibres bend preferentially around their minor elliptic axis and used
the Young’s tensile modulus, in conjunction with fibre’s ellipticity, to estimate the
bending stiffness of the fibres. They measured the fibre diameter on an OFDA and
reasoned, since the short fibre segments were lying flat on a glass slide, that this
diameter value could reasonably be assumed to represent the long axis of an ellipse. It is
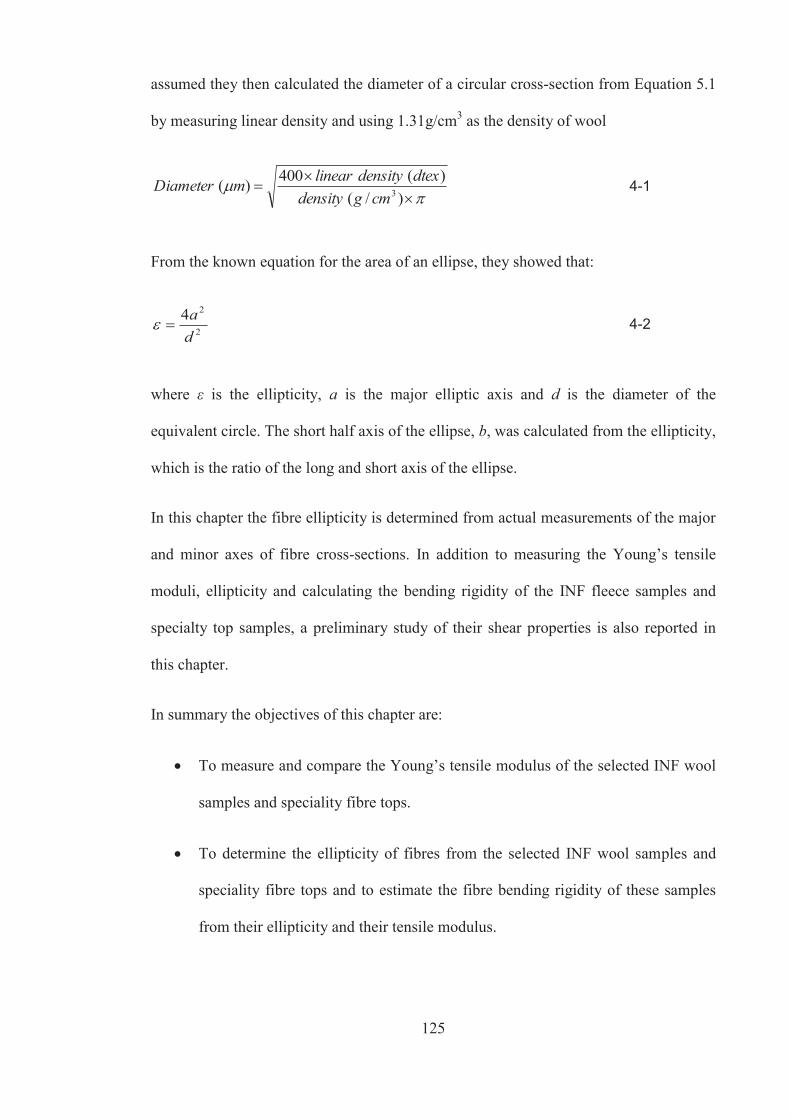
125
assumed they then calculated the diameter of a circular cross-section from Equation 5.1
by measuring linear density and using 1.31g/cm3 as the density of wool
)/()(400)( 3cmgdensity
dtexdensitylinearmDiameter 4-1
From the known equation for the area of an ellipse, they showed that:
2
24da 4-2
where ε is the ellipticity, a is the major elliptic axis and d is the diameter of the
equivalent circle. The short half axis of the ellipse, b, was calculated from the ellipticity,
which is the ratio of the long and short axis of the ellipse.
In this chapter the fibre ellipticity is determined from actual measurements of the major
and minor axes of fibre cross-sections. In addition to measuring the Young’s tensile
moduli, ellipticity and calculating the bending rigidity of the INF fleece samples and
specialty top samples, a preliminary study of their shear properties is also reported in
this chapter.
In summary the objectives of this chapter are:
To measure and compare the Young’s tensile modulus of the selected INF wool
samples and speciality fibre tops.
To determine the ellipticity of fibres from the selected INF wool samples and
speciality fibre tops and to estimate the fibre bending rigidity of these samples
from their ellipticity and their tensile modulus.

126
To obtain data on the shear modulus of the selected INF wool samples and
speciality fibre tops.
4.2 Materials and methods
4.2.1 Fibres from INF greasy mid-side samples (matched pairs) Three staples were randomly chosen from each of the six, INF mid-side samples
selected in Chapter 3. The greasy staples were cleaned by a gentle, four bath aqueous
scour. Fresh baths, all set at 65°C, were used for each sample. The first three baths
contained 0.05 % w/v, 0.05 % w/v and 0.025% w/v of a non-ionic detergent, Lissapol
TN450 (ICI) respectively. The final bath was a rinsing bath containing reverse osmosis
water (RO). Staples were immersed in each bath for one minute and a gentle up and
down motion was used to scour each securely held staple. The fibres were allowed to
dry overnight in a conditioned laboratory where the standard atmosphere was
maintained at 20 ± 2°C and 65 ± 2% relative humidity (RH).
4.2.2 Fibre samples from wool, alpaca and cashmere tops A Peyer texLab AL100 Almeter was used to generate fibre beards from each top.
Fibres, with lengths approximating the mean fibre length, were extracted from the
beards and the fibres were relaxed for 30 minutes in water containing 0.05% w/v of the
non-ionic detergent Lissapol TN450 (ICI). This relaxation removes any cohesive set
and processing oils that may have been imparted to the fibres during processing to top.
After rinsing in deionised water, the fibres were allowed to dry overnight in a standard
atmosphere (20°C, 65% RH).
4.2.3 Single fibre tensile testing At least 50 single fibres were selected for tensile testing from each of the scoured INF
samples and the mean fibre length top samples. For the INF samples, 51 single fibres
were tested (17 fibres per staple). A Vibroscope (Lenzing AG) was used to measure the

127
linear density of the selected fibres before tensile testing. The density of wool, cashmere
and alpaca was taken as 1.31 g/cm3 (Czaplicki 2012; Herrmann & Wortmann 1997;
Morton & Hearle 1993) and the fibre linear density was converted to a diameter (μm)
by assuming the cross-section was circular (Equation 4-1).
Each fibre was mounted on to an individual mounting frame that was cut from an
overhead transparency. The mounting frame had a 20 mm window (gauge length) and
each fibre was mounted such that its middle section was exposed in the 20 mm window
of the mounting frame. This ensured that weathered tips were not mounted in the testing
zone. The fibre was tensioned with a 200mg weight to remove the crimp from the fibre
before it was permanently anchored to the mounting frame with an epoxy adhesive
(Araldite, Selley’s Pty Limited). Physical aging affects the tensile properties of wool
fibres, the modulus increasing logarithmically with time after de-ageing treatments such
as wetting (Huson 1993; Struik 1978). In order to avoid ageing effects, the scoured
wool fibres were conditioned at 65% relative humidity and 20°C for seven to ten days
prior to carrying out tensile testing. Under these conditions the tensile properties are
relatively stable in the time frame of the experiment. Tensile testing was conducted in
standard atmospheric conditions (20 °C and 65 % RH) according to the (ASTM D
3822-07 Test Method. 2007). Tensile tests were carried out on an Instron Tensile Tester
(model 4500) fitted with a 2.5N load cell and pneumatic jaws and the load-displacement
data was collected using Series IX Automated Materials Testing System software
(Version 8.10.00). After clamping, the mounting frames were cut to release the fibres
and the crosshead was adjusted to give about 1 mm of slack, to ensure that the whole
force extension curve was captured. The fibres were extended at a cross-head speed of 5
mm/min (strain rate of 25%/min) till they broke. The advantage of using mounting
frames is that it allowed the complementary broken fibre ends to be easily retrieved at
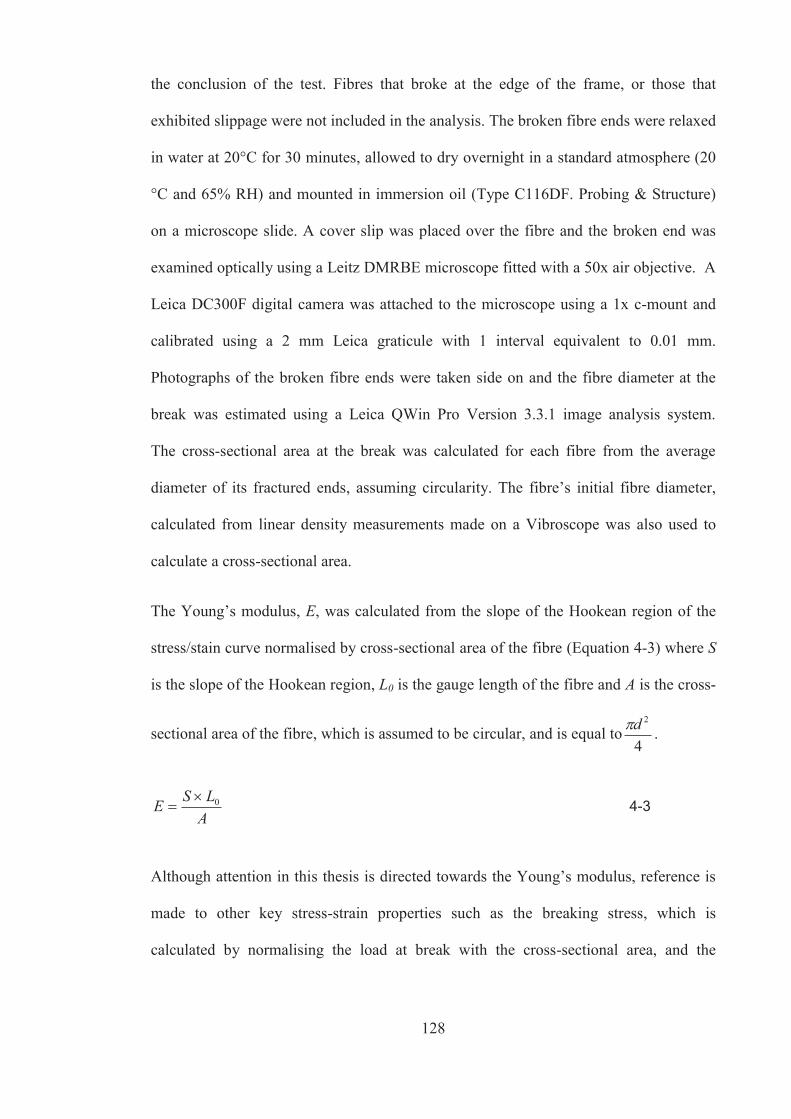
128
the conclusion of the test. Fibres that broke at the edge of the frame, or those that
exhibited slippage were not included in the analysis. The broken fibre ends were relaxed
in water at 20°C for 30 minutes, allowed to dry overnight in a standard atmosphere (20
°C and 65% RH) and mounted in immersion oil (Type C116DF. Probing & Structure)
on a microscope slide. A cover slip was placed over the fibre and the broken end was
examined optically using a Leitz DMRBE microscope fitted with a 50x air objective. A
Leica DC300F digital camera was attached to the microscope using a 1x c-mount and
calibrated using a 2 mm Leica graticule with 1 interval equivalent to 0.01 mm.
Photographs of the broken fibre ends were taken side on and the fibre diameter at the
break was estimated using a Leica QWin Pro Version 3.3.1 image analysis system.
The cross-sectional area at the break was calculated for each fibre from the average
diameter of its fractured ends, assuming circularity. The fibre’s initial fibre diameter,
calculated from linear density measurements made on a Vibroscope was also used to
calculate a cross-sectional area.
The Young’s modulus, E, was calculated from the slope of the Hookean region of the
stress/stain curve normalised by cross-sectional area of the fibre (Equation 4-3) where S
is the slope of the Hookean region, L0 is the gauge length of the fibre and A is the cross-
sectional area of the fibre, which is assumed to be circular, and is equal to4
2d .
ALSE 0 4-3
Although attention in this thesis is directed towards the Young’s modulus, reference is
made to other key stress-strain properties such as the breaking stress, which is
calculated by normalising the load at break with the cross-sectional area, and the

129
breaking strain, which is a measure of the extension relative to the original gauge length
of the fibre.
4.2.4 Ellipticity of fibre cross-sections (fibre shape) It is well known that the cross-sections of most animal fibres are not circular (Warner,
1995), and ellipticity is an appropriate measure of the fibre non-circularity. Three
methods of measuring fibre ellipticity were attempted:
1. Single Fibre Analyser or SIFAN 3, which uses a camera to detect the
shadow cast by fibres as they are rotated in set increments around their
vertical axis.
2. Scanning electron microscopy (SEM) of transverse cross-sections prepared
by packing fibres into heat-shrink tubing and sectioning.
3. Optical microscopy of transverse cross-sections prepared by embedding the
fibres in epoxy resin and cutting cross-sections with an ultramicrotome.
4.2.4.1 Ellipticity of single fibres using SIFAN 3 A Single Fibre Analyser or SIFAN 3 (BSC Electronics Pty Ltd.) was used for ellipticity
measurements. Firstly a nominal 10 μm, tungsten calibration wire (supplied by Graham
Higgerson, CSIRO but manufacturer’s details unknown) was used to assess the
calibration of the instrument before testing the fibre samples. The calibration wire and
20 fibres from each of the scoured INF samples and the mean fibre length top samples
were mounted on to plastic tabs with double sided sticky tape. A gauge length of 50 mm
was used for all samples except for the cashmere where a gauge length of 20 mm was
used due to its short fibre length. A pre-tensioning force of 0.5 cN was used to remove
any slack from the samples. Scanning was conducted at six orientations ie.,
0°,30°,60°,90°,120° and 150°, at a motor speed of 7 mm/sec with a step of 0.015 mm.
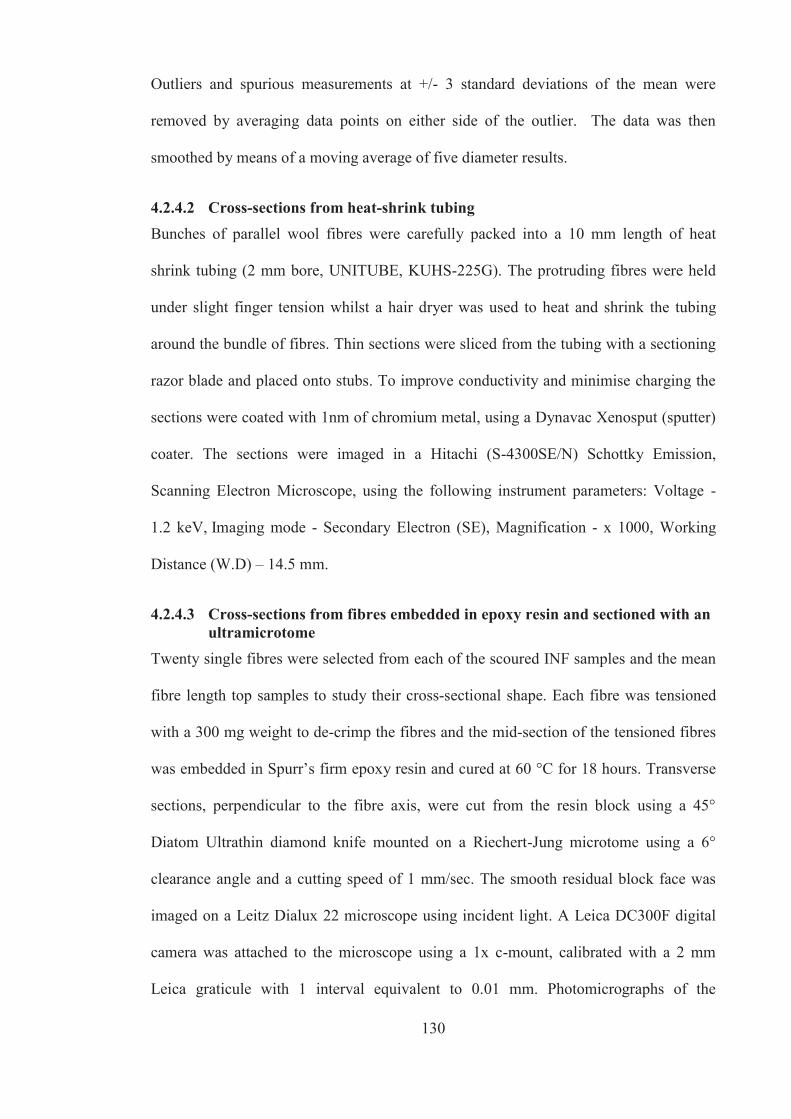
130
Outliers and spurious measurements at +/- 3 standard deviations of the mean were
removed by averaging data points on either side of the outlier. The data was then
smoothed by means of a moving average of five diameter results.
4.2.4.2 Cross-sections from heat-shrink tubing Bunches of parallel wool fibres were carefully packed into a 10 mm length of heat
shrink tubing (2 mm bore, UNITUBE, KUHS-225G). The protruding fibres were held
under slight finger tension whilst a hair dryer was used to heat and shrink the tubing
around the bundle of fibres. Thin sections were sliced from the tubing with a sectioning
razor blade and placed onto stubs. To improve conductivity and minimise charging the
sections were coated with 1nm of chromium metal, using a Dynavac Xenosput (sputter)
coater. The sections were imaged in a Hitachi (S-4300SE/N) Schottky Emission,
Scanning Electron Microscope, using the following instrument parameters: Voltage -
1.2 keV, Imaging mode - Secondary Electron (SE), Magnification - x 1000, Working
Distance (W.D) – 14.5 mm.
4.2.4.3 Cross-sections from fibres embedded in epoxy resin and sectioned with an ultramicrotome
Twenty single fibres were selected from each of the scoured INF samples and the mean
fibre length top samples to study their cross-sectional shape. Each fibre was tensioned
with a 300 mg weight to de-crimp the fibres and the mid-section of the tensioned fibres
was embedded in Spurr’s firm epoxy resin and cured at 60 °C for 18 hours. Transverse
sections, perpendicular to the fibre axis, were cut from the resin block using a 45°
Diatom Ultrathin diamond knife mounted on a Riechert-Jung microtome using a 6°
clearance angle and a cutting speed of 1 mm/sec. The smooth residual block face was
imaged on a Leitz Dialux 22 microscope using incident light. A Leica DC300F digital
camera was attached to the microscope using a 1x c-mount, calibrated with a 2 mm
Leica graticule with 1 interval equivalent to 0.01 mm. Photomicrographs of the
131
transverse fibre cross-sections were recorded and the ellipticity was estimated from the
ratio of the length of the major axis to minor axis (orthogonal feret) as measured by the
Leica QWin Pro Version 3.3.1 image analysis system.
4.2.5 Calculation of the bending rigidity of fibres The bending rigidities of fibres were calculated from Equation 4-4, using the
assumptions made by Wortmann and Schwann-Jonczyk (2006) that:
1. fibres preferentially bend around their minor axis
2. Young’s modulus is homogeneous over the cross-section and equal for
compression and extension deformations that occur in bending
4
3abEB 4-4
where a and b are the major (long) half axis and the minor (short) half axis of the ellipse
respectively and E is the Young’s modulus.
Values of a and b were experimentally determined from cross-sections of the fibres
rather than using the procedure described by Wortmann and Schwann-Jonczyk (2006).
It was also assumed that the Young’s modulus determined from stretching is
approximately equal to the Young’s modulus determined from bending. This is
considered reasonable for wool (Chapman 1973a,b; Kawabata et al. 2002; Kawabata,
Yamashita & Niwa 2000; Postle, Carnaby & DeJong 1988; Robbins 1994).
4.2.6 Preliminary study on the shear modulus of single fibres Bunches of approximately 100 single fibres were randomly selected from each of the
scoured samples and were sent to the Textile Research Institute (TRI) in Princeton, US
for testing on their single fibre torsional pendulum. This single fibre torsional pendulum
was designed for testing single human hair fibres and uses a 4.5 g pendulum weight. A

132
description of the apparatus and the testing protocol can be found elsewhere (Harper &
Kamath 2007; Persaud & Kamath 2004). The shear modulus, G, of a fibre was
calculated from Equation 4-5 (Harper & Kamath 2007).
33216
abbaTLMG 4-5
Where L is the length of the fibre, M is the moment of inertia for the pendulum, T is the
period of oscillation and a and b represent the major (long) half-axis and minor (short)
half-axis of the ellipse.
4.3 Results and discussion
4.3.1 Single fibre tensile properties Tensile stress-strain curves for wool, cashmere and alpaca stretched at a strain rate of
25%/min in air at 20 °C and 65% relative humidity were similar. Figure 4-1 gives an
example of the stress-strain curve for fibres from the specialty tops, wool tops and from
the Turretfield INF wool fibres. All fibres had the classic linear Hookean region where
the load increased rapidly with extension, the yielding region where there was little
increase in load with extension and a post yielding region where the load increased up
to the fibre break. About 25% of the alpaca and cashmere fibres tested showed
instability in the stress-strain curve in the vicinity of the fibre break. This was most
likely due to fibre slippage and would have resulted in errors in the stress and strain at
break for these fibres. Samples that exhibited severe slippage were discarded. This
instability in the stress-strain curve was rarely observed for the wool samples.

133
0
50
100
150
200
250
0 10 20 30 40 50
Stre
ss (M
Pa)
Strain (%)
Alpaca (26 μm) Cashmere (17 μm)Wool (17 μm ) Wool (27 μm)INF wool Turretfield soft (16 μm ) INF wool Turretfield harsh (16 μm)
Figure 4-1 Stress-strain curves of wool, cashmere and alpaca single fibres tested in air at 20°C and 65% relative humidity at a strain rate of 25%/min
The results of the tensile tests are summarized in Table 4-1, whilst the full data set and
coefficient of variation for the fibres are provided Tables A3.1 to A3.10 in Appendix 3.
The coefficient of variation of Young’s modulus, a non-failure property, was similar to
that observed in the breaking stress. This variability comes about partly through the
inherent variability in the fibres and partly through the difficulty of accurately
measuring this property. Figure 4-2 shows the variation in Young’s modulus of fibres
from the INF matched pairs and from the specialty tops. The Young’s modulus in that
figure was obtained by normalising the slope of the Hookean region by the fibre
diameter at the break. Within each matched pair there was a slight tendency for the
fibres with a low resistance to compression to have a higher Young’s modulus
(stiffness). The reason for this not understood, but may be due to variations in the crimp
form (planar vs helical). Unfortunately this aspect of crimp was not recorded for the

134
fibres tested and there were no obvious differences in fibres when they were mounted in
tabs for tensile testing.
Table 4-1 Tensile properties of INF mid-side samples and speciality tops (data in brackets represents the 95% confidence interval)
Sample description
Tensile properties
Force normalised by fibre diameter at the break
Force normalised by Vibroscope fibre diameter
No. of fibres tested
Fibre diameter
μm
Young’s modulus
GPa
Break stress MPa
Fibre diameter
μm
Young’s modulus
GPa
Break stress MPa
Break strain
% Turretfield wool
(low RtC) MFD 15.8 μm CVD 24.1%
50 12.8 (0.4)
6.07 (0.4)
236 (15)
16.3 (0.3)
3.72 (0.2)
144 (6)
42.2 (1.6)
Turretfield wool (high RtC)
MFD 15.8 μm CVD 29.8%
49 13.8 (0.5)
5.86 (0.4)
220 (13)
16.6 (0.4)
3.95 (0.1)
150 (7)
41.8 (1.5)
Kirby wool (low RtC)
MFD 16.8 μm CVD 14.3%
50 14.3 (0.6)
5.03 (0.3)
193 (11)
16.9 (0.6)
3.55 (0.1)
137 (6)
38.0 (2.0)
Kirby wool (high RtC)
MFD 16.7 μm CVD 20.4%
49 15.1 (0.6)
4.90 (0.3)
183 (11)
16.8 (0.5)
3.56 (0.2)
136 (6)
37.4 (2.3)
Katanning wool (low RtC)
MFD 17.9 μm CVD 16.2 %
51 15.2 (1.4)
6.33 (0.5)
211 (14)
18.9 (1.1)
3.95 (0.2)
157 (16)
39.1 (1.1)
Katanning wool (high RtC)
MFD 17.7 μm CVD 14.1%
53 13.2 (0.6)
6.08 (0.4)
207 (11)
17.4 (0.7)
3.40 (0.2)
117 (5)
38.5 (2.0)
Alpaca top
MFD 25.6 μm CVD 34.4%
40 22.4 (1.5)
6.03 (0.3)
217 (15)
25.9 (1.8)
4.59 (0.3)
164 (12)
35.5 (2.3)
Coarse wool top MFD 26.9 μm CVD 22.7%
47 25.0 (1.5)
5.47 (0.4)
203 (13)
29.0 (1.5)
3.97 (0.2)
149 (9)
36.6 (3.8)
Cashmere top
MFD 17.0 μm CVD 24.5%
38 15.6 (0.8)
6.40 (0.3)
222 (17)
18.4 (0.8)
4.65 (0.1)
159 (6)
39.8 (2.0)
Fine wool top
MFD 17.0 μm CVD 18.9%
51 14.5 (0.3)
4.99 (0.3)
206 (12)
16.8 (0.5)
3.66 (0.1)
151 (4)
36.8 (1.2)
MFD is mean fibre diameter, CVD is the coefficient of variation of fibre diameter. Fibres were tested at a constant rate of strain of 25%/min.
The wool fibres from Kirby had a significantly lower Young’s modulus (normalised by
fibre diameter at the break) compared to fibres from Turretfield and Katanning (Figure
4-2). The Kirby wool fibres had more crimp compared to the Turretfield and Katanning

135
wool fibres and this may explain the lower Young’s moduli of these samples,
particularly because a number of workers have already shown that an inverse
relationship exists between Young’s modulus and crimp (Barach & Rainard 1950;
Bendit 1980; Brand & Backer 1962; Dillon 1952; Dusenbury & Wakelin 1958; Evans
1954; Huson 1992; Menkart & Detenbeck 1957). The differences in the mechanical
properties may also be a reflection of differences in the fibre’s fine structure such as
crystallinity and molecular orientation (Behera & Shakyawar 2003; Rao & Gupta 1991).
4
5
6
7
3 4 5 6 7 8 9 10 11 12
Youn
g's m
odul
us, G
Pa
Resistance to Compression, KPa
Alpaca
Coarse wool
Cashmere
Fine wool
Turretfield High RtC
Turretfield Low RtC
Kirby High RtC
Kirby Low RtC
Katanning High RtC
Katanning Low RtC
Figure 4-2 Variation in Young’s modulus with resistance to compression (Error bars are the standard error of the mean)
Excel t-tests (two-sample with equal variance) were used to test for differences in the
Young’s moduli of each pair of the matched INF wools, between fine wool and
cashmere and between coarse wool and alpaca. The analysis showed that the null
hypothesis was accepted for the Turretfield, Katanning and Kirby samples (P>0.05)
meaning that we can be 95% certain that there are no differences in the Young’s moduli
of the pairs even though they differed in softness and RtC (Table 3-14). However the
null hypothesis was rejected (P<0.05) when comparing the Young’s moduli of fibres

136
from the cashmere and fine wool tops and also when comparing the Young’s moduli of
fibres from the alpaca and coarse wool tops. This indicates with 95% certainty that there
were differences in the Young’s moduli of these samples. The low crimp in the alpaca
and cashmere fibres compared to the wool fibres may also explain the significant
difference in the Young’s moduli of these samples.
Young’s Modulus, E, is defined as 4*S*L0/πd2 (Equation 4-3) where S is the slope of
the Hookean region of the force-extension curve, L0 is the gauge length and d is the
diameter of the fibre. The Young’s modulus depends on the accurate measurement of
these parameters. Errors are likely to be associated with the automatic measurement of
the slope and also the gauge length, however, the greatest error would be associated
with the measurement of the fibre diameter, a property that is not uniform along the
length of the fibre and is squared in Equation 4-3. The measurement of fibre diameter
has proved to be a formidable task and there are no clear guidelines on how to treat
single fibre tensile data.
In the current work the fibre was assumed to be circular and the diameter was
determined by two techniques, namely measuring the diameter at the break and by
estimating the diameter from the fibre’s linear density as measured by a Vibroscope
using Equation 4-1.
The diameter at the break is likely to, but not required to, coincide with the minimum
initial cross-sectional area of the fibre. Orwin, Woods and Elliott (1980) showed that
about 70% of sound wool breaks at its minimum diameter, and hence researchers studying
the failure properties of wool often use the cross-sectional area at the position of break
to normalize the force data (Huson & Turner 2001; Huson 2009; Thompson & Hynd
2009; Viney 2002). Determining the fibres cross-sectional area from the diameter at the
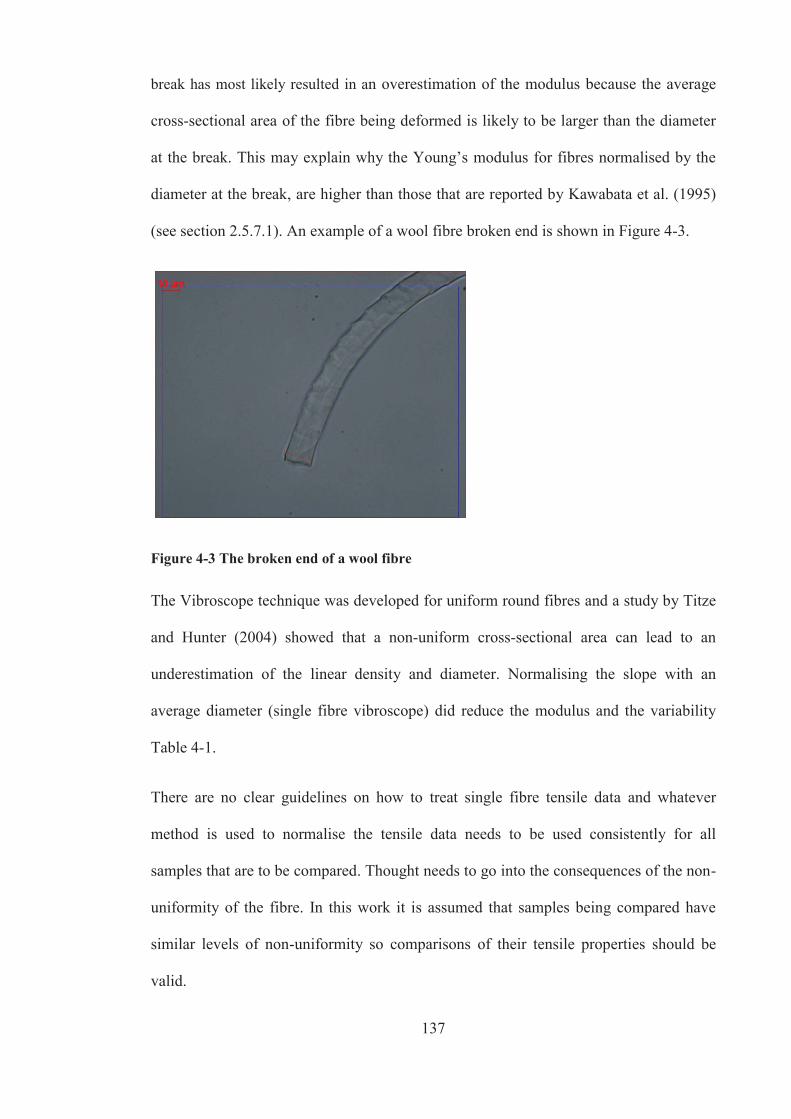
137
break has most likely resulted in an overestimation of the modulus because the average
cross-sectional area of the fibre being deformed is likely to be larger than the diameter
at the break. This may explain why the Young’s modulus for fibres normalised by the
diameter at the break, are higher than those that are reported by Kawabata et al. (1995)
(see section 2.5.7.1). An example of a wool fibre broken end is shown in Figure 4-3.
Figure 4-3 The broken end of a wool fibre
The Vibroscope technique was developed for uniform round fibres and a study by Titze
and Hunter (2004) showed that a non-uniform cross-sectional area can lead to an
underestimation of the linear density and diameter. Normalising the slope with an
average diameter (single fibre vibroscope) did reduce the modulus and the variability
Table 4-1.
There are no clear guidelines on how to treat single fibre tensile data and whatever
method is used to normalise the tensile data needs to be used consistently for all
samples that are to be compared. Thought needs to go into the consequences of the non-
uniformity of the fibre. In this work it is assumed that samples being compared have
similar levels of non-uniformity so comparisons of their tensile properties should be
valid.
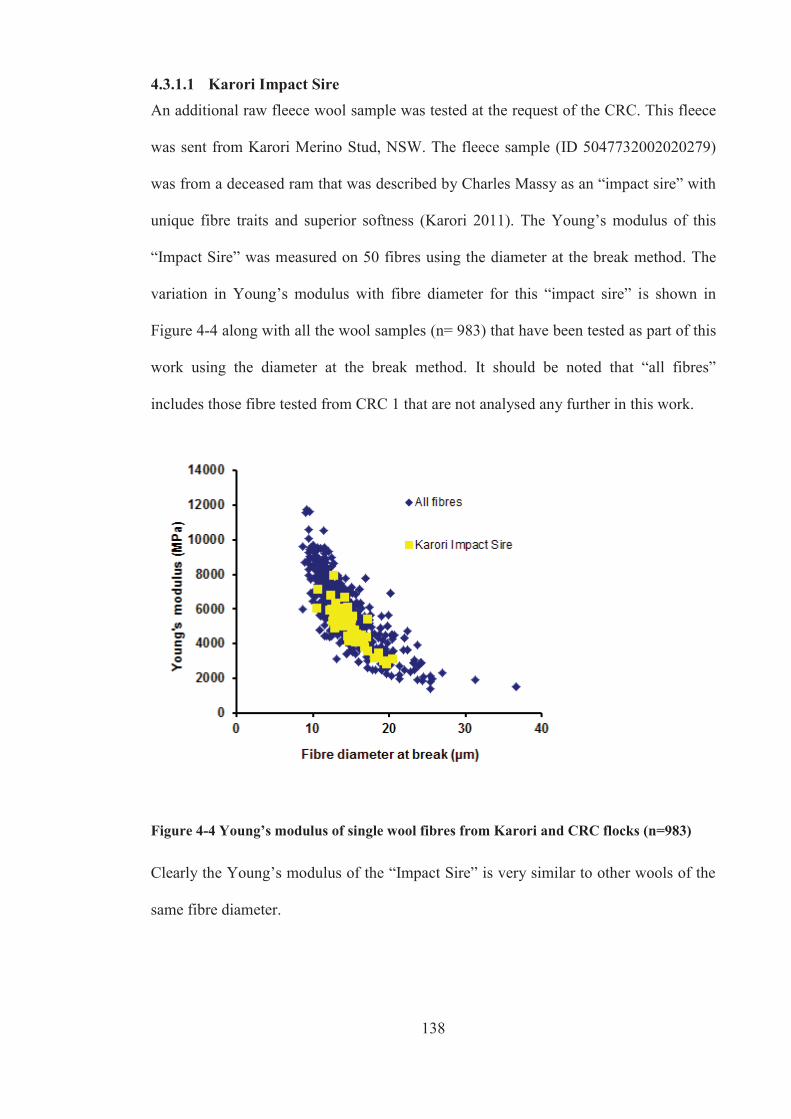
138
4.3.1.1 Karori Impact Sire An additional raw fleece wool sample was tested at the request of the CRC. This fleece
was sent from Karori Merino Stud, NSW. The fleece sample (ID 5047732002020279)
was from a deceased ram that was described by Charles Massy as an “impact sire” with
unique fibre traits and superior softness (Karori 2011). The Young’s modulus of this
“Impact Sire” was measured on 50 fibres using the diameter at the break method. The
variation in Young’s modulus with fibre diameter for this “impact sire” is shown in
Figure 4-4 along with all the wool samples (n= 983) that have been tested as part of this
work using the diameter at the break method. It should be noted that “all fibres”
includes those fibre tested from CRC 1 that are not analysed any further in this work.
Figure 4-4 Young’s modulus of single wool fibres from Karori and CRC flocks (n=983)
Clearly the Young’s modulus of the “Impact Sire” is very similar to other wools of the
same fibre diameter.
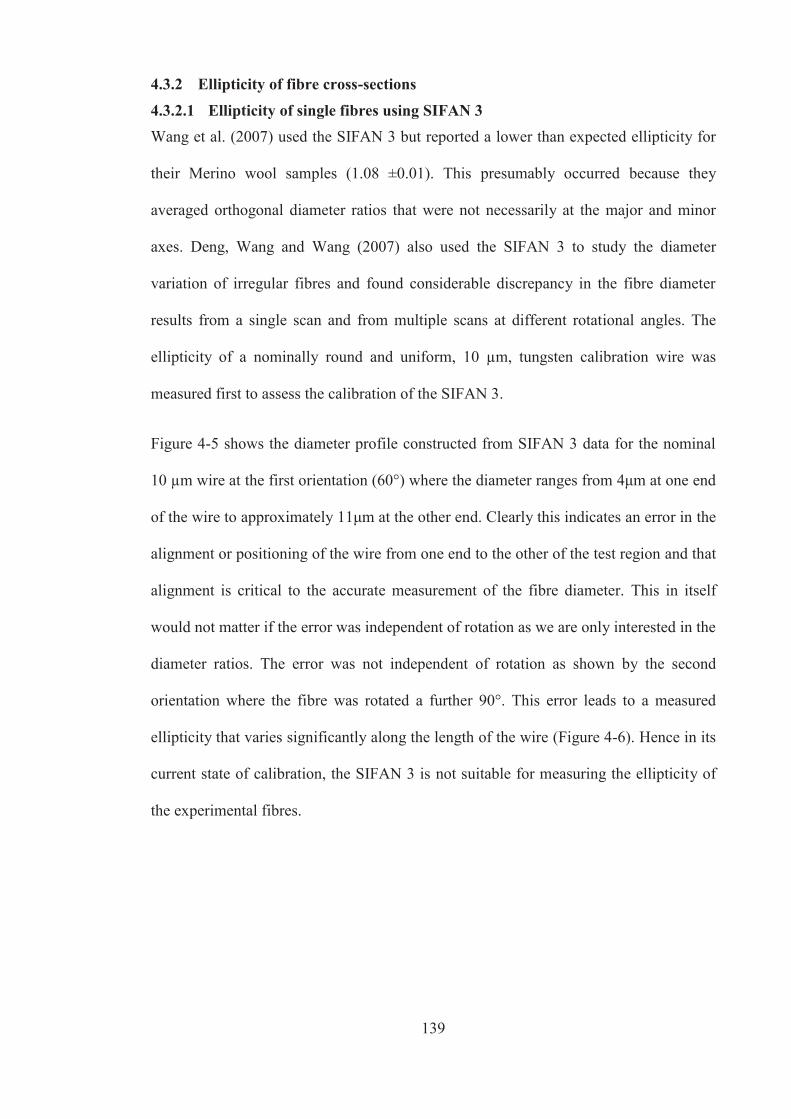
139
4.3.2 Ellipticity of fibre cross-sections
4.3.2.1 Ellipticity of single fibres using SIFAN 3 Wang et al. (2007) used the SIFAN 3 but reported a lower than expected ellipticity for
their Merino wool samples (1.08 ±0.01). This presumably occurred because they
averaged orthogonal diameter ratios that were not necessarily at the major and minor
axes. Deng, Wang and Wang (2007) also used the SIFAN 3 to study the diameter
variation of irregular fibres and found considerable discrepancy in the fibre diameter
results from a single scan and from multiple scans at different rotational angles. The
ellipticity of a nominally round and uniform, 10 μm, tungsten calibration wire was
measured first to assess the calibration of the SIFAN 3.
Figure 4-5 shows the diameter profile constructed from SIFAN 3 data for the nominal
10 μm wire at the first orientation (60°) where the diameter ranges from 4μm at one end
of the wire to approximately 11μm at the other end. Clearly this indicates an error in the
alignment or positioning of the wire from one end to the other of the test region and that
alignment is critical to the accurate measurement of the fibre diameter. This in itself
would not matter if the error was independent of rotation as we are only interested in the
diameter ratios. The error was not independent of rotation as shown by the second
orientation where the fibre was rotated a further 90°. This error leads to a measured
ellipticity that varies significantly along the length of the wire (Figure 4-6). Hence in its
current state of calibration, the SIFAN 3 is not suitable for measuring the ellipticity of
the experimental fibres.

140
0
2
4
6
8
10
12
14
16
18
20
0 5 10 15 20 25 30 35 40 45
Position along fibre (mm)
Diam
eter
(μm
)Fibre Orientation 60 degrees Fibre Orientation 150 degrees
Figure 4-5 Diameter profile of nominally round, 10 μm calibration wire measured at orientations of 60 degrees and 150 degrees with a SIFAN 3 instrument
0.5
1.0
1.5
2.0
2.5
0 5 10 15 20 25 30 35 40 45
Position along fibre (mm)
Max
imim
Dia
met
er R
atio
(μm
)
Figure 4-6 Maximum diameter ratio (ellipticity) of nominal 10 μm wire obtained from SIFAN 3 at an orientation of 60 degrees and 150 degrees.
4.3.2.2 Cross-sections from heat-shrink tubing Blankenburg et al. (1992) measured the ellipticity of fibres extracted from six
calibration tops ranging in nominal fibre diameter from 18μm to 36μm using the heat-
shrink tubing method. They found that average ellipticity values ranged from 1.17 for

141
the 22μm top to 1.28 for the 36μm top and obtained a significant positive correlation
between the fibre ellipticity and the mean fibre diameter. This is contrary to the findings
of Anderson and Benson (1953) who also studied the cross-sections of fibres of similar
diameter to those tested by Blankenburg et al. (1992), but did not find a significant
correlation between mean fibre diameter and fibre ellipticity. The heat-shrink tubing
method was assessed by packing parallel fibres into a 10 mm length of heat tubing and
shrinking the tubing with heat from a hair dryer before cutting sections. Figure 4-7
shows a typical micrograph of fibre cross-sections obtained from this method. As can be
seen from the image, most fibre cross-sections were tilted rather than perpendicular to
the fibre axis which induces ellipticity. Clearly this technique requires great packing
skill, otherwise fibre tilting does occur. If the face of the cross-section is tilted by an
angle of 25 degrees to the fibre axis, then a circular fibre may appear to have an
ellipticity of 1.103.
Figure 4-7 SEM images of typical fibre cross-sections obtained from the heat-shrink tubing method

142
4.3.2.3 Cross-sections from fibres embedded in epoxy resin and sectioned with an ultramicrotome
Typical cross-sections of wool, alpaca and cashmere that were cut from fibres that were
embedded in Spurr’s epoxy resin are shown in Figure 4-8. Fibres in these sections were
not tilted like those in Figure 4-7. Image analysis was used to determine the major axis
and the orthogonal minor axis for each of the cross-sections. The ellipticities of the
fibres were calculated by dividing the major axis by the minor axis. Ellipticity
measurements were only made on alpaca fibres that did not have a large or collapsed
medulla. The alpaca cross-sections were stained with methylene blue to accentuate their
medulla and melanin granules. Melanin granules are typically found in pigmented
animal fibres (Wang, Liu & Wang 2005) and were distributed loosely throughout the
cortical cells of the fibres from the brown alpaca top. Wang, Liu and Wang (2005)
suggested the pigment granules may contribute to the softness of alpaca by loosening
the bundles of cortical cell and making the fibre more flexible.
The ellipticity results are summarised in Table 4-2 and the individual results are
provided in Appendix 3 Table A3- 11 to Table A3- 15.
T-tests (two-sample with equal variance) have shown that there were no significant
differences in the ellipticity of fibres from the INF matched pairs (P>0.05) and similarly
there were no differences in the ellipticity of the alpaca and coarse wool fibres (P>0.05).
The result for the ellipticity of alpaca should be regarded with caution because the
ellipticity measurement was biased towards fibres that did not contain a large or
collapsed medulla. Heavily medullated fibres were distinctly more elliptical than those
that did not have a large medulla (Figure 4-8 B). However fibres from the cashmere top
were significantly rounder (less elliptical) than the wool fibres from the fine wool top
(P=0.007).

143
Figure 4-8 Variation in fibre ellipticity shown in transverse cross-sections. A) “soft” Turretfield wool fibres, B) alpaca top fibres stained with methylene blue and C) cashmere top fibres

144
Table 4-2 Fibre ellipticity of INF mid-side samples and speciality tops (data in brackets represents the 95% confidence interval)
Fibre ellipticity
Sample description No. of fibres tested Major (long)
half-axis μm
Minor (Short) half-axis μm
Ellipticity
Turretfield wool (low RtC)
MFD 15.8 μm CVD 24.1% 21 7.6 (0.9) 6.6 (0.8) 1.16 (0.04)
Turretfield wool (high RtC)
MFD 15.8 μm CVD 29.8% 25 6.8 (0.7) 5.7 (0.5) 1.18 (0.04)
Kirby wool (low RtC)
MFD 16.8 μm CVD 14.3% 20 8.5 (0.7) 7.2 (0.5) 1.17 (0.02)
Kirby wool (high RtC)
MFD 16.7 μm CVD 20.4% 20 8.6 (0.7) 7.4 (0.5) 1.15 (0.02)
Katanning wool (low RtC)
MFD 17.9 μm CVD 16.2 % 20 8.6 (0.7) 7.4 (0.6) 1.15 (0.03)
Katanning wool (high RtC)
MFD 17.7 μm CVD 14.1% 20 8.3 (0.7) 7.3 (0.6) 1.15 (0.02)
Alpaca top
MFD 25.6 μm CVD 34.4% 20 14.1 (1.1) 11.3 (0.7) 1.24 (0.04)
Coarse wool top
MFD 26.9 μm CVD 22.7% 20 13.0 (0.9) 10.7 (0.6) 1.22 (0.02)
Cashmere top
MFD 17.0 μm CVD 24.5% 20 9.1 (0.7) 7.9 (0.7) 1.14 (0.02)
Fine wool top
MFD 17.0 μm CVD 18.9% 20 9.7 (0.8) 8.2 (0.6) 1.19 (0.03)
MFD is the mean fibre diameter. CVD is the coefficient of variation of fibre diameter.
4.3.3 Bending rigidity of single fibres The bending rigidity of fibres was estimated from Equation 4-4 and the results in Table
4-3 show that alpaca fibre had the highest bending rigidity, followed by the coarse wool
sample. Fibres from the cashmere and fine wool tops were also significantly stiffer in
bending than the fibres from the INF fleece samples. Sampling fibres from top using
mean fibre length beards may have favoured the selection of coarser fibres which would
have significantly influenced the bending rigidity.
Moreover, there were no obvious trends with bending rigidity and perceived loose wool
softness. For example, the alpaca sample was perceived to be as soft as the 17 μm fine
wool (refer to section 3.3.3.5), yet it is much stiffer in bending than the fine wool.

145
Similarly cashmere was significantly softer than fine wool, yet its bending stiffness was
only slightly larger than for fine wool. The bending rigidity of cashmere was mainly due
to its large Young’s modulus (Table 4-1) and the fact that it was more circular in cross-
section than wool (Table 4-2). Also the Turretfield (low RtC) wool fleece sample was
judged to be significantly softer than the other INF samples (refer to section 3.3.2.3) yet
it did not have the lowest bending rigidity.
Table 4-3 Bending rigidity of INF mid-side samples and speciality tops (data in brackets represents the 95% confidence interval)
Bending rigidity ( 10-11 Nm2)
Sample description where diameter at break was used to determine E
where Vibroscope diameter was used to determine E
Turretfield wool (low RtC)
MFD 15.8 μm CVD 24.1% 1.04 0.64
Turretfield wool (high RtC)
MFD 15.8 μm CVD 29.8% 0.58 0.39
Kirby wool (low RtC)
MFD 16.8 μm CVD 14.3% 1.25 0.88
Kirby wool (high RtC)
MFD 16.7 μm CVD 20.4% 1.34 0.97
Katanning wool (low RtC)
MFD 17.9 μm CVD 16.2 % 1.73 1.08
Katanning wool (high RtC)
MFD 17.7 μm CVD 14.1% 1.54 0.86
Alpaca top
MFD 25.6 μm CVD 34.4% 9.64 7.33
Coarse wool top
MFD 26.9 μm CVD 22.7% 6.84 4.97
Cashmere top
MFD 17.0 μm CVD 24.5% 2.26 1.64
Fine wool top
MFD 17.0 μm CVD 18.9% 2.10 1.54
The Wortmann and Schwann-Jonczyk (2006) assumptions for calculating the bending
rigidity should be viewed with caution particularly for fibres with multiple cuticle
layers. These multiple cuticle layers may contribute to the bending stiffness (Swift
1995,2000; Wortmann & Schwann-Jonczyk 2006).
146
Based on a Young’s modulus value normalised by the vibroscope diameter, the bending
rigidity of the 27 μm wool, was found to be 4.97 x 10⁻¹¹ Nm2. On face value, this
bending rigidity value is comparable to the value obtained by Yu and Liu (2006) for a
28.1 μm wool ( 4.46 x 10⁻¹¹ Nm2). Yu and Liu (2006), however, determined the
Young’s modulus for wool experimentally from axial buckling experiments and
obtained a much value lower value of Young’s modulus (1.47 GPa). If this modulus is
used in place of the one that was measured from the tensile data, then the bending
rigidity of the 27 μm wool top would be reduced by a factor of 2.7 to 1.84 x 10⁻¹¹ Nm2.
Yu and Liu (2006) also determined the bending rigidity of 45 μm alpaca and obtained a
value of 43.55 x 10⁻¹¹ Nm2. Shah and Whiteley (1971) also determined the bending
rigidity of wool fibres experimentally and obtained a bending modulus of 3.04 GPa for
a 26.4 μm wool fibre. This bending modulus value is similar to the tensile modulus
obtained for the 27 μm wool fibres when the slope was normalised by the Vibroscope
diameter (3.97 GPa) in Table 4-1.
4.3.4 Preliminary study on the shear modulus of single fibres Fibres from the INF fleece samples, the fine wool top and cashmere top could not be
measured on TRI’s single fibre torsional pendulum because they could not support the
weight of the pendulum. The shear modulus of 26 μm alpaca fibre was found to be 0.22
GPa and is very similar to the result for 17 μm cashmere (0.25 GPa) measured by
Kawabata et al. (1995). The shear modulus of the coarse wool fibre (27 μm) was found
to be 1.28 GPa and again this value is comparable to the values reported by Kawabata et
al. (1995) for wool.
TRI only measured two fibres from each top sample, and hence these results cannot be
considered representative of the samples, and more fibres need to be measured.
However these preliminary results tend to indicate that under torsional stress, alpaca
147
fibre may behave similar to cashmere and very differently to wool. Unlike the tensile
modulus which reflects the stiffness of the oriented α-helices, the torsional modulus is
dominated by the matrix. Hence the higher torsional moduli of wool compared to alpaca
and cashmere indicates that the matrix of wool may be stiffer. Skelton (1967) has shown
that the shear rigidity of crimped fibres is lower than that of straight fibres. Thus, unlike
tensile modulus where the increased modulus of alpaca and cashmere fibres can be
explained by their decreased curvature, the reduced torsional modulus must be due to
some inherent difference in the matrix of the fibre. Further work is required to build a
sufficiently large dataset to verify this result.
4.4 Conclusion
This chapter examined the Young’s modulus, ellipticity, bending rigidity and shear
modulus of wool, cashmere and alpaca fibre to determine whether any differences in
these parameters may account for the differences in loose fibre softness.
Although the Kirby samples had significantly different Young’s moduli to the
Katanning and Turretfield samples, within each pair there were no differences in the
Young’s moduli even though they differed in subjective softness and resistance to
compression properties. These results support the finding of Roberts (1956) who was
unable to demonstrate a significant relationship between Young’s modulus and
subjectively assessed handle of loose wool.. In the case of the low crimp specialty
fibres, both cashmere and alpaca had a greater Young’s moduli compared to wool of an
equivalent diameter, yet these fibres were also significantly softer than wool. From this
we can conclude that tensile stiffness does not influence the softness of these fibres.
148
There were no striking differences in the Young’s moduli of the Karori Impact Sire
compared to the INF sheep and its Young’s modulus fitted well into the ranges of
Young’s modulus measured for sheep from the Information Nucleus flocks.
The ellipticity of the INF fibres did not differ significantly and their average ellipticity
was 1.16. The 17 μm cashmere fibres were the most circular and had an average
ellipticity of 1.14 which was significantly different to that of 17 μm wool (1.19). The
ellipticity of the 27 μm alpaca fibre and 27 μm wool did not differ significantly (1.24
and 1.22 respectively).
The bending rigidities of fibres were calculated using Young’s tensile modulus and
ellipticity data by assuming that Young’s modulus is homogeneous over the cross-
section and equal for compression and extension deformations that occur in bending.
There were no obvious trends with bending rigidity and perceived loose wool softness.
Alpaca fibre had the greatest bending rigidity and the INF fleece wools all had lower
bending rigidity than the fibres from tops.
A preliminary study on the torsional properties of single fibres has shown that alpaca
has a lower shear modulus compared to wool of an equivalent diameter. The shear
modulus obtained for 27 μm wool was 1.28 GPa, whilst the shear modulus of alpaca
was found to be 0.22 GPa and is similar to the shear moduli reported by Kawabata et al
Kawabata et al. (1995) for of 17 μm cashmere (0.25 GPa). Although the study was
conducted on only a few fibres, the low shear moduli of the specialty fibres compared to
wool suggests that there are some inherent differences in their matrices, which may in
turn contribute to the differences in their fibre softness.

149
CHAPTER 5 CHARACTERISATION OF THE SURFACE PROPERTIES OF WOOL, CASHMERE AND ALPACA FIBRES
5.1 Introduction
The scanning electron microscope (SEM) is a standard means of investigating the
surface topography of keratin fibres and offers higher resolution than optical
microscopy (Bradbury & Leeder 1970; Swift 1991; Wortmann & Arns 1986). Much of
the SEM work on cuticle scale height and scale frequency has been focussed on
developing fibre identification techniques in an effort to detect surreptitious substitution
of cashmere with cheaper fibre (IWTO-58-00 Test Method. 2000; Robson 2000;
Wortmann 1991; Wortmann & Arns 1986; Wortmann & Augustin 2004; Wortmann &
Phan 1999; Wortmann, Phan & Augustin 2003a,b; Wortmann & Wortmann 1992;
Wortmann, Wortmann & Arns 1989). Wool can be distinguished from other keratin
fibres based on scale height; a scale height greater than 0.6 μm is indicative of a wool
fibre, whilst a scale height less than 0.4 μm is indicative of speciality fibre (IWTO-58-
00 Test Method. 2000). The accuracy of this method is dependent on the skill and
experience of the operators. Recently Varley (2006) used a modified SEM technique by
bending fibres through 180º and found a greater overlap in the scale height properties
between wool and cashmere than previously reported by Wortmann and Arns (1986).
Varley (2006) measured only five scales, and found that cashmere, wool and alpaca had
average scale heights of 563 nm, 740 nm and 274 nm respectively. Robson (2000) used
a SEM to image the scale edges of 400 fibres and an image analysis method to measure
the scale height of the fibres. Using this technique, cashmere and lambswool were found
to have scale heights of 430 nm and 780 nm respectively.
The SEM has provided a wealth of information on the cuticle dimensions of wool and
other keratins, but it requires that fibres be coated with a conducting layer which could
150
potentially mask subtle surface features that may affect fibre softness or handle.
Scanning probe microscopy (SPM) is an ideal technique for the nanoscale
characterisation of the morphological and frictional properties of keratins. It has
advantages over a SEM because it is a non-destructive technique, it doesn’t require any
special sample preparation, it can be operated in air and it provides true three
dimensional images.
As described in Section 2.4, the Atomic force microscope (AFM) is a form of scanning
probe microscopy where a sharp tip that is attached to the underside of a flexible
cantilever is scanned across a surface to obtain images and nano-mechanical properties
of the surface. There are many imaging modes available for the AFM (Bhushan 2008c;
Bhushan & Marti 2008; Morris, Kirby & Gunning 1999), but the two types of imaging
modes most commonly used to study hair and wool surfaces in air at the nanoscale level
are contact mode and tapping mode (Breakspear, Smith & Luengo 2005; Gibson et al.
2001; Huson et al. 2008; Ruetsch et al. 2003; Swift & Smith 2000).
In contact mode, a silicon nitride tip is brought into direct contact with the surface.
During scanning the tip/sample force is kept constant by adjusting the height of the tip
to accommodate changes in the height of the sample (Bhushan 2008a,c; Bhushan &
Marti 2008; Butt, Cappella & Kappl 2005). The cantilevers used in contact mode are
generally triangular in shape and flexible which makes them sensitive to attractive and
repulsive forces. They have spring constants of around 0.06 to 0.58 Nm-1 (Bhushan
2008c). Tapping mode uses a stiffer, beam-like cantilever with a spring constant of
around 17 - 60 Nm-1. The cantilever is vibrated at its resonant frequency (Bhushan
2008c) and the oscillation of the cantilever allows a silicon tip to lightly tap on the
surface as it travels over the sample. The cantilever’s oscillation amplitude changes with
the surface topography. The feedback system works to maintain a constant setpoint

151
amplitude by raising or lowering the z-Piezo and this again generates the three
dimensional topographic image of the fibre surface (Bhushan 2008a; Bhushan & Marti
2008).
The nano-mechanical properties of fibres can be obtained by operating the instrument in
force mode and surface frictional properties can be obtained by operating the instrument
in friction mode (Huson et al. 2008).
In force-distance (f-d) mode the lateral movement of the probe is halted and the tip is
moved towards the sample and the deflection of the cantilever as a function of the
distance between the scanner and the sample is monitored. This technique is used to
measure surface forces and adhesion and to determine mechanical properties such as
elasticity and hardness. AFM nano-indentation is different from conventional nano-
indentation because the indentation is not normal to the surface and the forces are
determined from the cantilever deflection and stiffness (Jee & Lee 2010). In addition the
spring constant of the cantilever is difficult to measure accurately, and this combined
with a lack of information on the shape of the tip, makes AFM indentation more useful
for relative measurements. The penetration of the tip into the sample is inversely related
to the modulus or stiffness of the material. The models most commonly used to relate
the indentation data to the mechanical properties of the sample are those of Sneddon
(1965) and Oliver and Pharr (1992). The Sneddon (1965) model is mostly used in AFM
based nanoindentation experiments (Burnham & Colton 1989; Sáez de Ibarra et al.
2006) whilst the Oliver and Pharr method is generally used to analyse the indentation
data from instrumented indenters (Feng 2006; McAllister, Gillespie & VanLandingham
2012a; McAllister, Gillespie & VanLandingham 2012b; VanLandingham et al. 2001).
152
In f-d mode the deflection of the cantilever as a function of the distance between the
scanner and the sample is monitored and is used to measure surface forces and adhesion
and to determine mechanical properties such as elasticity and hardness. SPM has been
used to study the changes in microhardness of human hair and synthetic fibres following
the applications of chemical finishes (Kamath et al. 2002; Ruetsch et al. 2003) and on
wool fibres at different humidity (Maxwell & Huson 2005).
Friction force or lateral force microscopy detects the torsion of the cantilever during
scanning and is useful for examining the frictional properties of surfaces by providing a
measure of the friction between the surface and the probe (Sadaie et al. 2006). Much of
the research concerning the frictional properties of fibres has been conducted on human
hair. The coefficient of friction of virgin and chemically damaged hair has been studied
(Bhushan, Wei & Haddad 2005; LaTorre & Bhushan 2006; Sadaie et al. 2006) and
friction was shown to be sensitive to ethnic origin, age, disease and chemical treatment
(Breakspear, Smith & Luengo 2005). Additionally the tips of hair have an increased
friction compared to the root due to more damage and fewer lipids due to
photodegradation (Sadaie et al. 2006). The presence of the lipid layer (f-layer)
contributes to the coefficient of friction of hair and wool, and its removal results in an
increase in the coefficient of friction (Breakspear, Smith & Luengo 2005; Huson et al.
2008).
The surface properties of fibres play an important role in many wool properties
including the tactile properties of fibres (Rippon 2008; Swift 1995). Nanoscale
characterisation of keratin is essential to develop a better understanding of the
topography, frictional and mechanical properties of the fibre surface and the
contribution they make to fibre softness. In this chapter, AFM is used to characterise the
surface of cashmere, alpaca and wool fibres and establish whether the way fibres feel to

153
the touch is related to the structure and properties of the fibre surface at the nanometre
scale. Quantitative information such as cuticle scale height, scale frequency and scale
roughness as well as nano-mechanical frictional and penetration properties is obtained.
When we touch fibres or fabric with fingers, the skin on our fingertips comes into
contact with the surface of the sample. It is the interaction between the surface asperities
of our skin and the surface asperities of the sample that provide tactile information
regarding the frictional properties of the surface. To date, much of the work in the
textile industry has focussed on the measurement of macroscale friction of fibres and
this friction is believed to contribute to tactile properties of fabric and loose wool
(Makinson 1975; Rippon 2008). The capstan method, whereby the fibre slides over a
reference material has been widely used to study the effects of chemical treatments on
wool. Common reference materials have been ebonite, glass and horn (Rippon 2008).
More recently, steel capstans have been used to compare the coefficient of friction of
wool and alpaca fibres (Wang et al. 2005; Yu & Liu 2006), however comparisons
between wool and cashmere have not been made. This chapter reports on the use of a
capstan friction tester to measure and compare the macroscale coefficient of friction of
single wool, cashmere and alpaca fibres.
In summary the objectives of this chapter are:
To use SPM to measure and compare the cuticle scale height, scale frequency
and surface roughness of fibres from wool and speciality fibre tops that have
been matched for fibre diameter.
To use SPM to measure the penetration of the tip into cuticle of fibres from wool
and speciality fibre tops that have been matched for fibre diameter. This
provides an indication of the relative hardness of the cuticle.
154
To use SPM in lateral force imaging mode to determine the relative coefficient
of friction of the surface between the scale edges of fibres from wool and
speciality fibre tops that have been matched for fibre diameter.
To use a friction tester to measure the macroscale coefficient of friction of fibres
from wool and speciality fibre tops that have been matched for fibre diameter.
5.2 Materials and methods
5.2.1 Fibre samples for surface analysis In this chapter, the only INF sample whose surface was examined was the high and low
RtC samples from Turretfield. This pair was chosen because it was shown (see section
3.3.2.3) that the low RtC Turretfield sample was significantly softer than all other INF
samples. Therefore if the surface properties have an influence on the softness of the
fibres they may be apparent in this pair of samples.
The surface of fibre samples from the wool, alpaca and cashmere tops were also
examined. Fibre samples were taken from the mean fibre length beards that were
prepared from these tops (see section 4.2.2 of the previous chapter).
5.2.2 Sample preparation for surface analysis Samples were first cleaned using a gentle four bath aqueous scour. All baths were set at
65 °C and the first three baths contained 0.05 % w/v, 0.05 % w/v and 0.025% w/v of a
non-ionic detergent, Lissapol TN450 (ICI) respectively and the final bath contained
reverse osmosis (RO) water only. The scoured fibre samples were allowed to air dry.
This was followed by soxhlet extraction for 5 hours in chloroform / methanol (2:1
zoetrope) cycling 5 times per hour. Finally fibres were ultrasonicated in 0.05% w/v of
Lissapol TN450 (ICI) for 2 minutes, thoroughly rinsed, then ultrasonicated in two
further RO baths for 2 minutes each, and then allowed to air dry. This stringent cleaning

155
method removed the unbound lipid contamination from the surface of the fibres. The
cleaned fibres were examined with SPM and also tested on the capstan friction tester.
5.2.3 Scanning probe microscopy Five random ‘clean’ fibres were selected for each fibre type. The crimp was removed
from the fibres by suspending a 500mg weight from the end of each fibre before
mounting onto microscope slides using double-sided adhesive tape. The middle section
of the fibre was secured on the adhesive tape whilst the tip and base regions of the fibre
were removed.
All measurements were carried out on a Digital Instruments Dimension 3000 Scanning
Probe Microscope (SPM) in air under ambient conditions of approximately 20 °C and
55% RH. To avoid inconsistencies due to varying cantilever spring constants and tip
geometry, which influence surface forces and penetration (Maxwell & Huson 2005), the
same tip was used for as many measurements as practical. When the tip needed
replacing due to damage or breakage, it was replaced with a probe with a similar
resonance. Cleveland et al. (1993) showed that, provided cantilevers are identical except
for variations in thickness, the spring constant is proportional to the cube of the
unloaded resonant frequency. Thus selecting probes with similar frequencies is a
reasonable way of ensuring that the cantilever spring constant hasn’t changed
significantly.
5.2.3.1 Fibre surface characterisation by SPM Surface characterisation was performed by operating the SPM in tapping mode, using a
silicon tip (Pointprobe with a nominal spring constant of 42 N/m). The scanner was
calibrated for the X, Y, & Z directions using the 10μm x 10μm pitch grating with 200
nm deep pits. After engagement of the tip with the surface of the fibre, the tip was
scanned perpendicular to the fibre axis to locate the top of the fibre. The tip was

156
positioned at the top of the fibre to minimise the effects caused by the fibre curvature.
For cuticle step height and interval determinations, the tip was scanned parallel to the
axis of the fibre. Height images were obtained by scanning the tip over a 60μm length
using a scan rate of 0.25Hz, a 4:1 aspect ratio and a resolution of 256 data points per
line. Scanning at a 4:1 aspect ratio captures a 60 m x 15 m image, hence for each
fibre, 3 x (60 x 15 μm) images were captured, totalling 15 images per sample of five
fibres. Images were processed using a third-order flatten routine that removed tilt,
curvature and S-shape curvature from each scan line. Each individual cuticle step height
was determined by averaging the height differential parallel to the scale edge over a
distance of approximately 5μm at the apex of the fibre (see Figure 5-2). The distances
between the scale edges, termed cuticle interval, were also measured by averaging the
scale interval over a 5μm band at the apex of the fibre in each 60μm section (see Figure
5-2). For scale roughness determinations, the tip was scanned perpendicular to the axis
of the fibre and in between the scales edges, avoiding scale edges and areas of debris.
For each fibre, at least two height images were obtained over a 5μm x 5μm scan size
using a scanning rate of 1Hz and 256 data points per line. The height images were
processed using a third-order flatten and the roughness of the cuticle surface of each
fibre was analysed by measuring the root-mean square roughness, Rrms, of the entire 5 x
5 μm height image using the Nanoscope (V5.31) software. The surface roughness, Rrms,
is the standard deviation of the height values of each data point from the mean data
plane of the image within the selected measurement area.
The topography of these fibres were also examined in a SEM. Prior to imaging in the
SEM, wool, cashmere and alpaca fibres were coated with 1 nm of chromium metal,
using a Dynavac Xenosput (sputter) coater. This improved conductivity and minimised
sample charging in the SEM. The samples were imaged in a Hitachi (S-4300SE/N)
157
Schottky Emission, Scanning Electron Microscope, using a secondary electron imaging
mode and a voltage of 1.2 keV. A magnification of x 1200 was used to image
approximately a 100 μm length of fibre to show the scale frequency. A magnification of
x 15000 was used to obtain a close up view of the scale edges.
5.2.3.2 Cuticle penetration and surface stiffness characterisation by SPM Penetration or nano-indentation studies were conducted in tapping mode, with a scan
rate of 1 Hz, using a silicon ‘Pointprobe’ with a nominal cantilever spring constant (k)
of 42 N/m. It is important to select a probe with suitable cantilever stiffness and
experience has shown that this type of probe penetrates into the exocuticle of hair and
wool fibres under ambient conditions (Maxwell & Huson 2002,2005). If the cantilever
is much softer than the keratin surface then no penetration will occur. If the cantilever is
too stiff then no cantilever deflection will occur. The position sensitive detector was
calibrated by conducting a single force-distance (f-d) measurement on a hard surface
such as glass using a relative trigger of 20 nm. Subsequently, a trigger of 100 nm was
used in the f-v mode and 16x16 arrays of force-distance curves were collected in a 5 μm
x 5 μm area of the fibre surface. For each fibre, data were collected from three different
areas on the fibre surface, avoiding where possible the cuticle edges. A total of 768
separate force-distance measurements were made at regularly spaced intervals for each
fibre. The penetration of the tip into the sample was calculated at the maximum
cantilever deflection using f-v data analysis software. The penetration was determined
from the difference between the f-d curve on the sample and the f-d measurement on the
hard glass at the deflection trigger. The penetration data from each 5 μm x 5 μm square
area were averaged to give three penetration values for each fibre. A Young’s modulus
was estimated from the unloading portion of the f-d curves using the nominal tip radius
and cantilever spring constant parameters supplied by the manufacturer and applying

158
them to Sneddon’s model assuming a parabolic tip shape (Gibson et al. 2001; Sneddon
1965). The Young’s modulus (E) was estimated using Equation 5-1 (Gibson et al.
2001):
5.15.02 4/13000 zRTkE tip 5-1
where k is the cantilever spring constant (42 N/m), T is the trigger, 100 nm, μ is the
Poisson’s ratio (0.4) (Kawabata et al. 1995), Rtip is the radius of curvature of tip (10 nm)
and Δz is the elastic recovery during the unloading of the sample.
5.2.3.3 Cuticle surface friction characterisation by SPM The friction of the cuticle surface, between the scale edges, was measured using friction
or lateral force mode. The SPM was operated in contact mode and a standard Si3N4
probe with a nominal cantilever spring constant of 0.12 N/m was used for scanning. The
scan rate was fixed at 1 Hz over a scan area of 3 μm x 0.375 μm (8:1 aspect ratio). Care
was taken to ensure that the area being scanned was flat and clean and located on the
top of the fibre to avoid curvature artefacts. The fast scan axis was parallel to the long
axis of the fibre. The applied normal load (deflection setpoint in volts) was increased in
seven steps from -1 V to 4 V and the same area of the fibre was scanned for each
setpoint to avoid any topography influences on frictional properties. Both trace and
retrace friction images were collected and the friction image was obtained by
subtracting the retrace image from the trace image. In total, 8192 friction force
measurements were obtained for each deflection setpoint. Turn-around points at the
ends of scans were removed leaving 6000 – 8000 frictional force data points per image
for analysis. The friction force data (in volts) were averaged for each setpoint. A relative
coefficient of friction for each fibre was derived from the linear regression of the plot of
setpoint (applied load in volts) against the friction force (in volts) as per Amonton’s

159
Law where Ff = μFn where Ff is the frictional force, Fn is the normal force and μ is the
coefficient of friction (Brewer, Beake & Leggett 2001; Huson et al. 2008). The applied
scanning loads were estimated in nN by multiplying the setpoint in volts by the detector
sensitivity (~ 200 nm/V) and the cantilever spring constant (~ 0.12 N/m) (Huson et al.
2008). Therefore in the experiment conducted here, a 1 V change corresponds to a
change in the applied load of approximately 24 nN.
5.2.4 Fibre to metal friction characterisation using a capstan friction tester Fibre to metal friction was measured by a capstan method similar to that described by
Henshaw (1961) and Eley et al. (1985). However instead of using a 20 mm pinned
cylinder, a 5 mm diameter, solid, stainless steel cylinder was used as the metal test
surface. The smaller diameter cylinder enabled the testing of short fibres such as
cashmere and is similar in size to solid capstans used recently by other researchers
(Wang et al. 2005; Yu & Liu 2006).
Clean fibres (see section 5.2.2) were used for single fibre capstan friction testing and
testing was conducted in a laboratory conditioned to 20°C and 65% RH. A fibre with a
500 mg weight on its free end was suspended from a strain gauge, creating a tension, T0
or the input tension. The free end of the fibre was then draped over a stainless steel
cylinder (capstan) as shown in Figure 5-1, contacting the cylinder through 180° (θ). The
cylinder was rotated at 50 rpm which equated to a surface speed of 0.79 m/min. The
friction, as the fixed fibre slipped on the rotating capstan, produced an output tension,
T1, and this tension was recorded for approximately 10 seconds of rubbing. The
coefficient of friction was calculated from the two tension readings according the classic
capstan equation (Equation 5-2) where θ is the contact angle in radians (Gupta 2008; Tu
& Fort 2004).
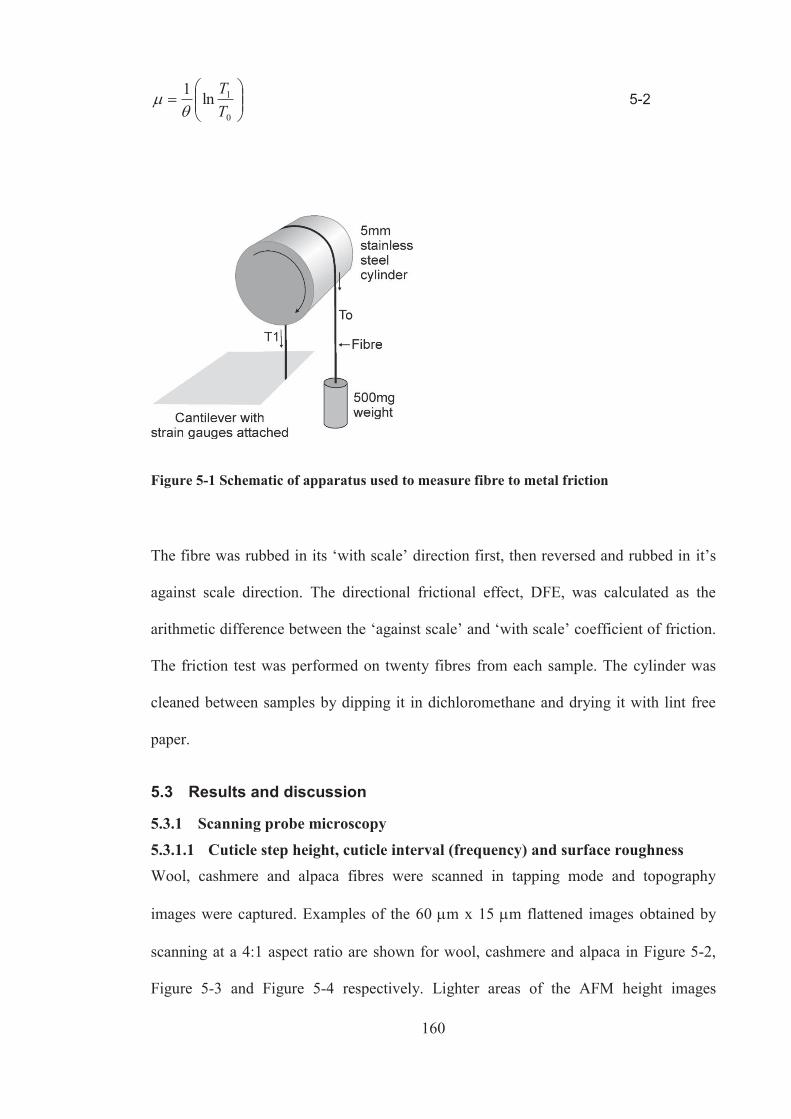
160
0
1ln1TT
5-2
Figure 5-1 Schematic of apparatus used to measure fibre to metal friction
The fibre was rubbed in its ‘with scale’ direction first, then reversed and rubbed in it’s
against scale direction. The directional frictional effect, DFE, was calculated as the
arithmetic difference between the ‘against scale’ and ‘with scale’ coefficient of friction.
The friction test was performed on twenty fibres from each sample. The cylinder was
cleaned between samples by dipping it in dichloromethane and drying it with lint free
paper.
5.3 Results and discussion
5.3.1 Scanning probe microscopy
5.3.1.1 Cuticle step height, cuticle interval (frequency) and surface roughness Wool, cashmere and alpaca fibres were scanned in tapping mode and topography
images were captured. Examples of the 60 m x 15 m flattened images obtained by
scanning at a 4:1 aspect ratio are shown for wool, cashmere and alpaca in Figure 5-2,
Figure 5-3 and Figure 5-4 respectively. Lighter areas of the AFM height images

161
correspond to higher regions and the darker areas correspond to lower regions. Profile
scanning analysis was used to obtain quantitative information on the cuticle step height
and cuticle interval. Above each flattened AFM height image in Figure 5-2, Figure 5-3
and Figure 5-4 are the corresponding profile (or cross-sectional) plots that show typical
variations in the cuticle step heights and the distance between cuticle edges along the
60μm region.
The majority of cuticle edges in the alpaca fibres appeared to be damaged and the areas
surrounding the cuticle edges showed debris on the surface. This debris is most likely
remnants of cuticle scales. Damage to the cuticle edges was only evident in some of the
cashmere fibres examined, and most of the cuticle edges of the wool fibres, including
those extracted from top, were relatively intact and did not show signs of damage.
The cuticle step height is a measure of how far the scale edge protrudes above the
surface of the cuticle cell below it and the cuticle interval refers to the distance between
consecutive scale edges. It has been shown that cuticle step height varies greatly, even
when a single scale is measured at different locations along its edge (Smith 1998; You
& Yu 1997). Therefore a single profile line is not sufficient for determining scale
height. In this thesis, a technique whereby the cuticle step height was measured and
averaged over a 5 μm distance parallel to the cuticle edge was used to determine the
average cuticle step height of the samples. All cuticle edges, except those that were too
severely damaged, or had too much surrounding debris, were measured in each 60 μm x
15 μm image using this technique. The average cuticle step height and average cuticle
interval of fibres from the low and high RtC Turretfield samples and fibres from the
wool and specialty tops are summarised in Table 5-1. The raw data is provided in
Appendix 5 Table A5- 1 to A5-6.

162
Figure 5-2 Typical AFM flattened height image (60 μm x 15 μm) of a single wool fibre from Turretfield (high RtC) – showing a 5 μm wide section analysis band used to determine cuticle step height (A) and cuticle interval (B)
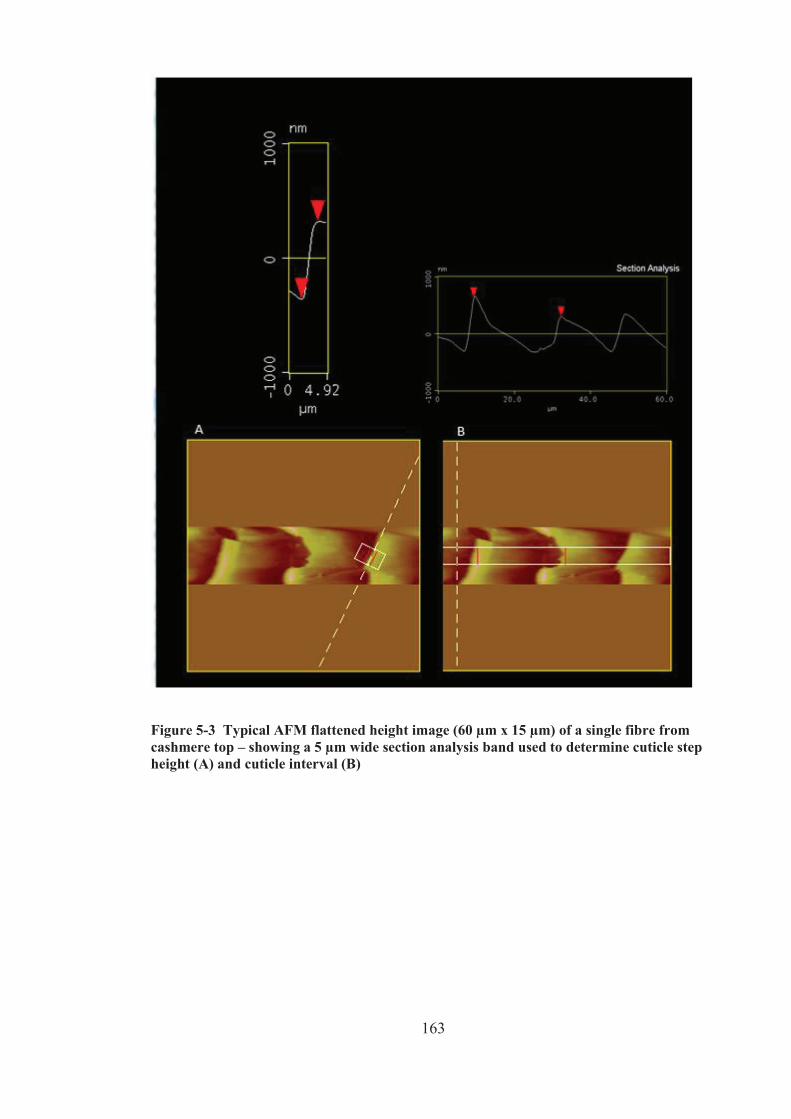
163
Figure 5-3 Typical AFM flattened height image (60 μm x 15 μm) of a single fibre from cashmere top – showing a 5 μm wide section analysis band used to determine cuticle step height (A) and cuticle interval (B)

164
Figure 5-4 Typical AFM flattened height image (60 μm x 15 μm) of a single fibre from alpaca top – showing a 5 μm wide section analysis band used to determine cuticle step height (A) and cuticle interval (B)
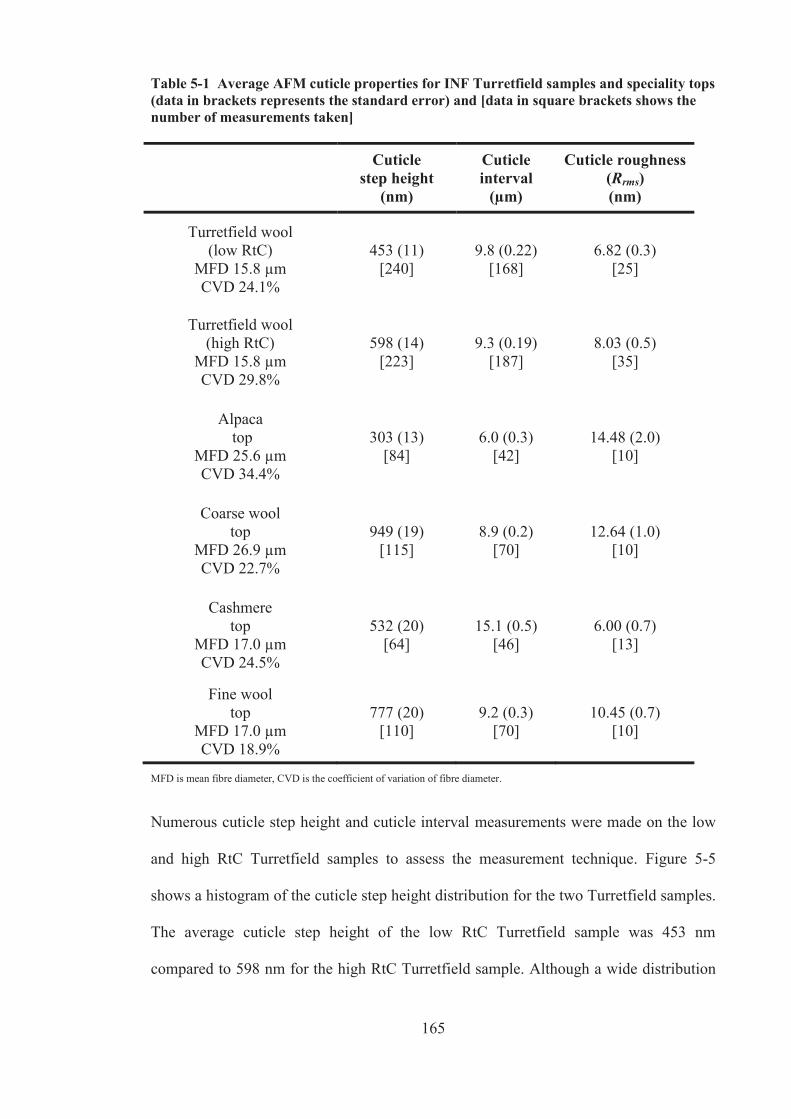
165
Table 5-1 Average AFM cuticle properties for INF Turretfield samples and speciality tops (data in brackets represents the standard error) and [data in square brackets shows the number of measurements taken]
Cuticle
step height (nm)
Cuticle interval
(μm)
Cuticle roughness (Rrms) (nm)
Turretfield wool (low RtC)
MFD 15.8 μm CVD 24.1%
453 (11) [240]
9.8 (0.22) [168]
6.82 (0.3) [25]
Turretfield wool (high RtC)
MFD 15.8 μm CVD 29.8%
598 (14) [223]
9.3 (0.19) [187]
8.03 (0.5) [35]
Alpaca top
MFD 25.6 μm CVD 34.4%
303 (13) [84]
6.0 (0.3) [42]
14.48 (2.0) [10]
Coarse wool top
MFD 26.9 μm CVD 22.7%
949 (19) [115]
8.9 (0.2) [70]
12.64 (1.0) [10]
Cashmere top
MFD 17.0 μm CVD 24.5%
532 (20) [64]
15.1 (0.5) [46]
6.00 (0.7) [13]
Fine wool top
MFD 17.0 μm CVD 18.9%
777 (20) [110]
9.2 (0.3) [70]
10.45 (0.7) [10]
MFD is mean fibre diameter, CVD is the coefficient of variation of fibre diameter.
Numerous cuticle step height and cuticle interval measurements were made on the low
and high RtC Turretfield samples to assess the measurement technique. Figure 5-5
shows a histogram of the cuticle step height distribution for the two Turretfield samples.
The average cuticle step height of the low RtC Turretfield sample was 453 nm
compared to 598 nm for the high RtC Turretfield sample. Although a wide distribution

166
in step height was found, a t-test showed that these cuticle heights were significantly
different (P<0.001). It is interesting to note that the scale heights of these two
Turretfield wool samples are much lower than the typical values of scale height of wool
reported in the literature (Liu & Wang 2007; Robson 2000; Varley 2006; Wortmann &
Phan 1999). The Turretfield samples were not tip shorn and their low scale heights may
be related to the birth coat of the sheep. There was no significant difference in their
cuticle interval (P=0.07).
Figure 5-5 Histogram showing the cuticle step height distribution of the low and high RtC Turretfield samples
The average cuticle step heights measured for fibres from the 17 μm and 27 μm wool
tops, cashmere top and alpaca top are typical of the values found in the literature (Liu &
Wang 2007; Valbonesi et al. 2010; Varley 2006; Wortmann & Phan 1999).
Alpaca fibre was found to have the lowest average cuticle step height, 303 nm, which
was significantly lower than the average cuticle step height of similar diameter wool
fibres (P<<0.0001). The cuticle interval, or the distance between scale edges of the

167
alpaca fibres was significantly shorter than the cuticle interval of similar diameter wool
fibres (P<<0.0001).
Cashmere fibres also had a significantly lower cuticle step height and a larger cuticle
interval compared to wool fibres from top of a similar diameter (P<<0.0001).
The AFM results show that for the paired samples, matched by fibre diameter, the softer
sample pair in each pair had a significantly lower cuticle step height. Hence cuticle step
height may play a role in how soft fibres feel when they are being handled, whilst
cuticle interval does not appear to be related to fibre softness.
The differences in the scale interval (frequency) and scale height were also readily
observed in SEM images taken for wool (Figure 5-6), alpaca (Figure 5-7) and cashmere
(Figure 5-8).
Figure 5-6 SEM images of a wool fibre from top showing the scale frequency and a cuticle edge

168
Figure 5-7 SEM images of an alpaca fibre from top showing the scale frequency and a cuticle edge
Figure 5-8 SEM images of a cashmere fibre from top showing the scale frequency and a cuticle edge
Roughness measurements were made with the AFM over an area of 5 μm x 5 μm on the
cuticle surface. All images were collected using the same tip, the same resolution and
the same flattening protocols to allow comparisons between samples (Eaton & West
2010).
Figure 5-9, Figure 5-10 and Figure 5-11 show typical height images (flattened), used to
determine surface roughness of wool and cashmere, wool and alpaca and the two
Turretfield wool samples respectively. The average cuticle roughness (Rrms) for the
fibres are summarised in Table 5-1. The raw data is provided in Appendix 5 Table A5-
1 to A5-6.
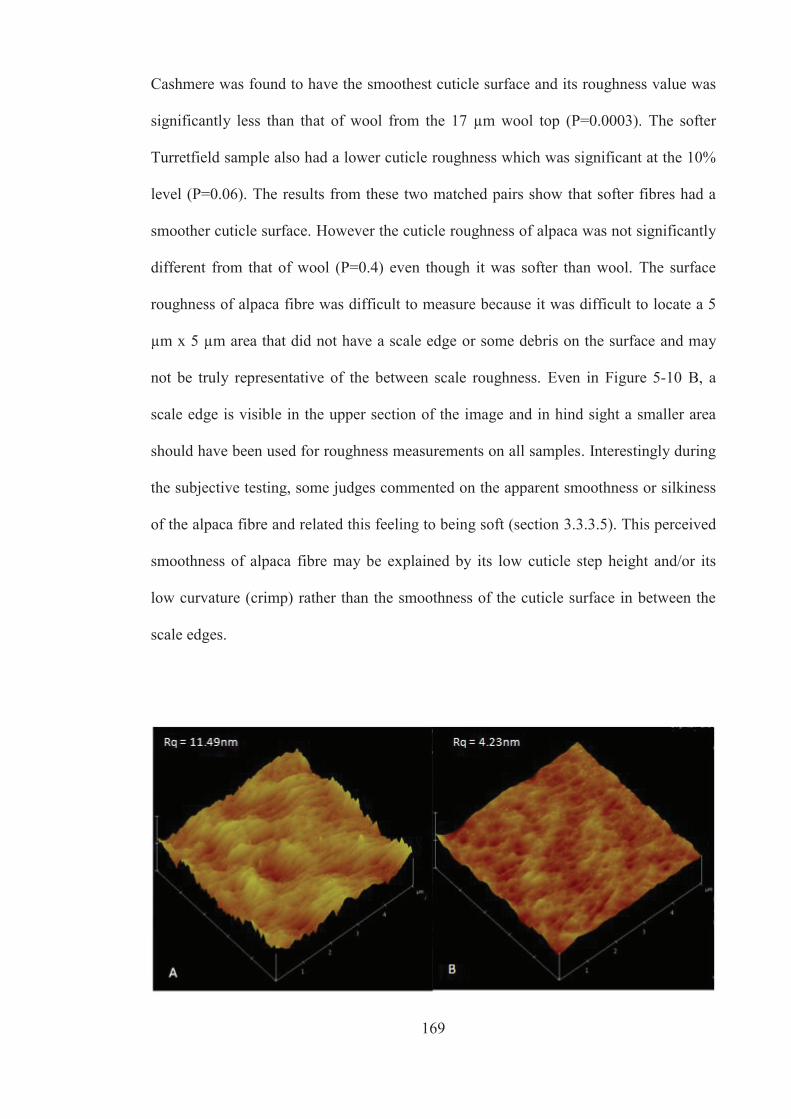
169
Cashmere was found to have the smoothest cuticle surface and its roughness value was
significantly less than that of wool from the 17 μm wool top (P=0.0003). The softer
Turretfield sample also had a lower cuticle roughness which was significant at the 10%
level (P=0.06). The results from these two matched pairs show that softer fibres had a
smoother cuticle surface. However the cuticle roughness of alpaca was not significantly
different from that of wool (P=0.4) even though it was softer than wool. The surface
roughness of alpaca fibre was difficult to measure because it was difficult to locate a 5
μm x 5 μm area that did not have a scale edge or some debris on the surface and may
not be truly representative of the between scale roughness. Even in Figure 5-10 B, a
scale edge is visible in the upper section of the image and in hind sight a smaller area
should have been used for roughness measurements on all samples. Interestingly during
the subjective testing, some judges commented on the apparent smoothness or silkiness
of the alpaca fibre and related this feeling to being soft (section 3.3.3.5). This perceived
smoothness of alpaca fibre may be explained by its low cuticle step height and/or its
low curvature (crimp) rather than the smoothness of the cuticle surface in between the
scale edges.
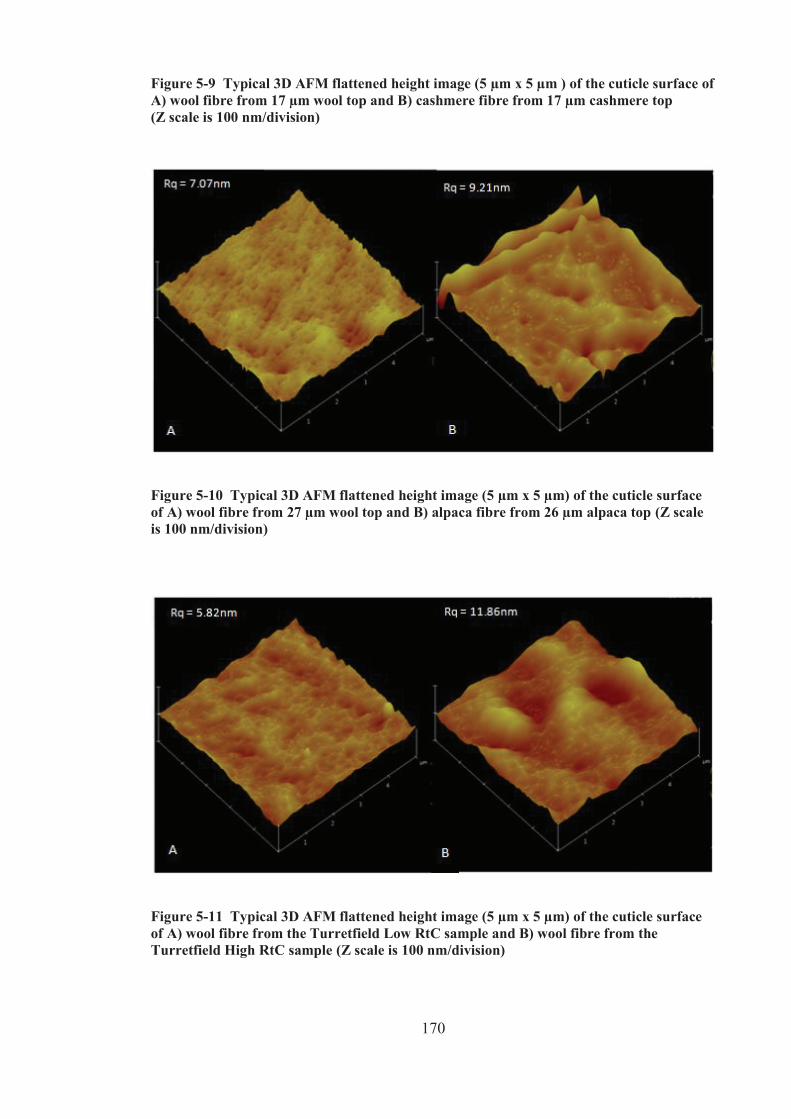
170
Figure 5-9 Typical 3D AFM flattened height image (5 μm x 5 μm ) of the cuticle surface of A) wool fibre from 17 μm wool top and B) cashmere fibre from 17 μm cashmere top (Z scale is 100 nm/division)
Figure 5-10 Typical 3D AFM flattened height image (5 μm x 5 μm) of the cuticle surface of A) wool fibre from 27 μm wool top and B) alpaca fibre from 26 μm alpaca top (Z scale is 100 nm/division)
Figure 5-11 Typical 3D AFM flattened height image (5 μm x 5 μm) of the cuticle surface of A) wool fibre from the Turretfield Low RtC sample and B) wool fibre from the Turretfield High RtC sample (Z scale is 100 nm/division)

171
5.3.1.2 Cuticle Penetration and surface stiffness – force volume mode In this study the relative hardness of the cuticle of the fibres was indicated from the
penetration depth of the AFM tip into the cuticle surface at the maximum cantilever
deflection of 100 nm. F-d measurements were made on each sample to determine the
depth of tip penetration into the cuticle. Typical f-d approach and retract curves for
wool and cashmere fibres, wool and alpaca fibres and the two Turretfield wool samples
are shown in Figure 5-12, Figure 5-13 and Figure 5-14 respectively. These individual f-
d plots are part of the array of 256 individual plots that make up the f-v analysis for
each sample. The hard surface calibration on glass is shown in all f-d curves and the
arrows indicate the penetration of the tip into the sample surface at the maximum
cantilever deflection.

172
Figure 5-12 Typical f-d measurement using a silicon point probe (k~42 N/m) on A) wool fibre from 17 μm wool top and B) cashmere fibre from 17 μm cashmere top

173
Figure 5-13 Typical f-d measurement using a silicon point probe (k~42 N/m) on A) wool fibre from 27 μm wool top and B) alpaca fibre from 26 μm alpaca top

174
Figure 5-14 Typical f-d measurement using a silicon point probe (k~42 N/m) on A) wool fibre from the Turretfield Low RtC sample and B) wool fibre from the Turretfield High RtC sample
When the tip penetrates the fibre, elastic, viscoelastic and plastic deformations can
occur. When the tip is withdrawn, only the elastic portion of the displacement is
recovered (Oliver & Pharr 2004). The hysteresis between the approach and retraction
curves is due to viscoelastic and/or plastic deformation.
When plastic deformation occurs, a residual impression of the indenter shape left in the
surface of the sample. Plastic deformation was observed in less than 10% of the fibres

175
tested and an example of the residual indents left in an alpaca fibre by the silicon
Pointprobe is shown in Figure 5-15. The height image, Figure 5-15A, showed the
topography of the indented alpaca cuticle. The phase image, Figure 5-15B, showed the
changes in the phase angle of the probe oscillation and the amplitude image in Figure
5-15C shows the feedback error image.
Figure 5-15 Tapping mode images of residual indents after f-v experiment on alpaca fibre A) height image, B) phase image and C) amplitude image
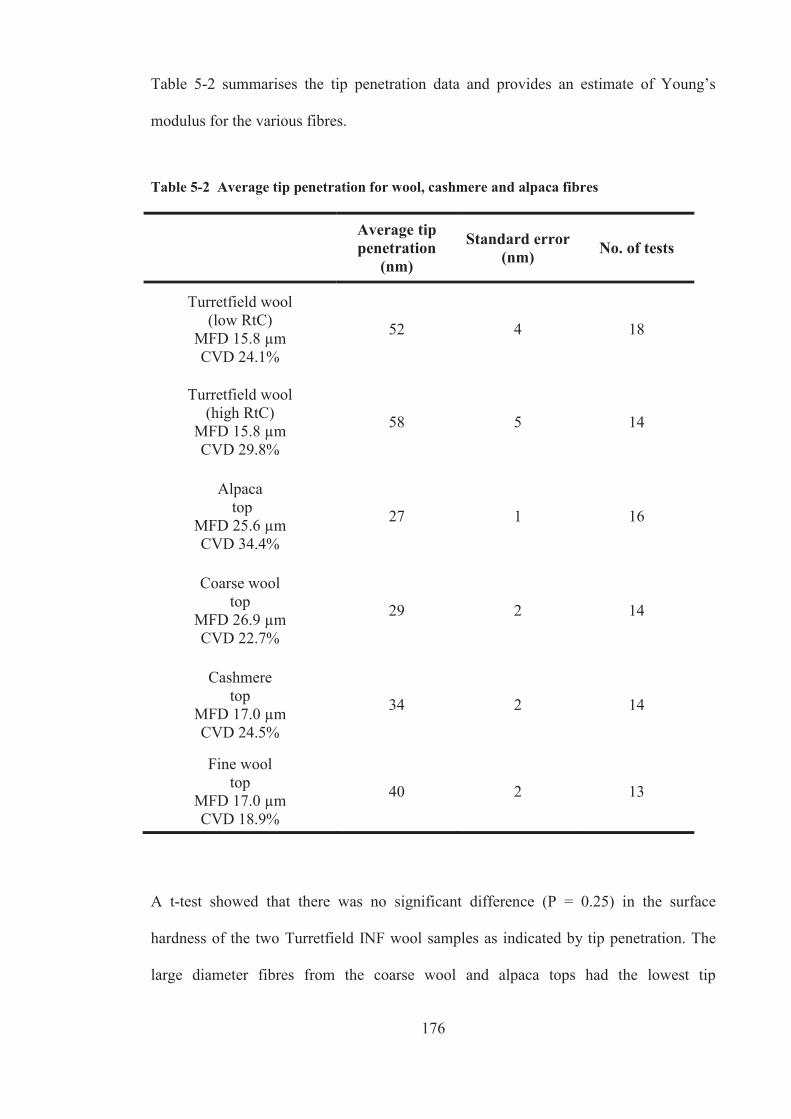
176
Table 5-2 summarises the tip penetration data and provides an estimate of Young’s
modulus for the various fibres.
Table 5-2 Average tip penetration for wool, cashmere and alpaca fibres
Average tip penetration
(nm)
Standard error (nm) No. of tests
Turretfield wool (low RtC)
MFD 15.8 μm CVD 24.1%
52 4 18
Turretfield wool (high RtC)
MFD 15.8 μm CVD 29.8%
58 5 14
Alpaca top
MFD 25.6 μm CVD 34.4%
27 1 16
Coarse wool top
MFD 26.9 μm CVD 22.7%
29 2 14
Cashmere top
MFD 17.0 μm CVD 24.5%
34 2 14
Fine wool top
MFD 17.0 μm CVD 18.9%
40 2 13
A t-test showed that there was no significant difference (P = 0.25) in the surface
hardness of the two Turretfield INF wool samples as indicated by tip penetration. The
large diameter fibres from the coarse wool and alpaca tops had the lowest tip

177
penetration, but their penetration values were not significantly different from one
another (P = 0.30). The surface of cashmere fibre was harder than the surface of fine
wool from a 17 μm wool top at the 10% level of significance (P = 0.08). The Turretfield
wool samples did have a significantly greater tip penetration compared to fibres from
the fine wool top sample (P < 0.02) suggesting their cuticle surface is softer.
The penetration of the tip into the sample is inversely related to the modulus or stiffness
of the material (Weisenhorn et al. 1993). In perfectly elastic samples, Sneddon’s elastic
contact mechanics can be used to calculate Young’s modulus and this requires accurate
calibrations of instrumental parameters such as tip shape and cantilever stiffness
(Tranchida et al. 2009; Tranchida, Piccarolo & Soliman 2006). Young’s modulus is
calculated from one of three equations depending on whether the tip shape is
cylindrical, parabolic or conical (Sneddon’s model) (Gibson et al. 2001). For small
indentations the assumption of a parabolic tip is likely to be valid (Gibson et al. 2001).
The viscoelastic behaviour of the keratin fibres, as indicated by comparison of the
approach (penetrating) and retraction (unloading) curves in Figure 5-12, Figure 5-13
and Figure 5-14, makes the analysis more complicated. For example, using the f-d curve
in Figure 5-14B where approximately 30 nm of elastic recovery has occurred, and
assuming the tip is parabolic with a radius of 10 nm and the Poisson’s ratio of the
sample was 0.4, the Young’s modulus of the sample is estimated to be 5.1 GPa.
The Young’s modulus of wool is most commonly established from tensile testing, and
for wool, E typically ranges from 3 to 5 GPa in air (Gibson et al. 2001) however in
section 4.3.1 we showed that the value of the Young’ modulus depends on how the
cross-sectional area of the fibre is determined. For the wool samples tested, Young’s
modulus ranged from 4.9 to 6.3 GPa when diameter at the break was used to determine

178
the cross sectional area and from 3.4 to 4.0 GPa when a Vibroscope measured diameter
was used to determine the cross sectional area.
5.3.1.3 Cuticle surface friction – nanoscale friction The friction force was measured in air as a function of applied load for each of the
fibres. Long range attraction of the Si3N4 tip to the surface of the two Turretfield fleece
samples occurred during friction testing. This long range attraction was most likely due
to static interference and was not evident in the fibres from the tops.
Due to concerns over the influence of the long range attraction on the friction of the
Turretfield samples, only friction data for the fibres from top samples have been
reported. The friction force of these top fibres increased linearly with the applied load
for all fibres tested and the Pearson correlation (r) was greater than 0.97. Examples of
the change in friction force with applied normal load for the fibres are shown in Figure
5-16.
The coefficients of friction (μ) were determined from the linear regression analysis of
these slopes according to Amonton’s Law, where the friction (lateral) force is equal to
the product of the coefficient of friction and the normal force (applied load). The results
for the coefficients of friction for the fibres tested are summarised in Table 5-3 and the
individual test results are provided in Appendix 5 Tables A5-8. Due to the large spread
in the data, the difference in the nano-scale coefficient of friction of cashmere, alpaca
and wool fibres was not significant at the 0.05 level.

179
Figure 5-16 Typical Amonton’s Law plots of friction force versus applied load for fibres from alpaca, cashmere and fine and coarse wool tops Table 5-3 Relative coefficient of friction (μ), standard errors and average correlation coefficients for wool, cashmere and alpaca fibres
Average coefficient of friction
(μ)
Standard error (nm)
No. of tests r2
Alpaca top
MFD 25.6 μm CVD 34.4%
0.0123 0.0013 15 0.96
Coarse wool top
MFD 26.9 μm CVD 22.7%
0.0145 0.0021 15 0.98
Cashmere top
MFD 17.0 μm CVD 24.5%
0.0135 0.0016 15 0.99
Fine wool top
MFD 17.0 μm CVD 18.9%
0.0144 0.0013 15 0.95

180
5.3.2 Capstan friction tester – macroscale friction Since the wool, cashmere and alpaca fibres did not show any differences in their
nanoscale frictional properties, their macroscale friction was examined using a capstan
friction tester. Unlike the nanoscale friction test, where only the cuticle surface between
the scales edges of fibres was tested, in the macroscale friction test, the scale edges
interact with the asperities of the metal capstan. This interaction between the scale edges
and the surface asperities of the capstan may reflect the potential interaction of the scale
edges with the asperities in human finger tips.
The capstan apparatus used to test the macroscale friction properties of the fibres is
shown in Figure 5-17 along with a typical friction chart used to calculate the coefficient
of friction for a fibre from the coarse wool top (Figure 5-18).
Figure 5-17 Single fibre friction tester
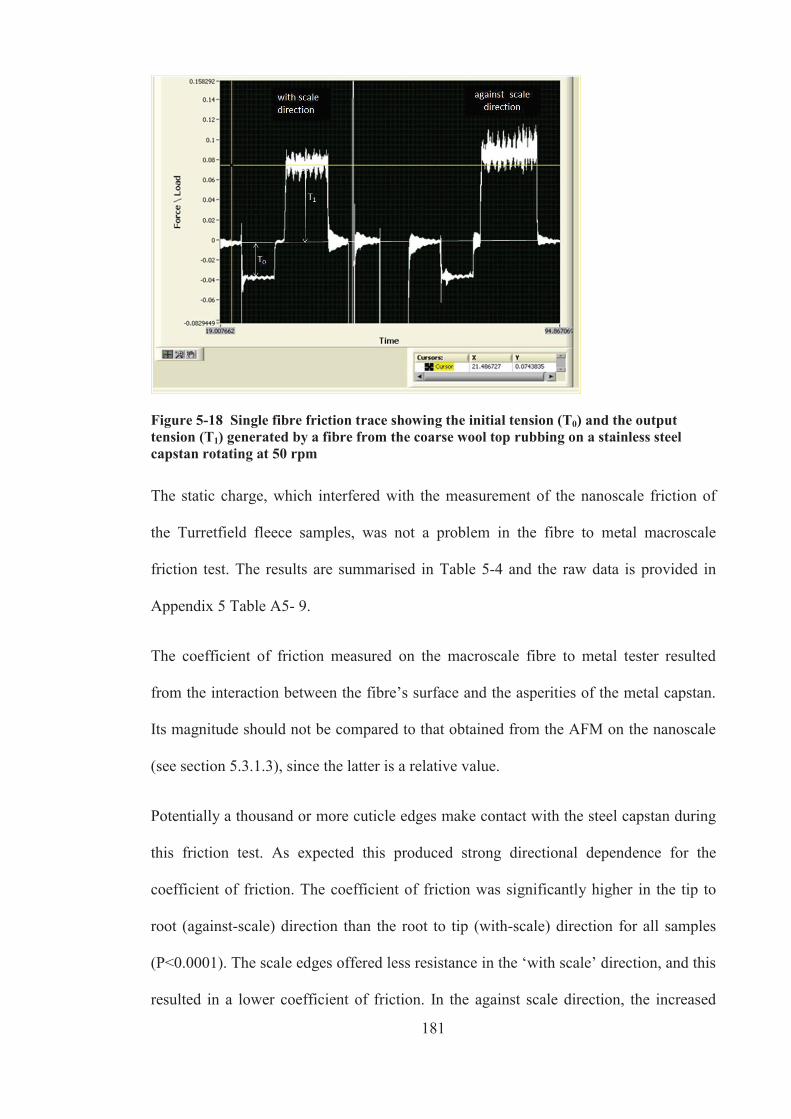
181
Figure 5-18 Single fibre friction trace showing the initial tension (T0) and the output tension (T1) generated by a fibre from the coarse wool top rubbing on a stainless steel capstan rotating at 50 rpm
The static charge, which interfered with the measurement of the nanoscale friction of
the Turretfield fleece samples, was not a problem in the fibre to metal macroscale
friction test. The results are summarised in Table 5-4 and the raw data is provided in
Appendix 5 Table A5- 9.
The coefficient of friction measured on the macroscale fibre to metal tester resulted
from the interaction between the fibre’s surface and the asperities of the metal capstan.
Its magnitude should not be compared to that obtained from the AFM on the nanoscale
(see section 5.3.1.3), since the latter is a relative value.
Potentially a thousand or more cuticle edges make contact with the steel capstan during
this friction test. As expected this produced strong directional dependence for the
coefficient of friction. The coefficient of friction was significantly higher in the tip to
root (against-scale) direction than the root to tip (with-scale) direction for all samples
(P<0.0001). The scale edges offered less resistance in the ‘with scale’ direction, and this
resulted in a lower coefficient of friction. In the against scale direction, the increased

182
interaction between the scale edges and the asperities on the steel capstan resulted in
higher coefficients of friction. This directional dependence has been reported for wool
and alpaca fibres (Wang et al. 2005; Yu & Liu 2006).
Table 5-4 Average fibre-metal coefficient of friction for wool, cashmere and alpaca fibres (Data in brackets represents the standard error)
n=20 Average
coefficient of friction (μw)
Average coefficient of friction (μa)
Average DFE
(μa - μw)
Turretfield wool (low RtC)
MFD 15.8 μm CVD 24.1%
0.25 (0.004)
0.30 (0.002)
0.048 (0.002)
Turretfield wool (high RtC)
MFD 15.8 μm CVD 29.8%
0.25 (0.003)
0.29 (0.003)
0.047 (0.004)
Alpaca top
MFD 25.6 μm CVD 34.4%
0.22 (0.005)
0.26 (0.005)
0.041 (0.004)
Coarse wool top
MFD 26.9 μm CVD 22.7%
0.25 (0.003)
0.31 (0.005)
0.062 (0.004)
Cashmere top
MFD 17.0 μm CVD 24.5%
0.21 (0.003)
0.25 (0.002)
0.045 (0.002)
Fine wool top
MFD 17.0 μm CVD 18.9%
0.24 (0.003)
0.31 (0.006)
0.067 (0.005)
Although the friction properties of cashmere and fine wool were not significantly
different at the nanoscale (see section 5.3.1.3), they were significantly different at the
macroscale. The ‘with scale’ and ‘against scale’ coefficients of friction and DFE of

183
cashmere were significantly lower than those of fine wool from the 17 μm fine wool top
(P<0.001).
Similarly the friction properties of alpaca and coarse wool fibres were not significantly
different at the nanoscale, yet at the macroscale they were significantly different. Alpaca
had significantly lower ‘with scale’ and ‘against scale’ coefficients of friction and lower
DFE compared to wool fibre from the 27 μm fine wool top (P<0.001).
There was no significant difference in the fibre to metal coefficient of friction for the
two Turretfield samples in either the with scale direction (P>0.5), the against scale
direction (P>0.3) and their average DFE (P>0.8).
The capstan friction tester was able to detect differences in the frictional properties of
specialty fibres and wool fibres of similar fibre diameter. The softer specialty fibres had
lower frictional properties which were most likely due to their lower scale heights and
in the case of cashmere, its smoother cuticle surface. Although the soft and harsh
Turretfield samples also had significant differences in scale height, differences in their
frictional properties could not be detected with the capstan friction tester. This may be
due to the difference in scale height of the Turretfield samples not being as large as the
difference in scale height between wool and the specialty fibres. The low DFE of the
Turretfield samples compared to the other wool samples is most likely due to its low
scale height.
It was interesting to note that the friction values obtained in this experiment for wool
fibres were similar to those reported by Wang et al. (2005) for 20.7 μm wool fibre.
Wang et al. (2005) used a rotating capstan fibre friction tester that comprised of an 8
mm diameter steel capstan running at 30 rpm (0.75 m/min surface speed), with a
tensioning weight of 100 mg. However they obtained much lower values for the

184
coefficient of friction of alpaca (μa~0.17, μw~0.15) and lambswool (μa~0.19, μw~0.16)
compared to those reported here for alpaca and Turretfield fleece wool. The difference
in tensioning weights may explain the reduction in friction for alpaca and lambswool
but it doesn’t explain the similarities observed for wool. Yu and Liu (2006) also used a
steel capstan to study the friction properties of wool and alpaca but they used a greater
testing speed (7.5 m/min) and did not specify the pretension used on the fibre. They
obtained coefficients of friction for wool (μa=0.35, μw=0.31) and alpaca (μa=0.28,
μw=0.24).
Friction of fibres is complex and values of the frictional parameters depend on many
factors that include; the mode of contact during friction tests, the morphology of the
surfaces in contact, the contact area, the load or normal force, the dimensions, the
environment and the speed of testing (Gupta 2008; Gupta & El Mogahzy 1991). This
makes it difficult to compare the values of the coefficients of friction, uw and ua, with
those previously reported in the literature.
However regardless of the testing conditions, the present results are consistent with
those published previously for wool and alpaca and show that alpaca, which was
perceived as being softer than wool, had a lower coefficient of friction than wool. The
results reported in this chapter also show that cashmere, which was softer than wool,
also had a lower coefficient of friction than wool on the macroscale.
5.4 Conclusion
The cuticle properties, namely cuticle step height, cuticle interval, cuticle roughness,
cuticle hardness and cuticle friction, of wool, cashmere and alpaca fibres, which were
matched for diameter, were examined in an ambient environment using the SPM. These
185
measurements were made to determine whether cuticle properties could account for the
differences in the softness of these fibres.
This SPM study showed that significant differences exist in the cuticle step height of the
different keratin fibres, including the different wool types. The results are similar to
those reported by others using a SEM to measure scale height (Liu & Wang 2007;
Valbonesi et al. 2010; Varley 2006; Wortmann & Phan 1999) and show that the cuticle
step heights of alpaca and cashmere fibres are significantly lower than those from wool
fibres of a similar diameter. These results, along with the softness scores summarized in
section 3.3.3.5, showed that for fibres of a similar diameter, the fibres with lower cuticle
step heights were significantly softer.
The cuticle interval, or the distance between scale edges of the alpaca fibres was
significantly shorter than that of wool fibres of a similar diameter. Cashmere fibre on
the other hand had a significantly larger cuticle interval compared to wool of a similar
fibre diameter and no difference in the cuticle interval of wool fibres from Turretfield
was detected. It is unlikely that cuticle interval has an effect on the perceived softness of
fibres.
The cuticle surface was significantly smoother for cashmere than for wool of a similar
diameter. Similarly the softer Turretfield sample also had a lower cuticle roughness
which was significant at the 10% level. Whilst these results suggest that a smooth
cuticle surface may contribute to fibre softness, the effect of the cuticle roughness on
the fibre softness is not clear because alpaca, which is also a soft fibre, had a
significantly rougher cuticle surface compared to wool of a similar diameter. Although
its large roughness value was mainly attributed the presence of scale edges in the test
area and to debris on the cuticle surface, its roughness value may not be truly

186
representative of the cuticle surface between scale edges. Hence more work needs to be
conducted to establish the influence of cuticle surface roughness on the softness of
fibres.
The penetration of the tip into the sample at the maximum cantilever deflection was
used as an indicator of the cuticle hardness. Alpaca and coarse wool fibre had the least
tip penetration and as such were deemed harder surfaces than the cuticle of cashmere
and fine wool fibre. The tip penetration into alpaca and coarse wool fibre were not
significantly different from one another, but the cuticle of cashmere was found to be
slightly harder than wool and was significant at the 10% level. Since both alpaca and
cashmere were judged as being significantly softer than wool (see section 3.3.3.5) it is
reasonable to conclude that the hardness of the cuticle has little influence on fibre
softness. The penetration was greatest for the two Turretfield samples.
Even though some differences in surface roughness were found between cashmere and
fine wool, there were no significant differences in their cuticle friction at the nanoscale.
Similarly there were no significant differences in the coefficient of friction of alpaca
and coarse wool fibres at the nanoscale. These results show that no clear relationship
exists between friction at the nanoscale and surface roughness and also no relationship
between friction at the nanoscale and the perceived softness of fibres.
Although the friction properties of cashmere and fine wool and alpaca and coarse wool
were not significantly different at the nanoscale (see section 5.3.1.3), they were
significantly different at the macroscale. The ‘with scale’ and ‘against scale’
coefficients of fibre to metal friction of the specialty fibres were significantly lower than
those of wool of a similar fibre diameter and may explain why the specialty fibres were
softer than wool. Macroscale friction is however not a reliable indicator of softness of

187
wool since the Turretfield samples were assessed as having different softness and yet
showed no difference in the coefficients of fibre to metal friction.
In conclusion, whilst it is acknowledged that the sample size is small in this study,
significant differences in the cuticle spacing, hardness and smoothness were found for
the different keratin fibres, but there were no obvious trends with fibre softness.
Similarly there were no significant differences in the frictional properties of the cuticle
surface of cashmere, alpaca and wool fibres when measured at the nano-scale. However
at the macro-scale level the specialty fibres were shown to have significantly lower
frictional properties than wool fibres of a similar diameter. Although these results
suggest that frictional properties could be an indicator of softness, it was not found to be
reliable for all samples. For instance, judges could reliably distinguish the difference in
the fibre softness of the soft and harsh Turretfield wool samples, yet these samples did
not show any differences in their fibre to metal frictional properties. Macro-scale
friction is likely to be heavily influenced by cuticle step heights and indeed the soft
alpaca and cashmere fibres were shown to have significantly lower cuticle step heights
than those from wool fibres of a similar diameter. The soft Turretfield wool sample also
showed a small but significantly lower cuticle step height than the harsh Turretfield
wool sample. Hence cuticle step height may be a secondary fibre property that is
influential in affecting fibre softness, probably by changing the frictional properties of
the fibre.

188
CHAPTER 6 SOFTNESS OF SINGLE JERSEY FABRICS KNITTED FROM WOOL, CASHMERE AND ALPACA FIBRE
6.1 Introduction
Subjective appraisal of the softness of alpaca, wool and cashmere top reported in section
3.3.3.5 showed that in loose fibre form, cashmere was softer than wool of the same
diameter and that 26 μm alpaca was as softer than the equivalent diameter wool and as
soft as fine wool (17 μm). This chapter examines whether these differences in fibre
softness are maintained when these fibres are transformed into plain, single jersey
knitted structures of similar weight (mass per unit area, g/m2).
When comparing the handle and the mechanical properties of fabrics produced from
different fibres types, it is important to compare fabrics that have a similar fabric
structure and weight. Producing fabrics of the same structure and weight from different
fibres (types) is not trivial. The starting point is that the fibres need to have the same
diameter and this is readily achieved. Fibre length and curvature however, will also
affect the way the fibres process and hence the structure and weight of the final fabric. It
is not easy to match fibres for all three parameters.
Studies on woven fabrics have shown that the handle of lighter weight fabrics are often
preferred over heavier fabrics (Haigh & Robinson 2002; Lamb, Purvis & Robinson
2000; McGregor 2001; Stevens & Mahar 1995). Furthermore, the preferred handle of
woven wool fabric correlated well with objective measures of fabric stiffness (Haigh &
Robinson 2002), with lighter fabrics being less stiff.
Some studies have already compared the softness of fabrics knitted from cashmere and
wool (McGregor 2001; McGregor & Postle 2008) and alpaca and wool (Finn, Vuckovic
& Miller 1999; Swinburn, Laing & Niven 1995; Wang, Wang & Liu 2003). These

189
studies have either compared fabrics that were not of a similar fabric weight or have not
disclosed the weights of the fabrics they were comparing. For example, McGregor and
Postle (2008) found that fabric knitted from 17 μm cashmere was softer, and had lower
bending and shear stiffness, compared to fabric knitted from 17 μm wool; these fabrics
were not the same weight, the cashmere fabric was lighter than the wool fabric by up to
20 g/m2. Wang, Wang and Liu (2003) compared alpaca and wool fabrics knitted from
yarns of the same linear density and found that fabrics knitted from 26 μm alpaca were
softer than fabrics knitted from 25μm wool and those knitted from alpaca-wool blends
containing 40% wool (22 μm). In contrast, Swinburn, Laing and Niven (1995), who also
compared alpaca and wool fabrics knitted from yarns of the same linear density, found
fabrics knitted from 100% alpaca (32.5 μm) were not as soft as blends containing 70%
alpaca (32.5 μm) and 30% wool (22 μm). Similarly Finn, Vuckovic and Miller (1999)
found that fabrics knitted from 25 μm alpaca were not as soft as alpaca-wool blends
containing 50% of 18 μm wool, but these fabrics were knitted from yarns of different
linear density.
It is not clear from the above studies whether the fabric’s mechanical properties and
softness are due to the fibre properties or related to the fabric weight. Curvature is
known to have an impact on the weight of fabric (Haigh & Robinson 2002; Lamb,
Purvis & Robinson 2000; McGregor 2001; Stevens & Mahar 1995). This occurs
because the fabric finishing treatments relax the strains imposed on fibres during
processing and allows the fibres to recover some of their original crimp and the fabrics
bulk up. This is exacerbated in knitwear where fabrics are generally not restrained
during finishing (Haigh & Robinson 2002). Low crimp wool fibres do not bulk up as
much as high crimp wool fibres of the same diameter and have been shown to make
smoother, lighter and thinner finished fabrics (Haigh & Robinson 2002; Lamb, Purvis &
190
Robinson 2000; McGregor 2001; Stevens & Mahar 1995). The handle of these lighter
weight fabrics were preferred by judges (Haigh & Robinson 2002; Stevens & Mahar
1995).
Curvature can be changed by covalently setting the fibres into different shapes (Barach
& Rainard 1950) and processing reduces fibre curvature (Wang, Liu & Wang 2004)
which can be covalently set during top dyeing. The use of different fibre lengths can be
addressed by stretch breaking. Whilst these approaches can go some way towards
overcoming the effect of different fibre parameters leading to different fabric weight, it
is also worthwhile to knit a range of single jersey fabrics with different cover factors
(tightness) to produce a range of fabric weights.
The processing routes used in this chapter to process the alpaca, wool and cashmere
tops were determined by the fibre length characteristics and the availability of
processing and spinning equipment at CSIRO Materials Science and Engineering. Due
to the woollen processing plant at CSIRO not being available for the duration of this
project, cashmere top was purchased with the intention of processing the cashmere fibre
on the worsted system. However the length of the cashmere fibre in the purchased top
was very short (29 mm) and could not be processed on CSIRO’s worsted system. So the
cotton system was used to process the cashmere top and fine wool top that was stretch
broken to a similar fibre length as the cashmere. At present there are only a few reports
on the processing of animal fibres on the cotton system and these have focussed on
blends with cotton (Iype et al. 2000; Madeley 1994; McGregor 2001; Robinson,
Cawood & Dobson 1977,1978b). This represents an opportunity to contribute to the
understanding of the yarn and fabric properties of pure cashmere and wool from high
twist, compact cotton spun yarns, for which there is no data currently available. It must
be noted that it is not the intention of this work to discuss the economic viability of
191
processing animal fibres (in top form) on the cotton system, rather, to use the cotton
system simply as a means of producing yarns from tops containing short fibres. The 26
μm alpaca and 27 μm ecru and top dyed tops were of an ideal length for processing on
the worsted system and this enables comparisons with the softness data obtained by
Wang, Wang and Liu (2003), Swinburn, Laing and Niven (1995) and Finn, Vuckovic
and Miller (1999).
The KESF is used to examine the bending properties of the experimental fabrics and the
PhabrOmeter (Nu Cybertek Inc) (Pan 2006,2007) was chosen to measure the handle
properties. Data derived directly from the PhabrOmeter extraction curves can be used in
the prediction models developed by Wang, Mahar and Hall (2012) to predict eight
different handle characteristics including fabric softness. This is the first time that the
PhabrOmeter and Wang’s prediction models are used to compare the handle of similarly
engineered fabrics knitted from cotton-spun wool and cashmere yarns and also from
worsted-spun alpaca and wool yarns.
In summary the objectives of this chapter are:
To spin pure cashmere and wool yarns on a cotton ring spinning system and
compare their yarn properties. To produce similar weighted knitted fabrics and
compare their softness subjectively. This data is non-existent for pure cashmere
and pure wool cotton spun yarns that are highly twisted and have a non-bulky
yarn structure.
To spin alpaca and coarse wool (ecru and top dyed) yarns using conventional
worsted ring spinning and compare their yarn properties. To produce similar
weighted knitted fabrics and compare their softness subjectively. This data will

192
be compared to the existing data of Wang, Wang and Liu (2003) and Finn,
Vuckovic and Miller (1999).
To obtain objective data on the handle (PhabrOmeter) and bending properties
(KESF) of the single jersey fabrics knitted from the alpaca, wool and cashmere
yarns.
6.2 Materials and methods
6.2.1 Wool, alpaca and cashmere tops Cashmere top (~17 μm) was purchased from China through textile, yarn and fibre
agents Cust & Jacobson Pty Ltd Textile Yarn & Fibre Agents. Alpaca top (~26 μm), ~
10 kg, was sourced from CSIRO’s top stock storage. Ecru wool tops (~17 μm and ~27
μm), approximately 10 kg each, were also sourced from CSIRO’s top stock with the
view to match the wool top diameter, length and curvature as closely as practicable to
those of the commercial alpaca and cashmere tops. Although it was easy to match the
coarse diameter and fibre length of alpaca with wool it was not possible to obtain wool
fibres with such low fibre curvatures as alpaca. Since fibre crimp is pulled out in
processing greasy wool to top (Fish, Mahar & Crook 1999; Lamb 1997), it was thought
worthwhile to permanently set some of the coarse wool top (~27 μm) fibre in its lower
curvature configuration during a top dyeing process to get closer to matching fibre
curvature. As with alpaca, it was easy to match the fine diameter of the 17 μm cashmere
fibre with 17 μm wool; however the mean fibre length and curvature of the wool fibre
was much greater than the cashmere as shown in Table 3-19. To match the short fibre
length of cashmere, fine (~17 μm) wool top was stretch broken. Approximately 9 kg
each of top dyed and stretch broken fibre were available for processing. The fibre
specifications for the commercial wool, alpaca and cashmere tops are provided in Table
3-19 and details on the stretch breaking and top dyeing procedures are given in sections

193
3.2.2.1and 0 respectively. Care was taken to ensure that fibres and fabrics were
processed using the same processing routes so that yarns and fabrics can be compared.
6.2.2 Yarn Production
6.2.2.1 Cashmere and stretch broken wool on the cotton ring spinning system The fine wool worsted top had a mean fibre length of 58 mm (Table 3-19) and required
stretch breaking to reduce the average length of the fibres to more closely match the
cashmere and allow it to be processed on the cotton system. The procedure used to
stretch break the wool to 33 mm has been described in 3.2.2.1.
Stretch broken wool and cashmere slivers were refreshed by hand spraying a fine mist
of tap water into each storage can (approximately 100 ml for each 10 kg lot) and the
cans were covered with plastic bags and left overnight to allow the moisture to penetrate
through the fibre mass. This ensured the fibres had sufficient moisture to prevent static
and hence roller lapping during processing. At least two drawing passages were made
on a Trützschler HSR 1000 draw frame, and the autoleveller was used on the last pass to
ensure satisfactory sliver evenness. Sliver lengths of 1 m were taken to estimate the
linear density of the sliver at all stages of gilling and drawing. The sliver irregularity
(U%) was measured on an Uster Tester 4 using a testing speed of 50 m/min over a
period of 1 minute. The drawn sliver was converted into roving on a Zinser 660 FU
roving machine. Approximately 38 twists per metre (tpm) was inserted into each roving
strand to help with fibre cohesion and the roving irregularity (U%) was measured on a
Uster Tester 4 using a testing speed of 50 m/min over a period of 1 minute. Roving
lengths of 1 m were taken to estimate the linear density of the roving. The finest yarn
that can be spun is limited by the minimum number of fibres in the yarn cross section.
The number of fibres (n) in the yarn cross section is estimated using equation (6.1) (Rae
& Bruce 1973), where the linear density of the yarn is in the units of tex (g/1000m), μ is
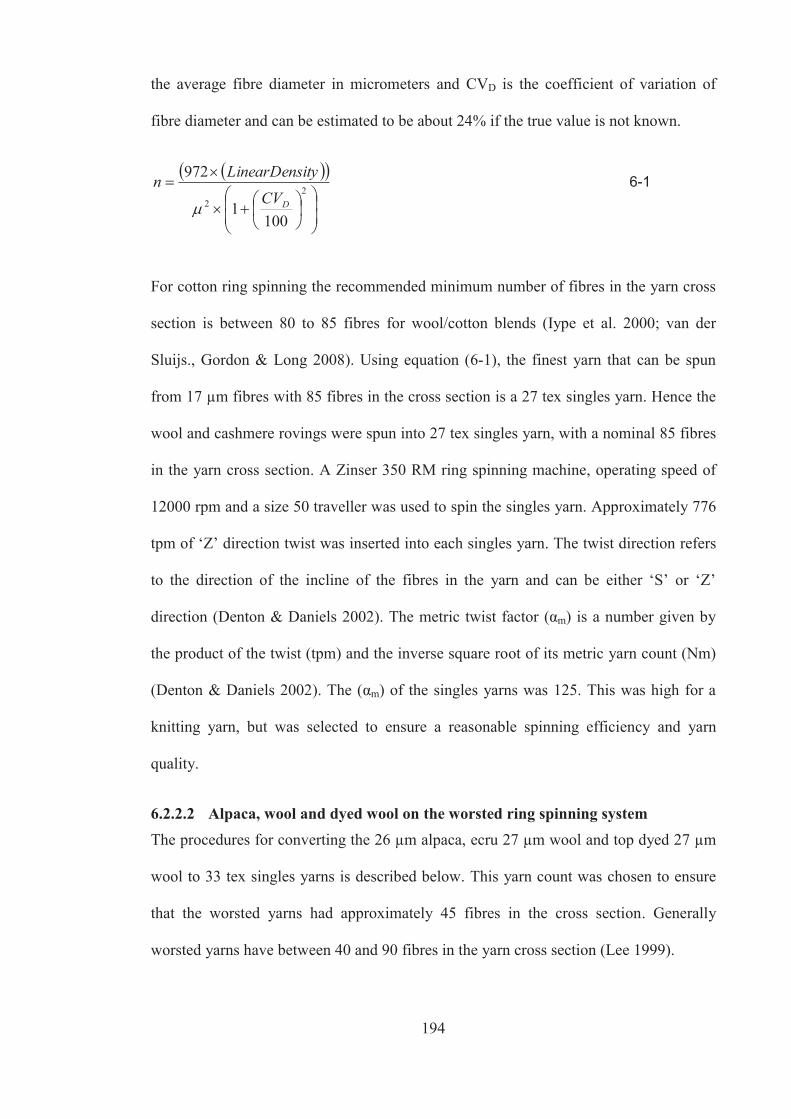
194
the average fibre diameter in micrometers and CVD is the coefficient of variation of
fibre diameter and can be estimated to be about 24% if the true value is not known.
22
1001
972
DCV
ityLinearDensn 6-1
For cotton ring spinning the recommended minimum number of fibres in the yarn cross
section is between 80 to 85 fibres for wool/cotton blends (Iype et al. 2000; van der
Sluijs., Gordon & Long 2008). Using equation (6-1), the finest yarn that can be spun
from 17 μm fibres with 85 fibres in the cross section is a 27 tex singles yarn. Hence the
wool and cashmere rovings were spun into 27 tex singles yarn, with a nominal 85 fibres
in the yarn cross section. A Zinser 350 RM ring spinning machine, operating speed of
12000 rpm and a size 50 traveller was used to spin the singles yarn. Approximately 776
tpm of ‘Z’ direction twist was inserted into each singles yarn. The twist direction refers
to the direction of the incline of the fibres in the yarn and can be either ‘S’ or ‘Z’
direction (Denton & Daniels 2002). The metric twist factor (αm) is a number given by
the product of the twist (tpm) and the inverse square root of its metric yarn count (Nm)
(Denton & Daniels 2002). The (αm) of the singles yarns was 125. This was high for a
knitting yarn, but was selected to ensure a reasonable spinning efficiency and yarn
quality.
6.2.2.2 Alpaca, wool and dyed wool on the worsted ring spinning system The procedures for converting the 26 μm alpaca, ecru 27 μm wool and top dyed 27 μm
wool to 33 tex singles yarns is described below. This yarn count was chosen to ensure
that the worsted yarns had approximately 45 fibres in the cross section. Generally
worsted yarns have between 40 and 90 fibres in the yarn cross section (Lee 1999).
195
26 μm Alpaca top: To prepare the alpaca top for subsequent processing, it was
refreshed with one pass on an Ingolstadt intersecting gill box and an emulsion
containing 100ml of Selbana 3001 (antistat), 100ml of Selbana 4611(cohesion agent)
and 400ml of water was sprayed (0.7% oww) as the alpaca sliver left the drafting zone.
This gill was operated at 60 m/min and the draft and ratch settings were set to produce
an output sliver weight of approximately 20 ktex. During this pass on the gill box, static
problems were encountered even before the alpaca sliver left the drafting zone. The
static charge caused the alpaca fibre to lap on the draft roller. This was alleviated by
hand spraying the alpaca sliver cans with the emulsion and allowing the moistened
sliver to rest for two hours before gilling resumed. At this stage, further processing
difficulties were anticipated for the alpaca fibre, so a decision was made to minimise
any further processing to prevent further static problems. Hence the alpaca top was not
recombed and only underwent two further drawing gills before roving. These were
conducted on an NSC GN6 intersecting gill (60 m/min) and NCS GV11 vertical gill
(100 m/min). A Sant Andrea RF4A Vertical Rover operating at 150 m/min was used to
produce 690 tex roving. Spinning was conducted on a FLC 16 Cognetex spinning
frame. A spinning draft of 20.9 was required to produce 33 tex singles yarn with 440
tpm ‘Z’ twist and a metric twist factor (αm) of 80. This twist factor is typically used for
knitting yarns. Tensions during spinning often caused the roving to draft apart as it was
leaving the roving package. To reduce the tension on the alpaca rovings during
spinning, the rovings were removed from the package and coiled into large beakers and
the spinning speed was conducted at about 5500 rpm.
27 μm ecru wool top and 27 μm top dyed wool top: Normal practice of a worsted mill
requires top dyed wool to be recombed prior to drawing for spinning. This procedure
was followed for ecru wool top as well. The wool tops were refreshed with two passes
196
on an Ingolstadt intersecting gill box at 60 m/min. An emulsion containing 100 mls of
Selbana 3001 (antistat) and 400mls of water was sprayed (0.5% oww) as the wool sliver
left the drafting zone. Recombing was carried out on a Schlumberger PB31 comb
running at 175 cycles per minute. The top comb pin density was 28 pins/cm and the nip
distance (noil set) was 34 mm. The input load was maintained at 308 ktex, and the
output weight of the resulting combed slivers were 20 ktex and 22 ktex for the ecru and
dyed wool respectively. The slivers were given two post comb gills on a Sant Andrea
SN10 gill box auto leveller, and since the NSC GN 6 Autoleveller gill box was out of
commission at the time, a further two drawing gills were carried out on the same Sant
Andrea SN10 gill box auto leveller running at 160 m/min. The final drawing gill was
conducted on a NCS GV11 vertical gill at 100 m/min to produce a 4ktex sliver for
roving. The drawn slivers were roved on a Sant Andrea RF4A Vertical Rover at 150
m/min to produce 2x330 tex roving. Spinning was conducted on a FLC 16 Cognetex
spinning frame, with a spinning draft of 20.15 to produce 33 tex singles yarn with 440
tpm ‘Z’ twist and a metric twist factor (αm) of 80. A spinning speed of 9000 rpm was
used with a size 24 traveller.
6.2.2.3 Yarn testing, setting and folding Singles yarn testing: Three random bobbins were selected for each singles yarn and
these were conditioned from the dry side by placing them in an oven at 50°C overnight,
then allowing them to recondition for at least 24 hours in the standard atmosphere of 20
± 2°C and 65 ± 2% (RH). Linear density of the singles yarn on each bobbin was
determined according to Australian Standard AS-2001.2.23. (1990). The yarn evenness
also known as yarn irregularity, and the frequency of yarn imperfections such as thick
and thin places, neps and hairiness were measured according to ASTM D 1425-09 Test
Method. (2009) on a Uster Tester 4, using a testing speed of 400 m/min. The twist in
197
singles yarns was determined using Australian Standard AS-2001.2.14. (1987). The
breaking force, elongation and tenacity of the singles yarns were determined using an
Uster Tensorapid 3 v6.1 following Australian Standard AS-2001.2.7. (1987). Six
bobbins were tested per samples and 50 individual tests were made on each bobbin
giving a total of 300 tests on each sample. A gauge length of 500 mm and a testing
speed of 500 mm/min were used.
Yarn clearing and setting: Prior to setting, singles yarns were wound and cleared of
faults on a Schlarfhorst 238 RM Autoconer at a speed of 500 m/min. This speed was too
high for the weak alpaca yarn and the alpaca yarn was run at 200 m/min under
minimum tension. The number of faults and splices in the singles yarns were recorded.
Following clearing, singles yarns were steamed in an autoclave. Two steaming cycles
were carried out: vacuum at -88 kPa, steam at 88°C for 5 minutes and exhaust. The
second steaming cycle was followed by a final vacuum at -88 kPa and exhaust.
Assembly winding and two-folding yarns: Singles yarns were assembly wound on a
Scharer Schweiter Mettler (SSM) assembly winder and twisted at 6500 rpm on a
Volkman VTS07 twister. Minimum tension was used to twist the alpaca yarns. A series
of trials were initially conducted to establish a folding twist that would minimise
spirality in single jersey fabrics. The results of this preliminary study are provided in
Table A4.1 in Appendix 4 and show that to minimise spirality, the worsted spun yarns
(26 μm alpaca, 26 μm ecru wool and 26 μm top dyed wool) should be twisted at 55% of
the singles twist and the cotton spun yarns (17 μm cashmere and 17 μm stretch broken
wool) should be twisted at 50% of the singles twist. Hence a folding twist of 242 tpm
(αm=62) was inserted in the ‘S’ direction for the worsted spun alpaca and wool yarns
and 388 tpm of folding twist (αm=90) was inserted in the ‘S’ direction for the cotton
spun cashmere and stretch broken wool yarns. After twisting, the two-fold yarns were

198
given two steaming cycles following the same procedure used for singles yarns
(described above) and waxed on a Fadis SpA hank to cone winder in readiness for
knitting.
6.2.3 Knitting Initially it was planned to produce light weight knitwear by knitting the singles yarn
into single jersey fabrics, however the alpaca singles yarn was too weak and could not
be knitted. Therefore a decision was made to knit single jersey fabrics from the five
two-folded yarns only. The two-fold yarns made from the cotton spun cashmere and
stretch broken wool and the worsted spun alpaca, ecru wool and top dyed wool were
knitted on a 14 gauge (444 needles), 10” Lawson Hemphill FAK circular knitting
machine using an intermediate speed setting of 6 for all yarns. Although some yarns
could be knitted at higher speeds, the intermediate speed was chosen to prevent the yarn
from breaking during knitting. This was particularly important for the alpaca yarns
which drafted apart easily. Fabrics of three different cover factors (machine tightness
factors) of 13, 14 and 15 tex½/cm were knitted from each yarn. The cover factor is a
number that indicates the cover or relative looseness or tightness of the knitting and is
calculated from the square root of the yarn’s linear density (tex) divided by the stitch
length (Denton & Daniels 2002). The imperial cover factor, which is more widely used
in the textile industry, is calculated from the inverse of the product of the stitch length in
inches and the square root of the worsted yarn count (WC). The machine tightness
factors can be converted to their imperial equivalents by dividing by 11.72, so the
machine tightness factors of 13, 14 and 15 tex½/cm are equivalent to the imperial cover
factors of 1.11, 1.2 and 1.28 (inches.WC½)-1. The gears and settings used to achieve
these machine tightness factors for the five yarns are provided in Table A4.2 in
Appendix 4. Yarns were knitted into a continuous tube containing approximately two
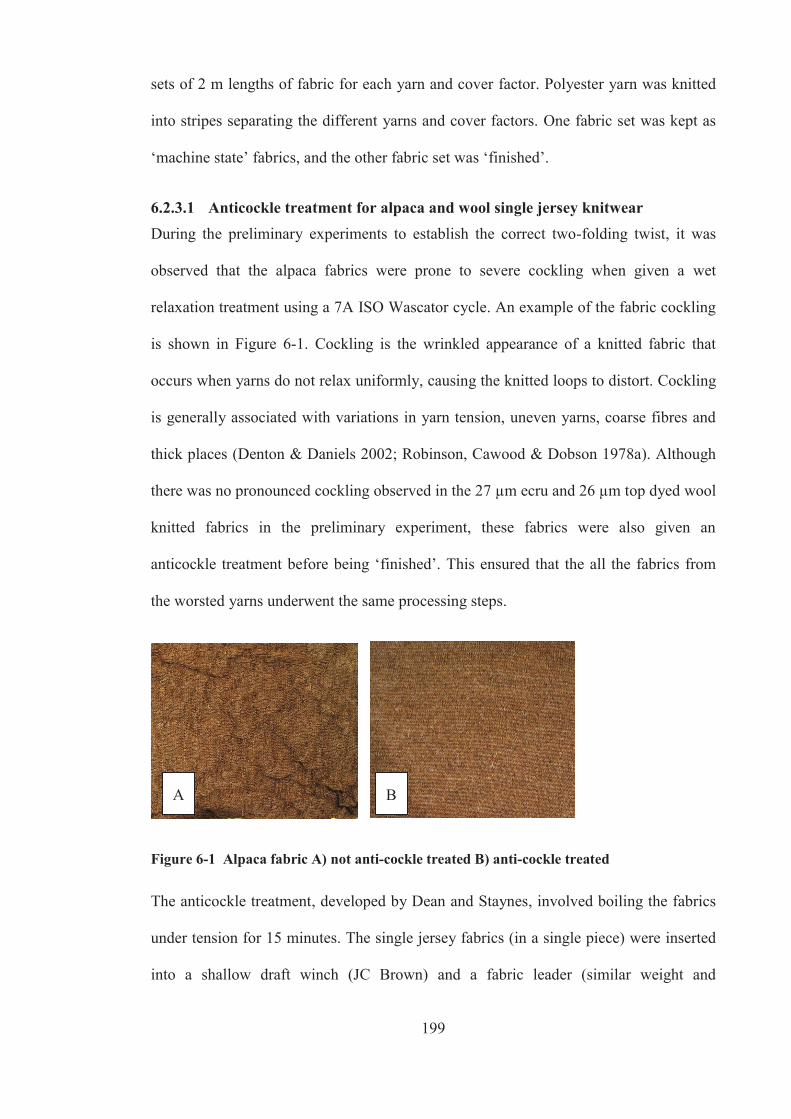
199
sets of 2 m lengths of fabric for each yarn and cover factor. Polyester yarn was knitted
into stripes separating the different yarns and cover factors. One fabric set was kept as
‘machine state’ fabrics, and the other fabric set was ‘finished’.
6.2.3.1 Anticockle treatment for alpaca and wool single jersey knitwear During the preliminary experiments to establish the correct two-folding twist, it was
observed that the alpaca fabrics were prone to severe cockling when given a wet
relaxation treatment using a 7A ISO Wascator cycle. An example of the fabric cockling
is shown in Figure 6-1. Cockling is the wrinkled appearance of a knitted fabric that
occurs when yarns do not relax uniformly, causing the knitted loops to distort. Cockling
is generally associated with variations in yarn tension, uneven yarns, coarse fibres and
thick places (Denton & Daniels 2002; Robinson, Cawood & Dobson 1978a). Although
there was no pronounced cockling observed in the 27 μm ecru and 26 μm top dyed wool
knitted fabrics in the preliminary experiment, these fabrics were also given an
anticockle treatment before being ‘finished’. This ensured that the all the fabrics from
the worsted yarns underwent the same processing steps.
Figure 6-1 Alpaca fabric A) not anti-cockle treated B) anti-cockle treated
The anticockle treatment, developed by Dean and Staynes, involved boiling the fabrics
under tension for 15 minutes. The single jersey fabrics (in a single piece) were inserted
into a shallow draft winch (JC Brown) and a fabric leader (similar weight and
A B

200
construction) was used to join the ends of the fabric. A bath containing 0.5 g/L of non-
ionic surfactant (Propscour) was set at 40°C and the winch was run at 40 m/min. The
temperature was increased at a rate of 1.5°C/min and fabrics were boiled for 15
minutes. To prevent setting in running marks or ‘cracking’ the fabric, the bath was then
cooled slowly to 50°C at a rate of 1°C/min and the tension in the fabric was maintained
by the operation of the winch (similar to the crabbing process (Denton & Daniels
2002)). The scour liquor was dropped and the fabrics were rinsed twice for 5 minutes
each in ambient tap water. The rinsed fabrics were spun in a Burton Hydroextractor to
remove excess water and were rolled onto perforated plastic formers (50 mm diameter)
and dried overnight in an oven at 50 °C. The following day, the fabrics were rerolled in
the opposite direction and again were allowed to dry overnight to give the fabrics an
even flat finish.
6.2.3.2 Finishing of knitted fabrics The fabric set allocated to ‘finishing’ included the anticockle treated single jersey
fabrics produced from the worsted spun 26 μm alpaca, 27 μm ecru wool and the 27 μm
top dyed wool and also the single jersey fabrics knitted from the cotton spun 17 μm
cashmere and stretch broken 17 μm wool. The cotton spun single jersey fabrics were
dry- finished with a simple 1 minute steam relaxation on an open Hoffman press
followed by a 30 second vacuum cooling. Single jersey fabrics were conditioned from
the dry side by placing them in an oven at 50°C overnight, then allowing them to
recondition for at least 24 hours in the standard atmosphere (20 °C and 65 % RH)
before testing.
6.2.4 Fabric testing
6.2.4.1 Fabric mass per unit area (weight), thickness and spirality Each machine state and finished fabric was tested for fabric mass per unit area, fabric
spirality and fabric thickness. The fabric mass per unit area (g/m2) was determined using
201
AS 2001.2.13-87 and the average mass per unit area (g/m2) of three evenly spaced
samples was recorded. The degree of fabric spirality was measured according to
Woolmark Test Method 276-May 2000. Fabrics were given a 1 x 7A Wascator wash
cycle, dried in a 50°C oven overnight and then reconditioned to standard atmospheric
conditions. The average of three angle readings was recorded. The fabric thickness was
measured at AWTA (Melbourne Laboratory) using a Digimatic Indicator (Mitutoyo).
The diameter of the foot was 24.725 mm and measurement was made at a pressure of
2.02 kPa and the average thickness of three evenly spaced samples was recorded.
6.2.4.2 Bending of knitted fabrics Three fabric samples, 2.5 x 2.5 cm in size, were randomly cut from each of the 30,
conditioned experimental fabrics. The edges of the machine state fabrics rolled severely
so it was not possible to conduct the bending tests on them. Hence bending testing was
carried out on only the 15 ‘finished’ fabrics. The bending deformation properties of the
finished fabrics were measured on KES-FB2 (small Pure Bending Tester) using a
bending rate of 0.5 cm-1/sec and machine sensitivity settings of 5 x 1. The fabric was
mounted so that the bending moment was applied perpendicular to the course direction.
The fabric was bent through an arc between the curvatures of -2.5 and 2.5 cm-1, hence
both the fabric face and fabric back were situated on the convex or outside of the arc at
one time during the test. Software developed at CSIRO (Division of Materials Science
and Engineering) was used to collect and analyse the bending rigidity (Bfab, μN.m) and
bending hysteresis (2HB, μN) for each fabric.
6.2.4.3 Objective evaluation of knitted fabric handle using the PhabrOmeter The experimental fabrics were tested on a PhabrOmeter Model 3 system (Nu Cybertek
Inc) located at the Australian Wool Testing Authority Limited (AWTA), Melbourne
laboratories. The PhabrOmeter was used to evaluate the handle properties of the knitted

202
fabrics. Three circular samples of 100cm2 fabric were randomly cut from each fabric
sample. For the test, a sample was placed face down on the sample holder in the
PhabrOmeter and the mass plate (453.6g) was loaded on to the sample. The superlight
fabric category (<280 g/m2) was used for testing and the extraction curve, which was
generated as the force rod pushed the sample through the nozzle, was recorded. This test
was repeated on the remaining samples and occasionally insertion/extraction curves
were rejected, so replacement samples were cut and analysed. For each
insertion/extraction, the PhabrOmeter software provided a radar fabric fingerprint
diagram. The software developed by Wang (H.Wang, personal communication, 20
March 2012) was used to smooth and average the three insertion/extraction curves
collected for each sample. Seven curve parameters were measured from the smoothed
curve and these included the slope of the incline (tangent of angle φ) (S1), the height of
the curve peak (H), the deflection position of the curve peak (bounded by the projection
triangle) (Dp), the post peak height (the distance between the top of the peak and the
apex of the projection triangle) (PPH), the width of the peak (bounded by the projection
triangle) (w), the slope of the decline (tangent of angle Φ) (S2) and the post defection
position of the curve peak (bounded by the projection triangle) (pDp). These curve
parameters were used along with the fabric mass (M) and fabric thickness (T) to
estimate the eight different handle characteristics for the experimental fabrics. These
handle characteristics were rough/smooth, clean/hairy, dry/greasy, soft/hard, tight/loose,
cool/warm and heavy/light and Table 6-1 lists the curve parameters used for the
calculations of each specific handle characteristic. These parameters are different from
those in Table 2-1 which were used in a recent paper (Wang, Mahar & Hall 2012) and
are believed to be an improvement because more effective algorithms were used to
derive these new predictions (H.Wang, personal communication, 20 March 2012).
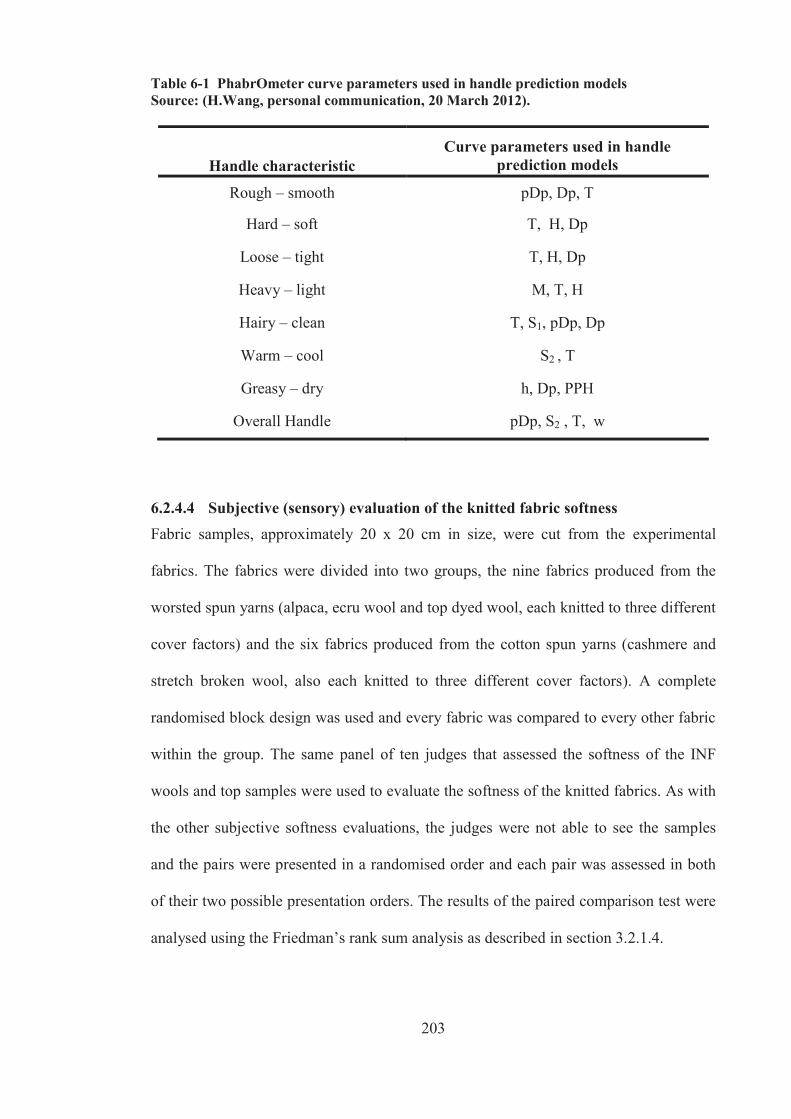
203
Table 6-1 PhabrOmeter curve parameters used in handle prediction models Source: (H.Wang, personal communication, 20 March 2012).
Handle characteristic Curve parameters used in handle
prediction models
Rough – smooth pDp, Dp, T
Hard – soft T, H, Dp
Loose – tight T, H, Dp
Heavy – light M, T, H
Hairy – clean T, S1, pDp, Dp
Warm – cool S2 , T
Greasy – dry h, Dp, PPH
Overall Handle pDp, S2 , T, w
6.2.4.4 Subjective (sensory) evaluation of the knitted fabric softness Fabric samples, approximately 20 x 20 cm in size, were cut from the experimental
fabrics. The fabrics were divided into two groups, the nine fabrics produced from the
worsted spun yarns (alpaca, ecru wool and top dyed wool, each knitted to three different
cover factors) and the six fabrics produced from the cotton spun yarns (cashmere and
stretch broken wool, also each knitted to three different cover factors). A complete
randomised block design was used and every fabric was compared to every other fabric
within the group. The same panel of ten judges that assessed the softness of the INF
wools and top samples were used to evaluate the softness of the knitted fabrics. As with
the other subjective softness evaluations, the judges were not able to see the samples
and the pairs were presented in a randomised order and each pair was assessed in both
of their two possible presentation orders. The results of the paired comparison test were
analysed using the Friedman’s rank sum analysis as described in section 3.2.1.4.
204
In addition to the paired comparison analysis, five fabrics (one fabric from the cashmere
cotton spun, fine wool cotton spun, alpaca worsted spun, ecru wool worsted spun and
top dyed wool worsted spun) were presented to the same panel of judges. This time the
judges were able to see the five fabrics and they were asked to quantify the softness of
fabrics by placing them in order of softest to least soft. The softest fabric was given a
score of ten and the least soft fabric was given a score of one. The judges were asked to
give the remaining three fabrics a score between one and ten. The average score was
calculated for each fabric and a ranking order established. This scoring system was used
to be compatible with the scoring system used by Wang, Mahar and Hall (2012).
6.2.4.5 Statistical analysis A two factor analysis of variance (Anova) with replication (α=0.05) was conducted
using Microsoft Office Excel (2003). The Anova was used to identify if fabric variables
(fibre type and machine tightness factor) and first order interactions between these
factors had a significant effect on mass per unit area, fabric thickness and fabric bending
properties of the experimental fabrics. The rejection of any null hypothesis in this two
factor Anova indicates that there is an effect and sample means are not identical.
However it does not indicate which pairs of means differ. An independent samples t-
test, Microsoft Office Excel (2003), was used to establish if the cashmere fabric and
stretch broken wool fabric differed in mass per unit area, thickness and bending
properties at each level of machine tightness (cover factor). An F test was conducted
prior to each t-test to assess the equality of variance. Comparisons of the fabrics
produced from the worsted spun yarns involved comparing the means of more than two
groups, so a Post Hoc Tukey’s HSD (honestly significant difference) test was used to
determine which pairs of means differed. The Tukey HSD was calculated using

205
nMSwithinqHSD df , where q(df,α) is obtained from the Q table, MSwithin is from the
Anova and n is the number of data points within each group.
Means that differed significantly were marked with superscripted letters and symbols in
the tables. Different superscripted letters highlighted the means that differed
significantly in the columns (same machine tightness factor, different fibre types),
whilst different superscripted symbols highlighted the means that differed significantly
in the rows (same fibre type, different machine tightness factor).
The statistical techniques used to analyse the subjective data is provided in section
3.2.1.4.
6.3 Results and discussion
6.3.1 Processing and yarn properties
6.3.1.1 Cashmere and wool –processed on the cotton system The standard atmosphere in the cotton processing mill was drier than the wool
processing mill. The relative humidity (RH) in the cotton mill was below 60% and
consequently the cashmere and wool top needed to be sprayed with water and covered
with plastic bags. The moistened slivers were rested for several hours to allow the
moisture to penetrate the fibre.
The machine setting for processing cashmere and stretch broken wool on the cotton
system are summarized in Tables A2.1 to A2.3 in Appendix 2. The stretch broken wool
sliver processed without any difficulties on the Cotton system’s Trützschler draw frame,
the Zinser Flyer Rover and the Zinser cotton ring spinner. However problems were
encountered when processing the cashmere fibre on the Trützschler draw frame. Fly
build-up in the take-down caused blockages and the auto-leveller could not be set. The
excessive fly was presumably due to static build up and the large number of very short

206
fibres in the cashmere sliver. An additional pass on the auto-leveller draw frame was
made to improve the evenness of the cashmere sliver. The cashmere fibre roved well,
however after processing, dirt residues were noticed on the rollers of the flyer rover
including the take down funnel and coiler of the draw frame. Excessive fly build-up was
also noticed on the Zinser ring spinner and had to be blown off with compressed air to
prevent its incorporation as short thick faults in the yarn as it was being spun.
The coefficient of variation (CVm, %) of mass is a well-known value for the
determination of the evenness of slivers, rovings and yarns. The test is based on the
measurement of mass using a capacitive sensor and the lower the CVm value, the more
even the material. The USTER TESTER 4 was used to measure the coefficient of mass
variation (CVm, %) in the drawn sliver and roving produced from the stretch broken
wool and cashmere top. The evenness results provided in Table 6-2 show that the
stretch broken wool sliver and roving was more even than the cashmere sliver and
roving. The higher CVm value and poorer quality of the cashmere sliver and roving
fibre is most likely associated with the fly build up preventing the use of the
autoleveller. McGregor (2001) also observed, in worsted processing, a higher CVm in
cashmere roving (12.8%) compared to wool (9.8%). He attributed this to the operation
of the rover and the higher incidence of fibres less than 25 mm in length and the lower
Hauteur of the cashmere fibre.
Table 6-2 Drawn sliver and roving evenness
Wool Cashmere
Drawing passage 1 2 1 2 3
Drawn Sliver CVm (%) 3.72 2.88 5.02 4.04 3.90
Flyer Rover CVm (%) 4.51 6.48
Although a preliminary spinning experiment showed that a 25 tex singles yarn could be
spun from the stretch broken wool with only 17 ends down per machine spinning hours

207
(EDMSH), in this current work, a 27 tex singles yarn with at least 85 fibres in the cross
section was spun. The stretch broken wool processed very well on the cotton system and
was successfully spun in to a 27 tex singles yarn with only 12 EDMSH. Similarly, a 27
tex singles cashmere yarn was also spun, however its spinning efficiency was not as
good with 85 EDMSH occurring.
The Schlarforst autoconer/winder made 33 fault cuts per 100km of yarn for the stretch
broken wool singles yarn and 105 fault cuts per 100km of yarn for the cashmere singles
yarns respectively. The USTER yarn irregularity results show that compared to the
stretch broken wool yarn the cotton spun cashmere singles yarn was more irregular,
with a greater U% which is ratio of the area of variation above and below the mean
value, a greater coefficient of mass variation (CVm %) and a greater index of yarn
irregularity (I) which is the ratio of between the measured irregularity and the limit
irregularity of an ideal yarn. The cashmere yarn also contained significantly more yarn
imperfections, thick and thin places and nep faults, than the stretch broken wool yarn
and all these are most likely due to the problems associated with drafting and the
excessive fly build-up during ring spinning. The cashmere singles yarn was hairier than
the stretch broken wool singles yarn. Yarn hairiness increases as the proportion of short
fibres in the yarn increases (Barella 1983) and the increased hairiness of the cashmere
yarn can be attributed to its high content of short fibres (< 20 mm) as reported in Table
3-17.
Table 6-3 provides the measured yarn properties for the cotton spun wool and cashmere
singles yarns. The Uster Tensorapid data shows the cashmere singles yarn is weaker,
with a lower breaking force, tenacity and elongation than the stretch broken wool
singles yarn.

208
Table 6-3 Average yarn properties of wool and cashmere singles yarns spun on the cotton system
Wool
(± 95% Confidence Interval)
Cashmere (± 95% Confidence
Interval) Singles Yarn
Linear density (g/km) 27.6 (1.5) 26.8 (0.5)
Number of fibres in cross section
88 85
Singles Twist (Z) (tpm) 772 (18) 773 (12)
Break Force (cN) 138 (1) 107 (2)
Elongation (%) 15.4 (0.5) 7.1 (0.2)
Tenacity (cN/tex) 5.00 (0.1) 3.97 (0.1)
U (%) 11.0 (0.5) 12.8 (0.2)
CVm (%) 13.8 (0.6) 16.3 (0.2)
Index of Irregularity 1.13 (0.05) 1.39 (0.02)
Thin Places/km (-50%) 4.2 (4.3) 44.6 (12.6)
Thick Places/km (+50%) 15.4 (5.6) 226.7 (45.3)
Neps/km (+200%) 7.5 (5.7) 144.2 (26.2)
Hairiness 6.29 (0.13) 8.47 (0.06)
Schlarforst fault cuts/100km 33 105
Folding twist (S) (tpm) 394 (4) 395 (4) Two-Fold Linear Density
(g/km) 56 (1) 54 (1)
6.3.1.2 Alpaca and wool – processed on the worsted system Although it was originally planned to process the alpaca and wool tops using the same
worsted processing, static and poor sliver cohesion in the alpaca top resulted in the
decision to shorten the alpaca processing route, skipping the recombing step and only
using two instead of three drawing gills. Static is a known problem in processing alpaca
fibre (Wang, Wang & Liu 2003) and as such these fibres are typically processed in mills
where the relative humidity is maintained at 85%. The relative humidity of the CSIRO

209
mill is only 65%. The initial input slivers were hand sprayed with water and this helped
control static at the draft rollers on the Ingolstadt gill box. It was also noticed that the
alpaca slivers were very weak and drafted apart easily causing many ends to drop out
during processing. This lack of cohesion between the alpaca fibres, static and problems
with roller lapping were frequently encountered when alpaca slivers were being
processed too dry or if they contained wet patches from the hand spraying. A build up
of dirt and residue on the front rollers also contributed to roller lapping and breaks and
an example of this dirt build-up on the front roller of the GN 6 gill is shown in Figure
6-2. Wet patches also caused the formation of slubs in the alpaca roving.
In comparison, the ecru and dyed wool lots processed without any problems on the
worsted system. The machine settings used for processing alpaca and wool on the
worsted system are provided in Tables A2.4 to A2 in Appendix 2.
Figure 6-2 Dirt build-up on GN 6 roller
The evenness results provided in Table 6-4 show that alpaca sliver coming off the NSC
GV 11 gill and alpaca roving coming off the Sant Andrea RF4A Vertical Rover were
less even than the wool slivers and roving.

210
Table 6-4 Sliver and roving evenness (worsted system)
Coarse Wool Top dyed wool Alpaca
GV11 CVm (%) 2.91 3.60 5.37
Vertical Flyer Rover CVm (%) 7.45 7.96 13.09
The higher CVm value and poorer quality of the alpaca sliver and roving is most likely
a reflection of the shortened processing route used to process the alpaca fibre and the
problems associated with static and the formation of slubs in the roving. The coefficient
of mass variation (CVm %) of alpaca roving obtained in this work (13%) is greater than
the 5 – 10% obtained by Wang, Wang and Liu (2003).
Table 6-5 provides the measured yarn properties for the worsted spun wool and alpaca
singles yarns. The Uster Tensorapid data shows the alpaca singles yarn had a lower
breaking force, tenacity and elongation than the coarse wool and top dyed wool yarns,
but a greater tenacity compared to the cotton spun cashmere yarn described in the
previous section (Table 6-3). The alpaca singles yarns broke frequently during winding
and consequently the speed of the Schlarforst autoconer/winder was reduced to 200
m/min. The number of fault cuts made per 100 km of yarn was 500 for the alpaca yarn
whereas only 16 fault cuts were made for the ecru and dyed wool with the winder
operating at 500 m/min. The USTER results confirmed that the alpaca singles yarn had
greater yarn irregularity and contained significantly more yarn imperfections, thick and
thin places and nep faults, than the wool yarns. The large number of faults in the alpaca
yarn was not unexpected given the difficulty that was experienced in processing the
fibre. The alpaca singles yarn produced in this work was less hairy than the wool singles
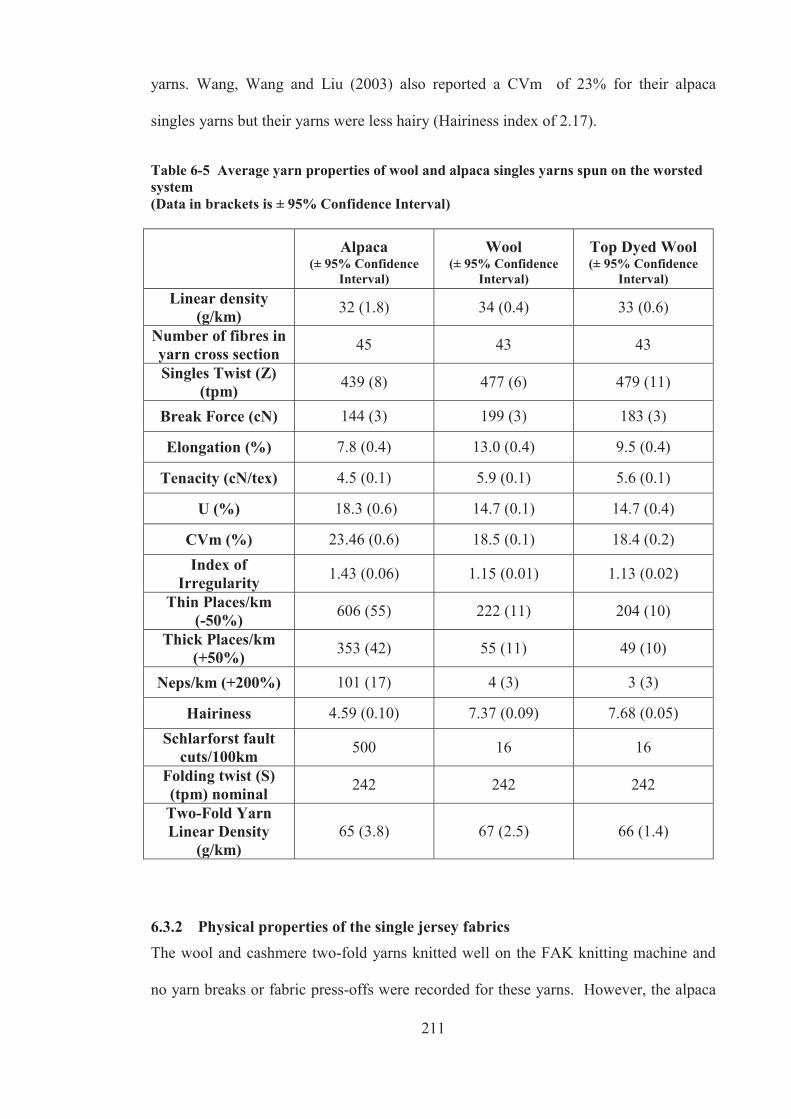
211
yarns. Wang, Wang and Liu (2003) also reported a CVm of 23% for their alpaca
singles yarns but their yarns were less hairy (Hairiness index of 2.17).
Table 6-5 Average yarn properties of wool and alpaca singles yarns spun on the worsted system (Data in brackets is ± 95% Confidence Interval)
Alpaca
(± 95% Confidence Interval)
Wool (± 95% Confidence
Interval)
Top Dyed Wool (± 95% Confidence
Interval) Linear density
(g/km) 32 (1.8) 34 (0.4) 33 (0.6)
Number of fibres in yarn cross section 45 43 43
Singles Twist (Z) (tpm) 439 (8) 477 (6) 479 (11)
Break Force (cN) 144 (3) 199 (3) 183 (3)
Elongation (%) 7.8 (0.4) 13.0 (0.4) 9.5 (0.4)
Tenacity (cN/tex) 4.5 (0.1) 5.9 (0.1) 5.6 (0.1)
U (%) 18.3 (0.6) 14.7 (0.1) 14.7 (0.4)
CVm (%) 23.46 (0.6) 18.5 (0.1) 18.4 (0.2) Index of
Irregularity 1.43 (0.06) 1.15 (0.01) 1.13 (0.02)
Thin Places/km (-50%) 606 (55) 222 (11) 204 (10)
Thick Places/km (+50%) 353 (42) 55 (11) 49 (10)
Neps/km (+200%) 101 (17) 4 (3) 3 (3)
Hairiness 4.59 (0.10) 7.37 (0.09) 7.68 (0.05) Schlarforst fault
cuts/100km 500 16 16
Folding twist (S) (tpm) nominal 242 242 242
Two-Fold Yarn Linear Density
(g/km) 65 (3.8) 67 (2.5) 66 (1.4)
6.3.2 Physical properties of the single jersey fabrics The wool and cashmere two-fold yarns knitted well on the FAK knitting machine and
no yarn breaks or fabric press-offs were recorded for these yarns. However, the alpaca
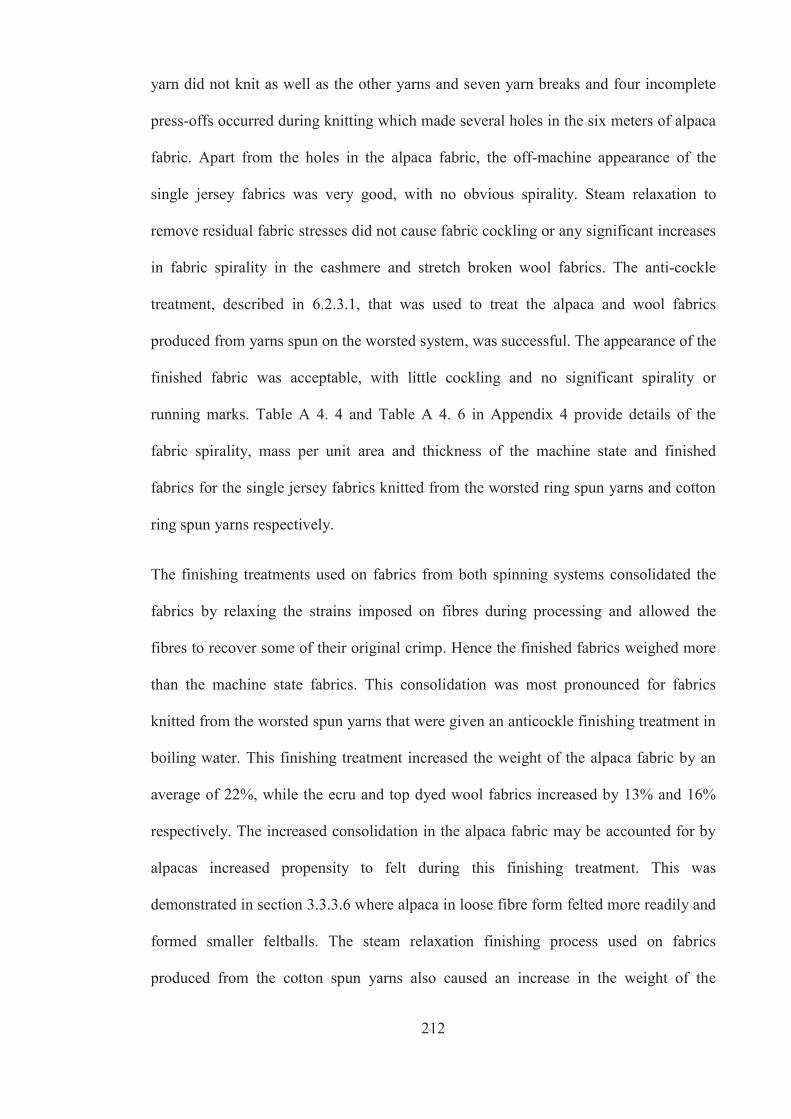
212
yarn did not knit as well as the other yarns and seven yarn breaks and four incomplete
press-offs occurred during knitting which made several holes in the six meters of alpaca
fabric. Apart from the holes in the alpaca fabric, the off-machine appearance of the
single jersey fabrics was very good, with no obvious spirality. Steam relaxation to
remove residual fabric stresses did not cause fabric cockling or any significant increases
in fabric spirality in the cashmere and stretch broken wool fabrics. The anti-cockle
treatment, described in 6.2.3.1, that was used to treat the alpaca and wool fabrics
produced from yarns spun on the worsted system, was successful. The appearance of the
finished fabric was acceptable, with little cockling and no significant spirality or
running marks. Table A 4. 4 and Table A 4. 6 in Appendix 4 provide details of the
fabric spirality, mass per unit area and thickness of the machine state and finished
fabrics for the single jersey fabrics knitted from the worsted ring spun yarns and cotton
ring spun yarns respectively.
The finishing treatments used on fabrics from both spinning systems consolidated the
fabrics by relaxing the strains imposed on fibres during processing and allowed the
fibres to recover some of their original crimp. Hence the finished fabrics weighed more
than the machine state fabrics. This consolidation was most pronounced for fabrics
knitted from the worsted spun yarns that were given an anticockle finishing treatment in
boiling water. This finishing treatment increased the weight of the alpaca fabric by an
average of 22%, while the ecru and top dyed wool fabrics increased by 13% and 16%
respectively. The increased consolidation in the alpaca fabric may be accounted for by
alpacas increased propensity to felt during this finishing treatment. This was
demonstrated in section 3.3.3.6 where alpaca in loose fibre form felted more readily and
formed smaller feltballs. The steam relaxation finishing process used on fabrics
produced from the cotton spun yarns also caused an increase in the weight of the

213
finished fabric; however the average increase in fabric weight was 2% and 7% for the
cashmere and wool fabrics respectively. The single jersey fabrics complied with the
Woolmark knitted apparel products specification, K1 (August 2000), and all had a
spirality of less than 5° after finishing.
For convenience, the average fabric mass per unit area and thickness of the finished
fabrics are also provided in Table 6-6 and Table 6-7 for fabrics made from the worsted
spun yarns (alpaca, ecru wool and top dyed wool) and cotton spun yarns (cashmere and
stretch broken wool) respectively. The two factor Anova results in Table A 4. 7 and
Table A 4. 10 of Appendix 4 showed that at the 0.05 level of significance, the null
hypothesis for machine tightness factor, fibre type and interaction were rejected
(P<0.05) for both spinning systems. Hence variations in these factors and the interaction
between these factors did have an effect on the weight of the finished fabric from both
spinning systems. Variations in these factors and the interaction between these factors
also had an effect on the thickness of the finished fabrics produced from the cotton spun
yarns, whilst for the worsted spun yarns, only fibre type influenced the thickness of the
finished fabrics (P<0.05). Independent t-tests (Table A 4. 8, Appendix 4) and Post Hoc
Tukey’s HSD tests (Table A 4. 9, Table A 4. 11 and Table A 4. 12, Appendix 4) were
used to determine which pairs of means differed at the 0.05 level of significance. The
average means that differed significantly in Table 6-6 and Table 6-7 were marked with
superscripted letters and symbols. Different superscripted letters highlighted the means
that differed significantly in the columns (same machine tightness factor, different fibre
types), whilst different superscripted symbols highlighted the means that differed
significantly in the rows (same fibre type, different machine tightness factor).
Increasing the machine tightness factor (cover factor) of the knit structure resulted in
significant increases in the finished fabric mass per unit area (g/m2) for the cotton spun
214
cashmere and stretch broken wool fabrics as illustrated in Figure 6-3 and for the
worsted spun alpaca and wool fabrics as illustrated in Figure 6-4.
Table 6-6 Average fabric weight and thickness for the single jersey fabrics knitted from worsted spun alpaca and wool yarns (Data in brackets is ± Standard error)
Fabrics knitted from worsted spun yarns
Machine tightness factor
(tex½/cm) 13 14 15
Average fabric mass per unit area (g/m2)
Alpaca 228 (1.5)a# 241(1.8)a% 254 (3.4)a@
Ecru wool 219 (1.0)b# 242 (1.5)a% 262 (0.3)b@
Top dyed wool 216 (1.7)b# 233 (0.9)b% 252 (1.7)a@
Average fabric thickness per unit area (mm)
Alpaca 0.82 (0.09)a 0.80( 0.02)a 0.85( 0.01)a
Ecru wool 0.97 (0.13)b 0.94 (0.01)b 0.94 (0.04)b
Top dyed wool 0.93 (0.09)b 0.95 (0.02)b 0.95 (0.05)b
Different letters signify that the sample means in the column (same machine tightness factor, different fibre types) are significantly different based on Post Hoc Tukey’s HSD (Table A 4. 11, Appendix 4). Similarly different symbols signify that the sample means in the row (same fibre type, different cover factor) are significantly different based on Post Hoc Tukey’s HSD (Table A 4. 12, Appendix 4).

215
Table 6-7 Average fabric weight and thickness for the single jersey fabrics knitted from cotton spun cashmere and wool yarns (Data in brackets is ± Standard error)
Fabrics knitted from cotton spun yarns
Machine tightness factor
(tex½/cm) 13 14 15
Average fabric mass per unit area (g/m2)
Cashmere 174 (0.9)a# 183 (2.3)a% 203 (0.9)a@ Stretch broken
fine wool 213 (1.2)b# 226 (1.9)b% 251 (0.7)b@
Average fabric thickness per unit area (mm)
Cashmere 0.90 (0.07)a#@ 0.84(0.06)a# 0.95 (0.04)@ Stretch broken
fine wool 0.99 (0.11)b 0.95 (0.05)b 0.97 (0.04)
Different letters signify that the sample mean in the column (same machine tightness factor, different fibre types) is significantly different based on the independent samples t Test (Table A 4. 8, Appendix 4). Different symbols signify that the sample mean in the row (same fibre type, different machine tightness factor) is significantly different based on the Post Hoc Tukey’s HSD (Table A 4. 9, Appendix 4).
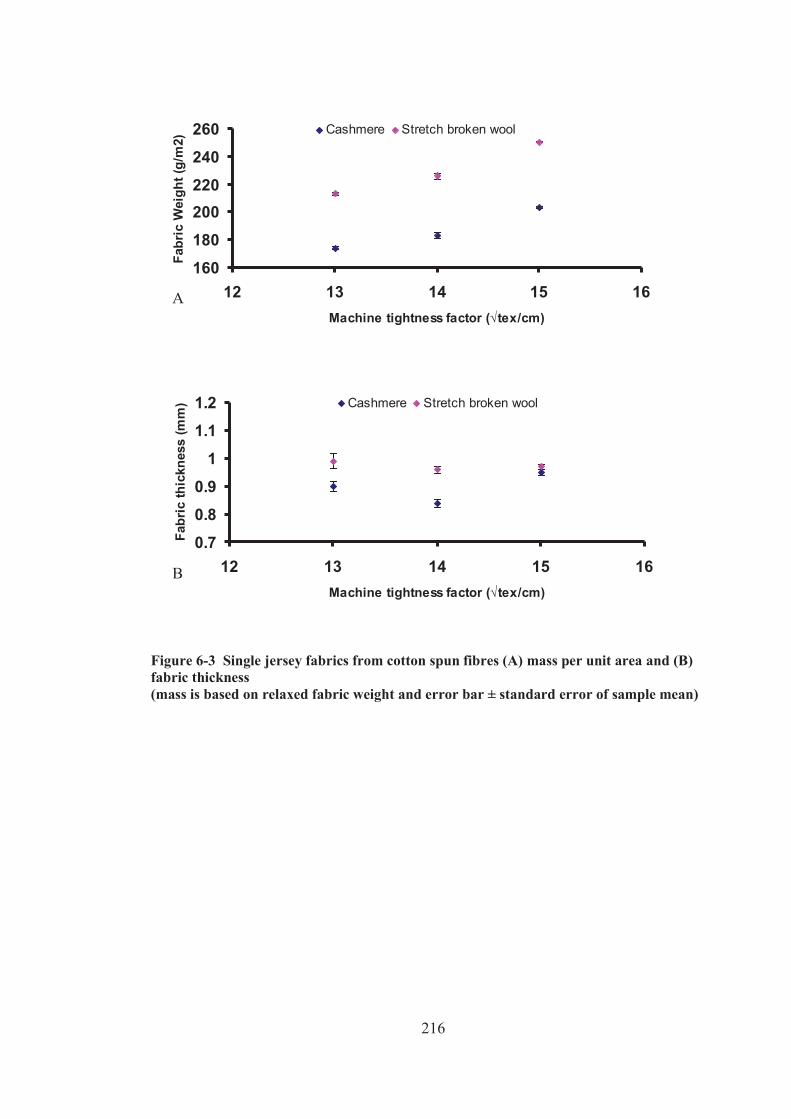
216
0.7
0.8
0.9
1
1.1
1.2
12 13 14 15 16Machine tightness factor (√tex/cm)
Fabr
ic th
ickn
ess
(mm
) Cashmere Stretch broken wool
160
180
200220
240
260
12 13 14 15 16Machine tightness factor (√tex/cm)
Fabr
ic W
eigh
t (g/
m2)
Cashmere Stretch broken wool
Figure 6-3 Single jersey fabrics from cotton spun fibres (A) mass per unit area and (B) fabric thickness (mass is based on relaxed fabric weight and error bar ± standard error of sample mean)
A
B

217
0.70.8
0.91
1.11.2
12 13 14 15 16Machine tightness factor (√tex/cm)
Fabr
ic T
hick
ness
(mm
) Alpaca Ecru wool Top dyed wool
200
220
240
260
280
12 13 14 15 16Machine tightness factor (√tex/cm)
Fabr
ic W
eigh
t (g/
m2)
Alpaca Ecru wool Top dyed wool
Figure 6-4 Single jersey fabrics from worsted spun fibres (A) mass per unit area and (B) fabric thickness (mass is based on relaxed fabric weight and error bar ± standard error of sample mean)
The finished cashmere fabrics were significantly lighter than the stretch broken wool
across all fabric tightness factors and significantly thinner at machine tightness factors
of 13 and 14. The cashmere fabric knitted to a machine tightness factor of 15 tex½/cm
had a fabric weight (203 g/m2) that was close to the weight of the stretch broken wool
fabric knitted to a machine tightness factor of 13 tex½/cm (213 g/m2). Although their
mean fabric weights were significantly different (tstat -6.71, P(T<=t)two-tail 0.003, tcritical
two-tail 2.78), there was no significant difference in the mean fabric thickness of these two
fabric samples ((tstat -1.52, P(T<=t)two-tail 0.202, tcritical two-tail 2.78).
A
B

218
The finished alpaca fabrics were significantly thinner than the wool fabrics across all
fabric tightness factors. The fabric weight, however, did not increase as rapidly with
machine tightness factor as the wool fabrics, and hence was greater than, equal to and
less than the wool fabric of equivalent cover factor.
Although yarns and fabric were initially engineered to similar specifications, it is clear
that after fabric relaxation, significant differences in fabric weight and fabric thickness
are evident between some of the different fibre groups and these structural differences
can influence some of the mechanical properties of fabrics (Gibson, Dhingra & Postle
1979).
6.3.3 KESF bending properties of knitted fabrics The fabric bending rigidity is denoted as Bfab in this study and relates to the difficulty
with which a fabric can be deformed by bending. It is a measure of the resistance to
bending and it is determined from the average slope of the linear regions of the bending
moment/curvature graph between the curvatures of 0.5 to 1.5 cm-1 for face bending and
between the curvatures of -0.5 and -1.5 cm-1 for the back bending (Kawabata 1980). The
hysteresis (2HB) is inversely related to the fabric’s ability to recover from bending and
represents the frictional loss due to bending. It is determined from the average
separation of the bending moment/curvature graph at 0.5 cm-1 for the face and -0.5 cm-1
for the back. Fabrics with higher values of bending rigidity and bending hysteresis will
bend less readily.
For woven fabrics it is normal practice to measure the bending rigidity and hysteresis in
both the warp and the weft directions and the mean of both directions is reported.
However in single jersey fabric, the direction of testing plays an enormous role because
a different number of leg yarns are bent as illustrated in examples A and B of Figure
6-5. In example A of Figure 6-5, only one yarn leg in each course is bent, but in
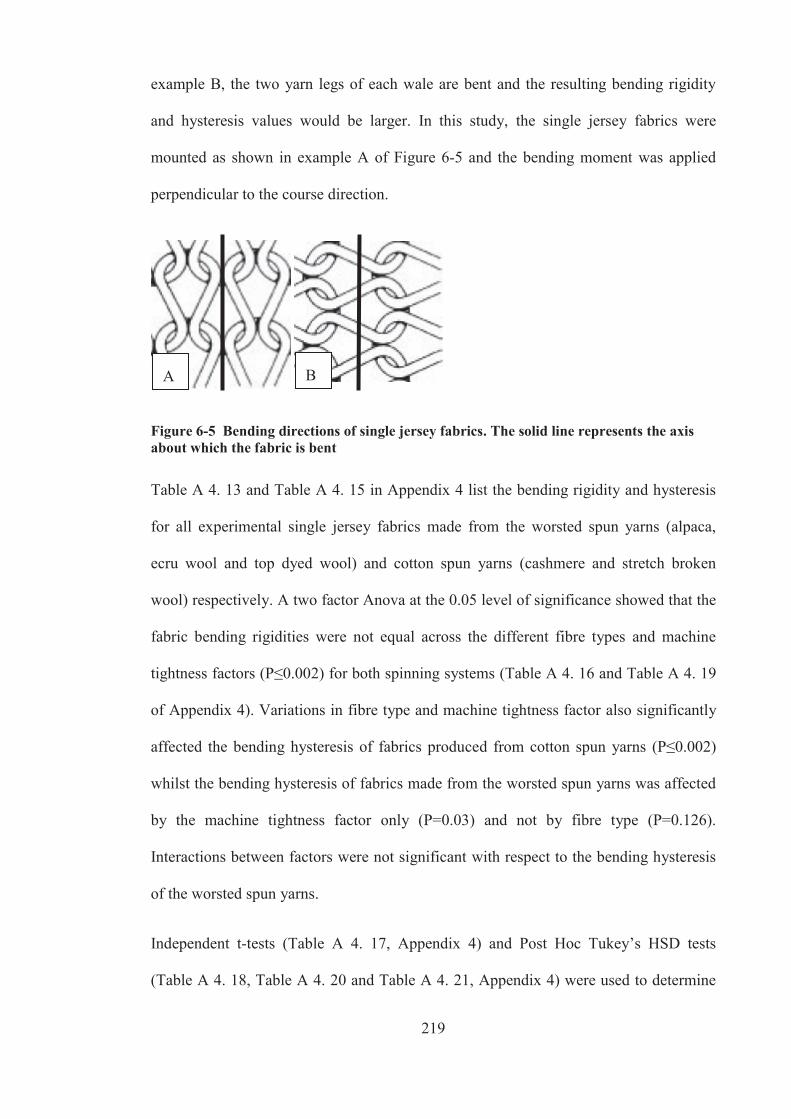
219
example B, the two yarn legs of each wale are bent and the resulting bending rigidity
and hysteresis values would be larger. In this study, the single jersey fabrics were
mounted as shown in example A of Figure 6-5 and the bending moment was applied
perpendicular to the course direction.
Figure 6-5 Bending directions of single jersey fabrics. The solid line represents the axis about which the fabric is bent
Table A 4. 13 and Table A 4. 15 in Appendix 4 list the bending rigidity and hysteresis
for all experimental single jersey fabrics made from the worsted spun yarns (alpaca,
ecru wool and top dyed wool) and cotton spun yarns (cashmere and stretch broken
wool) respectively. A two factor Anova at the 0.05 level of significance showed that the
fabric bending rigidities were not equal across the different fibre types and machine
tightness factors (P≤0.002) for both spinning systems (Table A 4. 16 and Table A 4. 19
of Appendix 4). Variations in fibre type and machine tightness factor also significantly
affected the bending hysteresis of fabrics produced from cotton spun yarns (P≤0.002)
whilst the bending hysteresis of fabrics made from the worsted spun yarns was affected
by the machine tightness factor only (P=0.03) and not by fibre type (P=0.126).
Interactions between factors were not significant with respect to the bending hysteresis
of the worsted spun yarns.
Independent t-tests (Table A 4. 17, Appendix 4) and Post Hoc Tukey’s HSD tests
(Table A 4. 18, Table A 4. 20 and Table A 4. 21, Appendix 4) were used to determine
A B

220
which pairs of means differed at the 0.05 level of significance and these are marked
with superscripted letters and symbols in Table 6-8 and Table 6-9 respectively. The
alpaca fabrics knitted to machine tightness factors 13 and 14 tex1/2 /cm exhibited
significantly lower bending rigidities than the wool fabrics knitted at the same tightness
settings (P<0.05), but this difference between wool and alpaca was not significant at the
tightest cover factor setting (15 tex½/cm) (P=0.221) (Table 6-8, Figure 6-6). The
cashmere fabrics had lower bending rigidities than the stretch broken wool fabrics at all
three cover factors (P<0.05) (Table 6-9, Figure 6-7).
Table 6-8 Average fabric bending rigidity and hysteresis for the single jersey fabrics knitted from worsted spun alpaca and wool yarns (Data in brackets is ± Standard error)
Fabrics knitted from worsted spun yarns
Machine tightness factor
(tex½/cm) 13 14 15
Average fabric bending rigidity (μN.m)
Alpaca 3.1 (0.1)a# 3.4 (0.4)a# 5.1 (0.9)a#
Ecru wool 6.1 (0.4)b# 6.3 (0.1)b# 6.6 (0.2)a#
Top dyed wool 5.1 (0.1)c# 5.6 (0.1)b# 6.6 (0.6)a%
Average fabric bending hysteresis (μN)
Alpaca 530 (31)a# 577 (29)a# 722 (42)a#
Ecru wool 692 (39)a# 707 (95)a# 741 (26)a#
Top dyed wool 594 (43)a# 663 (16)a#% 770 (53)a%@
Different letters signify that the sample means in the column (same machine tightness factor, different fibre types) are significantly different based on Post Hoc Tukey’s HSD (Table A 4. 18, Appendix 4). Similarly different symbols signify that the sample means in the row (same fibre type, different cover factor) are significantly different based on Post Hoc Tukey’s HSD (Table A 4. 19, Appendix 4).

221
Table 6-9 Average fabric bending rigidity and hysteresis for the single jersey fabrics knitted from cotton spun cashmere and wool yarns (Data in brackets is ± Standard error)
Fabrics knitted from cotton spun yarns
Machine tightness factor
(tex½/cm) 13 14 15
Average fabric bending rigidity (μN.m)
Cashmere 2.4 (0.04)a# 2.6 (0.2)a#% 3.2 (0.2)a%@ Stretch broken
fine wool 4.1 (0.1)b# 4.5 (0.2)b# 5.6 (0.4)b%
Average fabric bending hysteresis (μN)
Cashmere 481 (39)a# 594 (95)a#% 762 (26)a%@ Stretch broken
fine wool 669 (43)b# 753 (16)b#% 883 (53)b%@
Different letters signify that the sample mean in the column (same machine tightness factor, different fibre types) is significantly different based on the independent samples t Test (Table A 4. 17, Appendix 4). Different symbols signify that the sample mean in the row (same fibre type, different machine tightness factor) is significantly different based on the Post Hoc Tukey’s HSD (Table A 4. 18, Appendix 4).

222
300
600
900
13 14 15Machine tightness factor (√tex/cm)
Ben
ding
Hys
tere
sis
(μN
)
2
4
6
8
13 14 15Machine tightness factor (√tex/cm)
Ben
ding
Rig
idity
(μN
.m)
Alpaca Ecru wool Top dyed wool
A
B
Figure 6-6 Single jersey fabrics from worsted spun fibres - (A) fabric bending rigidity and (B) fabric bending hysteresis (error bar ± standard error of sample mean)

223
2
4
6
8
13 14 15Machine tightness factor (√tex/cm)
Ben
ding
Rig
idity
(μN
.m)
Cashmere Stretch broken wool
400
600
800
1000
13 14 15Machine tightness factor (√tex/cm)
Ben
ding
Hys
tere
sis
(μN
)
B
Figure 6-7 Single jersey fabrics from cotton spun fibres - (A) fabric bending rigidity and (B) fabric bending hysteresis (error bar ± standard error of sample mean)
The general trend of increasing bending rigidity and hysteresis with machine tightness
factor was evident in Figure 6-6 and Figure 6-7, but was not always significant due to
the large variations in bending and hysteresis that occurred for some of the samples.
Clearly more data should have been collected for a more accurate statistical comparison.
None-the-less the observed trend can be explained in terms of the increase in stitch
density that accompanies the increase in fabric tightness. As the stitch density increases,
the space available for stitches to move during bending is reduced and the contact

224
between fibres and yarns is increased, leading to stiffer fabric with greater bending
stiffness and hysteresis.
The aim of this chapter was to produce and compare the bending properties of fabrics of
similar weight. Although yarns and fabric were initially engineered to similar
specifications, it is clear from section 6.3.2 that after fabric relaxation there were
significant differences in the weight of cashmere fabrics and thickness of alpaca fabrics
compared to those made from wool. The alpaca fabrics were thinner than the wool
fabrics even though their fabric weights were fairly similar. The most likely explanation
for the lack of thickness in the alpaca fabric is the lack of crimp in the alpaca fibre and
lack of bulk in the alpaca yarn. Fabric thickness affects the bending rigidity of a fabric
which is given by the product of the elastic modulus and the moment of inertia of the
cross-section (Bueno et al., 2004). The moment of inertia of a rectangular cross section
is bh3/12, where h is the thickness and b is the width. Hence the lower bending rigidity
of the alpaca fabric is most likely due to it being thinner than the wool fabric.
The cashmere fabric knitted to a machine tightness factor of 15 tex½/cm had a similar
thickness to the stretch broken wool fabric knitted to a machine tightness factor of 13
tex½/cm. This cashmere fabric was marginally lighter in weight but had a bending
rigidity that was significantly lower than the stretch broken wool fabric (tstat -3.70,
P(T<=t)two-tail 0.02, tcritical two-tail 2.78). Although the cashmere fabrics had lower bending
rigidities than the stretch broken wool fabrics at all three cover factors, the cashmere
fabrics were lighter. A plot of fabric weight versus bending rigidity shows a clear trend
of increased fabric bending rigidity with increasing fabric weight for all fibre types
(Figure 6-8). This is consistent with the results of Lamb, Purvis and Robinson (2000)
who showed this trend for the Geelong Stiffness Index and weight of woven fabrics.

225
A positive, linear correlation existed between bending rigidity and fabric weight for
fabrics made from 17 μm wool and cashmere fibre (Pearson correlation, r = 0.96), with
92% of the variation in bending rigidity explained by variation in fabric weight (Figure
6-8). Thus the lower bending rigidity of the cotton spun cashmere compared to cotton
spun wool is highly likely to be due to its lower fabric weight. The inclusion in Figure
6-8 of data for worsted spun 17 μm wool and cashmere single jersey fabrics, collected
by McGregor and Postle (2008), also confirmed this linear relationship regardless of the
processing technique. The bending rigidity of 17 μm wool or cashmere single jersey
fabric can be predicted from the regression equation ŷ = 0.043x – 5.15. It is also clear
from Figure 6-8, that the bending rigidity of 26 μm wool single jersey fabrics sit above
this regression line whilst the 26 μm alpaca single jersey fabrics sit below the regression
line. The higher bending rigidity of the 26 μm wool single jersey fabric compared to the
17 μm wool single jersey fabric of similar thickness can be explained in terms of the
higher bending rigidity of its constituent fibres. The bending rigidity of cylindrical
fibres is proportional to the fourth power of mean fibre diameter. The low bending
rigidity of the alpaca fabric compared to wool may be explained by its low fabric
thickness compared to wool as discussed above.
If the fabric bending rigidity alone is an indicator of softness, then the order of fabric
softness (from softest to least soft) would be; cashmere (17 μm fibre, cotton spun),
alpaca (26 μm fibre, worsted spun), stretch broken wool (17 μm fibre, cotton spun), top
dyed wool (26 μm fibre, worsted spun) and ecru wool (26 μm fibre, worsted spun). In
the next section, the PhabrOmeter is used to predict the softness of these experimental
fabrics and these are compared to the subjective assessment of judges who have also
compared and rated the softness of these fabrics.
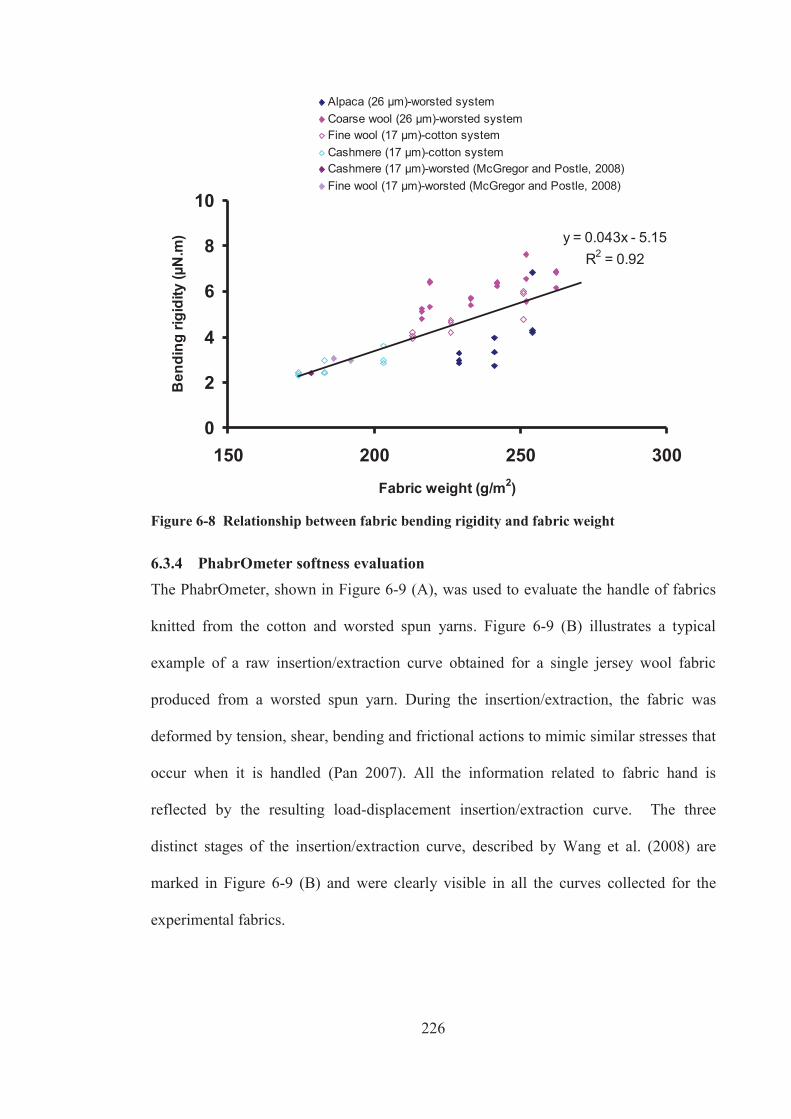
226
y = 0.043x - 5.15R2 = 0.92
0
2
4
6
8
10
150 200 250 300
Fabric weight (g/m2)
Ben
ding
rigi
dity
(μN
.m)
Alpaca (26 μm)-worsted systemCoarse wool (26 μm)-worsted systemFine wool (17 μm)-cotton systemCashmere (17 μm)-cotton systemCashmere (17 μm)-worsted (McGregor and Postle, 2008)Fine wool (17 μm)-worsted (McGregor and Postle, 2008)
Figure 6-8 Relationship between fabric bending rigidity and fabric weight
6.3.4 PhabrOmeter softness evaluation The PhabrOmeter, shown in Figure 6-9 (A), was used to evaluate the handle of fabrics
knitted from the cotton and worsted spun yarns. Figure 6-9 (B) illustrates a typical
example of a raw insertion/extraction curve obtained for a single jersey wool fabric
produced from a worsted spun yarn. During the insertion/extraction, the fabric was
deformed by tension, shear, bending and frictional actions to mimic similar stresses that
occur when it is handled (Pan 2007). All the information related to fabric hand is
reflected by the resulting load-displacement insertion/extraction curve. The three
distinct stages of the insertion/extraction curve, described by Wang et al. (2008) are
marked in Figure 6-9 (B) and were clearly visible in all the curves collected for the
experimental fabrics.

227
0.00
0.10
0.20
0.30
0.40
0 40 80 120Time (s)
Volta
ge (V
)
Stage 1
Stage 2 Stage 3
Figure 6-9 PhabrOmeterTM Model 3 (A) and an insertion/extraction curve for a single jersey wool fabric (B)
During the first stage (S1) of the insertion/extraction process, the fabric started to bend
and stretch where the force rod was pushing it into the nozzle of the PhabrOmeter. At
this point the fabric being compressed by the mass plate remained stationary. Once the
force rod pushed the fabric with enough force to overcome the static friction between
the fabric and the mass plate, the fabric held beneath the mass plate started to move and
crease. This was described as the second stage (S2) which continued until the maximum
force with displacement was reached. It was dependent on; the coefficient of friction
between the fabric, the sample holder and the mass plate; the weight of the mass plate;
and the bending rigidity of the crease ridges at the edge of the nozzle. As the force rod
continued to push the fabric into the nozzle, the creases radiated towards the outer
circumference of the sample as the fabric slid under the mass plate. The force acting on
A
B

228
the fabric decreased during stage three (S3) and was dependent on; the reduction in the
sliding friction between the sample, the sample holder and the mass plate; the
compaction of the fabric in the nozzle; the weight of the mass plate and the bending
rigidity of the crease ridges at the nozzle.
The PhabrOmeter uses the Karhunen-Loeve transformation to reduce the fabric
insertion/extraction data to eight mathematically derived fabric hand attributes which
can be mapped to create a unique fingerprint for each fabric (Pan 2007). The first three
feature axes on the radar diagram have been identified as v1=stiffness, v2=smoothness
and v3=softness (Anon 2012; Pan 2007) and comparing the fingerprints is a convenient
way of showing differences or similarities between fabrics. All radar fingerprints
created by the PhabrOmeter for the 15 experimental fabrics are provided in Figure 4A-
1 in Appendix 4. The differences in the v3 axis (softness axis) for the experimental
fabrics are subtle as illustrated in Figure 6-10 A and B, but show that the cashmere and
alpaca fabrics tend to be softer than the ecru wool.

229
Figure 6-10 PhabrOmeter single jersey fabric fingerprints (A) cotton spun cashmere and stretch broken wool and (B) the worsted spun alpaca and ecru wool
The method of averaging and smoothing the insertion/extraction curves developed by
Wang, Mahar and Hall (2012) was used on the data collected for the cashmere, wool
and alpaca single jersey fabrics. The averaged and smoothed insertion/extraction curves
for the fabrics knitted from the worsted spun alpaca and wool yarns are shown in Figure
6-11, whilst those obtained for fabrics knitted from the cotton-spun cashmere and wool
yarns are shown in Figure 6-12.
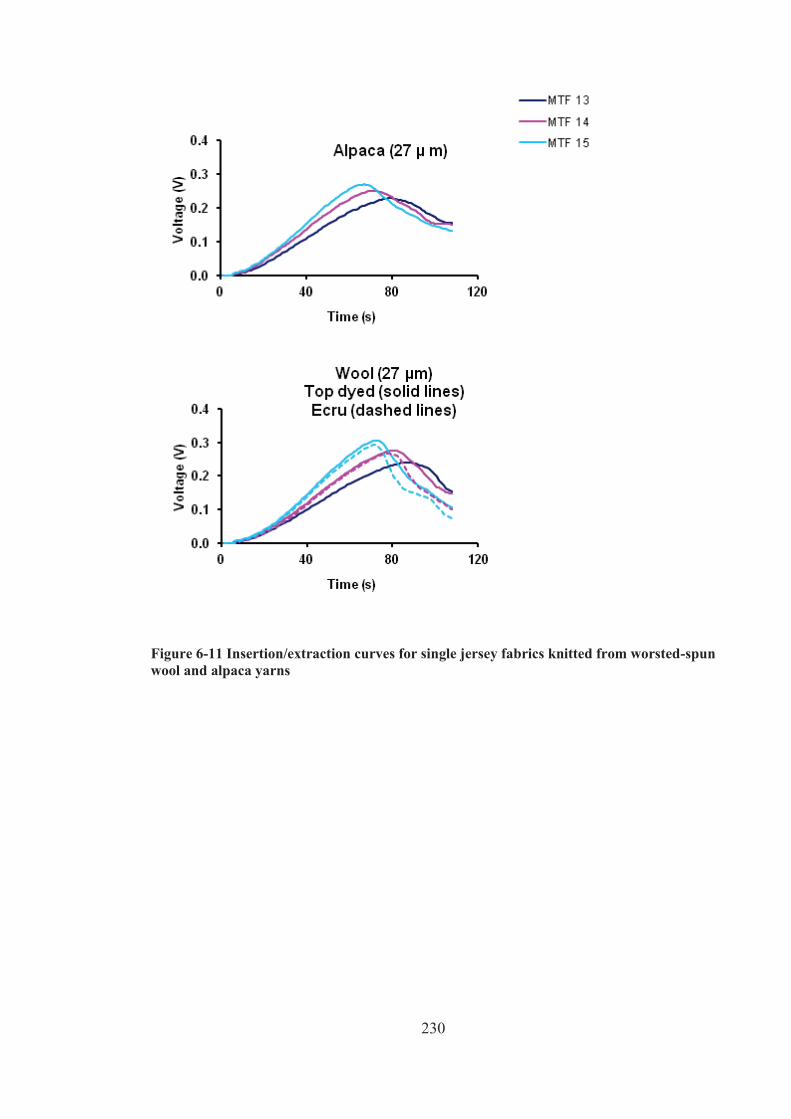
230
Figure 6-11 Insertion/extraction curves for single jersey fabrics knitted from worsted-spun wool and alpaca yarns
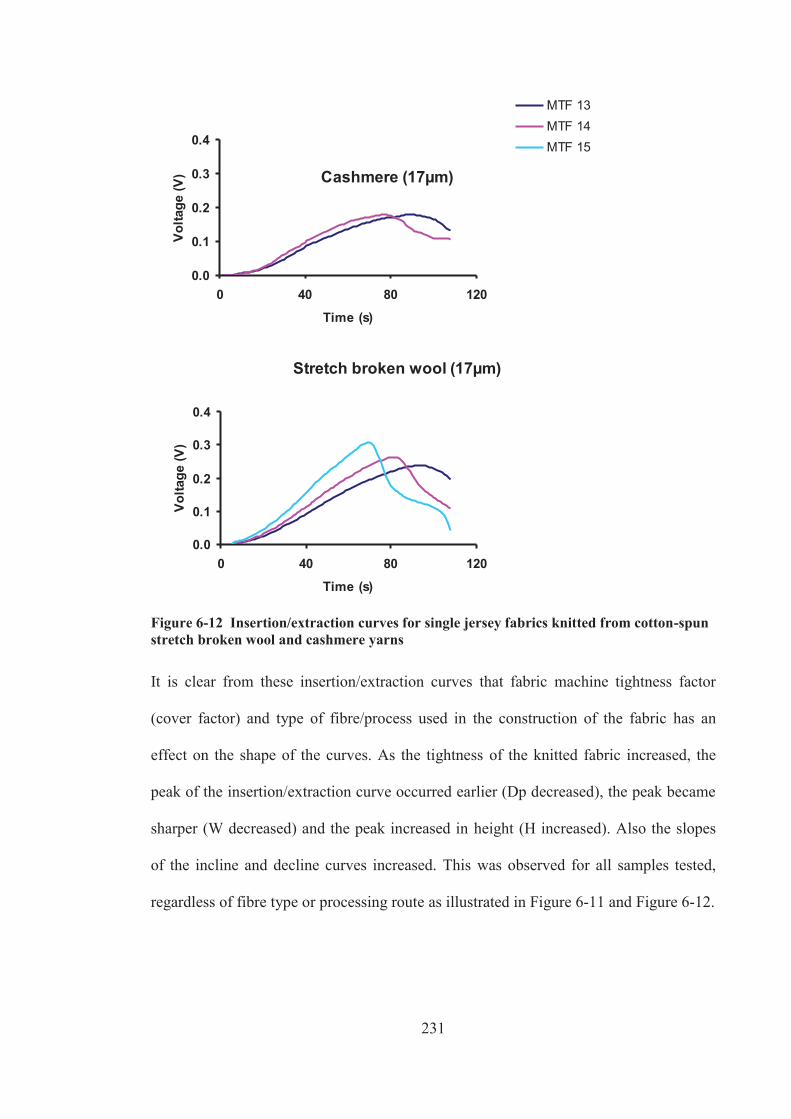
231
Cashmere (17μm)
0.0
0.1
0.2
0.3
0.4
0 40 80 120
Time (s)
Volta
ge (V
)
MTF 13MTF 14MTF 15
Stretch broken wool (17μm)
0.0
0.1
0.2
0.3
0.4
0 40 80 120
Time (s)
Volta
ge (V
)
Figure 6-12 Insertion/extraction curves for single jersey fabrics knitted from cotton-spun stretch broken wool and cashmere yarns
It is clear from these insertion/extraction curves that fabric machine tightness factor
(cover factor) and type of fibre/process used in the construction of the fabric has an
effect on the shape of the curves. As the tightness of the knitted fabric increased, the
peak of the insertion/extraction curve occurred earlier (Dp decreased), the peak became
sharper (W decreased) and the peak increased in height (H increased). Also the slopes
of the incline and decline curves increased. This was observed for all samples tested,
regardless of fibre type or processing route as illustrated in Figure 6-11 and Figure 6-12.
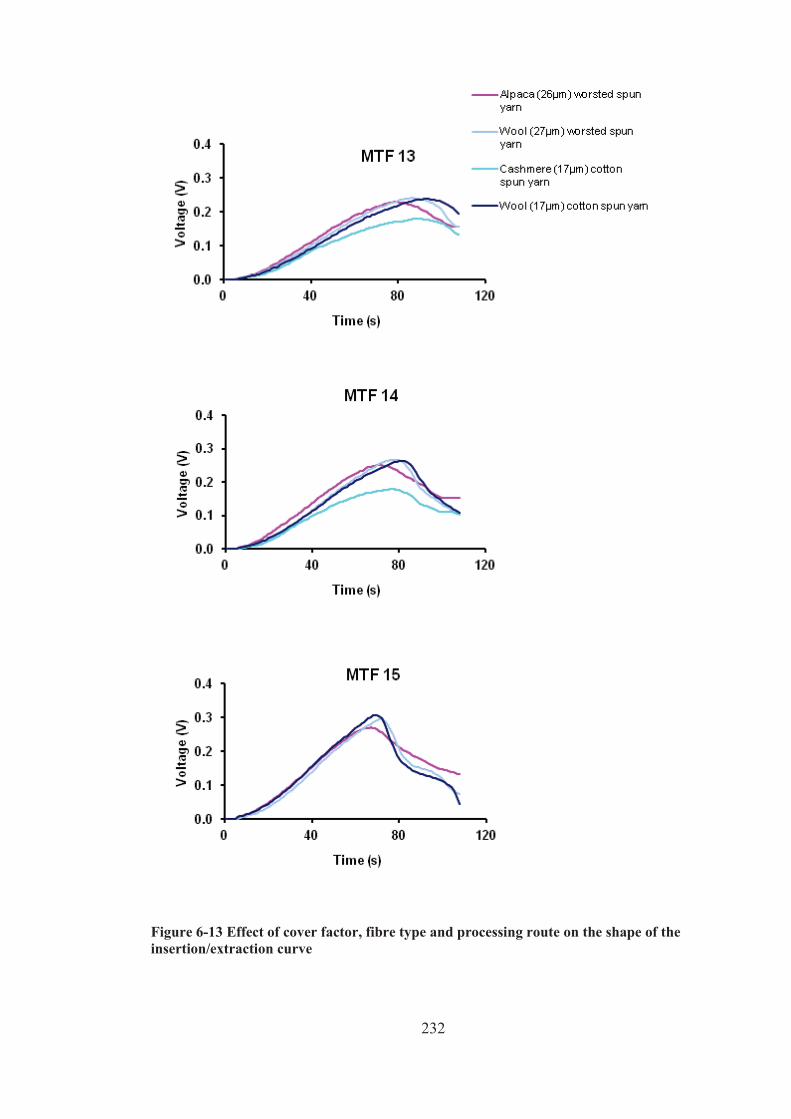
232
Figure 6-13 Effect of cover factor, fibre type and processing route on the shape of the insertion/extraction curve

233
Figure 6-13 shows the insertion/extraction curves obtained for the different fabrics
(fibre type/ process) at different fabric tightness (MTF). Most noticeable is the lower
peak height of the cashmere fabric compared to the wool and alpaca fabrics. Also it is
interesting to note that the insertion/extraction curves obtained for the fabrics produced
from the cotton-spun 17μm wool yarns were very similar to those produced from the 27
μm worsted-spun ecru wool yarn.
A number of curve parameters were derived from these insertion/extraction curves and
are provided in Table 6-10. Of the fifteen fabric samples, only the results of two
samples were not analysed by AWTA and the reason given was poor repeatability in the
insertion/extraction curves.

234
Table 6-10 PhabrOmeter curve parameters obtained for the experimental fabrics
Processing route /
Fibre type
Machine Tightness
factor (tex½/cm)
Curve parameters derived from insertion/extraction curves
H S1 pDp Dp S2 PPH W
Worsted -spun
26 μm alpaca
13 0.23 0.0040 74.86 75.38 -0.0034 0.0245 13.34
14 0.25 0.0047 67.22 69.22 -0.0041 0.0256 11.70
15 0.27 0.0056 41.08 65.59 -0.0073 0.0299 9.43
Worsted -spun
26 μm ecru wool
13 sample not measured by AWTA
14 0.27 0.0045 34.99 77.37 -0.0083 0.0238 8.15
15 0.29 0.0056 25.32 71.30 -0.0125 0.0225 5.82
Worsted - spun 26 μm
top dyed wool
13 0.24 0.0037 59.63 84.82 -0.0045 0.0283 13.95
14 0.28 0.0046 42.82 79.15 -0.0071 0.0273 9.79
15 0.31 0.0062 29.83 71.55 -0.0116 0.0387 9.57
Cotton -spun
17 μm cashmere
13 0.18 0.0025 68.34 86.16 -0.0030 0.0250 18.34
14 0.19 0.0032 63.95 76.52 -0.0037 0.0241 14.55
15 sample not measured by AWTA
Cotton –spun
17 μm stretch
broken wool
13 0.24 0.0036 64.65 89.40 -0.0042 0.0335 17.30
14 0.26 0.0043 31.70 80.54 -0.0091 0.0252 8.62
15 0.31 0.0056 22.79 69.92 -0.0141 0.0126 3.15
Compared to the single jersey fabric from stretch broken wool, the peak of the curve for
the single jersey cashmere fabric occurred later, its peak was broader, its peak height
was lower and the inclining and declining slopes were not as steep as those obtained for
the fine stretch broken wool. Similarly, the fabric produced from alpaca also differed
from coarse wool; its peak occurred earlier, its height was lower, the slope of the
declining curve was lower and hence its pDp value was also lower. Its inclining slope
and peak width were similar to coarse wool.
The PhabrOmeter curve parameters were used in the handle prediction models (Table
6-1) to predict the eight handle parameters for the fabrics (H. Wang, personal
235
communication, 20 March 2012). The handle predictions are provided in Table 6-11.
The criteria for the model are that the fabrics must be a single jersey knitted structure in
the weight range of 140-210 g/m2 and thickness equal or less than 0.9 mm.
According to the softness prediction model, the softest fabric (largest softness score)
was the cotton-spun fabric that was knitted from 17 μm cashmere to the machine
tightness factor of 13 tex½/cm. This was followed by the 26 μm alpaca fabric that was
also knitted to a machine tightness factor of 13 tex½/cm. The least soft fabric was the
cotton-spun fabric that was knitted from 17 μm stretch broken wool to a machine
tightness factor of 15 tex½/cm. This fabric was predicted to be less soft than fabrics
made from 26 μm wool.
These results are extremely odd because it is well known that fibre diameter is the most
important fibre parameter that influences the softness of wool fibre and fabric and the
17 μm wool and cashmere fabrics would be expected to be softer than the 26 μm wool
fabrics. However the validity of the prediction model may be questioned because the
majority of the experimental fabrics did not satisfy the weight and/or thickness criteria
of the prediction model.
In the next section of this chapter, judges evaluate the same set of fabrics and their
fabric softness rankings are compared to those predicted from the PhabrOmeter data.

236
Table 6-11 Predicted handle characteristics calculated by Wang (2011) for the single jersey fabrics
Process route /
Fibre type
Machine Tightness
factor (tex½/cm)
Predicted handle
Hard -
Soft
Rough -
smooth
Loose –
tight
Heavy –
light
Hairy -
clean
Warm –
cool
Greasy –
dry
Overall Handle
Worsted -spun
26 μm alpaca
13 5.8 4.1 5.2 6.6 7.4 7.1 6.6 4.0
14 5.4 4.1 5.8 6.9 7.1 6.9 6.7 4.1
15 4.7 4.1 6.4 7.5 6.1 6.8 7.2 4.4
Worsted -spun
26 μm ecru wool
13 sample not measured by AWTA
14 4.8 4.2 5.9 7.8 5.8 7.2 7.4 4.4
15 4.1 4.1 6.6 8.4 5.5 6.8 7.7 3.7
Worsted - spun 26 μm top
dyed wool
13 5.6 4.2 5.1 7.1 6.7 7.5 6.8 4.6
14 4.7 4.1 6.0 7.9 6.1 7.4 7.3 4.3
15 4.0 3.9 6.8 8.5 5.6 6.9 7.5 3.9
Cotton -spun
17 μm cashmere
13 6.7 4.5 4.0 5.6 7.1 7.4 6.5 5.2
14 5.6 3.8 4.7 6.4 6.4 7.5 7.4 5.5
15 sample not measured by AWTA
Cotton –spun
17 μm stretch broken
wool
13 5.5 3.8 4.9 7.3 7.0 7.9 6.9 4.4
14 4.9 4.4 5.7 7.6 5.6 7.2 7.3 4.6
15 3.7 3.8 7.0 8.6 5.6 6.7 8.1 2.9
6.3.5 Subjective evaluation of the softness of knitted fabrics A paired comparison testing the softness of the 15 experimental fabrics (5 different
fibres at 3 different cover factors) was not practical because each of the ten judges
would have had to evaluate 210 pairs of samples and would have suffered fatigue.
Analysing the fabrics in two separate groups, meant that each judge evaluated all
possible pairs from the worsted spun group twice (72 pairs) and all possible pairs from
the cotton spun group twice (30 pairs). The results for each group were analysed using a
Friedman Ranked Sum analysis (Meilgaard, Guille & Carr 1987) as described in
237
3.3.2.3, where the rank sum for each sample was calculated by summing the ranks over
all combinations and judges. The rank sum placed the samples in order of degree of
softness, with a higher rank sum corresponding to a higher degree of softness. Table
6-12 summarises the softness ranking of the six fabrics produced from the 17 μm
cashmere and stretch broken wool that were processed on the cotton system. The results
of the paired comparison test were analysed using the Friedman’s rank sum analysis as
described in section 3.2.1.4. The Friedman’s T was 175 whilst the critical value for
T(α=0.05) is 11.1. This suggests that some of the differences in the rank sum were
statistically significant. Tukey’s HSD (honestly significant difference) multiple
comparison procedure (Meilgaard, Guille & Carr 1987) was used to compare the rank
sums. The HSDα=0.05 was calculated to be 22.1 and therefore a difference of 22.1 was
required for rank sums to be significantly different at the 0.05 level.
The fabrics knitted from cashmere had larger softness rankings and were significantly
softer than the stretch broken wool fabrics at each machine tightness factor (cover
factor). As mentioned earlier, this difference in softness may be due to the difference in
weight of the fabrics and their lower bending rigidities. Interestingly, the judges could
not distinguish between the softness of cashmere fabric knitted to a machine tightness of
15 tex½/cm and the stretch broken wool knitted to a machine tightness of 13 tex½/cm.
These fabrics had a similar fabric weight and thickness yet their bending rigidities were
significantly different. Comments made by the judges during subjective testing
indicated that there was little if any difference in softness between these two fabrics.
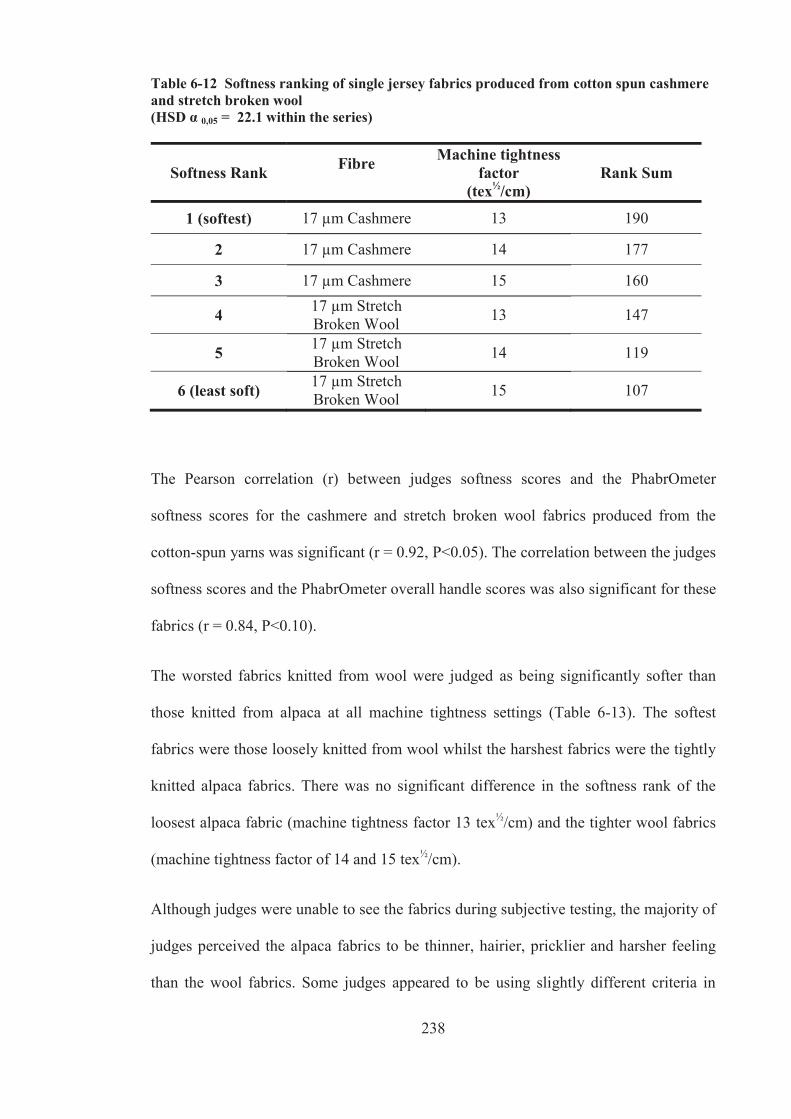
238
Table 6-12 Softness ranking of single jersey fabrics produced from cotton spun cashmere and stretch broken wool (HSD α 0,05 = 22.1 within the series)
Softness Rank Fibre
Machine tightness factor
(tex½/cm) Rank Sum
1 (softest) 17 μm Cashmere 13 190
2 17 μm Cashmere 14 177
3 17 μm Cashmere 15 160
4 17 μm Stretch Broken Wool 13 147
5 17 μm Stretch Broken Wool 14 119
6 (least soft) 17 μm Stretch Broken Wool 15 107
The Pearson correlation (r) between judges softness scores and the PhabrOmeter
softness scores for the cashmere and stretch broken wool fabrics produced from the
cotton-spun yarns was significant (r = 0.92, P<0.05). The correlation between the judges
softness scores and the PhabrOmeter overall handle scores was also significant for these
fabrics (r = 0.84, P<0.10).
The worsted fabrics knitted from wool were judged as being significantly softer than
those knitted from alpaca at all machine tightness settings (Table 6-13). The softest
fabrics were those loosely knitted from wool whilst the harshest fabrics were the tightly
knitted alpaca fabrics. There was no significant difference in the softness rank of the
loosest alpaca fabric (machine tightness factor 13 tex½/cm) and the tighter wool fabrics
(machine tightness factor of 14 and 15 tex½/cm).
Although judges were unable to see the fabrics during subjective testing, the majority of
judges perceived the alpaca fabrics to be thinner, hairier, pricklier and harsher feeling
than the wool fabrics. Some judges appeared to be using slightly different criteria in

239
their assessments and indicated the alpaca fabrics felt smoother, but the majority of
judges did not like the prickliness of the alpaca fabrics and said that the prickle made
the alpaca fabrics feel less desirable.
For wool and alpaca fabrics produced from the worsted-spun yarns, there was no
significant correlation between judges softness scores and the PhabrOmeter softness and
overall handle scores (r=0.18 and r=0.26 respectively).
Hairiness results in Table 6-5 showed that alpaca yarn was less hairy than the wool
yarn. However the alpaca fabrics knitted from these yarns were hairier than the wool
fabrics after the anticockle treatment (Figure 6-14). The judges also found the alpaca
fabrics to be hairier than the wool fabrics and the PhabrOmeter hairiness prediction
score in Table 6-11 also concurred. Although alpaca and wool worsted fabrics were
both given anticockle treatments, the alpaca fibres were most likely more susceptible to
fibre migration triggered by the mechanical action, allowing some fibre ends to move
more readily to the fabric surface where they protruded as surface hairs.
Table 6-13 summarises the softness ranking of the nine fabrics produced from the 26
μm alpaca, the 26 μm ecru wool and the 26 μm top dyed wool that were processed on
the worsted system. The Friedman’s T for these nine fabrics was 285 whilst the critical
value for T(α=0.05) was 15.5 indicating that some of the differences in the rank sum were
statistically significant. The HSDα=0.05 required for the rank sums to be significantly
different at the 0.05 level was 29.4.
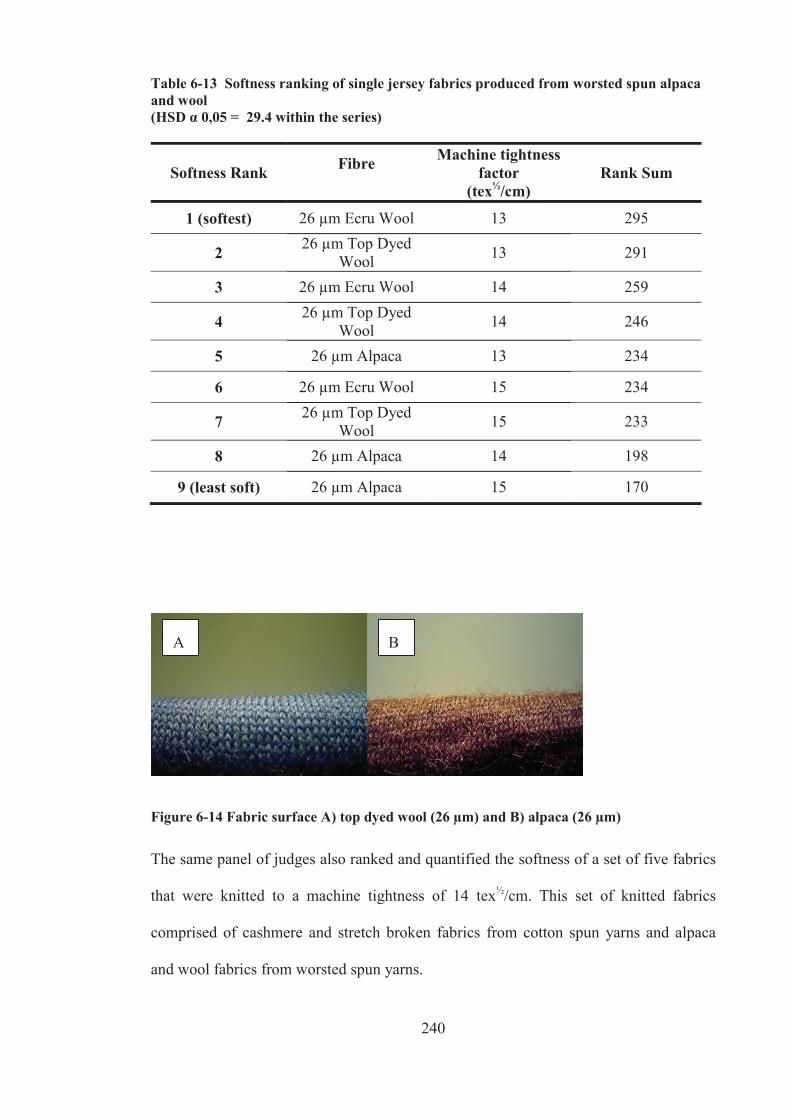
240
Table 6-13 Softness ranking of single jersey fabrics produced from worsted spun alpaca and wool (HSD α 0,05 = 29.4 within the series)
Softness Rank Fibre
Machine tightness factor
(tex½/cm) Rank Sum
1 (softest) 26 μm Ecru Wool 13 295
2 26 μm Top Dyed Wool 13 291
3 26 μm Ecru Wool 14 259
4 26 μm Top Dyed Wool 14 246
5 26 μm Alpaca 13 234
6 26 μm Ecru Wool 15 234
7 26 μm Top Dyed Wool 15 233
8 26 μm Alpaca 14 198
9 (least soft) 26 μm Alpaca 15 170
Figure 6-14 Fabric surface A) top dyed wool (26 μm) and B) alpaca (26 μm)
The same panel of judges also ranked and quantified the softness of a set of five fabrics
that were knitted to a machine tightness of 14 tex½/cm. This set of knitted fabrics
comprised of cashmere and stretch broken fabrics from cotton spun yarns and alpaca
and wool fabrics from worsted spun yarns.
A B
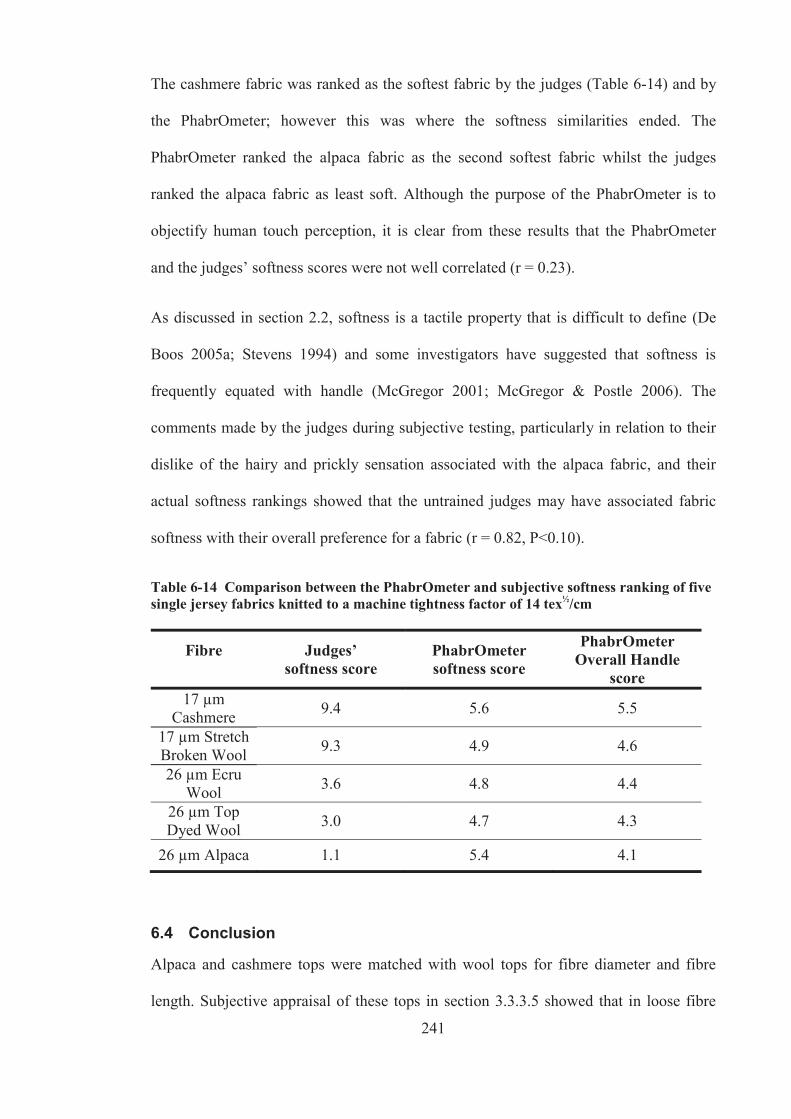
241
The cashmere fabric was ranked as the softest fabric by the judges (Table 6-14) and by
the PhabrOmeter; however this was where the softness similarities ended. The
PhabrOmeter ranked the alpaca fabric as the second softest fabric whilst the judges
ranked the alpaca fabric as least soft. Although the purpose of the PhabrOmeter is to
objectify human touch perception, it is clear from these results that the PhabrOmeter
and the judges’ softness scores were not well correlated (r = 0.23).
As discussed in section 2.2, softness is a tactile property that is difficult to define (De
Boos 2005a; Stevens 1994) and some investigators have suggested that softness is
frequently equated with handle (McGregor 2001; McGregor & Postle 2006). The
comments made by the judges during subjective testing, particularly in relation to their
dislike of the hairy and prickly sensation associated with the alpaca fabric, and their
actual softness rankings showed that the untrained judges may have associated fabric
softness with their overall preference for a fabric (r = 0.82, P<0.10).
Table 6-14 Comparison between the PhabrOmeter and subjective softness ranking of five single jersey fabrics knitted to a machine tightness factor of 14 tex½/cm
Fibre
Judges’ softness score
PhabrOmeter softness score
PhabrOmeter Overall Handle
score 17 μm
Cashmere 9.4 5.6 5.5
17 μm Stretch Broken Wool 9.3 4.9 4.6
26 μm Ecru Wool 3.6 4.8 4.4
26 μm Top Dyed Wool 3.0 4.7 4.3
26 μm Alpaca 1.1 5.4 4.1
6.4 Conclusion
Alpaca and cashmere tops were matched with wool tops for fibre diameter and fibre
length. Subjective appraisal of these tops in section 3.3.3.5 showed that in loose fibre

242
form, cashmere was softer than wool of the same diameter and that alpaca was also
softer than wool of a similar diameter. In fact, in loose fibre form, the 26 μm alpaca
fibre was perceived to be as soft as fine wool (17 μm). This chapter examined the
processing of these fibres and whether the differences in loose fibre softness were
maintained when fibres were transformed into plain, single jersey knitted structures of
similar weight (mass per unit area, g/m2).
Firstly it was demonstrated in this chapter that it was possible to spin yarn from 100%
stretch broken wool and 100% cashmere top on the cotton short staple processing
system. The stretch broken wool processed without any difficulties, however excessive
fly build up was identified as a problem when processing cashmere on this system and
this resulted in the cashmere yarn being more uneven with a greater number of yarn
imperfections compared to the stretch broken wool yarn. Although the cashmere and
stretch broken yarns were spun to the same yarn count and knitted under identical
conditions, evidence was provided that after steam relaxation fabrics knitted from the
cashmere yarn were lighter in weight, thinner and had a lower bending rigidity and
hysteresis compared to those knitted from the stretch broken wool yarn. Judges
perceived the lighter weight cashmere fabrics to be significantly softer than the stretch
broken wool fabrics knitted to the same fabric tightness settings; however judges could
not reliably distinguish any differences in fabric softness between the most tightly
knitted cashmere fabric and the most loosely knitted stretch broken wool fabric which
had a similar fabric weight and thickness. It is therefore reasonable to conclude that the
differences in loose fibre softness between cashmere and stretch broken wool was not
maintained when these fibres were spun into high twist yarns on the cotton system and
knitted into plain, single jersey fabrics of similar fabric weight.

243
Alpaca is notoriously difficult to process due to its low sliver cohesion and it is common
practice in industry to blend alpaca with wool to assist in processing (Wang, Wang &
Liu 2005; Wang, Wang & Liu 2003). Never-the-less in this chapter, 100% alpaca top
was processed on the worsted system. Problems with low sliver cohesion and static
were encountered and this resulted in poorer evenness in alpaca yarns compared to the
wool yarns. Fabrics knitted from the alpaca yarns exhibited cockling after wet
relaxation and the required an anti-cockle treatment to produce fabrics with an
acceptable appearance. Most judges found the surface of the alpaca fabrics to be prickly
and generally perceived the alpaca fabric to be less soft than the wool fabrics that were
knitted to the same machine tightness settings. Although the alpaca fabrics were thinner
and mostly exhibited lower bending rigidity and hysteresis across all knitting settings
than the wool fabrics, evidence was provided to show that the judges found the wool
fabric knitted a machine tightness factor (cover factor) of 13 tex½/cm to be much softer
than the alpaca fabrics. The processing protocol, which incorporated an anti-cockle
finishing treatment, increased the hairiness of the alpaca fabrics and made them feel less
soft than the wool fabrics. Hence it is reasonable to conclude that the difference in loose
fibre softness between alpaca and wool was not maintained in the single jersey fabrics
when this particular anticockle finishing treatment was used. Clearly the hairiness
generated in the alpaca fabric has confounded it softness assessment and it would be
beneficial to repeat this trial and make comparisons between wool and alpaca fabrics
that do not require an anticockle treatment.
Wang used data derived directly from the PhabrOmeter extraction curves in his
prediction models to predict the softness of the single jersey fabrics knitted from cotton-
spun of wool and cashmere yarns and also from worsted-spun alpaca and wool yarns
((H.Wang, personal communication, 20 March 2012). Although the fabric weight and

244
thickness criteria for these models were not met by the majority of the experimental
fabrics, the PhabrOmeter softness predictions were significantly correlated with the
judges’ softness rankings for the cotton spun cashmere and stretch broken wool fabrics,
but not for the worsted spun wool and alpaca fabrics that were anticockle treated. It was
clear the judges did not like the hairy/prickly feel of the alpaca fabrics and consequently
the judges down-graded the softness score of the alpaca fabrics compared to the wool
fabrics. Further work examining the influence of fabric hairiness on the PhabrOmeter’s
softness prediction model is clearly warranted.
245
CHAPTER 7 CONCLUSIONS
7.1 Summary
Fibre diameter alone cannot always explain the differences in the perceived softness of
wool samples (Shah & Whiteley 1971). This thesis reports on a comprehensive study on
other physical and surface properties that may also contribute to the softness of wool,
cashmere and alpaca fibres. Literature concerning relevant physical and surface
properties of fibres and fibre softness was reviewed. Subsequent chapters have reported
on the mechanical, compressional, felting and surface properties of wool fibres from
Australia’s information nucleus flock as well as from wool, cashmere and alpaca tops
that are matched for fibre diameter but differed in loose wool softness. The softness of
fabrics knitted from these top fibres was also reported. This final chapter summarises
the important conclusions that may be drawn from this work and provides some
recommendations for future work.
Resistance to compression has been touted as the best single indicator of subjectively
assessed handle of loose wool (Ali, Whiteley & Chaudri 1971; Madeley & Postle 1999;
Madeley, Postle & Mahar 1998a; Shah & Whiteley 1971), however recently other
researchers provided evidence that showed RtC to be a poor indicator of wool fibre
softness, particularly for wool fibres of varying diameters (Liu, Wang & Wang 2004a).
Therefore to gain a better understanding of the usefulness of the RtC test for indicating
the softness of wool of different diameters and curvature, 1265 data records collected by
the Cooperative Research Centre for Sheep Industry Innovation (Sheep CRC)
Information Nucleus Flocks (INF) for the 2007 Merino drop were analysed to
investigate the relationship between RtC and the handle or softness of greasy (raw)
wool. The average fibre diameter of the wool from the INF merino sheep was 17.0 μm
246
and their average RtC was 7.8 kPa. These results are in good agreement with those
reported for the 2003 progeny of twelve Australian superfine flocks (Brown 2005)
where the mean fibre diameter and RtC of those flocks were 16.8 μm and 7.9 kPa
respectively. The results of this study showed that across all INF flocks there was a
weak but significant negative relationship between the diameter of wool and its fibre
curvature. Fibre diameter and fibre curvature made positive contributions to the
resistance to compression values of the INF Merino flocks and the influence of fibre
curvature on resistance to compression was the more important of the two.
With regard to fibre softness, the results also showed that a positive association existed
between resistance to compression and the subjectively scored greasy handle. The
relationship between greasy handle and RtC certainly warrants further study. RtC of
specialty fibres, cashmere and alpaca, were lower than wool of a similar diameter. Their
fibre curvature was also significantly lower than wool and these results support the
findings of other researchers (Liu, Wang & Wang 2004a; Madeley 1994; McGregor
2007b; Teasdale et al. 1985).
It was anticipated that wool samples with different RtC would show differences in fibre
softness, particularly when the overwhelming influence of diameter and curvature on
hand was removed by selection. Hence three pairs of samples were selected from the
INF so that the samples in each pair were from the same flock and had similar mean
fibre diameter and curvature but different RtC, nominally high and low RtC. Judges
confirmed that RtC was a good indicator of softness, consistently finding the wool
sample in each pair that had the lower RtC as having the softer handle. Other keratin
samples included in the study were specialty tops of cashmere and alpaca and two wool
tops. The wool tops were selected so that they matched the fibre diameter, length and
curvature of the two specialty fibre tops as closely as practicable. The fibre length of the
247
fine wool top was easily shortened by a stretch breaking process to match the short fibre
length of cashmere. The stretch breaking process did not alter the handle of the fibre as
judges were unable to detect any differences in the loose wool softness of the fine
parent wool and the stretch broken fine wool. The inherent differences in fibre curvature
meant it was not possible to match wool fibre to the low fibre curvature of the specialty
fibres. Hence an attempt was made to match the low curvature of alpaca with wool by
permanently setting wool top in a lower curvature state during top dyeing. The setting
procedure used was not very successful and only reduced the overall fibre curvature of
the wool by 5%. There were no differences in the softness of the parent wool and the
top dyed wool.
Judges could detect significant differences in the softness of the specialty fibres and
wool. They found cashmere to be significantly softer than the wool of a similar
diameter. Similarly they found alpaca to be significantly softer than wool of a similar
diameter. Furthermore the judges could not reliably distinguish between the softness of
26 μm alpaca and 17 μm wool fibres, supporting the findings of Liu, Wang and Wang
(2004b) that in loose fibre form, alpaca is softer than wool.
The loose fibre felting propensities of these matched INF wool samples and matched
wool and specialty fibre tops were studied to determine whether feltball size is also a
good indicator of fibre softness. There were no significant differences in the felting
properties for most of the INF sample pairs even though they differed significantly in
their clean wool softness. Also there was no difference in the felting of the fine parent
wool tops and the fine stretch broken top, nor were there any differences in the felting
of the coarse wool top and the coarse, dyed top. Similarly there was no significant
difference in the felting behaviour of cashmere and fine wool of a similar diameter,
even though the cashmere fibre was significantly softer than the wool. Alpaca felted
248
more readily than wool and cashmere and these result support Sumner’s (2009) findings
that felting was not likely to be a good indicator of fibre softness.
It is well known that diameter and RtC, which is primarily a function of fibre curvature,
have a significant influence on fibre softness (Madeley, Postle & Mahar 1998b;
McGregor 2007a; Shah & Whiteley 1971; Stevens 1994). However, when these
parameters are matched, some keratin fibres are softer than others. This is not fully
understood. Hence the mechanical properties, cuticle properties and the shape of fibres
were measured for three such pairs of samples from the INF that were matched for fibre
diameter and curvature and also showed significant differences in softness. These
properties were also measured for fibres from the cashmere and alpaca specialty tops
and their corresponding wool tops that were matched for diameter.
The ratio of stress to strain is referred to as the modulus and is used to measure the
stiffness or rigidity of materials. Materials with high modulus are stiffer (Warner 1995).
Yet there were no significant differences in the Young’s tensile modulus between the
samples in each matched pair of INF fleece wools, even though they differed
significantly in softness. This result supports the finding of Roberts (1956). Although
the differences in Young’s moduli were not significant, there was a tendency for the
softer sample in each pair to have a higher Young’s modulus and therefore be stiffer.
This was opposite to expectation and it is likely that the increase in Young’s modulus
may be due to slight differences in the crimp or the crimp form in the samples. Fibres
with lower crimp are known to have a higher Young’s modulus (Barach & Rainard
1950; Bendit 1980; Brand & Backer 1962; Dillon 1952; Dusenbury & Wakelin 1958;
Evans 1954; Huson 1992; Menkart & Detenbeck 1957).

249
In contrast, the mechanical properties of the soft, specialty keratin fibres, cashmere and
alpaca, differed significantly from wool of a similar fibre diameter. The soft specialty
fibres had a significantly larger tensile stiffness (Young’s modulus) compared to wool
and again this was opposite to expectation as one would expect a soft fibre to be less
stiff. Again the low fibre crimp of alpaca and cashmere may have contributed to their
higher Young’s modulus compared to wool.
Although the bending rigidity of a fibre is believed to dominate fibre softness (Morton
& Hearle 1993; Warner 1995), no obvious trends with bending rigidity and loose fibre
softness were found for wool samples that differed in softness. This supports the
findings of Shah and Whiteley (1971). However it was also shown that both alpaca and
cashmere had a larger bending rigidity than wool, yet they were found to be softer than
wool. Clearly the assumptions used to calculate the bending rigidity in this thesis should
be viewed with caution but it also is quite possible that other fibre factors may have
outweighed the contribution of bending rigidity on the softness of fibres.
There were no significant differences in the shape of alpaca and wool fibre cross
sections, and cashmere fibres were found to be rounder than wool fibres of the same
fibre diameter. These results indicated that fibre shape was not responsible for the
superior softness of the specialty fibres over wool.
A preliminary experiment has shown the shear modulus of alpaca was much lower than
wool. Kawabata (1995) showed that compared to wool, cashmere also has a low shear
modulus. The shear modulus of alpaca fibre was very similar to the 0.25 GPa reported
by Kawabata (1995) for 17 μm cashmere. Unfortunately the TRI torsion apparatus used
in this thesis was unable to measure the shear modulus of the fine cashmere and wool

250
fibre, however these results suggest that specialty fibres have a lower resistance to
twisting compared to wool and this could certainly make them feel softer to the touch.
Cuticle properties such as the cuticle step height, roughness, interval between scale
edges, cuticle hardness, as indicated by the penetration depth of the AFM tip and the
coefficient of friction of the cuticle between the scale edges were measured in an
ambient environment using the SPM. Some of the cuticle properties of the matched
samples differed significantly. For example the soft Turretfield wool fibres had
significantly lower cuticle step heights compared to the harsher Turretfield sample.
Similarly the soft specialty fibres of cashmere and alpaca also had significantly lower
cuticle step heights compared to the harsher handling wool fibres of a similar diameter.
The cuticle surface was smoother for the soft Turretfield wool compared to the harsher
Turretfield wool. Cashmere fibre also had a significantly smoother surface compared to
wool of a similar diameter. The smoothness of the cuticle of the alpaca fibre was
difficult to measure due to the presence of surface contamination and measurement
artefacts. There was no difference in the hardness of the cuticle between the soft and
harsh handling Turretfield wool fibres or the soft alpaca and coarse wool fibres, yet the
cuticle of cashmere was significantly harder than wool of a similar diameter. The
distance between consecutive scale edges (cuticle interval) did not vary for the soft and
harsh handling Turretfield wool fibres. The cuticle interval was small for alpaca fibres
compared to wool fibres yet in contrast cashmere fibres had a greater distance between
scale edges than wool. Although there were no significant differences in the relative
coefficient of friction of cashmere compared to fine wool fibres and alpaca compared to
coarse wool fibres at the nano-scale, at the macroscale they differed significantly. The
‘with’ and ‘against’ scale coefficients of fibre to metal friction and the directional
friction effect (DFE) were significantly lower for the specialty fibres than for wool.
251
These macroscale frictional properties did not differ significantly for the soft and harsh
Turretfield wool fibres.
Whilst it is acknowledged that the sample size was small in this study, significant
differences in the cuticle spacing, hardness and smoothness were found for the different
keratin fibres, but no trends were found in relation to fibre softness. Similarly the
macro-scale fibre to metal friction results suggest that macro-frictional properties could
be an indicator of softness, however they were not found to be reliable for all samples.
Cuticle step height appears to the secondary fibre property that was most influential in
affecting fibre softness. It does so by most likely changing the frictional properties of
the fibres. So fibres with a low cuticle height have low friction and this probably makes
them feel smooth and soft to touch.
Cashmere and stretch broken fine wool tops were processed on the cotton short staple
processing system and alpaca and coarse wool tops were processed on the worsted
system. The specialty fibres were more difficult to process than wool fibres and suffered
from static and sliver cohesion problems. This resulted in uneven yarns with more
imperfections compared to the wool yarns. Folded yarns were knitted into single jersey
fabrics using a range of machine tightness settings. The finishing treatments used on
fabrics from both spinning systems consolidated the fabrics by relaxing the strains
imposed on fibres during processing and allowed the fibres to recover some of their
original crimp. Although the aim was to produce finished fabrics of the same fabric
weight, the different fibres recovered differently which made it difficult to control the
finished weights of the knitted fabrics. The finished cashmere fabrics were lighter in
weight, thinner and had a lower bending rigidity and hysteresis compared to those
knitted from the stretch broken wool yarn using the same knitting specifications. Judges
perceived the lighter weight cashmere fabrics to be significantly softer than the stretch
252
broken wool fabrics knitted to the same fabric tightness settings. However the judges
could not reliably distinguish any differences in the softness of cashmere and the fine
stretch broken wool fabrics when the fabrics were the same weight and thickness, even
though they were knitted to different tightness settings initially. Fabrics knitted from the
alpaca yarns exhibited cockling after wet relaxation and the required an anti-cockle
treatment to produce fabrics with an acceptable appearance. The finished alpaca fabrics
were thinner and mostly exhibited lower bending rigidity and hysteresis across all
knitting settings than the wool fabrics. Judges found the surface of the alpaca fabrics to
be prickly and generally perceived the alpaca fabric to be less soft than the wool fabrics
that were knitted to the same machine tightness settings.
Data derived directly from the PhabrOmeter extraction curves was used to predict a
number of handle parameters for these single jersey fabrics. The PhabrOmeter softness
predictions were significantly correlated with the judges’ softness rankings for the
cotton spun cashmere and stretch broken wool fabrics, but they were not significant for
the worsted spun wool and alpaca fabrics. The increased fabric hairiness as a result of
the anticockle treatment may have confounded the softness appraisal.
In summary, this research has provided useful information about the softness
characteristics of wool, cashmere and alpaca fibres. This work demonstrated that RtC is
useful for predicting softness of loose wool and the PhabrOmeter is useful for predicting
the softness of knitted fabrics, so long as the fabric weight and thickness criteria of the
prediction models are satisfied. The specific fibre properties that are manifested in the
soft specialty fibres are their low RtC, low shear modulus, low cuticle height and in
most cases smooth cuticle surfaces. Although these fibre properties may influence the
softness of loose fibres, when constrained in tight yarn and fabric structures, the benefit
of these fibre properties on fabric softness is less clear. Fibre curvature has a significant

253
influence on processing and can influence fabric weight. Cashmere fabric did not bulk
up as much as wool and were lighter and preferred over wool. However when cashmere
and wool fabrics of similar weight were compared, judges could not detect any
significant difference in the fabric softness.
7.2 Future work
This work has demonstrated that cashmere, alpaca and wool of similar diameter can
have significant differences in their tactile softness in fibre form. Although fibre
properties such as low shear modulus and low cuticle height were found to be
associated with soft specialty fibres, further work is required in this area to fully
understand the fibre properties that contribute to the softness of fibres and fabrics made
from wool.
The results obtained in the preliminary study on shear modulus of alpaca and wool
fibres as well as the results obtained by Kawabata (1995) for cashmere and wool have
shown that the shear modulus of these specialty fibres are very low compared to wool.
However what is responsible for this low shear modulus in these specialty fibres is not
known and how the shear modulus varies among the Australian merino flock is also not
known. This requires further investigation.
The potential of SPM for characterising the nanoscale properties of the cuticle of fibres
such as the cuticle step height, cuticle interval, cuticle roughness, hardness and friction
of different keratin fibres was demonstrated in this thesis. How these properties vary
among the Australian merino flock is still unknown and requires further investigation.
Quantification of the variation in these properties amongst the Australian merino clip
may provide a basis for genetic improvement of these properties and an improvement of
the softness of the Australian merino wool.
254
Although this study has demonstrated the potential of the PhabrOmeter for predicting
the softness of fabrics knitted from cashmere and wool, it has also demonstrated that the
softness of hairy fabrics may not be predicted accurately with the current softness
prediction models. A better understanding of how fabric hairiness influences the
PhabrOmeters’s softness prediction is necessary.

APPENDICES
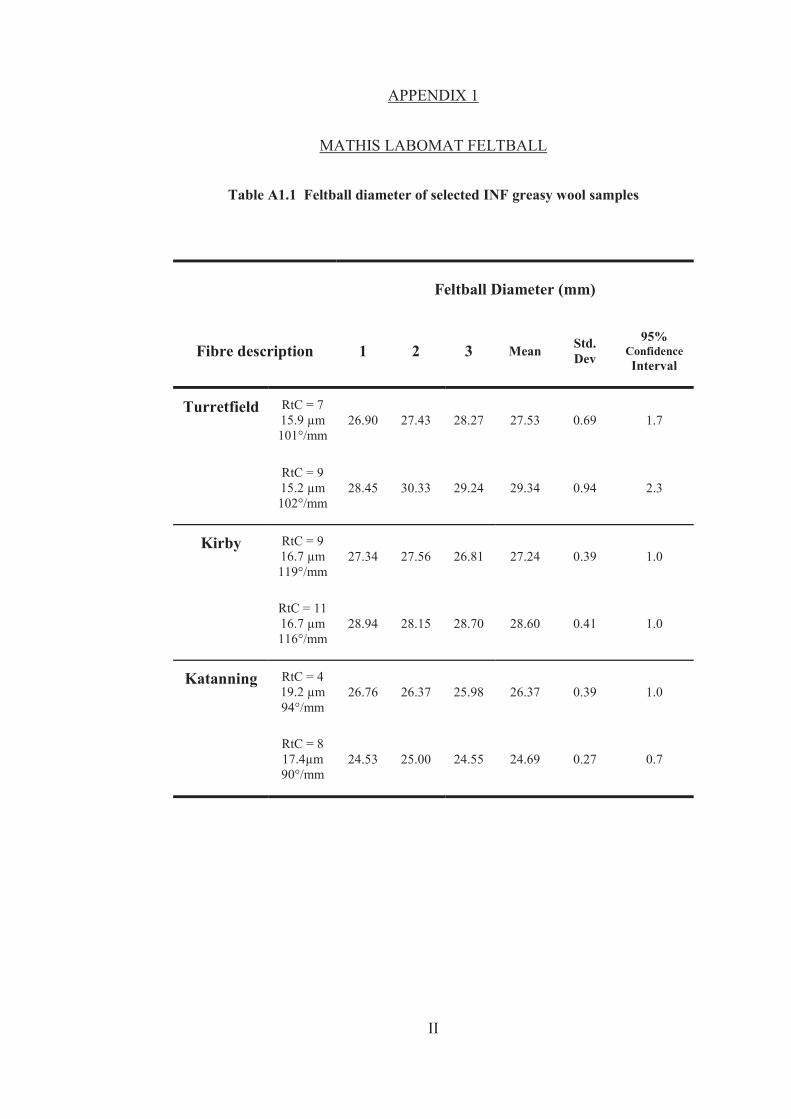
II
APPENDIX 1
MATHIS LABOMAT FELTBALL
Table A1.1 Feltball diameter of selected INF greasy wool samples
Feltball Diameter (mm)
Fibre description 1 2 3 Mean Std. Dev
95% Confidence Interval
Turretfield RtC = 7 15.9 μm 101°/mm
26.90 27.43 28.27 27.53 0.69 1.7
RtC = 9 15.2 μm 102°/mm
28.45 30.33 29.24 29.34 0.94 2.3
Kirby RtC = 9 16.7 μm 119°/mm
27.34 27.56 26.81 27.24 0.39 1.0
RtC = 11 16.7 μm 116°/mm
28.94 28.15 28.70 28.60 0.41 1.0
Katanning RtC = 4 19.2 μm 94°/mm
26.76 26.37 25.98 26.37 0.39 1.0
RtC = 8 17.4μm 90°/mm
24.53 25.00 24.55 24.69 0.27 0.7

III
APPENDIX 1
MATHIS LABOMAT FELTBALL
Table A1.2 Feltball diameter of cashmere, alpaca and wool tops
Feltball Diameter (mm)
Fibre description 1 2 3 Mean Std.
Dev
95% Confidence
Interval
Cashmere 23.42 22.78 22.30 22.83 0.56 1.4
Alpaca 19.95 20.31 20.62 20.29 0.34 0.8
Coarse wool 24.12 23.38 23.71 23.73 0.37 0.9
Top dyed wool 23.23 22.41 22.86 22.83 0.41 1.0
Fine wool 21.84 22.32 21.67 21.94 0.34 0.8
Stretch broken fine
wool 21.12 21.60 21.75 21.49 0.33 0.8
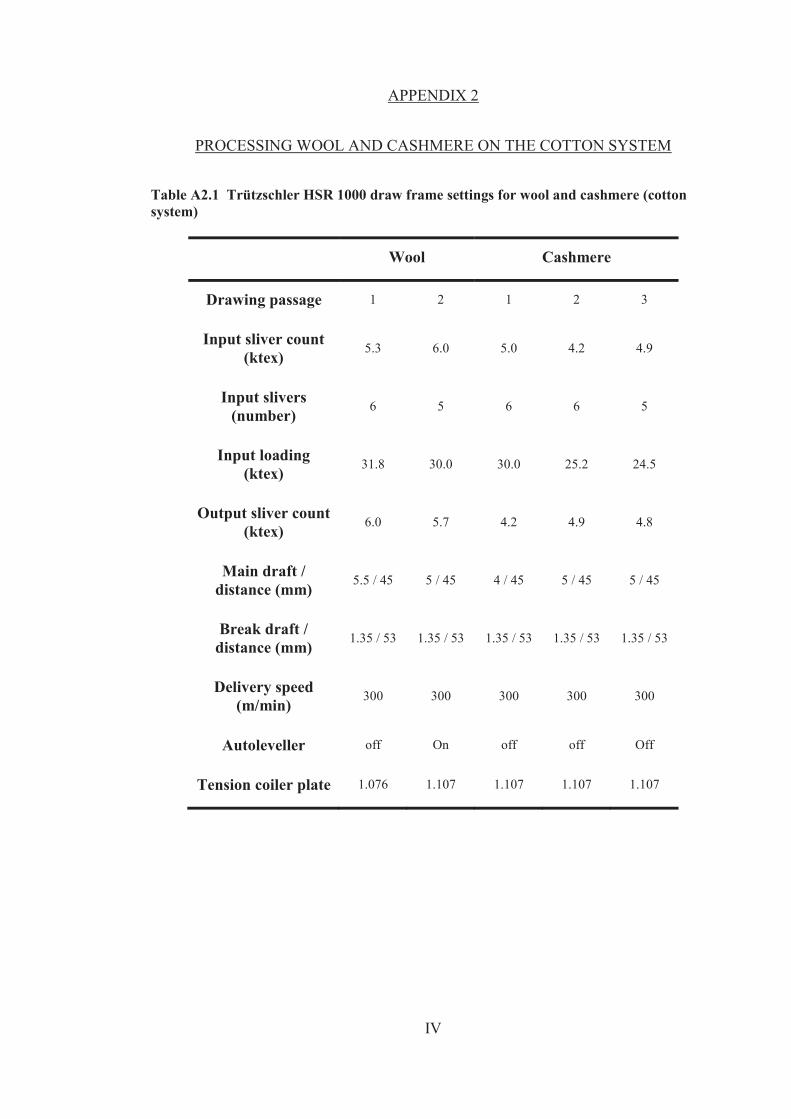
IV
APPENDIX 2
PROCESSING WOOL AND CASHMERE ON THE COTTON SYSTEM
Table A2.1 Trützschler HSR 1000 draw frame settings for wool and cashmere (cotton system)
Wool Cashmere
Drawing passage 1 2 1 2 3
Input sliver count (ktex) 5.3 6.0 5.0 4.2 4.9
Input slivers (number) 6 5 6 6 5
Input loading (ktex) 31.8 30.0 30.0 25.2 24.5
Output sliver count (ktex) 6.0 5.7 4.2 4.9 4.8
Main draft / distance (mm) 5.5 / 45 5 / 45 4 / 45 5 / 45 5 / 45
Break draft / distance (mm) 1.35 / 53 1.35 / 53 1.35 / 53 1.35 / 53 1.35 / 53
Delivery speed (m/min) 300 300 300 300 300
Autoleveller off On off off Off
Tension coiler plate 1.076 1.107 1.107 1.107 1.107

V
APPENDIX 2
PROCESSING WOOL AND CASHMERE ON THE COTTON SYSTEM
Table A2.2 Zinser 660 Flyer Rover settings for wool and cashmere (cotton system)
Wool Cashmere
Input sliver count (ktex) 5.70 4.80
Output roving count (ktex) 1140 855
Delivery speed (m/min) 18 18
Draft 5.59 5.59
Twist (tpm) 37 38

VI
APPENDIX 2
PROCESSING WOOL AND CASHMERE ON THE COTTON SYSTEM
Table A2.3 Zinser 350 RM (cotton ring spinning machine) settings for wool and cashmere
Wool Cashmere
Input roving count (ktex) 1140 855
Draft 43 32
Output yarn count (Tex) 26.8 26.8
Twist (tpm) 776 776
Twist direction Z Z
Twist Factor (αe) 4.2 4.2
Traveller size 50 50
Maximum speed (rpm) 12000 12000

VII
APPENDIX 2
PROCESSING WOOL AND ALPACA ON THE WORSTED SYSTEM
Table A2.4 Ingolstadt intersecting gill settings (worsted system)
Wool Top dyed wool Alpaca
Drawing passage 1 2 1 2 1
Input sliver count (ktex) 20 20.4 17.5 18 20
Input slivers (number) 6 6 5 6 4
Input loading (ktex) 120 122.4 87.5 108 80
Output sliver count (ktex) 20.4 20.5 18 17.1 19
Draft 5.99 6.59 5.5 6.59 4.73
Ratch (mm) 40 40 40 40 45
Delivery speed (m/min) 60 60 60 60 60
Selbana 3001 (%oww) 0.5 0.5 0.5 0.5 0.7

VIII
APPENDIX 2
PROCESSING WOOL AND ALPACA ON THE WORSTED SYSTEM
Table A2.5 Sant Andrea SN10 and NSC GV11 gill settings for wool and top dyed wool
Wool Top dyed wool
Machine SN 10
SN 10
SN 10
SN 10
GV 11
SN 10
SN 10
SN 10
SN 10
GV 11
Post comb passage 1 2 1 2
Drawing passage 1 2 3 1 2 3
Input sliver count (ktex) 20 21 20 20 15 22 22 22 19.5 15
No. of Input slivers 6 6 6 6 2 6 6 6 6 2
Input loading (ktex) 120 126 120 120 30 132 132 132 117 30
Output sliver count (ktex) 21 20 20 15 4.2 22 22 19.5 15 4
Draft setting 5.84 6.63 6.63 8.19 7 5.48 6.22 7.21 8.19 7
Ratch (mm) 40 40 40 40 300/205 40 40 40 40 300/
205 Delivery speed
(m/min) 160 160 160 160 100 160 160 160 160 100

IX
APPENDIX 2
PROCESSING WOOL AND ALPACA ON THE WORSTED SYSTEM
Table A2.6 NSC GN6 and NSC GV11 gill settings for alpaca
Alpaca
Machine GN 6 GV 11
Input sliver count (ktex) 19 15.4
Input slivers (number) 4 2
Input loading (ktex) 76 31
Output sliver count (ktex) 15.4 4.3
Draft 4.6 7.1
Delivery speed (m/min) 60 100
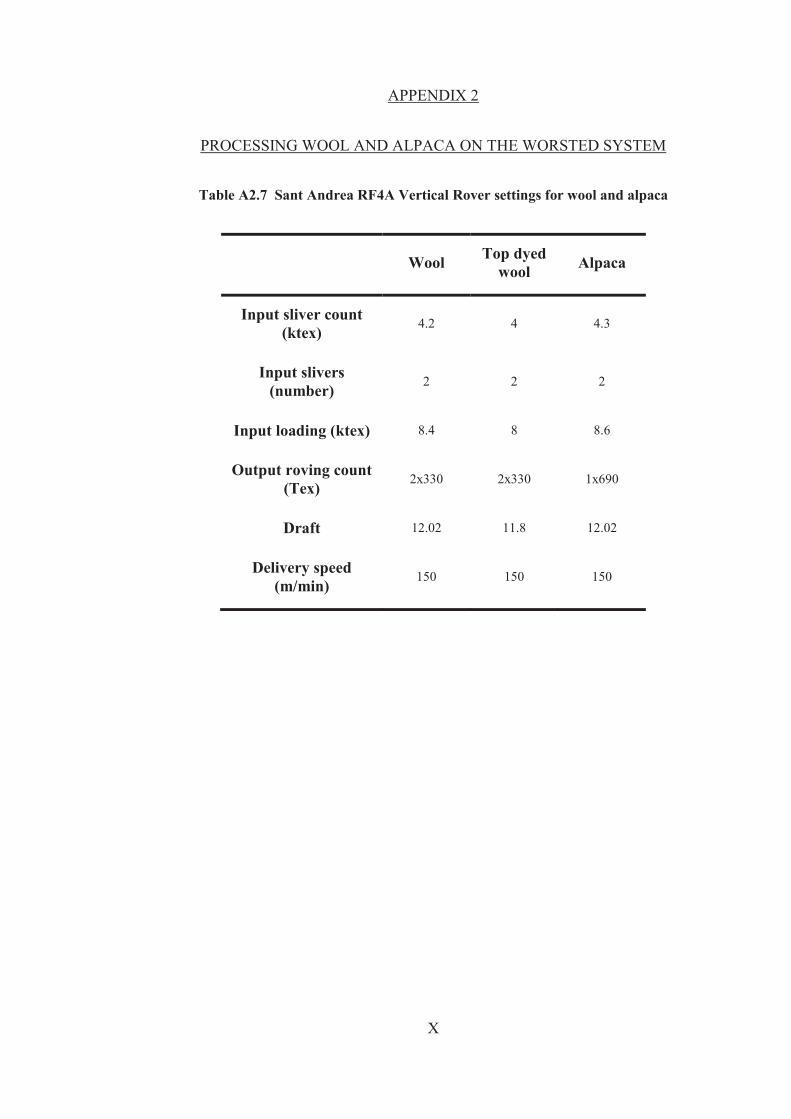
X
APPENDIX 2
PROCESSING WOOL AND ALPACA ON THE WORSTED SYSTEM
Table A2.7 Sant Andrea RF4A Vertical Rover settings for wool and alpaca
Wool Top dyed wool Alpaca
Input sliver count (ktex) 4.2 4 4.3
Input slivers (number) 2 2 2
Input loading (ktex) 8.4 8 8.6
Output roving count (Tex) 2x330 2x330 1x690
Draft 12.02 11.8 12.02
Delivery speed (m/min) 150 150 150

XI
APPENDIX 3 – TENSILE PROPERTIES Table A3- 1 Turretfield (low RtC)- MFD 15.8 μm CVD 24.1%
Force normalised by fibre diameter at the break
Force normalised by Vibroscope fibre diameter
Young’s modulus GPa
Break stress MPa
Young’s modulus GPa
Break stress MPa
Break strain %
5794 6912 5947 6367 7853 9568 8326 5614 4209 7581 5106 6867 4436 8656 7529 5099 5939 5312 6792 5472 6620 6250 4748 5549 5650 5742 6449 6796 4858 5292 4394 5582 6702 4896 2470 7700 5966 6165 6019 6231 6440 4085 6325 5875 6106 4017 6148 7716 7911 5372
286 283 298 258 255 254 264 279 169 259 240 368 237 263 347 207 220 204 263 228 262 200 253 254 204 221 242 270 170 132 274 170 337 203 119 335 223 191 230 218 235 175 250 212 178 149 201 243 218 240
3512 3227 3057 3913 4509 4306 3605 3599 4209 3627 3309 3234 2799 4491 3160 3045 4145 4379 3883 3638 3697 3807 3621 3121 4069 3346 3693 3221 3777 5221 3342 4216 2693 3352 3134 3221 3248 4375 3345 3830 3628 3165 3423 3408 4157 3610 3879 5643 5047 4211
174 132 153 159 147 114 114 179 169 124 155 173 149 136 146 124 154 168 150 151 146 122 193 143 147 129 139 128 132 130 209 128 136 139 150 140 122 135 128 134 132 136 135 123 121 134 127 178 139 188
43.5 43.0 34.2 47.0 40.4 37.8 34.7 42.0 40.7 44.1 48.2 48.5 39.5 41.1 38.7 40.7 47.3 47.1 47.8 39.9 47.5 34.4 22.9 46.1 40.6 47.7 36.8 45.9 39.7 47.6 47.9 41.9 42.4 49.4 48.0 46.9 42.1 47.8 44.4 40.7 40.2 32.4 47.5 47.7 39.5 33.9 47.4 35.4 37.1 41.9
CV% 22% 22% 16% 15% 13%

XII
APPENDIX 3 – TENSILE PROPERTIES Table A3- 2 Turretfield (high RtC)- MFD 15.8 μm CVD 29.8%
Force normalised by fibre diameter at the break
Force normalised by Vibroscope fibre diameter
Young’s modulus GPa
Break stress MPa
Young’s modulus GPa
Break stress MPa
Break strain %
5939 8958 7076 7959 7988 7037 8862 6605 6534 5499 5335 5358 5383 8426 5898 6101 5976 4350 5063 7890 7650 3833 6053 6358 5653 5021 6612 5099 4267 4763 5954 4505 6471 5521 3583 4456 5649 5006 4871 5937 2470 7927 5192 6687 5422 5272 4387 5414 5046
227 357 242 316 247 246 257 260 228 276 214 212 190 270 207 257 249 180 212 198 309 147 238 232 202 210 223 201 166 204 218 167 226 236 143 198 224 158 195 234 85
273 214 248 192 216 167 207 196
4252 4768 3871 4588 4660 4108 3731 4017 3781 4236 3957 4195 4084 3944 4565 4067 4033 4089 4007 3879 3841 3675 4453 3733 3615 3696 3877 3162 3531 4307 3555 3916 4272 3691 3680 4456 4595 3556 4180 4323 2766 3305 2888 4404 4610 3139 4781 3377 3439
162 190 132 182 144 144 108 158 132 212 158 166 144 126 160 171 168 169 168 97
155 141 175 136 129 155 131 125 137 184 130 145 149 158 147 198 182 112 167 170 95
114 119 163 163 128 182 129 133
45.5 42.5 34.2 47.4 42.1 37.5 33.1 39.3 36.8 46.1 46.6 45.8 36.5 38.0 40.7 40.9 49.0 42.1 41.9 33.0 28.9 44.8 46.0 45.6 38.6 48.3 34.0 40.7 40.8 46.0 42.8 35.8 46.8 48.2 45.7 46.7 47.4 44.5 40.6 48.4 39.7 42.1 49.0 40.5 34.9 46.1 33.7 37.3 44.2
CV% 23% 21% 12% 17% 12% MFD is the mean fibre diameter. CVD is the coefficient of variation of fibre diameter. CV% is the coefficient of variation of the sample. Fibres were tested at a constant rate of strain of 25%/min.

XIII
APPENDIX 3 – TENSILE PROPERTIES Table A3- 3 Kirby (low RtC)- MFD 16.8 μm CVD 14.3%
Force normalised by fibre diameter at the break
Force normalised by Vibroscope fibre diameter
Young’s modulus GPa
Break stress MPa
Young’s modulus GPa
Break stress MPa
Break strain %
4006 3722 4765 5784 5827 3402 7602 5038 4228 3551 4197 2955 2519 5822 4871 4642 4956 6224 4797 5003 5461 7621 4548 5348 3281 6407 4784 6006 6361 4738 6041 4426 5244 4634 4548 4273 5646 5044 6887 4937 5100 5246 5710 4197 3939 6768 5404 3926 6162 5031
131 153 155 181 238 111 257 172 147 148 181 107 104 180 193 175 221 218 161 188 205 260 178 212 146 243 175 221 232 229 205 266 184 179 203 194 222 246 177 195 181 225 238 164 191 219 226 178 212 242
4019 2735 3721 4145 3051 3342 3368 4129 3665 2845 2652 3379 3558 3955 3310 3898 3481 3588 3856 4273 3868 4153 3970 2976 3563 3827 3750 3938 3669 3287 3555 2693 3712 2417 2993 3354 3873 3516 4066 3942 2806 3596 3959 3657 3480 3935 3660 2344 4734 3147
132 113 121 130 125 109 114 141 127 119 114 122 147 123 131 147 155 126 129 161 145 142 155 118 158 145 137 145 134 159 121 162 130 94
134 152 152 172 105 155 100 154 165 143 169 128 153 107 163 151
35.5 34.3 32.7 35.1 34.1 28.1 32.1 36.8 36.3 31.4 35.7 28.6 36.9 29.5 38.8 43.3 43.3 35.1 35.0 41.7 40.2 38.9 45.3 33.2 43.9 37.8 41.3 38.8 39.8 46.8 34.1 39.5 39.0 20.9 44.8 42.7 42.7 52.5 22.4 44.9 26.1 41.9 47.8 38.3 54.4 35.9 43.6 30.3 46.8 42.3
CV% 22% 20% 14% 14% 18% MFD is the mean fibre diameter. CVD is the coefficient of variation of fibre diameter. CV% is the coefficient of variation of the sample. Fibres were tested at a constant rate of strain of 25%/min.

XIV
APPENDIX 3 – TENSILE PROPERTIES Table A3- 4 Kirby (high RtC)- MFD 16.7 μm CVD 20.4%
Force normalised by fibre diameter at the break
Force normalised by Vibroscope fibre diameter
Young’s modulus GPa
Break stress MPa
Young’s modulus GPa
Break stress MPa
Break strain %
6773 5745 6026 4483 5401 2856 3472 2994 4092 3196 5335 5358 3123 3577 5123 4559 4322 5811 5279 5608 3833 6053 6358 5653 5021 4358 5099 4267 4763 5954 4505 4315 5521 4894 4456 4154 5649 5006 4871 5937 3636 6611 6022 4897 5422 5272 4387 4774 5046
252 226 213 181 206 106 109 112 150 160 218 224 110 126 188 197 164 215 140 178 149 238 251 163 214 147 202 166 204 221 167 178 200 195 201 200 195 163 195 247 102 156 186 193 192 220 168 199 186
3591 3153 3031 3958 3968 3586 3948 3697 3207 3756 3066 3476 3823 3992 3764 3592 3471 3577 3844 3888 3550 3961 3604 3615 4008 4083 2711 3849 3780 3842 3566 3805 3735 3885 3559 3933 3051 3392 3643 3629 3541 3827 3518 3829 3947 3687 3737 3594 3325
133 124 107 160 151 134 124 138 117 188 126 145 135 141 138 155 132 133 102 123 138 156 142 104 171 138 107 150 162 143 132 157 135 155 161 189 106 110 146 151 99 90
109 151 140 154 143 150 122
34.0 44.0 39.1 42.3 41.1 39.3 33.1 39.3 38.4 33.7 32.0 33.9 37.0 38.0 41.2 49.5 42.1 41.9 23.9 31.3 42.6 34.6 29.7 38.3 30.7 34.0 28.9 35.5 45.4 42.6 35.5 35.0 34.5 45.7 45.8 48.8 45.9 34.4 40.6 46.1 33.3 41.3 36.5 39.2 36.8 45.6 38.2 41.1 45.9
CV% 19% 21% 8% 16% 15% MFD is the mean fibre diameter. CVD is the coefficient of variation of fibre diameter. CV% is the coefficient of variation of the sample. Fibres were tested at a constant rate of strain of 25%/min.
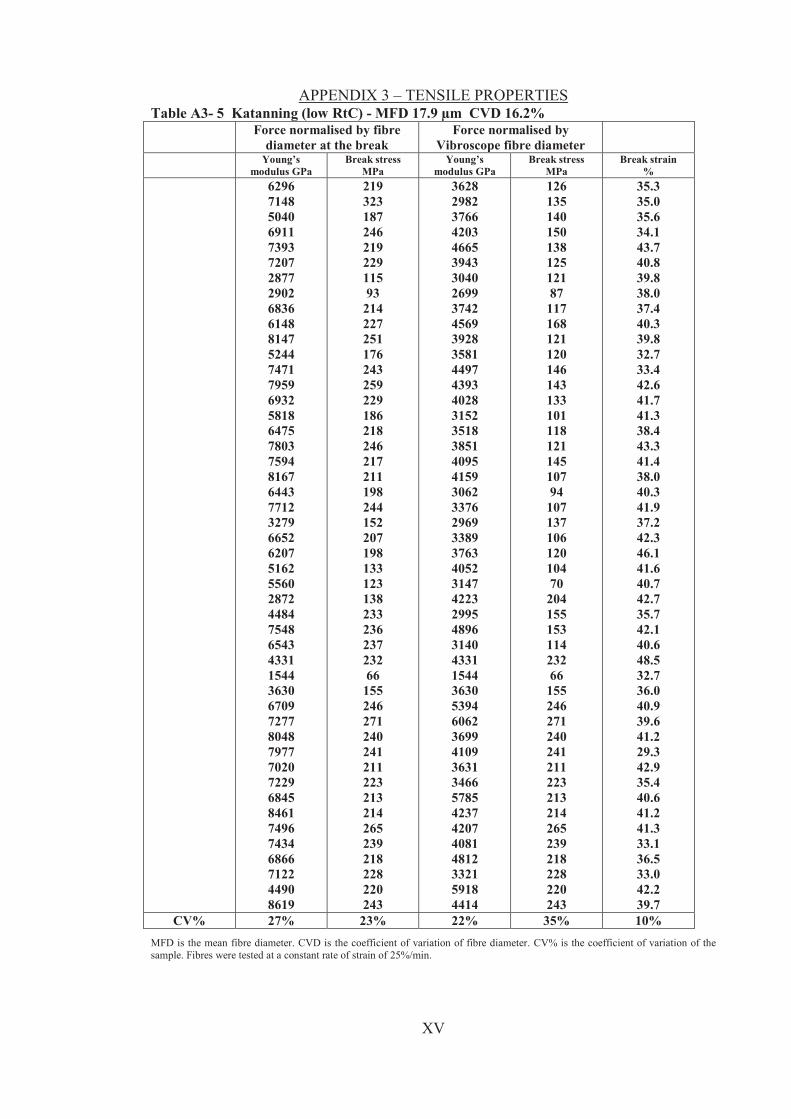
XV
APPENDIX 3 – TENSILE PROPERTIES Table A3- 5 Katanning (low RtC) - MFD 17.9 μm CVD 16.2%
Force normalised by fibre diameter at the break
Force normalised by Vibroscope fibre diameter
Young’s modulus GPa
Break stress MPa
Young’s modulus GPa
Break stress MPa
Break strain %
6296 7148 5040 6911 7393 7207 2877 2902 6836 6148 8147 5244 7471 7959 6932 5818 6475 7803 7594 8167 6443 7712 3279 6652 6207 5162 5560 2872 4484 7548 6543 4331 1544 3630 6709 7277 8048 7977 7020 7229 6845 8461 7496 7434 6866 7122 4490 8619
219 323 187 246 219 229 115 93
214 227 251 176 243 259 229 186 218 246 217 211 198 244 152 207 198 133 123 138 233 236 237 232 66
155 246 271 240 241 211 223 213 214 265 239 218 228 220 243
3628 2982 3766 4203 4665 3943 3040 2699 3742 4569 3928 3581 4497 4393 4028 3152 3518 3851 4095 4159 3062 3376 2969 3389 3763 4052 3147 4223 2995 4896 3140 4331 1544 3630 5394 6062 3699 4109 3631 3466 5785 4237 4207 4081 4812 3321 5918 4414
126 135 140 150 138 125 121 87
117 168 121 120 146 143 133 101 118 121 145 107 94
107 137 106 120 104 70
204 155 153 114 232 66
155 246 271 240 241 211 223 213 214 265 239 218 228 220 243
35.3 35.0 35.6 34.1 43.7 40.8 39.8 38.0 37.4 40.3 39.8 32.7 33.4 42.6 41.7 41.3 38.4 43.3 41.4 38.0 40.3 41.9 37.2 42.3 46.1 41.6 40.7 42.7 35.7 42.1 40.6 48.5 32.7 36.0 40.9 39.6 41.2 29.3 42.9 35.4 40.6 41.2 41.3 33.1 36.5 33.0 42.2 39.7
CV% 27% 23% 22% 35% 10% MFD is the mean fibre diameter. CVD is the coefficient of variation of fibre diameter. CV% is the coefficient of variation of the sample. Fibres were tested at a constant rate of strain of 25%/min.

XVI
APPENDIX 3 – TENSILE PROPERTIES Table A3- 6 Katanning (high RtC) - MFD 17.7 μm CVD 14.1%
Force normalised by fibre diameter at the break
Force normalised by Vibroscope fibre diameter
Young’s modulus GPa
Break stress MPa
Young’s modulus GPa
Break stress MPa
Break strain %
5260 7216 5339 3623 6629 7590 6324 6303 6487 5114 7572 6117 9514 4633 6049 5281 5979 5825 5806 5382 7219 7213 6942 7929 6534 6021 5773 4435 6016 4218 5483 5484 4261 5905 4676 4906 2599 5475 4770 4803 4442 8464 6364 4404 5651 4769 6504 7552 5868 5430 7020 4739 5051
199 214 201 133 207 236 240 208 224 175 227 213 260 129 220 179 218 229 195 208 244 264 243 258 235 191 217 203 189 165 201 229 175 244 290 228 110 208 172 184 159 246 198 183 246 197 278 217 203 191 206 75
209
3330 4747 3518 3711 4069 3951 3014 3584 4057 4423 3764 3437 4238 3393 3770 3946 3973 2440 2486 3785 2975 3177 2709 3234 3362 3844 2639 2798 3626 2159 3417 2467 4132 2477 3409 6136 2875 2992 2992 2759 2998 3623 3802 2394 3289 2928 3342 3427 3502 3430 3914 2341 3141
126 141 132 136 127 123 114 118 140 152 113 120 116 95
137 134 145 96 83
146 101 116 95
105 121 122 99
128 114 85 90
103 170 76
105 153 122 113 108 106 107 105 118 100 97
121 143 98
121 120 115 79
130
41.0 38.0 45.1 41.2 39.3 37.6 41.9 37.4 44.3 24.7 35.3 39.9 39.1 23.5 41.2 39.4 48.7 25.6 25.9 42.7 35.5 42.0 46.4 37.0 42.2 41.2 37.8 44.5 39.6 33.1 18.2 39.2 46.6 17.5 34.8 29.9 43.7 48.0 35.6 44.8 40.0 37.1 43.9 48.1 37.7 43.8 48.1 33.2 45.2 38.1 38.4 32.2 43.8
CV% 22% 23% 20% 17% 19%
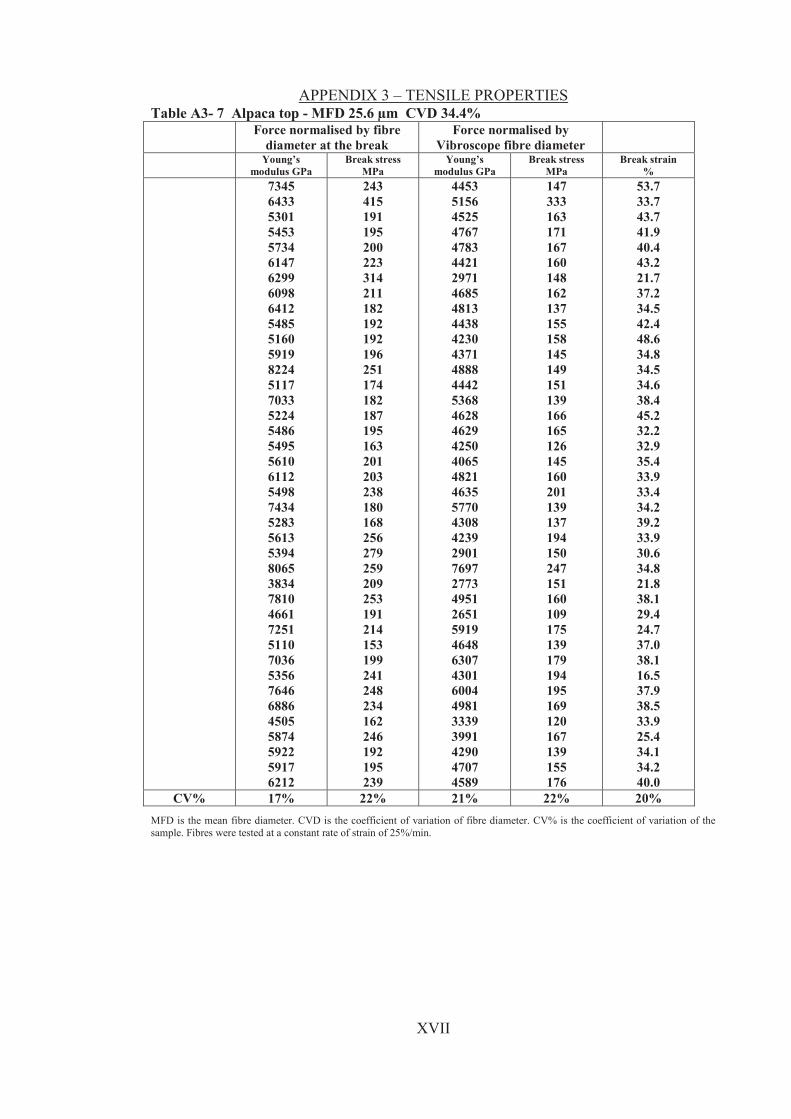
XVII
APPENDIX 3 – TENSILE PROPERTIES Table A3- 7 Alpaca top - MFD 25.6 μm CVD 34.4%
Force normalised by fibre diameter at the break
Force normalised by Vibroscope fibre diameter
Young’s modulus GPa
Break stress MPa
Young’s modulus GPa
Break stress MPa
Break strain %
7345 6433 5301 5453 5734 6147 6299 6098 6412 5485 5160 5919 8224 5117 7033 5224 5486 5495 5610 6112 5498 7434 5283 5613 5394 8065 3834 7810 4661 7251 5110 7036 5356 7646 6886 4505 5874 5922 5917 6212
243 415 191 195 200 223 314 211 182 192 192 196 251 174 182 187 195 163 201 203 238 180 168 256 279 259 209 253 191 214 153 199 241 248 234 162 246 192 195 239
4453 5156 4525 4767 4783 4421 2971 4685 4813 4438 4230 4371 4888 4442 5368 4628 4629 4250 4065 4821 4635 5770 4308 4239 2901 7697 2773 4951 2651 5919 4648 6307 4301 6004 4981 3339 3991 4290 4707 4589
147 333 163 171 167 160 148 162 137 155 158 145 149 151 139 166 165 126 145 160 201 139 137 194 150 247 151 160 109 175 139 179 194 195 169 120 167 139 155 176
53.7 33.7 43.7 41.9 40.4 43.2 21.7 37.2 34.5 42.4 48.6 34.8 34.5 34.6 38.4 45.2 32.2 32.9 35.4 33.9 33.4 34.2 39.2 33.9 30.6 34.8 21.8 38.1 29.4 24.7 37.0 38.1 16.5 37.9 38.5 33.9 25.4 34.1 34.2 40.0
CV% 17% 22% 21% 22% 20% MFD is the mean fibre diameter. CVD is the coefficient of variation of fibre diameter. CV% is the coefficient of variation of the sample. Fibres were tested at a constant rate of strain of 25%/min.

XVIII
APPENDIX 3 – TENSILE PROPERTIES Table A3- 8 Coarse wool top - MFD 26.9 μm CVD 22.7%
Force normalised by fibre diameter at the break
Force normalised by Vibroscope fibre diameter
Young’s modulus GPa
Break stress MPa
Young’s modulus GPa
Break stress MPa
Break strain %
7118 5774 3434 4958 5686 3942 5314 4940 5696 4931 4803 4419 5495 4683 4412 6794 3108 7264 6349 4375 4938 4039 6009 5556 4443 4334 3340 3651 6231 5201 6361 4026 5763 7452 7284 5314 3738 7051 6656 7464 5158 5106 5886 8237 6951 6857 6374
265 213 158 211 216 177 233 198 240 195 170 186 222 198 186 241 112 219 235 185 161 107 227 169 225 204 232 141 210 185 262 234 293 249 216 212 100 262 233 224 222 89
221 228 208 196 177
3982 4116 4000 4871 4346 3968 3825 4421 3527 3985 4465 3277 4348 3621 3225 2969 2877 4173 4060 3397 4220 3390 3675 4179 3106 3290 2871 2676 4316 3237 4319 3104 3707 6081 4660 3546 3198 4729 4788 5517 3548 4107 4314 4155 4787 4690 4910
148 152 184 208 165 178 168 178 149 157 158 138 175 153 136 105 104 126 150 144 137 90
139 127 157 155 199 103 146 115 178 180 189 204 138 141 86
176 168 166 153 72
162 115 144 134 136
36.5 36.7 38.6 54.5 36.9 42.6 43.8 42.0 41.1 42.2 40.6 49.5 39.2 39.3 33.2 16.9 22.7 29.7 36.4 50.3 52.8 40.3 50.4 32.4 54.7 44.3 69.3 40.4 54.1 51.1 50.9 58.4 29.4 23.3 20.7 31.7 21.7 21.4 24.9 25.2 17.8 10.9 22.6 28.6 23.9 20.2 26.4
CV% 23% 21% 21% 35% 35% MFD is the mean fibre diameter. CVD is the coefficient of variation of fibre diameter. CV% is the coefficient of variation of the sample. Fibres were tested at a constant rate of strain of 25%/min.
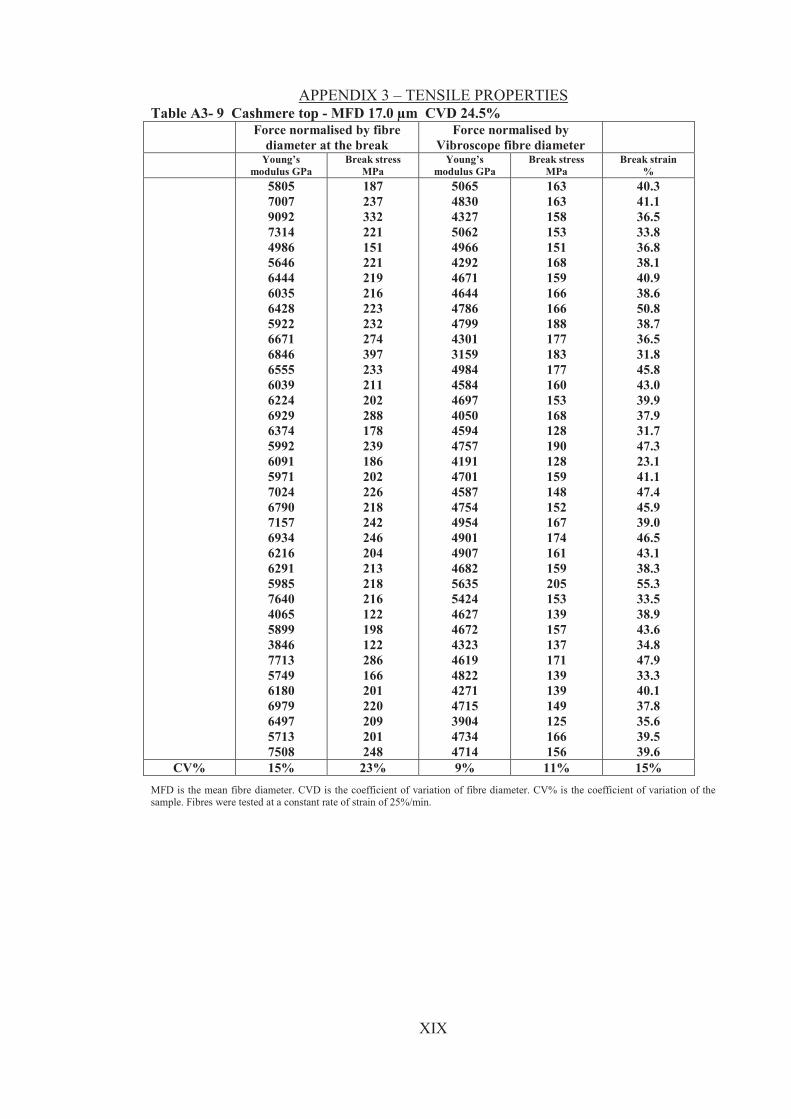
XIX
APPENDIX 3 – TENSILE PROPERTIES Table A3- 9 Cashmere top - MFD 17.0 μm CVD 24.5%
Force normalised by fibre diameter at the break
Force normalised by Vibroscope fibre diameter
Young’s modulus GPa
Break stress MPa
Young’s modulus GPa
Break stress MPa
Break strain %
5805 7007 9092 7314 4986 5646 6444 6035 6428 5922 6671 6846 6555 6039 6224 6929 6374 5992 6091 5971 7024 6790 7157 6934 6216 6291 5985 7640 4065 5899 3846 7713 5749 6180 6979 6497 5713 7508
187 237 332 221 151 221 219 216 223 232 274 397 233 211 202 288 178 239 186 202 226 218 242 246 204 213 218 216 122 198 122 286 166 201 220 209 201 248
5065 4830 4327 5062 4966 4292 4671 4644 4786 4799 4301 3159 4984 4584 4697 4050 4594 4757 4191 4701 4587 4754 4954 4901 4907 4682 5635 5424 4627 4672 4323 4619 4822 4271 4715 3904 4734 4714
163 163 158 153 151 168 159 166 166 188 177 183 177 160 153 168 128 190 128 159 148 152 167 174 161 159 205 153 139 157 137 171 139 139 149 125 166 156
40.3 41.1 36.5 33.8 36.8 38.1 40.9 38.6 50.8 38.7 36.5 31.8 45.8 43.0 39.9 37.9 31.7 47.3 23.1 41.1 47.4 45.9 39.0 46.5 43.1 38.3 55.3 33.5 38.9 43.6 34.8 47.9 33.3 40.1 37.8 35.6 39.5 39.6
CV% 15% 23% 9% 11% 15% MFD is the mean fibre diameter. CVD is the coefficient of variation of fibre diameter. CV% is the coefficient of variation of the sample. Fibres were tested at a constant rate of strain of 25%/min.

XX
APPENDIX 3 – TENSILE PROPERTIES Table A3- 10 Fine wool top - MFD 17.0 μm CVD 18.9%
Force normalised by fibre diameter at the break
Force normalised by Vibroscope fibre diameter
Young’s modulus GPa
Break stress MPa
Young’s modulus GPa
Break stress MPa
Break strain %
4312 4788 5437 4867 5167 6454 5529 5706 5610 3077 4711 4266 5130 4477 3874 4557 6146 4402 5279 5017 4923 4093 4063 4914 5008 4108 4783 7293 4496 4053 3980 5333 3961 8366 5792 3577 6398 5765 6338 4267 5897 5629 6050 4699 4435 4130 5239 4878 4677 3831 4624
183 202 234 183 230 303 234 267 253 131 181 161 201 174 174 172 261 182 201 189 242 191 162 199 227 165 182 315 158 158 182 214 154 270 230 194 252 328 268 176 204 212 207 194 205 153 178 181 164 174 240
3313 3471 3250 3483 3283 3398 3384 3524 3155 3442 3841 3869 3737 3750 3245 3869 3442 3540 3845 3869 3232 3204 3378 3541 3345 3168 3789 3413 3759 3862 3285 3909 3291 5059 4191 3043 4137 3319 4105 3621 4749 4131 4636 3843 3637 3847 3505 3334 4393 3599 3561
141 146 140 131 146 160 143 165 142 146 147 146 146 146 146 146 146 146 146 146 159 150 135 143 152 127 144 147 132 150 150 157 128 163 166 165 163 189 174 150 164 156 158 158 168 143 119 124 154 164 185
33.6 37.6 38.0 38.9 36.3 36.8 28.7 35.4 32.7 34.3 35.1 34.4 41.6 36.9 36.4 28.3 35.7 25.8 39.7 30.7 41.3 38.4 37.0 33.2 43.4 38.6 36.9 29.2 34.1 37.2 44.3 40.2 27.9 32.7 41.0 39.2 38.7 38.9 37.9 35.1 42.7 34.7 38.3 35.8 43.5 32.8 43.3 33.1 43.2 42.3 43.0
CV% 19% 21% 12% 9% 12%
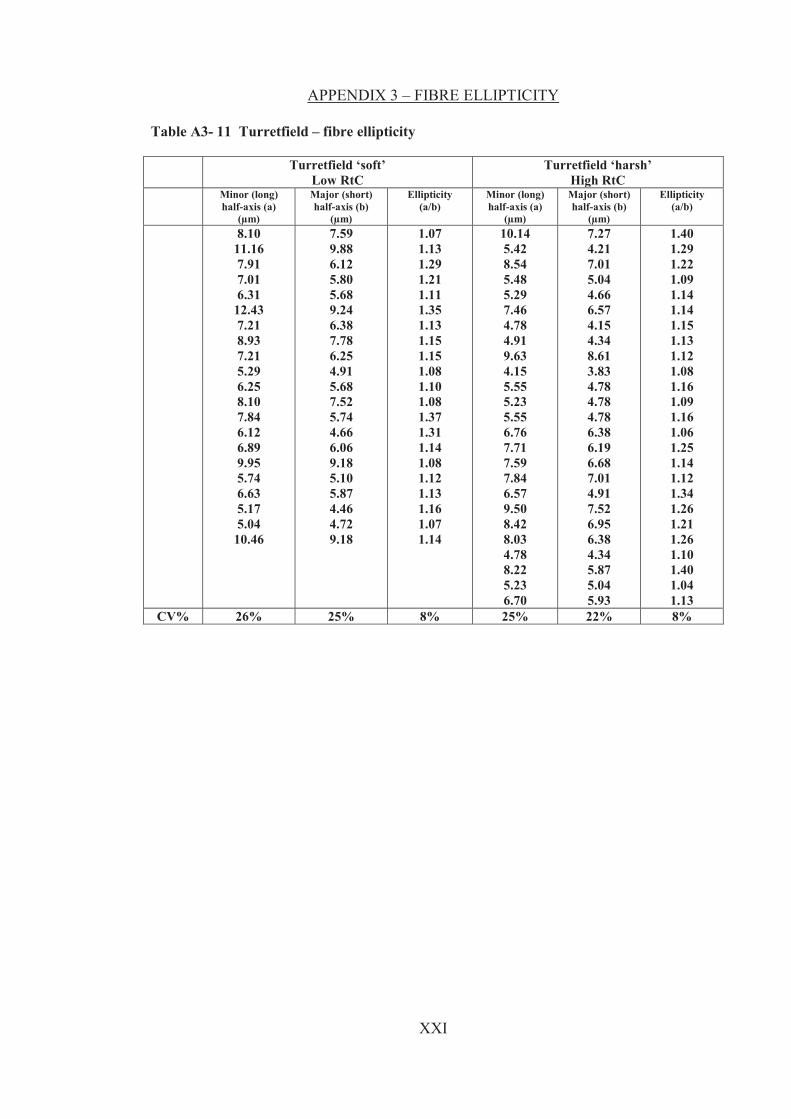
XXI
APPENDIX 3 – FIBRE ELLIPTICITY
Table A3- 11 Turretfield – fibre ellipticity
Turretfield ‘soft’ Low RtC
Turretfield ‘harsh’ High RtC
Minor (long) half-axis (a)
(μm)
Major (short) half-axis (b)
(μm)
Ellipticity (a/b)
Minor (long) half-axis (a)
(μm)
Major (short) half-axis (b)
(μm)
Ellipticity (a/b)
8.10 11.16 7.91 7.01 6.31
12.43 7.21 8.93 7.21 5.29 6.25 8.10 7.84 6.12 6.89 9.95 5.74 6.63 5.17 5.04
10.46
7.59 9.88 6.12 5.80 5.68 9.24 6.38 7.78 6.25 4.91 5.68 7.52 5.74 4.66 6.06 9.18 5.10 5.87 4.46 4.72 9.18
1.07 1.13 1.29 1.21 1.11 1.35 1.13 1.15 1.15 1.08 1.10 1.08 1.37 1.31 1.14 1.08 1.12 1.13 1.16 1.07 1.14
10.14 5.42 8.54 5.48 5.29 7.46 4.78 4.91 9.63 4.15 5.55 5.23 5.55 6.76 7.71 7.59 7.84 6.57 9.50 8.42 8.03 4.78 8.22 5.23 6.70
7.27 4.21 7.01 5.04 4.66 6.57 4.15 4.34 8.61 3.83 4.78 4.78 4.78 6.38 6.19 6.68 7.01 4.91 7.52 6.95 6.38 4.34 5.87 5.04 5.93
1.40 1.29 1.22 1.09 1.14 1.14 1.15 1.13 1.12 1.08 1.16 1.09 1.16 1.06 1.25 1.14 1.12 1.34 1.26 1.21 1.26 1.10 1.40 1.04 1.13
CV% 26% 25% 8% 25% 22% 8%

XXII
APPENDIX 3 – FIBRE ELLIPTICITY
Table A3- 12 Kirby - fibre ellipticity
Kirby ‘soft’ Low RtC
Kirby ‘harsh’ High RtC
Minor (long) half-axis (a)
(μm)
Major (short) half-axis (b)
(μm)
Ellipticity (a/b)
Minor (long) half-axis (a)
(μm)
Major (short) half-axis (b)
(μm)
Ellipticity (a/b)
8.12 7.09
11.18 9.40 7.56 7.92 7.12 7.48 9.14 7.72 5.66
10.32 8.29 6.49 8.12 8.03
10.74 7.97
10.02 10.73
7.19 5.80 8.92 8.11 6.42 6.58 6.44 6.56 7.49 6.47 5.10 8.93 7.36 5.74 7.46 6.86 8.49 6.83 8.44 8.80
1.13 1.22 1.25 1.16 1.18 1.20 1.11 1.14 1.22 1.19 1.11 1.16 1.13 1.13 1.09 1.17 1.26 1.17 1.19 1.22
10.95 7.93 6.76 9.38 9.59 6.83
11.18 6.08 7.39 7.27 8.71
11.08 9.20 9.44 7.81 8.74 8.21 7.63 7.85 9.25
9.24 6.39 5.93 8.22 8.21 6.23 9.24 5.49 6.43 6.52 6.98 9.50 8.43 7.92 6.73 7.61 7.27 6.93 6.91 8.47
1.19 1.24 1.14 1.14 1.17 1.10 1.21 1.11 1.15 1.12 1.25 1.17 1.09 1.19 1.16 1.15 1.13 1.10 1.14 1.09
CV% 18% 16% 4% 17% 16% 4%

XXIII
APPENDIX 3 – FIBRE ELLIPTICITY
Table A3- 13 Katanning – fibre ellipticity
Katanning ‘soft’ Low RtC
Katanning ‘harsh’ High RtC
Minor (long) half-axis (a)
(μm)
Major (short) half-axis (b)
(μm)
Ellipticity (a/b)
Minor (long) half-axis (a)
(μm)
Major (short) half-axis (b)
(μm)
Ellipticity (a/b)
8.14 6.42 7.28
10.68 7.58 9.62
12.11 8.95 6.74 9.19 7.67 8.05
11.32 9.48 9.58 6.65 8.27 8.58 7.17 7.71
7.01 5.86 6.19 9.72 6.75 8.43 9.43 7.71 6.14 7.92 6.62 7.08
10.04 8.78 8.24 6.07 7.14 7.44 6.12 5.69
1.16 1.09 1.18 1.10 1.12 1.14 1.28 1.16 1.10 1.16 1.16 1.14 1.13 1.08 1.16 1.09 1.16 1.15 1.17 1.36
7.82 6.62 9.81 7.71 9.24 8.65 9.41 7.95 8.80
10.69 8.31 9.18 6.45 5.55 9.46 7.91 8.74 9.78 5.23 9.57
6.96 6.01 8.56 7.07 7.86 7.47 7.92 6.92 7.61 9.25 7.07 8.16 5.23 4.78 8.18 7.36 7.97 8.39 4.14 8.34
1.12 1.10 1.15 1.09 1.18 1.16 1.19 1.15 1.16 1.16 1.17 1.13 1.23 1.16 1.16 1.07 1.10 1.17 1.26 1.15
CV% 18% 18% 6% 17% 18% 4%

XXIV
APPENDIX 3 – FIBRE ELLIPTICITY
Table A3- 14 Alpaca and Coarse wool top – fibre ellipticity
Alpaca ‘soft’ Low RtC
Coarse wool ‘harsh’ High RtC
Minor (long) half-axis (a)
(μm)
Major (short) half-axis (b)
(μm)
Ellipticity (a/b)
Minor (long) half-axis (a)
(μm)
Major (short) half-axis (b)
(μm)
Ellipticity (a/b)
13.71 14.32 19.45 12.59 18.21 11.26 12.63 14.17 11.97 11.32 12.45 18.81 14.75 13.65 12.49 13.17 14.37 13.64 12.61 16.36
12.31 11.24 14.36 10.63 14.45 8.84
10.22 11.23 10.16 10.46 10.86 13.37 11.34 10.72 9.04
10.74 11.93 11.23 10.47 12.48
1.11 1.27 1.35 1.18 1.26 1.27 1.24 1.26 1.18 1.08 1.15 1.41 1.30 1.27 1.38 1.23 1.21 1.22 1.20 1.31
13.72 16.73 12.31 13.34 12.29 12.56 11.73 9.42
16.09 11.33 13.71 14.84 8.76
13.40 13.81 12.91 11.86 15.04 12.56 13.46
11.34 12.82 10.24 10.49 10.08 10.16 9.72 8.75
12.83 9.26
11.27 12.23 7.82
10.72 11.36 10.58 10.22 12.13 10.28 10.96
1.21 1.31 1.20 1.27 1.22 1.24 1.21 1.08 1.25 1.22 1.22 1.21 1.12 1.25 1.22 1.22 1.16 1.24 1.22 1.23
CV% 17% 13% 7% 15% 12% 4%

XXV
APPENDIX 3 – FIBRE ELLIPTICITY
Table A3- 15 Cashmere and fine wool top – fibre ellipticity
Cashmere ‘soft’ Low RtC
Fine wool ‘harsh’ High RtC
Minor (long) half-axis (a)
(μm)
Major (short) half-axis (b)
(μm)
Ellipticity (a/b)
Minor (long) half-axis (a)
(μm)
Major (short) half-axis (b)
(μm)
Ellipticity (a/b)
10.66 6.15 9.74 8.16 8.47
11.88 9.76 7.96 7.12 8.27
13.14 6.93
12.37 8.73 9.32 7.73 9.11 7.06 9.96 9.12
9.58 5.61 8.99 7.36 7.26 9.98 8.56 7.03 6.54 7.39
10.57 5.89
10.77 7.65 8.28 6.66 8.02 6.15 8.70 7.77
1.11 1.10 1.08 1.11 1.17 1.19 1.14 1.13 1.09 1.12 1.24 1.18 1.15 1.14 1.13 1.16 1.14 1.15 1.14 1.17
8.24 10.71 10.48 7.81
10.11 7.38
12.46 9.06
11.33 12.23 8.62 7.91 9.08
11.06 11.76 8.21 9.28 8.35
11.70 8.06
7.32 9.88 8.67 6.58 8.49 6.28
10.68 8.01 9.79 9.49 7.26 7.11 7.52 9.39 9.11 7.01 7.63 7.02 9.24 7.09
1.13 1.08 1.21 1.19 1.19 1.18 1.17 1.13 1.16 1.29 1.19 1.11 1.21 1.18 1.29 1.17 1.22 1.19 1.27 1.14
CV% 20% 19% 3% 17% 15% 5%

XXVI
APPENDIX 4 – KNITTED FABRIC PROPERTIES
SPIRALITY IN SINGLE JERSEY KNITS
14 Gauge 3.5” FAK
Machine tightness factor 14 tex½/cm
The Woolmark test method TM 276-May 2000 was used to test the angle of spirality in
plain knitted fabrics. In order to comply with Woolmark knitted apparel products
specification, K1 (August 2000), spirality in knitwear must not exceed 5°.
Table A 4. 1 Spirality in single jersey knits – preliminary experiment
Processing route
Fibre description
Folding twist (% of singles)
Machine state Fabric
Spirality (°)
Wet relaxed (1X7A) TM276 Fabric
Spirality (°)
Worsted ring spun 26 μm alpaca
50 2 3
55 3 4
60 5 7
Worsted ring spun
26 μm ecru wool
50 3 3
55 2 3
60 8 6
Cotton ring spun
17 μm cashmere
50 2 4
55 5 6
60 6 9
Cotton ring spun
17 μm stretch broken wool
50 3 3
55 3 4
60 6 8

XXVII
APPENDIX 4 – KNITTED FABRIC PROPERTIES
Table A 4. 2 Lawson Hemphill 14 gauge 10” FAK - gears and settings
Yarn description
Machine Tightness
factor (tex½/cm)
Stitch length (mm)
Gear Setting
Worsted ring spun 26 μm alpaca
R65/2tex
13 6.27 30 3.66
14 5.75 30 3.35
15 5.39 30 3.14
Worsted ring spun 26 μm ecru wool
R67/2 tex
13 6.37 30 3.71
14 5.84 30 3.40
15 5.47 30 3.19
Worsted ring spun 26 μm top dyed
wool R66/2 tex
13 6.32 30 3.68
14 5.80 30 3.38
15 5.43 30 3.17
Cotton ring spun 17 μm cashmere
R54/2 tex
13 5.68 30 3.31
14 5.25 30 3.06
15 4.92 15 5.74
Cotton ring spun 17 μm stretch broken wool
R56/2 tex
13 5.77 30 3.36
14 5.34 30 3.11
15 5.00 15 5.83
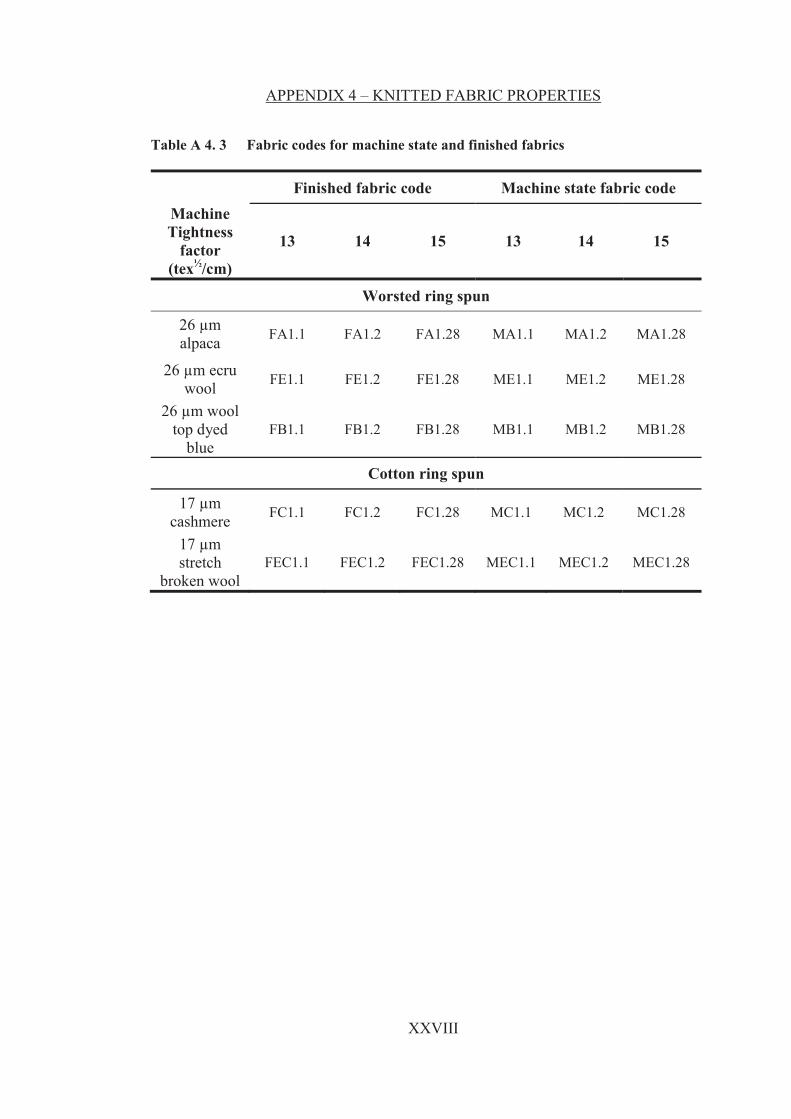
XXVIII
APPENDIX 4 – KNITTED FABRIC PROPERTIES
Table A 4. 3 Fabric codes for machine state and finished fabrics
Finished fabric code Machine state fabric code Machine Tightness
factor (tex½/cm)
13 14 15 13 14 15
Worsted ring spun
26 μm alpaca FA1.1 FA1.2 FA1.28 MA1.1 MA1.2 MA1.28
26 μm ecru wool FE1.1 FE1.2 FE1.28 ME1.1 ME1.2 ME1.28
26 μm wool top dyed
blue FB1.1 FB1.2 FB1.28 MB1.1 MB1.2 MB1.28
Cotton ring spun
17 μm cashmere FC1.1 FC1.2 FC1.28 MC1.1 MC1.2 MC1.28
17 μm stretch
broken wool FEC1.1 FEC1.2 FEC1.28 MEC1.1 MEC1.2 MEC1.28

XXIX
APPENDIX 4 – KNITTED FABRIC PROPERTIES
Table A 4. 4 Physical properties of single jersey fabrics made from worsted ring spun alpaca, ecru wool and top dyed wool
Finished & anti cockle treated fabric Machine state fabric
Code
Fabric weight (g/m2)
Fabric thickness
(mm)
Fabric spirality
(°) Code
Fabric weight (g/m2)
Weight change
(%)
FA1.1 231 0.86 3 MA1.1 181
226 0.80 2 180
228 0.80 2 180
Average 229 0.82 2 Average 180 27
FA1.2 238 0.79 3 MA1.2 202
242 0.81 2 208
244 0.80 2 201
Average 241 0.80 2 204 18
FA1.28 261 0.85 3 MA1.28 214
252 0.85 2 209
250 0.84 2 213
Average 254 0.85 2 Average 212 20
FE1.1 218 1.01 3 ME1.1 193
218 0.91 2 195
221 0.99 2 204
Average 219 0.97 2 Average 197 11
FE1.2 240 0.94 2 ME1.2 216
245 0.94 2 211
242 0.95 1 219
Average 242 0.94 2 Average 215 13
FE1.28 262 0.92 0 ME1.28 226
262 0.95 1 225
263 0.94 1 231
Average 262 0.94 1 Average 227 16
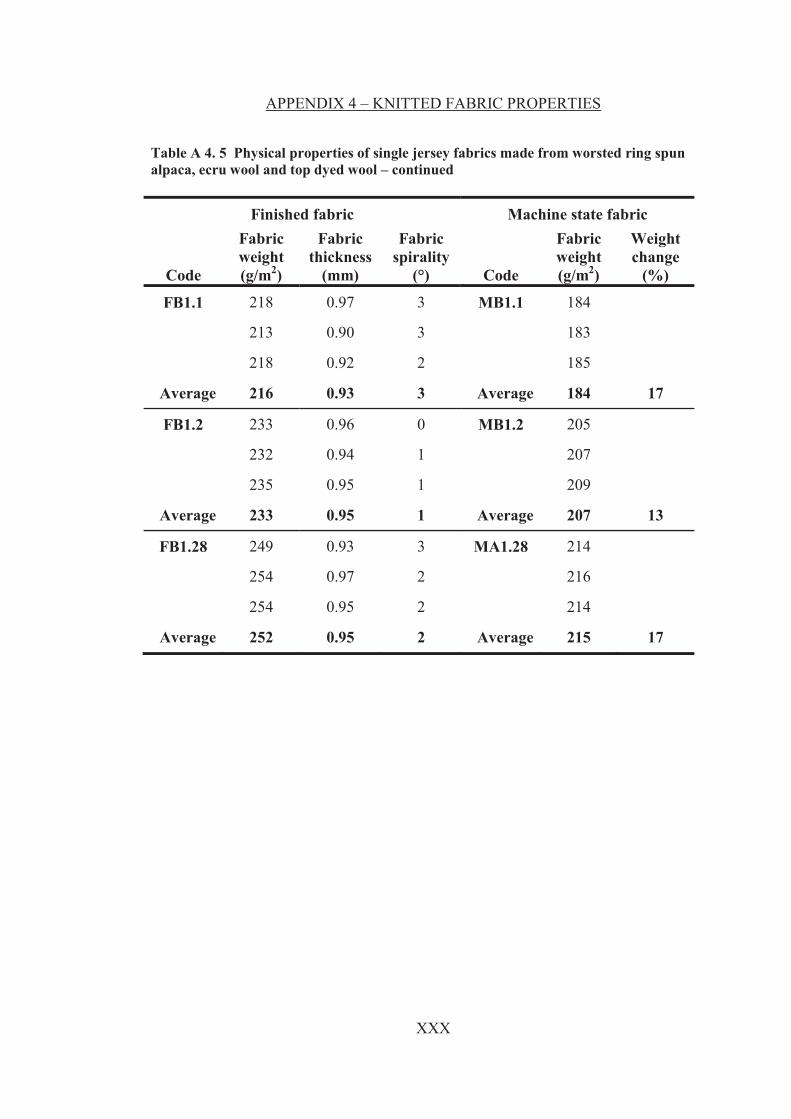
XXX
APPENDIX 4 – KNITTED FABRIC PROPERTIES
Table A 4. 5 Physical properties of single jersey fabrics made from worsted ring spun alpaca, ecru wool and top dyed wool – continued
Finished fabric Machine state fabric
Code
Fabric weight (g/m2)
Fabric thickness
(mm)
Fabric spirality
(°) Code
Fabric weight (g/m2)
Weight change
(%)
FB1.1 218 0.97 3 MB1.1 184
213 0.90 3 183
218 0.92 2 185
Average 216 0.93 3 Average 184 17
FB1.2 233 0.96 0 MB1.2 205
232 0.94 1 207
235 0.95 1 209
Average 233 0.95 1 Average 207 13
FB1.28 249 0.93 3 MA1.28 214
254 0.97 2 216
254 0.95 2 214
Average 252 0.95 2 Average 215 17
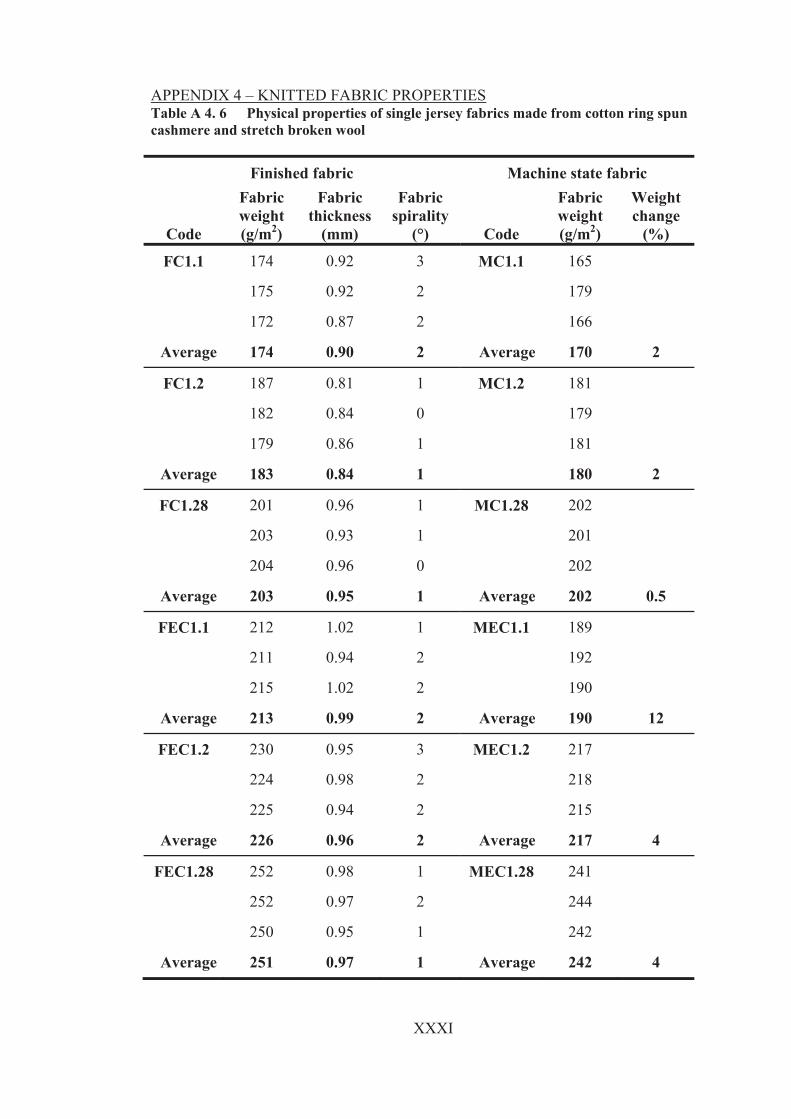
XXXI
APPENDIX 4 – KNITTED FABRIC PROPERTIES Table A 4. 6 Physical properties of single jersey fabrics made from cotton ring spun cashmere and stretch broken wool
Finished fabric Machine state fabric
Code
Fabric weight (g/m2)
Fabric thickness
(mm)
Fabric spirality
(°) Code
Fabric weight (g/m2)
Weight change
(%)
FC1.1 174 0.92 3 MC1.1 165
175 0.92 2 179
172 0.87 2 166
Average 174 0.90 2 Average 170 2
FC1.2 187 0.81 1 MC1.2 181
182 0.84 0 179
179 0.86 1 181
Average 183 0.84 1 180 2
FC1.28 201 0.96 1 MC1.28 202
203 0.93 1 201
204 0.96 0 202
Average 203 0.95 1 Average 202 0.5
FEC1.1 212 1.02 1 MEC1.1 189
211 0.94 2 192
215 1.02 2 190
Average 213 0.99 2 Average 190 12
FEC1.2 230 0.95 3 MEC1.2 217
224 0.98 2 218
225 0.94 2 215
Average 226 0.96 2 Average 217 4
FEC1.28 252 0.98 1 MEC1.28 241
252 0.97 2 244
250 0.95 1 242
Average 251 0.97 1 Average 242 4

XXXII
APPENDIX 4 – KNITTED FABRIC PROPERTIES
COTTON RING SPUN CASHMERE AND STRETCH BROKEN FINE WOOL
Table A 4. 7 Two factor Anova with replications (α=0.05) for mean fabric weight and thickness of single jersey fabrics knitted from cotton spun cashmere and stretch broken fine wool to different machine tightness factors
Source of variation
Fabric weight (g/m2) Fabric Thickness (mm)
F P-value F critical F P-value F critical
Machine tightness
factor 288 0.000 3.89 8.64 0.005 3.89
Fibre type 1398 0.000 4.75 33.75 0.000 4.75
Interaction 5.69 0.018 3.89 5.57 0.019 3.89
Table A 4. 8 Independent samples t-test (α=0.05) testing the significance of the differences in mean fabric weight and thickness due to fibre type for fabrics knitted from cotton spun yarns (difference between sample means in columns - same machine tightness factor but different fibre types) Machine tightness
factor (tex½/cm)
Fabric weight (g/m2) Fabric Thickness (mm)
Tstat Tcrit (two tail)
P(T<=t) (two tail)
Tstat Tcrit (two tail)
P(T<=t) (two tail)
13 -26.16 2.78 1.27x10⁻⁵ -2.86 2.78 0.046
14 -14.65 2.78 0.0001 -6.36 2.78 0.031
15 -44.02 2.78 1.59x10⁻⁶ -1.25 2.78 0.279
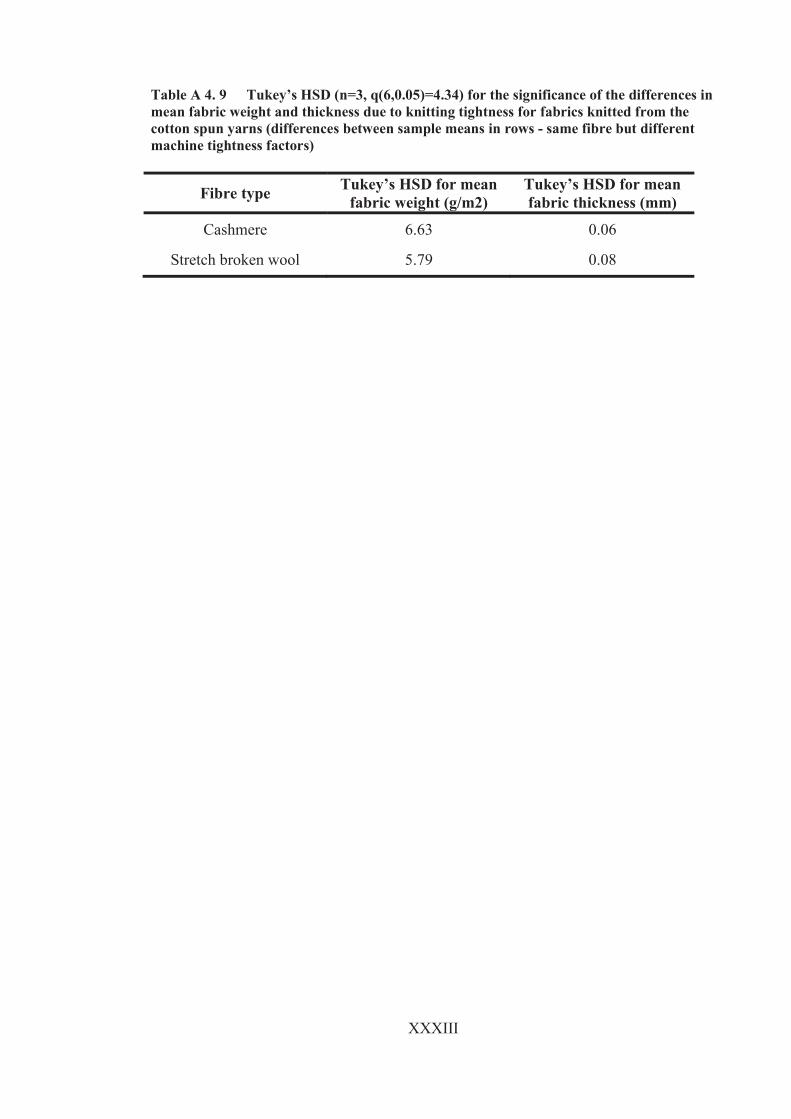
XXXIII
Table A 4. 9 Tukey’s HSD (n=3, q(6,0.05)=4.34) for the significance of the differences in mean fabric weight and thickness due to knitting tightness for fabrics knitted from the cotton spun yarns (differences between sample means in rows - same fibre but different machine tightness factors)
Fibre type Tukey’s HSD for mean fabric weight (g/m2)
Tukey’s HSD for mean fabric thickness (mm)
Cashmere 6.63 0.06
Stretch broken wool 5.79 0.08

XXXIV
APPENDIX 4 – KNITTED FABRIC PROPERTIES
WORSTED RING SPUN ALPACA, ECRU WOOL AND TOP DYED WOOL
Table A 4. 10 Two factor Anova with replications (α=0.05) for mean fabric weight and thickness of single jersey fabrics knitted from worsted spun alpaca, ecru wool and top dyed wool to different machine tightness factors
Dependent Variable Fabric weight (g/m2) Fabric Thickness (mm)
Source of variation F P-value F critical F P-value F critical
Cover factor 317.36 0.000 3.56 0.06 0.558 3.56
Fibre type 18.18 0.000 3.56 67.59 0.000 3.56
Interaction 6.70 0.002 2.93 1.86 0.161 2.93
Table A 4. 11 Tukey’s HSD (n=3, q(6,0.05)=4.34) for the significance of the differences in mean fabric weight and thickness due to fibre type for fabrics knitted from the worsted spun yarns (differences between sample means in columns - same machine tightness factor but different fibre types)
Machine tightness
factor
Post Hoc Tukey’s HSD for mean fabric weight (g/m2)
Post Hoc Tukey’s HSD for mean fabric thickness (mm)
13 6.08 0.11
14 6.14 0.02
15 9.49 0.04
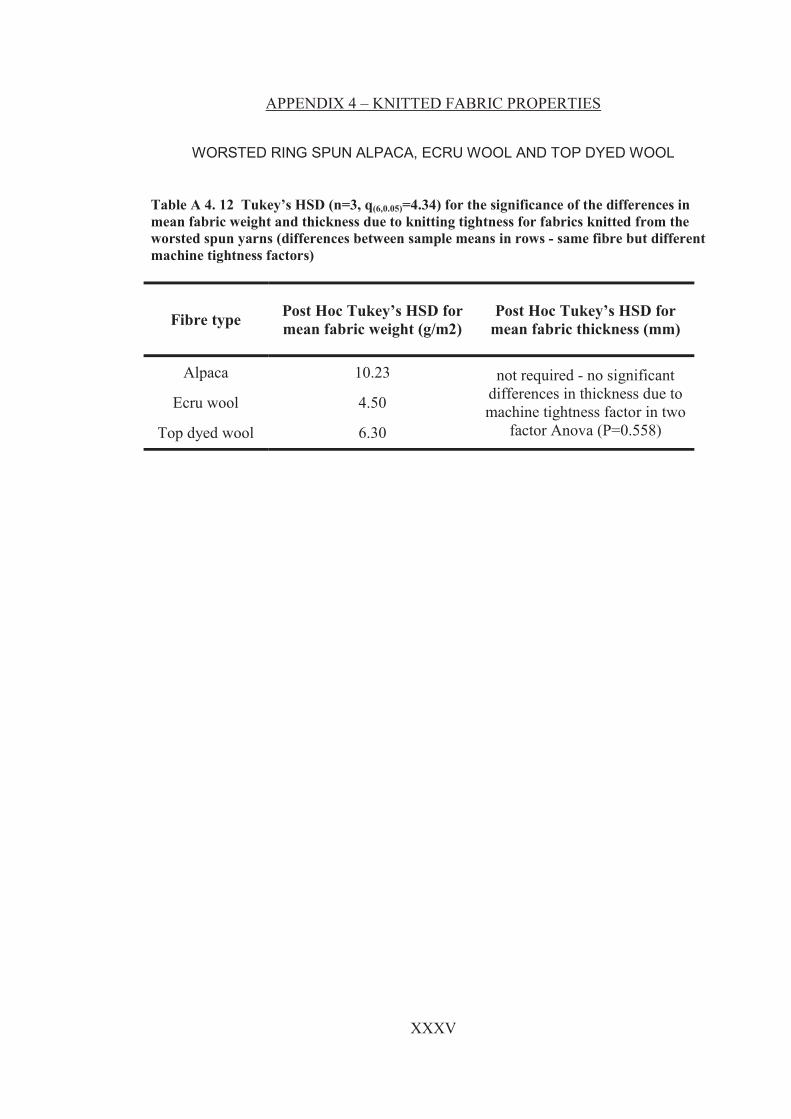
XXXV
APPENDIX 4 – KNITTED FABRIC PROPERTIES
WORSTED RING SPUN ALPACA, ECRU WOOL AND TOP DYED WOOL
Table A 4. 12 Tukey’s HSD (n=3, q(6,0.05)=4.34) for the significance of the differences in mean fabric weight and thickness due to knitting tightness for fabrics knitted from the worsted spun yarns (differences between sample means in rows - same fibre but different machine tightness factors)
Fibre type Post Hoc Tukey’s HSD for mean fabric weight (g/m2)
Post Hoc Tukey’s HSD for mean fabric thickness (mm)
Alpaca 10.23 not required - no significant differences in thickness due to machine tightness factor in two
factor Anova (P=0.558)
Ecru wool 4.50
Top dyed wool 6.30

XXXVI
APPENDIX 4 – KNITTED FABRIC PROPERTIES
Table A 4. 13 KESF bending properties of single jersey fabrics made from worsted ring spun alpaca, ecru wool and top dyed wool
Fabric Code
Fabric bending rigidity (B,μN.m)
Fabric bending hysteresis (2HB,μN)
Upper Lower Average Upper Lower Average
FA1.1 3.49 2.51 3.00 487.72 747.60 617.66
3.47 2.28 2.88 413.40 548.00 480.70
3.31 2.27 3.29 418.24 564.79 491.50
Average 3.42 2.35 3.06 439.79 620.13 529.96
FA1.2 3.96 2.74 3.35 348.34 457.00 402.67
4.69 3.31 4.00 684.25 897.27 790.76
3.64 1.84 2.74 460.24 614.02 537.13
Average 4.10 2.63 3.36 497.61 656.10 576.85
FA1.28 7.16 6.54 6.85 705.13 1049.45 877.29
5.49 3.10 4.29 566.10 656.05 611.08
5.86 2.55 4.21 548.50 808.30 678.40
Average 6.17 4.06 5.12 606.58 837.93 722.26
FE1.1 6.50 6.40 6.45 624.00 732.67 678.33
5.02 5.66 5.34 511.91 624.36 568.13
6.29 6.53 6.41 750.37 909.85 830.11
Average 5.94 6.20 6.07 628.76 755.63 692.19
FE1.2 6.11 6.69 6.40 672.28 796.61 734.45
6.10 6.63 6.37 652.28 804.73 728.55
5.83 6.68 6.25 587.57 728.79 658.18
Average 6.01 6.67 6.34 637.38 776.71 707.06
FE1.28 6.40 7.30 6.85 716.00 844.07 780.04
5.71 6.67 6.19 664.30 715.77 690.04
6.41 7.39 6.90 692.33 815.26 753.79
Average 6.17 7.12 6.65 690.88 791.70 741.29

XXXVII
APPENDIX 4 – KNITTED FABRIC PROPERTIES
Table A 4. 14 KESF bending properties of single jersey fabrics made from worsted ring spun alpaca, ecru wool and top dyed wool – continued
Fabric Code
Fabric bending rigidity (B,μN.m)
Fabric bending hysteresis (2HB,μN)
Upper Lower Average Upper Lower Average FB1.1 5.12 5.37 5.24 596.12 705.09 650.61
4.83 5.46 5.14 514.12 657.81 585.97
4.40 5.26 4.83 486.97 603.17 545.07
Average 4.78 5.36 5.07 532.40 655.36 593.88
FB1.2 5.40 5.97 5.68 547.57 727.58 637.57 5.44 6.02 5.73 637.40 804.58 720.99
4.87 5.96 5.41 561.35 697.91 629.63
Average 5.24 5.98 5.61 582.11 743.36 662.73
FB1.28 6.06 7.07 6.56 632.07 810.81 721.44 7.50 7.79 7.64 784.01 924.04 854.03
5.14 6.04 5.59 697.96 770.24 734.10
Average 6.23 6.97 6.60 704.68 835.03 769.86

XXXVIII
APPENDIX 4 – KNITTED FABRIC PROPERTIES
Table A 4. 15 KESF bending properties of single jersey fabrics made from cotton ring spun cashmere and stretch broken wool
Fabric Code
Fabric bending rigidity (B,μN.m)
Fabric bending hysteresis (2HB,μN)
Upper Lower Average Upper Lower Average
FC1.1 2.24 2.55 2.40 375.31 445.56 410.44
2.17 2.74 2.46 394.51 694.00 544.26
2.20 2.45 2.33 382.35 592.40 487.38
Average 2.20 2.58 2.39 384.06 577.32 480.69
FC1.2 2.91 2.04 2.48 400.97 528.78 464.88
2.40 2.44 2.42 670.65 887.98 779.32
2.06 3.91 2.98 366.07 707.27 536.67
Average 2.46 2.80 2.63 479.23 708.01 593.62
FC1.28 3.97 1.99 2.98 654.11 884.82 769.46
4.90 2.34 3.62 715.95 887.95 801.95
4.23 1.50 2.87 523.15 905.28 714.22
Average 4.37 1.94 3.16 631.07 892.68 761.88
FEC1.1 3.77 4.37 4.08 674.27 827.97 751.12
3.38 4.48 3.93 532.17 685.47 608.82
3.82 4.62 4.22 614.07 678.14 646.10
Average 3.66 4.49 4.08 606.84 730.53 668.68
FEC1.2 4.19 4.27 4.23 688.97 834.84 761.90
4.09 5.39 4.74 707.82 841.06 774.44
4.07 5.26 4.67 631.81 810.89 721.35
Average 4.12 4.97 4.55 676.20 828.93 752.56
FEC1.28 5.05 6.82 5.94 853.94 1041.41 947.67
5.78 3.82 4.80 741.10 816.49 778.80
5.42 6.63 6.03 850.75 994.93 922.84
Average 5.42 5.76 5.59 815.26 950.94 883.10
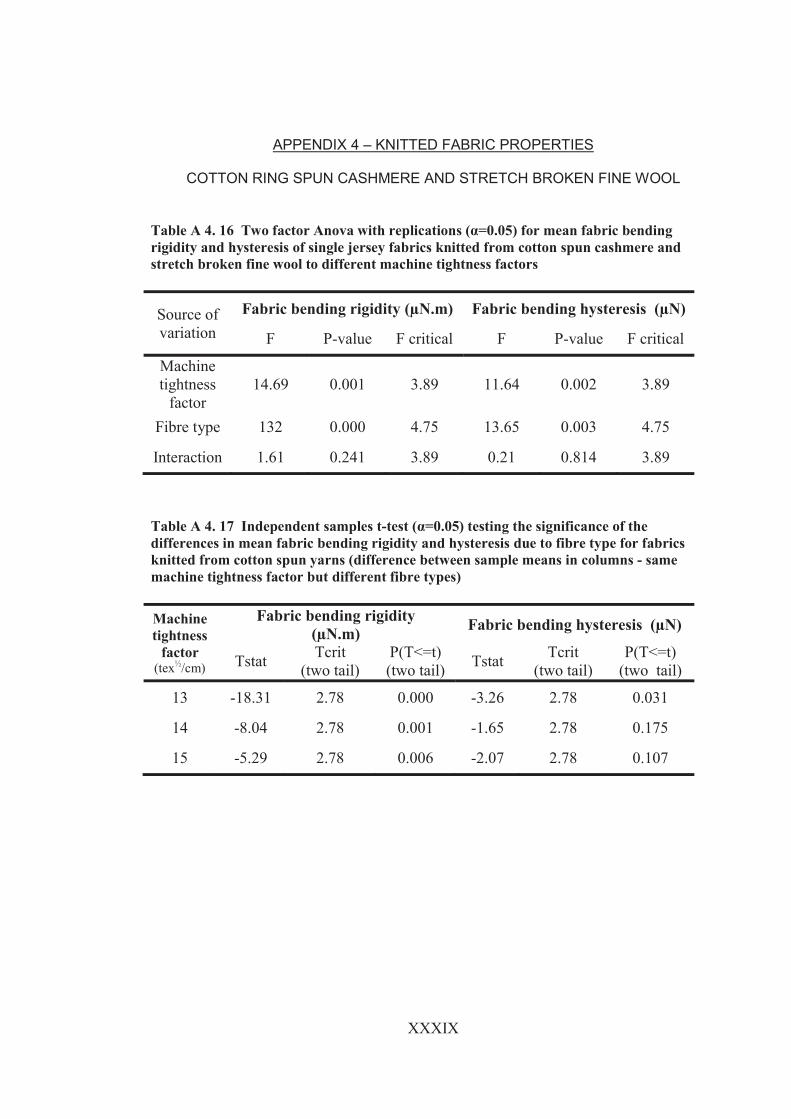
XXXIX
APPENDIX 4 – KNITTED FABRIC PROPERTIES
COTTON RING SPUN CASHMERE AND STRETCH BROKEN FINE WOOL
Table A 4. 16 Two factor Anova with replications (α=0.05) for mean fabric bending rigidity and hysteresis of single jersey fabrics knitted from cotton spun cashmere and stretch broken fine wool to different machine tightness factors
Source of variation
Fabric bending rigidity (μN.m) Fabric bending hysteresis (μN)
F P-value F critical F P-value F critical
Machine tightness
factor 14.69 0.001 3.89 11.64 0.002 3.89
Fibre type 132 0.000 4.75 13.65 0.003 4.75
Interaction 1.61 0.241 3.89 0.21 0.814 3.89
Table A 4. 17 Independent samples t-test (α=0.05) testing the significance of the differences in mean fabric bending rigidity and hysteresis due to fibre type for fabrics knitted from cotton spun yarns (difference between sample means in columns - same machine tightness factor but different fibre types) Machine tightness
factor (tex½/cm)
Fabric bending rigidity (μN.m) Fabric bending hysteresis (μN)
Tstat Tcrit (two tail)
P(T<=t) (two tail)
Tstat Tcrit (two tail)
P(T<=t) (two tail)
13 -18.31 2.78 0.000 -3.26 2.78 0.031
14 -8.04 2.78 0.001 -1.65 2.78 0.175
15 -5.29 2.78 0.006 -2.07 2.78 0.107

XL
APPENDIX 4 – KNITTED FABRIC PROPERTIES
COTTON RING SPUN CASHMERE AND STRETCH BROKEN FINE WOOL
Table A 4. 18 Tukey’s HSD (n=3, q(6,0.05)=4.34) for the significance of the differences in mean fabric bending rigidity and hysteresis due to knitting tightness for fabrics knitted from the cotton spun yarns (differences between sample means in rows - same fibre but different machine tightness factors)
Fibre type Tukey’s HSD for mean fabric bending rigidity
(μN.m)
Tukey’s HSD for mean bending hysteresis (μN)
Cashmere 0.74 265
Stretch broken wool 1.09 174
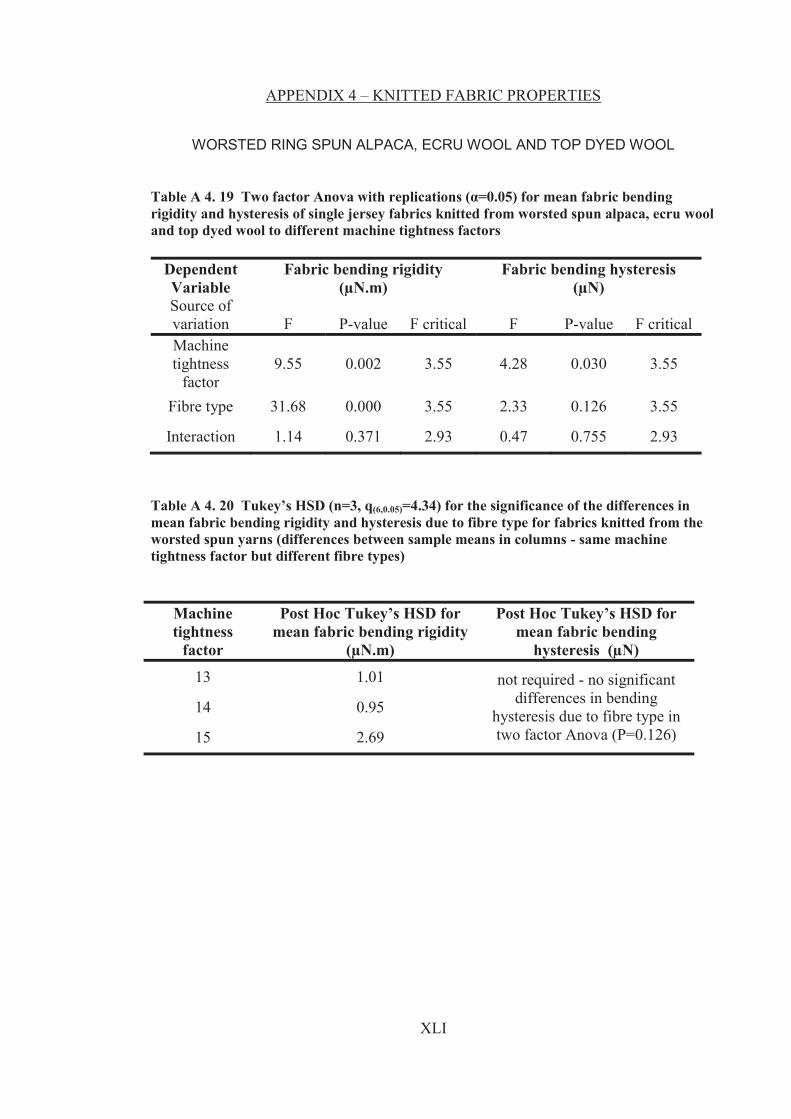
XLI
APPENDIX 4 – KNITTED FABRIC PROPERTIES
WORSTED RING SPUN ALPACA, ECRU WOOL AND TOP DYED WOOL
Table A 4. 19 Two factor Anova with replications (α=0.05) for mean fabric bending rigidity and hysteresis of single jersey fabrics knitted from worsted spun alpaca, ecru wool and top dyed wool to different machine tightness factors
Dependent Variable
Fabric bending rigidity (μN.m)
Fabric bending hysteresis (μN)
Source of variation F P-value F critical F P-value F critical Machine tightness
factor 9.55 0.002 3.55 4.28 0.030 3.55
Fibre type 31.68 0.000 3.55 2.33 0.126 3.55
Interaction 1.14 0.371 2.93 0.47 0.755 2.93
Table A 4. 20 Tukey’s HSD (n=3, q(6,0.05)=4.34) for the significance of the differences in mean fabric bending rigidity and hysteresis due to fibre type for fabrics knitted from the worsted spun yarns (differences between sample means in columns - same machine tightness factor but different fibre types)
Machine tightness
factor
Post Hoc Tukey’s HSD for mean fabric bending rigidity
(μN.m)
Post Hoc Tukey’s HSD for mean fabric bending
hysteresis (μN)
13 1.01 not required - no significant differences in bending
hysteresis due to fibre type in two factor Anova (P=0.126)
14 0.95
15 2.69

XLII
APPENDIX 4 – KNITTED FABRIC PROPERTIES
WORSTED RING SPUN ALPACA, ECRU WOOL AND TOP DYED WOOL
Table A 4. 21 Tukey’s HSD (n=3, q(6,0.05)=4.34) for the significance of the differences in mean fabric bending rigidity and hysteresis due to knitting tightness for fabrics knitted from the worsted spun yarns (differences between sample means in rows - same fibre but different machine tightness factors)
Fibre type Post Hoc Tukey’s HSD for
mean fabric bending rigidity (μN.m)
Post Hoc Tukey’s HSD for mean fabric bending
hysteresis (μN)
Alpaca 2.38 365
Ecru wool 1.08 211
Top dyed wool 1.50 150

XLIII
APPENDIX 4 – KNITTED FABRIC PROPERTIES
PHABROMETER FINGERPRINTS FOR SINGLE JEREY FABRICS
6.45
7.45
8.45
9.45
10.45
11.45
12.45
13.45
V1
V2
V3
V4
V5
V6
V7
V8
FA1.1-a FA1.1-bFA1.1-c FA1.1-dFA1.1-e FA1.1-fFA1.28-a FA1.28-bFA1.28-c FA1.28-dFA1.28-e FA1.28-fFA1.2-a FA1.2-bFA1.2-c FA1.2-dFA1.2-e FA1.2-fFB1.1-a FB1.1-bFB1.1-c FB1.1-dFB1.1-e FB1.1-fFB1.28-a FB1.28-bFB1.28-c FB1.28-dFB1.28-e FB1.28-fFB1.2-a FB1.2-bFB1.2-c FB1.2-dFB1.2-e FB1.2-fFC1.1.a FC1.1.bFC1.1.c FC1.1.dFC1.1.e FC1.1.fFC1.1-b FC1.1-CFC1.1-d FC1.1-eFC1.1-f FC1.2-aFC1.2-b FC1.2-cFC1.2-d FC1.2-eFC1.2-f FE1.1-aFE1.28-a FE1.28-bFE1.28-c FE1.28-dFE1.28-e FE1.28-fFE1.2-a FE1.2-bFE1.2-c FE1.2-dFE1.2-e FE1.2-fFEC1.1-a FEC1.1-bFEC1.1-c FEC1.1-dFEC1.1-e FEC1.1-fFEC1.28-a FEC1.28-bFEC1.28-c FEC1.28-dFEC1.28-e FEC1.28-fFEC1.2-a FEC1.2-bFEC1.2-c FEC1.2-dFEC1.2-e FEC1.2-f
Figure 4A- 1 Fingerprint diagrams for all cashmere, wool and alpaca single jersey fabrics
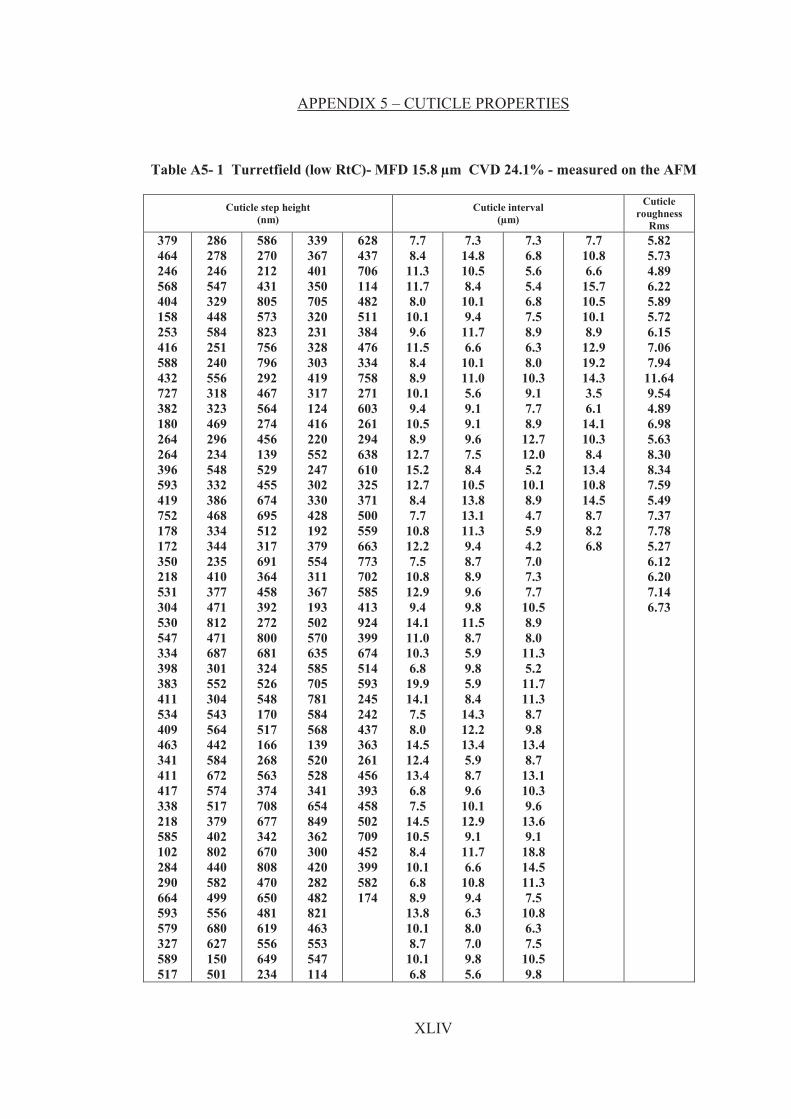
XLIV
APPENDIX 5 – CUTICLE PROPERTIES
Table A5- 1 Turretfield (low RtC)- MFD 15.8 μm CVD 24.1% - measured on the AFM
Cuticle step height (nm)
Cuticle interval (μm)
Cuticle roughness
Rms 379 464 246 568 404 158 253 416 588 432 727 382 180 264 264 396 593 419 752 178 172 350 218 531 304 530 547 334 398 383 411 534 409 463 341 411 417 338 218 585 102 284 290 664 593 579 327 589 517
286 278 246 547 329 448 584 251 240 556 318 323 469 296 234 548 332 386 468 334 344 235 410 377 471 812 471 687 301 552 304 543 564 442 584 672 574 517 379 402 802 440 582 499 556 680 627 150 501
586 270 212 431 805 573 823 756 796 292 467 564 274 456 139 529 455 674 695 512 317 691 364 458 392 272 800 681 324 526 548 170 517 166 268 563 374 708 677 342 670 808 470 650 481 619 556 649 234
339 367 401 350 705 320 231 328 303 419 317 124 416 220 552 247 302 330 428 192 379 554 311 367 193 502 570 635 585 705 781 584 568 139 520 528 341 654 849 362 300 420 282 482 821 463 553 547 114
628 437 706 114 482 511 384 476 334 758 271 603 261 294 638 610 325 371 500 559 663 773 702 585 413 924 399 674 514 593 245 242 437 363 261 456 393 458 502 709 452 399 582 174
7.7 8.4
11.3 11.7 8.0
10.1 9.6
11.5 8.4 8.9
10.1 9.4
10.5 8.9
12.7 15.2 12.7 8.4 7.7
10.8 12.2 7.5
10.8 12.9 9.4
14.1 11.0 10.3 6.8
19.9 14.1 7.5 8.0
14.5 12.4 13.4 6.8 7.5
14.5 10.5 8.4
10.1 6.8 8.9
13.8 10.1 8.7
10.1 6.8
7.3 14.8 10.5 8.4
10.1 9.4
11.7 6.6
10.1 11.0 5.6 9.1 9.1 9.6 7.5 8.4
10.5 13.8 13.1 11.3 9.4 8.7 8.9 9.6 9.8
11.5 8.7 5.9 9.8 5.9 8.4
14.3 12.2 13.4 5.9 8.7 9.6
10.1 12.9 9.1
11.7 6.6
10.8 9.4 6.3 8.0 7.0 9.8 5.6
7.3 6.8 5.6 5.4 6.8 7.5 8.9 6.3 8.0
10.3 9.1 7.7 8.9
12.7 12.0 5.2
10.1 8.9 4.7 5.9 4.2 7.0 7.3 7.7
10.5 8.9 8.0
11.3 5.2
11.7 11.3 8.7 9.8
13.4 8.7
13.1 10.3 9.6
13.6 9.1
18.8 14.5 11.3 7.5
10.8 6.3 7.5
10.5 9.8
7.7 10.8 6.6
15.7 10.5 10.1 8.9
12.9 19.2 14.3 3.5 6.1
14.1 10.3 8.4
13.4 10.8 14.5 8.7 8.2 6.8
5.82 5.73 4.89 6.22 5.89 5.72 6.15 7.06 7.94
11.64 9.54 4.89 6.98 5.63 8.30 8.34 7.59 5.49 7.37 7.78 5.27 6.12 6.20 7.14 6.73

XLV
APPENDIX 5 – CUTICLE PROPERTIES
Table A5- 2 Turretfield (high RtC)- MFD 15.8 μm CVD 29.8% - measured on the AFM
Cuticle step height (nm)
Cuticle interval (μm)
Cuticle roughness
Rms 279 242 501 407 683 545 576 365 706 299 421 376 557 539 214 316 610 474 322 581 602 532 263 437 571 451 425 417 311 632 306 648 611 568 411 609 743 986 778 891 727 751 955 419 574 898 980 774 687
952 493 607 763 526 619 513 473 726 704 661 984 469
1411 484 759 470 737 652 545 789 490 616 688 419 751 529 623 481 438 567 672 508 716 626 498 372 829 656 510 556 430 528 310 264 823 523 547 557
648 645 464 667 572 431 805 664 690 478 520
1020 263 214 155 102 193 80
580 278 576 359 361 284 656 613 493 623 517 341 730 618 549
1190 675 564 896 659 812 756 575 549 758 390 886 280 678 657 744
615 568 417 469 670 619 748 601
1097 881 705 398 992 388 437 461 480
1018 363 378 530 448 485 557 760 677 637 808 592 913 376 736 442 657 823 390 675 334 876 630
1083 533 967 615 678 695 429
1152 650
853 659 558 236 421 511 421 890 791 818 537 743
1022 1116 244 710 741 809 779 471 823 424 829 386 882 497 667
8.0 7.5
10.1 10.8 8.7
10.5 8.0 7.5
10.1 10.8 8.7
10.5 6.6 5.4 5.4 5.9 6.6 5.9 4.7 4.0 5.9 8.4 7.0 3.8 6.6 9.8
10.8 9.4
11.3 8.4
11.7 11.0 9.1
11.3 12.7 10.8 12.7 9.1 8.7
10.3 13.4 9.4
10.3 9.6 9.8 8.9
13.6 6.8
12.9
10.3 9.8
11.0 9.8
13.6 8.4
11.3 7.3 5.4 8.9 5.2 9.8 7.3 8.2 9.8 4.9
11.0 9.1
11.5 5.3 8.7 7.3 8.4 8.4
11.0 8.7 5.9
12.0 8.4
10.1 9.6
10.1 6.6
10.1 7.5 9.8 5.6
10.3 4.7 9.1 4.9 8.0 9.1 7.0
14.1 6.1
10.5 8.0
10.1
6.3 11.7 6.3
12.2 8.9 5.9 9.8 7.3 6.1 9.6
10.8 10.3 7.7 8.9
11.3 9.4
13.8 7.7
18.8 6.8 6.8
12.4 8.9
10.8 5.4 7.3
10.1 8.2 4.2
11.7 9.1 4.7
15.9 8.0
12.4 12.4 14.1 12.2 12.4 12.2 14.5 12.2 12.2 10.1 12.2 8.2
11.0 13.4 10.3
12.4 10.8 7.5 6.6
12.9 8.4 7.7 8.4 5.2 8.7 8.7 8.7
11.3 13.4 9.4 9.4
11.5 6.8 9.6 9.1
11.7 8.0 7.7 9.6
10.8 7.0 5.6 8.9
10.1 12.2 10.5 9.1
12.0 6.6 8.4 6.6 7.3
14.3 7.7 8.9
7.47 5.87 7.92
13.35 13.41 7.73 8.69
11.52 7.75
11.86 13.00 7.20 4.46 5.38 5.35 7.71 7.48 4.66 9.18 7.72 8.00 7.91 4.87 7.00 4.60 4.20
10.18 5.60 5.16
10.34 7.89
15.69 5.38 8.73 7.76
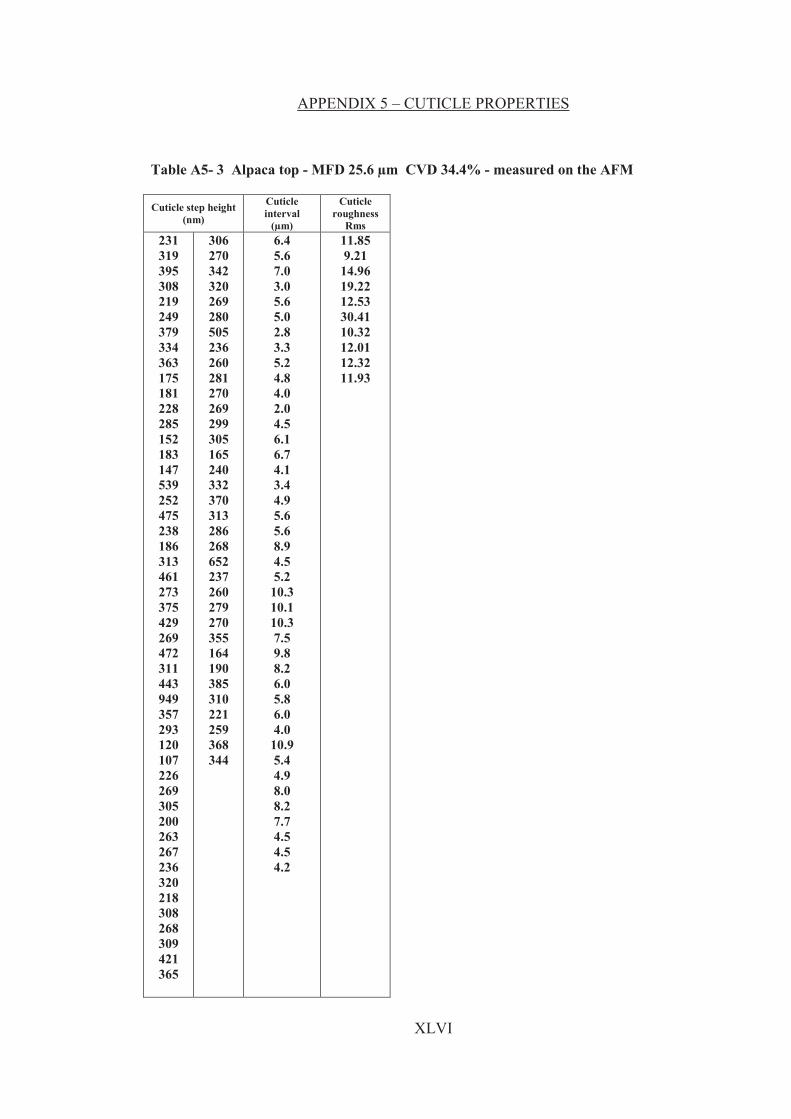
XLVI
APPENDIX 5 – CUTICLE PROPERTIES
Table A5- 3 Alpaca top - MFD 25.6 μm CVD 34.4% - measured on the AFM Cuticle step height
(nm)
Cuticle interval
(μm)
Cuticle roughness
Rms 231 319 395 308 219 249 379 334 363 175 181 228 285 152 183 147 539 252 475 238 186 313 461 273 375 429 269 472 311 443 949 357 293 120 107 226 269 305 200 263 267 236 320 218 308 268 309 421 365
306 270 342 320 269 280 505 236 260 281 270 269 299 305 165 240 332 370 313 286 268 652 237 260 279 270 355 164 190 385 310 221 259 368 344
6.4 5.6 7.0 3.0 5.6 5.0 2.8 3.3 5.2 4.8 4.0 2.0 4.5 6.1 6.7 4.1 3.4 4.9 5.6 5.6 8.9 4.5 5.2
10.3 10.1 10.3 7.5 9.8 8.2 6.0 5.8 6.0 4.0
10.9 5.4 4.9 8.0 8.2 7.7 4.5 4.5 4.2
11.85 9.21
14.96 19.22 12.53 30.41 10.32 12.01 12.32 11.93
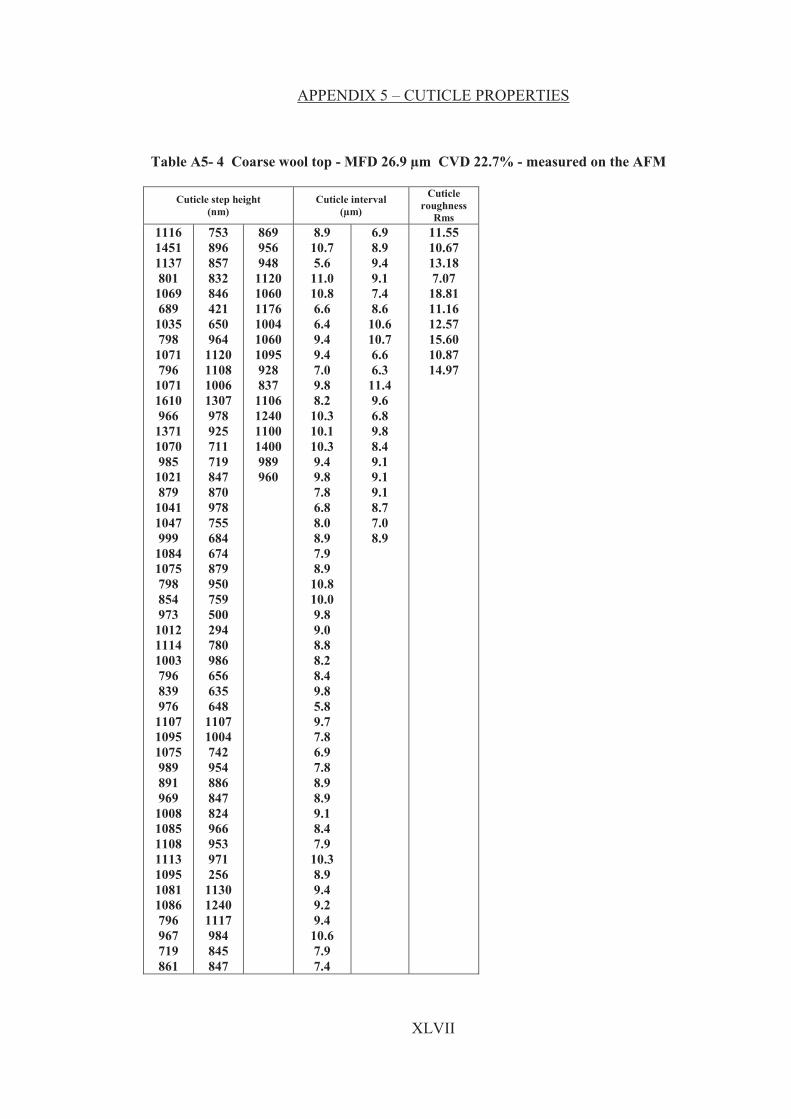
XLVII
APPENDIX 5 – CUTICLE PROPERTIES
Table A5- 4 Coarse wool top - MFD 26.9 μm CVD 22.7% - measured on the AFM
Cuticle step height (nm)
Cuticle interval (μm)
Cuticle roughness
Rms 1116 1451 1137 801
1069 689
1035 798
1071 796
1071 1610 966
1371 1070 985
1021 879
1041 1047 999
1084 1075 798 854 973
1012 1114 1003 796 839 976
1107 1095 1075 989 891 969
1008 1085 1108 1113 1095 1081 1086 796 967 719 861
753 896 857 832 846 421 650 964
1120 1108 1006 1307 978 925 711 719 847 870 978 755 684 674 879 950 759 500 294 780 986 656 635 648
1107 1004 742 954 886 847 824 966 953 971 256
1130 1240 1117 984 845 847
869 956 948
1120 1060 1176 1004 1060 1095 928 837
1106 1240 1100 1400 989 960
8.9 10.7 5.6
11.0 10.8 6.6 6.4 9.4 9.4 7.0 9.8 8.2
10.3 10.1 10.3 9.4 9.8 7.8 6.8 8.0 8.9 7.9 8.9
10.8 10.0 9.8 9.0 8.8 8.2 8.4 9.8 5.8 9.7 7.8 6.9 7.8 8.9 8.9 9.1 8.4 7.9
10.3 8.9 9.4 9.2 9.4
10.6 7.9 7.4
6.9 8.9 9.4 9.1 7.4 8.6
10.6 10.7 6.6 6.3
11.4 9.6 6.8 9.8 8.4 9.1 9.1 9.1 8.7 7.0 8.9
11.55 10.67 13.18 7.07
18.81 11.16 12.57 15.60 10.87 14.97

XLVIII
APPENDIX 5 – CUTICLE PROPERTIES
Table A5- 5 Cashmere top - MFD 17.0 μm CVD 24.5% - measured on the AFM Cuticle step height
(nm)
Cuticle interval
(μm)
Cuticle roughness
Rms 656 880 848 774 534 620 811 515 414 379 406 360 416 565 595 687 707 991 518 308 236 260 759 471 344 686 515 469 415 421 453 378 656 457 533 520 613 489 550 590 578 600 645 542 536 569 298 328 619
844 645 520 407 480 486 515 512 531 620 266 414 513 400 412
14.1 13.8 16.4 13.4 20.2 13.1 22.3 23.2 12.2 12.9 16.4 15.0 5.6
15.9 13.4 20.2 15.2 15.0 11.0 17.6 13.4 14.5 11.3 9.4
17.6 10.3 14.1 16.0 14.5 22.3 14.8 16.9 16.4 12.6 14.2 12.6 13.5 13.7 14.7 16.3 20.4 16.2 17.4 15.3 14.2 17.0
4.23 8.70 6.18
10.00 4.87
11.13 4.31 4.43 4.51 4.25 3.82 3.37 8.22

XLIX
APPENDIX 5 – CUTICLE PROPERTIES
Table A5- 6 Fine wool top - MFD 17.0 μm CVD 18.9% - measured on the AFM
Cuticle step height (nm)
Cuticle interval (μm)
Cuticle roughness
Rms 739
1213 1240 946 630 961 712
1168 583 692 992 687 398 931
1299 611 749 521
1033 1157 921
1051 886
1100 760
1247 966
1256 1041 723
1130 491
1091 591
1304 1096 989 621 644 696 478 738 376 804 853 859 551
1002 798
640 854 632 945 520 689 539
1002 1024 847 617 568 599 852 782 999 854 634 644 760 821
1024 1021 839 731 630 620 626 634 720 634 559 640 620 549 630 884 746 630 640 630 690 550 800 780 730 560 650 700
659 759 589 640 630 650 720 732 654 596 560 630
8.9 6.7 8.9 9.1 8.9 9.3
11.6 4.0 6.6
11.7 8.4
10.7 9.6
10.7 7.4 7.9 8.0 8.0 9.8 8.4
11.8 7.5 9.1 7.5 8.7 9.6 8.9
11.0 10.3 7.9 8.2 9.1 8.9 6.1 7.3 9.1 7.7 9.1 8.2
18.0 5.9
11.8 7.7 7.7 9.8 8.7 9.8 6.1 9.8
9.0 8.2 9.1
16.0 11.5 8.4
11.0 9.1
11.3 11.8 9.1
11.5 10.3 11.0 4.5
10.3 9.6 9.8 7.7 7.9 9.3
11.49 11.50 10.46 9.48
12.59 8.69 7.19
10.36 14.29 8.42

L
APPENDIX 5 – CUTICLE PROPERTIES
Table A5- 7 Penetration of a silicon Pointprobe into the cuticle in air under ambient conditions of approximately 20 °C and 55% RH. (Trigger 100nm, cantilever stiffness, k ~42 N/m) - measured on the AFM
Penetration of silicon probe into cuticle (nm) Fine wool
top MFD 17.0 μm CVD 18.9%
Cashmere top
MFD 17.0 μm CVD 24.5%
Coarse wool top
MFD 26.9 μm CVD 22.7%
Alpaca top
MFD 25.6 μm CVD 34.4%
Turretfield wool (low RtC)
MFD 15.8 μm CVD 24.1%
Turretfield wool (high RtC)
MFD 15.8 μm CVD 29.8%
40 40 49 50 58 50 42 33 24 26 46 36 32
34 19 26 32 33 37 30 34 30 34 32 38 47 51
27 28 23 44 25 35 28 31 34 26 27 22 31 25
31 28 30 28 28 29 29 29 32 22 22 17 18 30 34 24
51 44 44 63 46 41 39 69 53 55 62 52 40
100 46 43 45 41
62 49 62 73
108 52 51 69 54 57 44 41 46 50

LI
APPENDIX 5 – CUTICLE PROPERTIES
Table A5- 8 Nanoscale coefficient of friction of the cuticle surface between the scale edges in air under ambient conditions of approximately 20 °C and 55% RH (measured on the AFM).
Coefficient of friction Fine wool
top MFD 17.0 μm CVD 18.9%
Cashmere top
MFD 17.0 μm CVD 24.5%
Coarse wool top
MFD 26.9 μm CVD 22.7%
Alpaca top
MFD 25.6 μm CVD 34.4%
0.0137 0.0179 0.0207 0.0100 0.0063 0.0065 0.0244 0.0179 0.0143 0.0159 0.0108 0.0137 0.0131 0.0121 0.0189
0.0074 0.0050 0.0048 0.0060 0.0091 0.0110 0.0182 0.0138 0.0182 0.0216 0.0225 0.0214 0.0154 0.0154 0.0134
0.0094 0.0096 0.0091 0.0184 0.0230 0.0280 0.0259 0.0195 0.0230 0.0101 0.0062 0.0039 0.0065 0.0195 0.0054
0.0087 0.0189 0.0216 0.0171 0.0147 0.0114 0.0190 0.0085 0.0117 0.0048 0.0133 0.0050 0.0100 0.0089 0.0104
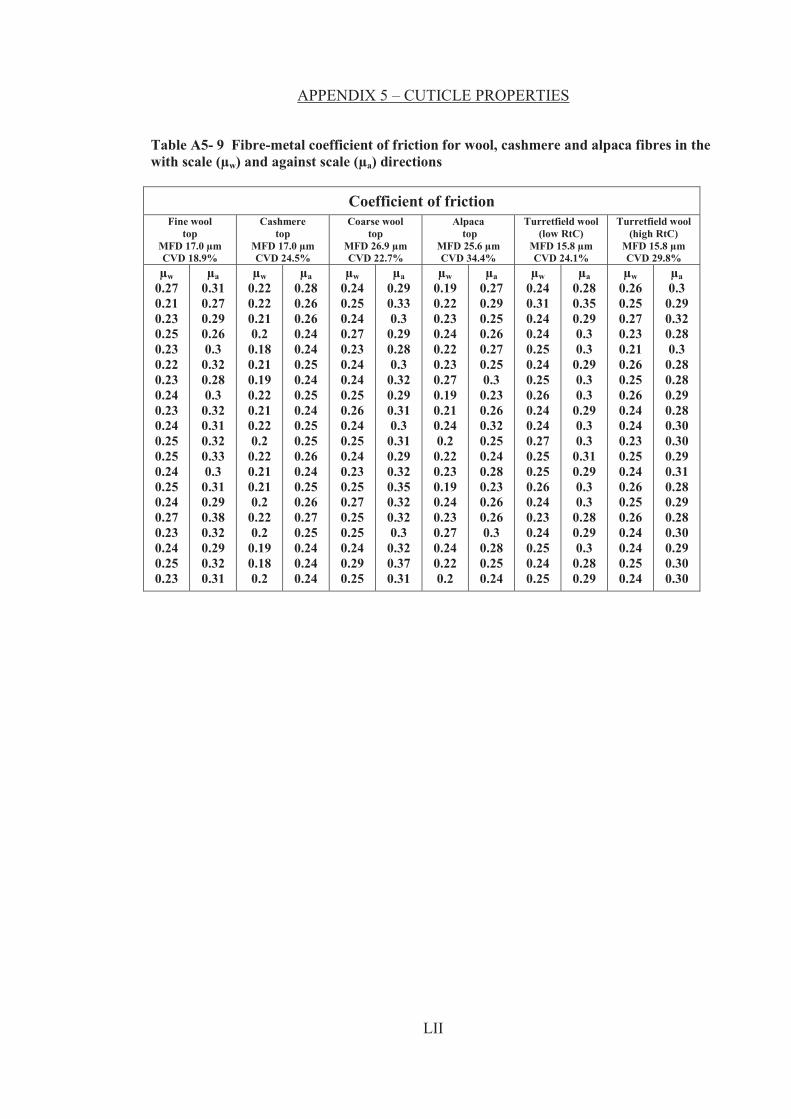
LII
APPENDIX 5 – CUTICLE PROPERTIES
Table A5- 9 Fibre-metal coefficient of friction for wool, cashmere and alpaca fibres in the with scale (μw) and against scale (μa) directions
Coefficient of friction Fine wool
top MFD 17.0 μm CVD 18.9%
Cashmere top
MFD 17.0 μm CVD 24.5%
Coarse wool top
MFD 26.9 μm CVD 22.7%
Alpaca top
MFD 25.6 μm CVD 34.4%
Turretfield wool (low RtC)
MFD 15.8 μm CVD 24.1%
Turretfield wool (high RtC)
MFD 15.8 μm CVD 29.8%
μw 0.27 0.21 0.23 0.25 0.23 0.22 0.23 0.24 0.23 0.24 0.25 0.25 0.24 0.25 0.24 0.27 0.23 0.24 0.25 0.23
μa 0.31 0.27 0.29 0.26 0.3
0.32 0.28 0.3
0.32 0.31 0.32 0.33 0.3
0.31 0.29 0.38 0.32 0.29 0.32 0.31
μw 0.22 0.22 0.21 0.2
0.18 0.21 0.19 0.22 0.21 0.22 0.2
0.22 0.21 0.21 0.2
0.22 0.2
0.19 0.18 0.2
μa 0.28 0.26 0.26 0.24 0.24 0.25 0.24 0.25 0.24 0.25 0.25 0.26 0.24 0.25 0.26 0.27 0.25 0.24 0.24 0.24
μw 0.24 0.25 0.24 0.27 0.23 0.24 0.24 0.25 0.26 0.24 0.25 0.24 0.23 0.25 0.27 0.25 0.25 0.24 0.29 0.25
μa 0.29 0.33 0.3
0.29 0.28 0.3
0.32 0.29 0.31 0.3
0.31 0.29 0.32 0.35 0.32 0.32 0.3
0.32 0.37 0.31
μw 0.19 0.22 0.23 0.24 0.22 0.23 0.27 0.19 0.21 0.24 0.2
0.22 0.23 0.19 0.24 0.23 0.27 0.24 0.22 0.2
μa 0.27 0.29 0.25 0.26 0.27 0.25 0.3
0.23 0.26 0.32 0.25 0.24 0.28 0.23 0.26 0.26 0.3
0.28 0.25 0.24
μw 0.24 0.31 0.24 0.24 0.25 0.24 0.25 0.26 0.24 0.24 0.27 0.25 0.25 0.26 0.24 0.23 0.24 0.25 0.24 0.25
μa 0.28 0.35 0.29 0.3 0.3
0.29 0.3 0.3
0.29 0.3 0.3
0.31 0.29 0.3 0.3
0.28 0.29 0.3
0.28 0.29
μw 0.26 0.25 0.27 0.23 0.21 0.26 0.25 0.26 0.24 0.24 0.23 0.25 0.24 0.26 0.25 0.26 0.24 0.24 0.25 0.24
μa 0.3
0.29 0.32 0.28 0.3
0.28 0.28 0.29 0.28 0.30 0.30 0.29 0.31 0.28 0.29 0.28 0.30 0.29 0.30 0.30
LIII
REFERENCES
ACWEP (2009). SUBMISSION FROM AUSTRALIAN COUNCIL OF WOOL EXPORTERS & PROCESSORS TO INQUIRY INTO MANUFACTURING IN VICTORIA.
ALI, M. A., K. J. WHITELEY AND M. A. CHAUDRI (1971). "INFLUENCE OF FIBRE CHARACTERISTICS ON TACTILE APPRAISAL OF LOOSE WOOL PART 2." JOURNAL OF THE TEXTILE INSTITUTE 62(7): 375-381.
ALIMAA, D., T. MATSUO, M. NAKAJIMA AND M. TAKAHASHI (2000). THE MAIN MECHANICAL PROPERTIES OF CASHMERE KNITTED FABRICS IN TERMS OF FABRIC STRUCTURE AND YARN PROPERTY. 10TH INTERNATIONAL WOOL TEXTILE RESEARCH CONFERENCE AACHEN, GERMANY.
ALIOUCHE, D. AND P. VIALLTER (2000). "MECHANICAL AND TACTILE COMPRESSION OF FABRICS: INFLUENCE ON HANDLE." TEXTILE RESEARCH JOURNAL 70(11): 939-944.
ALLAIN, D. AND C. RENIERI (2010). "GENETICS OF FIBRE PRODUCTION AND FLEECE CHARACTERISTICS IN SMALL RUMINANTS, ANGORA RABBIT AND SOUTH AMERICAN CAMELIDS." ANIMAL 4(9): 1472-1481.
ALLEY, V. L. AND A. D. MCHATTON (1978). NOZZLE EXTRACTION PROCESS AND HANDLEMETER FOR MEASURING HANDLE UNITED STATES PATENT US. 4,103,550.
ALSTON, P. V., S. M. HANSEN AND P. J. DUNCAN (2002). "EFFECT OF FIBER CROSS SECTION ON ROTOR SPINNING OF POLYESTER." TEXTILE RESEARCH JOURNAL 72(4): 352-356.
ANDERSON, S. L. AND F. BENSON (1953). "FIBRE ELLIPTICITY AND ITS EFFECT ON DIAMETER MEASUREMENT." JOURNAL OF THE TEXTILE INSTITUTE 44: 98-104.
ANON (2012) "THE FUTURE OF FABRIC QUALITY EVALUATION: HTTP://PHABROMETER.COM/CASESTUDIES/KNITWOOL.ASPX."
ARAI, K., T. HIRATA, S. NISHIMURA, M. HIRANO AND S. NAITO (1993). "CROSS-LINKING STRUCTURE OF KERATIN. IV. THE NUMBER OF CROSS-LINKAGES IN LOW-SULFUR COMPONENTS AND THE VOLUME FRACTION OF HIGH-SULFUR DOMAINS IN VARIOUS Α-KERATIN FIBERS." JOURNAL OF APPLIED POLYMER SCIENCE 47(11): 1973-1981.
ASTM D 1425-09 TEST METHOD. (2009). STANDARD TEST METHOD FOR UNEVENNESS OF TEXTILE STRANDS USING CAPACITANCE TESTING EQUIPMENT AMERICAN SOCIETY FOR TESTING AND MATERIALS
ASTM D 3822-07 TEST METHOD. (2007). TEST METHOD FOR TENSILE PROPERTIES OF SINGLE TEXTILE FIBRES. AMERICAN SOCIETY FOR TESTING AND MATERIALS
AUSTRALIAN STANDARD AS-2001.2.14. (1987). "DETERMINATION OF TWIST IN YARNS."
AUSTRALIAN STANDARD AS-2001.2.23. (1990). "DETERMINATION OF LINEAR DENSITY OF TEXTILE YARN FROM PACKAGES."
AUSTRALIAN STANDARD AS-3535. (2004). " WOOL – METHOD FOR THE MEASUREMENT OF RESISTANCE TO COMPRESSION."
AWI (2006). WOOL/COTTON TECHNICAL MANUAL.
BAHI, A., J. T. JONES, C. M. CARR, R. V. ULIJN AND J. SHAO (2007). "SURFACE CHARACTERIZATION OF CHEMICALLY MODIFIED WOOL." TEXTILE RESEARCH JOURNAL 77(12): 937-945.

LIV
BAIRD, K. (1963). "CHANGES OF CURVATURE WITH REGAIN OF SET WOOL AND HAIR FIBRES." TEXTILE RESEARCH JOURNAL 33(10): 866-868.
BANKY, E. C. AND S. B. SLEN (1955). "NOTE ON THE EFFECT OF NONUNIFORMITY OF THE CROSS-SECTIONAL AREA UPON THE TENSILE BEHAVIOR OF WOOL FIBERS." TEXTILE RESEARCH JOURNAL 25(4): 358-361.
BARACH, J. L. AND L. W. RAINARD (1950). "EFFECT OF CRIMP ON FIBER BEHAVIOR: PART II: ADDITION OF CRIMP TO WOOL FIBERS AND ITS EFFECT ON FIBER PROPERTIES." TEXTILE RESEARCH JOURNAL 20(5): 308-316.
BARELLA, A. (1983). "YARN HAIRINESS." TEXTILE PROGRESS 13(1): 1-61.
BATEUP, B. O. (1986). OPTIMISATION OF THE AQUEOUS SCOURING PROCESS. SYMPOSIUM OF WOOL SCOURING AND WORSTED CARDING: NEW APPROACHES, CSIRO DIVISION OF TEXTILE INDUSTRY.
BEHERA, B. K. AND D. B. SHAKYAWAR (2000). "STRUCTURE-PROPERTY RELATIONSHIP OF FIBRE, YARN AND FABRIC WITH SPECIAL REFERENCE TO LOW-STRESS MECHANICAL PROPERTIES AND HAND VALUE OF FABRIC." INDIAN JOURNAL OF FIBRE & TEXTILE RESEARCH 25(3): 232-237.
BEHERA, B. K. AND D. B. SHAKYAWAR (2003). "THE HAND OF WOVEN FABRICS FROM INDIAN WOOL AND BLENDS." TEXTILE ASIA DECEMBER: 40-48.
BEHERY, H. M. (1986). "COMPARISON OF FABRIC HAND ASSESSMENT IN THE UNITED-STATES AND JAPAN." TEXTILE RESEARCH JOURNAL 56(4): 227-240.
BEHERY, H. M. (2005). "EFFECT OF MECHANICAL AND PHYSICAL PROPERTIES ON FABRIC HAND - INTRODUCTION." EFFECT OF MECHANICAL AND PHYSICAL PROPERTIES ON FABRIC HAND: 1-7.
BEHRENDT, R., P. R. LAMB, K. L. BUTLER, G. A. ROBINSON AND M. DOLLING (1996). THE PROCESSING PERFORMANCE OF SOFT HANDLING, HIGH CRIMP DEFINITION, LOW CRIMP FREQUENCY 21 MICRON WOOL. TOP-TECH '96 PAPERS PRESENTED AT GEELONG AUSTRALIA 11-14 NOVEMBER, 1996: 350-355.
BEIL, N. B. AND W. W. J. R. ROBERTS (2002A). "MODELING AND COMPUTER SIMULATION OF THE COMPRESSIONAL BEHAVIOR OF FIBER ASSEMBLIES: PART I: COMPARISON TO VAN WYK'S THEORY." TEXTILE RESEARCH JOURNAL 72(4): 341-351.
BEIL, N. B. AND W. W. J. R. ROBERTS (2002B). "MODELING AND COMPUTER SIMULATION OF THE COMPRESSIONAL BEHAVIOR OF FIBER ASSEMBLIES: PART II: HYSTERESIS, CRIMP, AND ORIENTATION EFFECTS." TEXTILE RESEARCH JOURNAL 72(5): 375-382.
BENDIT, E. G. (1980). "THERE IS NO HOOKEAN REGION IN THE STRESS-STRAIN CURVE OF KERATIN (OR OTHER VISCOELASTIC POLYMERS)." JOURNAL OF MACROMOLECULAR SCIENCE-PHYSICS B17(1): 129-140.
BHUSHAN, B. (2008A). INTRODUCTION - MEASUREMENT TECHNIQUES AND APPLICATIONS. NANOTRIBOLOGY AND NANOMECHANICS. AN INTRODUCTION. B. BHUSHAN. BERLIN, SPRINGER-VERLAG: 1-34.
BHUSHAN, B. (2008B). "NANOSCALE CHARACTERIZATION OF HUMAN HAIR AND HAIR CONDITIONERS." PROGRESS IN MATERIALS SCIENCE 53(4): 585-710.
BHUSHAN, B. (2008C). NANOTRIBOLOGY, NANOMECHANICS AND MATERIALS CHARACTERIZATION. NANOTRIBOLOGY AND NANOMECHANICS. AN INTRODUCTION. B. BHUSHAN. BERLIN, SPRINGER-VERLAG: 311-416.

LV
BHUSHAN, B. AND O. MARTI (2008). SCANNING PROBE MICROSCOPY - PRINCIPLE OF OPERATION, INSTRUMENTATION AND PROBES. NANOTRIBOLOGY AND NANOMECHANICS. AN INTRODUCTION. B. BHUSHAN. BERLIN, SPRINGER-VERLAG: 37-110.
BHUSHAN, B., G. H. WEI AND P. HADDAD (2005). "FRICTION AND WEAR STUDIES OF HUMAN HAIR AND SKIN." WEAR 259: 1012-1021.
BINNIG, G., H. ROHRER, C. GERBER AND E. WEIBUL (1982). "SURFACE STUDIES BY SCANNING TUNNELING MICROSCOPY." PHYSICAL REVIEW LETTERS 49: 57-61.
BINNS, H. (1926). "THE DISCRIMINATION OF WOOL FABRICS BY THE SENSE OF TOUCH." BRITISH JOURNAL OF PSYCHIATRY 16: 237-247.
BINNS, H. (1934). "A TACTILE COMPARISON OF THE CLOTH QUALITIES OF CONTINENTAL AND NOBLE COMBED MATERIALS." JOURNAL OF THE TEXTILE INSTITUTE 25: T157-T173.
BISHOP, D. P. (1996). "FABRICS: SENSORY AND MECHANICAL PROPERTIES." TEXTILE PROGRESS 26(3): 1-64.
BLACH, J., W. LOUGHLIN, G. WATSON AND S. MYHRA (2001). "SURFACE CHARACTERIZATION OF HUMAN HAIR BY ATOMIC FORCE MICROSCOPY IN THE IMAGING AND F-D MODES." INTERNATIONAL JOURNAL OF COSMETIC SCIENCE 23(3): 165-174.
BLANKENBURG, G. (1969). "THE INDUSTRIAL APPLICATION OF FELTING AND MILLING TESTS FOR LOOSE WOOL." WOOL SCIENCE REVIEW 35: 24-34.
BLANKENBURG, G., H. PHILLIPERN, P. SPIELGELMACHER AND J. HAHNEN (1992). "CORRELATION OF THE FIBRE ELLIPTICITY, SNIPPET LENGTH AND EMBEDDING MEDIUM WITH THE MEAN DIAMETER OF MOHAIR AND WOOL." REPORT NO. 3, INTERNATIONAL WOOL TEXTILE ORGANISATION TECHNICAL COMMITTEE (NICE).
BRADBURY, J. H. (1973). "THE STRUCTURE AND CHEMISTRY OF KERATIN FIBERS." ADVANCES IN PROTEIN CHEMISTRY 27: 111-121.
BRADBURY, J. H. AND J. D. LEEDER (1970). "KERATIN FIBRES: PART IV- STRUCTURE OF CUTICLE." AUSTRALIAN JOURNAL OF BIOLOGICAL SCIENCES 23: 843-854.
BRADBURY, J. H. AND K. F. LEY (1972). "THE CHEMICAL COMPOSTION OF WOOL. XI: SEPARATION AND ANALYSIS OF EXOCUTICLE AND ENDOCUTICLE." AUSTRALIAN JOURNAL OF BIOLOGICAL SCIENCE 25: 1235-1247.
BRADY, P. R. AND X. WANG (2005). CASHMERE AND WOOL CORTICAL CELLS. PROCEEDINGS OF THE 3RD INTERNATIONAL CASHMERE DETERMINATION TECHNIQUE SEMINAR. ERDOS, INNER MONGOLIA.
BRAND, R. H. (1964). "MEASUREMENT OF FABRIC AESTHETICS: ANALYSIS OF AESTHETIC COMPONENTS." TEXTILE RESEARCH JOURNAL 34(9): 791-804.
BRAND, R. H. AND S. BACKER (1962). "MECHANICAL PRINCIPLES OF NATURAL CRIMP OF FIBER." TEXTILE RESEARCH JOURNAL 32(1): 39-49.
BREAKSPEAR, S. AND J. R. SMITH (2004). "RETURNING TO THE SAME AREA OF HAIR SURFACES BEFORE AND AFTER TREATMENT: A LONGITUDINAL AFM TECHNIQUE." JOURNAL OF MICROSCOPY 215(1): 34-39.
LVI
BREAKSPEAR, S., J. R. SMITH AND G. LUENGO (2005). "EFFECT OF THE COVALENTLY LINKED FATTY ACID 18-MEA ON THE NANOTRIBOLOGY OF HAIR'S OUTERMOST SURFACE." JOURNAL OF STRUCTURAL BIOLOGY 149(3): 235-242.
BREWER, N. J., B. D. BEAKE AND G. J. LEGGETT (2001). "FRICTION FORCE MICROSCOPY OF SELF-ASSEMBLED MONOLAYERS: INFLUENCE OF ADSORBATE ALKYL CHAIN LENGTH, TERMINAL GROUP CHEMISTRY, AND SCAN VELOCITY." LANGMUIR 17(6): 1970-1974.
BRINGANS, S. D., J. E. PLOWMAN, J. M. DYER, S. CLERENS, J. A. VERNON AND W. G. BRYSON (2007). "CHARACTERIZATION OF THE EXOCUTICLE A-LAYER PROTEINS OF WOOL." EXPERIMENTAL DERMATOLOGY 16(11): 951-960.
BROWN, D. (2005). NOVEL MERINO WOOL QUALITY TRAITS AWI PROJECT EC814, ANIMAL GENETICS AND BREEDING UNIT, UNIVERSITY OF NEW ENGLAND/NSW DEPARTMENT OF PRIMARY INDUSTRY.
BROWN, D. J., B. J. CROOK AND I. W. PURVIS (2000). "THE ESTIMATION OF FIBRE DIAMETER PROFILE CHARACTERISTICS USING REDUCED PROFILING TECHNIQUES." WOOL TECHNOLOGY AND SHEEP BREEDING 48(1): 1-14.
BROWN, T. D. AND W. J. ONIONS (1961). "THEORY FOR THE DEVELOPMENT OF WOOL FIBRE CRIMP ON DRYING." JOURNAL OF THE TEXTILE INSTITUTE 52: T101-108.
BUENO, M. A., A. P. ANEJA AND M. RENNER (2004). "INFLUENCE OF THE SHAPE OF FIBER CROSS SECTION ON FABRIC SURFACE CHARACTERISTICS." JOURNAL OF MATERIALS SCIENCE 39(2): 557-564.
BURNHAM, N. A. AND R. J. COLTON (1989). "MEASURING THE NANOMECHANICAL PROPERTIES AND SURFACE FORCES OF MATERIALS USING AN ATOMIC FORCE MICROSCOPE." JOURNAL OF VACUUM SCIENCE & TECHNOLOGY. A, VACUUM, SURFACES, AND FILMS 7(4): 2906-2913.
BUTT, H. J., B. CAPPELLA AND M. KAPPL (2005). "FORCE MEASUREMENTS WITH THE ATOMIC FORCE MICROSCOPE: TECHNIQUE, INTERPRETATION AND APPLICATIONS." SURFACE SCIENCE REPORTS 59(1-6): 1-152.
CALDWELL, J. P., D. N. MASTRONARDE, J. L. WOODS AND W. G. BRYSON (2005). "THE THREE-DIMENSIONAL ARRANGEMENT OF INTERMEDIATE FILAMENTS IN ROMNEY WOOL CORTICAL CELLS." JOURNAL OF STRUCTURAL BIOLOGY 151(3): 298-305.
CAMPBELL, M. E., K. J. WHITELEY AND GILLESPI.JM (1972). "COMPOSITIONAL STUDIES OF HIGH-CRIMP AND LOW-CRIMP WOOLS." AUSTRALIAN JOURNAL OF BIOLOGICAL SCIENCES 25(5): 977-987.
CAMPBELL, W. K. AND W. R. LANG (1965). "AN ASPECT OF THE HAND OF GEELONG LAMBS' WOOL." TEXTILE RESEARCH JOURNAL 35(3): 284-285.
CARNABY, G. A. AND N. PAN (1989). "THEORY OF THE COMPRESSION HYSTERESIS OF FIBROUS ASSEMBLIES." TEXTILE RESEARCH JOURNAL 59(5): 275-284.
CARTER, H. B., W. J. ONIONS AND J. M. D. PITTS (1969). "INFLUENCE OF ORIGIN ON STRESS-STRAIN RELATIONS OF WOOL FIBRES." JOURNAL OF THE TEXTILE INSTITUTE 60(10): 420-429.
CASSIDY, T., P. J. WEEDALL AND R. J. HARWOOD (1989). "AN EVALUATION OF DIFFERENT YARN-SPINNING SYSTEMS ON THE HANDLE OF FABRICS. PART 1: A COMPARISON OF RING-SPUN AND MULE-SPUN WOOLLEN YARNS." JOURNAL OF THE TEXTILE INSTITUTE 80: 537-545.

LVII
CASSIE, A. B. D. (1946). "PHYSICAL PROPERTIES OF FIBRES AND TEXTILE PERFORMANCES." JOURNAL OF THE TEXTILE INSTITUTE (PROCEEDINGS) 37(7): P154-P167.
CHAMPION, S. C. AND G. E. ROBARDS (2000). "FOLLICLE CHARACTERISTICS, SEASONAL CHANGES IN FIBRE CROSS-SECTIONAL AREA AND ELLIPTICITY IN AUSTRALASIAN SPECIALTY CARPET WOOL SHEEP, ROMNEYS AND MERINOS." SMALL RUMINANT RESEARCH 38(1): 71-82.
CHAPMAN, B. M. (1969A). "A MECHANICAL MODEL FOR WOOL AND OTHER KERATIN FIBERS." TEXTILE RESEARCH JOURNAL 39(12): 1102-1109.
CHAPMAN, B. M. (1969B). "A REVIEW OF THE MECHANICAL PROPERTIES OF KERATIN FIBRES." TEXTILE INSTITUTE & INDUSTRY 7(5): 142-142.
CHAPMAN, B. M. (1971). "APPARATUS FOR MEASURING BENDING AND TORSIONAL STRESS-STRAIN-TIME RELATIONS OF SINGLE FIBERS." TEXTILE RESEARCH JOURNAL 41(8): 705-707.
CHAPMAN, B. M. (1973A). "THE BENDING AND STRESS-STRAIN PROPERTIES OF SINGLE FIBRES AND THE EFFECT OF TEMPERATURE AND RELATIVE HUMIDITY." JOURNAL OF THE TEXTILE INSTITUTE 64: 312-327.
CHAPMAN, B. M. (1973B). "BENDING STRESS RELAXATION AND RECOVERY OF WOOL, NYLON 66, AND TERYLENE FIBERS." JOURNAL OF APPLIED POLYMER SCIENCE 17(6): 1693-1713.
CHAPMAN, R. E. (1986). HAIR, WOOL, QUILL, NAIL, CLAW, HOOF AND HORN. BIOLOGY OF THE INTEGUMENT, VOL. 2 VERTEBRATES. J. BEREITER-HAHN, A. G. MATOLTSY AND K. SYLVIA-RICHARDS, SPRINGER-VERLAG, BERLIN: 293-317.
CHAPMAN, R. E. AND K. WARD (1979). HISTOLOGICAL AND BIOLOGICAL FEATURES OF THE WOOL FOLLICLE AND FIBRE. PHYSIOLOGICAL AND ENVIRONMENTAL LIMITATION TO WOOL GROWTH, J.L. BLACK AND P.J. REIS, UNE PUBLISHING UNIT, ARMIDALE: 193-208.
CHAUDRI, M. A. (1966). "THE INFLUENCE OF CRIMP FORM ON THE COMPRESSIONAL BEHAVIOUR OF ANIMAL FIBRE BULKS." BIORHEOLOGY 4: 31-32.
CHAUDRI, M. A. AND K. J. WHITELEY (1968). "INFLUENCE OF NATURAL VARIATIONS IN FIBER PROPERTIES ON BULK COMPRESSION OF WOOL." TEXTILE RESEARCH JOURNAL 38(9): 897-906.
CHAUDRI, M. A. AND K. J. WHITELEY (1969). "4--FRICTIONAL AND FELTING PROPERTIES OF WOOL FIBRES TREATED WITH BENZOQUINONE." JOURNAL OF THE TEXTILE INSTITUTE 60(2): 37-45.
CHAUDRI, M. A. AND K. J. WHITELEY (1970). "RELATIONSHIPS BETWEEN LOOSE-WOOL FELTING AND BULK COMPRESSIONAL PROPERTIES." TEXTILE RESEARCH JOURNAL 40(9): 775-779.
CHEN, P. L., R. L. BARKER, G. W. SMITH AND B. SCRUGGS (1992). "HANDLE OF WEFT KNIT FABRICS." TEXTILE RESEARCH JOURNAL 62(4): 200-211.
CHERNOVA, O. F. (2002). "ARCHITECTONIC AND DIAGNOSTIC SIGNIFICANCE OF HAIR CUTICLE." BIOLOGY BULLETIN 29(3): 238-247.
CHOI, M. S. AND S. P. ASHDOWN (2000). "EFFECT OF CHANGES IN KNIT STRUCTURE AND DENSITY ON THE MECHANICAL AND HAND PROPERTIES WEFT-KNITTED FABRICS FOR OUTERWEAR." TEXTILE RESEARCH JOURNAL 70(12): 1033-1045.

LVIII
CHRISTOE, J. R., R. J. DENNING, D. J. EVANS, M. G. HUSON, L. N. JONES, P. R. LAMB, K. R. MILLINGTON, D. G. PHILLIPS, A. P. PIERLOT, J. A. RIPPON AND I. M. RUSSELL (1998). WOOL. KIRK-OTHMER ENCYCLOPEDIA OF CHEMICAL TECHNOLOGY, JOHN WILEY & SONS, INC.: 664-712.
CLEVELAND, J. P., S. MANNE, D. BOCEK AND P. K. HANSMA (1993). "A NONDESTRUCTIVE METHOD FOR DETERMINING THE SPRING CONSTANT OF CANTILEVERS FOR SCANNING FORCE MICROSCOPY." REVIEW OF SCIENTIFIC INSTRUMENTS 64(2): 403-405.
COLLINS, J. D. AND M. CHAIKIN (1968). "STRUCTURAL AND NON-STRUCTURAL EFFECTS IN THE OBSERVED STRESS-STRAIN CURVE FOR WET WOOL FIBRES." JOURNAL OF THE TEXTILE INSTITUTE 59: 379-400.
COLLINS, J. D. AND M. CHAIKIN (1971). "MECHANICAL PROPERTIES OF WOOL FIBRES AND INFLUENCE OF FIBRE STRUCTURAL AND DIMENSIONAL VARIATION .1. STRESS-STRAIN BEHAVIOUR AT VARIOUS HUMIDITIES." JOURNAL OF THE TEXTILE INSTITUTE 62(6): 289-303.
COTTLE, D. J. (1991). THE SHEEP INDUSTRY. AUSTRALIAN SHEEP AND WOOL HANDBOOK, INKATA PRESS, MELBOURNE: 3-18.
CROSSLEY, J. A. A., C. T. GIBSON, L. D. MAPLEDORAM, M. G. HUSON, S. MYHRA, D. K. PHAM, C. J. SOFIELD, P. S. TURNER AND G. S. WATSON (2000). "ATOMIC FORCE MICROSCOPY ANALYSIS OF WOOL FIBRE SURFACES IN AIR AND UNDER WATER." MICRON 31(6): 659-667.
CRUTHERS, N., R. M. LAING, D. CARR AND B. NIVEN (2010). PROPERTIES OF NEW ZEALAND ALPACA TEXTILES. TEXTILE INSTITUTE WORLD CONFERENCE, MANCHESTER.
CURTIS, K. M. S. AND J. H. STANTON (2002). "ANALYSIS OF THE CURVATURE OF WOOL OFFERED FOR AUCTION IN AUSTRALIA." IWTO CONGRESS, BARCELONA, SPAIN, MAY 2002: TECHNOLOGY & STANDARDS COMMITTEE.
CZAPLICKI, Z. (2012). "PROPERTIES AND STRUCTURE OF POLISH ALPACA WOOL." FIBRES & TEXTILES IN EASTERN EUROPE 20(1): 8-12.
DALTON, J. AND R. FRANCK (2001). CASHMERE, CAMELHAIR AND OTHER HAIR FIBRES. SILK, MOHAIR, CASHMERE AND OTHER LUXURY FIBRES. R. R. FRANCK, WOODHEAD PUBLISHING: 133-174.
DARGAHI, J. AND S. NAJARIAN (2004). "HUMAN TACTILE PERCEPTION AS A STANDARD FOR ARTIFICIAL TACTILE SENSING - A REVIEW." INTERNATIONAL JOURNAL OF MEDICAL ROBOTICS AND COMPUTER ASSISTED SURGERY 1(1): 23-35.
DE BOOS, A. G. (2005A). AUSTRALIAN MERINO: ROUTES TO IMPROVED SOFTNESS, COMFORT AND PERFORMANCE. 32ND AACHEN TEXTILE CONFERENCE, AACHEN, DWI AN DER RWTH AACHEN E.V.
DE BOOS, A. G. (2005B). CONCEPTS AND UNDERSTANDING OF FABRIC HAND. EFFECT OF MECHANICAL AND PHYSICAL PROPERTIES ON FABRIC HAND. H. M. BEHERY, THE TEXTILE INSTITUTE: 11-44.
DE BOOS, A. G., G. R. NAYLOR, I. J. SLOTA AND J. STANTON (2002). "THE EFFECT OF THE DIAMETER CHARACTERISTICS OF THE FIBRE ENDS ON THE SKIN COMFORT AND HANDLE OF KNITTED WOOL FABRICS." WOOL TECHNOLOGY AND SHEEP BREEDING 50(2): 110-120.
DEMACARTY, P. C. AND J. H. DUSENBURY (1955). ON THE BULK COMPRESSION CHARACTERISTICS OF WOOL FIBERS. 25: 875-885.

LIX
DENG, C., L. WANG AND X. WANG (2007). "DIAMETER VARIATIONS OF IRREGULAR FIBERS UNDER DIFFERENT TENSIONS." FIBERS AND POLYMERS 8(6): 642-648.
DENTON, M. J. AND P. N. DANIELS, EDS. (2002). TEXTILE TERMS AND DEFINITIONS, 11TH EDITION, . MANCHESTER, ENGLAND, THE TEXTILE INSTITUTE.
DHAMIJA, S., V. K. KOTHARI AND R. K. VARSHNEY (2011). "EFFECT OF POLYESTER FIBRE FINENESS AND CROSS-SECTIONAL SHAPE ON PHYSICAL CHARACTERISTICS OF YARNS." JOURNAL OF THE TEXTILE INSTITUTE 102(4): 293-307.
DILLON, J. H. (1952). "TENSILE PROPERTIES OF NEWER FIBERS." INDUSTRIAL AND ENGINEERING CHEMISTRY 44(9): 2115-2122.
DOBB, M. G., F. R. JOHNSTON, J. A. NOTT, L. OSTER, J. SIKORSKI AND W. S. SIMPSON (1961). "MORPHOLOGY OF THE CUTICLE LAYER IN WOOL FIBRES AND OTHER ANIMAL HAIRS." JOURNAL OF THE TEXTILE INSTITUTE 52: T153-171.
DOMINGUEZ, C., E. JOVER, J. M. BAYONA AND P. ERRA (2004). "EFFECT OF THE CARBON DIOXIDE MODIFIER ON THE LIPID COMPOSITION OF WOOL WAX EXTRACTED FROM RAW WOOL." ANALYTICA CHIMICA ACTA 477: 233-242.
DUERDEN, J. E. (1929). "12-STANDARDS OF THICKNESS AND CRIMPS IN MERINO GREASE WOOLS." JOURNAL OF THE TEXTILE INSTITUTE: T93-T100.
DUSENBURY, J. H. AND J. H. WAKELIN (1958). "EFFECTS OF CRIMP AND CROSS-SECTIONAL AREA ON THE MECHANICAL PROPERTIES OF WOOL FIBERS." TEXTILE RESEARCH JOURNAL 28(12): 989-1005.
EATON, P. AND P. WEST (2010). ATOMIC FORCE MICROSCOPY. NEW YORK, OXFORD UNIVERSITY PRESS.
ELDER, H. M. (1966). "EFFECT OF TEMPERATURE AND HUMIDITY ON BENDING MODULUS OF SOME MONOFILAMENT MATERIALS." JOURNAL OF THE TEXTILE INSTITUTE 57(2): T75-80.
ELDER, H. M., S. FISHER, K. ARMSTRONG AND G. HUTCHINSON (1984). "FABRIC SOFTNESS, HANDLE AND COMPRESSION " JOURNAL OF THE TEXTILE INSTITUTE 75(1): 37-46.
ELEY, J. R., B. V. HARROWFIELD, D. E. HENSHAW AND G. A. ROBINSON (1980). STRETCH-BREAKING AND CUTTING WOOL FOR THE SHORT-STAPLE SYSTEM. 6TH INTERNATIONAL WOOL TEXTILE RESEARCH CONFERENCE, PRETORIA.
ELEY, J. R., B. V. HARROWFIELD, D. E. A. PLATE AND G. A. ROBINSON (1985). REPORT TO TOPMAKERS. G52, CSIRO.
ELLIS, B. C. AND R. K. GARNSWORTHY (1980). "A REVIEW OF TECHNIQUES FOR THE ASSESSMENT OF HAND." TEXTILE RESEARCH JOURNAL 50(4): 231-238.
ESSICK, G. K., F. MCGLONE, C. DANCER, D. FABRICANT, Y. RAGIN, N. PHILLIPS, T. JONES AND S. GUEST (2010). "QUANTITATIVE ASSESSMENT OF PLEASANT TOUCH." NEUROSCIENCE & BIOBEHAVIORAL REVIEWS 34(2): 192-203.
EVANS, D. E., J. D. LEEDER, J. A. RIPPON AND D. E. RIVETT (1985). SEPARATION AND ANALYSIS OF THE SURFACE LIPIDS OF THE WOOL FIBER. PROCEEDINGS OF THE 7TH INTERNATIONAL WOOL TEXTILE RESEARCH CONFERENCE TOKYO, ELSEVIER APPLIED SCIENCE. 1: 135-142.

LX
EVANS, D. J., R. J. DENNING AND J. S. CHURCH (2002). INTERFACE OF KERATIN FIBRES WITH THEIR ENVIRONMENT. ENCYCLOPEDIA OF SURFACE AND COLLOID SCIENCE, MARCEL DEKKER: 2628-2642.
EVANS, T. F. (1954). "PROPERTIES OF APPAREL WOOLS: V. DEPENDENCE OF THE PHYSICAL PROPERTIES OF SINGLE FIBERS ON DIAMETER AND CRIMP." TEXTILE RESEARCH JOURNAL 24(7): 637-643.
FAN, R., C. DONG, J. ZHANG, J. HE, Y. REN AND R. BAI (2008). "A STUDY ON THE STRUCTURE AND CHARACTERISTICS OF THE ALPACA (LAMA PACOS) FIBRE." ACTA LASER BIOLOGY SINICA 17(2): 224-228.
FELDTMAN, H. D., J. D. LEEDER AND J. A. RIPPON (1983). THE ROLE OF FIBRE STRUCTURE IN WOOL FIBRE AND FABRIC PERFORMANCE. OBJECTIVE EVALUATION OF APPAREL FABRICS. R. POSTLE, TEXTILE MACHINERY SOCIETY OF JAPAN: 125-134.
FELDTMAN, H. D. AND J. R. MCPHEE (1964). "THE EFFECT OF TEMPERATURE ON THE FELTING OF SHRINK-RESISTANT WOOL." AMERICAN DYESTUFF REPORTER 34(3): 199-206.
FENG, G. (2006). "A STUDY OF THE MECHANICAL PROPERTIES OF NANOWIRES USING NANOINDENTATION." JOURNAL OF APPLIED PHYSICS 99(7): 074304.
FERGUSON, M. B., R. BEHRENDT AND B. A. MCGREGOR (2000). "OBSERVATIONS ON THE FOLLICLE CHARACTERISTICS AND FIBRE PROPERTIES OF SURI AND HUACAYA ALPACAS." ASIAN-AUSTRALASIAN JOURNAL OF ANIMAL SCIENCES 13 SUPPLEMENT: C: 400.
FEUGHELMAN, M. (1959). "A TWO-PHASE STRUCTURE FOR KERATIN FIBRES." TEXTILE RESEARCH JOURNAL 39: 223-228.
FEUGHELMAN, M. (1997). MECHANICAL PROPERTIES AND STRUCTURE OF ALPHA-KERATIN FIBRES- WOOL, HUMAN HAIR AND RELATED FIBRES, UNIVERSITY OF NEW SOUTH WALES PRESS.
FEUGHELMAN, M. AND A. R. HALY (1960). "THE MECHANICAL PROPERTIES OF THE ORTHO- AND PARA- LIKE COMPONENTS OF LINCOLN WOOL FIBERS." TEXTILE RESEARCH JOURNAL 37: 334-336.
FINN, N., L. VUCKOVIC AND S. MILLER (1999). PROCESSING OF ALPACA FIBRE IN AUSTRALIA, UNPUBLISHED DATA CSIRO.
FINNIMORE, E. (1985). OBJECTIVE HANDLE PARAMETERS OF KNITTED OUTERWEAR FABRICS. OBJECTIVE MEASUREMENT APPLICATIONS TO PRODUCT DESIGN AND PROCESS CONTROL. S. KAWABATA, R. POSTLE AND M. NIWA, THE TEXILE MACHINERY SOCIETY OF JAPAN: 45-53.
FINNIMORE, E. AND A. BERECK (1987). "THE EFFECT OF BLEACHING ON THE HANDLE PROPERTIES OF WOOL FABRICS." MELLIAND TEXTILBERICHTE INTERNATIONAL 68(8): E253-E255.
FINNIMORE, E. AND A. KONIG (1986). "INSTRUMENTAL EVALUATION OF THE SOFTNESS OF FABRICS .PART 1: CORRELATION OF INSTRUMENTAL MEASUREMENTS AND MANUAL EVALUATION." MELLIAND TEXTILBERICHTE INTERNATIONAL 67(7): E211-E212.
FISH, V. E., T. J. MAHAR AND B. J. CROOK (1999). "FIBRE CURVATURE MORPHOMETRY AND MEASUREMENT." WOOL TECHNOLOGY AND SHEEP BREEDING 47(4): 248-265.
FORGARTY, N., R. BANKS, J. VAN DER WERF, A. BALL AND J. GIBSON (2007). THE INFORMATION NUCLEUS - A NEW CONCEPT TO ENHANCE SHEEP INDUSTRY GENETIC
LXI
IMPROVEMENT. PROCEEDINGS ASSOCIATION FOR THE ADVANCEMENT OF ANIMAL BREEDING AND GENETICS. ARMIDALE. 17: 29-32.
FRANCK, R. R., ED. (2001). SILK, MOHAIR, CASHMERE AND OTHER LUXURY FIBRES, WOODHEAD PUBLISHING LTD.
FRASER, R. D. B. (1954). "THE FINE STRUCTURE OF THE WOOL FIBRE." WOOL TECHNOLOGY & SHEEP BREEDING JOURNAL 1: 46-50.
FRASER, R. D. B., L. N. JONES, T. P. MACRAE, E. SUZUKI AND P. A. TULLOCH (1980). THE FINE STRUCTURE OF THE WOOL FIBRE. 6TH INTERNATIONAL WOOL TEXTILE RESEARCH CONFERENCE, PRETORIA, SOUTH AFRICAN WOOL AND TEXTILE RESEARCH INSTITUTE.
FRASER, R. D. B. AND T. P. MACRAE (1956). "THE DISTRIBUTION OF ORTHO- AND PARA-CORTICAL CELLS IN WOOL AND MOHAIR." TEXTILE RESEARCH JOURNAL 26(8): 618-619.
FRASER, R. D. B. AND T. A. PRESSLEY (1958). "FELTING INVESTIGATIONS: PART I : POTENTIAL SUBSTITUTES FOR RABBIT FUR IN HAT FELTS." TEXTILE RESEARCH JOURNAL 28(6): 478-485.
FRITZ, A. M. (1990). "SENSORY ASSESSMENT ASSESSED." TEXTILE ASIA 21: 144-147.
FUKUHARA, M. (1993). "INNOVATION IN POLYESTER FIBERS: FROM SILK-LIKE TO NEW POLYESTER." TEXTILE RESEARCH JOURNAL 63(7): 387-391.
GALBRAITH, H. (2010). "FUNDAMENTAL OF HAIR FOLLICLE BIOLOGY IN FINE FIBRE PRODUCTION IN ANIMALS." ANIMAL PRODUCTION 4(9): 1490-1509.
GERKEN, M. (2010). "RELATIONSHIPS BETWEEN INTEGUMENTAL CHARACTERISTICS AND THERMOREGULATION IN SOUTH AMERICAN CAMELIDS." ANIMAL 4(9): 1451-1459.
GIBSON, C. T., S. MYHRA, G. S. WATSON, M. G. HUSON, D. K. PHAM AND P. S. TURNER (2001). "EFFECTS OF AQUEOUS EXPOSURE ON THE MECHANICAL PROPERTIES OF WOOL FIBERS - ANALYSIS BY ATOMIC FORCE MICROSCOPY." TEXTILE RESEARCH JOURNAL 71(7): 573-581.
GIBSON, V. L., R. C. DHINGRA AND R. POSTLE (1979). "BENDING PROPERTIES OF WARP-KNITTED OUTERWEAR FABRICS " TEXTILE RESEARCH JOURNAL 49: 50-56.
GROSBERG, P. AND C. IYPE (1999). YARN PRODUCTION, THEORETICAL ASPECT. MANCHESTER, THE TEXTILE INSTITUTE INTERNATIONAL.
GROVER, G., M. A. SULTAN AND S. M. SPIVAK (1993). "A SCREENING TECHNIQUE FOR FABRIC HANDLE." JOURNAL OF THE TEXTILE INSTITUTE 84(3): 486-494.
GUPTA, B. (2008). FRICTION IN TEXTILE MATERIALS, WOODHEAD PUB LIMITED.
GUPTA, B. S. AND Y. E. EL MOGAHZY (1991). FRICTION IN FIBROUS MATERIALS: PART I: STRUCTURAL MODEL. 61: 547-555.
GUPTA, N. P., R. AGARWAL AND S. PANT (2007). "FACTORS AFFECTING FELTING OF WOOL : AN OVERVIEW." JOURNAL OF THE TEXTILE ASSOCIATION 68(1): 43-45.
GUTHRIE, J. C., D. H. MORTON AND P. H. OLIVER (1954). "59-AN INVESTIGATION INTO THE BENDING AND TORSIONAL RIGIDITIES OF SOME FIBRES." JOURNAL OF THE TEXTILE INSTITUTE (TRANSACTIONS) 45(12): T912-T929.
HAIGH, M. G. AND G. A. ROBINSON (2002). "THE EFFECT OF FIBRE ATTRIBUTES ON FABRIC PROPERTIES." WOOL TECHNOLOGY & SHEEP BREEDING JOURNAL 50(4): 664-670.

LXII
HANSFORD, K. A. (1994). FLEECE SPECIFICATION AND PROCESSING PREDICTION. WOOLSPEC 94, SYDNEY, AUSTRALIA: J1-J22.
HANSFORD, K. A. (1996). A REVIEW: STYLE MEASUREMENTS AND TOPMAKING EFFECTS. TOP TECH '96: 311-323.
HANSFORD, K. A. (1999). "REAL-TIME MEASUREMENT ON-FARM OF MEAN FIBRE DIAMETER, FIBRE DIAMETER VARIABILITY AND FIBRE CURVATURE USING SIROLAN LASERSCAN." WOOL TECHNOLOGY & SHEEP BREEDING JOURNAL 47: 19-31.
HANSFORD, K. A., G. B. EMERY AND D. C. TEASDALE (1985). "A METHOD TO MEASURE THE DIAMETER PROFILE OF WOOL STAPLES." WOOL TECHNOLOGY & SHEEP BREEDING JOURNAL 33: 25-27.
HARDY, M. H. AND A. G. LYNE (1956). "THE ORE-NATAL DEVELOPMENT OF WOOL FOLLICLES IN MERINO SHEEP." AUSTRALIAN JOURNAL OF BIOLOGICAL SCIENCE 9: 423-441.
HARLAND, D. P., J. P. CALDWELL, J. L. WOODS, R. J. WALLS AND W. G. BRYSON (2011). "ARRANGEMENT OF TRICHOKERATIN INTERMEDIATE FILAMENTS AND MATRIX IN THE CORTEX OF MERINO WOOL." JOURNAL OF STRUCTURAL BIOLOGY 173(1): 29-37.
HARLOCK, S. C. AND S. S. RAMKUMAR (1997). "A STUDY OF THE HANDLE CHARACTERISTICS OF COTTON RIB KNITTED FABRICS." TEXTILES & THE INFORMATION SOCIETY, PAPERS PRESENTED AT THE 78TH WORLD CONFERENCE OF THE TEXTILE INSTITUTE IN ASSOCIATION WITH THE 5TH TEXTILE SYMPOSIUM OF SEVE & SEPVE: 149.
HARPER, D. L. AND Y. K. KAMATH (2007). "THE EFFECT OF TREATMENTS ON THE SHEAR MODULUS OF HUMAN HAIR MEASURED BY THE SINGLE FIBER TORSION PENDULUM." JOURNAL OF COSMETIC SCIENCE 58(4): 329-337.
HATCHER, S., P. I. HYND, K. J. THORNBERRY AND S. GABB (2010). "CAN WE BREED MERINO SHEEP WITH SOFTER, WHITER, MORE PHOTOSTABLE WOOL?" ANIMAL PRODUCTION SCIENCE 50(11-12): 1089-1097.
HEARLE, J. W. S. (2000). "A CRITICAL REVIEW OF THE STRUCTURAL MECHANICS OF WOOL AND HAIR FIBRES." INTERNATIONAL JOURNAL OF BIOLOGICAL MACROMOLECULES 27(2): 123-138.
HENSHAW, D. E. (1961). "THE ROLE OF A LUBRICANT AND ITS VISCOSITY IN WORSTED CARDING." JOURNAL OF THE TEXTILE INSTITUTE (PROCEEDINGS) 52(12): P651-P652.
HERRMANN, S. AND F. J. WORTMANN (1997). "OPPORTUNITIES FOR THE SIMULTANEOUS ESTIMATION OF ESSENTIAL FLEECE PARAMETERS IN RAW CASHMERE FLEECES." LIVESTOCK PRODUCTION SCIENCE 48(1): 1-12.
HOFFMAN, R. M. AND L. F. BESTE (1951). "SOME RELATIONS OF FIBER PROPERTIES TO FABRIC HAND." TEXTILE RESEARCH JOURNAL 21(2): 66-81.
HOLST, P. J., W. H. CLARKE AND I. G. MADDOCKS (1982). "SKIN AND FLEECE CHARACTERISTICS OF 2 GROUPS OF FERAL GOATS." AUSTRALIAN JOURNAL OF EXPERIMENTAL AGRICULTURE 22(116): 173-176.
HOLT, C. (2006). A SURVEY OF THE RELATIONSHIPS OF CRIMP FREQUENCY, MICRON, CHARACTER & FIBRE CURVATURE, A REPORT TO THE AUSTRALIAN ALPACA ASSOCIATION: 1-33.
HORIO, M. AND T. KONDO (1953). "CRIMPING OF WOOL FIBERS." TEXTILE RESEARCH JOURNAL 23(6): 373-386.

LXIII
HOWORTH, W. S. AND P. H. OLIVER (1958). "39-THE APPLICATION OF MULTIPLE FACTOR ANALYSIS TO THE ASSESSMENT OF FABRIC HANDLE." JOURNAL OF THE TEXTILE INSTITUTE (TRANSACTIONS) 49(11): T540-T553.
HUNTER, L. (2002). MECHANICAL PROCESSING FOR YARN PRODUCTION. WOOL: SCIENCE AND TECHNOLOGY. W. S. SIMPSON AND G. H. CRAWSHAW: 161-214.
HUNTER, L., S. KAWABATA, E. GEE AND M. NIWA (1982). THE EFFECT OF WOOL FIBRE DIAMETER AND CRIMP ON THE OBJECTIVELY MEASURED HANDLE OF WOVEN FABRICS. OBJECTIVE SPECIFICATION OF FABRIC QUALITY, MECHANICAL PROPERTIES AND PERFORMANCE. S. KAWABATA, R. POSTLE AND M. NIWA, TEXTILE MACHINERY SOCIETY OF JAPAN 167.
HUNTER, L., S. SMUTS AND E. GEE (1985). "THE ROLE OF SHEEP BREED IN DETERMINING THE RELATIONSHIP BETWEEN WOOL FIBER PROPERTIES AND WORSTED YARNS AND FABRIC PROPERTIES." INTERNATIONAL WOOL TEXTILE RESEARCH CONFERENCE. PROCEEDINGS 2: 11-25.
HUSON, M. (1996). FUNDAMENTALS OF FELTING. TOP TECH '96: 67-69.
HUSON, M., D. EVANS, J. CHURCH, S. HUTCHINSON, J. MAXWELL AND G. CORINO (2008). "NEW INSIGHTS INTO THE NATURE OF THE WOOL FIBRE SURFACE." JOURNAL OF STRUCTURAL BIOLOGY 163(2): 127-136.
HUSON, M. AND P. TURNER (2001). "INTRINSIC STRENGTH OF WOOL: EFFECTS OF TRANSGENESIS, SEASON AND BLOODLINE (REPRINTED FROM THE 10TH INTERNATIONAL WOOL TEXTILE CONFERENCE, GERMANY, NOVEMBER 2000)." WOOL TECHNOLOGY AND SHEEP BREEDING 49(1): 62-72.
HUSON, M. G. (1992). "MECHANISM BY WHICH OXIDIZING AGENTS MINIMIZE STRENGTH LOSSES IN WOOL DYEING " TEXTILE RESEARCH JOURNAL 62(1): 9-14.
HUSON, M. G. (1993). "COHESIVE SETTING OF WOOL IN AIR: EFFECT OF MECHANICAL DE-AGEING." TEXTILE RESEARCH JOURNAL 63(4): 204-210.
HUSON, M. G. (1998). "PHYSICAL PROPERTIES OF WOOL FIBERS IN ELECTROLYTE SOLUTIONS." TEXTILE RESEARCH JOURNAL 68(8): 595-605.
HUSON, M. G. (2009). TENSILE FAILURE OF WOOL. HANDBOOK OF TENSILE PROPERTIES OF TEXTILE AND TECHNICAL FIBRES. A. R. BUNSELL. CAMBRIDGE, WOODHEAD PUBLISHING.
HUSON, M. G., L. A. TITCOMBE AND F. A. LAWRENCE (1996). MICROSTRUCTURE AND WATER UPTAKE STUDIES OF WOOL USING ATOMIC FORCE MICROSCOPY AND CONFOCAL LASER SCANNING MICROSCOPY. IWTO REPORT NO. 4 (CAPE TOWN MEETING).
HYND, P. I., N. M. EDWARDS, M. HEBART, M. MCDOWALL AND S. CLARK (2009). "WOOL FIBRE CRIMP IS DETERMINED BY MITOTIC ASYMMETRY AND POSITION OF FINAL KERATINISATION AND NOT ORTHO- AND PARA-CORTICAL CELL SEGMENTATION." ANIMAL 3(6): 838-843.
IWTO-12-03 TEST METHOD. (2003). MEASUREMENT OF THE MEAN AND DISTRIBUTION OF FIBRE DIAMETER USING THE SIROLAN-LASERSCAN FIBRE DIAMETER ANALYSER. INTERNATIONAL WOOL TEXTILE ORGANISATION
IWTO-17-04 TEST METHOD. (2004). DETERMINATION OF FIBRE LENGTH AND DISTRIBUTION PARAMETERS. INTERNATIONAL WOOL TEXTILE ORGANISATION.
LXIV
IWTO-20-69(E) TEST METHOD. (1969). METHOD FOR THE DETERMINATION OF THE FELTING PROPERTIES OF LOOSE WOOL AND TOP. INTERNATIONAL WOOL TEXTILE ORGANISATION
IWTO-52-06 TEST METHOD. (2006). CONDITIONING PROCEDURES FOR TESTING TEXTILES. INTERNATIONAL WOOL TEXTILE ORGANISATION
IWTO-58-00 TEST METHOD. (2000). SCANNING ELECTRON MICROSCOPIC ANALYSIS OF SPECIALITY FIBRES AND SHEEP'S WOOL AND THEIR BLENDS. INTERNATIONAL WOOL TEXTILE ORGANISATION.
IYNF. (2009). "2009 INTERNATIONAL YEAR OF NATURAL FIBRES " HTTP://WWW.NATURALFIBRES2009.ORG/EN/FIBRES/CASHMERE.HTML.
IYPE, C., C. A. LAWRENCE, M. R. MAHMOUDI, B. D. GREENWOOD AND A. DELGHANI (2000). "COTTON SYSTEM PROCESSING OF WOOL AND WOOL-RICH BLENDS." TEXTILE ASIA 31: 51.
JAMES, J. F. P. (1963). "THE THICKNESS VARIATION AND BREAKING STRESS OF WOOL." JOURNAL OF THE TEXTILE INSTITUTE: T420-T432.
JEE, A.-Y. AND M. LEE, . (2010). "COMPARATIVE ANALYSIS ON THE NANOINDENTATION OF POLYMERS USING ATOMIC FORCE MICROSCOPY." POLYMER TESTING 29(1): 95-99.
JEGUIRIM, S. E.-G., A. B. DHOUIB, M. SAHNOUN, M. CHEIKHROUHOU, N. NJEUGNA, L. SCHACHER AND D. ADOLPHE (2010). "THE TACTILE SENSORY EVALUATION OF KNITTED FABRICS: EFFECT OF SOME FINISHING TREATMENTS." JOURNAL OF SENSORY STUDIES 25(2): 201-215.
JONES, L. N., T. J. HORR AND I. J. KAPLIN (1994). "FORMATION OF SURFACE MEMBRANES IN DEVELOPING MAMMALIAN HAIR FIBRES." MICRON 25: 589-595.
KADWELL, M., M. FERNANDEZ, H. F. STANLEY, R. BALDI, J. C. WHEELER, R. ROSADIO AND M. W. BRUFORD (2001). "GENETIC ANALYSIS REVEALS THE WILD ANCESTORS OF THE LLAMA AND ALPACA." PROCEEDINGS OF THE ROYAL SOCIETY B: BIOLOGICAL SCIENCES7TH INTERNATIONAL WOOL TEXTILE RESEARCH CONFERENCE, TOKYO, 1985. VOLUME II. 268: 2575-2584.
KAMATH, Y. K., S. B. RUETSCH, E. PETROVICOVA, L. KINTRUP AND H. J. SCHWARK (2002). "EFFECTS OF SPIN FINISH ON FIBER SURFACE HARDNESS: AN INVESTIGATION WITH ATOMIC FORCE MICROSCOPY AND FRICTIONAL MEASUREMENTS." JOURNAL OF APPLIED POLYMER SCIENCE 85(2): 394-414.
KAPLIN, I. J. AND K. J. WHITELEY (1978). "ELECTRON MICROSCOPE STUDY OF FIBRIL: MATRIX ARRANGEMENTS IN HIGH- AND LOW- CRIMP WOOL FIBERS " AUSTRALIAN JOURNAL OF BIOLOGICAL SCIENCE 31: 231-240.
KARORI. (2011). "IT’S OFFICIAL- KARORI WOOL IS SOFTER THAN CASHMERE!" KARORI MERINOS NEWS - NOVEMBER 2011 RETRIEVED 2/7/2012, 2012, FROM HTTP://WWW.KARORI.COM.AU/INDEX.PL?SITEMENU=22.
KAWABATA, S. (1980). THE STANDARDIZATION AND ANALYSIS OF HANDLE EVALUATION. OSAKA, THE MACHINERY SOCIETY OF JAPAN.
KAWABATA, S. (1982). THE DEVELOPMENT OF THE OBJECTIVE MEASUREMENT OF FABRIC HANDLE. KYOTO, THE TEXTILE MACHINERY SOCIETY OF JAPAN.
KAWABATA, S. (1996). MICROMEASUREMENT OF THE MECHANICAL PROPERTIES OF SINGLE FIBRES. MODERN TEXTILE CHARACTERIZATION METHODS. M. RAHEEL: 311-328.
LXV
KAWABATA, S., Y. KAWASHIMA, Y. YAMASHITA AND A. TANAKA (2002). BENDING PROPERTY OF THE SINGLE WOOL FIBER. 31TH TEXTILE RESEARCH SYMPOSIUM. MT. FUJI, JAPAN.
KAWABATA, S., Y. KAWASHIMA, Y. YAMASHITA AND M. TANAKA (2004). "APPARENT ELASTIC MODULUS OF SCALE ESTIMATED FROM BENDING PROPERTY OF SINGLE WOOL FIBRE." JOURNAL OF TEXTILE ENGINEERING 50(2): 21-24.
KAWABATA, S. AND M. NIWA (1996). OBJECTIVE MEASUREMENT OF FABRIC HAND. IN MODERN TEXTILE CHARACTERISATION METHODS: 329-354.
KAWABATA, S., M. NIWA, C. MURAKI, M. INOUE, M. UYAMA AND R. S. RENGASAMY (1995). ANISOTROPY IN THE MECHANICAL AND THERMAL PROPERTIES OF WOOL FIBRES. THE 9TH INTERNATIONAL WOOL TEXTILE RESEARCH CONFERENCE, BIELLA, ITALY.
KAWABATA, S., M. NIWA AND Y. YAMASHITA (2002). "RECENT DEVELOPMENTS IN THE EVALUATION TECHNOLOGY OF FIBER AND TEXTILES: TOWARD THE ENGINEERED DESIGN OF TEXTILE PERFORMANCE." JOURNAL OF APPLIED POLYMER SCIENCE 83(3): 687-702.
KAWABATA, S., Y. YAMASHITA AND M. NIWA (2000). MICRO-MECHANICS OF WOOL SINGLE FIBRE. 10TH INTERNATIONAL WOOL TEXTILE RESEARCH CONFERENCE AACHEN, GERMANY.
KENYON, P. R. AND G. A. WICKHAM (1999). "A NEW TECHNIQUE FOR MEASURING LOOSE-WOOL FELTABILITY." JOURNAL OF THE TEXTILE INSTITUTE 90(1): 266-267.
KENYON, P. R., G. A. WICKHAM AND H. T. BLAIR (1999). "NATURAL VARIATION IN FELTING AND YARN SHRINKAGE IN WOOL FROM ROMNEY AND ROMNEY-CROSS SHEEP." JOURNAL OF THE TEXTILE INSTITUTE 90(1): 395-403.
KHAYATT, R. M. AND N. H. CHAMBERLAIN (1948). "15--THE BENDING MODULUS OF ANIMAL FIBRES " JOURNAL OF THE TEXTILE INSTITUTE (TRANSACTIONS) 39(5): T185-T197.
KIM, J. O. AND B. L. SLATEN (1999). "OBJECTIVE EVALUATION OF FABRIC HAND - PART I: RELATIONSHIPS OF FABRIC HAND BY THE EXTRACTION METHOD AND RELATED PHYSICAL AND SURFACE PROPERTIES." TEXTILE RESEARCH JOURNAL 69(1): 59-67.
KURDO, K. O. A., K. J. WHITELEY AND L. J. SMITH (1986). "THE INFLUENCE OF RESISTANCE TO COMPRESSION ON THE PROCESSING PERFORMANCE OF SUPERFINE WOOLS .1. TOPMAKING." JOURNAL OF THE TEXTILE INSTITUTE 77(2): 104-118.
KYUNGWOO LEE, E. (2003). "TORSIONAL AND BENDING ANALYSIS OF FIBERS WITH A GENERALIZED CARDIOID-SHAPED CROSS SECTION." TEXTILE RESEARCH JOURNAL 73(12): 1085-1090.
LADYMAN, M. E., J. C. GREEFF AND A. C. SCHLINK (2004). FELTABILITY OF MERINO WOOL IS INFLUENCED BY SCALE STRUCTURE. THE AUSTRALIAN SOCIETY OF ANIMAL PRODUCTION 25TH BIENNIAL CONFERENCE : THE NEW REALITIES, MELBOURNE, VICTORIA.
LAM, J. K. C. AND I. WONG (2011). FABRIC HAND ON LIGHT WEIGHT SUMMER KNITTED FABRIC. AUTEX 2011 CONFERENCE. MULHOUSE, FRANCE.
LAMB, P. R. (1997). THE DOWNSTREAM EFFECTS OF CRIMP. CSIRO FINEWOOL NEWSLETTER. 10: 8-9.
LXVI
LAMB, P. R., I. W. PURVIS AND G. A. ROBINSON (2000). "PROCESSING IMPLICATIONS OF FINER, LONGER, LOWER CRIMP WOOL." ASIAN-AUSTRALASIAN JOURNAL OF ANIMAL SCIENCES 13: 16-19.
LAMB, P. R., G. A. ROBINSON AND T. J. MAHAR (1996). THE EFFECT OF FIBRE CRIMP ON YARN EVENNESS AND SPINNING PERFORMANCE. TOP TECH '96: 324-331.
LANGBEIN, L., J. SCHWEIZER AND W. J. KWANG (2005). KERATINS OF THE HUMAN HAIR FOLLICLE. INTERNATIONAL REVIEW OF CYTOLOGY, ACADEMIC PRESS. VOLUME 243: 1-78.
LANGLEY, K. D. AND T. A. KENNEDY (1981). "THE IDENTIFICATION OF SPECIALTY FIBERS." TEXTILE RESEARCH JOURNAL 51(11): 703-709.
LANGSTON, J. H. AND W. T. RAINEY, JR. (1954). A LITERATURE SURVEY ON FIBER FRICTION. 24: 643-653.
LATORRE, C. AND B. BHUSHAN (2005A). "NANOTRIBOLOGICAL CHARACTERIZATION OF HUMAN HAIR AND SKIN USING ATOMIC FORCE MICROSCOPY." ULTRAMICROSCOPY 105(1-4): 155-175.
LATORRE, C. AND B. BHUSHAN (2005B). "NANOTRIBOLOGICAL EFFECTS OF HAIR CARE PRODUCTS AND ENVIRONMENT ON HUMAN HAIR USING ATOMIC FORCE MICROSCOPY." JOURNAL OF VACUUM SCIENCE & TECHNOLOGY A 23(4): 1034-1045.
LATORRE, C. AND B. BHUSHAN (2006). "INVESTIGATION OF SCALE EFFECTS AND DIRECTIONALITY DEPENDENCE ON FRICTION AND ADHESION OF HUMAN HAIR USING AFM AND MACROSCALE FRICTION TEST APPARATUS." ULTRAMICROSCOPY 106(8-9): 720-734.
LEE, P. (1999). "EXAMINING THE PRACTICALITIES OF USING SINGLE YARN IN THE WARP." WOOL RECORD 158(3651): 31.
LEEDER, J. D. (1986). "THE CELL MEMBRANE COMPLEX AND ITS INFLUENCE ON THE PROPERTIES OF THE WOOL FIBRE." WOOL SCIENCE REVIEW 63: 3-35.
LEEDER, J. D., B. A. MCGREGOR AND R. G. STEADMAN (1998). PROPERTIES AND PERFORMANCE OF GOAT FIBRE. RURAL INDUSTRIES RESEARCH AND DEVELOPMENT CORPORATION, RIRDC PUBLICATION NO. 98/22.
LEEDER, J. D. AND J. A. RIPPON (1985). "CHANGES INDUCED IN THE PROPERTIES OF WOOL BY SPECIFIC EPICUTICLE MODIFICATION." JOURNAL OF THE SOCIETY OF DYERS AND COLOURISTS 101: 11-16.
LEEDER, J. D., I. M. TRELOAR AND M. TSATSARONIS (1988). "A COMMENT ON THE USE OF DICHLOROMETHANE IN THE DETERMINATION OF SOLVENT-SOLUBLE MATTER IN WOOL." JOURNAL OF THE TEXTILE INSTITUTE 79(2): 143-146.
LI, S. W., H. S. OUYANG, G. E. ROGERS AND C. S. BAWDEN (2009). "CHARACTERIZATION OF THE STRUCTURAL AND MOLECULAR DEFECTS IN FIBRES AND FOLLICLES OF THE MERINO FELTING LUSTRE MUTANT." EXPERIMENTAL DERMATOLOGY 18(2): 134-142.
LI, Y. (2001). THE SCIENCE OF CLOTHING COMFORT, OXFORD, UK, THE TEXTILE INSTITUTE.
LINDBERG, J. AND N. GRALEN (1948). "MEASUREMENT OF FRICTION BETWEEN SINGLE FIBERS .2. FRICTIONAL PROPERTIES OF WOOL FIBERS MEASURED BY THE FIBER-TWIST METHOD." TEXTILE RESEARCH JOURNAL 18(5): 287-301.

LXVII
LIPSON, M. AND P. HOWARD (1946). "FRICTION BETWEEN KERATIN SURFACES AS AFFECTED BY SOME SHRINKPROOFING TREATMENTS." JOURNAL OF THE SOCIETY OF DYERS AND COLOURISTS 62(1): 29-32.
LIU, H. AND W. G. BRYSON (2005). "MODELLING STRUCTURAL EFFECTS ON SINGLE ROMNEY WOOL FIBRE STRESS-STRAIN RELATIONSHIP, BENDING STIFFNESS, AND CURVATURE " RESEARCH JOURNAL OF TEXTILE AND APPAREL 9(2): 1-8.
LIU, X., C. J. HURREN AND X. WANG (2005). A COMPARATIVE STUDY OF THE MECHANICAL PROPERTIES OF WOOL AND ALPACA FIBRES. 11TH INTERNATIONAL WOOL RESEARCH CONFERENCE, LEEDS, UK.
LIU, X., L. WANG AND X. WANG (2004A). "RESISTANCE TO COMPRESSION BEHAVIOUR OF ALPACA AND WOOL." TEXTILE RESEARCH JOURNAL 74(3): 265-270.
LIU, X., L. J. WANG AND X. G. WANG (2004B). "EVALUATING THE SOFTNESS OF ANIMAL FIBERS." TEXTILE RESEARCH JOURNAL 74(6): 535-538.
LIU, X. AND X. WANG (2007). "A COMPARATIVE STUDY ON THE FELTING PROPENSITY OF ANIMAL FIBERS." TEXTILE RESEARCH JOURNAL 77(12): 957-963.
LOBB, J. T., K. A. HANSFORD, W. HUMPHRIES, P. R. LAMB AND S. R. YANG (1997). A PRELIMINARY STUDY OF FIBRE CURVATURE MEASUREMENT USING SIROLAN-LASERSCAN AND ITS POTENTIAL APPLICATIONS. IWTO REPORT NO. 8 (BOSTON).
LOGAN, R. I., D. E. RIVETT, D. J. TUCKER AND A. H. F. HUDSON (1989). "ANALYSIS OF THE INTERCELLULAR AND MEMBRANE LIPIDS OF WOOL AND OTHER ANIMAL FIBRES." TEXTILE RESEARCH JOURNAL 59: 109-113.
LUNDGREN, H. P. (1969). "NEW CONCEPTS IN EVALUATING FABRIC HAND." TEXTILE CHEMIST AND COLORISTS(1): 35-45.
LUPTON, C. J., A. MCCOLL AND R. H. STOBART (2006). "FIBER CHARACTERISTICS OF THE HUACAYA ALPACA." SMALL RUMINANT RESEARCH 64(3): 211-224.
LY, N. (2004). INNOVATION IN WOOL TEXTILES. 2ND INTERNATIONAL TEXTILE CONFERENCE THE NORTH INDIA SECTION OF THE TEXTILE INSTITUTE, NEW DELHI, INDIA, NISTI.
LY, N. G., D. H. TESTER, P. BUCKENHAM, A. F. ROCZNIOK, A. L. ADRIAANSEN, F. SCAYSBROOK AND S. DE JONG (1991). "SIMPLE INSTRUMENTS FOR QUALITY CONTROL BY FINISHERS AND TAILORS." TEXTILE RESEARCH JOURNAL 61(7): 402-406.
MACLAREN, J. A. AND B. MILLIGAN (1981). WOOL SCIENCE, THE CHEMICAL REACTIVITY OF THE WOOL FIBRE, SCIENCE PRESS.
MADELEY, T. (1994). THE PHYSICAL PROPERTIES AND PROCESSING OF FINE MERINO LAMB'S WOOL. DOCTOR OF PHILOSOPHY PHD, UNIVERSITY OF NEW SOUTH WALES.
MADELEY, T., T. MAHAR AND R. POSTLE (1995). CRIMP AND THE HANDLE OF FINE MERINO WOOL. PROCEEDINGS OF THE 9TH INTERNATIONAL WOOL TEXTILE RESEARCH CONFERENCE. VOLUME II: WOOL STRUCTURE & PROPERTIES, PROTEIN CHEMISTRY, FINE ANIMAL FIBRES, BIELLA.
MADELEY, T. AND R. POSTLE (1994). "FINE MERINO CRIMP & SOFTNESS." TEXTILE ASIA: 44-47.
MADELEY, T. AND R. POSTLE (1999). "PHYSICAL PROPERTIES AND PROCESSING OF FINE MERINO LAMB'S WOOL - PART III: EFFECTS OF WOOL FIBER CURVATURE ON THE

LXVIII
HANDLE OF FLANNEL WOVEN FROM WOOLEN SPUN YARN." TEXTILE RESEARCH JOURNAL 69(8): 576-582.
MADELEY, T., R. POSTLE AND T. MAHAR (1998A). "PHYSICAL PROPERTIES AND PROCESSING OF FINE MERINO LAMB'S WOOL - PART II: SOFTNESS AND OBJECTIVE CHARACTERISTICS OF LAMB'S WOOL." TEXTILE RESEARCH JOURNAL 68(9): 663-670.
MADELEY, T., R. POSTLE AND T. MAHAR (1998B). "PHYSICAL PROPERTIES AND PROCESSING OF FINE MERINO LAMB'S WOOL PART I: WOOL GROWTH AND SOFTNESS OF HANDLE." TEXTILE RESEARCH JOURNAL 68(8): 545-552.
MAHAR, T. AND R. POSTLE (1983). INTERNATIONAL FABRIC HANDLE SURVEY, THE TEXTILE MACHINERY SOCIETY OF JAPAN.
MAHAR, T. J. AND H. WANG (2010). "MEASURING FABRIC HANDLE TO DEFINE LUXURY: AN OVERVIEW OF HANDLE SPECIFICATION IN NEXT-TO-SKIN KNITTED FABRICS FROM MERINO WOOL." ANIMAL PRODUCTION SCIENCE 50(11-12): 1082-1088.
MAKINSON, K. R. (1975). SURFACE PROPERTIES OF WOOL FIBERS. SURFACE CHARACTERISTICS OF FIBERS AND TEXTILES PART 1. M. J. SCHICK. NEW YORK, MARCEL DEKKER, INC: 109-164.
MAKINSON, K. R. (1978). "BILATERAL DIFFERENTIATION IN THE CUTICLE OF MERINO WOOL FIBERS." TEXTILE RESEARCH JOURNAL 48(10): 598-603.
MAKINSON, K. R. (1979). SHRINKPROOFING OF WOOL, MARCEL DEKKER, NEW YORK.
MARLER, J. W. AND A. G. DE BOOS (2006). DEFINITION OF MERINO. INTERNATIONAL WOOL TEXTILE ORGANISATION, COMMERCIAL SUPPLIERS FORUM, XI'AN MEETING, REPORT NO. CSF 01.
MARTI, M., A. M. MANICH, M. H. USSMAN, I. BONDIA, J. L. PARRA AND L. CODERCH (2004). "INTERNAL LIPID CONTENT AND VISCOELASTIC BEHAVIOR OF WOOL FIBERS." JOURNAL OF APPLIED POLYMER SCIENCE 92(5): 3252-3259.
MASSEY, C. (2011). BREAKING THE SHEEP'S BACK, UNIVERSITY OF QUEENSLAND PRESS.
MATSUDAIRA, M., S. KAWABATA AND M. NIWA (1984A). "THE EFFECT OF FIBER CRIMP ON FABRIC QUALITY." JOURNAL OF THE TEXTILE INSTITUTE 75(4): 273-277.
MATSUDAIRA, M., S. KAWABATA AND M. NIWA (1984B). "THE LOSS OF CRIMP AND CRIMP RECOVERY OF WOOL FIBRES DURING HIGH-SPEED WORSTED SPINNING." JOURNAL OF THE TEXTILE INSTITUTE 75(4): 267 - 272.
MATSUDAIRA, M., Y. TAN AND Y. KONDO (1993). "THE EFFECT OF FIBER CROSS-SECTIONAL SHAPE ON FABRIC MECHANICAL-PROPERTIES AND HANDLE." JOURNAL OF THE TEXTILE INSTITUTE 84(3): 376-386.
MAXWELL, J. M. AND M. G. HUSON (2002). "USING THE SCANNING PROBE MICROSCOPE TO MEASURE THE EFFECT OF RELATIVE HUMIDITY ON SAMPLE STIFFNESS." REVIEW OF SCIENTIFIC INSTRUMENTS 73(10): 3520-3524.
MAXWELL, J. M. AND M. G. HUSON (2005). "SCANNING PROBE MICROSCOPY EXAMINATION OF THE SURFACE PROPERTIES OF KERATIN FIBRES." MICRON 36(2): 127-136.
MCALLISTER, Q. P., J. W. GILLESPIE AND M. R. VANLANDINGHAM (2012A). "EVALUATION OF THE THREE-DIMENSIONAL PROPERTIES OF KEVLAR ACROSS LENGTH SCALES." JOURNAL OF MATERIALS RESEARCH: 1-14.

LXIX
MCALLISTER, Q. P., J. W. GILLESPIE AND M. R. VANLANDINGHAM (2012B). "NONLINEAR INDENTATION OF FIBERS." JOURNAL OF MATERIALS RESEARCH 27(1): 197-213.
MCCORD, M. G. AND M. S. ELLISON (1996). "AN AUTOMATED TORSION BALANCE FOR INVESTIGATION OF MICROSTRUCTURE OF SINGLE FILAMENTS. I. POLYPROPYLENE." JOURNAL OF APPLIED POLYMER SCIENCE 61(2): 293-306.
MCGREGOR, B. A. (2001). THE QUALITY OF CASHMERE AND ITS INFLUENCE ON TEXTILE MATERIALS PRODUCED FROM CASHMERE AND BLENDS WITH SUPERFINE WOOL, PHD THESIS. PHD PHD, THE UNIVERSITY OF NEW SOUTH WALES.
MCGREGOR, B. A. (2002). "IS MERINO WOOL A LUXURY PRECIOUS FIBRE?" WOOL TECHNOLOGY AND SHEEP BREEDING 50(3): 319-326.
MCGREGOR, B. A. (2003). "CLEAN FIBRE, VEGETABLE MATTER, WAX, SUINT AND ASH CONTENT, YIELD AND FIBRE ATTRIBUTES OF COMMERCIAL LOTS OF AUSTRALIAN CASHMERE." WOOL TECHNOLOGY AND SHEEP BREEDING 51(3): 224-241.
MCGREGOR, B. A. (2004). "QUALITY ATTRIBUTES OF COMMERCIAL CASHMERE." SOUTH AFRICAN JOURNAL OF ANIMAL SCIENCE 34: 137-140.
MCGREGOR, B. A. (2005). PILLING AND APPEARANCE CHANGE OF WORSTED SPUN CASHMERE KNITWEAR - A COMPARISON OF THE ICI PILLBOX AND THE RANDOM TUMBLE METHODS. PROCEEDINGS OF THE 3RD INTERNATIONAL CASHMERE DETERMINATION TECHNIQUE SEMINAR. ERDOS, INNER MONGOLIA.
MCGREGOR, B. A. (2006). "PRODUCTION, ATTRIBUTES AND RELATIVE VALUE OF ALPACA FLEECES IN SOUTHERN AUSTRALIA AND IMPLICATIONS FOR INDUSTRY DEVELOPMENT." SMALL RUMINANT RESEARCH 61(2-3): 93-111.
MCGREGOR, B. A. (2007A). "CASHMERE FIBRE CRIMP, CRIMP FORM AND FIBRE CURVATURE." INTERNATIONAL JOURNAL OF SHEEP & WOOL SCIENCE 55(1): 105-129.
MCGREGOR, B. A. (2007B). SOFTNESS ATTRIBUTES OF AUSTRALIAN CASHMERE. AGRICULTURE NOTES, AG1004, ISSN 1329-8062, DEPARTMENT OF PRIMARY INDUSTRIES, VICTORIA.
MCGREGOR, B. A. AND K. L. BUTLER (2004). "SOURCES OF VARIATION IN FIBRE DIAMETER ATTRIBUTES OF AUSTRALIAN ALPACAS AND IMPLICATIONS FOR FLEECE EVALUATION AND ANIMAL SELECTION." AUSTRALIAN JOURNAL OF AGRICULTURAL RESEARCH 55(4): 433-442.
MCGREGOR, B. A. AND K. L. BUTLER (2008). "THE EFFECTS OF CASHMERE ATTRIBUTES ON THE EFFICIENCY OF DEHAIRING AND DEHAIRED CASHMERE LENGTH." TEXTILE RESEARCH JOURNAL 78(6): 486-496.
MCGREGOR, B. A. AND R. POSTLE (2002). "SINGLE YARN KNITTED FABRICS PRODUCED FROM LOW AND HIGH CURVATURE SUPERFINE MERINO WOOL." WOOL TECHNOLOGY & SHEEP BREEDING JOURNAL 50(4): 691-697.
MCGREGOR, B. A. AND R. POSTLE (2004). "PROCESSING AND QUALITY OF CASHMERE TOPS FOR ULTRAFINE WOOL WORSTED BLEND FABRICS." INTERNATIONAL JOURNAL OF CLOTHING SCIENCE & TECHNOLOGY 16(1/2): 119-131.
MCGREGOR, B. A. AND R. POSTLE (2006). THE SOFTNESS OF CASHMERE RAW MATERIALS AND CASHMERE TEXTILES. PROCEEDINGS OF 2006 CHINA INTERNATIONAL WOOL TEXTILE CONFERENCE & IWTO WOOL FORUM: 1-7.

LXX
MCGREGOR, B. A. AND R. POSTLE (2007). "WORSTED CASHMERE TOP AND YARNS BLENDED WITH LOW OR HIGH CURVATURE SUPERFINE MERINO WOOL." TEXTILE RESEARCH JOURNAL: 792-803.
MCGREGOR, B. A. AND R. POSTLE (2008). "MECHANICAL PROPERTIES OF CASHMERE SINGLE JERSEY KNITTED FABRICS BLENDED WITH HIGH AND LOW CRIMP SUPERFINE MERINO WOOL." TEXTILE RESEARCH JOURNAL 78(5): 399-411.
MCGREGOR, B. A. AND R. POSTLE (2009). "WEAR ATTRIBUTES OF CASHMERE SINGLE JERSEY KNITTED FABRICS BLENDED WITH HIGH AND LOW CRIMP SUPERFINE MERINO WOOL." TEXTILE RESEARCH JOURNAL 79(10): 876-887.
MCGREGOR, B. A. AND D. J. TUCKER (2010). "EFFECTS OF NUTRITION AND ORIGIN ON THE AMINO ACID, GREASE, AND SUINT COMPOSITION AND COLOR OF CASHMERE AND GUARD HAIRS." JOURNAL OF APPLIED POLYMER SCIENCE 117(1): 409-420.
MCQUEEN, R. H., R. M. LAING, H. J. L. BROOKS AND B. E. NIVEN (2007). "ODOR INTENSITY IN APPAREL FABRICS AND THE LINK WITH BACTERIAL POPULATIONS." TEXTILE RESEARCH JOURNAL 77(7): 449-456.
MCQUEEN, R. H., R. M. LAING, C. M. DELAHUNTY, H. J. L. BROOKS AND B. E. NIVEN (2008). "RETENTION OF AXILLARY ODOUR ON APPAREL FABRICS." JOURNAL OF THE TEXTILE INSTITUTE (2004) 99(6): 515-523.
MEADE, S. J., J. M. DYER, J. P. CALDWELL AND W. G. BRYSON (2008). "COVALENT MODIFICATION OF THE WOOL FIBER SURFACE: REMOVAL OF THE OUTER LIPID LAYER." TEXTILE RESEARCH JOURNAL 78(11): 943-957.
MEILGAARD, M. D., G. V. GUILLE AND A. J. CARR (1987). SENSORY EVALUATION TECHNIQUES. BOCA RATON, FLORIDA, CRC PRESS INC.
MENKART, J. AND J. C. DETENBECK (1957). "THE SIGNIFICANCE OF WOOL FIBER CRIMP PART I: A STUDY ON THE WORSTED SYSTEM." TEXTILE RESEARCH JOURNAL 27(9): 665-689.
MENKART, J. AND B. JOSEPH (1958). "THE SIGNIFICANCE OF WOOL FIBER CRIMP: PART II: A STUDY ON THE WOOLEN SYSTEM." TEXTILE RESEARCH JOURNAL 28(11): 940-945.
MEREDITH, R. (1954). "30-THE TORSIONAL RIGIDITY OF TEXTILE FIBRES." JOURNAL OF THE TEXTILE INSTITUTE (TRANSACTIONS) 45(7): T489-T503.
MILITKY, J. (2005). APPLICATION OF STATISTICAL METHODS IN EVALUATION OF FABRIC HAND. EFFECT OF MECHANICAL AND PHYSICAL PROPERTIES ON FABRIC HAND. H. M. BEHERY, THE TEXTILE INSTITUTE: 66-121.
MORANTE, R., F. GOYACHE, A. BURGOS, I. CERVANTES, M. M.A. PÉREZ-CABAL AND J. GUTIÉRREZ (2009). "GENETIC IMPROVEMENT FOR ALPACA FIBRE PRODUCTION IN THE PERUVIAN ALTIPLANO: THE PACOMARCA EXPERIENCE." ANIMAL GENETIC RESOURCES INFORMATION 45: 37-43.
MORRIS, V. J., A. R. KIRBY AND A. P. GUNNING (1999). ATOMIC FORCE MICROSCOPY FOR BIOLOGISTS. NORWICH, UK, IMPERIAL COLLEGE PRESS.
MORTON, W. E. AND J. W. S. HEARLE (1993). PHYSICAL PROPERTIES OF TEXTILE FIBRES, THE TEXTILE INSTITUTE.
MURAKI, C. (1994). "CHANGES IN ANISOTROPIC ELASTIC MODULI OF WOOL FIBRES DURING WORSTED SPINNING, WEAVING AND FINISHING." JOURNAL OF THE TEXTILE INSTITUTE (2004) 85(1): 12-21.
LXXI
NA, Y. AND C. KIM (2001). "QUANTIFYING THE HANDLE AND SENSIBILITY OF WOVEN SILK FABRICS." TEXTILE RESEARCH JOURNAL 71(8): 739-742.
NAGORCKA, B. N. (1981). "THEORETICAL BASIS FOR CRIMP." AUSTRALIAN JOURNAL OF BIOLOGICAL SCIENCE 34: 189-209.
NAY, T. AND H. JOHNSON (1967). "FOLLICLE CURVATURE AND CRIMP SIZE IN SOME SELECTED AUSTRALIAN MERINO GROUPS." AUSTRALIAN JOURNAL OF AGRICULTURAL RESEARCH 18: 833-840.
NAYLOR, G. R. S. (1998). "FIBRE DIAMETER DISTRIBUTION IN SALE LOTS AND TOPS." WOOL TECHNOLOGY & SHEEP BREEDING JOURNAL 46(2): 144-153.
NAYLOR, G. R. S. (2010). "FABRIC-EVOKED PRICKLE IN WORSTED SPUN SINGLE JERSEY FABRICS PART 4: EXTENSION FROM WOOL TO OPTIMTMFINE FIBER." TEXTILE RESEARCH JOURNAL 80(6): 537-547.
NAYLOR, G. R. S., C. M. OLDHAM AND J. STANTON (2004). "SHEARING TIME OF MEDITERRANEAN WOOLS AND FABRIC SKIN COMFORT." TEXTILE RESEARCH JOURNAL 74(4): 322-328.
NAYLOR, G. R. S., D. G. PHILLIPS, C. J. VEITCH, M. DOLLING AND D. J. MARLAND (1997). "FABRIC-EVOKED PRICKLE IN WORSTED SPUN SINGLE JERSEY FABRICS. PART I. THE ROLE OF FIBER END DIAMETER CHARACTERISTICS." TEXTILE RESEARCH JOURNAL 67(4): 288-295.
NEGRI, A. P., H. J. CORNELL AND D. E. RIVETT (1993). "A MODEL FOR THE SURFACE OF KERATIN FIBRES." TEXTILE RESEARCH JOURNAL 63(2): 109-115.
NIWA, M. AND M. ISHIDA (1978). "AN ANALYSIS OF "SOFTNESS" OF FABRICS." JOURNAL OF THE TEXTILE MACHINERY SOCIETY OF JAPAN 31: 403-410.
O'CONNELL, R. A. AND H. P. LUNDGREN (1954). "COMPARISON OF WOOLS BETWEEN AND WITHIN SEVERAL BREEDS OF SHEEP." TEXTILE RESEARCH JOURNAL 24(7): 677-685.
O'CONNELL, R. A. AND A. S. YEISER (1954). "EFFECT OF CRIMP ON MECHANICAL PROPERTIES OF WET WOOL." TEXTILE RESEARCH JOURNAL 24(7): 629-632.
OERLIKON (2010) "THE FIBER YEAR 2009/10: A WORLD SURVEY ON TEXTILE AND NON-WOVENS INDUSTRY HTTP://WWW.OERLIKONTEXTILE.COM/PORTALDATA/1/RESOURCES/SAURER_TEXTILE_SOLUTIONS/MEDIA_CENTER/FIBER_YEAR_2009_10/THE_FIBRE_YEAR_2010_EN_0607.PDF." 88P.
OLIVER, W. C. AND G. M. PHARR (1992). "AN IMPROVED TECHNIQUE FOR DETERMINING HARDNESS AND ELASTIC-MODULUS USING LOAD AND DISPLACEMENT SENSING INDENTATION EXPERIMENTS." JOURNAL OF MATERIALS RESEARCH 7(6): 1564-1583.
OLIVER, W. C. AND G. M. PHARR (2004). "MEASUREMENT OF HARDNESS AND ELASTIC MODULUS BY INSTRUMENTED INDENTATION: ADVANCES IN UNDERSTANDING AND REFINEMENTS TO METHODOLOGY." JOURNAL OF MATERIALS RESEARCH 19(01): 3-20.
ONIONS, W. J. (1962). WOOL. AN INTRODUCTION TO ITS PROPERTIES, VARIETIES, USES AND PRODUCTION. LONDON, ERNEST BENN LIMITED.
ORWIN, D. F. G. (1979). "THE CYTOLOGY AND CYTOCHEMISTRY OF THE WOOL FOLLICLE." INTERNATIONAL REVIEW OF CYTOLOGY 60: 331-374.

LXXII
ORWIN, D. F. G. (1989). VARIATIONS IN WOOL FOLLICLE MORPHOLOGY. THE BIOLOGY OF WOOL AND HAIR. G.E. ROGERS., P.J. REIS., K.A. WARD. AND R.C. MARSHALL., CHAPMAN AND HALL: 227-241.
ORWIN, D. F. G., J. L. WOODS AND K. H. ELLIOTT (1980). COMPOSITION OF THE CORTEX OF SOUND AND TENDER WOOLS 6TH INTERNATIONAL WOOL TEXTILE RESEARCH CONFERENCE, PRETORIA.
ORWIN, D. F. G., J. L. WOODS AND S. L. RANFORD (1984). "CORTICAL CELL-TYPES AND THEIR DISTRIBUTION IN WOOL FIBERS." AUSTRALIAN JOURNAL OF BIOLOGICAL SCIENCES 37(4): 237-255.
OXTOBY, E. (1987). SPUN YARN TECHNOLOGY. LONDON, BUTTERWORTHS AND CO.,.
PAN, N. (2006). SYSTEM AND METHOD FOR FABRIC HAND EVALUATION. UNITED STATES PATENT APPLICATION PUBLICATION, US 2006/0036410 A1.
PAN, N. (2007). "QUANTIFICATION AND EVALUATION OF HUMAN TACTILE SENSE TOWARDS FABRIS." INTERNATIONAL JOURNAL OF DESIGN AND NATURE 1(1): 48-60.
PAN, N. AND K. C. YEN (1992). "PHYSICAL INTERPRETATION OF CURVES OBTAINED THROUGH THE FABRIC EXTRACTION PROCESS FOR HANDLE MEASUREMENT." TEXTILE RESEARCH JOURNAL 62: 279-290.
PAN, N., H. S. ZERONIAN AND H. RYU (1993). "AN ALTERNATIVE APPROACH TO THE OBJECTIVE MEASUREMENT OF FABRICS." TEXTILE RESEARCH JOURNAL 63(1): 33-43.
PANARETTO, B. A. (1979). EFFECTS OF LIGHT ON CYCLIC ACTIVITY OF WOOL FOLLICLES AND POSSIBLE RELATIONSHIPS TO CHANGES IN THE PELAGE OF OTHER ANIMALS. PHYSIOLOGICAL AND ENVIRONMENTAL LIMITATIONS TO WOOL GROWTH. J. L. BLACK AND P. J. REIS, UNE PUBLISHING UNIT, ARMIDALE: 327-336.
PARBHU, A. N., W. G. BRYSON AND R. LAL (1999). "DISULFIDE BONDS IN THE OUTER LAYER OF KERATIN FIBERS CONFER HIGHER MECHANICAL RIGIDITY: CORRELATIVE NANO-INDENTATION AND ELASTICITY MEASUREMENT WITH AN AFM." BIOCHEMISTRY 38(36): 11755-11761.
PARRY, A. L., B. W. NORTON AND B. J. RESTALL (1992). "SKIN FOLLICLE DEVELOPMENT IN THE AUSTRALIAN CASHMERE GOAT." AUSTRALIAN JOURNAL OF AGRICULTURAL RESEARCH 43(4): 857-870.
PATTINSON, R. (1981). "WHAT CHARACTERS DETERMINE THE CLEAN PRICE OF WOOL AT AUCTION." WOOL TECHNOLOGY & SHEEP BREEDING JOURNAL 29(3): 93-98.
PEIRCE, F. T. (1930). "THE HANDLE OF CLOTH AS A MEASURABLE QUANTITY." JOURNAL OF THE TEXTILE INSTITUTE (TRANSACTIONS) 21(9): T377-T416.
PERSAUD, D. AND Y. K. KAMATH (2004). "TORSIONAL METHOD FOR EVALUATING HAIR DAMAGE AND PERFORMANCE OF HAIR CARE INGREDIENTS." JOURNAL OF COSMETIC SCIENCE 55: S65-S77.
PETERSON, A. D., A. BRIMS, M. A. BRIMS AND S. G. GHERARDI (1998). "MEASURING THE DIAMETER PROFILE OF SINGLE WOOL FIBRES BY USING THE SINGLE FIBRE ANALYSER (SIFAN)." JOURNAL OF THE TEXTILE INSTITUTE 89(3): 441-448.
PETRIE, O., J., (1995) "HARVESTING OF TEXTILE ANIMAL FIBRES." FAO AGRICULTURAL SERVICES BULLETIN NO. 122 2010.

LXXIII
PHAN, K. (1991). ELECTRON MICROSCOPY AND THE CHARACTERIZATION OF KERATIN FIBRES. AACHEN, COMETT EUROTEX.
PHAN, K. H., S. RUTTEN AND C. POPESCU (2008). "YAK AND SHEEP'S WOOL: THE FIBRES HIDDEN BEHIND CASHMERE." PROCEEDINGS OF THE 4TH INTERNATIONAL CASHMERE/WOOL IDENTIFICATION SYMPOSIUM, ERDOS 49-54.
PHAN, K. H., F. J. WORTMANN AND W. ARNS (1995). "CHARACTERISATION OF CASHMERE." PROCEEDINGS OF THE 9TH INTERNATIONAL WOOL TEXTILE RESEARCH CONFERENCE. VOLUME II: WOOL STRUCTURE & PROPERTIES, PROTEIN CHEMISTRY, FINE ANIMAL FIBRES: 571.
PHAN, K. H., F. J. WORTMANN, G. WORTMANN AND W. ARNS (1988). "CHARACTERISATION OF SPECIALTY ANIMAL FIBRES BY SCANNING ELECTRON MICROSCOPY." SCHRIFTENREIHE DES DEUTSCHEN WOLLFORSCHUNGSINSTITUTES 103: 137-162.
PHAN, K. H., G. WORTMANN AND F. J. WORTMANN (2000). "MICROSCOPIC CHARACTERISTICS OF SHAHTOOSH AND ITS DIFFERENTIATION FROM CASHMERE/PASHMINA." 10TH INTERNATIONAL WOOL TEXTILE RESEARCH CONFERENCE PROCEEDINGS.
PHILLIPS, D. G. (1987). "EFFECTS OF HUMIDITY, AGING, ANNEALING, AND TENSILE LOADS ON THE TORSIONAL DAMPING OF WOOL FIBERS." TEXTILE RESEARCH JOURNAL 57(7): 415-420.
PHILLIPS, T. L., T. J. HORR, M. G. HUSON, P. S. TURNER AND R. A. SHANKS (1995). "IMAGING WOOL FIBER SURFACES WITH A SCANNING FORCE MICROSCOPE." TEXTILE RESEARCH JOURNAL 65(8): 445-453.
PIERLOT, A., P., (1997). "INFLUENCE OF GLASS TRANSITION ON THE FELTING SHRINKAGE OF WOOL FABRIC." TEXTILE RESEARCH JOURNAL 67(8): 616-618.
PLOWMAN, J. E., L. N. PATON AND W. G. BRYSON (2007). "THE DIFFERENTIAL EXPRESSION OF PROTEINS IN THE CORTICAL CELLS OF WOOL AND HAIR FIBRES." EXPERIMENTAL DERMATOLOGY 16(9): 707-714.
POLETTI, G., F. ORSINI, C. LENARDI AND E. BARBORINI (2003). "A COMPARATIVE STUDY BETWEEN AFM AND SEM IMAGING ON HUMAN SCALP HAIR." JOURNAL OF MICROSCOPY-OXFORD 211: 249-255.
POPESCU, C. AND H. HOCKER (2007). "HAIR - THE MOST SOPHISTICATED BIOLOGICAL COMPOSITE MATERIAL." CHEMICAL SOCIETY REVIEWS 36(8): 1282-1291.
POPESCU, C. AND F. J. WORTMANN (2010). WOOL - STRUCTURE, MECHANICAL PROPERTIES AND TECHNICAL PRODUCTS BASED ON ANIMAL FIBRES. INDUSTRIAL APPLICATIONS OF NATURAL FIBRES: STRUCTURE, PROPERTIES AND TECHNICAL APPLICATIONS. J. MUSSIG. WEST SUSSEX, WILEY & SONS, LTD: 255-266.
POSTLE, R., G. A. CARNABY AND S. DEJONG (1988). THE MECHANICS OF WOOL STRUCTURES, ELLIS HORWOOD LIMITED.
POWELL, B. C. AND G. E. ROGERS (1997). THE ROLE OF KERATIN PROTEINS AND THEIR GENES IN THE GROWTH, STRUCTURE AND PROPERTIES OF HAIR. FORMATION AND STRUCTURE OF HUMAN HAIR. P. JOLLES, H. ZAHN AND H. HOCKER. BERLIN, BIRKHAUSER: 59-148.
RAE, A. AND R. BRUCE, EDS. (1973). THE WIRA TEXTILE DATA BOOK. LEEDS, ENGLAND, WIRA.

LXXIV
RAHEEL, M. AND J. LIU (1991). "AN EMPIRICAL-MODEL FOR FABRIC HAND .2. SUBJECTIVE ASSESSMENT." TEXTILE RESEARCH JOURNAL 61(2): 79-82.
RAO, D. R. AND V. B. GUPTA (1991). "PROPERTY STRUCTURE CORRELATIONS IN WOOL FIBERS." TEXTILE RESEARCH JOURNAL 61(10): 609-617.
RAO, D. R., S. PARTHASARATHY AND S. K. CHOPRA (1984). "TORSIONAL STUDIES OF WOOL FIBERS." JOURNAL OF THE TEXTILE INSTITUTE 75(5): 336-341.
REALFF, M. L. AND A. CASCIO (2005). EFFECT OF FIBER FACTORS ON FABRIC HAND. EFFECT OF MECHANICAL AND PHYSICAL PROPERTIES ON FABRIC HAND. H. M. BEHERY, THE TEXTILE INSTITUTE: 197-218.
REIS, R. C., B. N. NAGORCKA, D. A. TUNKS AND S. G. MUNRO (1990). VARIATION OF LENGTH GROWTH RATE AND DIAMETER OF MERINO WOOL FIBRES. 8TH INTERNATIONAL WOOL TEXTILE RESEARCH CONFERENCE, CHRISTCHURCH.
RIPPON, J. A. (1992). THE STRUCTURE OF WOOL. WOOL DYEING. D. M. LEWIS. BRADFORD, SOCIETY OF DYERS AND COLOURISTS: 1-51.
RIPPON, J. A. (2008). FRICTION, FELTING AND SHRINK-PROOFING OF WOOL. FRICTION IN TEXTILE MATERIALS. B. S. GUPTA, WOODHEAD: 253-291.
RIVETT, D. E. (1991). "STRUCTURAL LIPIDS OF THE WOOL FIBER." WOOL SCIENCE REVIEW 67: 1-25.
ROBBINS, C. (2009). "THE CELL MEMBRANE COMPLEX: THREE RELATED BUT DIFFERENT CELLULAR COHESION COMPONENTS OF MAMMALIAN HAIR FIBERS." JOURNAL OF COSMETIC SCIENCE 60(4): 437-465.
ROBBINS, C. R. (1994). CHEMICAL AND PHYSICAL BEHAVIOUR OF HUMAN HAIR, SPRINGER-VERLAG.
ROBBINS, C. R. AND R. J. CRAWFORD (1984). "A METHOD TO EVALUATE HAIR BODY " JOURNAL OF THE SOCIETY OF COSMETIC CHEMISTS 35(7): 369-377.
ROBBINS, C. R. AND R. J. CRAWFORD (1991). "CUTICLE DAMAGE AND THE TENSILE PROPERTIES OF HUMAN HAIR." JOURNAL OF THE SOCIETY OF COSMETIC CHEMISTS 42(1): 59-67.
ROBERTS, N. F. (1956). "THE RELATION BETWEEN THE SOFTNESS OF HANDLE OF WOOL IN THE GREASY AND SCOURED STATES AND ITS PHYSICAL CHARACTERISTICS." TEXTILE RESEARCH JOURNAL 26: 687-697.
ROBERTS, N. F. (1961). "THE EFFECT OF FIBRE THICKNESS, LENGTH AND CRIMP ON WORSTED SPINNING LIMITS, YARN IRREGULARITY AND HANDLE." WOOL TECHNOLOGY & SHEEP BREEDING JOURNAL 8(2): 27-36.
ROBINSON, G. A. (2000). "FIBRE TO FABRIC." AUSTRALIAN SUPERFINE WOOL GROWERS ASSOCIATION NEWSLETTER OCTOBER: 26-27.
ROBINSON, G. A., M. P. CAWOOD AND D. A. DOBSON (1977). KNITTABILITY OF SHORT STAPLE WOOL BLEND YARNS SPUN ON TWO DIFFERENT SYSTEMS AND KNITTED ON A 28 GAUGE SINGLE JERSEY MACHINE. TECHNICAL REPORT NO. 356, SOUTH AFRICAN WOOL TEXTILE RESEARCH INSTITUTE.
ROBINSON, G. A., M. P. CAWOOD AND D. A. DOBSON (1978A). COCKLING IN FULLY-FASHIONED KNITWEAR PART IV: THE EFFECT OF FIBRE DIAMETER, CRIMP AND YARN

LXXV
LINEAR DENSITY. TECHNICAL REPORT NO. 423, SOUTH AFRICAN WOOL TEXTILE RESEARCH INSTITUTE: 1-11.
ROBINSON, G. A., M. P. CAWOOD AND D. A. DOBSON (1978B). THE PHYSICAL PROPERTIES OF LIGHTWEIGHT SINGLE JERSEY FABRICS KNITTED FROM SHORT STAPLE WOO-BLEND YARNS. TECHNICAL REPORT NO. 398, SOUTH AFRICAN WOOL TEXTILE RESEARCH INSTITUTE.
ROBSON, D. (1997). "ANIMAL FIBER ANALYSIS USING IMAGING TECHNIQUES .1. SCALE PATTERN DATA." TEXTILE RESEARCH JOURNAL 67(10): 747-752.
ROBSON, D. (2000). "ANIMAL FIBER ANALYSIS USING IMAGING TECHNIQUES - PART II: ADDITION OF SCALE HEIGHT DATA." TEXTILE RESEARCH JOURNAL 70(2): 116-120.
ROGERS, G. E. (2006). "BIOLOGY OF THE WOOL FOLLICLE: AN EXCURSION INTO A UNIQUE TISSUE INTERACTION SYSTEM WAITING TO BE RE-DISCOVERED." EXPERIMENTAL DERMATOLOGY 15(12): 931-949.
ROLANDO, P. AND P. P. TOWNEND (1962). "THE EFFECTS OF FIBRE QUALITY IN THE HANDLE OF KNITTED WOOL GARMENTS." THE TEXTILE JOURNAL OF AUSTRALIA 37: 705-706.
ROWE, J. B. (2010). "THE AUSTRALIAN SHEEP INDUSTRY - UNDERGOING TRANSFORMATION." ANIMAL PRODUCTION SCIENCE 50(11-12): 991-997.
RUETSCH, S. B., Y. K. KAMATH, L. KINTRUP AND H. J. SCHWARK (2003). "EFFECTS OF CONDITIONERS ON SURFACE HARDNESS OF HAIR FIBERS: AN INVESTIGATION USING ATOMIC FORCE MICROSCOPY." JOURNAL OF COSMETIC SCIENCE 54(6): 579-588.
RUSSELL, I. M. (2009). WOOL AS A NATURAL RENEWABLE FIBRE. ADVANCES IN WOOL TECHNOLOGY. CAMBRIDGE, WOODHEAD PUBLISHING LIMITED: 61-85.
RYDER, M. L. (2001). "WOOL BIOLOGY." TEXTILES MAGAZINE 30(1): 16.
RYDER, M. L. AND S. K. STEPHENSON (1968). WOOL GROWTH, ACADEMIC PRESS, LONDON.
SADAIE, M., N. NISHIKAWA, S. OHNISHI, K. TAMADA, K. YASE AND M. HARA (2006). "STUDIES OF HUMAN HAIR BY FRICTION FORCE MICROSCOPY WITH THE HAIR-MODEL-PROBE." COLLOIDS AND SURFACES B: BIOINTERFACES 51(2): 120-129.
SÁEZ DE IBARRA, Y., J. J. GAITERO, E. ERKIZIA AND I. CAMPILLO (2006). "ATOMIC FORCE MICROSCOPY AND NANOINDENTATION OF CEMENT PASTES WITH NANOTUBE DISPERSIONS." PHYSICA STATUS SOLIDI. A, APPLICATIONS AND MATERIALS SCIENCE 203(6): 1076-1081.
SAWBRIDGE, M. AND J. FORD (1987). TEXTILE FIBRES UNDER THE MICROSCOPE, SHIRLEY INSTITUTE PUBLICATION S.50.
SCHEEPERS, G. E. AND R. I. SLINGER (1968). "THE INFLUENCE OF FIBRE CRIMP FORM ON THE FELTING AND COMPRESSIONAL PROPERTIES OF WOOL." SAWTRI TECHNICAL REPORT NO. 103.
SCHLINK, A. C., J. C. GREEFF, J. EHNI AND R. DENNING (2009). "USING A BENCH-TOP ROTOR SPINNING SYSTEM TO MEASURE VARIATION BETWEEN INDIVIDUAL FLEECES FOR PREDICTING YARN AND FABRIC CHARACTERISTICS." ANIMAL PRODUCTION SCIENCE 49(4): 333-339.

LXXVI
SCOTT, G. V. AND C. R. ROBBINS (1978). "STIFFNESS OF HUMAN HAIR FIBERS." JOURNAL OF THE SOCIETY OF COSMETIC CHEMISTS 29(8): 469-485.
SHAH, S. M. A. AND K. J. WHITELEY (1966). "VARIATIONS IN THE STRESS-STRAIN PROPERTIES OF WOOL FIBRES." JOURNAL OF THE TEXTILE INSTITUTE (TRANSACTIONS) 57(7): 286-293.
SHAH, S. M. A. AND K. J. WHITELEY (1971). "INFLUENCE OF FIBRE CHARACTERISTICS ON TACTILE APPRAISAL OF LOOSE WOOL .1." JOURNAL OF THE TEXTILE INSTITUTE 62(7): 361-374.
SHIM, S. (2003). ANALYTICAL TECHIQUES FOR DIFFERENTIATIONG HUACAYA AND SURI ALPACA FIBERS. PHD PHD THESIS, OHIO STATE UNIVERSITY.
SKELTON, J. (1967). "38-THE EFFECTS OF PLANAR CRIMP IN THE MEASUREMENT OF THE MECHANICAL PROPERTIES OF FIBRES, FILAMENTS, AND YARNS." JOURNAL OF THE TEXTILE INSTITUTE (2004) 58(11): 533-556.
SLINGER, R. I. (1965). "FACTORS INFLUENCING THE RESISTANCE TO COMPRESSION OF WOOL FIBER ENSEMBLES." TEXTILE RESEARCH JOURNAL 35(9): 856-858.
SMITH (1998). "A QUANTITATIVE METHOD FOR ANALYSING AFM IMAGES OF THE OUTER SURFACES OF HUMAN HAIR." JOURNAL OF MICROSCOPY 191(3): 223-228.
SMITH, G. A. (1988). "PROCESSING OF SPECIALITY ANIMAL FIBRES." SCHRIFTENREIHE DES DEUTSCHEN WOLLFORSCHUNGSINSTITUTES E.V 103: 8-21.
SMITH, J. (2009). PROGRAM 2: GENETIC ANALYSIS OF WOOL TRAITS, 2007 DROP INF PROGENY. CRC FOR SHEEP INDUSTRY INNOVATION.
SMITH, J. L., I. W. PURVIS AND M. G. HAIGH (2005). "CRIMP FREQUENCY EFFECTS ON PROCESSING PERFORMANCE OF SUPERFINE WOOL WHEN STAPLE LENGTH IS HELD CONSTANT." INTERNATIONAL JOURNAL OF SHEEP & WOOL SCIENCE 53(2): 1-20.
SMITH, J. L., I. W. PURVIS AND G. J. LEE (2006). "FIBRE DIAMETER PROFILES - POTENTIAL APPLICATIONS FOR IMPROVING FINE-WOOL QUALITY." INTERNATIONAL JOURNAL OF SHEEP & WOOL SCIENCE 54(2): 54-61.
SMITH, J. R. (1997). "USE OF ATOMIC FORCE MICROSCOPY FOR HIGH-RESOLUTION NON-INVASIVE STRUCTURAL STUDIES OF HUMAN HAIR." JOURNAL OF THE SOCIETY OF COSMETIC CHEMISTS 48(4): 199-208.
SMITH, J. R. (2004). CALCULATION OF CUTICLE STEP HEIGHTS FROM AFM IMAGES OF OUTER SURFACES OF HUMAN HAIR. ATOMIC FORCE MICROSCOPY: BIOMEDICAL METHODS AND APPLICATIONS. N. J. CLIFTON. TOTOWA, N.J, HUMANA PRESS. 242.
SMITH, J. R. AND J. A. SWIFT (2002). "LAMELLAR SUBCOMPONENTS OF THE CUTICULAR CELL MEMBRANE COMPLEX OF MAMMALIAN KERATIN FIBRES SHOW FRICTION AND HARDNESS CONTRAST BY AFM." JOURNAL OF MICROSCOPY-OXFORD 206: 182-193.
SMUTS, S., J. LEE AND L. HUNTER (1991). TEXREPORT NO. 3 A REVIEW OF FABRIC OBJECTIVE MEASUREMENT, CSIR: 1-79.
SMUTS, S. AND R. I. SLINGER (1972). "THE INFLUENCE OF FIBRE FRICTION ON THE HANDLE OF WOOL AND MOHAIR." SAWTRI TECHNICAL REPORT(163): 1-5.
SNEDDON, I. (1965). "THE RELATION BETWEEN LOAD AND PENETRATION ION THE AXISYMMETRIC BOUSSINESQ PROBLEM FOR A PUNCH OF ARBITRARY PROFILE." INTERNATIONAL JOURNAL OF ENGINEERING SCIENCE 3: 47-57.

LXXVII
SOMVANSHI, R., G. L. KOUL AND J. C. BISWAS (1994). "LIGHT AND ELECTRON-MICROSCOPIC STUDY OF INDIAN PASHMINA (CASHMERE) FIBER." INDIAN JOURNAL OF ANIMAL SCIENCES 64(2): 189-193.
SPEAKMAN, J. B. AND E. STOTT (1931). "A CONTRIBUTION TO THE THEORY OF MILLING. PART I : A METHOD FOR MEASURING THE SCALINESS OF WOOL FIBRES." JOURNAL OF THE TEXTILE INSTITUTE (TRANSACTIONS) 22(6): T339-T348.
SPEAKMAN, J. B., E. STOTT AND H. CHANG (1933). "A CONTRIBUTION TO THE THEORY OF MILLING." JOURNAL OF THE TEXTILE INSTITUTE (TRANSACTIONS) 24(7): T273-T292.
STANKOVIC, S. B. (2008). "COMPRESSION HYSTERESIS OF FIBROUS SYSTEMS." POLYMER ENGINEERING AND SCIENCE 48(4): 676-682.
STAPLETON, I. W. (1992). ALPACA AS A TEXTILE FIBRE: FACT OR FICTION - A REVIEW AND INTERPRETATION OF PUBLISHED RESEARCH FINDINGS ON ALPACA, TEXTILE & FIBRE RESEARCH INSTITUTE.
STEVENS, D. (1994). HANDLE: SPECIFICATIONS AND EFFECTS. WOOL SPEC 94: SPECIFICATION OF AUSTRALIAN WOOL AND ITS IMPLICATIONS FOR MARKETING AND PROCESSING, CSIRO DIVISION OF WOOL TECHNOLOGY & INTERNATIONAL WOOL SECRETARIAT, SYDNEY AUSTRALIA.
STEVENS, D. AND D. W. CROWE (1994). STYLE AND PROCESSING EFFECTS. WOOLSPEC 94: PROCEEDINGS OF A SEMINAR ON SPECIFICATIONS OF AUSTRALIAN WOOL AND ITS IMPLICATIONS FOR MARKETING AND PROCESSING: E1-E13.
STEVENS, D. AND T. J. MAHAR (1995). "THE BENEFICIAL EFFECTS OF LOW FIBRE CRIMP IN WORSTED PROCESSING AND ON FABRIC PROPERTIES AND FABRIC HANDLE." PROCEEDINGS OF THE 9TH INTERNATIONAL WOOL TEXTILE RESEARCH CONFERENCE. VOLUME V: GARMENT MANUFACTURE & RELATED PROPERTIES -- MECHANICAL PROCESSING 5: 134-142.
STEWART, R. G., ED. (1983). WOOL SCOURING AND ALLIED TECHNOLOGY, CAXTON PRESS.
STRUIK, L. C. (1978). PHYSICAL AGING IN AMORPHOUS POLYMERS AND OTHER MATERIALS, ELSEVIER.
STYLIOS, G. K. (2005). "NEW MEASUREMENT TECHNOLOGIES FOR TEXTILES AND CLOTHING." INTERNATIONAL JOURNAL OF CLOTHING SCIENCE AND TECHNOLOGY 17(3-4): 135-149.
SULAR, V. AND A. OKUR (2007). "SENSORY EVALUATION METHODS FOR TACTILE PROPERTIES OF FABRICS." JOURNAL OF SENSORY STUDIES 22(1): 1-16.
SULAR, V. AND A. OKUR (2008). OBJECTIVE EVALUATION OF FABRIC HANDLE BY SIMPLE MEASUREMENT METHODS. TEXTILE RESEARCH JOURNAL. 78: 856-868.
SUMNER, R. M. W. (2009). "RELATIONSHIPS BETWEEN SOFTNESS AND FELTABILITY WITH CUTICLE SCALE PATTERN AND FIBRE DIMENSIONS WITHIN INDIVIDUAL FLEECES FROM SIX BREEDS OF SHEEP." INTERNATIONAL JOURNAL OF SHEEP & WOOL SCIENCE 57(1).
SUMNER, R. M. W. AND M. L. BIGHAM (1993). "BIOLOGY OF FIBER GROWTH AND POSSIBLE GENETIC AND NONGENETIC MEANS OF INFLUENCING FIBER GROWTH IN SHEEP AND GOATS - A REVIEW." LIVESTOCK PRODUCTION SCIENCE 33(1-2): 1-29.
SUNG, V. (2011). "THE CHANGING TREND IN GLOBAL FIBRE CONSUMPTION." TEXTILE ASIA 42: 8-9.

LXXVIII
SWAN, P. G. (1993). PHD THESIS OBJECTIVE MEASUREMENT OF FIBRE CRIMP CURVATURE AND THE BULK COMPRESSIONAL PROPERTIES OF AUSTRALIAN WOOLS PHD THESIS, UNIVERSITY OF NEW SOUTH WALES.
SWAN, P. G. (1994). FIBRE SPECIFICATION AND STAPLE STRUCTURE. WOOLSPEC 94 PROCEEDINGS OF A SEMINAR ON SPECIFICATION OF AUSTRALIAN WOOL AND ITS IMPLICATIONS FOR MARKETING AND PROCESSING: G1-G12.
SWAN, P. G. (2010). THE FUTURE OF WOOL AS AN APPAREL FIBRE. INTERNATIONAL SHEEP AND WOOL HANDBOOK. NOTHINGHAM, NOTHINGHAM UNIVERSITY PRESS.
SWIFT, J. A. (1991). "FINE DETAILS ON THE SURFACE OF HUMAN HAIR." INTERNATIONAL JOURNAL OF COSMETIC SCIENCE 13(3): 143-159.
SWIFT, J. A. (1995). "SOME SIMPLE THEORETICAL CONSIDERATIONS ON THE BENDING STIFFNESS OF HUMAN HAIR." INTERNATIONAL JOURNAL OF COSMETIC SCIENCE 17: 245-253.
SWIFT, J. A. (1997). MORPHOLOGY AND HISTOCHEMISTRY OF HUMAN HAIR. FORMATION AND STRUCTURE OF HUMAN HAIR. P. JOLLES, H. ZAHN AND H. HÖCKER. BASEL, BIRKHÄUSER VERLAG: 149-175.
SWIFT, J. A. (2000). "THE CUTICLE CONTROLS BENDING STIFFNESS OF HAIR." JOURNAL OF COSMETIC SCIENCE 51(1): 37-38.
SWIFT, J. A. AND J. R. SMITH (2000). "ATOMIC FORCE MICROSCOPY OF HUMAN HAIR." SCANNING 22(5): 310-318.
SWINBURN, D. J., R. M. LAING AND B. E. NIVEN (1995). DEVELPMENT OF ALPACA AND ALPACA/WOOL BLEND KNITWEAR FABRICS. THE 9TH INTERNATIONAL WOOL TEXTILE RESEARCH CONFERENCE. BIELLA.
TEASDALE, D. (1986). "RESISTANCE TO COMPRESSION -- A CANDIDATE FOR SALE BY DESCRIPTION." WOOL TECHNOLOGY & SHEEP BREEDING JOURNAL 34(4): 139.
TEASDALE, D. (1995). THE WOOL HANDBOOK - THE A TO Z OF FIBRE TO TOP, AWEX.
TEASDALE, D. C., R. M. DOUGLAS, M. K. HOGAN AND I. A. BRETT (1985). AUSTRALIAN CASHMERE: ITS MEASUREMENT AND CHARACTERISATION. THE 7TH INTERNATIONAL WOOL TEXTILE RESEARCH CONFERENCE, TOKYO.
TESTER, D. H. (1987). "FINE-STRUCTURE OF CASHMERE AND SUPERFINE MERINO WOOL FIBERS." TEXTILE RESEARCH JOURNAL 57(4): 213-219.
TESTER, D. H., L. J. SMITH, U. K. DAS AND C. A. FOLEY (1986). A COMPARISON OF CASHMERE AND WOOL FABRICS: FINISHING RESPONSE AND MECHANICAL PROPERTIES, CSIRO DIVISION OF TEXTILE PHYSICS, LABORATORY NOTE SN/108.
THOMPSON, A. C. T., M. L. HEBART, N. M. PENNO AND P. I. HYND (2007). PERINATAL WOOL FOLLICLE ATTRITION COINCIDES WITH ELEVATED PERINATAL CIRCULATING CORTISOL CONCENTRATION IN MERINO SHEEP. 58: 748-752.
THOMPSON, A. N. AND P. I. HYND (2009). "STRESS-STRAIN PROPERTIES OF INDIVIDUAL MERINO WOOL FIBRES ARE MINOR CONTRIBUTORS TO VARIATIONS IN STAPLE STRENGTH INDUCED BY GENETIC SELECTION AND NUTRITIONAL MANIPULATION." ANIMAL PRODUCTION SCIENCE 49(8): 668-674.
LXXIX
TITCOMBE, L. A., M. G. HUSON AND P. S. TURNER (1997). "IMAGING THE INTERNAL CELLULAR STRUCTURE OF MERINO WOOL FIBRES USING ATOMIC FORCE MICROSCOPY." MICRON 28(1): 69-71.
TITZE, I. R. AND E. J. HUNTER (2004). "NORMAL VIBRATION FREQUENCIES OF THE VOCAL LIGAMENT." JOURNAL OF THE ACOUSTIC SOCIETY OF AMERICA 115(5): 2264-2269.
TM 136 WOOLMARK TEST METHOD. (2000). DICHLOROMETHANE EXTRACTABLE MATTER. THE WOOLMARK COMPANY.
TONIN, C., M. BIANCHETTO, C. VINEIS AND M. F. BIANCHET (2002). "DIFFERENTIATING FINE HAIRS FROM WILD AND DOMESTIC SPECIES: INVESTIGATIONS OF SHATOOSH, YANGIR, AND CASHMERE FIBERS." TEXTILE RESEARCH JOURNAL 72(8): 701.
TRANCHIDA, D., Z. KIFLIE, S. ACIERNO AND S. PICCAROLO (2009). "NANOSCALE MECHANICAL CHARACTERIZATION OF POLYMERS BY ATOMIC FORCE MICROSCOPY (AFM) NANOINDENTATIONS: VISCOELASTIC CHARACTERIZATION OF A MODEL MATERIAL." MEASUREMENT SCIENCE & TECHNOLOGY 20(9).
TRANCHIDA, D., S. PICCAROLO AND M. SOLIMAN (2006). "NANOSCALE MECHANICAL CHARACTERIZATION OF POLYMERS BY AFM NANOINDENTATIONS: CRITICAL APPROACH TO THE ELASTIC CHARACTERIZATION." MACROMOLECULES 39(13): 4547-4556.
TU, C. F. AND T. FORT (2004). "A STUDY OF FIBER-CAPSTAN FRICTION. 1. STRIBECK CURVES." TRIBOLOGY INTERNATIONAL 37(9): 701-710.
TUCKER, D. J., A. H. F. HUDSON, G. V. OZOLINS, D. E. RIVETT AND L. N. JONES (1988). "SOME ASPECTS OF THE STRUCTURE AND COMPOSITION OF SPECIALTY ANIMAL FIBRES." SCHRIFTENREIHE DES DEUTSHCES WOLLFORSCHUNGSINSTITUTES E.V PROCEEDINGS OF THE 1ST INTERNATIONAL SYMPOSIUM ON SPECIALTY ANIMAL FIBRES 103: 71-103.
TUCKER, D. J., D. E. RIVETT, B. J. RESTALL AND A. H. F. HUDSON (1985). "NON-PROTEIN COMPONENTS OF THE CASHMERE FIBRE." PROCEEDINGS OF THE 7TH INTERNATIONAL WOOL TEXTILE RESEARCH CONFERENCE, TOKYO, 1985. VOLUME II.: 223-235.
TUCKWELL, C. (1994) "THE PERUVIAN ALPACA INDUSTRY." 50P.
VALBONESI, A., S. CRISTOFANELLI, F. PIERDOMINICI, M. GONZALES AND M. ANTONINI (2010). "COMPARISON OF FIBER AND CUTICULAR ATTRIBUTES OF ALPACA AND LLAMA FLEECES." TEXTILE RESEARCH JOURNAL 80(4): 344-353.
VAN DER SLUIJS., S. G. GORDON AND R. L. LONG (2008). "A SPINNER'S PERSPECTIVE ON FIBRE FINENESS AND MATURITY." THE AUSTRALIAN COTTON GROWER(FEBRUARY/MARCH): 30-32.
VAN WYK, C. M. (1946). "A STUDY OF THE COMPRESSIBILITY OF WOOL, WITH SPECIAL REFERENCE TO SOUTH AFRICAN MERINO WOOL." ONDERSTEPOORT JOURNAL OF VETERINARY SCIENCE 21: 99-226.
VANLANDINGHAM, M. R., J. S. VILLARRUBIA, W. F. GUTHRIE AND G. F. MEYERS (2001). "NANOINDENTATION OF POLYMERS: AN OVERVIEW." MACROMOLECULAR SYMPOSIA. 167(1): 15-44.
VARLEY, A. R. (2006). "A MODIFIED METHOD OF CUTICLE SCALE HEIGHT DETERMINATION FOR ANIMAL FIBERS." AATCC REVIEW 6(5): 39-42.

LXXX
VARSHNEY, R. K., V. K. KOTHARI AND S. DHAMIJA (2011). "INFLUENCE OF POLYESTER FIBRE FINENESS AND CROSS-SECTIONAL SHAPE ON LOW-STRESS CHARACTERISTICS OF FABRICS." JOURNAL OF THE TEXTILE INSTITUTE 102(1): 31-40.
VELDSMAN, D. P. AND C. C. KRITZINGER (1960). "93--STUDIES ON THE FELTING PROPERTIES OF SOUTH AFRICAN MERINO WOOLS." JOURNAL OF THE TEXTILE INSTITUTE (TRANSACTIONS) 51(12): T1257-T1273.
VILLARROEL, J. (1959). A STUDY OF ALPACA FIBRE. MASTER OF SCIENCE, UNIVERSITY OF NEW SOUTH WALES.
VINEY, C. (2002). FRACTURE OF NATURAL POLYMERIC FIBERS. FIBER FRACTURE. M. ELICES AND J. LLORCA. AMSTERDAM, ELSEVIER: 303-328.
VON BERGEN, W. AND W. KRAUSS (1949). TEXTILE FIBER ATLAS, TEXTILE BOOK PUBLISHERS, INC.
VON BERGEN, W. AND J. P. STEVENS (1963). SPECIALTY HAIR FIBRES. WOOL HANDBOOK. W. VON BERGEN, INTERSCIENCE PUBLISHERS. 1: 315-450.
VON BERGEN, W. AND J. H. WAKELIN (1952). "PROPERTIES OF APPAREL WOOLS." TEXTILE RESEARCH JOURNAL 22(2): 123-137.
WAGNER, R. AND I. JOEKES (2007). "HAIR MEDULLA MORPHOLOGY AND MECHANICAL PROPERTIES." JOURNAL OF COSMETIC SCIENCE 58: 359-368.
WANG, H., X. LIU AND X. WANG (2005). "INTERNAL STRUCTURE AND PIGMENT GRANULES IN COLORED ALPACA FIBERS." FIBERS AND POLYMERS 6(3): 263-268.
WANG, H., T. MAHAR, X. LIU AND X. WANG (2007). "MEASUREMENT PRECISION AND EVALUATION OF THE DIAMETER PROFILES OF SINGLE WOOL FIBERS." TEXTILE RESEARCH JOURNAL 77(12): 981-991.
WANG, H., T. J. MAHAR AND R. HALL (2012). "PREDICTION OF THE HANDLE CHARACTERISTICS OF LIGHTWEIGHT NEXT-TO-SKIN KNITTED FABRICS USING A FABRIC EXTRACTION TECHNIQUE." JOURNAL OF THE TEXTILE INSTITUTE 103(7): 691-697.
WANG, H., T. J. MAHAR, N. PAN AND R. POSTLE (2008). OBJECTIVE HANDLE EVALUATION OF NEXT-TO-SKIN FABRICS KNITTED FROM MERINO WOOL. 86TH TEXTILE INSTITUTE WORLD CONFERENCE, FASHION AND TEXTILES: HEADING TOWARDS NEW HORIZONS, VOL 3, CONFERENCE PROCEEDINGS: 347-365.
WANG, L., X. LIU AND X. WANG (2004). CHANGES IN FIBRE CURVATURE DURING THE PROCESSING OF WOOL AND ALPACA FIBRES AND THEIR BLENDS. 83RD WORLD CONFERENCE OF THE TEXTILE INSTITUTE, QUALITY TEXTILES FOR QUALITY LIFE. SHANGHAI: 449-452.
WANG, L., A. SINGH AND X. WANG (2008A). "DEHAIRING AUSTRALIAN ALPACA FIBRES WITH A CASHMERE DEHAIRING MACHINE." JOURNAL OF THE TEXTILE INSTITUTE 99(6): 539-544.
WANG, L., A. SINGH AND X. WANG (2008B). "A STUDY ON DEHAIRING AUSTRALIAN GREASY CASHMERE." FIBERS AND POLYMERS 9(4): 509-514.
WANG, L., X. WANG AND X. LIU (2005). WOOL AND ALPACA FIBRE BLENDS. 11TH INTERNATIONAL WOOL RESEARCH CONFERENCE. LEEDS, ENGLAND, UNIVERSITY OF LEEDS.

LXXXI
WANG, L. J., T. LIN, X. G. WANG AND A. KAYNAK (2005). "FRICTIONAL AND TENSILE PROPERTIES OF CONDUCTING POLYMER COATED WOOL AND ALPACA FIBERS." FIBERS AND POLYMERS 6(3): 259-262.
WANG, L. J., A. SINGH AND X. G. WANG (2006). USE OF CASHMERE DEHAIRING TECHNOLOGY FOR COARSE ALPACA FIBERS. PROCEEDINGS OF 2006 CHINA INTERNATIONAL WOOL TEXTILE CONFERENCE & IWTO WOOL FORUM. M. YAO: 8-12.
WANG, X., L. CHANG AND B. MCGREGOR (2006). THE HAIRINESS OF WORSTED WOOL AND CASHMERE YARNS AND THE IMPACT OF FIBER CURVATURE ON HAIRINESS. 76: 281-287.
WANG, X., L. WANG AND X. LIU (2003). THE QUALITY AND PROCESSING PERFORMANCE OF ALPACA FIBRES. RURAL INDUSTRIES RESEARCH AND DEVELOPMENT CORPORATION, RIRDC PUBLICATION NO. 03/128.
WARNER, S. B. (1995). FIBRE SCIENCE, PRENTICE-HALL, INC.
WATSON, M. T. AND E. V. MARTIN (1966). "SOME TENSILE PROPERTIES OF SPECIALTY HAIR FIBRES." TEXTILE RESEARCH JOURNAL(6): 1112-1113.
WATSON, N., N. JACKSON AND K. J. WHITELEY (1977). "INHERITANCE OF RESISTANCE TO COMPRESSION PROPERTY OF AUSTRALIAN MERINO WOOL AND ITS GENETIC CORRELATION WITH FOLLICLE CURVATURE AND VARIOUS WOOL AND BODY CHARACTERS." AUSTRALIAN JOURNAL OF AGRICULTURAL RESEARCH 28(6): 1083-1094.
WEISENHORN, A. L., M. KHORSANDI, S. KASAS, V. GOTZOS AND H. J. BUTT (1993). "DEFORMATION AND HEIGHT ANOMALY OF SOFT SURFACES STUDIED WITH AN AFM." NANOTECHNOLOGY 4(2): 106-113.
WHITELEY, K. J. (1963). "1--THE STRESS-STRAIN PROPERTIES OF FELTING WOOLS." JOURNAL OF THE TEXTILE INSTITUTE (TRANSACTIONS) 54(1): T1-T8.
WHITELEY, K. J. AND E. BALASUBRAMANIAM (1965). THE ORIGIN AND SIGNIFICANCE OF CRIMP CONFIGURATION OF SINGLE FIBRES. THIRD INTERNATIONAL WOOL TEXTILE RESEARCH CONFERENCE, PARIS.
WHITELEY, K. J., M. C. CAMPBELL, C. SIU AND V. G. KULKARNI (1975). MECHANICAL AND CHEMICAL PROPERTIES OF WOOL FIBRES EXHIBITING EXTREME VARIATION IN CHEMICAL COMPOSITION AND CRIMP FORM. PROCEEDINGS OF THE 5TH INTERNATIONAL WOOL TEXTILE RESEARCH CONFERENCE, AACHEN.
WHITELEY, K. J., N. R. WATSON AND O. D. WILKINS (1978). "THE RELATIONSHIP BETWEEN RESISTANCE TO COMPRESSION OF WOOL BULKS AND FOLLICLE CURVATURE." JOURNAL OF THE TEXTILE INSTITUTE 69(2-3): 41-48.
WHITELEY, K. J., S. J. WELSMAN, J. H. STANTON AND R. PATTINSON (1986). "I - OBSERVATIONS ON THE CHARACTERISTICS OF AUSTRALIAN GREASY WOOL PART VI: THE RESISTANCE TO COMPRESSION OF MERINO FLEECE WOOLS." JOURNAL OF THE TEXTILE INSTITUTE 77(1): 1-8.
WILDMAN, A. B. (1954). THE MICROSCOPY OF ANIMAL TEXTILE FIBRES : INCLUDING METHODS FOR THE COMPLETE ANALYSIS OF FIBRE BLENDS. LEEDS, WOOL INDUSTRIES RESEARCH ASSOCIATION.
WILKINS, O. D., K. J. WHITELEY AND J. H. STANTON (1981). AUSTRALIAN SUPERFINE WOOLS - FIBRE DIAMETER, STAPLE CRIMP FREQUENCY AND RESISTANCE TO COMPRESSION CHARACTERISTICS. IWTO REPORT N. 6 (CHRISTCHURCH).

LXXXII
WILLIAMS, A. C., H. G. M. EDWARDS AND B. W. BARRY (1994). "RAMAN SPECTRA OF HUMAN KERATOTIC BIOPOLYMERS: SKIN, CALLUS, HAIR AND NAIL." JOURNAL OF RAMAN SPECTROSCOPY 25(1): 95-98.
WILLIAMS, A. J. (1991). WOOL GROWTH. AUSTRALIAN SHEEP AND WOOL HANDBOOK. D. J. COTTLE. MELBOURNE, INKATA PRESS: 224-241.
WOOD, E. (1999). "TANGLING WITH WOOL SERIES: 1. THE 'EWENIQUE' FIBRE FACTORY." WOOL TECHNOLOGY & SHEEP BREEDING JOURNAL 47(3): 199-204.
WOOD, E. (2003). "TEXTILE PROPERTIES OF WOOL AND OTHER FIBRES." WOOL TECHNOLOGY & SHEEP BREEDING JOURNAL 51(3): 272-290.
WOODS, H. J. (1935). "CRIMP FORMS IN MERINO WOOL FIBRES: 1--DESCRIPTIVE." JOURNAL OF THE TEXTILE INSTITUTE (TRANSACTIONS) 26(3): T93-T110.
WORTMANN, F. J. (1991). "QUANTITATIVE FIBER MIXTURE ANALYSIS BY SCANNING ELECTRON-MICROSCOPY .3. ROUND TRIAL RESULTS ON MOHAIR WOOL BLENDS." TEXTILE RESEARCH JOURNAL 61(7): 371-374.
WORTMANN, F. J. AND W. ARNS (1986). "QUANTITATIVE FIBER MIXTURE ANALYSIS BY SCANNING ELECTRON MICROSCOPY. PART 1: BLENDS OF MOHAIR AND CASHMERE WITH SHEEP'S WOOL " TEXTILE RESEARCH JOURNAL 56(7): 442-446.
WORTMANN, F. J. AND P. AUGUSTIN (2004). "QUANTITATIVE FIBER MIXTURE ANALYSIS BY SCANNING ELECTRON MICROSCOPY - PART VII: MODELING THE MICROSCOPIC ANALYSIS OF BINARY ANIMAL FIBER BLENDS." TEXTILE RESEARCH JOURNAL 74(3): 248-252.
WORTMANN, F. J. AND K. H. PHAN (1999). "CUTICLE SCALE HEIGHTS OF WOOL AND SPECIALTY FIBERS AND THEIR CHANGES DUE TO TEXTILE PROCESSING." TEXTILE RESEARCH JOURNAL 69(2): 139-144.
WORTMANN, F. J., K. H. PHAN AND P. AUGUSTIN (2003A). "QUANTITATIVE FIBER MIXTURE ANALYSIS BY SCANNING ELECTRON MICROSCOPY - PART V: ANALYZING PURE FIBER SAMPLES AND SAMPLES WITH SMALL ADMIXTURES ACCORDING TO TEST METHOD IWTO-58." TEXTILE RESEARCH JOURNAL 73(8): 727-732.
WORTMANN, F. J., K. H. PHAN AND P. AUGUSTIN (2003B). "QUANTITATIVE FIBER MIXTURE ANALYSIS BY SCANNING ELECTRON MICROSCOPY - PART VI: POSSIBILITIES AND LIMITATIONS OF THE ANALYSIS OF BINARY SPECIALTY FIBER/WOOL BLENDS IN VIEW OF TEST METHOD IWTO-58." TEXTILE RESEARCH JOURNAL 73(9): 781-786.
WORTMANN, F. J. AND A. SCHWANN-JONCZYK (2006). "INVESTIGATING HAIR PROPERTIES RELEVANT FOR HAIR 'HANDLE'. PART 1: HAIR DIAMETER, BENDING AND FRICTIONAL PROPERTIES." INTERNATIONAL JOURNAL OF COSMETIC SCIENCE 28: 61-68.
WORTMANN, F. J. AND G. WORTMANN (1992). "QUANTITATIVE FIBER MIXTURE ANALYSIS BY SCANNING ELECTRON-MICROSCOPY .4: ASSESSMENT OF LIGHT-MICROSCOPY AS AN ALTERNATIVE TOOL FOR ANALYZING WOOL SPECIALTY FIBER BLENDS." TEXTILE RESEARCH JOURNAL 62(7): 423-431.
WORTMANN, F. J., G. WORTMANN AND W. ARNS (1989). "QUANTITATIVE FIBER MIXTURE ANALYSIS BY SCANNING ELECTRON-MICROSCOPY .2. BLENDS OF WOOL WITH ANGORA RABBIT HAIR." TEXTILE RESEARCH JOURNAL 59(2): 73-80.
WORTMANN, F. J., G. WORTMANN AND R. GREVEN (2000). "MECHANICAL PROFILOMETRY OF WOOL AND MOHAIR FIBERS." TEXTILE RESEARCH JOURNAL 70(9): 795-801.

LXXXIII
WORTMANN, F. J. AND H. ZAHN (1994). "THE STRESS/STRAIN CURVE OF Α-KERATIN FIBERS AND THE STRUCTURE OF THE INTERMEDIATE FILAMENT." TEXTILE RESEARCH JOURNAL 64(12): 737-743.
WULIJI, T., G. H. DAVIS, R. N. ANDREWS, P. TURNER, G. H. MOORE AND K. G. DODDS (1992). "FIBER PRODUCTION, SHEARING PROCEDURE AND FLEECE CHARACTERISTICS OF ALPACAS FARMED IN NEW-ZEALAND." PROCEEDINGS OF THE NEW ZEALAND SOCIETY OF ANIMAL PRODUCTION, VOL 52 1992 52: 289-292.
YICK, K.-L., K. P. S. CHENG, R. C. DHINGRA AND Y. L. HOW (1996). COMPARISON OF MECHANICAL PROPERTIES OF SHIRTING MATERIALS MEASURED ON THE KES-F AND FAST INSTRUMENTS. 66: 622-633.
YIN, N. E., R. H. KISSINGER, W. S. TOLGYESI AND E. M. COTTINGTON (1977). "THE EFFECT OF FIBER DIAMETER ON THE COSMETIC ASPECTS OF HAIR." JOURNAL OF THE SOCIETY OF COSMETIC CHEMISTS 28: 139-150.
YOU, H. AND L. YU (1997). "ATOMIC FORCE MICROSCOPY AS A TOOL FOR STUDY OF HUMAN HAIR." SCANNING 19(6): 431-437.
YU, W. D. AND Y. Q. LIU (2006). "SOFTNESS EVALUATION OF KERATIN FIBERS BASED ON SINGLE-FIBER BENDING TEST." JOURNAL OF APPLIED POLYMER SCIENCE 101(1): 701-707.
ZAHN, H. AND G. BLANKENBURG (1962). "THE INFLUENCE OF WEATHERING ON SOME CHEMICAL AND PHYSICAL PROPERTIES OF WOOL FIBERS, WITH PARTICULAR REFERENCE TO FELTING." TEXTILE RESEARCH JOURNAL 32(12): 986-997.
ZHANG, P. H., X. LIU, L. J. WANG AND X. G. WANG (2006). "AN EXPERIMENTAL STUDY ON FABRIC SOFTNESS EVALUATION." INTERNATIONAL JOURNAL OF CLOTHING SCIENCE AND TECHNOLOGY 18(1-2): 83-95.