fiber reinforced plastic durability: nonlinear multi …€¦ · · 2015-08-28fiber reinforced...
TRANSCRIPT

Page 1
FIBER REINFORCED PLASTIC DURABILITY: NONLINEAR MULTI-SCALE MODELING FOR STRUCTURAL PART LIFE PREDICTIONS
Benoît Bidaine, Laurent Adam, Roger Assaker e-Xstream engineering
Gilles Robert, Olivier Moulinjeune, Laurent Perret Solvay Engineering Plastics
Pierre Charrier, Denis Taveau, Ludovic Chauvet TrelleborgVibracoustic
Sarra Haouala, Anouar Krairi, Issam Doghri Université Catholique de Louvain
Jean-François Luye Promold
Abstract To make the next generation of lightweighting come through, engineers undertake
increasingly deep simulation of composite performances during the part design phase. After having considered stiffness and failure predictions, they are now eager to tackle fiber reinforced plastic (FRP) durability, accounting simultaneously for FRP manufacturing process and nonlinear behavior. To address their interest, e-Xstream engineering has joined DURAFIP, a collaborative R&D project involving 14 academic and industrial French and Belgian partners. Among others, this project has given birth to dedicated material models combined to micromechanical and phenomenological fatigue criteria as well as to their interface with appropriate software describing complimentary aspects (manufacturing process and structural behavior). Hence, it paves the way for a nonlinear multi-scale modeling workflow accurately predicting structural part life. As outlined by this paper, this workflow will constitute an efficient composite life assessment solution, original with respect to previous extrapolations of metal fatigue approaches. Indeed it relies on direct nonlinear mechanical simulation, more representative for the actual nature of polymers.
We have applied this workflow to a beam demonstrator employed at Solvay and to a simplified beam model. First we have calibrated linear and nonlinear material models, such as the ones developed at Université Catholique de Louvain and e-Xstream engineering, from a limited amount of experimental data. Then we have coupled it to finite element analyses (FEA) of the beam, taking advantage of local fiber orientation predictions from injection molding simulations optimized by Promold, an SME specialized in this field. These FEA have provided realistic life predictions – i.e., within experimental variability – for constant amplitude cyclic loadings. Above all, they have required reasonable computing resources. Such FEA efficiently account for the spatial variability of material properties, both in terms of stresses and life (time-decreasing strengths). They proceed from the calibration of material models taking into account the local stress state which cannot be measured experimentally. They drive reductions in prototyping and design costs related to the structural durability of a component, one of the most expensive attributes to test. To further characterize their applicability, we are currently applying such nonlinear multi-scale modeling workflow to an industrial part designed by TrelleborgVibracoustic. We will also investigate how to extend this workflow to address life measurement variability and more complex loadings.

Page 2
Introduction The automotive industry is striving to meet targets for reducing fuel consumption and
emissions by introducing lightweight vehicle components or even, more recently, by switching to lightweight materials for car bodies. Composite materials give to car makers the opportunity to produce such new lightweight structures because of the inherent properties, such as high strength to mass ratio, high stiffness to mass ratio. However, their introduction increases the complexity of a new program development, introducing new challenges, from the manufacturing step to the design step. The development of composites in automotive is driven by the need for low costs and high production rates. Indeed, when the aeronautic industry produces hundreds of airplanes in a year, the automotive industry must produce hundreds of cars in a day to remain profitable. Another challenge that the automotive industry is facing is that, during a new car development, the design may change every week, generating a complete review of previous technology choices. Defining or targeting a new performance can have an impact on the choice of material which can have an impact on the manufacturing process, and any new decision must be applied in a very short time.
Of course, the development of CAE methodology has dramatically helped to meet these challenges, especially in the last 30 years when metallic materials were still the reference. However, new technologies are emerging to support the development of the composite components accounting for their specific behavior. Indeed, such materials exhibit different properties with respect to metals. In particular, their non-linearity and anisotropy are not straightforward to simulate and depend directly on the manufacturing process used. In addition, the targeted performance is driven by the choice of reinforcement, from short-fiber reinforced plastics (SFRP) for semi-structural components to continuous-fiber reinforced polymers (CFRP) or even woven reinforced polymer for structural components.
Starting from this situation, the Digimat software aims at bridging the gap between manufacturing process and structural simulations. After 10 years of development, this platform proposes now a comprehensive approach to model and simulate any type of composite material accounting for the manufacturing process effect and targeting any type of performance (cf. Figure 1).
SFRP are present in the car constitution for many years now and appear to be most mature technology regarding composite materials. Many components are made of SFRP among them, exhaust manifold, low B-pillar, sun roof bearing, engine mount and of course interior components. Associated manufacturing process is injection molding, resulting in a wide range of local fiber orientation affecting the local mechanical properties. Digimat provides all the tools to calibrate the non-linear material properties of the SFRP and to perform multi-scale analysis that account for this local orientation without seeing composite as a black metal. This approach has proven the only one empowering the designer to take the best of composite properties. Using the technology embedded in Digimat, designers can perform any type of analyses requested to verify the safety behavior of the component, from modal analyses for NVH application [1], to explicit analyses for crash application requiring to account for the strain rate dependent failure behavior [2]. Another strong need from the automotive industry, also covered by Digimat as outlined by the present paper, is the fatigue and durability prediction of such materials.

Page 3
More recently, and always in the objective to decrease the global weight of the vehicle while ensuring the respect of the safety standards from regulatory agencies, CFRP are now used in the body vehicle design. A crucial step for implementing CFRP into production parts is the ability to accurately predict and characterize the failure mechanisms of such material. In particular, the microstructure of laminates creates very complex failure mechanisms such as matrix cracking, fiber breaking, and delamination. Digimat contains a complete framework to handle the progressive damage behavior of CFRP [3]. This framework, initially defined for unidirectional reinforcement has been extended to any type of woven reinforcements and can be used up to crash application. In the case of woven, the effect of the manufacturing process, i.e., draping, can be accounted for by computing local stiffness with respect of each warp and weft orientations [4].
Finally, as new material systems are emerging and are entering in the design of the vehicle, the Digimat platform follows also this trend with the objective to link the manufacturing effects to the final performance of the part. For instance, braided, used in the body of the BMW i3 can be modeled by the software and Discontinuous Fiber Composites (DFC), shaped by a compression molding process, can be analyzed accounting for the specific orientation of each composite chip.
Figure 1: Digimat offers a comprehensive approach to model and simulate any type of composite material
accounting for the manufacturing process effect and targeting any type of performance. The present paper aims at illustrating how multi-scale material modeling can be applied to
high-cycle fatigue (HCF) simulation, as investigated in the framework of the European project DURAFIP dedicated to the durability of reinforced polyamides [5]. This paper presents first the main characteristics of composites submitted to fatigue loadings. Then it introduces material models relevant to cyclic loading simulations, including a phenomenological fatigue model available in Digimat and explains their application on the fatigue life prediction of SFRP beams.
Page 4
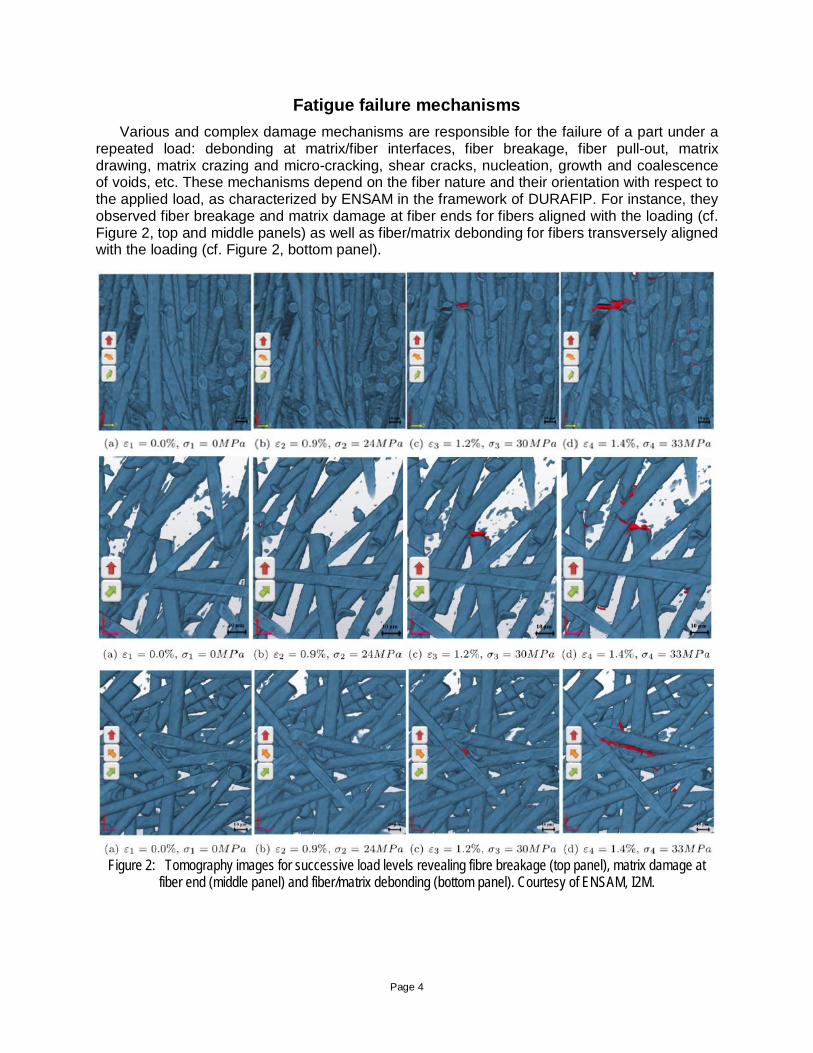
Fatigue failure mechanisms Various and complex damage mechanisms are responsible for the failure of a part under a
repeated load: debonding at matrix/fiber interfaces, fiber breakage, fiber pull-out, matrix drawing, matrix crazing and micro-cracking, shear cracks, nucleation, growth and coalescence of voids, etc. These mechanisms depend on the fiber nature and their orientation with respect to the applied load, as characterized by ENSAM in the framework of DURAFIP. For instance, they observed fiber breakage and matrix damage at fiber ends for fibers aligned with the loading (cf. Figure 2, top and middle panels) as well as fiber/matrix debonding for fibers transversely aligned with the loading (cf. Figure 2, bottom panel).
Figure 2: Tomography images for successive load levels revealing fibre breakage (top panel), matrix damage at
fiber end (middle panel) and fiber/matrix debonding (bottom panel). Courtesy of ENSAM, I2M.

Page 5
The action of these mechanisms is usually characterized experimentally on material samples submitted to cyclic loadings. The simplest cyclic loading results in a sinusoidal stress evolution with time (cf. Figure 4). It usefully illustrates the main parameters used in fatigue characterization: the maximum stress, the stress amplitude and the stress ratio 𝑅 = 𝜎𝑚𝑖𝑛
𝜎𝑚𝑎𝑥. The
experimental characterization of such loading consists in determining the number of cycles after which the material fails. Hence it associates this number to a given stress amplitude and R ratio. Collecting such measurements for various stress amplitudes (and R ratios) enables to draw so-called Wöhler or S-N curves. These curves depict the anisotropy of composites when varying the angle between loading and fiber directions [6]: likewise strength, the stress amplitude adopts different orders of magnitude in the longitudinal and transverse directions. As each point of these curves is obtained from one test and each test possibly lasts a long time especially at lower stress amplitudes, the full fatigue characterization of a composite requires many tests, much time and cost.
Figure 3: Fatigue testing of composites. A fatigue test consists in the repeated application of a stress loading mainly characterized by its amplitude. The simplest cycle of such a loading consists in a sinusoidal stress evolution with time
(left plot). It yields one number of cycles at failure associated to the stress amplitude and forms S-N curves when varying the stress amplitude through different tests (right plot). Such curves reveal the anisotropy of composites
when varying the angle between loading and fiber direction (e.g., 0°, 45° or 90°).
Microstructure sensitive fatigue material modeling
The fatigue life prediction of composites in full details requires modeling the cyclic material behavior and all related fatigue damage mechanisms. Hence we have developed material models of increasing complexity levels. On the one hand, we have combined nonlinear material models with mean-field homogenization in order to enable direct nonlinear mechanical simulations. We have also introduced a time homogenization method in order for these simulations to represent large numbers of cycles with affordable computing resources. On the other hand, we have implemented a micromechanically-based phenomenological material model involving a stress-based fatigue criterion. In order to use this latter model for a structural fatigue analysis, it needs to be calibrated against experimental data collected from fatigue tests on specimens. Such calibration has been applied to a glass reinforced polyamide 66 (PAGF), Technyl® A 218 V30, accounting in particular for the local stress state.
Material models and experimental data
A first material modeling effort consisted in representing the material response to a cyclic stress loading (cf. Figure 5). Hence we have developed at Université Catholique de Louvain (UCL) a thermodynamically-based constitutive model for thermoplastic polymers coupling

Page 6
viscoelasticity, viscoplasticity and ductile damage [7]. This model gathers several most relevant ingredients: the viscosity enables to represent hysteresis loops; the plasticity overwhelms the cyclic peak strain drift known as rachetting, especially for the first cycles; the damage is modeled using damage mechanics concepts, namely an isotropic damage variable and the effective stress, and accumulates until a critical value associated to fatigue failure. For SFRP, this model is used to account for weak spots appearing at fiber tips, homogenized with a viscoelastic matrix and elastic misaligned fibers.
Figure 4: SFRP stress-strain response to a cyclic stress loading reveals hystereses and rachetting, e.g., for the selected PAGF30, 23°C, RH50, R = 0.1, transversely to the principal fiber direction, at a 40-MPa nominal peak stress
(left). Such response is adequately simulated by means of a viscoelastic-viscoplastic material model (right).
In parallel with the above-described constitutive model, we have developed a time homogenization method to enable direct simulation of large numbers of cycles [8]. This method predicts the material response by representing (microchronological) cycles by few (macrochronological) time points (cf. Figure 6). Hence it reduces the computational cost considerably: it simulates 6000 cycles of a tension-torsion loading on a cylindrical bar in 6 s, i.e., 97% less than without time homogenization.
Figure 5: The time homogenization method predicts the response of a cylindrical bar to a cyclic tension-torsion loading by representing each cycle by few time points (first 10 cycles left, last 10 cycles right).

Page 7
To prepare the application to the simulation of industrial parts, of advanced material models such as the above-described ones, we have introduced at e-Xstream, in Digimat, a phenomenological fatigue material model. The model corresponds to the simplest linear elastic modeling assumption. It behaves as if the material macroscopic mechanical state was oscillating between the imposed maximum and minimum stresses (cf. Figure 7). At the same time, the material strength decreases so that failure is reached after a given number of cycles. This approach does not explicitly model each damage mechanism individually, but captures them on a macroscopic level.
Figure 6: Phenomenological HCF model. The model behaves as if the material macroscopic mechanical state was oscillating between the imposed maximum and minimum stresses (left plot). At the same time, the material strength
S decreases so that failure is reached after a given number of cycles Nc (right plot).
The phenomenological HCF model predicts SFRP S-N curves for any fiber orientation and multiaxial loadings, by means of a failure criterion with decreasing strengths parameters. Multiaxial failure criteria have proved to work accurately in static and dynamic failure analysis of SFRP and can also be exploited to compute the fatigue life of composites [9]. They can be applied in pseudo-grains to compute their fatigue life. Pseudo-grains consist in virtual 2-phase unidirectional composites in which the actual microstructure is decomposed. Upon computation over all pseudo-grains, homogenization of the global fatigue state is performed. The general computation workflow applied by Digimat is summarized in Figure 8 [10].
Figure 7: Fatigue computation workflow using the composite pseudo-grain HCF model.

Page 8
The input required to calibrate this HCF model consists in three S-N curves measured at different main fiber alignments with respect to the loading direction. This requires to machine out from an injected plaque three specimens from various orientations – typically 0°, 90° and some intermediate angle like 30° or 45° – with respect to the injection direction (cf. Figure 9).
Figure 8: Specimens machined out from an injected plate and used in the fatigue testing.
We have conducted at Solvay such characterization of PAGF for different conditioning. It particular, we collected S-N curves appropriate for the calibration of a fatigue material model for Technyl® A 218 V30 at 23°C and RH0, with R = 0.1 (cf. Figure 10).
Figure 9: S-N curves collected by Solvay from fatigue tests on PAGF30 specimens, at 23°C, RH0, R = 0.1 and 3 orientations.
90°

Page 9
Fatigue material model calibration A fatigue material model consists in the description of the elastic properties of the
constitutive materials, the composite microstructure and the fatigue failure criterion definition. For the selected PAGF30 at 23°C and RH0, a 3679-MPa polyamide and a 71000-MPa glass have been defined as well as a 30% mass fraction and a 24 aspect ratio. The fiber orientation, the last microstructure characteristic, varies spatially depending on the injection process. In particular, it has adopted a given distribution through the plate from which specimens have been cut to be submitted to fatigue tests.
The fatigue failure criterion relies on 3 unidirectional S-N curves calibrated in order for the material model to reproduce the experimental S-N curves (cf. Figure 13). Hence such calibration requires a fiber orientation assumption representative for the specimens submitted to the tests from which the experimental curves have been built. This calibration subsequently enables to predict a different fatigue life for different fiber orientations. Indeed different fiber orientations correspond to different relative contributions of each pseudo-grain. In turn, the fatigue life of each pseudo-grain, constituting virtual unidirectional composites, only depends on the 3 calibrated unidirectional S-N curves.
Figure 10: Material model calibration. The unidirectional S-N curves (continuous lines) constitute the fatigue failure criterion parameters. They are employed at pseudo-grain level to compute S-N curves for any fiber orientation, e.g.,
the one representative for specimens tested to collect experimental S-N curves (dots).
We validated the fatigue material model by means of structural fatigue analyses of specimens using Moldflow, ANSYS, nCode and Digimat. Such fatigue analyses indeed require, on the one hand, a description of the local stress state considered constant for a constant amplitude cyclic loading and, on the other hand, S-N curves representative for the behavior of the local fiber orientation. We obtain the first from 3 Digimat/ANSYS coupled FEA – one per specimen orientation. They provide the appropriate input for 13 Digimat/nCode analyses corresponding to several load levels for each specimen orientation. For each fatigue analysis, the most critical element and layer, i.e., exhibiting the shorter fatigue life, are identified and their stress amplitude and number of cycles are associated to form S-N curves comparable to the experimental ones.

Page 10
The calibrated material model yields realistic life results from specimen validation (cf. Figure 15). These results are associated to the same critical elements for each load level, all located at the edge of the specimen and at the beginning of the area exhibiting width variation, but different depending on the orientation however. They are also associated to different critical layers, in the skin at 0° and 90° and in the core at 45°.
Figure 11: Validation results from specimen analyses based on local stress state material model calibration.
Structural part life prediction To predict the fatigue life of a real composite component, the above-described
phenomenological fatigue material model is coupled with a fatigue simulation software like HBM nCode DesignLife, LMS Virtual.Lab Durability, etc. This approach has been successfully applied for the durability assessment of an SFRP beam submitted to a cyclic bending load.
Part description and experimental data We have designed at Solvay a demonstrator beam to investigate the material behavior and
the influence of injection molding in a structural context. In the framework of the fatigue case study, this 45-cm long beam has been manufactured with Technyl® A 218 V30 (polyamide 6.6 reinforced by 30% of short glass fibers) and has been submitted to constant-amplitude cyclic bending loads. It has also been modeled by means of a 500,000-element FE model (cf. Figure 16).
Figure 12: FEA model of the Solvay beam made of PAGF30.

Page 11
We measured the fatigue life performance of the beam for various conditionings, load ratios R and maximum loads. In particular, 4 maximum forces have enabled to reach fatigue lives between 1000 and 1,000,000 cycles for 23°C, RH0 and R = 0.1 (cf. Figure 17). We have almost systematically observed failure starting below the bender, along a bottom side rib.
Figure 13: Fatigue life of the beam measured for 23°C, RH0, R = 0.1 and various constant amplitude loadings (left)
and failure location (right). Failure is observed below the bender, in the area under tensile loading.
To apply the fatigue simulation workflow, we have simulated this test by coupling Digimat to ANSYS for a unit load. We have performed an optimized injection simulation of the beam at Promold, providing local fiber orientation tensors in each element of the FE model. We have then performed an FEA for a 1-N bending load. This FEA has highlighted 3 characteristic regions:
• the boundary conditions region, exhibiting numerical peak stresses attributed to the combination of several simplifications among others, neglected for the fatigue assessment as no fatigue failure is expected in that region;
• the compressive region at the top of the beam, including hotspots in terms of minimum principal stresses, neglected for the fatigue assessment as compressive strengths are deemed larger than tensile ones;
• the tensile region, at the bottom of the beam, including hotspots in terms of maximum principal stresses, constituting the focus of the fatigue assessment.
Durability assessment
We performed a durability assessment of the beam with Digimat and nCode DesignLife by means of the material model calibrated as described in previous section. We analyzed the numbers of cycles predicted in each element of the tensile region for various maximum loads. In particular, we observed minimum fatigue lives along inner ribs and on the bottom face of the beam (cf. Figure 18).

Page 12
Figure 14: Weak spots in the tensile region for a 10-kN maximum force. Minimum fatigue lives appear along inner
ribs and on the bottom face of the beam.
Local stress state material model calibration enables a straightforward and methodologically repeatable durability assessment. Indeed it makes the association of the beam fatigue life to the elements exhibiting the smaller numbers of cycles relevant. These numbers of cycles fall within the experimental variability for the 4 maximum forces experimentally characterized (cf. Figure 19). However we observe overestimations for the larger loads, for which the linear approximation of the material behavior is the most questionable.
Figure 15: Fatigue life in critical elements along the bottom inner rib for a 10-kN maximum force. The numbers of
cycles observed in critical elements fall within the experimental variability.

Page 13
Influence of nonlinearities The main fatigue simulation results, i.e., the weak spots ranking and the fatigue life
prediction, depend on the representativity of the predicted stress state in critical locations. Indeed, this stress state constitutes the basic input for the fatigue criterion yielding an actual number of cycles. This stress state is sensitive to nonlinearities, mainly from contact and material modeling.
To envision how these nonlinearities would influence the results of the fatigue simulation workflow described in previous subsection (not accounting for such nonlinearities), we characterized their influence on the local stress state predicted by several FEA of a simplified beam under cyclic 3-point bending (cf. Figure 20). In particular, we coupled Digimat to Abaqus, considering material properties representative for the selected PAGF30, 23°C, RH50, and injection simulation results representing fibers mainly oriented along the beam. In particular, we have compared extrapolations of FE results obtained for a unit load (10 N), representative for the stress state considered by the above-described fatigue analysis, to FE results obtained with linear (elastic) and nonlinear (viscoelastic-viscoplastic, VEVP) material models.
Figure 16: FEA model of a simplified beam made of PAGF30.
Local stress state
To characterize the influence of nonlinearities, we focused on the stress history response to a sinusoidal force loading in the most stressed element, on the center of the bottom face of the beam. For a 150-N maximum load, applied at 1 Hz with R = 0.1 (cf. Figure 21), the maximum and minimum stresses (at t = 0.5 and 1 s respectively) exhibit smaller values than the ones extrapolated from a unit load FEA. We associated these decreases to contact nonlinearities for the FEA employing a linear material model and contact and material nonlinearities for the FEA employing a nonlinear material model.
10 cm

Page 14
Figure 17: Stress history response to a sinusoidal 150-N maximum force loading at 1 Hz and R = 0.1 in the most
stressed element, on the center of the bottom face of the beam, extrapolated from a unit load FEA (grey) and resulting from FEA employing linear (black) and nonlinear (red) material models.
Such stress histories correspond to different values of the parameters primarily useful for the
application of a fatigue criterion, i.e., stress amplitudes and load ratios.
• First, these histories yield different stress amplitudes than the one representative for the previous fatigue analysis. Hence, referring these stress amplitudes – smaller for the loading scenario considered (cf. Figure 22) – to an S-N curve would provide longer fatigue lives.
• Second, these histories correspond to a (local) load ratio (in terms of stresses) different than the imposed one (in terms of force). Hence, the S-N curve to consider for a fatigue life computation should be computed by accounting for mean stress sensitivity and not simply rely on S-N curves collected from tensile tests on specimens at the same imposed load ratio.
Figure 18: Stress amplitudes and load ratios in the most stressed element, on the center of the bottom face of the beam, for a sinusoidal 150-N maximum force loading at 1 Hz and R = 0.1, extrapolated from a unit load FEA (grey)
and resulting from FEA employing linear (black) and nonlinear (red) material models.
Fatigue life
Adapting local stress amplitudes and load ratios according to the previous observations would make a fatigue criterion predict a different fatigue life. To exemplify this statement and taking advantage of the simulated microstructure, mainly oriented along the beam similarly to the stress field, we directly employ experimental S-N curves collected from 0° tensile tests for the selected PAGF30, 23°C, RH50, to deduce fatigue lives:

Page 15
• We convert the stress amplitude computed from the predicted stress history (instead of the one deduced from a unit load case) into a number of cycles according to these S-N curves (“adapted stress amplitude”);
• We scale the S-N curve to account for mean stress sensitivity before performing the conversion (“adapted load ratio”); we perform this scaling according to experimental observations of the mean stress effect [11].
Considering several imposed load ratios (R = -0.2 and R = 0.1) and a single maximum load (150 N), we observe a potentially different influence of nonlinearities for different load ratios (cf. Figure 23). In particular, we focus on the influence of contact nonlinearities by considering FE results obtained according to a linear material model.
Figure 19: Fatigue life of the most stressed element, on the center of the bottom face of the beam, for a sinusoidal 150-N maximum force loading at 1 Hz and R = -0.2 or R = 0.1, deduced for the stress state predicted by a unit load
FEA and resulting from successive stress amplitude and load ratio adaptations from an FEA employing a linear material model.
Furthermore we observe a potentially different influence of nonlinearities for different maximum loads at R = 0.1 (cf. Figure 24). In particular, we focus on the combined influence of contact and material nonlinearities by considering FE results obtained according to a nonlinear material model. Such variable influence modifies the apparent slope of the curve relating the maximum force to the number of cycles. Hence accounting for nonlinearities could help reducing the apparent slope discrepancy between the experimental median and the predicted curves (cf. Figure 19), for large maximum loads in particular. Finally this influence varies spatially so that the weak spots ranking in terms of numbers of cycles could be improved by accounting for it.

Page 16
Figure 20: Fatigue life of the most stressed element, on the center of the bottom face of the beam, for sinusoidal
150-N and 100-N maximum force loadings at 1 Hz and R = 0.1, deduced for the stress state predicted by a unit load FEA and resulting from successive stress amplitude and load ratio adaptations from an FEA employing a nonlinear
material model.
Summary and next steps
The design of high quality, light and energy efficient vehicles is crucial for success in the automotive and aerospace industries among others. Such design heavily relies on composites. Hence accurate modeling of their HCF behavior is required to optimize designs without compromising the lifetime and security of structural components.
HCF modeling benefits from micromechanics to capture accurately the anisotropic behavior of composite materials. For SFRP, it handles the effect of fiber orientation thanks to a phenomenological material model based on a failure criterion applied at pseudo-grain level. At the structural level, it is coupled to fatigue FE solvers to predict the fatigue life of, e.g., an SFRP beam submitted to a cyclic bending load. In such a case, a good correlation with experimental test has been shown.
This microstructure-sensitive fatigue criterion is ready to be combined to nonlinear constitutive models and mean stress sensitivity capabilities. Indeed such tools will improve the representativity of the local stress state constituting the primary input for the fatigue criterion.
Acknowledgments This work has been undertaken in the framework of the DURAFIP project funded by France
under the FUI (Fonds unique interministériel) and the Walloon Region under the EUREKA programme (convention 1117479).
Bibliography [1] Calmels, S., Lesueur, M. “Anisotropic Damping Behavior of Reinforced Plastic Parts for NVH Simulations”. SPE Automotive Composites Conference & Exhibition, 2015.
[2] Adam, L., Depouhon, A., and Assaker, R. “Multi-Scale Modeling of Crash & Failure of Reinforced Plastics Parts”. 7th Europen LS-DYNA Conference, 2009.
[3] Calmels, S., Bidaine, B., and Danielson, K. "The Post-Failure Behavior's Prediction of CFRP Parts under Dynamic Loads". SAE Technical Paper 2015-01-0692, 2015, doi:10.4271/2015-01-0692.
Page 17
[4] Cheruet, A., Calmels, S., Duflot, M. “Predicting Post Failure Behavior of Woven Made Parts for Crash Design Needs”. SPE Automotive Composites Conference & Exhibition, 2015.
[5] Robert, G., Bidaine, B., Chauvet, L., Charrier, P. “Modelling fatigue”. International Innovation, n° 156, pp. 87-89, 2014. http://digimag.internationalinnovation.com//launch.aspx?eid=959679bf-d138-4b31-a57c-99f4c75e9819&pnum=89
[6] Bernasconi, A., Davoli, P., Basile, A., Filippi, A. "Effect of fiber orientation on the fatigue behavior of a short glass fiber reinforced polyamide-6". Int. Journal of Fatigue, vol. 29, pp. 199-208, 2007.
[7] Krairi, A., Doghri, I. “A thermodynamically-based constitutive model for thermoplastic polymers coupling viscoelasticity, viscoplasticity and ductile damage”. Int. Journal of Plasticity, vol. 60, pp. 163-181, 2014. http://www.sciencedirect.com/science/article/pii/S074964191400093X
[8] Haouala, S., Doghri, I. “Modeling and algorithms for two-scale time homogenization of viscoelastic-viscoplastic solids under large numbers of cycles”. Int. Journal of Plasticity, vol. 70, pp. 98-125, 2015.
[9] Liu, Y. "A unified multiaxial fatigue damage model for isotropic and anisotropic materials". Int. Journal of Fatigue, vol. 29, no. 2, 2007.
[10] e-Xstream engineering. "Digimat documentation Release 6.0.1", 2015.
[11] Robert, G., Moulinjeune, O., Houba, M. “Fatigue of Glass Fibers Reinforced Polyamides: Mean Stress Effects as a Function of Glass Fibers Orientation”. 20th Int. Conference on Composite Materials, 2015.