fiber optic sensors for pem fuel cells by nigel david a ... · fiber optic sensors for pem fuel...
TRANSCRIPT

Fiber Optic Sensors for PEM Fuel Cells
by
Nigel David
B.Sc., Simon Fraser University, 2004
M.Sc., Simon Fraser University, 2007
A Dissertation Submitted in Partial Fulfillment of the
Requirements for the Degree of
DOCTOR OF PHILOSOPHY
in the Department of Mechanical Engineering
c© Nigel David, 2011
University of Victoria
All rights reserved. This dissertation may not be reproduced in whole or in part, by
photocopying or other means, without the permission of the author.

ii
Fiber Optic Sensors for PEM Fuel Cells
by
Nigel David
B.Sc., Simon Fraser University, 2004
M.Sc., Simon Fraser University, 2007
Supervisory Committee
Dr. Peter Wild, Co-supervisor
(Department of Mechanical Engineering)
Dr. Ned Djilali, Co-supervisor
(Department of Mechanical Engineering)
Dr. David Sinton, Departmental Member
(Department of Mechanical Engineering)
Dr. Tom Fyles, Outside Member
(Department of Chemistry)

iii
Supervisory Committee
Dr. Peter Wild, Co-supervisor
(Department of Mechanical Engineering)
Dr. Ned Djilali, Co-supervisor
(Department of Mechanical Engineering)
Dr. David Sinton, Departmental Member
(Department of Mechanical Engineering)
Dr. Tom Fyles, Outside Member
(Department of Chemistry)
ABSTRACT
Fibre-optic sensing techniques for application in polymer electrolyte fuel cells
(PEMFC) are presented in this thesis. Temperature, relative humidity (RH) and air-
water two-phase flow sensors are developed and demonstrated based on optical fibre
Bragg gratings (FBG). Bragg gratings offer the following characteristics that warrant
their development for application in PEMFCs: small size, environmental compati-
bility and the possibility of multiplexed multi-parameter sensing. Contributions of
this work are in novel sensor development and implementation strategies. Important
installation design considerations include the sensor proximity to the catalyst layer,

iv
sensor strain relief and minimal bending of the fibre. With these considerations,
the dynamic and steady-state performance of FBG temperature sensors distributed
throughout the flow-field of a single cell PEMFC was validated with a co-located
micro-thermocouple. In the development of FBGs for in situ measurement of relative
humidity, a polyimide-coated FBG based RH sensor is presented with significantly
improved response time and sensitivity over previously reported designs. The RH
inside a PEMFC under transient operating conditions is monitored. Step increases in
current induce significantly larger increases in RH near the outlet than near the inlet
of the cell, and associated transients within the fuel cell are found on a time scale
approaching the sensor response time. Finally, to complete the suite of FBG sensors
for water management in PEMFCs, an evanescent field based FBG sensor embedded
in a microchannel for the measurement of two-phase flow dynamics is presented. Us-
ing high speed video for validation, it is established that the novel sensor enables the
measurement of droplet average velocity and size in flow regimes representative of an
operating fuel cell.

v
Contents
Supervisory Committee ii
Abstract iii
Table of Contents v
List of Tables viii
List of Figures ix
Acknowledgements xi
Dedication xii
1 Introduction 1
1.1 Overview of PEMFCs and Water Management Issues . . . . . . . . . 2
1.2 Overview of Diagnostic Techniques For Water Management in PEMFCs 6
1.2.1 In situ temperature measurement techniques . . . . . . . . . . 6
1.2.2 In situ relative humidity measurement techniques . . . . . . . 10
1.2.3 Liquid water detection in PEMFCs . . . . . . . . . . . . . . . 15
1.3 Fibre optic sensors . . . . . . . . . . . . . . . . . . . . . . . . . . . . 20
1.3.1 Temperature . . . . . . . . . . . . . . . . . . . . . . . . . . . . 20
1.3.2 Humidity . . . . . . . . . . . . . . . . . . . . . . . . . . . . . 21
1.3.3 Liquid water . . . . . . . . . . . . . . . . . . . . . . . . . . . . 22

vi
1.4 Objectives . . . . . . . . . . . . . . . . . . . . . . . . . . . . . . . . . 23
1.5 Organization of Dissertation . . . . . . . . . . . . . . . . . . . . . . . 23
2 In-fibre Bragg Gratings 25
2.1 Optical fibre and FBGs . . . . . . . . . . . . . . . . . . . . . . . . . . 25
2.2 Thermal and mechanical influence on FBGs . . . . . . . . . . . . . . 29
2.2.1 FBG humidity sensing . . . . . . . . . . . . . . . . . . . . . . 31
2.3 Evanescent field sensors . . . . . . . . . . . . . . . . . . . . . . . . . 32
2.4 FBGs in PEMFCs . . . . . . . . . . . . . . . . . . . . . . . . . . . . 36
2.4.1 Techno-economics of FBG sensing system . . . . . . . . . . . . 38
3 Summary of Key Results 41
3.1 In-fibre Bragg Grating Sensors for Distributed Temperature Measure-
ment in a Polymer Electrolyte Membrane Fuel Cell . . . . . . . . . . 41
3.2 Parametric Study of an FBG Relative Humidity Sensor . . . . . . . . 43
3.3 Simultaneous In Situ Measurement of Temperature and Relative Hu-
midity in a PEMFC using Optical fibre Sensors . . . . . . . . . . . . 45
3.4 Fibre Bragg Grating Sensor for Two-Phase Flow in Microchannels . . 46
4 Conclusions and Future Work 48
4.1 Conclusions and Contributions . . . . . . . . . . . . . . . . . . . . . . 48
4.2 Future Work . . . . . . . . . . . . . . . . . . . . . . . . . . . . . . . . 51
Bibliography 53
A In-fibre Bragg grating sensors for distributed temperature mea-
surement in a polymer electrolyte membrane fuel cell 64

vii
B Parametric Study of a Polymer-Coated Fibre-Optic Humidity Sen-
sor 70
C Simultaneous In Situ Measurement of Temperature and Relative
Humidity in a PEMFC Using Optical Fiber Sensors 86
D Fiber Bragg Grating Sensor for Two-Phase Flow in Microchannels 94

viii
List of Tables
Table 1.1 Summary of the in situ temperature techniques in PEMFCs . . 10
Table 1.2 Summary of the in situ humidity measurement techniques in
PEMFCs . . . . . . . . . . . . . . . . . . . . . . . . . . . . . . . 15

ix
List of Figures
Figure 1.1 Schematic of a PEMFC showing the main components and their
relative scales. . . . . . . . . . . . . . . . . . . . . . . . . . . . 3
Figure 1.2 Typical polarization curve for a PEMFC showing the different
loss mechanisms. . . . . . . . . . . . . . . . . . . . . . . . . . . 4
Figure 1.3 (a) Schematic of test cell for infrared imaging technique used by
Wang et al. to measure the temperature profile across the ac-
tive area. (b) Infrared image of active area during high current
operation. (c)Detailed drawing of flow field of the PEMFC. (d)
Temperature plotted against location along the flow field for dif-
ferent current densities. Reproduced with permission from the
Journal of Power Sources [1]. . . . . . . . . . . . . . . . . . . . 8
Figure 1.4 (a) Miniature capacitive RH sensors (Sensirion, Inc.) used by
Hinds et al. for in situ measurements. (b) Diagram of single cell
showing sensor locations. (b) Results from cathode side showing
positive gradient in RH from inlet to outlet. Reproduced with
permission from the Journal of Power Sources [2] . . . . . . . . 13
Figure 1.5 Flow patterns in PEM fuel cell operation. (a) slug flow, (b)
transition flow from slug to annular, (c) wavy stratified flow,
and (d) stratified annular flow. Reproduced with permission for
the Journal of Power Sources [3]. . . . . . . . . . . . . . . . . . 17

x
Figure 1.6 Sequence of flow-field images with corresponding voltage data
showing the effect of a water plug. Reproduced with permission
from the Journal of Power Sources [4]. . . . . . . . . . . . . . . 18
Figure 1.7 Table of comparison of the various visualization techniques used
for liquid water in PEMFCs. Reproduced from Bazylak et al. [5]
with permission from the International Journal of Hydrogen Energy 19
Figure 2.1 (a) Schematic (not to scale) of an FBG sensor written in single
mode optical fibre. (b) Refractive index profile along the length
of the FBG created by patterned UV exposure. (c) Typical spec-
tral response of FBG sensor when illuminated with broadband
light. (d) Basic optical setup for measuring FBG spectra. . . . 27
Figure 2.2 Schematic showing the refractive index profile n(r) of a standard
single mode optical fibre and the associated electric field profile
E(r) of the lowest propagation mode. The part of the electric
field that extends beyond the core is the evanescent field. . . . . 33
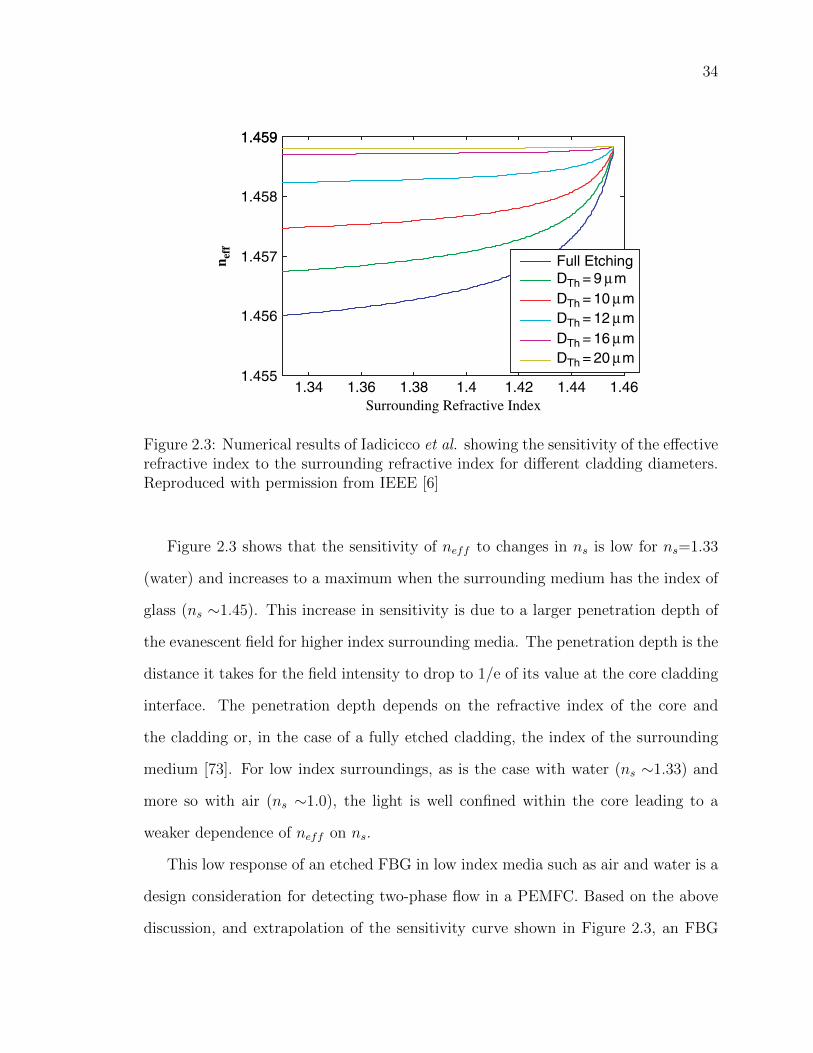
Figure 2.3 Numerical results of Iadicicco et al. showing the sensitivity of the
effective refractive index to the surrounding refractive index for
different cladding diameters. Reproduced with permission from
IEEE [6] . . . . . . . . . . . . . . . . . . . . . . . . . . . . . . . 34
Figure 2.4 Schematic of D-shaped fibre with FBG (not to scale). Use of this
fibre requires less etching for evanescent field based sensors. . . 35
Figure 2.5 Schematic showing the preferred installation locations of FBG
sensors within the bipolar plate. . . . . . . . . . . . . . . . . . 40
Figure 2.6 Schematic showing a multiplexed FBG sensor implemented into
a PEMFC stack. . . . . . . . . . . . . . . . . . . . . . . . . . . 40

xi
Acknowledgements
First and foremost I would like to thank my supervisors, Dr. Peter Wild and
Dr. Ned Djilali, for their guidance and support throughout this research. Their
technical expertise in the fields of sensor development and fuel cells, respectively,
combined to make this project a continuing success. I am also very appreciative of
their understanding of my responsibilities as a father while being a graduate student.
I would also like to thank my coworkers. Without their help this work would not
have been nearly as productive and enjoyable as it was. I would like to thank Dr.
Chris Dennison, who, as Peter’s pioneering grad student in fibre optics, introduced
me to the exciting research field that was entirely new to me. When not discussing
sensor design with Chris, we could discuss other important matters like hunting and
fishing. Other past and present members of Dr. Wild’s sensing group with whom
I have shared in the pleasures and pitfalls of sensor development work include Dr.
Dustin Olender, David Singlehurst, Juan Botero, Devan Bouchard and Chris Bueley.
From Dr. Djilali’s fuel cell research group, I would like to thank Dr. Slava Berjnov,
Dr. Amy Bazylak, Dr. Jingwei Hu and T.C. Wu. Many thanks also goes to Dr.
David Sinton and members of his microfluidics group for access to their equipment
and expertise.
I would like to thank Sue Walton and Peggy White from the Institute for Inte-
grated Energy Systems (IESVic) office. During my years of studies at IESVic, Sue and
Peggy have provided constant support to our research groups creating an environment
for them to thrive.
Finally, I would like to thank my family for their love and support during this
seemingly endless journey of school.

xii
Dedication
This thesis is dedicated to my mother and stepfather; without their help it simply
would not have been possible.

Chapter 1
Introduction
This dissertation describes the development and implementation of optical in-fibre
Bragg grating (FBG) sensors for monitoring temperature, relative humidity, and the
liquid water phase in polymer electrolyte fuel cells (PEMFCs). In PEMFCs, these
coupled parameters have significant impact on performance and degradation. For
optimal performance it is well understood that a water balance must be maintained,
which ensures good hydration of the membrane without flooding the electrodes [7–10].
Furthermore, accumulation of liquid water in the electrodes can initiate and exacer-
bate degradation of the membrane electrode assembly (MEA), which functions as the
core of a PEMFC. Currently there is a lack of diagnostics tools for the parameters
of interest in water management, particularly tools that can provide non-invasive
distributed measurements.
Fibre optics and, in particular, FBG sensors, are well suited to in situ monitor-
ing of PEMFCs due to their small size, inherent electrochemical resistance and the
possibility of multiplexing several sensors on a single fibre. The FBG-based sensors
described in this thesis rely on different underlying mechanisms that span the ther-
mal, mechanical and optical properties of the FBGs. These mechanisms are described

2
in Chapter 2 of this thesis. Chapter 3 gives a summary of the experiments and results
that were obtained in the development of the FBG sensors for temperature, RH and
liquid water. A more detailed account of the research undertaken for this thesis is
provided in Appendices A-D, which comprise published and submitted manuscripts
that have resulted from this work.
This introductory chapter provides context for the measurements and sensor de-
velopment, beginning with an overview of PEM fuel cells and the associated water
management issues.
1.1 Overview of PEMFCs and Water Management
Issues
PEM fuel cells have been seen for decades as a promising source of clean power for
stationary and transportation applications. Delay in their widespread usage can be
attributed to high materials costs (e.g., membranes and platinum catalyst), lack of
hydrogen infrastructure, and inadequate performance and durability. Improvements
in performance and durability, particularly in relation to water management issues,
continues to be an area of active research within industry and academia.
The operation of a fuel cell depends on the optimized regulation of the flow of
reactants, products, heat, and charged species in conjunction with reaction kinetics.
These strongly coupled processes take place over a large range of length and time
scales and in structures with very different characteristics. These include micro-
channels, porous electrode layers, and polymer electrolytes. See Figure1.1.
There are various structures and transport processes that form the basis of PEMFC
operation [11]. The anode and cathode micro-channels carry hydrogen and oxygen
gases, respectively. The micro-channels are typically grooved into graphite plates,

3
Air
H2
Membrane(t~50 µm)
Catalyst layerGas Di�usion Layer (t~200 µm)Channel
~3 mm
1 mm
cathode
anode
water�ow plate
heat
Figure 1.1: Schematic of a PEMFC showing the main components and their relativescales.
which offer good mechanical, thermal and electrical properties. The gas diffusion
layers (GDL) consist of an anisotropic fibrous structure, typically in the form of car-
bon paper, that allows distribution of the reactant gases to the catalyst layers. In
addition to gas distribution, the GDLs and the graphite bipolar plates transport elec-
trons. Simultaneously, proton transport takes place across the membrane between
the catalyst layers, byproduct heat is transferred through the GDL, and evaporation
and condensation of water takes place.
The byproduct water and heat created from the electrochemical operation of a
PEMFC (Figure 1.1) can impact negatively on performance if not properly managed.
MEA flooding and membrane drying are two of the main performance degradation
mechanisms that occur when water management is not adequate. A thorough review
of these phenomena, their causes, characterization methods, and mitigation strategies,
is given in [3, 9, 11].

4
The effects of water management issues on cell performance are depicted schemat-
ically on the polarization curve shown in Figure 1.2. In general, optimum cell perfor-
mance is achieved when the cell temperature is held at ∼80◦C and the membrane is
well hydrated. This combination ensures adequate reaction kinetics (i.e., low activa-
tion losses) and good proton conductivity (i.e., low ohmic losses) [12].
At higher currents, or when local water and heat management is inadequate, wa-
ter condensation can lead to “flooding” within the GDL and catalyst layer. Flooding
of these structures, typically occurring on the cathode side, inhibits the gas from
reaching the reaction sites within the catalyst layer and results in transport or con-
centration losses. See Figure 1.2.
Current density (A cm-2)
Volta
ge (V
)
0
1.0
theoretical potential (1.23V)
activation lossesohmic losses(drying)
concentration losses
fuel cross-over and reverse potential
IV curve of PEMFC
1.0
�ooding
OCV
Figure 1.2: Typical polarization curve for a PEMFC showing the different loss mech-anisms.
Liquid water and the resulting “two phase-flow” often propagate from the micro-
structure of the GDL to the gas channels where small droplets join together to form
“plugs” of water, blocking the entire flow channel. Due to local reactant starvation

5
and the associated transient pressure surges, water plugs can cause large and sudden
perturbations in the voltage of the cell. Such voltage perturbations are operationally
undesirable and can induce degradation mechanisms. In situ techniques for the lo-
calized detection of liquid water are likely to be part of mitigation strategies for
flooding.
Conversely, membrane dehydration is caused by excessive water removal and/or
high local temperatures. This leads to an increase in ohmic losses since the ionic
conductivity of the membrane is strongly dependent on its hydration level, or relative
humidity (RH) of the gas [7].
Increased ohmic losses also occur in regions where membrane thinning is present.
Membrane thinning is thought to be caused by manufacturing defects or chemical
attack. A region of thinner membrane will have a lower through-plane ionic resistance,
promoting higher current densities, and increased ohmic heating in that region. This
mechanism results in a local area of high temperature known as a hotspot. If left
unchecked, the temperature at the hotspot can reach the glass transition temperature
of the membrane material (∼135◦C), causing irreversible damage to the membrane
in the form of pinholes.
In current fuel cell stack technology, the regulation and control of these complex
processes is based on elaborate design and material features (e.g. flow-field design
and hydrophobic GDLs) in conjunction with water management strategies. Water
management strategies rely on global performance indicators and bulk measurements
(e.g. stack voltage and current, outlet relative humidity and temperature, and pres-
sure drop), which are relatively insensitive to local changes in conditions that are
believed to be the precursors to performance drop and degradation. In situ mea-
surements of these local changes in the parameters that affect water management
are essential for better understanding of the associated mechanisms and, ultimately,

6
improved stack performance.
1.2 Overview of Diagnostic Techniques For Water
Management in PEMFCs
The inability of bulk characterization methods such as polarization curve, electro-
chemical impedance spectroscopy, membrane resistance and pressure drop to spatially
resolve phenomena associated with water management has led researchers to develop
new techniques. The techniques that have been used to measure temperature, RH,
and the presence of liquid water inside operating fuel cells, either by visualization, or
with sensors are reviewed here with emphasis on their suitability for application to
PEMFC stacks. The limitations of such techniques, which are also discussed, served
to motivate and guide the FBG sensor techniques developed in the course of this
thesis work.
1.2.1 In situ temperature measurement techniques
It has been noted that the temperature inside a PEM fuel cell impacts its performance.
The temperature has an effect on electrochemical activation of the reactants, and the
relative humidity in the flow field, which affects membrane drying and flooding. If the
temperature of the membrane becomes too high at a hot spot, excessive degeneration
and potential failure of the MEA can occur. In addition to information relevant to
water management and failure diagnostics, the local determination of temperature
throughout the cell can provide information on the distribution of other parameters
such as current density and relative humidity.
Temperature measurements inside an operating PEMFC have been made using a
variety of techniques including infra red camera [1], thermocouples [13–17], resistance

7
temperature detectors (RTDs) [18–27], bandgap sensor [2], optical fibre sensors [28–
32], and tuneable laser diode absorption spectroscopy [33–36].
The infrared imaging technique requires a window for optical access and, therefore
is clearly not feasible in a commercial FC. The infrared imaging technique of Wang et
al. [1] was nonetheless important in demonstrating the spatially resolved distribution
of temperature in an operating fuel cell. The most notable feature in their thermal
images were the gradients of up to 5◦C across the active area of the small single
cell. See Figure 1.3. The temperature gradients were attributed to current density
gradients caused by self humidification of the membrane, which increased from inlet
to outlet.
Using miniaturized electronic sensors (thermocouples, RTDs, and silicon bandgap)
researchers have resolved in-plane temperature gradients in the flow channels [15],
on the landings [13], between the catalyst layer and the GDL [17], and within the
membrane [18]. Thermocouples have the advantage of off-the-shelf availability and
small size (∼250 µm). Thermocouples have good temperature resolution capabilities
and, as a result of their size, have a short response time.
Micro-scale RTDs have the added advantage over thermocouples of the possibility
of thin film device fabrication techniques, which is good for mass production of these
sensors. These thin film RTD sensors are inherently thin and can be as small as
∼100 µm on a side. They are typically surface mounted and, therefore, take on the
temperature of the substrate on to which they are mounted. For this reason, they
are well suited for experimental measurements within membranes, as shown by He et
al. [18]. Also for this reason, however, they are not well suited for the measurement
of gas temperature within the flow channels of a fuel cell.
A silicon bandgap temperature sensor was used by Hinds et al. [37] to measure the
gas temperature in a diverted flow channel just outside the active area of a PEMFC.

8
Infraredcameraa) b)
d)c)
Figure 1.3: (a) Schematic of test cell for infrared imaging technique used by Wanget al. to measure the temperature profile across the active area. (b) Infrared imageof active area during high current operation. (c)Detailed drawing of flow field of thePEMFC. (d) Temperature plotted against location along the flow field for differentcurrent densities. Reproduced with permission from the Journal of Power Sources [1].
This sensor, which was part of the commercial RH sensor they were using for in situ
RH measurements discussed in the following section, yielded good results, but was too
large to be located within the active area of a PEMFC. Furthermore, these sensors
cannot be multiplexed.
In general, the limitations of electronic sensors for application to PEMFC stacks
lie in their lack of robustness, both mechanically and electrochemically and in their
inability to be multiplexed for spatially resolve distributed measurements. With the
small size that is necessary for minimal impact on performance, the wire leads become
delicate and the sensors prone to failure [13]. Careful consideration of the wire mate-

9
rials is necessary since the environment within a fuel cell promotes corrosion due to
the constant presence of humidity and electrochemical activity. Separate installation
of many sensors, each with at least two leads, would be necessary to obtain any sort
of spatially resolved measurements. This would not only require modifications to the
fuel cell, but an interrogation system with sufficient separate channels for each sensor.
Optical approaches that have been used for temperature measurement include
tuneable diode laser absorption spectroscopy (TDLAS) and optical fibre sensors. TD-
LAS was first demonstrated in PEMFCs by Basu et al. [33]. The technique is based
on the absorption of light emitted from a tuneable laser as it passes along the length of
a flow channel. The spectrum of the laser diode can be tuned to the absorption band
of water vapour or other species. The spectrum of light that is detected on the side
opposite the laser can give information on the temperature and partial pressure of the
gas species within the channel. The technique is limited in that it is only operational
if the channel is free of liquid water to achieve a line-of-sight between the laser and
the detector. Other drawbacks to this technique are the low temperature resolution
(±2◦C) and that the measurements are based on an average over the channel length,
which yield limited spatial resolution.
Optical fibre sensors reported for in situ temperature measurements include phos-
phorescence based sensors [28], fluorescence based sensors [29], and as presented in
this thesis, FBG sensors [31]. The former two sensors rely on the temperature depen-
dent decay of light emitted from a photo-luminescent substance on the distal end of
an optical fibre. Due to the inherent small size of optical fibres, these techniques have
good spatial resolution potential. The main drawback of these fibre-end techniques, as
compared to FBGs, is the inability to multiplex several sensors on a single fibre. FBG
sensors are wavelength encoded, which means they can be multiplexed. The main
characteristics of these optical techniques, and the others that have been used for in

10
Table 1.1: Summary of the in situ temperature techniques in PEMFCs
Spatialresolution
Temporalresolution
Temperatureresolution
Cost Merits Drawbacks
Thermocouples 250 µm [13] Good ±0.19◦C [15] Low Small size;Commerciallyavailable
Non-multiplexing (manywires needed for distributedsensing in stack); Trade off:robustness vs. size; May beaffected by e.m. noise
RTDs 110 µm [19] Good ±0.3◦C [27] Medium Thin; Commerciallyavailable
Non-multiplexing; Substratemay block ions formembrane measurements
TDLAS Low (averageover channellength)
4 s [35] ±2◦C in80-100◦C [35]
High Allows detection ofspecies; Does notdisturb fueloperation
Cannot be used withcondensation in channel;Complex optical alignment;Require complex signalprocessing or referencesignal;
fibre optics 700 µm(Phosph) [30];1 mm(FBG) [31]
Good ±0.2◦C [32] High(Equip-ment)
Multiplexing (FBG);Immune to e.m.noise; Chemicallyinert
Brittle ; FBGs requirecareful strain isolation
situ temperature measurements are summarized in Table 1.1 for easy comparison.
1.2.2 In situ relative humidity measurement techniques
It has been mentioned that the ionic conductivity of a polymer electrolyte membrane
is strongly dependent on its water content [7]. Attempts to regulate the hydration
level of the membrane, and minimize ohmic losses, are made by controlling the inlet
RH of the gas streams and the fuel cell temperature. During cell operation, however,
a combination of water generation, water transport phenomena, and temperature
gradients cause inhomogeneities in RH and membrane water content. These inho-
mogeneities are likely to cause localized concentration and ohmic losses within the
fuel cell. In situ distributed measurement of RH is necessary to quantify these losses
and improve cell design and mitigation strategies. Prior to a discussion of the in situ
RH measurement techniques that have been demonstrated, some background on the
physical parameter of RH is given.
The most commonly used units for humidity measurement are relative humidity

11
(RH), dew point and parts per million. Dew point is the temperature (above 0 ◦C)
at which the water vapour in a gas condenses into liquid. Dew point depends on the
pressure of the gas, but is independent of temperature and is therefore defined as an
absolute humidity measurement. Part per million is also an absolute measurement,
and represents the water vapour content in a given volume of gas. Absolute humidity
measurement is typically used for trace amounts of moisture, whereas RH is most
common for higher humidity ranges, such as would often be the case in a PEMFC.
Most humidity sensors that could potentially be installed into a PEMFC are RH
sensors [38]. RH is the ratio of the partial pressure of vapour to saturated vapour
pressure: [39].
RH =PH2O
P ∗H2O
(T )× 100% (1.1)
Where PH2O is the partial pressure of water vapour, and P ∗H2O
is the saturation
pressure of water vapour. The saturation pressure is a function of pressure and
temperature and, therefore, so is the relative humidity. There are several empirical
relations for the saturation pressure of water vapour. A relatively simple relation that
provides a reasonable balance between usability and accuracy is given by [8],
P ∗H2O
(T ) = −2846.4[Pa]+411.24[Pa◦C−1]T−10.554[Pa◦C−2]T2 +0.16636[Pa◦C−3]T3,
(1.2)
where T and P are the temperature and pressure of the water vapour, expressed in
degrees Celsius, and Pascals, respectively. This curve fit is accurate from 15◦C to
100◦C.
The electronic sensors used for in situ RH measurements have all been capacitive.
The most successful demonstration of one was reported by Hinds et al. [37] using
small commercially available capacitive RH sensors (Sensirion, Inc., SHT75). These

12
combined RH and temperature sensors were installed around the outside of the flow-
fields of the anode and cathode plates of a single cell PEMFC (Figure 1.4a and b).
Steady state results for different temperatures and inlet humidities were presented.
Representative results for the cathode dew point as a function of position along the
flow-field side for under-humidified inlet gases are shown in shown in Figure 1.4c.
From this plot, a positive gradient from inlet to outlet is evident, becoming more pro-
nounced with increasing current density. The temperature measurements yielded the
same positive gradients. These results support the mechanism of self humidification
causing current density gradients proposed by Wang et al..
The transient RH measurements made by Hinds et al. provided useful information
on the dynamics of the RH in the flow-field. Measurements acquired during a sudden
change in cell current showed RH transients on the timescale of the SHT75 response
time (τ63 = 8s) [40]. This information serves to guide the use of other sensors, putting
an upper limit on the response time necessary for meaningful measurements.
The main limitations of the miniature capacitive RH sensor from Sensirion is their
size, inability to recover quickly from saturation, and inability to multiplex. Despite
being small, the sensor footprint of 3 x 7 mm [40] prohibits their installation within
the flow-field for truly localized measurements and requires significant modification
to the fuel cell plate.
Significantly smaller capacitive RH sensors based on MEMS fabrication techniques
were developed by Lee et al. specifically for in situ measurements in PEMFCs [19,20,
22–24]. Despite the potential of minimally invasive sensors, their in situ performance
was either drastically reduced upon installation in the PEMFC, or not reported.
An electrochemical technique for failure diagnostics using micro-sensing electrodes
was reported by Herrera et al. [41]. The technique is based on the use of 50µm
platinum wire sensing electrodes located at the inlet and outlet of the cell. The

13
potentials of the reference electrodes were correlated with relative humidity and the
onset of flooding of the fuel cell. Despite the clear benefit presented in this technique
for detecting flooding, drying and low fuel stoichiometry, calibration specifications of
the response of the electrodes to RH was not provided, and will likely depend on the
electrode location within the cell.
Rather than installing micro-sensors in the PEMFC, Mench et al. and Partridge
et al. used micro-tubes to extract small samples of gas for analysis by chromatog-
raphy and mass spectrometry, respectively [42, 43]. These techniques were used to
measure water vapour concentration at multiple locations in the serpentine flow filed
of an operating PEMFC. The authors suggest that in combination with spatially re-
solved temperature measurements, the transient RH distributions could be measured,
however, data for such measurements were not presented. The main drawbacks for
these techniques are the need for co-located temperature sensors and, in the case of
the work of Partridge et al. [43], a prohibitively expensive mass spectrometer.
a)
b)
c)
Figure 1.4: (a) Miniature capacitive RH sensors (Sensirion, Inc.) used by Hinds etal. for in situ measurements. (b) Diagram of single cell showing sensor locations.(b) Results from cathode side showing positive gradient in RH from inlet to outlet.Reproduced with permission from the Journal of Power Sources [2]

14
Optical techniques reported for in situ RH measurement include TDLAS and fibre-
optics. As mentioned previously TDLAS can be used to measure the partial pressure
of water vapour as well as temperature. With this technique, Basu et al. claimed the
first simultaneous non-intrusive measurements of the partial pressure of water vapour
and temperature inside a PEMFC under steady state and transient operations [33].
Two channels in the serpentine flow path of a collector plate were extended to allow
optical access into the test cell. One sensing channel was located near the inlet
and one was located near the outlet. The partial pressure was measured to increase
linearly with cell current and was higher towards the outlet. These measurements
agreed with the calculated production of water at the cathode side and were not
significantly affected by electro-osmotic drag.
The main drawbacks of TDLAS for RH measurements lie again in its tempera-
ture resolution and spatial resolution. To obtain RH from the partial pressure mea-
surements, conversion is made using Equation 1.1, which contains the temperature
dependent saturation pressure of water vapour. Examining Equations 1.1 and 1.2, it
is clear that limitations in temperature resolution put limitations on the RH resolu-
tion of the technique. Also, locally resolved measurements are not possible, as the
measurements are taken as an average over the channel.
Using a U-bent optical fibre coated with a silica-gel solution Tao et al. [30] demon-
strated an RH sensor based on the principle of spectroscopic absorption. The reported
range of measurement and response time at 90% of the total signal of this sensor were
4-95 %RH and 3 minutes, respectively. This sensor response is slow compared to the
transient RH measurements made by Hinds et al. [2]. In addition, the U-bent design
constrains spatial requirements and multiplexing is not possible.
A fibre optic RH sensor with a significantly faster response (10s) than the one
reported by Tao et al. [30] was demonstrated by David et al. for in situ measure-

15
Table 1.2: Summary of the in situ humidity measurement techniques in PEMFCs
Spatialresolution
Temporalresolution
Best RHresolution
Cost Merits Drawbacks
Capacitive 100µm [19] 8 s(63%) [37]
±0.25%RH[19]
Medium Small size(non-commercial);Easy to massproduce; Easyplacement inside fuelcell
Non-multiplexing
TDLAS Low (averageover channellength)
4 s [35] ±2.5%RH[35]
Medium Does not interferewith F.C. operation
Limited range (40-90%RH)
Fibre optics 1 mm (Lengthof FBG) [32]
10 s(90%) [32]
±2%RH [32] High(Equip-ment)
Small size;Multiplexingpossible; Immune toe.m. interference andcorrosion
Brittle; Complex installation(strain isolation)
Referenceelectrode
High(50µm) [41]
notreported
not reported Low Commercial; Easy toinstrument,Multi-parametersensing
Location specific response,Non-multiplexing
ments [32]. In addition to having a short response time and good sensitivity, the
sensor has the potential for multiplexing. This development and demonstration of
this work is presented in detail in Appendix B and C. The main characteristics of the
electrical and optical techniques that have been used for in situ RH measurements
are summarized in Table 1.2 for easy comparison.
1.2.3 Liquid water detection in PEMFCs
As previously discussed in this chapter, electrode flooding and air-water two-phase
flow in the gas channels are common during fuel cell operation and have been linked
to a variety of performance and material degradation mechanisms. Due to the com-
plex nature of these two-phase flow phenomena, in situ diagnostic tools are necessary
to gain better understanding of the phenomena and to suggest effective mitigation
strategies [3, 5, 44]. So far, various visualization techniques and pressure drop mea-
surements have been used to detect liquid water in operating fuel cells, however, due
to their limitations, there is still a need for spatially distributed information of the

16
hydrodynamics within the flow channels of a commercial fuel cell [3].
Pressure drop measurements are typically made across the cathode flow plate of
a PEMFC. The pressure drop across the flow field increases as liquid water builds up
in the porous GDL and in the flow channels, impeding the flow of gas. Increasing
pressure drop is, therefore, an indication of electrode flooding and two-phase flow.
These measurements can be used as feedback for the control of operating parameters
to mitigate flooding; however, pressure drop measurements typically lack the spatial
resolution required to obtain distributed two-phase flow information [44]. Visualiza-
tion techniques on the other hand generally offer good spatial resolution, which allows
for accurate flow regime characterization; however, the results often depend on the
specific materials used for the transparent plate, which are dissimilar to those in a
typical graphite bipolar plate fuel cell.
Despite the limitations of pressure drop and visualization techniques, numerous
in situ and ex situ experiments have been carried out using them. These experiments
were recently reviewed by Anderson et al. [3]. Results from these studies highlighted
the importance of flow maldistribution across the flow field and two-phase flow pat-
terns within the channels for water management of PEMFCs. Knowledge of the
common flow regimes (see Fig. 1.5) can help guide the design and placement of micro
sensors such that they can be utilized for system control and for flow field devel-
opment. For example, all of the flow regimes shown in Fig. 1.5 indicate liquid flow
on the sidewalls of the channel, whether two-phase flow (slug flow, transition flow)
or film flow (wavy stratified, stratified annular). These flow patterns suggest that a
sensor located on the sidewall of a micro channel would be most useful. Such a sensor
design could, potentially, differentiate between types of stratified flow adjacent to the
sidewalls.
As mentioned, most techniques developed for liquid water detection in operat-

17
Figure 1.5: Flow patterns in PEM fuel cell operation. (a) slug flow, (b) transitionflow from slug to annular, (c) wavy stratified flow, and (d) stratified annular flow.Reproduced with permission for the Journal of Power Sources [3].
ing PEMFCs have involved visualization techniques of varying degrees of complexity.
These include optical imaging, X-ray imaging, magnetic resonance imaging and neu-
tron imaging. These techniques were recently reviewed by Bazylak et al. [5]. Due to
the need for optical access or a custom fuel cell design for the particular technique,
none of the visualization techniques would be feasible on commercial PEMFC stacks;
however, the information that visualization techniques can provide on the fundamen-
tals of water transport through the micro-structures of a PEMFC is important.
Droplet formation on the surface of the GDL and water transport within the flow
channels has become a key area of research that can guide sensor development. Real
time optical imaging of these phenomena is routinely carried out using transparent
cells, where a standard conductive collector plate has been replaced with a custom
plate, usually made of plexiglass and metal. Studies using these cells have correlated
local two-phase flow regimes with local current density and pressure drops. Some
of the most striking correlations were made in a recent study by Dillet et al. [4].
Figure 1.6 shows two images of the flow-field of their test cell taken in sequence.
This study clearly shows the existence of water slug flow in the flow channel and
the consequences it has on the current density distribution across the cell. From

18
the images they measured the average speed of the slugs to be 190 mms−1, which
is a useful benchmark for sensor development. Optical visualization techniques are
limited to single cells, or the end cell of a stack where full optical access can be gained.
(a) (b)
Figure 1.6: Sequence of flow-field images with corresponding voltage data showingthe effect of a water plug. Reproduced with permission from the Journal of PowerSources [4].
The more advanced imaging techniques of magnetic resonance imaging, neutron
imaging, and X-ray imaging have been used to resolve through-plane water distribu-
tion in the MEA [45–47]. Investigation of water generation, transport and accumula-
tion in the micro-structures of the MEA, including the membrane, the micro-porous
layer and the GDL, is critical to gaining understanding of flooding phenomena and,
ultimately, water management. The impact of these imaging techniques on commer-
cial stack design is likely limited because they require modified fuel cells, as well as
costly and sophisticated large-scale equipment that is not widely available. However,
for the development of novel micro-sensors, such as optical fibre sensors, that could
potentially be embedded into these micro-structures, use of these advanced imaging
techniques could prove essential for their validation. The spatial and temporal res-
olution capabilities of the visualization techniques suitable for use in a PEMFC are

19
summarized in the table shown in Figure 1.7.
Figure 1.7: Table of comparison of the various visualization techniques used for liquidwater in PEMFCs. Reproduced from Bazylak et al. [5] with permission from theInternational Journal of Hydrogen Energy
Only a single micro-sensor for water measurement in a PEMFC flow-field has
been reported to date. Conteau et al. [48] recently developed and demonstrated
an electrochemical sensor for detecting water droplets within the flow channel of an
emulation fuel cell. The sensor was based on an impedance measurement between
two electrodes on either side of a graphite micro-channel. Simulated dynamic droplet
conditions were created within the channel, and the sensor data was correlated with
high-speed digital camera footage. The sensor proved capable of detecting the small
and fast droplets that occur in real PEM fuel cells under operation.
As with the other electronic sensors discussed in the previous sections, the elec-
trode based sensor developed by Conteau et al. will require particular attention to
electrical isolation, which, inside a fuel cell can prove difficult due to the conduc-
tive materials. For distributed measurements using these sensors, multiplexing will
require several electrically isolated leads, which poses another significant instrumen-

20
tation challenge. As has been mentioned, many of the limitations of electronic sensor
techniques can be overcome with the use of fibre optic sensors.
1.3 Fibre optic sensors
Fibre optic sensors have certain advantages which include immunity to electromag-
netic interference and corrosion, lightweight, small size, high sensitivity, high band-
width, and, in the case of Bragg gratings, ease of multiplexing for distributed measure-
ments. These properties combine to make fibre optic sensors an attractive solution
for in situ diagnostics relating to water management in PEMFCs. In the previous
sections, the discussion of fibre optic sensors was limited to temperature and humid-
ity sensors, as there have not been any reported techniques for in situ detection of
liquid water using fibre optics. In addition to other optical fibre-based techniques for
temperature and humidity, there are techniques for detection of phase (i.e., liquid or
gas) and refractive index that could be implemented in PEMFCs. These techniques
are surveyed in the following sections.
1.3.1 Temperature
For temperature, the fibre-end photoluminescence techniques [28,29] and fibre Bragg
grating sensors [31, 32] discussed above represent the most common types of fibre
optic temperature sensors, and the progression towards multiplexing that FBGs can
offer. Multiplexing is an attractive feature for distributed measurements in PEMFC
stacks. Multiplexed FBG temperature sensors have been proven in similarly challeng-
ing environments such as those found in down-hole (oil and gas well) applications [49]
and biomedical applications [50]. An additional benefit of the combined temperature
sensitivity and multiplexing capability of FBGs is that the temperature compensation

21
of sensors for other parameters can be done on a single fibre [32].
1.3.2 Humidity
The fibre optic techniques that have been demonstrated for humidity measurement
in PEMFCs [30, 32] also represent a progression towards FBGs, which enable multi-
plexing and multi-parameter measurements. There are, however, several other optical
fibre based sensors that have been reported for humidity. These were reviewed re-
cently by Yeo et al. [51]. All of the sensors rely on the application of a sensing layer
on to the optical fibre, and are categorized in terms of the basic sensing principles.
The fibre optic humidity sensing principles include spectroscopic, evanescent wave,
interferometric, and fibre Bragg gratings.
Spectroscopic based techniques typically rely on the deposition of a reagent on
to the tip of an optical fibre. The sensitive layer on the tip of the fibre elicits a
spectral response to humidity either by absorbing light or fluorescing in the presence
of moisture. Despite being widely used for chemical sensing, the main drawback with
spectroscopic humidity sensors is the lack of multiplexing capability that would be
required for distributed sensing in a fuel and the slow response of the sensors reported
in the literature (∼2mins) [51].
Evanescent wave sensors operate by accessing the evanescent field that penetrates
from the core into cladding of the fibre. Coatings that exhibit a change in refractive
index in the presence of moisture can be applied to a region of exposed core to achieve
a modulation in the transmitted or reflected power as a function of the surrounding
RH. The use of such a configuration gives flexibility in terms of the interaction length,
response time and distributed sensing capability [51].
Among the sensors reviewed by Yeo et al., the polyimide-coated FBG stands
out with a large reported measurement range (10-90% RH) [52] combined with the

22
potential for multiplexing. These sensors rely on the moisture induced swelling of the
polyimide coating. This hygroscopic property of the polyimide transfers strain into
the FBG, which is then detected as a shift in the Bragg wavelength. A more detailed
discussion of this FBG sensing mechanism is given in Chapter 2.
1.3.3 Liquid water
Despite not having been applied to PEMFCs, techniques using optical fibre-ends,
without FBGs, as reflectometers to detect two-phase regimes have been demon-
strated [53, 54]. Multi-point probes were used to measure bubble size and velocity
with time resolved intensity-based measurements that were binary, depending on the
phase of the fluid; gas or liquid. Two-phase flow occurs in the gas channels of PEM-
FCs, and the measurement of droplet size and velocity using this technique could
be very useful. An advantage of the technique is that it requires fairly rudimentary
equipment, but there is no multiplexing capability.
One technique that could be used to detect water droplets and has multiplexing
capabilities like FBGs, but requires expensive interrogation equipment is optical time
domain reflectometry (OTDR). This technique is typically used to locate defects along
long spans of fibre, and works by measuring the backscattered light intensity from
a fibre following a light pulse. Defects in the fibre show up as irregularities in the
time trace, and can be located along the fibre simply by using the time of flight and
the velocity of light in the silica fibre. “Defects” can be created along the fibre and
made sensitive to water by etching to the core. Expense of interrogation equipment
increases with desired spatial resolution and examples of OTDR being done on length
scales found inside a PEMFC are not reported in the literature.
A promising FBG technique that can be used to detect liquid water, and could
equally well be applied to study flooding phenomena in PEMFCs, involves etching

23
away the fibre cladding to allow interaction of the evanescent field. The reflected
spectrum of the FBG becomes sensitive to the refractive index of the surrounding
medium. A more detailed discussion of evanescent field based sensing with FBGs
is provided in the following chapter, as it is the basis for the sensor presented in
Appendix D.
1.4 Objectives
The overall objective of this research is to develop and demonstrate optical fibre
measurement techniques for temperature, RH and liquid water in PEMFC. For the
temperature technique, the objective is to install multiple FBG temperature sensors
into the active area of an operating fuel cell and compare data to a co-located micro-
thermocouple for validation. For relative humidity, the objectives include ex situ
validation of an improved polymer-coated FBG sensor design followed by in situ
demonstration of the improved sensor design. The objective for the liquid water
detection is to develop an evanescent field based FBG sensor to measure droplet
speed and size in a micro flow channel without perturbing the two-phase flow.
1.5 Organization of Dissertation
This dissertation is presented in the manuscript format, where the most detailed
aspects of the research are contained in published and submitted manuscripts that
are included in the appendices. The chapters leading up to the appendices serve to
provide context and a framework that links the manuscripts in terms of background,
motivation and objectives.
Much of the background presented in Chapter 1 has focused on PEMFCs to pro-
vide the design space for the sensors developed during this thesis work. Also in

24
Chapter 1, it became clear that optical fibre Bragg grating sensors are a potentially
feasible platform on which to develop a suite of sensors for temperature, humidity
and liquid water. The manuscripts presented in Appendices A-D are in fact individ-
ual proof-of-concept studies on the development or implementation of FBG sensors
for these three parameters in PEMFCs. FBGs being the common thread between
the manuscripts, Chapter 2 is devoted to optical fibre and FBGs with emphasis on
the sensing mechanisms behind the FBG techniques for each parameter. In Chapter
3 the contributions presented in the manuscripts are summarized, which includes a
brief discussion of the objectives, methods, and results for each paper. In the fourth,
and final chapter of the thesis, the key conclusions and future considerations for this
work are discussed.

25
Chapter 2
In-fibre Bragg Gratings
The potential of fibre-optics for in situ diagnostics in PEMFCs was highlighted in
Chapter 1. This chapter is focused on the properties of optical fibre and in-fibre Bragg
gratings for this application. Before discussing the specific sensing mechanisms for
temperature, RH, and liquid water, the basic principles of optical fibre and FBGs
are presented. Related techniques reported in the literature are cited to establish the
feasibility and novelty of the sensors developed in the present work.
2.1 Optical fibre and FBGs
The geometry of an optical fibre typically comprises two concentric solid glass cylin-
ders . The inner cylinder is called the core, and the outer cylinder the clad. The
core has an index of refraction, n1, that is slightly higher than the cladding index,
n2 (Figure 2.1a). This is achieved with the addition of dopants to the silica used in
the core. This slight difference in index is sufficient to guide light in the core by total
internal reflection, provided the cladding is thick enough to contain the evanescent
waves associated with total internal reflection [55].
The most common type of optical fibre for telecommunications and for commer-

26
cial FBG sensors is asingle-mode fibre. A typical single-mode fibre has a cladding
diameter of ∼125 µm and a core diameter of ∼8 µm. These dimensions allow only
single mode waves (solutions to Maxwell’s equations) to propagate along the fibre.
Single mode propagation ensures low modal dispersion, which is particularly impor-
tant for information transfer over long distances. Wavelengths in the near infrared
(1.3-1.5 µm) are typically used in single-mode fibre, since this bandwidth corresponds
to minimal absorption in silica glass [55].
Due to low power requirements and high data transfer rates, optical fibre began
replacing copper wire for telecommunications soon after the fibre was developed in the
1970s. Since then, numerous sensing techniques covering a broad range of applications
have emerged based on fibre optics [56, 57]. The proliferation in sensing applications
can be attributed to optical fibre being inherently small, chemically resistant and
immune to electromagnetic interference. Despite these useful properties of optical
fibre, it is in general more challenging than copper wires to work with because of
the small diameter and brittle nature of the fibre. Furthermore, in contrast to the
mechanical contact or soft solder connections that can be made easily with wires,
optical fibres require close tolerance mechanical or fusion splicing for their connection.
To make the fibre easier to handle during installation, polymer coatings are often
applied to strengthen the fibre and make it more flexible.
Among the many types of optical fibre sensors is the FBG. The FBG is unique
in that it offers the possibility of spatially distributed multi-parameter measurements
on a single fibre [58]. Because of these capabilities, FBGs have found numerous
applications as single-point sensors or as distributed sensors. They have become
particularly important in the the field of structural health monitoring [58,59].
An FBG occupies a short length (typically 1mm-10mm) of optical fibre and is
comprised of a periodically modified index of refraction along the core (Figure 2.1a

27
Core Refractive Index
n
n2
n3
Spectral Response
P P P
Input Transmitted Reflectedλ λ λ
λB
neff
λB
light source
spectrumanalyzer(λB)
opticalcoupler FBG
core
clad
Bragg grating (1-10 mm)
Λ
a)
b)
c)
d)
(Ø=8 µm)
(Ø=125 µm)
λB = 2 neff Λ
n(r)
r
r
z
∆n=0.4%n2
n1
Figure 2.1: (a) Schematic (not to scale) of an FBG sensor written in single modeoptical fibre. (b) Refractive index profile along the length of the FBG created by pat-terned UV exposure. (c) Typical spectral response of FBG sensor when illuminatedwith broadband light. (d) Basic optical setup for measuring FBG spectra.
and 2.1b). This pattern of modified indices is typically photo-induced by UV laser,
using either interference or phase mask techniques. The original profile of the fibre

28
is unaffected by the grating so that it is indistinguishable from other regions of the
fibre.
When light transmitted along an optical fibre encounters a grating, a narrow band
of wavelength is preferentially reflected (Figure 2.1c). In accordance with Bragg’s law,
the center-wavelength of this narrow band (i.e., the Bragg wavelength) is given by
λB = 2neffΛ, (2.1)
where Λ is the spatial period of the grating and neff is the effective index of refraction
in the core. The effective index of refraction is approximated by the average index
along the grating. See Figure 2.1b. Due to the evanescent field that penetrates into
the cladding, however, neff also depends partly on n1, the index of the clad. If the
cladding is etched down into the region of evanescent field penetration, neff becomes
dependent on the refractive index of the surrounding medium. This is the principle
behind evanescent field or wave sensors, which are discussed later in the chapter.
The shape of the reflected FBG peak is largely determined by the length of the
grating, L, and the magnitude of the index difference in the grating,
∆n = n3 − n2. (2.2)
This is expressed quantitatively in the following equations for maximum reflectiv-
ity [58]:
Rmax = tanh2
[π
(∆n
n2
)(L
Λ
)](2.3)
and the full width half maximum (FWHM) bandwidth, ∆λW , of the peak [58]
∆λW = 2λB
[(Λ
L
)(∆n
2n2
)]1/2
. (2.4)

29
The typical Bragg wavelength of commercially available FBGs is around 1550 nm.
Other commonly used Bragg wavelengths for FBGs are 800 nm and 1300 nm. Maxi-
mum reflectivity values are typically 90% of the peak intensity of incident light. The
FWHM of the peak typically varies from as narrow as 0.2 nm for 10 mm long gratings
to 1 nm for 1 mm gratings [58].
The reflected spectrum of an FBG can be measured by a number of techniques [58],
an example of a common method is shown in Fig. 2.1(d). The FBG is illuminated with
a broadband light source, and the reflected light is coupled into an optical spectrum
analyzer for measurement. From this spectral data, the centre of the peak can be
calculated to obtain the Bragg wavelength of the sensor. For the detection of several
FBGs with different Bragg wavelengths on a single fibre, interrogation units that
employ wavelength division multiplexing are commonly used [60].
2.2 Thermal and mechanical influence on FBGs
Because of the Bragg condition (Eq.2.1), FBGs are able to measure both strain and
temperature. Both the refractive index, neff , and the spatial period of the grating, Λ,
are functions of applied strain and temperature. The difficulty of using FBGs as strain
or temperature sensors, therefore, is often in the decoupling of these parameters.
Assuming the refractive index, neff (ε, T ), and the grating spacing, Λ(ε, T ), are
linear functions of strain and temperature, a Taylor expansion of Eq. 2.1 wavelength
about a reference state of temperature and strain yields [58]
∆λBλB
= εz −n2eff
2(εzp12 + εr(p11 + p12)) + ξ∆T (2.5)
The first term, εz, is the thermally and mechanically induced axial strain in the
grating, which changes the grating pitch. The second term represents the strain-optic

30
effect, where p11 and p12 are the principal components of the strain-optic tensor and
εz and εr are the corresponding axial and radial strains, respectively. The third term
represents the thermo-optic effect, where ξ is thermo-optic coefficient.
For a Bragg grating written in single mode optical fibre subjected only to axial
strain the following simplified version is often used [61],
∆λBλB
= (1 − Pe)εz + ((1 − Pe)α + ξ)∆T, (2.6)
where
Pe = p12 − ν(p11 + p12) (2.7)
represents the effective strain optic coefficient in which the radial strain is accounted
for by the Poisson effect.
Equation 2.6 is a superposition of the mechanical and thermal response of the
FBG; α is the coefficient of thermal expansion (CTE) of the fibre; and ξ is the
thermo-optic coefficient. The temperature sensitivity of a bare fibre is primarily due
to the thermo-optic effect [62].
The temperature response of an FBG written in standard single mode fibre is
linear up to 85 ◦C with a typical sensitivity of ∼10 pm◦C−1 for bare fibre [62]. At
higher temperatures the sensitivity increases and becomes slightly non-linear [62]. In
the operating range of a PEMFC (20-90◦C) the FBG response to temperature can be
assumed to be linear.
The UV induced change in refractive index that forms the grating decays over
time at a rate that increases with temperature due to thermal excitation of trapped
electrons [63]. Edrogan et al. [63] used experimental data to develop a model for
accelerated aging of UV induced Bragg gratings at various temperatures. The model
suggests that at a temperature of 400K (higher than in PEMFCs), the decay in

31
reflectivity of an FBG starting at 90% reflectivity is expected to be negligible over
the lifetime of a fuel cell.
A typical value for the sensitivity of an FBG in a bare fibre to applied axial strain
is ∼1.2 pmµε−1 at λB=1550 nm [64]. The sensing of many parameters (e.g. pressure,
electromagnetic fields, chemicals, humidity) relies on the strain sensitivity of the
FBG. Transducing layers or structures can be used to convert these measurands into
strain in the fibre. For an FBG humidity sensor, for example, the glass fibre has been
coated with a hygroscopic polymer that expands in the presence of moisture [52,61,65].
This expansion induces strain in the fibre, which is detected as a shift in the Bragg
wavelength.
With the sub-picometer resolution of current multiplexing interrogators [66] pre-
cise measurement of strain (and other parameters) and temperature is possible, with
resolution comparable to conventional strain gauges and thermocouples (<1 µε,<0.1◦C).
Due to the co-sensitivity of FBGs to strain and temperature, temperature compen-
sation of sensors is often necessary. This can be done using a co-located FBG with a
different Bragg wavelength [32,67].
2.2.1 FBG humidity sensing
Of particular interest in this research is humidity sensing using FBGs, which, as
mentioned can be achieved by applying hygroscopic polymer coatings to the fibre.
The polymer coating acts as a strain transducer, transferring strain into the fibre as
it absorbs moisture. The first polymer reported as a transducing layer for FBGs was
polyimide. Polyimide is a commonly used polymer for protective coating on optical
fibre due to its thermomechanical stability. Polyimide is also hygroscopic. In 2001, it
was demonstrated by Giaccarri et al. that commercial FBGs recoated with polyimide
for protection produced a linear, reversible shift in Bragg wavelength with changes in

32
RH [68].
Soon after demonstration of the sensitivity of polyimide-recoated commercial
FBGs by Giaccarri et al., the FBG humidity sensor concept was investigated fur-
ther by Yeo et al. and Kronenberg et al. [52,61]. In their studies they systematically
tested the steady state response of FBGs on standard single mode fibre coated with
varying thicknesses of polyimide. They found that a simple 1-D axial strain model
could be used to predict experimental results for sensitivity as a function of coating
thickness.
Achieving sufficient sensitivity to enable 1% RH resolution with the sensor design
of Yeo et al. and Kronenberg et al., polyimide coatings of ∼10 µm were required.
With coatings if this thickness, however, it was shown by Yeo et al. that the response
times are prohibitively long (τ63 ∼5 min) for dynamic measurements within PEMFCs
[37, 61]. An improved sensor design that enables high resolution and fast response
measurements was presented by David et al. [31,32]. The sensor is based on an etched
single mode optical fibre with thinner polyimide coatings. The details of this sensor
are discussed in Appendices B and C.
2.3 Evanescent field sensors
Another sensing mechanism for optical fibre and FBGs is based on evanescent field
interaction. The evanescent field describes the part of the electromagnetic wave so-
lution for an optical fibre that decays exponentially into the cladding region of the
fibre. See Figure 2.2. Sensing is achieved by reducing the thickness of the cladding
so that the evanescent field interacts with the surrounding medium. With this inter-
action, the index of refraction of the guided mode in the core becomes influenced by
the refractive index of the surrounding medium. Based on this principle, numerous

33
optical fibre and FBG chemical [67, 69], biological [70] and liquid refractive index
sensors [6, 71,72] have been developed in recent years.
r
E(r)
n(r)
evanescent field
rcore
Figure 2.2: Schematic showing the refractive index profile n(r) of a standard singlemode optical fibre and the associated electric field profile E(r) of the lowest prop-agation mode. The part of the electric field that extends beyond the core is theevanescent field.
For FBGs with sufficiently reduced cladding thickness, the change in refractive
index of the surrounding medium is detected as a shift in the Bragg wavelength. The
dependence of the Bragg wavelength on the index of its surrounding medium can be
written as
∆λB = 2∆neff (ns)Λ (2.8)
where neff has simply been written as a function of ns, the refractive index of the
surrounding medium. The dependence neff on ns for an FBG written in standard
single mode fibre and operating at 1550 nm was solved numerically by Iadicicco et
al. [6] for different cladding diameters. See Figure 2.3. This dependence was verified
experimentally by testing the response of an FBG that was progressively etched to
smaller diameters using hydrofluoric (HF) acid until the cladding was fully removed,
leaving only the 8.3 µm diameter core.
34
Fiber Bragg Gratings Evanescent Wave Sensors 129
Fig. 14 Schematic of a uniform THFBG
allowing simpler and lower cost equipment for practical sensor interrogation. Sim-ilarly to FBGs written in D-shaped fibers, the sensitization through cladding re-moval depends on the residual fiber diameter and the surrounding refractive index.Figure 15 shows the dependence of the effective refractive index corresponding tothe fundamental guided mod on the SRI at 1550 nm for different values of etchingdepth, full etching case is referred to completely removed cladding layers and Dth
represents the residual cladding diameter. As expected, evanescent wave enhance-ment occurs for SRI close to the core refractive index approaching its maximumin the case of completely removed cladding similarly to FBGs written in D-shapedfibers [34]. In 2003, ThFBGs have been widely investigated by our group to the aimof assessing the fabrication process [49, 50].
Indeed, one of the main disadvantage of ThFBGs relies on the significant weak-ening of the grating structure especially in cases where maximum sensitivity isrequired. Proper fabrication procedures and packaging are thus needed to providereliable SRI refractometers employing this configuration.
In Fig. 16(a), a schematic of the sensor packaging for sensor preparation and test-ing is shown. A PMMA (poly methyl methacrylate) tube was properly designed andrealised to be used for both the etching process and further sensors operation. Thefiber was fixed at the two bases using an epoxy based resin (EPON 828 by SHELL)
1.34 1.36 1.38 1.4 1.42 1.44 1.461.455
1.456
1.457
1.458
1.459
Full EtchingD
Surrounding Refractive Index
n eff
1.459
Full EtchingDTh = 9 μ mDTh = 10 μ mDTh = 12 μ mDTh = 16 μ mDTh = 20 μ m
Fig. 15 Effective refractive index behaviour at 1550 nm for different etching depthFigure 2.3: Numerical results of Iadicicco et al. showing the sensitivity of the effectiverefractive index to the surrounding refractive index for different cladding diameters.Reproduced with permission from IEEE [6]
Figure 2.3 shows that the sensitivity of neff to changes in ns is low for ns=1.33
(water) and increases to a maximum when the surrounding medium has the index of
glass (ns ∼1.45). This increase in sensitivity is due to a larger penetration depth of
the evanescent field for higher index surrounding media. The penetration depth is the
distance it takes for the field intensity to drop to 1/e of its value at the core cladding
interface. The penetration depth depends on the refractive index of the core and
the cladding or, in the case of a fully etched cladding, the index of the surrounding
medium [73]. For low index surroundings, as is the case with water (ns ∼1.33) and
more so with air (ns ∼1.0), the light is well confined within the core leading to a
weaker dependence of neff on ns.
This low response of an etched FBG in low index media such as air and water is a
design consideration for detecting two-phase flow in a PEMFC. Based on the above
discussion, and extrapolation of the sensitivity curve shown in Figure 2.3, an FBG

35
in standard single mode fibre needs to be etched close to the core to elicit a strong
response to phase for water. Such a reduction in fibre diameter, however, leaves the
fibre prone to breakage and difficult to work with during sensor construction. The
difficulty of accessing the evanescent field in standard single mode optical fibre has
lead researchers to design FBG evanescent field sensors based on novel methods of
accessing the core and special types of fibre. Rather than uniform chemical etching
of the cladding with HF, alternative methods of accessing the core in standard fibre
have included femtosecond laser micro-machining [74, 75] and side polishing of the
cladding [67]. Starting with a specialty D-shaped fibre on the other hand, which has
a flat side that is in close to proximity (∼14µm) to the core (Fig. 2.4, less cladding
removal is required to access the core, leaving substantially more fibre to work with
in sensor fabrication.
Figure 2.4: Schematic of D-shaped fibre with FBG (not to scale). Use of this fibrerequires less etching for evanescent field based sensors.
The side-polished technique was demonstrated by Shroeder et al. [67] in an FBG
evanescent field sensor for hydrogen gas. An FBG written in standard single mode
fibre was embedded into a glass block and then polished leaving a residual cladding

36
thickness of less than 2 µm. The authors show that the sensitivity to refractive index
of evanescent field FBG sensors can be improved by applying thin layers of high
refractive index dielectric materials or metals. In their sensor they applied a thin
layer of palladium, the refractive index of which changes with hydrogen concentration.
Shroeder et al. also demonstrated the use of a co-located full cladding FBG for
temperature compensation in their sensor.
Although the technique of mechanical side-polishing used by Schroeder et al. was
effective in the demonstration of their sensor, the ability to uniformly polish the
length of the FBG with sub-micron tolerance could prove challenging to reproduce.
An alternative approach to side-polishing is the use of D-shaped optical fibre which,
as mentioned, requires minimal chemical etching to access the core. Chemical etching
ensures uniform exposure of the evanescent field along the length FBG and is easily
reproducible. An evanescent field FBG refractive index sensor based on D-shaped
fibre was demonstrated by Meltz et al. [76]. For this sensor, the cladding on the flat
side of the D-fibre was etched with HF to within an estimated 0.5 of the core. The
sensor response from air to water was measured as a shift in the Bragg wavelength of
approximately 200 pm, which would give a signal to noise ratio of ∼200 when using
current FBG interrogation systems. Implementation of this sensor into a microchan-
nel to measure droplet speed and size is one of the objectives of the work presented
in this thesis. Development of such a sensor is discussed in Appendix D.
2.4 FBGs in PEMFCs
The mechanisms for the measurement of temperature, RH, and liquid/gas phase
transitions have been presented. From the above discussions, FBGs emerge as a
feasible solution for measurement of these parameters in the PEMFC environment.

37
In the context of distributed monitoring of temperature, RH and water in PEMFC
stacks for research, and potentially commercial applications, FBGs possess promising
characteristics that warrant further development and investigation:
• Small size: optical fibres are nominally 125µm in diameter, and as small 10 µm
when etched [6]. The small size of FBGs allows for installation into the flow
channels of PEMFC plates and possibly into the other structures comprising the
MEA. Installation of current capacitive RH sensors is limited by their relatively
large size.
• Environmental compatibility : glass fibre is chemically inert and immune to elec-
tromagnetic interference. In the high humidity, high temperature and electro-
chemically active environment of a PEMFC, corrosion resistance and electro-
magnetic interference are significant barriers to the use of wired electronic sen-
sors in this application. In addition, glass fibre is tolerant to high temperatures,
much higher than occur inside a PEMFC.
• Multi-parameter and multiplexed sensing : FBG sensors for temperature, RH
and refractive index (water) have been demonstrated in the literature and in
the research presented in this dissertation [31,32,76]. One of the primary moti-
vations for using FBGs for this application is that they are wavelength encoded
and, therefore, can be multiplexed. This leaves open the possibility of combining
sensors for all three parameters on a single fibre for distributed measurements.
With other techniques seen in the literature, such integrated measurement of
multiple parameters is not possible.
Despite their clear benefits for this application, as listed above, optical fibre and
FBGs present themselves with inherent challenges for sensor development. In working
with optical fibre, the challenges are mainly due to its fragility when not coated

38
and the restriction on bending of the fibre. The minimum suggested bend radius of
standard single mode optical fibre is ∼15 mm. Excessive bending of the fibre causes
light loss and the possibility of breakage. This limitation is a major consideration for
implementation of FBGs into the low-profile planar structures of a PEMFC.
As discussed above in this chapter, the sensitivity of FBGs to strain and tempera-
ture is the basis for many FBG sensors. It is this co-sensitivity that poses a significant
challenge in sensor design. For an FBG used strictly as a temperature or RH sensor
for example, isolation from extraneous strain must be incorporated into the design so
only the desired measurand is being measured. For FBG sensors that are based on
strain, like the polymer coated RH FBG sensor for example, co-sensitivity to temper-
ature is unwanted and requires temperature compensation. This adds an element of
design challenge, but fortunately can be accomplished using a co-located FBG that
is isolated form strain.
2.4.1 Techno-economics of FBG sensing system
Based on the discussions of the previous sections and the work presented in the
manuscripts found in the appendices of this thesis, FBG based techniques for the
in situ monitoring of temperature, RH and liquid water are technically feasible. By
installing FBGs at selected locations throughout a fuel cell stack, quasi distributed
real time monitoring of these parameters can provide feedback for the control of
optimal operating conditions and detect failure modes such as hotspots and flooding.
Currently, the cost of FBG sensors (∼$100/FBG) and the associated monitoring
system (∼$10k-$20k) is prohibitive for the implementation of distributed FBG sensing
systems in all but the most high value applications (i.e., fuel cell buses and research
stacks). This high cost of implementation may be prohibitive at the moment, but
provides incentive for the efficient usage of FBGs within a PEMFC to obtain the most

39
meaningful measurements.
A schematic representation of an FBG array distributed throughout a PEM fuel
cell stack is depicted in Fig. 2.6. Current wavelength division multiplexing interroga-
tion systems have multiple channels, each capable of monitoring up to ∼40 FBGs on
a single fibre. As mentioned, however, economic considerations require efficient use
of FBGs, and hence careful consideration of the locations of the FBGs throughout
the flow field of the bipolar plates and throughout the stack.
For temperature measurements, which are useful for the detection of hotspots
forming in the membrane, locating the FBGs nearest the membrane can be achieved
by embedding the FBG into the lands, between the flow channels. This technique
was demonstrated in the manuscript presented in Appendix A. For the measurement
of relative humidity, the FBG RH sensor should be located in the flow channel, but in
an area that is not prone to flooding. From the diagrams of the common two-phase
flow patterns that occur in PEMFC operation (Figure 1.5), the centre of the flow
channel is the least likely to be covered by a film of liquid water. Conversely, for the
measurement of liquid water using FBGs, installation on the side wall of the channel,
where film flow regimes are most common, would be most useful. A schematic of the
various sensor locations is shown in Fig.2.5.

40
Figure 2.5: Schematic showing the preferred installation locations of FBG sensorswithin the bipolar plate.
Figure 2.6: Schematic showing a multiplexed FBG sensor implemented into a PEMFCstack.

41
Chapter 3
Summary of Key Results
Selected studies undertaken during this dissertation resulted in significant contribu-
tions that were presented at international conferences and published in science and
engineering journals. These studies are described in detail in the manuscripts in-
cluded in Appendix A through D. This chapter serves to provide an overview of the
motivations, methods and key results of these studies in logical progression. The
order of the sections in this chapter, and the corresponding appendices, represent a
progression from sensor implementation to sensor design improvement to novel sensor
development for the parameters of temperature, RH and liquid water, respectively.
3.1 In-fibre Bragg Grating Sensors for Distributed
Temperature Measurement in a Polymer Elec-
trolyte Membrane Fuel Cell
Temperature distribution data inside commercial PEM fuel cell stacks could be used
to improve the effectiveness of cooling systems and to identify where potentially dam-
aging hotspots may occur across the membrane. Monitoring of the temperature dis-

42
tribution over such a large active area using current state-of-the-art techniques is
technically challenging. As discussed, many of these challenges can be overcome by
using optical fibre Bragg grating sensors. The primary objective of this study was
to demonstrate the feasibility of using FBG sensors to measure temperature near the
MEA in an operating fuel cell.
To demonstrate feasibility, four FBG sensors were installed in a single test cell
and used to measure steady-state and transient temperature profiles. To measure the
temperature near the MEA, the FBGs were installed on the lands between the flow
channels in the cathode collector plate. In contrast to electrical sensors that use wire
leads, particular attention needed to be given to strain relief and minimizing bending
of the optical fibre. Validation of the installation technique was determined with in
situ calibration against a co-located thermocouple. The calibration of the sensors was
linear and repeatable, with sensitivities in good agreement with the expected value.
Resolution of the installed and calibrated FBG sensors was shown to be 0.2◦ C
over the operating range of the fuel cell, offering sufficient resolution to measure small
gradients between sensors. During cell operation under co-flow conditions, steady-
state temperature profiles showed gradients increasing from inlet to outlet. This
result was consistent with measurements presented in the literature that were made
using other techniques [1, 2, 33]. The small thermal mass of the FBG, combined
with the installation technique enabled fast response in situ measurements that were
comparable to, if not more insightful than those made with the co-located micro-
thermocouple.
This work demonstrated for the first time that FBGs can be embedded inside a
PEM fuel cell to reliably measure temperature dynamically with resolution compa-
rable to micro-thermocouples. Based on the results of this study, it was shown that
this technique could prove useful as a diagnostic tool to identify hot spots on the

43
membrane and validate thermal management strategies in commercial stacks.
For further information, the reader is directed to Appendix A, or [31].
3.2 Parametric Study of an FBG Relative Humid-
ity Sensor
Another key parameter in the water management of PEM fuel cells is the relative
humidity (RH) of the gases inside the cell. The RH inside the cell should be high
enough to ensure good membrane hydration. When this is achieved, ohmic losses
in the membrane are minimized. Recently reported in situ measurements of RH
in single cell PEMFCs have shown significant gradients across the flow field as well
as interesting dynamic behaviour [37]. None of these techniques, however, can be
implemented into commercial bipolar plates due to sensor size [37] or performance
limitations [24,33]. As discussed above, FBG sensors possess many qualities that are
well suited towards their implementation in PEMFCs. The objective of this study
was to design a fibre optic RH sensor that addresses the response time and sensitivity
limitations of the previous designs such that it can be implemented as a diagnostic
tool in PEM fuel cells.
The proposed sensor design is based on a polyimide recoated FBG. The polymer
coating swells in the presence of increased RH, imparting strain on the fibre, which is
detected as a Bragg wavelength shift. Such a design, consisting of a standard single
mode fibre coated with polyimide was previously reported, but lacked the sensitivity
and response time required for measurements inside a PEM fuel cell. The method for
improving sensitivity and response time was to thin the optical fibre, which for equal
coating thicknesses, provides a more sensitive response than a standard diameter
FBG. Less coating thickness yields a faster response since it is a diffusion driven

44
response.
Sensors of varying fibre diameter and coating thickness were fabricated and tested
for steady-state and transient response. The experimental investigation was compli-
mented by 1-D and 3-D numerical simulations of the design. A coating device was
constructed to apply thin and uniform coatings of the polyimide Pyralin R©. Transient
simulations and experiments on standard diameter fibres suggested that a coating
thickness of less than 4µm is needed to achieve a response time of 5 s, competitive
with commercial capacitive RH sensors. Such a thin coating on a standard single
mode fibre, however, yields a low sensitivity and thus low sensing resolution.
Both 1-D and 3-D models suggested a increase in sensitivity when the fibre diam-
eter is reduced. Using a 2.5 µm coating on a fibre with a diameter of 20 µm a seven
times increase in sensitivity over an unetched fibre was achieved. Tests showed that
the etched fibre sensor exhibited a linear, repeatable response to changes in RH over
the range of 15-95 %RH. Rapid recovery (20s) from saturation with liquid water was
also demonstrated, which is in contrast to commercial RH sensors.
The proof of concept study showed that an FBG RH sensor with sufficient sen-
sitivity and dynamic resolution can be realized. In addition to its application to
PEMFCs, this design may equally well be suited to many other applications.
For more information, please refer to Appendix B or [32]

45
3.3 Simultaneous In Situ Measurement of Tem-
perature and Relative Humidity in a PEMFC
using Optical fibre Sensors
In the previously discussed study, an FBG RH sensor with good dynamic resolution
was demonstrated. The objective of this study was to implement this FBG RH sensor
in a single cell PEMFC to demonstrate its feasibility. Two etched FBG RH sensors
with FBG temperature compensation were fabricated and installed in the cathode
flow-channels, one near the inlet and one near the outlet.
Using a method of installation that was similar to the one demonstrated for the
FBG temperature sensors [32], minimal intrusion to the flow-field was achieved. RH
and temperature data was acquired with the sensors while operating the cell under
dry conditions to obtain a steady-state polarization curve. The steady-state mea-
surements were consistent with related studies from the literature, which have shown
higher RH towards the outlet due to self-humidification [2]. RH levels approaching
100 %RH were measured near the outlet for high current densities.
Transient measurements were made during sudden changes in cell current. These
results exhibited RH transients inside a PEMFC on a time scale approaching the
sensor response time of ∼5 s.
In situ implementation of FBG RH sensors was demonstrated for the first time
in this work. The performance of the novel etched FBG RH sensor proved that
it is indeed well suited to application in PEMFCs. The contribution of feasibility
demonstration has set the course for a multiplexed FBG approach using the same
basic sensor design. In the interest of improved cell design, particularly with regard
to water management strategies, this technique could prove useful as a non-invasive
diagnostic tool.
46
For more information, please refer to Appendix C.
3.4 Fibre Bragg Grating Sensor for Two-Phase Flow
in Microchannels
Performance loss due to flooding in the flow channels and GDL of a PEM fuel cell is
common, particularly at high current densities [9]. Despite a general understanding
of flooding phenomena in a PEMFC and the associated degradation mechanisms,
however, there is a lack of in situ diagnostic tools for the detection of flooding.
In the studies summarized thus far, FBG sensors were demonstrated for non in-
vasive in situ measurements of temperature and RH in PEMFCs. To extend the use
of FBGs to include liquid water detection, the sensing mechanism of evanescent field
interaction was exploited in this work.
Previously reported FBG refractive index sensors based on this evanescent field
interaction are either extremely thin and prone to breakage [6], not easily repro-
duced [67], or not embedded into a surface [76]. Furthermore, none have been used
to detect two-phase flow on a surface. Surface embedding is essential to enable non-
intrusive measurements of two-phase flow in a microchannel, as would be needed in a
PEMFC. The objective of this study was to develop an FBG based liquid water sensor
for measuring and characterizing two-phase flow in a microchannel that is designed
to emulate a gas flow channel in a PEMFC.
Based on a D-shaped optical fibre, a refractive index sensor comprising two ad-
jacent FBGs was made by chemically etching the cladding to expose the evanescent
field. The D-fibre was embedded into a polydimethylsiloxane (PDMS) polymer sub-
strate. This substrate with the sensor was then used as a wall of a microchannel in
which two-phase flow regimes were created. Two adjacent FBGs with known spac-

47
ing were used in this sensor design so that the size and speed of a droplet could be
measured as it passed along the length of the fibre.
Sensor data was synchronously acquired with high speed digital video for valida-
tion and correlation. The validated sensor capabilities include excellent spatially and
temporally resolved measurements of slug flow and droplet flow regimes.
The initial strategy for measuring the convection speed of water droplets relied
on the use of two FBGs and was successfully demonstrated. The results however also
showed that in fact such measurements are also possible with a single FBG provided
it is short enough.
For more information on this study please refer to Appendix D.

48
Chapter 4
Conclusions and Future Work
4.1 Conclusions and Contributions
This dissertation was dedicated to the development and demonstration of FBG sen-
sor techniques for the measurement of temperature, humidity and two-phase flow in
PEMFCs. Techniques for the installation of FBG temperature and RH sensors into
fuel cell plates were developed to ensure reliable and repeatable measurements. These
installation techniques were validated experimentally by calibration and in situ mea-
surements in an operating fuel cell. Novel FBG sensors for RH and water detection
were developed and demonstrated. This development work spanned the disciplines
of heat transfer, diffusion, mechanics, optics, and microfluidics and involved a com-
bination of experimental and numerical modelling studies. The specific contributions
resulting from this dissertation are summarized below and organized with respect to
the four studies outlined in Chapter 3.
1. In-fibre Bragg Grating Sensors for Distributed Temperature Measurement in a
Polymer Electrolyte Membrane Fuel Cell:
In this work, the use of FBGs in a PEMFC was demonstrated for the first time.

49
A significant challenge of this component of the work is in sensor installation.
Key considerations for FBG temperature sensor installation in a PEMFC were
identified and implemented in the techniques. These installation design consid-
erations include the sensor proximity to the catalyst layer, sensor strain relief
and minimal bending of the fibre. In an effort to measure the temperature
close to the MEA, which is the area of most interest to fuel cell researchers, the
FBGs were located in grooves on the land areas between the flow channels of
the graphite collector plate. To promote heat transfer between the FBG and
the GDL rather than the flow plate, the groove was machined deeper directly
underneath the FBG sensor. This feature, combined with the small thermal
mass of the fibre contributed to good in situ temporal resolution of the FBG
temperature sensors. Angled holes were used at the entry point of the fibre into
the graphite plate. This feature is necessary to ensure minimal bending of the
fibre, as excessive bending of the fibre causes light loss, and the possibility of
fibre cracking and breakage.
2. Parametric Study of a Polymer-Coated Fiber-Optic Relative Humidity Sensor:
In this study, a polyimide-coated FBG based RH sensor was demonstrated with
significantly improved response time and sensitivity over previously reported
designs. Sensor response times of τ63 < 5s were demonstrated for thin poly-
mer coatings and a seven times increase in sensitivity was achieved by chemical
etching of the fibre cladding around the FBG. In addition, quick recovery from
saturation by liquid water was demonstrated for the sensor. These sensor char-
acteristics are particularly important for implementation of the sensor into a
PEMFC. Further to the experimental findings of this study, numerical analysis
of transient response of the sensor design was presented for the first time.

50
3. Simultaneous In Situ Measurement of Temperature and Relative Humidity in a
PEMFC Using Optical FIbre Senors:
Following the progression from sensor design to sensor implementation, the
aforementioned polymer-coated FBG RH sensor was used for in situ measure-
ments in a PEMFC. This was the first reported demonstration of FBG RH sen-
sors for fuel cell application. For the simultaneous temperature measurements
and temperature compensation of the RH sensitive FBG, a sensor comprising
an adjacent uncoated multiplexed FBG at a different wavelength was described.
Two of the sensors were embedded directly into the cathode flow channels of a
single test cell and were used to make real-time measurements of RH and tem-
perature during cell operation. Results showed that for an increased current
density, much larger increases in RH occur near the outlet than near the inlet,
a trend that has been reported in other studies. From the results, it was also
determined that RH transients inside a PEMFC exist on a time scale approach-
ing the sensor response time, proving that the sensor could provide information
on the dynamics of water transport in the MEA. The contributions of this work
serve to validate the contribution made in the previous study on sensor design
improvements for PEMFC implementation.
4. Fibre Bragg Grating Sensor for Two-Phase Flow in Microchannels:
An evanescent field based FBG sensor for surface measurements of two-phase
flow was demonstrated for the first time. The contributions of this work are
in the techniques of sensor fabrication and in the data analysis that suggests
the use of a simplified design for effective measurements. An etched D-shaped
fibre with two adjacent FBGs was cast into the surface of a PDMS polymer
substrate, which was then used as one of the surfaces in a PDMS microchannel.
High speed digital video of two-phase flow created in the channel was captured

51
synchronously with sensor data acquisition. The FBGs exhibited an on-off type
response to the passage of droplets, which correlated precisely with liquid water
flowing over the FBG locations. This correlation enabled the measurement of
droplet average velocity size using only the sensor data. Upon close inspection
of the correlated data, it was shown that for droplets larger than the FBG
length, a single FBG can be used to estimate the speed and size of a fast
moving droplet. This study suggests that an evanescent field FBG sensor could
be adapted for use in the flow-channel of a PEMFC to investigate droplet and
flooding phenomena. This new sensor concept could be applied, for example,
to micro-fluidic devices or to the detection of condensation.
4.2 Future Work
Although one of the key motivations for using FBGs in this work was their abil-
ity to be multiplexed, this functionality was only demonstrated in the temperature
compensation of the RH sensor. The development of multiplexed FBG sensors that
incorporate the sensors for temperature, RH, and phase that were developed during
this thesis work is reserved for future engineering work. Ideas for doing this include
the use of thinner fibre so that chemical etching is not needed for the RH sensor,
and the use of micro-machining techniques on the same fibre to access the evanescent
field for phase detection. Each sensor will consist of three adjacent FBGs, on for
each parameter, and will require the use of a package or superstructure to isolate the
sensor from extraneous mechanical strain.
Other future extensions of this work can be divided into the implementation of
fibre optic sensors for fundamental research into PEMFCs and implementation of
these diagnostic tools into commercial fuel cell plates for distributed monitoring. Of

52
particular interest is the potential for obtaining real time data under various operating
conditions to improve understanding of degradation mechanisms.

53
Bibliography
[1] M. Wang, H. Guo, C. Ma, Temperature distribution on the MEA surface of a
PEMFC with serpertine channel flow bed, Journal of Power Sources 157 (2006)
181–187. doi:10.1016/j.jpowsour.2005.08.012.
[2] G. Hinds, M. Stevens, J. Wilkinson, M. de Posta, S. Bell, Novel in situ measure-
ments of relative humidity in a polymer electrolyte membrane fuel cell, Journal
of Power Sources 186 (2009) 52–57.
[3] R. Anderson, L. Zhang, Y. Ding, M. Blanco, H. T. Bi, D. P. Wilkinson, A critical
review of gas-liquid two-phase flow in pem fuel cells, Journal of Power Sources
12 (2010) 123.
[4] J. Dillet, O. Lottin, G. Maranzana, S. Didierjean, D. Conteau, C. Bonnet, Di-
rect observation of the two-phase flow in the air channel of a proton exchange
membrane fuel cell and of the effects of a clogging/unclogging sequence on the
current density distribution, Journal of Power Sources 195 (2010) 2795–2799.
[5] A. Bazylak, Liquid water visualization in PEM fuel cells: A re-
view, International Journal of Hydrogen Energy 34 (2009) 3845–3857.
doi:10.1016/j.ijhydene.2009.02.084.

54
[6] A. Iadicicco, A. Cusano, A. Cutolo, R. Bernini, M. Giordano, Thinned fiber
bragg gratings as high sensitivity refractive index sensors, IEEE Photo 16 (2004)
1149–1151.
[7] J. Lariminie, A. Dicks, Fuel Cell Systems Explained, Wiley, New York, 2000.
[8] M. Mench, Fuel Cell Engines, John Wiley & Sons, Inc., 2008.
[9] N. Yousfi-Steiner, P. Mocoteguy, D. Candussco, D. Hissel, A. Hernandez,
A. Aslanides, A review on pem voltage dergadation associated with water
management: Impacts, influent factors and characterization, Journal of Power
Sources 183 (2008) 260–274.
[10] H. Li, Y. Tang, Z. Wang, e. al., A review of water flooding issues in the proton
exchange membrane fuel cell, Journal of Power Sources 178 (2008) 103–117.
[11] N. Djilali, P. Sui, Transport phenomena in fuel cells: from microscale to
macroscale, International Journal of Computational Fluid Dynamics 22 (2008)
115–133.
[12] I. EG&G Technical Services (Ed.), Fuel Cell Handbook, Seventh Edition, U.S.
Department of Energy, Office of Fossil Energy, National Energy Technology Lab-
oratory, Morgantown, West Virginia, 2004.
[13] M. Wilkinson, M. Blanco, E. Gu, J. J. Martin, D. P. Wilkinson, J. J. Zhang,
H. Wang, In situ experimental technique for measurement of temperature and
current distribution in proton exchange membrane fuel cells, Electrochemical
and Solid-State Letters 9 (2006) A507–A511.
[14] M. H. Wang, H. Guo, C. F. Ma, F. Ye, J. Yu, X. Liu, Y. Wang, C. Y. Wang,
Temperature measurement technologies and their application in the research

55
of fuel cells, in: Proceedings of the 1st International Conference on Fuel Cell
Science, Engineering and Technology, 2003, pp. 95–100.
[15] J. Lebæk, S. T. Ali, P. Møller, C. Mathiasen, L. P. Nielsen, S. K. Kær, Quantifi-
cation of in situ temperature measurements on a PBI-based high temperature
PEMFC unit cell, International Journal of Hydrogen Energy 35 (2010) 9943–
9953. doi:10.1016/j.ijhydene.2009.10.002.
[16] M. M. Mench, D. J. Bufford, T. W. Davis, In situ temperature distribution
measurement in an operating polymer electrolyte fuel cell, in: Proceedings of
the IMECE’03 2003 ASME International Mechanical Engineering Congress &
Exposition, ASME, Washington DC, (USA), 2003, p. 14 pp.
[17] G. Zhang, L. Guo, L. Ma, H. Liu, Simultaneous measurement of current and
temperature distributions in a proton exchange membrane fuel cell, Journal of
Power Sources 195 (2010) 3597–3604. doi:10.1016/j.jpowsour.2009.12.016.
[18] S. He, M. M. Mench, S. Tadigadapa, Thin film temperature sensor for real-time
measurement of electrolyte temperature in a polymer electrolyte fuel cell, Sensors
and Actuators A 125 (2006) 170–177. doi:10.1016/j.sna.2005.05.021.
[19] C.-Y. Lee, S.-J. Lee, C.-L. Hsieh, Application of micro sensor on diagnosis of
micro fuel cells, in: Proceedings of the 2nd IEEE international conference on
Nano/Micro Engineered Molecular Systems, IEEE, 2007, pp. 434–437.
[20] J.-R. Lee, H. Tsuda, B.-Y. Koo, Single-mode fibre optic Bragg grating sensing
on the base of birefringence in surface-mounting and embedding applications,
Optics & Lasers Technology 39 (2007) 157–164.

56
[21] K.-H. Lee, Y.-D. Su, S.-J. Chen, F.-G. Tseng, G.-B. Lee, Microfluidic systems in-
tegrated with two-dimensional surface plasmon resonance phase imaging systems
for microarray immunoassay, Biosensors and Bioelectronics 23 (2007) 466–472.
[22] Chi-Yuan Lee, Guan-Wei Wu, Chi-Lieh Hsieh, In situ diagnosis of micrometal-
lic proton exchange membrane fuel cells using microsensors, Journal of Power
Sources 172 (2007) 363–367. doi:10.1016/j.jpowsour.2007.07.032.
[23] K.-S. Lee, R. H. Kim, D.-Y. Yang, S. H. Park, Advances in 3D
nano/microfabrication using two-poton initiated polymerization, Prog. Polym.
Sci. 33 (2008) 631–681.
[24] C.-Y. Lee, C.-H. Lin, A novel integration approach for combining the micro
thermal sensor and stainless steel foil as gas diffusion layer in micro fuel cell,
Renewable Energy 35 (2010) 759–762. doi:10.1016/j.renene.2009.09.011.
[25] C.-Y. Lee, C. Chang, P.-C. Chan, R.-D. Huang, M.-S. Tong, Fabrication of
Micro-sensors based on a parylene thin-film substrate for monitoring proton ex-
change membrane fuel cells, in: Proceedings of the 2010 5th IEEE International
Conference on Nano/Micro Engineered and Molecular Systems, IEEE, Xiamen
(CN), 2010, pp. 102–105.
[26] C.-Y. Lee, C. Chang, W.-J. Hsieh, W.-Y. Fan, C.-Y. Huang, C.-Y. Chao, Flexible
micro-sensors on stainless steel foil for monitoring proton exchange membrane
fuel cells, in: Proceedings of the 2010 5th IEEE International Conference on
Nano/Micro Engineered and Molecular Systems, 2010, pp. 106–109.
[27] C. Lee, F. Weng, C. Cheng, H. Shiu, Shiqah-Ping Jung, Wen-Chen Chang,
Pin-Cheng Chan, Wen-Ting Chen, Chung-Ju Lee, Use of flexible micro-
temperature sensor to determine temperature in situ and to simulate a pro-

57
ton exchange membrane fuel cell, Journal of Power Sources 196 (2011) 228–234.
doi:10.1016/j.jpowsour.2010.06.051.
[28] T. J. McIntyre, W. P. Partridge, S. W. Allison, L. C. Maxey, M. R. Cates,
C. L. Britton, R. Lenarduzzi, T. J. Toops, T. K. Plant, Fiber optic temperature
sensors for PEM fuel cells, Presentation Department of Energy Hydrogen, Fuel
cells, and Infraestructure program revier meeting (2005).
URL http://www.hydrogen.energy.gov/pdfs/progress04/ivh4 mcintyre.pdf
[29] K. Inman, X. Wang, B. Sangeorzan, Design of an optical thermal sen-
sor for proton exchange membrane fuel cell temperature measurement us-
ing phosphor thermometry, Journal of Power Sources 195 (2010) 4753–4757.
doi:10.1016/j.jpowsour.2010.02.071.
[30] S. Tao, J. C. Fanguy, X. Hu, Q. Yan, Fiber optic sensors for in situ real-time mon-
itoring PEM fuel cell operation, in: Proceedings of FUELCELL2005 Third Inter-
national Conference on Fuel Cell Science, Engineering and Technology, ASME,
Ypsilanti, Michigan (US), 2005, pp. 231–234.
[31] N. A. David, P. M. Wild, J. Hu, N. Djilali, In-fibre Bragg grat-
ing sensors for distributed temperature measurement in a polymer elec-
trolyte membrane fuel cell, Journal of Power Sources 192 (2009) 376–380.
doi:10.1016/j.jpowsour.2009.03.021.
[32] N. A. David, P. M. Wild, J. Jensen, T. Navessin, N. Djilali, Simultaneous in situ
measurement of temperature and relative humidity in a PEMFC using optical
fiber sensors, Journal of The Electrochemical Society 157 (8) (2010) B1173–
B1179. doi:10.1149/1.3436652.

58
[33] S. Basu, H. Xu, M. W. Renfro, B. M. Cetegen, In situ optical diagnostics for
measurements of water vapor partial pressure in PEM fuel cell, Journal of Fuel
Cell Science and Technology 3 (2006) 1–7. doi:10.1115/1.2133799.
[34] S. Basu, M. W. Renfro, H. Gorgun, B. M. Cetegen, In situ simultaneous mea-
surements of temperature and water partial pressure in a PEM fuel cell under
steady state and dynamic cycling, Journal of Power Sources 159 (2006) 987–994.
doi:10.1016/j.jpowsour.2005.11.091.
[35] S. Basu, M. Renfro, B. Cetegen, Spatially resolved optical measurements
of water partial pressure and temperature in a PEM fuel cell under dy-
namic operating conditions, Journal of Power Sources 162 (2006) 286–293.
doi:10.1016/j.jpowsour.2006.06.073.
[36] R. Sur, T. Boucher, M. Renfro, B. Cetegen, In situ measurements of water vapor
partial pressure and temperature dynamics in a PEM fuel cell, Journal of The
Electrochemical Society 157 (1) (2010) B45–B53. doi:10.1149/1.3247355.
[37] G. Hinds, M. Stevens, J. Wilkinson, M. de Podesta, S. Bell, Novel in situ mea-
surements of relative humidity in a polymer electrolyte membrane fuel cell, Jour-
nal of Power Sources 186 (2009) 52–57. doi:10.1016/j.jpowsour.2008.09.109.
[38] Z. Chen, C. Lu, Humidity sensors: A review of materials and mechanisms, Sensor
Letters 3 (2005) 274–295.
[39] R. H. Perry, D. W. Green (Eds.), Perry’s Chemical Engineers’ Handbook, 8th
Edition, McGraw-Hill, 2007.
[40] Sensirion, Datasheet SHT7x (SHT71, SHT75) Humidity and Temperature
Sensor, Online (2010).
URL http://www.sensirion.com/en/pdf/product information/Datasheet-humidity-sensor-SHT7x.pdf

59
[41] O. Herrera, W. Merida, D. P. Wilkinson, Sensing electrodes for failures
diagnostics in fuel cells, Journal of Power Sources 190 (2009) 103–109.
doi:10.1016/j.jpowsour.2008.08.034.
[42] M. Mench, Q. Dong, C. Wang, In situ water measurements in a polymer elec-
trolyte fuel cell, Journal of Power Sources 124 (2003) 90–98.
[43] W. P. Partridge, T. J. Toops, J. Green, T. R. Armstrong, Intra-fuel cell stack
measurements of transient concentration distributions, Journal of Power Sources
160 (2006) 454–461.
[44] J. Wu, X. Z. Yuan, H. Wang, M. Blanco, J. J. Martin, J. Zhang,
Diagnostic tools in PEM fuel cell research: Part II Physical/chemical
methods, International Journal of Hydrogen Energy 33 (2008) 1747–1757.
doi:10.1016/j.ijhydene.2008.01.020.
[45] Z. Zhang, J. Martin, J. Wu, H. Wang, K. Promislow, B. Balcom, Magnetic
resonance imaging of water content across the nafion membrane in an operational
fuel cell, Journnal of magnetic resonance 193 (2008) 259–266.
[46] D. Hussey, D. Jacobson, M. Arif, J. Owejan, J. Gagliardo, T. Trabold, Neutron
images of the through-plane water distribution of an operating fuel cell, Journal
of Power Sources 172 (2007) 225–228.
[47] I. Manke, C. Hartnig, N. Kardjilov, H. Riesemeier, J. Goebbles, R. Kuhn,
P. Kruger, J. Banhart, In situ synchrotron x-ray radiography investigations of
water transport in pem fuel cells, Fuel Cells 10 (2010) 26–34.
[48] D. Conteau, C. Bonnet, D. Funfschilling, M. Weber, S. Didierjean, F. Lapicque,
Detection of liquid water in pem fuel cells’ channels: design and validation of a
microsensor, Fuel Cells 4 (2010) 520–529.

60
[49] Q. Wang, L. Zhang, C. Sun, Q. Yu, Multiplexed fiber-optic pressure and tem-
perature sensor system for down-hole measurements, IEEE Sensors 8 (2008)
1879–1883.
[50] Y.-J. Rao, D. J. Webb, D. A. Jackson, L. Zhang, I. Bennion, In-fiber Bragg-
grating temperature sensor system for medical applications, J. Lightwave Tech-
nol. 15 (5) (1997) 779–785.
[51] T. L. Yeo, T. Sun, K. T. V. Grattan, Fibre-optic sensor technologies for humidity
and moisture measurement, Sensors and Actuators A 144 (2008) 280–295.
[52] P. Kronenberg, P. K. Rastogi, P. Giaccari, H. G. Limberger, Relative humidity
sensor with optical fiber bragg gratings, Optics Letters 27 (16) (2002) 1385–1387.
[53] H. Lim, K. Chang, C. Su, e. al., Bubble velocity, diameter, and void fraction
measurements in a multiphase flow using fiber optic reflectometer, Review of
Scientific Instruments 79 (12) (2008) 125105.
[54] M. Pettigrew, C. Zhang, N. Mureithi, D. Pamfil, Detailed flow and force mea-
surements in a rotated triangular tube bundle subjected to two-phase cross-flow,
Journal of Fluids and Structures 20 (2005) 567–575.
[55] S. G. Lipson, H. Lipson, D. S. Tannhauser, Optical Physics, Cambridge Univer-
sity Press, 2001.
[56] E. Udd (Ed.), Fiber Optics Sensors: An Introduction for Engineers and Scien-
tists, Wiley, New York, 1991.
[57] B. Lee, Review of the present status of optical fiber sensors, Optical Fiber Tech-
nology 9 (2003) 57–79.

61
[58] R. Measures, Structural Monitoring With Fiber Optic Technology, Academic
Press, San Diego, 2001.
[59] M. Majunder, T. K. Gangopadhyay, A. K. Chakroborty, K. Dasgupta, D. K.
Bhattacharya, Fibre Bragg gratings in structural health monitoring - Present
status and applications, Sensors and Actuators A 147 (2008) 150–164.
[60] Yun-Jiang Rao, In-fibre Bragg grating sensors, Meas. Sci. Technol. 8 (4) (1997)
355–375. doi:10.1088/0957-0233/8/4/002.
[61] T. L. Yeo, T. Sun, K. T. V. Grattan, D. Parry, R. Lade, B. D. Powell, Polymer-
coated fiber bragg grating for relative humidity sensing, IEEE Sensors 5 (5)
(2005) 1082–1089.
[62] K. O. Hill, G. Meltz, Fiber bragg grating technology fundamentals and overview,
Journal of Lightwave Technology 15 (1997) 1263–1276.
[63] T. Edrogan, V. Mizrahi, P. J. Lemaire, D. Monroe, Decay of ultraviolet-induced
fiber bragg gratings, Journal of Applied Physics 76 (1994) 73.
[64] Y.-J. Rao, In-fibre bragg grating sensors, Measurement Science and Technology
8 (1997) 355–375.
[65] L. Wang, Y. Liu, M. Zhang, D. Tu, X. Mao, Y. Liao, A relative humidity sensor
using a hydrogel-coated long period grating, Measurement Science and Technol-
ogy 18 (2007) 3131–3134.
[66] Micron Optics, Optical fiber sensors guide Fundamental & Applications (2005
2005).

62
[67] K. Schroeder, W. Ecke, R. Willsch, Optical fiber bragg grating hydrogen sensor
based on evanescent-field interaction with palladium thin-film transducer, Optics
and Lasers in Engineering 47 (2009) 1018–1022.
[68] P. Giaccari, H. G. Limberger, P. Kronenberg, in: Influence of humidity and
temperature on polyimide-coated fiber Bragg gratings, in: Proceedings OSA
Trends in Optics and Photonics Series: Bragg gratings, Photosensitivity, Poling
in Glass Waveguides, vol. 61, Washington, DC, USA, p. BFB2.
[69] W. Cao, Y. Duan, Optical fiber-based evanescent ammonia sensor, Sensors and
Actuators B 110 (2005) 252–259.
[70] A. Leung, M. Shankar, R. Mutharasan, A review of fiber-optic biosensors, Sensors
and Actuators B 125 (2007) 688–703.
[71] J. Chen, W. Bock, P. Mikulic, Simple fiber-optic refractive index sensor based
on evanescent higher order modes, in: Proceedings of the SPIE, Vol. 7386, 2009,
pp. 73861K–1–73861K–6.
[72] W. Liang, Y. Huang, Y. Xu, R. K. Lee, A. Yariv, Highly sensitive fiber Bragg
grating refractive index sensors, Appl. Phys. Lett. 86 (2005) 151122 (3pp).
[73] J. Dakin, B. Culshaw, Optical FIber Sensors: Principles and Components,
Artech House, Inc., 1988.
[74] K. Zhou, Y. Lai, X. Cheng, K. Sugden, L. Zhang, I. Bennion, A refractometer
based on a micro-slot in a fiber Bragg grating formed by chemically assisted
femtosecond laser processing, Opt. Express 15 (24) (2007) 15848–15853.
[75] H. Alemohammad, E. Toyserkani, J. Pinkerton, Femtosecond laser microma-
chining of fibre Bragg grating for simultaneous measurement of temperature and
concentration of liquids, J. Phys. D: Appl. Phys. 41 (2008) 185101.

63
[76] G. Meltz, S. J. Hewlett, J. D. Love, Fiber grating evanescent-wave sensors, in:
Proceedings of the SPIE, Vol. 2836, 1996, pp. 342–350.

64
Appendix A
In-fibre Bragg grating sensors for
distributed temperature
measurement in a polymer
electrolyte membrane fuel cell

Journal of Power Sources 192 (2009) 376–380
Contents lists available at ScienceDirect
Journal of Power Sources
journa l homepage: www.e lsev ier .com/ locate / jpowsour
Short communication
In-fibre Bragg grating sensors for distributed temperature measurement in apolymer electrolyte membrane fuel cell
Nigel A. David ∗, Peter M. Wild, Jingwei Hu, Nedjib DjilaliDepartment of Mechanical Engineering, University of Victoria, Canada
a r t i c l e i n f o
Article history:Received 25 January 2009Received in revised form 5 March 2009Accepted 6 March 2009Available online 19 March 2009
Keywords:Fibre Bragg gratingPolymer electrolyte membrane fuel cellTemperature
a b s t r a c t
A new application of in-fibre Bragg grating (FBG) sensors for the distributed measurement of temperatureinside a polymer electrolyte membrane fuel cell is demonstrated. Four FBGs were installed on the landsbetween the flow channels in the cathode collector plate of a single test cell, evenly spaced from inletto outlet. In situ calibration of the FBG sensors against a co-located micro-thermocouple shows a linear,non-hysteretic response, with sensitivities in good agreement with the expected value. A relative errorof less than 0.2 ◦ C over the operating range of the test cell (∼ 20–80 ◦C) was achieved, offering sufficientresolution to measure small gradients between sensors. While operating the fuel cell at higher currentdensities under co-flow conditions, gradients of more than 1 ◦ C were measured between the inlet andoutlet sensors. Due to their small thermal mass, the sensors also exhibit good temporal response todynamic loading when compared with the thermocouple. Design and instrumentation of the graphitecollector plate features minimal intrusion by the sensors and easy adaptation of the techniques to bipolarplates for stack implementation.
© 2009 Elsevier B.V. All rights reserved.
1. Introduction
Heat and water management are two of the most critical deter-minants of PEM fuel cell performance and have consequently beenthe subject of numerous experimental and theoretical studies [1–5].Progress in fully controlling heat and water transport has beenlimited by the coupling of the processes, lack of understandingof some of the underlying mechanisms, and limitations of exper-imental techniques. Recent multi-physics computational modelshave provided significant insight, but their predictive capabilitiesare not entirely established due to the limited availability of in situexperimental measurements [5].
Measurement of the temperature distribution inside an operat-ing fuel cell has been reported by a handful of groups using methodsinvolving electrical based microsensors and optical techniques.Wilkinson and coworkers used a series of micro-thermocouplesembedded in the graphite collector plate of a single test fuel cellto measure the temperature at the interface of the gas diffusionlayer (GDL) and the graphite plate [6]. They demonstrated thisas a useful technique for indirectly mapping the current densityacross the active area of cell, but only half of their sensors were
∗ Correspondingauthor at: Department of Mechanical Engineering, University ofVictoria, PO Box 3055 STN CSC, Victoria, BC, Canada V8W 3P6. Tel.: +1 250 853 3198;fax: +1 250 721 6323.
E-mail address: [email protected] (N.A. David).
operational during the experiments due to the fragility of the fineleads.
Micro-fabricated thin film thermistor based temperature sen-sors were demonstrated by He et al. for measuring the temperatureinside a PEM bilayer [7]. The 16 �m thick and 0.25 mm2sensorswere positioned at the reactant inlet and outlet, and showed alinear response in situ, even as the membrane swelled from hydra-tion. Microsensors for the in situ measurement of temperature andhumidity in micrometallic fuel cells were demonstrated by Lee etal. [8]. These sensing techniques could be useful for studying fun-damental heat transfer in PEM fuel cells, but due to the customnature of the MEAs and elaborate fabrication processes, their scopeof application is limited.
An optical technique that does not require the preparation of acustom MEA is described by Wang et al. An infrared camera wasused to view the anode side of a fuel cell under different operatingtemperatures and current densities [9]. They report a temperatureresolution of less than 0.3 ◦ C with their technique, and were ableto clearly observe gradients of up to 5 ◦ C from inlet to outlet athigher current densities. The gradients were attributed to increasedcurrent density along the flow path resulting from increased waterproduction at the cathode, hydrating the membrane more towardsthe outlet.
Wang et al. see this method as a means of locating hot spots (localhigher temperature regions); aiding in proper thermal manage-ment and, ultimately, to suggest better cell design. This technique islimited in its application, however, as the anode polar plate needs to
0378-7753/$ – see front matter © 2009 Elsevier B.V. All rights reserved.doi:10.1016/j.jpowsour.2009.03.021

N.A. David et al. / Journal of Power Sources 192 (2009) 376–380 377
be modified with a barium fluoride window, allowing it to be trans-parent to infrared light for camera viewing. It can, therefore, only beapplied to a single cell, or an end cell of a stack. Optical access intoa PEM fuel cell is also required in the technique recently developedby Basu et al. [10]. They use tunable diode laser absorption spec-troscopy to measure water partial pressure and temperature alongindividual flow channels of a prototype cell. The temperature mea-surements however, are not sufficiently accurate nor spatially wellresolved for the detailed study of temperature distribution inside afuel cell.
In this paper, fibre-optic based measurements are presentedbased on a novel application of in-fibre Bragg grating (FBG)sensors. The use of FBGs is particularly well suited for in situmeasurements. Optical fibres are not only sufficiently small forminimal impact on cell performance, but when coated with poly-imide FBGs are immune to moisture and the electrochemicallyactive environment found inside the cell. In addition, being opticaldevices, they are inherently insensitive to electromagnetic interfer-ence.
2. In-fibre Bragg grating sensing principle
A FBG typically consists of a short segment of single mode opticalfibre with a photoinduced periodically modulated index of refrac-tion. See Fig. 1(a). When the grating is illuminated with broadbandlight, the reflected power spectrum has structure caused by inter-ference of the light with the planes of the grating, much like Braggdiffraction. See Fig. 1(b). The peak of the spectrum in this caseoccurs at a wavelength corresponding to twice the optical pathlength between adjacent planes, and is called the Bragg wavelength,�B = 2�n, where n is the index of refraction of the silica fibre and� is the grating pitch. When the grating is subjected to mechani-cal or thermal strain its pitch changes, causing a shift in the Braggwavelength.
This shift is given by
��B
�B= (1 − Pe)ε + [(1 − Pe)˛ + �]�T, (1)
where Pe is the photo-elastic constant of the fibre, ε is the mechan-ical strain induced in the fibre, ˛ is the coefficient of thermalexpansion of the optical fibre, and � is the thermo-optic coefficient.
Fig. 1. Schematic of an in-fibre Bragg grating sensor.
Fig. 2. Graphite bipolar plate with four FBG sensors.
A comprehensive review of FBGs, along with a description of manyof their important applications can be found in Rao [11].
3. Experimental setup
3.1. Instrumentation
The FBGs used in this work are 10 mm long, with a nominal roomtemperature Bragg wavelength of 1550 nm. These are available forpurchase from Micron Optics, Inc., Atlanta, GA (model os1100). Thestandard single mode fibre on to which they are written is 125 �min diameter and is coated with a thin polyimide layer for durability.The FBG data for calibration and in situ measurements is collectedwith a Micron Optics, Inc. sm130 interrogation unit, with a specifiedwavelength resolution of 0.1 pm at 10 Hz sampling rate.
Four FBGs have been embedded in the lands separating the ser-pentine flow channels of a custom two-piece graphite cathode platemachined in house. A top view of this plate is shown in Fig. 2.The fibres lie in milled grooves, 150 �m deep, such that they arenot compressed when the cell is assembled and clamped. Deepersections were milled directly underneath the FBGs to eliminateconductive heat transfer with the graphite plate and ensure thetemperature measured by the FBGs is more representative of theMEA. A schematic of the instrumentation is shown in Fig. 3(b).
The two major design challenges of instrumenting the FBGs werelimiting bending of the fiber as it entered the cell, and isolatingit from strain, which could cause unpredictable measurements. Tolimit bending, an angled hole was drilled at one end of the groovenext to the gasket, connecting to a relief channel milled in thegraphite backing plate. This is shown in the schematic of Fig. 3(b).In addition to having a sufficiently deep groove for the FBG to lie inwithout being compressed by the MEA, cyanoacrylate adhesive wasused to fix the fibre in place, isolating it from any strain transferredfrom outside the cell.
A miniature T-type thermocouple with a wire diameter of 0.13mm from Omega Engineering, Inc. (Stamford, CT) was installedadjacent to the FBGs for their calibration. The thermocouple wasinserted into a 300 �m hole drilled perpendicular to the graphiteplate and potted in silicone for insulation. As shown in theschematic of Fig. 3, the thermocouple junction lies in the same planeas the FBGs and, therefore, is well situated for calibration purposesand also provides a comparative measurement during in situ testingof the fuel cell.
3.2. Test cell
The instrumented graphite plate described above was sized tofit into a pre-existing test fuel cell assembly in our laboratory. The

378 N.A. David et al. / Journal of Power Sources 192 (2009) 376–380
Fig. 3. Schematic of the in situ FBG sensor with adjacent thermocouple for calibra-tion (a). The side view schematic in (b) shows how the FBGs were installed into thetwo-piece graphite cathode plate.
assembly consists of gold plated current collector plates, and stain-less steel manifolds for gas distribution and water circulation forthe cell heating system. This assembly can be seen in Fig. 4, wherethe fibre optics are also shown entering the cathode plate.
MEAs for the test cell were fabricated at the National ResearchCouncil Institute for Fuel Cell Innovation, Vancouver, Canada. Anactive area of 30.25 cm2, with platinum loading of 0.4 mg/cm2wasachieved by masking and spray deposition of a carbon catalyst inkonto Nafion © 115 membrane. The GDL used for the MEAs is Toraypaper with 10% PTFE content and was hot pressed onto the carboncatalyst.
Fig. 4. Photograph of the the single test cell assembly. The cell temperature is set bycirculating deionized water from a temperature controlled bath in the test stationthrough the stainless steel plates on either side of the cell.
Table 1Sensitivities of the four FBG sensors calibrated before and afer experimental testing,11 days apart.
FBG Sensitivity (pm ◦C−1) Sensitivity after 11 days
1 10.84 10.762 10.73 10.693 10.85 10.814 10.84 10.79
The test cell is operated using a Ballard 3kW fuel cell test station,which enables the control of the fuel and oxidant flow rate, and thecell temperature with a water heating system. The current densityof the fuel cell is varied using an electronic load bank (Dynaload Inc.,MCL488, Hackettstown, NJ) that is connected via copper leads to thegold plated collector plates on either side of the single cell. The cellvoltage and the thermocouple voltage were measured using analoginputs on a 16 bit data acquisition device (National InstrumentsInc.).
4. Experimental methods
4.1. Calibration
Calibration of the four FBGs was routinely carried out before andafter acquisition of each data set. The FBGs were calibrated againstthe thermocouple situated in the same plane as the fibres. See Fig. 3.To reproduce the in situ environment, the sensors were coveredwith a piece of GDL and then clamped between half inch aluminumplates. The high thermal conductivity of aluminum minimizes thepotential for thermal gradients within the assembly and allows forthermal cycling in a reasonable amount of time. The assembly wasplaced in a programmable laboratory convection oven (Cascade TekInc., Hillsboro, OR), and cycled between ∼ (30–70 ◦C) at a rate of∼ 0.2 ◦C/min. Each data point from the thermocouple was taken asthe mean value of 100 samples acquired at a rate 1 kHz, resulting ina resolution of approximately ∼ 0.05 ◦ C for these measurements.
4.2. In situ testing
As a baseline case for the in situ measurements, the current wasset to zero, and only the cell temperature was varied using the waterheating system. This was to provide a reference for the tempera-tures measured by the FBGs while drawing current from the cellwith the load bank.
For the case of cell operation, the hydrogen and air were fed intothe cell in co-flow mode at a flow rate of 1.0 standard liters perminute and a pressure of 15 psi. The cell was first conditioned at
Fig. 5. Calibration data for one of the FBG sensors.

N.A. David et al. / Journal of Power Sources 192 (2009) 376–380 379
Fig. 6. FBG and thermocouple measurements under varying temperature and zero current conditions.
room temperature with a current density of 0.3 A cm−2 for approx-imately 30 min to humidify the membrane. The current was thenincreased incrementally like for obtaining polarization curve. Dur-ing testing, temperature data were taken from the FBGs sensors andthe co-located thermocouple every 2 s to gain dynamic informationof the temperature profile at the MEA/graphite plate interface insidethe cell.
5. Results and discussion
5.1. Calibration
A representative calibration curve for one of the FBGs is pre-sented in Fig. 5 and shows that there is essentially no hysteresis.The sensitivity of this particular FBG was determined to be 10.7pm ◦C−1, from a linear fit to the data, which is in good agreementwith the literature [11]. There was good agreement between thefour sensors, as well as good repeatability; Table 1 shows the sen-sitivities of all four FBGs measured 11 days apart. By interrogationof the FBGs using the Micron Optics unit, a temperature resolutionof 0.01 ◦ C for the individual FBG sensors was possible.
5.2. In situ tests
Shown in Fig. 6 are the results from the base case in which tem-perature was varied under zero current conditions. As seen in theclose up, a maximum spread of 0.2 ◦ C was measured between thesensors. This very small offset could be due to the position of thesensors relative to the inlet of the heating water, with FBG1 and thethermocouple being nearest the water inlet.
If the temperature across the cell were indeed uniform, with nogradient induced by the heating system, the data from this base-line would indicate a relative uncertainty between the sensors overthe measurement range shown. With this established, any temper-ature gradients higher than 0.2 ◦ C during cell operation could beattributed to factors other than the heating system, namely localcurrent flow and associated irreversibilities.
Departure from the baseline case temperature profile wasclearly seen while drawing current through the cell at the differentcell temperatures. Fig. 7 shows the results of a case where the celltemperature was set to 50 ◦C. The current was increased from 6 to12 A allowing the cell voltage to reach steady state in between steps.The most prominent features are the jumps in temperature mea-sured by all the sensors, including the thermocouple; these jumpscorrelate with each step change in current. The data shows thatthere is no apparent lag in the response time of the FBGs comparedto the thermocouple, which is indicative of their comparable sizes,and location relative to the MEA. In addition, the thermocouple datalies just above FBG1, which is consistent with its physical locationand the apparent gradient in temperature across the cell.
Fig. 7. Time response of FBG and thermocouple (top) with increasing cell current(below). Water temperature for the cell heating system was maintained constant at50 ◦C.
An increased in temperature with current draw was expectedto be measured by all sensors due primarily to ohmic losses, butgradients across the cell of more than 1 ◦ C were also observed.Shown in Fig. 8 are the temperatures measured by the FBGs plottedagainst their location for the same time series of Fig. 7. A positivegradient from inlet to outlet is clearly shown and becomes larger athigher currents indicating a non-uniform current density across thecell. This is consistent with the experimental observations of Wang
Fig. 8. Temperature profiles for different current densities with cell temperature setnear 50 ◦ C with water heating system.

380 N.A. David et al. / Journal of Power Sources 192 (2009) 376–380
et al. who attributed this to the improved humidification of themembrane towards the outlet resulting in higher current densities[9].
6. Conclusions
The research presented here demonstrates that FBGs can beembedded inside a PEM fuel cell to reliably measure tempera-ture dynamically with a relative resolution of less than 0.2◦. Inthe interest of improved cell design, this relatively inexpensivetechnique could prove useful as a diagnostic tool to identify hotspots on the membrane, or as an indirect means of determiningcurrent distribution across the cell as done by Wilkinson et al.[6].
Further improvement of the technique will involve the mul-tiplexing of several FBGs on a single fiber. This will increase thenumber of measurement points from four to upwards of ten result-ing in the possibility for truly distributed temperature data withina an operating fuel cell, and the eventual extension of the techniqueto multi-point monitoring in complete stacks.
Acknowledgements
This work was funded by the Natural Sciences and EngineeringResearch Council (NSERC) of Canada. Access to the NRC Institute forFuel Cell Innovation, Vancouver, Canada, and the assistance of Dr.Titichai Navessin in fabricating MEAs is gratefully acknowledged.
References
[1] A. Rowe, X. Li, Journal of Power Sources 102 (2001) 82–96.[2] N. Djilali, D. Lu, International Journal of Thermal Sciences 41 (2002) 29–40.[3] A.Z. Weber, J. Newman, Journal of the Electrochemical Society 153 (2006)
A2205–A2214.[4] A. Faghri, Z. Guo, International Journal of Heat and Mass Transfer 48 (2005)
3891–3920.[5] N. Djilali, Energy 32 (2007) 269–280.[6] M. Wilkinson, M. Blanco, E. Gu, J.J. Martin, D. Wilkinson, J.J. Zhang, H. Wang,
Electrochemical and Solid-State Letters 9 (11) (2006) A507.[7] S. He, M.M. Mench, S. Tadigadapa, Sensors and Actuators A 125 (2006) 170.[8] C.-Y. Lee, G.-W. Wu, C.-L. Hsieh, Journal of Power Sources 172 (2007) 363–367.[9] M. Wang, H. Guo, C. Ma, Journal of Power Sources 157 (2006) 181.
[10] S. Basu, M.W. Renfro, B.M. Cetegen, Journal of Power Sources 162 (2006) 286.[11] Y.-J. Rao, Measurement Science and Technology 8 (1997) 355–375.

70
Appendix B
Parametric Study of a
Polymer-Coated Fibre-Optic
Humidity Sensor

Parametric Study of a Polymer-Coated Fibre-Optic
Humidity Sensor
Nigel A. David, Peter M. Wild, Ned Djilali
Department of Mechanical Engineering and Institute for Integrated Energy Systems,
University of Victoria
Abstract. A relative humidity sensor based on polymer coated optical fibre Bragg
gratings is presented. This fully functional sensor has response time and resolution
comparable to the current capacitive RH sensors but with greater applicability. In
this paper, numerical and experimental methods are used to determine the affects
of coating thickness and fibre diameter on the response time and sensitivity of Bragg
gratings coated with Pyralin. Transient results indicate that coating thicknesses of less
than 4µm are needed to achieve a response time of 5 s, competitive with commercial
capacitive RH sensors. Using thin coatings of ∼2 µm, for a short response time,
sensors with reduced fibre diameter were fabricated and tested under steady state,
transient and saturated conditions. By chemical etching from 125 µm to 20 µm, the
sensitivity increased by a factor of seven. Such an increase in sensitivity allows for
the resolution and response time of the Pyralin-coated sensor to be comparable to
commercial capacitive RH sensors. These characteristics, in addition to the sensors
rapid recovery from saturation in liquid water, indicates good potential for use of this
sensor design in applications where electronic RH sensors are not suitable.
Submitted to: Meas. Sci. Technol.

Parametric Study of a Polymer-Coated Fibre-Optic Humidity Sensor 2
Table 1. Table of nomenclature
λB Bragg wavelength
εi principal strains
n0 effective index of refraction
ξ thermo-optic coefficient
Pe effective strain-optic coefficient
α coefficient of thermal expansion
ST sensitivity to temperature
SRH sensitivity to RH
k stiffness weighting factor
β coefficient of hygroscopic expansion
E Young’s modulus
A cross sectional area
η moisture concentration
D diffusion coefficient
τ63 1/e response time
1. Introduction
Relative humidity (RH) is a parameter that must be measured and controlled in many
environments and industrial processes. Many of the miniature RH sensors on the market
today are capacitive, and based on MEMS technology [1]. These types of sensors offer
low-cost, accurate, fast response measurements over a large humidity range, satisfying
the demands of most applications. In some instances, however, the sensor size, and
inability to recover quickly from saturation are limiting factors in their usage. Further
limitations are typical of electronic sensors, such as the need to isolate the leads from
electromagnetic interference and the restricted ability of multi-channel multiplexing.
An application where the limitations of miniature capacitive RH sensors have
become evident is in polymer electrolyte membrane fuel cells (PEMFCs). Humidity
levels in the gas streams of commercial PEMFCs often need to be controlled to achieve
optimal performance [2, 3]. Recent in situ measurements across the active area of a
single cell have indicated significant gradients in RH arising during cell operation [4, 5].
These gradients, if extending over the relatively large active area of commercial fuel cell
stacks, could be a source of performance loss and degradation. Further understanding of
this phenomenon requires non-invasive distributed measurements of RH in commercial
PEMFC stacks.
The current commercially available miniature RH sensors are not particularly well
suited for use in fuel cells. The sensor size is too large for the confined flow channels;
the sensors are slow to recover from condensation, which is common in a PEMFC; the
sensor leads need to be carefully isolated since a fuel cell is electrically active; and
there is limited space inside the PEMFC for multiple leads that would be required for

Parametric Study of a Polymer-Coated Fibre-Optic Humidity Sensor 3
distributed measurements.
Fibre optic sensors, unlike the current capacitive RH sensors, have the advantages
of being intrinsically small and immune to electromagnetic interference. Among the
fibre optic sensor technologies for humidity measurement discussed in a recent review
by Yeo et al. [6], the polymer-coated fibre Bragg grating (FBG) RH sensor stands out for
having a wide measurement range combined with the capability of multiplexing several
sensors on a single fibre. Multiple studies have shown these sensors to have a linear,
reversible, and accurate response over the range of 10-100% RH [7, 8, 9].
FBGs have found myriad sensing applications [10], particularly for the measurement
of strain and temperature, to which an FBG is inherently sensitive. The sensing principle
of the polymer-coated FBG is based on the hygroscopic expansion of the polymer
coating, which induces strain in the fibre core. The strain is detected as a wavelength
shift in the FBG signal. The FBG-based RH sensor was first reported by Giaccari et al.
after researchers found that commercially available FGBs that had been recoated with
polyimide were sensitive to changes in humidity [11]. Polyimide is often used for coating
optical fibre and FBGs to provide increased tensile strength and durability. In addition
to its favourable thermomechanical properties, polyimide exhibits fast and reversible
moisture absorption, making it ideal as the sensing layer in capacitive RH sensors [1],
and since the work of Giacarri, in fibre-optic RH sensors.
Sensitivity and response time of polyimide-coated FBG RH sensors have been
shown to increase with increasing coating thickness. In studies by Kronenberg et al. [8]
and Yeo et al. [7] FBGs were coated with the polyimide Pyralin R©(HD Microsystems)
and tested for steady-state sensitivity and response time, respectively. The shortest
response time reported by Yeo et al. [7] was approximately τ63 = 5 minutes for a coating
thickness of 10µm. Thinner coatings, down to 3.6 µm, were tested by Kronenberg
et al., but only for steady-state sensitivity. The sensitivity of their thinnest coating
sensor, which would have the shortest response time, was 0.3 pm%RH−1. Optical
interrogators for FBGs typical have wavelength resolution of ∼1 pm. This implies a
minimum detectable change in RH of no less than 3% RH for the fast FBG RH sensor.
Operating characteristics of commercial miniature capacitive RH sensors, such as the
HIH-4000 from Honeywell, Inc. [12], with τ63 = 5 s and resolution of 0.5% RH indicate
a need for design improvements on the polyimide-coated FBGs sensors for them to be
competitive.
Following our recent work in which the use of FBG RH sensors was demonstrated in
situ in an operating fuel cell, the focus of this paper is the realization of fully functional
FBG sensors with response time and resolution comparable to the current capacitive
RH sensors, but with greater applicability. A numerical analysis is presented allowing
systematic investigation of the effect of coating thickness and fibre diameter on the
steady-state and transient response of the coated FBG sensor. The fabrication process
to realize sensors with varying coating thickness and fibre diameters is described, and
experimental results obtained under a range of environmental conditions are presented.

Parametric Study of a Polymer-Coated Fibre-Optic Humidity Sensor 4
2. Methodology
2.1. Theoretical background
An FBG typically consists of a short segment of single mode optical fibre with a photo-
induced periodically modulated index of refraction in the core of the fibre. When the
grating is illuminated with broadband light, the reflected spectrum has a peak at the
Bragg wavelength, λB = 2Λn0, where n0 is the effective index of refraction of the silica
fibre core and Λ is the grating pitch. The dependence of both n0 and Λ on strain and
temperature allows the use of FBGs for sensing these and other parameters. Many of
the growing number of sensing applications for FBGs have been reviewed by Rao [10].
The influence of strain and temperature changes on the Bragg wavelength of an
FBG sensor can be obtained by Taylor series expansion of the expression for the Bragg
wavelength about a reference state of strain and temperature. Assuming zero reference
strain and keeping only first order terms in the expansion, a general expression for the
relative Bragg wavelength shift for unpolarized light is given by [13]
∆λBλB
= εz −n20
2(εzp12 + εr(p11 + p12)) + ξ∆T (1)
The first term, εz, is the thermally and mechanically induced axial strain in the grating,
which changes the grating pitch. The second term represents the strain-optic effect,
where p11 and p12 are the principal components of the strain-optic tensor and εz and εrare the corresponding axial and radial strains. The third term represents the thermo-
optic effect, where ξ is thermo-optic coefficient.
For a Bragg grating written in single mode optical fibre subjected only to axial
strain the following simplified version is often used [7],
∆λBλB
= (1− Pe)εz + ((1− Pe)α + ξ)∆T, (2)
where
Pe = p12 − ν(p11 + p12) (3)
represents the effective strain optic coefficient in which the radial strain is accounted
for by the Poisson effect. Equation 2 is a superposition of the mechanical and thermal
response of the FBG; α is the coefficient of thermal expansion (CTE) of the fibre; and
ξ is the thermo-optic coefficient.
For a polymer-coated FBG humidity sensor, shown in Fig. 1, the RH and
temperature induced axial strain in the fibre can be separated as follows:
∆λBλB
= (1− Pe)εRH + (1− Pe)εT + ξ∆T (4)
∆λBλB
= ST∆T + SRH∆RH. (5)

Parametric Study of a Polymer-Coated Fibre-Optic Humidity Sensor 5
ST and SRH are the temperature and RH sensitivity coefficients, respectively. To
relate the RH sensitivity to material properties, one may express SRH as the sum of
a mechanical and a strain-optic contribution:
SRH = (1− Pe)kβc [%RH−1]. (6)
k is a stiffness-weighting factor for the coefficient of hygroscopic expansion, βc, of the
polymer coating.
The one-dimensional (1-D) model of the sensor used by Kronenberg et al. [8], in
which radial strain is neglected, consists of an infinitely long bi-material rod in which
the two materials adhere perfectly. See Fig. 1. Plain strain and plain stress are assumed
in this model. The axial stresses in the materials must balance at equilibrium according
to,
σfAf + σcAc = 0, (7)
where the subscripts c and f represent the coating and the fibre. σ is the normal stress
and A is the cross-sectional area. Since the two materials are fused at the interface,
their axial deformation must be equal, satisfying the following condition:
∆Lf = ∆Lc = kβc∆RHL, (8)
Assuming linear, elastic, and isotropic behavior for the silica and Pyralin R©, the stress
and strain are related by
εz = σc/Ec (9)
and
εz = σf/Ef (10)
where E is the Young’s modulus. From these relations, k is determined to be
k =EcAc
EcAc + EfAf
. (11)
Substituting k into Equations 6 and 5 yields the following expression for the sensor’s
response to changes in RH:
∆λBλB
= (1− Pe)EcAc
EcAc + EfAf
βc∆RH. (12)
In Kronenberg et al. and Yeo et al. [8, 7], known values of E and Pe were used in
Eq. 12. By varying βc, Eq. 12 was fitted to experimental sensitivity results for sensors
of increasing coating thickness. Values for the 1-D coefficient of hygroscopic expansion,
β1−Dc , determined in both studies were in good agreement with each other. Kronenberg
et al. also used a three-dimensional (3-D) finite element model to determine βc; however
there was a discrepancy between β1−Dc and β3−D
c , indicating a dependence on the radial
strain.

Parametric Study of a Polymer-Coated Fibre-Optic Humidity Sensor 6
2.2. Transient model
In the current study, for a more complete representation of the coated fibre that
includes radial strain and diffusion, the sensor is modeled in 3-D using the commercial
finite element software Comsol R©. In this model, the diffusion of moisture into the
Pyralin R© is assumed to be Fickian and, therefore, governed by Eq. 13, where η is the
moisture concentration and D is the diffusion coefficient. The diffusion driven moisture
concentration in the polymer is coupled to the mechanical behaviour of the sensor by
prescribing an isotropic 3-D coefficient of hygroscopic expansion β3−Dc , a Poisson ratio,
ν and a Young’s modulus Ec to the polymer coating silica fibre and the silica fibre.
Where, of course, the hygroscopic coefficient of the glass fiber is set to zero.
∂η
∂t= D∇2η, (13)
Optical fiber
Bragg grating
Pyralin coating
rc
r f
Figure 1. Schematic of the Pyralin R© coated FBG sensor.
Given the axial symmetry of the sensor and negligible azimuthal changes in the
surface conditions, only radial (r) and axial (z) dependence was considered in the
simulation and the computational domain was restricted to the half plane. The length
of the coated fibre domain was set to 800 µm, which ensured that edge effects were
avoided. A mesh of about 30,000 triangular elements was used, with a higher density
of points near the interface of the two materials.
Transient simulations of the sensor response to a step change in humidity were run
by prescribing initial and boundary conditions on the moisture concentration. Time
dependent radial and axial strains along the fibre axis were obtained and then converted
to a Bragg wavelength shift using Eq. 1. By comparing simulation results to those
obtained from transient experiments for different coating thicknesses, an estimate of the
diffusion coefficient for the Pyralin coating was made and the Fickian diffusion model
validated.
Steady-state strains induced by RH changes were converted to Bragg wavelength
shifts using Eq. 1. Sensitivity to RH for different coating thicknesses and reduced fibre

Parametric Study of a Polymer-Coated Fibre-Optic Humidity Sensor 7
diameters were obtained and compared to experiment. The coefficient of hygroscopic
expansion, β3−Dc was varied in the 3-D model to fit the model results to the data.
2.3. Experimental
Several Pyralin R© coated FBG sensors with varying coating thickness and fibre diameter
were fabricated in-house and tested for static sensitivity and transient response.
Methods for fabrication and testing are described in the following sections.
2.3.1. Sensor fabrication 10 mm long Bragg gratings from Micron Optics, Inc.
(Atlanta, GA.) were used for the full diameter fibre sensors. For the reduced fibre
diameter sensors, 2 mm long gratings from Technica SA (Zug, Switzerland) were used
in the interest of miniature sensor development. The gratings were written in standard
SMF 28 optical fibre with nominal Bragg wavelengths of 1550 nm. The moisture
sensitive Pyralin coating was applied to the FBG using the procedure outlined in Yeo
et al. [7]. The stock polyimide recoat was first removed by immersion in 98% sulfuric
acid for approximately 10 minutes. The fibre was then rinsed in de-ionized water and
wiped with isopropyl alcohol. The FBG was then dipped in Pyralin and withdrawn at
a speed slow enough to produce a uniform coating without bead formation. Speeds of
10-20 mm/min were used, depending on the fibre diameter. Each coat was pre-cured in
an oven for 5 minutes at 150◦ C. Subsequent coats were applied to obtain the desired
thickness. The final baking of the fibre was done at 180◦ C for one hour.
To reduce the fibre diameter for increased sensor sensitivity, the fibre was etched
with hydrofluoric acid (HF) prior to coating with the Pyralin. The section of bare
fibre with a 2 mm Bragg grating was immersed in 48% HF for sufficient time, using a
pretedermined etching rate, to produce the desired diameter. The etched fibre was then
neutralized in a saturated CaOH solution to stop the etching. The same procedure as
described above was then used to coat the etched fibre with Pyralin.
The fibre diameters and coating thicknesses of the sensors were measured with an
optical microscope and are shown in Table 2. Uncertainty for the coating thickness due
to slight non-uniformities over the length of the grating and was estimated to be 1.0 µm.
2.3.2. Sensor testing The sensors’ steady-state response to RH was measured at
constant temperature in a programmable environmental chamber. The individual FBG
sensors were protected with perforated hypodermic tubing. During calibration the
sensors were placed next to a reference humidity probe, the HX80 from Omega with
specified accuracy of ±1 % over a range 0f 10-95 %RH. The Bragg wavelength shift of
the FBG was detected using an optical interrogation unit (SM130, Micron Optics, Inc.,
Atlanta, GA), with a specified wavelength resolution of 0.1 pm at 10 Hz sampling rate.
The temperature was held constant at 24.0 ± 0.2 ◦C while the RH in the chamber was
cycled from 30% to 90% in increments of ∼10%, allowing the chamber and sensors to
reach eqiulibrium at each step.

Parametric Study of a Polymer-Coated Fibre-Optic Humidity Sensor 8
Table 2. Unetched and etched FBG sensors fabricated and tested in this work.
Sensor diameter (±0.5µm) coating thickness (±1.0µm) SRH (±0.01[10−6%RH−1])
FBG 1 125.0 2.7 0.16
FBG 2 125.0 9.5 0.74
FBG 3 125.0 17.0 1.54
FBG 4 125.0 18.1 2.22
FBG A 75.0 2.0 0.23
FBG B 50.0 2.5 0.41
FBG C 40.0 2.5 0.55
FBG D 31.5 2.3 0.83
FBG E 20.0 2.0 1.42
For the transient testing that was performed on both etched and unetched sensors,
a two-compartment chamber was constructed, with which a step change in RH could
be applied to the sensor. See Fig. 2. The upper compartment is exposed to ambient
RH while the lower compartment is sealed with a pierceable Teflon diaphragm and held
at 85 %RH achieved using a saturated KCl salt solution. During testing the chamber
was placed in the environmental chamber set to 45 %RH and 24◦ C. Beginning in the
upper compartment, the FBG sensor gets pushed through the diaphragm such that it
is immediately exposed to the high humidity level. From the Bragg wavelength data
acquired during this procedure it is possible to characterize the response time of the
sensor. The sensor response to saturation with liquid water was tested by using water
in the lower chamber.
3. Results and discussion
3.1. Unetched sensors
3.1.1. Steady-state Calibration data for FBG 2 is plotted in Fig. 3 and shows linearity
that is representative of the other sensors. A linear fit to the data yields a slope of
m = 1.00 ± 0.02 pm%RH−1, which, for a nominal Bragg wavelength of 1550 nm, gives
RH sensitivity, SRH = (0.64±0.01)×10−6 %RH−1. See Eq.5. Upon cyling the chamber
three times there was no apparent hysterisis nor was there a change in sensitivity.
Sensitivities for all of the unetched sensors are given in Table 2. The calibration results
for the unetched Pyralin-coated sensors confirmed the linear and reversible behavior of
this sensor design reported in previous studies.
Shown in Fig. 4 is a plot of SRH of the four unetched sensors versus the coating
cross sectional area. Also plotted are curves obtained using the 1-D and 3-D models as
well as data points from the work of Kronenberg et al., which are shown for comparison.
In the models, the mechanical properties of Ef = 72 GPa [8], and Ec = 2.45 GPa[14]
were used along with a bare fibre diameter of 125 µm.
In the case of the 1-D model, a value of β1−Dc = 7.7 × 10⁻⁵ %RH−1 gives the best

Parametric Study of a Polymer-Coated Fibre-Optic Humidity Sensor 9
Ambient RH
85% RH
FBG
Hypodermic tube
Sliding seal
Figure 2. Schematic of the two-part chamber used for transient testing of the sensors.
fit Eq.12 to our data. This value is 7% lower than that of Kronenberg et al. who used
the same model. This difference is attributed to our use of strain optic coefficients, p1i,
that are specific to SMF 28 fibre core [15], and are 7% lower than the bulk silica values
used by Kronenberg et al..
With the use of β3−Dc = 7.3 × 10⁻⁵ %RH−1 in the 3-D model, the steady-state
sensitivities obtained were in good agreement with the data from both groups. This
value of β3−Dc is only 1 % lower than that of Kronenberg et al..
3.1.2. Transient Results from the transient tests for three sensors of increasing coating
thickness are shown in Fig. 5. It is clear from these results that the response time of the
sensor increases significantly with coating thickness and that a thin coating is desirable
for applications where transient RH conditions are to be investigated.
Transient simulation results for FBG 2 (9.5 µm coating) using three different
diffusion coefficients are shown in comparison to an experimental response curve in
Fig. 6. The strains in the fibre core for each time step in the simulation were used to
compute the wavelength shift as a function of time. The agreement between the shape
of the simulation curve and the actual response curve validates the assumption that
Fickian diffusion governs the transient behaviour of the sensor.
Figure 7 shows radial concentration profiles for FBG 2 obtained with the 3-D

Parametric Study of a Polymer-Coated Fibre-Optic Humidity Sensor 10
2 0 3 0 4 0 5 0 6 0 7 0 8 0 9 0 1 0 0- 1 0
01 02 03 04 05 06 07 0
F B G 2 c a l i b r a t i o n d a t a L i n e a r f i t
s l o p e = 1 . 0 0 p m / % R Hr 2 = 0 . 9 9 9 4
Bragg
wave
length
shift
(pm)
R e l a t i v e h u m i d i t y ( % R H )
Figure 3. Bragg wavelength shift as a function of RH for FBG 2 with a 9.5 µm thick
Pyralin coating. The measurement errors are indicated by the symbol size on the plot.
0 . 0 0 0 . 2 5 0 . 5 0 0 . 7 5 1 . 0 0 1 . 2 5 1 . 5 00 . 0
0 . 5
1 . 0
1 . 5
2 . 0
2 . 5
FBG
4FB
G 3
FBG
2
FBG
1
P r e s e n t w o r k K r o n e n b e r g e t a l . 1 D m o d e l ( β = 7 . 7 [ 1 0 - 5 %R H ] ) 3 D m o d e l ( β = 7 . 5 ) 3 D m o d e l ( β = 7 . 0 )
RH se
nsitiv
ity, S RH
(10-6 %
RH-1 )
C o a t i n g c r o s s s e c t i o n a r e a ( 1 0 4 µm 2 )
Figure 4. RH sensitivity for sensors of different coating thickness including results
from the 1-D and 3-D models and results from Kronenberg et al..
transient model. It is more appropriate to refer the moisture concentration rather than
relative humidity, since water diffuses in the material as liquid rather than gas. To
simulate the experiment, the moisture concentration, η, throughout the polymer was
initially set to 9.79 gm−3, which is equivalent to the water vapor concentration in air
at 45 %RH and 24 ◦C. The boundary conditions for t > 0 of the simulation, were
η = 18.5 gm−3 at the outer surface of the coating and zero flux, or ∂η/∂r = 0, at the
glass-polymer interface.
Transient simulations were carried out for coating thicknesses from 1 µm to 20 µm.
It was found that by using D = 8.5± 1.0 × 10⁻¹³ m2s−1, τ63 of the tested FBGs could
be predicted within experimental uncertainty. See Fig. 8. This value for the diffusion
coefficient is within 10% of literature values for polyimide that have been measured
using two different techniques [16].

Parametric Study of a Polymer-Coated Fibre-Optic Humidity Sensor 11
0 1 0 0 2 0 0 3 0 0 4 0 0 5 0 0 6 0 0 7 0 0 8 0 0 9 0 0 1 0 0 0 1 1 0 00 . 0
0 . 2
0 . 4
0 . 6
0 . 8
1 . 0
1 . 2
1 4 5 . 0 s3 5 . 0 s3 . 2 s
F B G 4F B G 2F B G 1
R e s p o n s e t i m e , τ63
( F B G 4 )
( F B G 2 )
t = 1 8 . 1 µm
t = 9 . 5 µm
Norm
alized
Brag
g wav
eleng
th sh
ift
T i m e ( s )
C o a t i n g t h i c k n e s s : t = 2 . 7 µm ( F B G 1 )
S e n s o r
Figure 5. Transient response of 3 unetched fibre sensors of increasing coating thickness
to a step change in RH from 45 % to 85 %. The wavelength shift was normalized relative
to the sensor value reached at equilibrium at 85 % RH.
- 2 5 0 5 0 1 0 0 1 5 0 2 0 0 2 5 0 3 0 0 3 5 00 . 0
0 . 2
0 . 4
0 . 6
0 . 8
1 . 01 . 1
Norm
alized
Brag
g wav
eleng
th sh
ift
T i m e ( s )
9 . 5 µm c o a t i n g s e n s o r d a t a D = 7 . 5 [ 1 0 - 1 3 m 2 s - 1 ] D = 8 . 5 D = 9 . 5
Figure 6. Transient response of FBG 2 (9.5 µm coating) after a step change from 45-
85% RH. Data is shown in comparison with simulation results obtained using Comsol.
For the response time of Pyralin-coated FBG sensor design to be competitive with
the Honeywell HIH-4000 mini capacitive sensor (τ63 = 5s), the coating thickness must be
less than ∼ 4 µm. The FBG sensor should also be competitive in terms of RH resolution,
which is 0.5% RH for the HIH-4000 mini. FBG 1, for example, with τ63 = 3s, and
SRH = (0.16± 0.01)× 10−6%RH−1, would carry a minimum detectable change in RH,
or resolution, of ∼ 4 %RH using a common FBG interrogator. Improved sensitivity is,
therefore, necessary for the FBG sensor resolution to rival capacitive sensors. The 1-D
model for the FBG sensor (see Eq. 12), however, suggests that a reduced fibre diameter
can lead to increased sensitivity, and therefore improved resolution.

Parametric Study of a Polymer-Coated Fibre-Optic Humidity Sensor 12
5 4 5 6 5 8 6 0 6 2 6 4 6 6 6 8 7 0 7 2 7 4- 202468
1 01 21 41 61 82 02 2
t = 0 s 5 s 2 0 s 6 0 s 1 0 0 s 2 5 0 s
P o l y i m i d e c o a t i n g
Moistu
re co
ncen
tratio
n, η
(g/m3 )
R a d i u s ( µ m )
S i l i c a f i b e r
Figure 7. Radial moisture concentration profiles for FBG 2 acquired with Comsol
transient simulation.
0 2 4 6 8 1 0 1 2 1 4 1 6 1 8 2 00
1 02 03 04 05 06 07 08 09 0
1 0 01 1 01 2 01 3 01 4 01 5 01 6 0
FBG
4
FBG
2
FBG
1
τ6 3 d a t a D = 7 . 5 [ 1 0 - 1 3 m 2 s - 1 ] D = 8 . 5 D = 9 . 5
63%
resp
onse
time,
τ 63 (s
)
C o a t i n g t h i c k n e s s ( µm )
Figure 8. Experimental and model results for τ63 as a function of coating thickness.
3.2. Etched sensors
3.2.1. Steady-state Five 2 mm long FBGs were etched with HF to reduce the diameter
for increased sensitivity. See Table 2. A coating thickness of ∼ 2.5 µm was chosen
because, as shown in the preceding section, it yielded a short response time of τ63 ∼ 3 s
for the unetched sensor. The sensors were calibrated in the environmental chamber using
the same procedure as for the unetched FBGs. Shown in Fig.9 is the calibration data
for the 31.5 µm sensor over the range of ∼ 15 − 95 %RH. It was seen that in addition
to an increase in sensitivity, the linearity and repeatable behavior was preserved with
the reduction in diameter.
Sensitivities of the five etched sensors versus fibre diameter are shown in Fig. 10.
Also shown are 1-D and 3-D model results, obtained by using β1−Dc and β3−D
c from the
unetched fibre analysis. These results show that the 1-D model predict a significantly

Parametric Study of a Polymer-Coated Fibre-Optic Humidity Sensor 13
5 1 0 2 0 3 0 4 0 5 0 6 0 7 0 8 0 9 0 1 0 0- 1 0
0
2 0
4 0
6 0
8 0
1 0 0
1 2 03 1 . 5 µm ∅ F B G c a l i b r a t i o n d a t a
L i n e a r f i t
Bragg
wave
length
shift
(pm)
R e l a t i v e h u m i d i t y ( % R H )
s l o p e = 1 . 2 8 p m / %R Hr 2 = 0 . 9 9 9 5
Figure 9. Calibration data for a 31.5 µm etched fibre sensor with 2.3 µm Pyralin
coating.
0 1 0 2 0 3 0 4 0 5 0 6 0 7 0 8 0 9 0 1 0 0 1 1 0 1 2 0 1 3 00 . 00 . 20 . 40 . 60 . 81 . 01 . 21 . 41 . 61 . 82 . 0
E
DC
BFB
G 1
F B G s e n s o r s 3 D m o d e l ( β= 7 . 5 [ 1 0 - 5 % R H - 1 ] , t = 2 . 5 µm ) 1 D m o d e l ( β= 7 . 7 [ 1 0 - 5 % R H - 1 ] )
RH se
nsitiv
ity, S RH
(10-6 %
RH-1 )
F i b r e d i a m e t e r ( µm )
A
Figure 10. Sensitivity (SRH) versus fibre diameter for etched FBG sensors from
Table 1. Solid and dashed lines indicate 3-D and 1-D model results, respectively, using
a coating thickness of 2.5 and β3−Dc and β1−D
c from the unetched analysis.
higher RH sensitivities for the etched fibre sensors.
Results from the 3-D model, shown in Fig. 10 can be used to establish a limit on the
possible increase in sensitivity that can be achieved by etching the FBG. The sensitivity
of a short response time sensor, i.e. FBG 1, can be increased by an order of magnitude
if the fibre diameter is etched to 10µm, the diameter of the fibre core. In practice,
however, etching to the core is not feasible with this sensor design, as evanescent field
interaction would likely comprise the measurements. A factor of 7 increase in sensitivity
over FBG 1 was achieved with FBG E, having a diameter of 20 µm. Such an increase in
sensitivity brings the resolution of the polyimide-coated RH sensor to less than 1% RH,
and into the range of commercial capacitive RH sensors.
3.2.2. Transient The response curves shown in Fig. 11 indicate consistent response
times of τ63 ∼ 3s despite the reduction in fibre diameter, which is to be expected since
the coating thickness are all similar.
Tests for effects of liquid water by sensor immersion were performed on FBG D,

Parametric Study of a Polymer-Coated Fibre-Optic Humidity Sensor 14
- 5 0 5 1 0 1 5 2 0 2 5 3 0 3 5 4 0 4 5- 0 . 10 . 0
0 . 2
0 . 4
0 . 6
0 . 8
1 . 01 . 1
F B G 1 F B G B F B G C F B G D
Norm
alize
d Brag
g wav
eleng
th sh
ift
T i m e ( s )
Figure 11. Transient response of Pyralin-coated FBG sensors of varying fibre diameter
with similar coating thicknesses (∼ 2.5µm).
- 2 0 0 2 0 4 0 6 0 8 0 1 0 0 1 2 0 1 4 0 1 6 0 1 8 02 03 04 05 06 07 08 09 0
1 0 01 1 0 S e n s o r o u t o f w a t e r
Relat
ive hu
midit
y (%
RH)
T i m e ( s )
S e n s o r i n t o w a t e r
Figure 12. Response to liquid water of a 31.5 µm etched fibre sensor with 2.3 µm
Pyralin coating.
with a diameter of 31.5 µm and coating thickness 2.3 µm. Results from this test are
shown in Fig. 12. It is seen that upon immersion in water the sensor measures near
100% RH with a response time comparable to the RH transient tests. Full recovery
from saturation takes place in 20 s, at which point the sensor again measures the 39%
RH of the room.
4. Conclusions
Etched fibre Pyralin-coated FBG humidity sensors were fabricated with varying coating
thicknesses and fibre diameters to test the affect these parameters have on response time
and sensitivity. Transient results indicated that coating thicknesses of less than 4µm
are needed to achieve a response time of 5 s, competitive with commercial capacitive RH
sensors. For thin-coating (∼2.5 µm), and hence fast response sensors, it was found that
by etching the fibre diameter from 125 µm to 20 µm, the sensitivity increased by a factor

Parametric Study of a Polymer-Coated Fibre-Optic Humidity Sensor 15
of seven. Such an increase in sensitivity allows for the resolution and response time of
the Pyralin-coated sensor to be comparable to commercial capacitive RH sensors. These
characteristics, in addition to the sensors rapid recovery from saturation in liquid water,
indicates good potential for use of this sensor design in applications where electronic
RH sensors are not suitable.
5. Acknowledgments
This work was funded through a Strategic Research grant from the Natural Sciences
and Engineering Council of Canada.
[1] Z. Chen and C. Lu. Humidity sensors: A review of materials and mechanisms. Sensor Letters,
3:274–295, 2005.
[2] S. Lister and N. Djilali. Mathematical modelling of ambient air breathing fuel cells for portable
devices. Electrochemica ACTA, 52:3849–3862, 2007.
[3] Ch. Hartnig, I. Manke, N. Kardjilo, A. Hilger, M. Gruenerbel, J. Kaczerowski, J. Banhart, and
W. Lehnert. Combined neutron radiography and locally resolved current density measurements
of operating pem fuel cells. Journal of Power Sources, 176:452–459, 2008.
[4] G. Hinds, M. Stevens, J. Wilkinson, M. de Posta, and S. Bell. Novel in situ measurements
of relative humidity in a polymer electrolyte membrane fuel cell. Journal of Power Sources,
186:52–57, 2009.
[5] N. David, P.M. Wild, J. Jensen, and N. Djilali. Simultaneous in situ measurement of temperature
and relative humidity in a pemfc using optical fiber sensors. Journal of the Electrochemical
Society, 157:B1173–B1179, 2010.
[6] T. L. Yeo, T. Sun, and K. T. V. Grattan. Fibre-optic sensor technologies for humidity and moisture
measurement. Sensors and Actuators A, 144:280–295, 2008.
[7] T. L. Yeo, T. Sun, K. T. V. Grattan, D. Parry, R. Lade, and B. D. Powell. Polymer-coated fiber
bragg grating for relative humidity sensing. IEEE Sensors, 5(5):1082–1089, 2005.
[8] P. Kronenberg, P. K. Rastogi, P. Giaccari, and H. G. Limberger. Relative humidity sensor with
optical fiber bragg gratings. Optics Letters, 27(16):1385–1387, 2002.
[9] L. Wang, Y. Liu, M. Zhang, D. Tu, X. Mao, and Y. Liao. A relative humidity sensor using
a hydrogel-coated long period grating. Measurement Science and Technology, 18:3131–3134,
2007.
[10] Y.-J. Rao. In-fibre bragg grating sensors. Measurement Science and Technology, 8:355–375, 1997.
[11] P. Giaccari, H. G. Limberger, and P. Kronenberg. In Influence of humidity and temperature on
polyimide-coated fiber Bragg gratings, in: Proceedings OSA Trends in Optics and Photonics
Series: Bragg gratings, Photosensitivity, Poling in Glass Waveguides, vol. 61, Washington, DC,
USA, page BFB2.
[12] HIH-4000 Datasheet. Honeywell Sensing and Control, Golden Valley, MN, USA.
[13] Raymond Measures. Structural Monitoring With Fiber Optic Technology. Academic Press, San
Diego, 2001.
[14] Pyralin Technical Information. HD Microsytems.
[15] A. Bertholds and R. Dandliker. Determination of the individual strain-optic coefficients in single-
mode optical fibers. Journal of Lightwave Technology, 6:17–20, 1988.
[16] J. L. Mrotek, J. M. Matthewson, and C. R. Kurkjian. Diffusion of moisture through optical fiber
coatings. Journal of Lightwave Technology, 19:988–993, 2001.

86
Appendix C
Simultaneous In Situ Measurement
of Temperature and Relative
Humidity in a PEMFC Using
Optical Fiber Sensors

Simultaneous In Situ Measurement of Temperatureand Relative Humidity in a PEMFC Using OpticalFiber SensorsN. A. David,a,z P. M. Wild,a,* J. Jensen,a T. Navessin,b and N. Djilalia,*aDepartment of Mechanical Engineering and Institute for Integrated Energy Systems, University ofVictoria, British Columbia, Canada V8W 3P6bNational Research Council Institute for Fuel Cell Innovation, Vancouver, British Columbia, Canada V6T1W5
The development, implementation, and demonstration of in-fiber Bragg grating �FBG� sensors for a simultaneous measurement oftemperature and relative humidity �RH� in an operating polymer electrolyte membrane fuel cell �PEMFC� are presented. Etchedfiber, polymer-coated FBG sensors with fast response and high sensitivity are installed in situ in a minimally invasive manner inthe cathode unipolar plate of a single PEMFC with serpentine flow fields. The performance of the fuel cell under transientoperating conditions is monitored. Step increases in current induce significantly larger increases in RH near the outlet than near theinlet of the cell, and associated transients within the fuel cell are found on a time scale approaching the sensor response time��1 Hz�. The improved response of the technique, together with the significantly improved temperature and RH resolution,provides useful information on the dynamics of heat and water management. The technique is well suited for distributed mea-surements, and its relatively low cost and nonintrusive character make it a good candidate for practical multipoint monitoring ofcomplete stacks.© 2010 The Electrochemical Society. �DOI: 10.1149/1.3436652� All rights reserved.
Manuscript submitted February 22, 2010; revised manuscript received May 5, 2010. Published June 10, 2010.
The temperature and relative humidity �RH� inside a polymerelectrolyte membrane fuel cell �PEMFC� have a significant impacton performance, particularly due to the effect these coupled param-eters have on the water balance within the cell.1-5 Optimal waterbalance is achieved when the membrane is well hydrated, ensuringgood proton conductivity, and the electrodes are relatively free ofliquid water to maintain effective gas transport to the reaction sites.
Water produced at the cathode during cell operation is effectivein hydrating the membrane at lower cell temperatures. But at higheroperating temperatures, which are preferred for reduced activationpolarization, the cathode RH is insufficient and the membrane driesout. Membrane dry-out not only causes an increase in ohmic over-potential but can also accelerate membrane degradation.6 To avoidthis dry operation, gas streams are typically humidified before en-tering the cell. Excessive humidification, however, can cause flood-ing and can severely decrease the cell performance due to masstransport losses. Nonuniformities in the temperature and water dis-tribution are often present7-9 and add to the challenges of thermaland water management.
Further adding to the difficulty of achieving controlled waterbalance in a PEMFC are dynamic operating conditions, which arecommon in transportation applications. Recent experimental andmodeling studies further elucidate the roles of temperature and hu-midity on cell performance under these conditions.10,11 As predictivemodels are extended to two and three dimensions, the ability tomeasure distributed temperature and RH in situ becomes increas-ingly useful for validation. Techniques developed for these purposesalso supplement conventional bulk diagnostic techniques.
Distributed measurements of RH and temperature inside aPEMFC have been performed using electrical and optical techniqueswith varying degrees of invasiveness and practicality. Microtem-perature and humidity sensors were fabricated on a metallic bipolarplate of a PEMFC by Lee et al. for in situ diagnostics.12 The sensorswere calibrated, and polarization curves were reported for an oper-ating fuel cell with and without sensors, indicating a significant dropin performance when sensors were embedded, but no temperature orRH data were presented.
Using tunable laser diode spectroscopy, Basu et al.13 claimed thefirst simultaneous nonintrusive measurements of water vapor partialpressure and temperature inside a PEMFC under steady and tran-
sient operations. Two channels in the serpentine flow path of a bi-polar plate were extended to the edges to allow optical access into atest cell. One sensing channel was located near the inlet, and onewas located near the outlet. This technique was limited, however, inits temperature resolution, and temperature differences between thetwo flow channels were not resolved. The partial pressure of watervapor, which is proportional to RH for a given temperature, wasmeasured to increase linearly with cell current and was higher to-ward the outlet. These measurements agreed with the calculated pro-duction of water at the cathode and were not significantly affectedby electro-osmotic drag. A similar approach was proposed by Par-tridge et al.,14 who reported on the use of spatially resolved capillaryinlet mass spectrometry to measure water concentration at multiplelocations in the serpentine flow field of an operating PEMFC. Theauthors suggest that in combination with spatially resolved tempera-ture measurements, the transient RH distributions could also bemeasured. Data for such measurements, however, were not pre-sented.
The trends in the partial pressure of water vapor across the cellreported in Basu et al. were confirmed more recently by the distrib-uted RH measurements of Hinds et al.15 In their work, they usedminiature single-chip capacitive sensors from Sensirion Inc.�SHT75� to accurately measure temperature and RH at pointsaround the flow field of a single test cell. The sensors, althoughrelatively small, were still too large to be installed directly into theflow channels in the active area and were therefore recessed intoauxiliary channels around the active area. The main constraint ofthis technique was the sensor size �3 � 7 mm�, which limits theability to make measurements in the active area and limits the trans-fer of the technique to commercial plate designs.
The focus of the present work is the development of an in situfiber-optic-based measurement technique that addresses temperatureresolution and sensor size limitations of existing methods.13,15 Op-tical fibers have properties that are suitable for the PEMFC environ-ment: In particular, they are nonconductive, chemically inert, andinherently small. They were recently used by Inman et al.16 for an insitu distributed point measurement of temperature across the surfaceof the gas diffusion layer. The point sensor they developed, locatedat the fiber tip, is based on the principle of phosphor thermometry.
In a previous work, we introduced the use of in-fiber Bragggrating �FBG� sensors for distributed temperature measurements in aPEMFC.17 In contrast to the sensors used by Inman et al., FBGs areinstalled parallel to the fuel cell plates and can be multiplexed withseveral sensors on a single fiber. Building on this, in this paper, we
* Electrochemical Society Active Member.z E-mail: [email protected]
Journal of The Electrochemical Society, 157 �8� B1173-B1179 �2010�0013-4651/2010/157�8�/B1173/7/$28.00 © The Electrochemical Society
B1173
Downloaded 09 Jul 2010 to 142.104.85.22. Redistribution subject to ECS license or copyright; see http://www.ecsdl.org/terms_use.jsp

present an extension of the FBG technique to the simultaneous mea-surement of RH and temperature. Sensors are fabricated and in-stalled in flow channels of the graphite cathode flow plate of a singlePEMFC and used to take minimally invasive measurements duringcell operation. With the addition of FBG multiplexing, the techniquepresented here offers the prospect of real-time multipoint monitoringof complete stacks.
Fiber Bragg Gratings: Background
An FBG typically consists of a short segment of a single-modeoptical fiber with a photoinduced periodically modulated index ofrefraction in the core of the fiber. This effectively creates a gratingof planes perpendicular to the fiber axis. When the grating is illumi-nated with broad-band light, the reflected power spectrum has astructure caused by interference of the light with the planes of thegrating. The peak of the spectrum occurs at the Bragg wavelength,�B = 2�n, where n is the index of refraction of the silica fiber and �is the grating pitch. When grating is subjected to mechanical orthermal strain, its pitch changes, causing a shift in Bragg wave-length.
This shift is given by
��B
�B= �1 − Pe�� + ��1 − Pe�� + ���T �1�
where Pe is the photoelastic constant of the fiber, � is the mechanicalstrain induced in the fiber, � is the coefficient of thermal expansionof the optical fiber, and � is the thermo-optic coefficient. A compre-hensive review of FBGs, along with a description of many of theirimportant applications, can be found in Rao.18
One such application is RH sensing.19-21 FBG is coated with amoisture-sensitive polymer that swells as water vapor absorbs intomicropores of the material. Swelling of the polymer causes axialstrain in the FBG, which is proportional to RH.
In the absence of external mechanical strain, the Bragg wave-length shift can be represented as a linear superposition of responseto changes in RH ��RH� and temperature ��T�
��B
�B= ST�T + SRH�RH �2�
where the temperature and RH sensitivity coefficients, ST and SRH,are given by
ST = �1 − Pe�Ep�rf + t�2
Ep�rf + t�2 + Efrf2 ��p − �f� + �f �3�
SRH = �1 − Pe��1 −Efrf
2
Efrf2 + Ep�t2 + 2trf�
��p �4�
These coefficients were calculated based on a uniform axial strainmodel, neglecting edge effects.19,21 The variables �p, �p, Ep, and trepresent the coefficients of thermal and hygroscopic expansion, theYoung’s modulus, and the thickness of the polymer material. TheYoung’s modulus and the radius of the fiber are represented by Efand rf, and �f is the thermo-optic coefficient of the fiber.
This type of sensor with the moisture-sensitive polyimide Pyralin�PI-2525 from HD Microsystems� was first presented by Kronen-berg et al.19 The authors showed that an FBG coated with polyimidehas a linear and reversible response for temperature and RH rangesof 13–60°C and 10–90%, respectively. The highest temperature intheir study was limited to the maximum operating range of the elec-trical gauge used, and they report additional tests showing that thesensor was not damaged when exposed to temperatures rangingfrom 20 to 160°C. In a similar study by Yeo et al.,20 Pyralin-coated sensors were characterized with linear response up to an RHlevel of 97%. The ranges reported by both groups suggest goodcompatibility of the sensors in a PEMFC.
In both the work of Kronenberg et al. and Yeo et al., severalsensors were fabricated from standard single-mode fiber �SMF 28�FBGs, each with a different coating thickness, and were tested in a
climatic chamber for sensitivity to temperature and RH. Using theseresults and published values for other parameters in Eq. 3 and 4, thecoefficients of thermal and hygroscopic expansion were identified.
The coating thicknesses tested by Kronenberg and co-workersranged from �4 to 30 m with measured RH sensitivities rangingover an order of magnitude, from 0.3 to 3.0 pm %−1. Temperaturesensitivity ranged from 10.0 pm °C−1 for a bare fiber to12.3 pm °C−1 for the thickest coating.
Based on the sensitivities measured by Kronenberg et al. for thePyralin-coated sensor, the maximum Bragg wavelength shift for a100% change in RH would be 300 pm. The same order of magnitudeBragg wavelength shift would result from temperature changes ofaround 30°C. Controlled temperature increases on this scale arecommon in PEMFCs when bringing the cell up to operating tem-peratures, after which point smaller variations can occur during nor-mal operation. To decouple the Bragg wavelength shift due to thesetemperature variations and to make accurate measurement of RHwithin the PEMFC environment, temperature compensation is re-quired.
The work of Kronenberg suggests using thicker coatings to en-hance sensitivity but does not discuss the impact this might have onthe sensor time response, which is also an important considerationfor use in a PEMFC. Yeo et al. built upon this work, characterizingthe time response of the Pyralin-coated FBG RH sensor to stepchanges in humidity.20 The response times were 18–45 min for10–45 m thick Pyralin coatings, much too long for the investiga-tion of transients in a PEMFC, which are typically on the order ofseconds.22 To reduce the response time of the sensor, thinner coat-ings must be used, but at the cost of lower sensitivity.
According to Eq. 4, however, sensitivity can be re-established byreducing the fiber diameter. In the present work, an FBG-based sen-sor is fabricated with reduced fiber diameter and temperature com-pensation, both important features for implementation inside aPEMFC.
Sensor Fabrication and Characterization
A schematic of one of the RH sensors fabricated for this work isshown in Fig. 1a. It is made up of two 1 mm FBGs spaced apart by3 mm. The distal FBG was etched and coated with Pyralin for hu-
125 µm O 31.5 µm O
1 mm
Uncoated temperatureFBG
Pyralin coatedhumidity FBG
not to scale
(a)
Lightintensity
1 2
(b)22062206 T RH+T
Figure 1. �Color online� �a� Schematic of the RH sensor consisting of two 1mm FBGs spaced apart by 3 mm. The distal FBG has a reduced diametercoated with the humidity-sensitive polymer, Pyralin, while the other FBG isleft unetched and used for temperature compensation. �b� Schematic of thereflected spectrum from the sensor. The uncoated FBG used for temperaturecompensation has the Bragg wavelength denoted by �1, which only shiftswith temperature. The etched and coated FBG has Bragg wavelength �2 andshifts with both RH and temperature.
B1174 Journal of The Electrochemical Society, 157 �8� B1173-B1179 �2010�B1174
Downloaded 09 Jul 2010 to 142.104.85.22. Redistribution subject to ECS license or copyright; see http://www.ecsdl.org/terms_use.jsp

midity sensing. The proximal FBG was left unetched and used fortemperature compensation, which was necessary due to the dualsensitivity of the coated FBG. The FBGs used for these sensors werewritten on SMF 28 fiber with Bragg wavelengths of 1540 and 1550nm and recoated with polyimide for durability �Technica SA Inc.,Beijing, China�. Depicted schematically in Fig. 1b is a reflectedspectrum with two peaks centered on the Bragg wavelengths of eachFBG.
A length of fiber with the two FBGs was cut so that one FBG is2 mm from the distal end. The stock polyimide recoat was removedby immersion in 98% sulfuric acid for approximately 10 min. Thefiber was then rinsed in deionized water. To prepare the fiber for HFetching, it was placed in a Teflon tube such that the distal FBG wasprotruding. Hot wax was used to seal the tube at the midpoint be-tween the two FBGs. The exposed FBG was submerged in 48% HFfor 30 min and then immediately neutralized in a saturated CaOHsolution to stop the etching. This results in a fiber diameter of31.5 � 0.5 m, measured using an optical microscope with a grati-cule.
For applying the Pyralin coating on the etched FBG, the proce-dure outlined in Yeo et al. was followed.20 The etched FBG was firstwiped with isopropyl alcohol and then dipped in Pyralin and with-drawn at a predetermined constant speed. A speed of 20 mm/minwas used to produce uniform coatings without bead formation. Aschematic of the setup for coating the FBGs is shown in Fig. 2. Eachcoat was precured in an oven for 5 min at 150°C. For the sensors inthis work, three coats of polymer were applied to obtain a thicknessof 2.5 � 0.5 m. The final baking of the fiber was at 200°C for 1h.
Calibration of the sensors to RH was carried out using a series ofsmall chambers containing saturated salt solutions to produce hu-midity fixed points that are in accordance with ASTM 104-02.23 Inthis way, the individual sensors, before installation in the fuel cell,are characterized in terms of sensitivity and temporal response tohumidity. The temperature calibration of the sensors was conve-
niently performed in situ where dry gas can be easily flowed throughthe channels to create a low constant humidity environment.
Nalgene bottles with a volume of 125 mm were modified so as toaccept a single sensor via a Lure lock connection in the lid. Thebottles were partially filled with �25 mm of the saturated salt so-lutions and then placed in a constant temperature water bath set at25°C. The four salts used for calibration are listed in Table I, alongwith their associated RH at 25°C.24 The RH inside the chamberswas measured using a Sensirion Inc. SHT75 RH sensor with speci-fied accuracy of �1.8% RH. The Bragg wavelength shift of the FBGwas detected using an optical interrogation unit �SM130 from Mi-cron Optics, Inc., Atlanta, GA�, with a specified wavelength reso-lution of 0.1 pm at a 10 Hz sampling rate.
The time response of the sensor was tested by moving it betweentwo of the bottles containing different salt solutions, the act of whichtakes less than 2 s.
The RH calibration results for a 31.5 m diameter fiber FBGwith a 2.5 � 0.5 m Pyralin coating are shown in Fig. 3. The sen-sitivity to RH was 0.99 pm % RH−1 from the slope of the linear fitto the data. Although a saturated salt solution for a higher humiditylevel was not used, linear response for a Pyralin-coated FBG wasshown up to 97% RH by Yeo et al. Furthermore, when the sensorwas immersed in water, it measured 100 � 2.0% RH and recoveredquickly upon drying. For this fiber diameter and coating thickness,including their measured uncertainties, the calculated sensitivitybased on Eq. 4 is 1.25 � 0.25 pm % RH−1, indicating a reason-able agreement between the model of Kronenberg et al. and thisetched sensor design. The sensitivity measured here is more than 3times higher than the value reported by Kronenberg et al. for a3.6 � 1 m thick coating on an unetched fiber.
Figure 4 shows the sensor response to a step change in humidityfrom 43 and 84% RH. From this plot, the two conventionally de-fined response times are determined and given in the inset table. The90% response time of 10 s is a vast improvement over the previousgeneration of unetched sensors reported in Ref. 20 and is suitable tomeasure transient phenomena inside a PEMFC. In fact, the 63%
Figure 2. �Color online� Schematic of the dipping procedure used for coat-ing the FBGs with polymer.
Table I. RH fixed points for the saturated salt solutions used forsensor calibration.24
Salt RH at 25°C
K2Co3 43.16 � 0.39NaBr 57.57 � 0.4KI 68.86 � 0.24KCl 84.34 � 0.26
40 50 60 70 80 900
10
20
30
40
50
Relative humidity (%)
Braggwavelengthshift(pm)
y = *x - 42.6
datalinear fit
0.99
Figure 3. �Color online� RH calibration data for a 34 m RH sensor ac-quired using humidity fixed point chambers containing saturated salt solu-tions.
B1175Journal of The Electrochemical Society, 157 �8� B1173-B1179 �2010� B1175
Downloaded 09 Jul 2010 to 142.104.85.22. Redistribution subject to ECS license or copyright; see http://www.ecsdl.org/terms_use.jsp

response time is half that specified for the commercial sensors usedin Ref. 25. Also notable in the response data is that upon returning tothe low humidity state, the Bragg wavelength settles back to theoriginal value, indicating reversibility of the polymer expansionmechanism.
Temperature calibration was done with the sensors installed inthe graphite fuel cell flow plate. Two miniature T-type thermo-couples were installed into a blank graphite plate such that when it isused to cover the flow plate with the FBGs, the thermocouples andthe FBGs are colocated. The single cell was assembled, with theblank plate used in place of the membrane electrode assembly�MEA� and the anode flow plate. Dry air was fed into the cathodeflow field, and the temperature was increased using the water heat-ing system and then allowed to cool to room temperature by naturalconvection.
Shown in Fig. 5 are temperature calibration data for each FBGacquired during slow thermal cycling of the sensors in situ under dryconditions. As indicated by the slopes of the linear fits to the data,the polymer coating on the RH-sensitive FBG has the effect of in-creasing its sensitivity to temperature by �10%. This result is con-sistent with Eq. 3. Although the calibration was performed in the25–80°C range, to cover the operating range of interest of the fuelcell, the sensor temperature range can be easily extended.19
With good linearity and reversibility in the RH and temperaturecalibration data, estimations of the accuracies of the etched FBGsensors fabricated in this work are �2.0% RH and �0.2°C. Thesevalues are based on the specifications of Sensirion SHT75 and theOmega thermocouple used as references for calibration. The abso-lute temperature uncertainty reported here is an order of magnitudeimprovement over that of the technique used by Basu et al. for theirin situ measurements13 and is adequate to investigate temperaturedifferences between adjacent channels inside a single PEMFC.13,17
Resolving differences in temperature and RH in situ is further im-proved by the high wavelength resolution of the Micron OpticsSM130 used to interrogate the FBGs in the sensor. Based on this, theminimum detectable change in RH is 0.1% RH, assuming tempera-ture compensation.
In Situ Experiments
Sensor installation.— A graphite flow plate for a single test cellof an active area of 30.25 cm2 was machined with a serpentine flowfield and instrumented with two of the previously discussed FBGRH sensors. The schematic in Fig. 6a shows the location of one ofthe installed sensors in the flow plate and where it sits relative to themain PEMFC components. The design challenges in embedding theFBG sensor in an operating fuel cell were discussed in Ref. 17. Toavoid interference with the flow in the gas channel, the sensor wasinstalled in a groove at the bottom of the flow channel, as shown in
Fig. 6b. Underneath the sensor is a recess in the groove to ensurethat the entire surface of the sensor is in contact with the air in thechannel. Clearly, from the figure, with this installation and with thesmall diameter of the sensor, there is minimal impact on the activearea of the PEMFC.
Proper sealing of the installation is also important to minimizethe impact on performance. Cyanoacrylate adhesive was used to fixthe fiber in place and to seal the angled hole where it enters the flowchannel. This provides strain relief to ensure that only the changes inRH and temperature within the sensing region are detected ratherthan mechanical strain transmitted from the exterior. Another impor-tant feature of the design shown in Fig. 6b is the curve in the fiber asit enters the sensing region from outside the cell. Excessive bendingresults in loss of optical power transmitted to and from the sensor,and bends therefore should be limited to about 1 cm in radius.
Figure 7 shows the locations of the two sensors along the flowfield in the graphite flow plate. The plate is used on the cathode sideof the test cell, and air flows over sensors 1 and 2 from the inlet tothe outlet, respectively.
Test cell.— The instrumented graphite plate described above wassized to fit into a pre-existing fuel cell test assembly. The assemblyconsists of gold-plated current collector plates, and stainless steelmanifolds for gas distribution and water circulation for the cell heat-ing system. This assembly can be seen in Fig. 8, where the fiberoptics is also shown entering the cathode plate.
MEAs for the test cell were fabricated at the National ResearchCouncil Institute for Fuel Cell Innovation, Vancouver, Canada. Anactive area of 30.25 cm2, with platinum loading of 0.4 mg/cm2,was achieved by masking and spray deposition of a carbon catalystink onto Nafion 115 membrane. The gas diffusion layer used for the
0 10 20 30 40 50 60 70 80 90 100 110 120 130 140 150
5.0
10
15
20
25
30
35
40
45
0.0Braggwavelengthshift(pm)
Time (s)
43% RH
84% RH
Response timeRecovery time
63% 90%4 s5 s
10 s11 s
Figure 4. �Color online� Response of the etched sensor with coating thick-ness of 2.5 � 0.5 m to a step change in RH. Conventionally defined re-sponse times for the sensor are shown in the table.
20 40 60 801539.5
1539.6
1539.7
1539.8
1539.9
1540.0
1540.1
1540.2
Thermocouple temperature (°C)
Braggwavelength(nm)
y = *x + 1539.4
20 40 60 801551.2
1551.3
1551.4
1551.5
1551.6
1551.7
1551.8
1551.9
1552.0
Thermpcouple temperature (°C)
Braggwavelength(nm)
y = *x + 1551
Pyralin Coated FBG
FBG
10.2 E-3
11.4 E-3
(a)
(b)
Uncoated
Figure 5. �Color online� Calibration data for the RH sensor with respect totemperature acquired under dry conditions. �a� 125 m uncoated FBG usedfor temperature compensation. �b� 34 m Pyralin-coated FBG.
B1176 Journal of The Electrochemical Society, 157 �8� B1173-B1179 �2010�B1176
Downloaded 09 Jul 2010 to 142.104.85.22. Redistribution subject to ECS license or copyright; see http://www.ecsdl.org/terms_use.jsp

MEAs was Toray paper with 10% polytetrafluoroethylene content,and that for the MEAs used in this study was not hot-pressed ontothe carbon catalyst layer.
The test cell was operated using a Ballard 3 kW fuel cell teststation, which enabled control of the fuel and oxidant flow rates, anda cell temperature with a water heating system. The current densityof the fuel cell was varied using an electronic load bank �DynaloadInc., MCL488, Hackettstown, NJ� that was connected via copperleads to the gold-plated collector plates on either side of the singlecell. The cell voltage was measured using analog inputs on a 16 bitdata acquisition device �National Instruments Inc.�.
In situ testing conditions.— For in situ testing of the sensors, thecell was run in the coflow mode with the temperature set to 40°C.Water tanks for the gas humidifier were also set to 40°C, but be-cause the tubing from these tanks to the test cell was not heated, theinlet gas streams were underhumidified. A standard PEMFC test isto vary the cell current with the load and to acquire a polarizationcurve by measuring the corresponding cell voltages. By performingthis test with the sensors installed, steady-state and transient behav-iors are observed in the cell voltage as well as in the RH and tem-perature within the cell. Data from the sensors were acquired at asampling rate of 1 kHz and presented with 1000 averages to im-prove the resolution. Before carrying out the current sweeps forpolarization tests, the MEA was conditioned by running the cell at0.3 A cm−2 for �30 min.
Results and Discussion
To obtain a polarization curve quasi-statically, the cell currentwas incremented from 0 to 15 A and back down to 0 in steps of 3 A,allowing the cell voltage to reach steady state between each step.The flow rates for the air and hydrogen streams were set to 1.25 and0.75 slpm. This overstoichiometry was used to prevent water accu-mulation in the flow channels. Because the etched fiber sensor isfree at one end in this installation, the fine fiber can be easily de-flected due to the surface tension of water accumulated around it.The resulting strain on the FBGs perturbs the sensor measurementssignificantly. Such perturbations were observed at low oxidant flowrates and higher currents.
Results from incrementally increasing the cell current from 0 to15 A are shown in Fig. 9 with the cell voltage data and the sensormeasurements. In Fig. 9b, the RH near the outlet climbs higher thanthe inlet RH after the first step in cell current. The following twosteps in current, to 6 and 9 A, are also marked with increases in RHnear the outlet. Subsequent steps in current result in smaller incre-ments in RH near the outlet until a maximum of around 90% RH isreached.
In contrast to the large changes in RH near the outlet, the inletRH increases in smaller steps. These steps continue throughout the
FBG sensor
GDL
Membran
e
GDL
Groove
Flow channel
1.25mm
0.6mm
Membrane
GDL
Gasket seal
N otto scale
(a)
(b)
Flow channel
Temperature FBG RH FBGAdhesive for strain relief
Figure 6. �Color online� Schematic of the in situ FBG sensor located in thebottom of the flow channel of the graphite flow plate �a�. The side viewschematic in �b� shows how the sensors were installed into the flow plate.
5.5 cm
Air inlet
Air Outlet
Sensor 1
Sensor 2
Flow channel
Dual FBG RH sensor
0.9 mm
Figure 7. �Color online� Schematic of the cathode flow plate showing thelocations of the two etched FBG RH sensors. Inset drawing is of a singlesensor embedded in the flow channel.
Gas/water manifold
Current collectorplate
Graphite flow-fieldplate
Clamping plate
Fibres with FBGs
Figure 8. �Color online� Photograph of the single test cell assembly. The celltemperature is set by circulating deionized water from a temperature con-trolled bath in the test station through the stainless steel plates on either sideof the cell.
B1177Journal of The Electrochemical Society, 157 �8� B1173-B1179 �2010� B1177
Downloaded 09 Jul 2010 to 142.104.85.22. Redistribution subject to ECS license or copyright; see http://www.ecsdl.org/terms_use.jsp

range of currents with no plateau, as is the case for the outlet RH.The higher RH measured near the outlet on the cathode side for allcell currents above zero is to be expected; water produced in thecatalyst layer during cell operation acts to increasingly humidify theair as it flows from the inlet to the outlet. Sensor 1 is only a fewchannels downstream from the inlet and, therefore, measures air thathas a limited interaction with product water and has thus generallylower RH.
Shown in Fig. 10 is the transient response of sensor 2 followinga step change in current from 0 to 3 A, with the cell voltage responseplotted for comparison. There is an initial rise in RH of more than 30% in �30 s after the step change. This is followed by a smaller
and slower increase in RH, after which it reaches steady state at atime comparable to the cell voltage �t = � 180 s�. The response ofthe cell voltage and the RH agrees with measurements of Hinds etal. and is consistent with the time scale of water sorption into theNafion membrane, which is of the order of hundreds of seconds.26
This result demonstrates that RH transients inside a PEMFC exist ona time scale approaching the sensor response time and that the sen-sor could provide information on the dynamics of water transport inthe MEA.
Temperature differences, reaching up to �1.5°C, were also mea-sured in the flow field between the inlet and the outlet, as shown inFig. 9c. These are expected as a result of higher membrane hydra-tion toward the outlet, leading to higher current densities and moreohmic losses. Gradients in temperature such as this have also beenreported in other studies.17,27,28
The steady-state polarization results for the test described areshown in Fig. 11. The cell voltage measured for decremented currentis higher than that for the incremented current, indicating hysteresisin performance. The corresponding steady-state measurements ofRH are shown in Fig. 11b, which also show hysteresis and likelycontribute to the hysteresis in the polarization curve.
0 1000 2000 30000
0.5
1.0
1.5Cellvoltage(V)
0 1000 2000 30000102030405060708090100
Relativehumidity(%)
0 1000 2000 300036373839404142
Time (s)
Temperature(°C)
15 A12 A
9 A3 A 6 A
OCV
Sensor 2
Sensor 1
Sensor 1
Sensor 2
(a)
(b)
(c)
Figure 9. �a� Voltage, �b� RH, and �c� temperature data taken while incre-menting cell current for obtaining a polarization curve. The flow rates for theair and hydrogen were 1.25 and 0.75 slpm, respectively.
0 50 100 150 20010
20
30
40
50
60
70
80
90
100
RelativeHumidity(%)
0 50 100 150 2000
0.2
0.4
0.6
0.8
1
1.2
Time (s)
CellVoltage(V)
Sensor 2 RH
Cell Voltage
Figure 10. �Color online� Transient response of sensor 2 following a stepchange in current density from 0 to 3 A at time t = 28 s. The cell voltageresponse is also shown for comparison.
0 3.0 6.0 9.0 12.0 15.00.2
0.4
0.6
0.8
1
1.2
Current (A)
Cellvoltage(V)
Current upCurrent down
0 3.0 6.0 9.0 12.0 15.010
20
30
40
50
60
70
80
90
100
Current (A)
RelativeHumidity(%)
Sensor 2
Sensor 1
(a)
(b)
Figure 11. �a� Steady-state polarization data for increasing and decreasingcurrents with cell temperature set to 40°C. �b� Corresponding steady-stateRH measurements of sensors 1 and 2.
B1178 Journal of The Electrochemical Society, 157 �8� B1173-B1179 �2010�B1178
Downloaded 09 Jul 2010 to 142.104.85.22. Redistribution subject to ECS license or copyright; see http://www.ecsdl.org/terms_use.jsp

Conclusions
An etched fiber, polymer-coated FBG sensor for a fast response,high sensitivity measurement of RH and temperature has been dem-onstrated. Two of the sensors were embedded directly into the cath-ode flow channels of a single test cell and were used to make real-time measurements of RH and temperature during cell operation.
Results show that for an increased current density, much largerincreases in RH occur near the outlet than near the inlet, a trend thathas been reported in other studies. From the results, it was alsodetermined that RH transients inside a PEMFC exist on a time scaleapproaching the sensor response time, proving that the sensor couldprovide information on the dynamics of water transport in the MEA.
The small size of the sensor implemented here and its accurate,high resolution measurement capabilities combine to address keylimitations of other techniques used for in situ PEMFC measure-ments. In the interest of improved cell design, particularly with re-gard to humidification and thermal and water management schemes,this relatively inexpensive technique could prove useful as a nonin-vasive in situ diagnostic tool.
Further improvements of the technique involve the multiplexingof several temperature-compensated FBG RH sensors on a singlefiber. This increases the number of measurement points from 4 to 10,resulting in truly distributed RH and temperature data within anoperating fuel cell. This naturally lends itself to a sensor installationthat is fixed on both ends and, therefore, to measurements that areunperturbed by liquid water. Furthermore, with the minimal inva-siveness of the optical fibers into the fuel cell flow plate, the tech-nique could be extended for use in bipolar plates for multipointmonitoring of complete stacks.
Acknowledgments
This work was funded by the Natural Sciences and EngineeringResearch Council �NSERC� of Canada and the Canada ResearchChairs program. The authors also acknowledge the valuable input ofDr. Matt Moffit on coating techniques.
University of Victoria assisted in meeting the publication costs of thisarticle.
References1. J. Lariminie and A. Dicks, Fuel Cell Systems Explained, John Wiley & Sons, New
York �2000�.2. M. M. Mench, Q. L. Dong, and C. Y. Wang, J. Power Sources, 124, 90 �2003�.3. Q. G. Yan, H. Toghiani, and J. X. Wu, J. Power Sources, 158, 316 �2006�.4. A. Z. Weber and J. Newman, J. Electrochem. Soc., 153, A2205 �2006�.5. S. Kim and M. M. Mench, J. Electrochem. Soc., 156, B353 �2009�.6. C. Chen and T. F. Fuller, Polym. Degrad. Stab., 94, 1436 �2009�.7. N. Djilali and D. Lu, Int. J. Therm. Sci., 41, 29 �2002�.8. T. Berning and N. Djilali, J. Electrochem. Soc., 150, A1589 �2003�.9. S. Kjelstrup and A. Rosjorde, J. Phys. Chem. B, 109, 9020 �2005�.
10. M. Meiler, D. Andre, O. Schmid, and E. P. Hofer, J. Power Sources, 190, 56�2009�.
11. A. A. Shah, G. S. Kim, P. C. Sui, and D. Harvey, J. Power Sources, 163, 793�2007�.
12. C.-Y. Lee, G.-W. Wu, and C.-L. Hsieh, J. Power Sources, 172, 363 �2007�.13. S. Basu, M. W. Renfro, and B. M. Cetegen, J. Power Sources, 162, 286 �2006�.14. W. P. Partridge, T. J. Toops, J. B. Green, and T. R. Armstrong, J. Power Sources,
160, 454 �2006�.15. G. Hinds, M. Stevens, J. Wilkinson, M. de Posta, and S. Bell, J. Power Sources,
186, 52 �2009�.16. K. Inman, X. Wang, and B. Sangeorzan, J. Power Sources, 195, 4753 �2010�.17. N. A. David, P. M. Wild, J. Hu, and N. Djilali, J. Power Sources, 192, 376 �2009�.18. Y.-J. Rao, Meas. Sci. Technol., 8, 355 �1997�.19. P. Kronenberg, P. K. Rastogi, P. Giaccari, and H. G. Limberger, Opt. Lett., 27,
1385 �2002�.20. T. L. Yeo, T. Sun, K. T. V. Grattan, D. Parry, R. Lade, and B. D. Powell, Sens.
Actuators B, 110, 148 �2005�.21. X. F. Huang, D. R. Sheng, K. F. Cen, and H. Zhou, Sens. Actuators B, 127, 518
�2007�.22. S. Shimpalee, W.-k. Lee, J. Van Zee, and H. Naseri-Neshat, J. Power Sources, 156,
355 �2006�.23. American Society for Testing and Materials, E104-02 �2007�.24. L. Greenspan, J. Res. Natl. Bur. Stand., Sect. A, 81A, 1 �1977�.25. SHT7x Datasheet, Sensirion Inc., Zurich, Switzerland, http://www.sensirion.com,
last accessed 2009.26. P. Majsztrik, M. Satterfield, A. Bocarsly, and J. Benziger, J. Membr. Sci., 301, 93
�2007�.27. M. Wang, H. Guo, and C. Ma, J. Power Sources, 157, 181 �2006�.28. P. T. Nguyen, T. Berning, and N. Djilali, J. Power Sources, 130, 149 �2004�.
B1179Journal of The Electrochemical Society, 157 �8� B1173-B1179 �2010� B1179
Downloaded 09 Jul 2010 to 142.104.85.22. Redistribution subject to ECS license or copyright; see http://www.ecsdl.org/terms_use.jsp

94
Appendix D
Fiber Bragg Grating Sensor for
Two-Phase Flow in Microchannels

Noname manuscript No.(will be inserted by the editor)
Fiber-Bragg Grating Sensor for Two-Phase Flow in
Microchannels
Nigel David · Ned Djilali · Peter Wild
Received: date / Accepted: date
Abstract A new non-intrusive measurement technique for two-phase flow in mi-
crochannels is presented. The development of an evanescent field based optical
fibre Bragg grating sensor is described, and experiments coupled with flow visual-
ization demonstrating the performance of this sensor are presented. Two adjacent
1 mm FBGs in etched D-shaped fibre are embedded into the surface of a PDMS
microchannel. Experiments are conducted in both droplet and slug flow regimes
and high speed digital video are captured synchronously with the sensor data.
The FBGs exhibit an on-off type response to the passage droplets which is shown
to correlate precisely with the passage of the liquid phase. This correlation en-
ables the measurement of droplet average velocity and size using only the sensor
data. In addition to the use of both FBG signals for the purpose of measuring
droplet speed and size, it is shown that for droplets larger than the FBG length, a
single FBG can be used to estimate the convection velocity and size of fast mov-
ing droplets. This sensing method is potentially useful for monitoring two-phase
N. David · N.Djilali · P. WildDepartment of Mechanical Engineering, University of Victoria, PO Box 3055, STN CSC, Vic-toria, BC, V8W 3P6, CanadaTel.: +250-721-8940Fax: +250-721-6323E-mail: [email protected]
N. DjilaliE-mail: [email protected]

2 Nigel David et al.
flow in fuel cells and microfluidic applications such as micro-heat exchangers and
lab-on-a-chip systems.
Keywords Multiphase flow · Liquid water · Fiber-optics · PEM Fue cell · Water
management
1 Introduction
Two phase flows in microchannels occur in numerous applications. These include
heat sinks that rely on the phase transition of boiling refrigerants to cool integrated
circuits and electronic devices [1,2]; microfluidic devices used in microchemical mi-
croelectromechanical and lab-on-chip systems [3,4]; and fuel cells used to convert
chemical energy into electricity[5]. In spite of the progress in general understanding
of microchannel two-phase flow phenomena, the development of broadly applicable
predictive models is still lagging. Two phase flow regimes in microchannels differ
significantly [6–8] from those encountered in more classical systems, and there is a
need for improved experimental techniques [9] to further fundamental understand-
ing of flow dynamics, bubble and/or film sizes, pressure drop, wettability etc. in
order to inform improved design and control of the flow and associated transport
processes. In polymer electrolyte membrane (PEM) fuel cells, which are the pri-
mary motivation for the work presented here, liquid water management in the gas
flow microchannels is a critical problem that leads to numerous performance and
material degradation issues [10,11]. In microfluidic devices that are increasingly
designed for an array of complex processes including mixing, assays and chemical
reactions, more precise understanding of the dynamics of immiscible fluid phases
is needed to achieve precise control [12].
Experimental methods currently available for characterizing the dynamics and
mixing of two-phase flows in microchannels and micro-reactors are reviewed in [13].
These include visualization techniques tracking directly interfaces or in conjunc-
tion with fluorescent dyes or reactive species; micro particle image velocimetry; and
non-intrusive sensors. Visualization techniques have also been extensively used to

Fiber-Bragg Grating Sensor for Two-Phase Flow in Microchannels 3
visualize liquid water in operating fuel cells [10] specifically designed to allow op-
tical access; the techniques include NMR imaging, neutron imaging, synchrotron
X-ray imaging, microtomography and optical photography. Visualization-based
techniques have proven extremely valuable but typically require expensive equip-
ment, and are limited to optically accessible systems. Investigation of multi-layered
microfluidic devices is for example difficult, and optical access in commercial fuel
cell stacks is not possible without compromising the design.
Micro-sensors are an obvious alternative to address the needs for monitor-
ing and measurements. Non-intrusive sensors that rely on infrared absorption or
refractive index detection have been developed for microfluidic devices and micro-
reactors, however these still require optical access [12]. The only micro-sensor
demonstrated to date for measurement of two-phase flow in fuel cells is reported
by Conteau et al.[14]. The sensor was based on an impedance measurement be-
tween two electrodes on either side of a graphite micro-channel used to simulate
experimentally two phase flows relevant to fuel cells. Correlation of the sensor data
with high-speed digital images showed the capabilities of the sensor in detecting
small and fast water droplets injected into the microchannel.
Electrode-based sensors, such as the one developed by Conteau et al., will
require special attention to electrical isolation, which, inside of an electrochemi-
cally active fuel cell, can prove difficult. For distributed measurements using these
sensors, multiplexing will require several electrically isolated leads, which poses
another significant instrumentation challenge.
Fiber optics is an approach to PEMFC diagnostics that is free from the con-
straints of electronic sensors. Important advantages of optical fiber sensors are
that they are inherently small, electrochemically inert, and there is potential for
multiplexing several sensors along a single optical fiber.
The fiber Bragg grating (FBG) sensor, for instance, can be multiplexed easily,
and can be used to measure multiple parameters. As a result, there are growing
number of applications for which FBGs are being used. FBG sensors were recently

4 Nigel David et al.
developed and used to measure temperature and humidity in operating PEM fuel
cells[15,16]. Humidity sensitivity is achieved by adding a hygroscopic polymer
coating to the cladding of fiber.
Temperature and humidity are important parameters inside a PEMFC, but
the measurement of liquid water is paramount. It has been shown that by remov-
ing the glass cladding around an FBG, it becomes sensitive to the surrounding
refractive index [17–19]. These types of sensors, known as evanescent field sensors
are sensitive along the length of the FBG, which makes them ideal for multiplexed
implementation into fuel cell plates. Such sensors have not yet, however, been
demonstrated to measure the difference of refractive index between air and water
inside of a PEMFC.
In this paper, a proof-of-concept study of an FBG-based evanescent field sensor
for detecting water droplets in a microchannel is presented. Validation of the design
was carried out by correlations between high-speed digital video footage and the
sensor response under various two-phase flow conditions.
2 Sensing principle
An FBG typically consists of a short segment of single mode optical fiber with a
photo-induced periodically modulated index of refraction in the core of the fiber.
When the grating is illuminated with broadband light, the reflected spectrum has
a peak at the Bragg wavelength given by
λB = 2Λneff , (1)
where neff is the effective index of refraction of the modified core and Λ is the
grating pitch. Both neff and Λ are dependent on strain and temperature, which
enables the FBG to be used for sensing parameters such as temperature, strain,
pressure and humidity, for example.

Fiber-Bragg Grating Sensor for Two-Phase Flow in Microchannels 5
When the cladding of the fiber is removed around the Bragg grating, neff be-
comes influenced by the refractive index of the surrounding medium. For constant
temperature and strain conditions, small variations in the Bragg wavelength due
to changes in the effective refractive can be simply expressed by
∆λB = 2∆neff (ns)Λ (2)
where neff is written as a function of ns, the refractive index of the surrounding
medium.
The refractive index sensitivity of etched cladding FBGs written in standard
single mode fiber with a core of 8.3 µm was determined numerically and experi-
mentally by Iadicicco et al. [17]. A non linear dependence of λB on ns was reported
with increased sensitivity as the surrounding refractive index approached that of
glass. The study showed that for a sensor with cladding diameter of 8.5 µm, mea-
surement resolutions of 10−5 and 10−4 were possible for the outer refractive index
of 1.45 and 1.33, respectively, when using an FBG interrogator with 1pm resolu-
tion.
Iadicicco et al. cite the reason for higher sensitivity for higher refractive index
surroundings is the penetration depth of the evanescent field. For lower external
refractive indexes, like air (1.0) and water (1.33) the light is well confined within the
core, leading to a weak dependence on ns. However, for higher indexes approaching
that of the fiber core (n=1.46), the fundamental mode is less confined to the core
region, leading to increased interaction with the surrounding medium.
Etching standard single mode optical fiber to a diameter of ∼8 µm makes it
difficult to handle and to package into a sensor, particularly when embedding into a
surface to detect liquid water. Alternative solutions to gain access to the evanescent
field about an FBG without sacrificing its mechanical integrity were demonstrated
by Schroeder et al. [18] and Meltz et al. [19]. Schroeder et al. used side polishing on
a pre-embedded standard single mode fiber to construct a sensor that was sensitive
to the refractive index change induced by the presence of hydrogen on the surface.
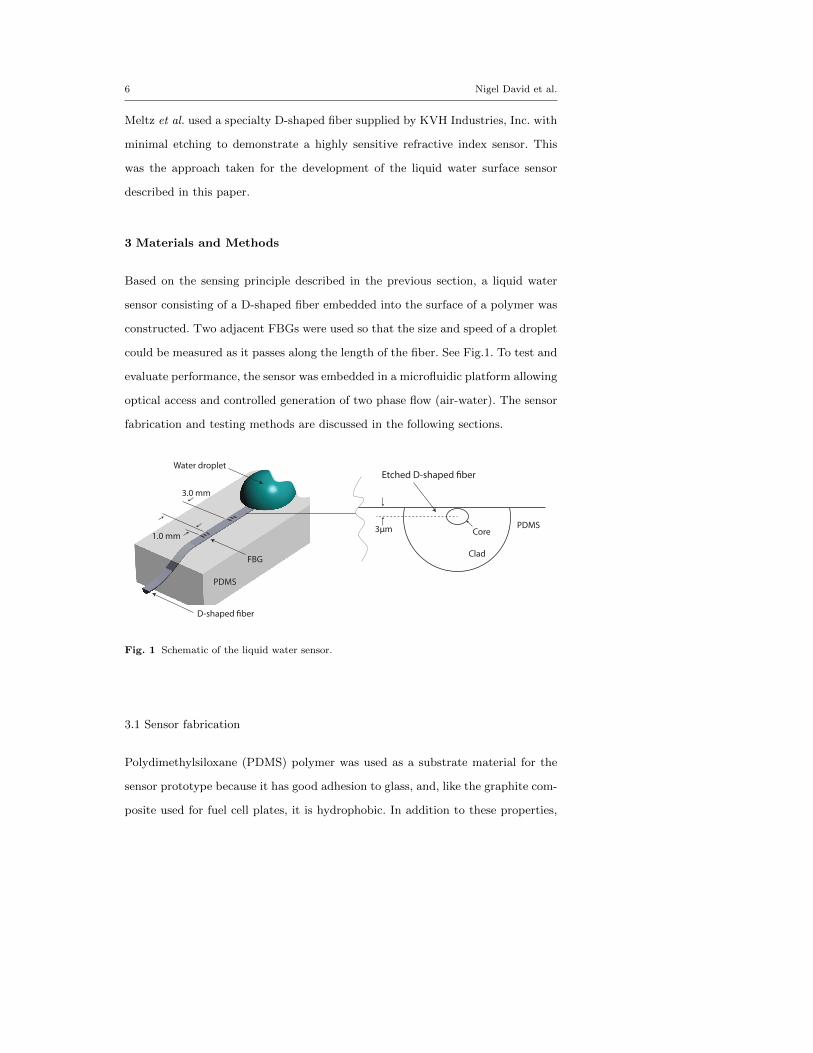
6 Nigel David et al.
Meltz et al. used a specialty D-shaped fiber supplied by KVH Industries, Inc. with
minimal etching to demonstrate a highly sensitive refractive index sensor. This
was the approach taken for the development of the liquid water surface sensor
described in this paper.
3 Materials and Methods
Based on the sensing principle described in the previous section, a liquid water
sensor consisting of a D-shaped fiber embedded into the surface of a polymer was
constructed. Two adjacent FBGs were used so that the size and speed of a droplet
could be measured as it passes along the length of the fiber. See Fig.1. To test and
evaluate performance, the sensor was embedded in a microfluidic platform allowing
optical access and controlled generation of two phase flow (air-water). The sensor
fabrication and testing methods are discussed in the following sections.
1.0 mm
3.0 mm
PDMS
D-shaped �ber
FBG
Water droplet
PDMS
Clad
Core3μm
Etched D-shaped �ber
Fig. 1 Schematic of the liquid water sensor.
3.1 Sensor fabrication
Polydimethylsiloxane (PDMS) polymer was used as a substrate material for the
sensor prototype because it has good adhesion to glass, and, like the graphite com-
posite used for fuel cell plates, it is hydrophobic. In addition to these properties,

Fiber-Bragg Grating Sensor for Two-Phase Flow in Microchannels 7
PDMS is commonly used in prototyping microfluidic devices and, therefore, could
be used for the transparent microchannel to test the sensor.
D-fiber has a roughly semi circular cross section with the light carrying core
lying just beneath the flat surface. It requires only minimal etching to access the
evanescent field near the core of the fiber, leaving a fiber that is substantially easier
to work with during the fabrication steps following the etching. The D-fiber used
for the sensors in this study was supplied by KVH industries, Inc.
Two adjacent FBGs were written into the D-fiber by Technica SA, Inc., China.
They were specified to be one millimetre in length with centre wavelengths of 1547
and 1552 nm and spaced apart at the inside edges by 3 mm. See Fig. 1. Using a
hot wire technique to locate the FBGs, the centre-to-centre grating spacing was
verified to be 4 mm.
To detect the refractive index change above the flat side of the D-fiber, the
fiber was etched with hydrofluoric acid (HF). Using a 48% HF solution at room
temperature, the etch rate for the flat to the round dimension was determined to
be 2.75 µm/min. A length of 1.5 cm of the D-fiber containing the two FBGs at the
distal end of the fiber was immersed in the HF solution and etched for 8 minutes.
According to the D-fiber specifications provided be KVH, Inc. the core diameter
is 5 µm, and the distance from the centre of the core to the flat side is nominally
∼14 µm. After etching the D-fiber in HF for 8 minutes this distance becomes 3 µm,
leaving a cladding thickness of ∼0.5 µm above the core.
The spectra of the FBGs were measured prior to and after etching with a Smart
Scan FBG interrogator (Smartfibers, Inc., Bracknell, UK). Wavelength resolution
of the Smartscan is ∼1 pm. The full etching caused a blue shift of 800 pm of the
Bragg wavelengths when exposed to the air, with no difference in peak amplitude.
This effect has been observed before, and is attributed to residual strain relaxation
in the core of the fiber [17]. Upon submerging the etched FBGs in water, the Bragg
wavelengths of the two FBGs increased by ∼400 pm, indicating a clear response
to the change in surrounding refractive index. See Fig.2

8 Nigel David et al.
1544 1545 1546 1547 1548 1549 1550 1551 1552 1553 15540
20
40
60
80
FBG2
Dry Wet
FBG1
Ref
lect
ed in
tens
ity (A
.U.)
Wavelength (nm)
~300 pm ~400 pm
Fig. 2 Sensor response to liquid water.
Subsequent to etching the D-fiber, it was cast into PDMS using a mold made
from Poly(methyl methacrylate) (PMMA). PMMA has a flat, shiny surface to
which PDMS does not bond.
Using a fiber rotator, and a stereo microscope, the D-fiber was oriented in the
mold such that the flat side of the fiber was parallel to the PMMA surface. A 1
cm length of the fiber containing the two FBGs was pressed against the PMMA
surface with two small PDMS blocks that were weighted down. This was to ensure
the FBGs would be exposed at the surface of the sensor once released from the
mold.
The PDMS used for the sensor was the two part Sylgard 184 silicone elastomer
kit from Dow Corning, Inc. A 5:1 by weight ratio of pre-polymer to curing agent
was used to obtain a stiffer cured material. After thoroughly mixing the PDMS, it
was degassed under vacuum for 20 minutes, and then poured into the mold over
top of the FBGs to a depth of ∼7 mm. The PDMS was allowed to cure for 24 hrs.
With the FBGs located at its center, a rectangle approximately 30 mm x 60 mm
was cut into the cured PDMS with a scalpel. The rectangular slab containing the
FBGs was carefully released from the PMMA mold. Inspection under a microscope
revealed a thin layer of PDMS on top of the fiber that inhibited the sensor response
to liquid water. This thin layer was removed mechanically with a soft tool, and
the sensitivity to surface droplets was established.

Fiber-Bragg Grating Sensor for Two-Phase Flow in Microchannels 9
3.2 Sensor testing setup
A schematic of the setup for sensor testing is shown in Fig. 3. A microchannel made
from PDMS was placed on top of the sensor allowing controlled generation of both
droplet and slug two-phase flow. The cross sectional area of the microchannel as
well as the range of air and water injection rates used in the tests are representative
of fuel cell conditions. The sensors performance was validated by correlating high
speed digital video of the two-phase flow with the sensor data, which was acquired
synchronously.
The digital video was taken with a Vision Research, Inc. (Phantom, Miro 4)
camera at a frame rate of 1000 frames per second. The FBG data was acquired at
2 kHz using the Smartscan interrogation unit.
0.60 mm
0.20 mm
Air
WaterSensor
Micro-channel
PDMS test channel
PDMS with sensor
High speed camera
FBG interrogator
PDMS test channel
Fig. 3 Schematic of the sensor test setup.
The microchannels used for the tests were fabricated out of PDMS using stan-
dard soft photolithography techniques and incorporated air and water injection
ports connected to syringe pumps controlled to create the desired flow regime.
The dimensions of the microchannel are shown in Fig. 3. The air and water in-
jection ports were fed with syringe pumps to create segmented flow within the
channel.
With air and water injection rates set to 90 and 45 µlmin−1 respectively, short
segments of water, or slugs, spaced apart by longer segments of air passed through

10 Nigel David et al.
the channel and over the embedded FBGs. A small amount of red dye was mixed
into the water as a contrast to enable better visualization of the water.
To test the sensor response to fast moving droplets, a 1 mm wide PDMS channel
was created with side walls and no cover. Individual droplets were deposited at
the entrance to the channel. Forced air was blown through the widened entrance
to the channel causing the small droplet to convect through the channel at a high
speed. Care was taken to ensure the droplet remained intact without touching the
side walls as it passed over the FBGs.
4 Results and discussion
Tests were carried out to validate the sensor in the slug and droplet flow regimes
that are relevant to the fuel cell two-phase flows that motivated this work [20].
4.1 Slug flow regime
Shown in Fig. 4 are sample results from the slug flow regime tests. The slugs
passed through the channel in the direction from FBG1 to FBG2. The sensor data
plotted in Fig. 4(a) was taken over a 25 second time period during which 4 slugs
passed across the sensor. It is clear that each FBG exhibits an on-off type response
to the passing slugs with the response of FBG1 leading that of FBG2, which is
consistent with the relative locations of the gratings. The Bragg wavelength shifts
are consistent with the initial tests carried out after etching. See Fig.2.
The sensor response to the passage of a single slug is shown in Fig. 4(b).
Selected video frames, at particular times of interest on the response plot are
shown in Fig. 4(c) for comparison. Comparison of the video frames to the sensor
data is important for validating the sensor performance. The locations of the FBGs
have been highlighted since they are normally transparent.
At time t1, both sensors are reading the low Bragg wavelength indicating a
dry state. Looking at the first video frame this is indeed the case, as the slug

Fiber-Bragg Grating Sensor for Two-Phase Flow in Microchannels 11
has not yet reached FBG1. At time t2, FBG1 is starting to respond with an
increasing Bragg wavelength, indicating that it is entering into the wet state. The
video frame corresponding to t2 agrees with the data, showing the front of the
slug just reaching the edge of FBG1. A short time later, at t3, the FBG response
becomes saturated, indicating that it is fully covered by water. This is confirmed
in the corresponding video frame, which shows the slug covering FBG1. The same
correlation for wetting is seen for FBG2 at t5 and t6.
The wet to dry transition for FBG2, between times t8 and t9 shows an im-
mediate recovery as soon as the trailing edge of the slug reaches the edge of the
FBGs. This is an indication that there is no film of water left on the fiber behind
the slug, despite a difference in wetting characteristics between the PDMS and the
glass.
After validating the FBGs responses to the passing slug using visualization,
it was clear that the data could be used to reliably calculate the average velocity
of the slug as it passes over the sensor. The spacing between FBG1 and FBG2
(4.0 mm) was divided by the time interval between the leading edges of the re-
sponse curves of Fig. 4(b) , i.e. times t2 for FBG1 and t5 for FBG2. For this
slug, the average velocity was 3.0 cm/s. The slug length can then be computed by
multiplying the residence time on one FBG by the average velocity. The residence
time, at FBG2 for example, is taken to be t8-t5 = 0.2 s. With this, the size of
the passing slug is estimated to be 6.0 mm. Using the scale on the images, the
slug measures closer to 5.0 mm. The longer residence time at FBG2 compared to
FBG1, however, indicates the slug velocity is not constant as it passes over the
sensor, highlighting the limitation of this post-processing technique. The use of
a third grating could however overcome this limitation and yield more accurate
velocity and size date for accelerating and decelerating slugs.
For a more instantaneous measure of the slug velocity, the response of a single
FBG was also analyzed. The velocity of the front passing FBG1 can be measured
by dividing the FBG length by the time taken to cover it (t3-t2=0.03s). Using an

12 Nigel David et al.
FBG length of 0.8mm the velocity is 2.7 cm/s, and the size is estimated to be
4 mm. These values are in reasonable agreement with those calculated using the
spacing between two FBGs, indicating that a single FBG can be used to estimate
the speed and size of a slug passing through a microchannel. The can only be done,
however, if the exact length of the FBG is known.
FBG1 FBG2
t1
t2
t3
t4
t5
t6
t7
t8
t9
t10
t3 t4 t5 t8t7t6 t9 t10t2t1
4.0 mm
FBG1FBG2
9.8 9.9 10.0 10.1 10.2 10.31546.3
1546.4
1546.6
1550.0
1550.2
1550.4
Brag
g w
avel
engt
h (n
m)
Time (s)
0 2 4 6 8 10 12 14 16 18 20 22 241546.3
1546.4
1546.6
1550.0
1550.2
1550.41550.5
Brag
g w
avel
engt
h (n
m)
Time (s)
FBG1FBG2
a)
b) c)
Fig. 4 Results from sensor validation test in the slug flow regime. (a) Response of sensor topassing slugs of water flowing through microchannel. (b) Bragg wavelength shifts of FBG1 andFBG2 as a result of a single slug. (c) Frames from high speed camera corresponding to thetimes shown in the sensor data from plot (b). Locations of FBGs have been highlighted in theimages.
4.2 Droplet flow regime
Representative results from the passage of a single droplet over the sensor are
shown in Fig. 5. As with the slug results, the response data for the droplet corre-
lated well with the synchronized video images. The response curve of FBG1 has

Fiber-Bragg Grating Sensor for Two-Phase Flow in Microchannels 13
features that are not present in the response of FBG2. Upon closer analysis of
the high speed video, these features in the data can be attributed to the droplet
front’s shape changing as it passes over FBG1. This is likely due to a combination
of fluctuation from the forced air entering the open-top flow channel and imperfect
homogeneity of the surface.
Using the FBG spacing, and the time interval between t2 and t7 the average ve-
locity of the droplet shown in Fig. 5 is calculated to be 25 cm/s. It is clear, however,
from the response curves that the droplet speeds up between FBG1 and FBG2.
Using the response of only FBG2, the velocity is calculated to be 53.0 cm/s, more
than double the average velocity. With this, the size of the droplet is estimated to
be 2.3 mm. This is in good agreement with the video frame corresponding to t10.
t1 t2 t3 t4 t5 t6 t7 t8 t9 t10 t11 t1
t2
t3
t4
t5
t6
t7
t8
t9
t10
t11
FBG1 FBG2
4.0 mm
5.05 5.06 5.07 5.081546.3
1546.4
1546.6
1550.0
1550.2
1550.4
1550.6
Brag
g w
avel
engt
h (n
m)
Time (s)
FBG1FBG2
Fig. 5 (a) Sensor data from single fast droplet test. (b) Selected frames from the high speedvideo, corresponding to times shown in (a). Locations of FBGs have been highlighted in theimages.
5 Conclusions
The concept of a surface embedded FBG sensor for the measurement of two-
phase flow dynamics has been demonstrated and validated. It was shown that with

14 Nigel David et al.
minimal etching, FBGs written into a D-shaped fiber respond to the presence of
liquid water due to a change in the surrounding refractive index. Such a strong
response precludes the need for temperature compensation for a sensor design
based on this principle.
A sensor consisting of a D-fiber with two adjacent FBGs embedded into the
surface of a polymer was constructed. The polymer substrate with embedded sen-
sor was used as a wall in a microchannel. High speed digital video of the droplet
flow was captured synchronously with the sensor data acquisition. The FBGs ex-
hibited an on-off type response to the passage droplets, which correlated precisely
with liquid water flowing over the FBG locations. This correlation enabled the
measurement of droplet average velocity and size using only the sensor data. In
addition to the use of both FBG signals for the purpose of measuring droplet speed
and size, it was shown that for droplets larger than the FBG length, a single FBG
can be used to estimate the speed and size of a fast moving droplet.
The study presented here suggest that an evanescent field FBG sensor based
on this concept could be adapted for use in the flow-channel of a PEMFC to
investigate droplet and flooding phenomena. This sensing concept is not, however,
limited to fuel cells. It could be applied, for example, to microfluidic devices or to
the detection of condensation.
6 Acknowledgments
This research was funded through a Strategic Research grant from the Natural
Sciences and Engineering Research Council (NSERC) of Canada. The D-fiber used
for the sensors in this study was kindly provided by KVH industries Inc.
References
1. G. Hetsroni, A. Mosyak, Z.e.a. Segal, International Journal of Heat and Mass Transfer 45,
3275 (2002)
2. L. Zhang, J.M. Koo, L.e.a. Jiang, Journal of Microelectromechanical Systems 11, 12 (2002)

Fiber-Bragg Grating Sensor for Two-Phase Flow in Microchannels 15
3. A. Gunther, S. Khan, M. Thalman, F. Trachsel, K. Jensen, Lab Chip 4, 278 (2004)
4. D. Funfschilling, Y. Ma, H.Z. Li, Microfluidics and Nanofluidics 8, 467 (2010)
5. X. Zhu, P.C. Sui, N. Djilali, Microfluidics and Nanofluidics 4, 1613 (2008)
6. A.E. Bergles, S.G. Kandlikar, Journal of Heat Transfer 127, 101 (2005)
7. W.S. von Rohr Philipp Rudolf, International Journal of Multiphase Flow 32, 791 (2006)
8. P.S. Zhu, X., N. Djilali, Journal of Power Sources 181, 101 (2008)
9. G.R. B. Tibiri, F. J. do Nascimento, Experimental Thermal and Fluid Science 34, 463
(2010)
10. A. Bazylak, International Journal of Hydrogen Energy 34, 3845 (2009)
11. H. Li, Y. Tang, Z. Wang, Z. Shi, S. Wu, D. Song, J. Zhang, K. Faith, J. Zhang, H. Wang,
Z. Liu, R. Abouatallah, A. Mazza, Journal of Power Sources 178, 103 (2008)
12. M.B. F. Schembri, Microfluid Nanofluid 11, 189 (2011)
13. R.G. C. King, E. Walsh, Microfluid Nanofluid 3, 463 (2007)
14. D. Conteau, C. Bonnet, D. Funfschilling, M. Weber, S. Didierjean, F. Lapicque, Fuel Cells
4, 520 (2010)
15. N.A. David, P.M. Wild, J. Hu, N. Djilali, Journal of Power Sources 192, 376 (2009). DOI
10.1016/j.jpowsour.2009.03.021
16. N.A. David, P.M. Wild, J. Jensen, T. Navessin, N. Djilali, Journal of The Electrochemical
Society 157(8), B1173 (2010). DOI 10.1149/1.3436652
17. A. Iadicicco, A. Cusano, A. Cutolo, R. Bernini, M. Giordano, IEEE Photo 16, 1149 (2004)
18. K. Schroeder, W. Ecke, R. Willsch, Optics and Lasers in Engineering 47, 1018 (2009)
19. G. Meltz, S.J. Hewlett, J.D. Love, in Proceedings of SPIE Vol. 2836 Chemical, Biochem-
ical, and Environmental Fiber Sensors VIII, pp. 342-350 (1996)
20. T.C. Wu, N. Djilali, Submittted to the Journal of Power Sources