fi regulation of phytoplankton communities by physical i
TRANSCRIPT

Tournai of Marine Research, 4/, 539-556, 1983
f i :,
,Ii
Regulation of phytoplankton communities by physicalprocesses in upwelling ecosystems
by Walker O. Smith, 1 George W. Heburn,2,3 Richard T. Barber4
and James J. O'Brien2
ABSTRACTSinking rates of particles were superimposed on the x-z-t current field observed at 15S off the
coast of San Juan, Peru in March-May, 1977 to calculate particle trajectories in the upwellingcirculation. Vertical velocities were calculated by a modified variational objective analysistechnique using the measured onshore and longshore currents in conjunction with the physicalconstraint of mass continuity. The calculated vertical flow showed considerable temporal andspatial variability, with the mean vertical transport varying by two orders of magnitude over the16 km wide continental shelf. Changes in direction occurred rapidly (within 24 h) as has beenobserved for horizontal circulation in this region. The vertical velocity of water was much greaterthan the sinking rates of particles during the 52 day period, so that the net vertical transport ofparticles was controlled by the vertical velocity of the water. Reseeding of sinking particles fromthe surface offshore-flowing layer into the deeper onshore flow could not be demonstrated forthis period, which may explain why the measured biomass and primary productivity wereanomalously low in 1977. Vertical mixing greatly increased the possibility of reseeding bytransporting material downward into the onshore flow. We suggest that recirculation of particlesmay normally occur in the Peruvian upwelling system, but that the continuity probably involvesmovement in the longshore as well as the cross-shelf direction.
1. Introduction
Coastal upwelling is a process in which surface waters are displaced offshore by aone-sided horizontal divergence caused by the longshore winds and are replaced bycold, nutrient-rich subsurface waters. Upwelling regions are characterized by substan-tial advective movement of water in both the longshore and onshore/offshoredirections. The upwelling circulation also has significant components of temporalvariation which occur over short (hours), intermediate (days), long (seasonal) andinterannual time scales. Presently, it is uncertain to what degree communities utilizethe physical structure of an upwelling system to enhance their growth or stability
I. Botany Department and Graduate Program in Ecology, University of Tennessee. Knoxville. Tennes-see. 37996, U.S.A.
2. Department of Meteorology, Florida State University, Tallahassee, Florida, 32306, U.S.A.3. Present address: Naval Ocean Research and Development Activity, NSTL Station, Mississippi,
39259, U.s.A.4. Duke University Marine Laboratory, Beaufort, North Carolina. 28516, U.S.A.
539

540 Journal of Marine Research [41,3
(Margalef, 1979), or whether the communities simply "withstand" the energeticphysical conditions by adapting to the wide range of conditions that can occur.
Some populations and communities use the physical conditions of a particularhabitat for their benefit. Estuarine dinoflagellate blooms can be maintained in bothspace and time by migration between the two layers in a region with typical estuarinecirculation (Seliger et al.. 1970; Tyler and Seliger, 1978; Seliger et al.. 1981), andMesodinium rubrum. a migratory photosynthetic ciliate, has been shown to maintainitself on the continental shelf during periods of active upwelling by a similarmechanism (Barber and Smith, 1981). Zooplankton also migrate between layers ofwater whose direction of flow is opposite in order to regulate their position (Peterson etal.. 1979; Wroblewski, 1982), and Mathieson (1982) hypothesized that anchovetasimilarly utilize local currents to remain at one location. Use of currents by fishes andhigher trophic level invertebrates at various stages of their life cycle has also beenobserved (Cushing, 1976; Parrish et al.. 1981). It appears that most trophic levels havemembers which utilize the prevalent current patterns to increase their reproductivesuccess in a physically dynamic environment.
It has also been suggested that phytoplankton community composition is stronglyinfluenced by the prevalent circulation patterns in upwelling systems. Malone (1975)suggested that "the high levels of net plankton productivity reflect the selective effectsof circulation" and that small nanoplankton were selectively removed from upwellingareas by mass transport normal to the coast because of their low sinking rates.Migratory species also are selectively retained by utilizing the bilayered flow regime(Brink et al.. 1981; Barber and Smith, 1981). Therefore the size and composition ofphytoplankton in both surface and source waters can be directly controlled byadvective processes independent of biological (growth rates, grazing) processes.
The Peruvian upwelling region is a system in which changes in bottom topographyand longshore wind stress result in upwelling which is enhanced locally, producingvariations in water temperature, nutrients and plankton biomass alongshore as well asthe expected changes offshore (Brink et al.. 1981; Huntsman et al.. 1981; Smith et al..1981). Plume structures are commonly observed (Kelley et al.. 1975) which increase ordecrease in spatial extent through time depending on local wind stress, surface heatingand longshore current interaction with the bottom topography. The region at 15S haspersistent upwelling (Ryther et al., 1971) and has received considerable study duringthe past two decades. In 1977 a series of current meter arrays were deployed off thecoast, with a majority being morred at 15S (Brink et al.. 1978). The current meterswere spaced within the water column so that both surface, intermediate and bottomflow could be measured on the continental shelf. In addition, arrays were deployedperpendicular to the coast to resolve the horizontal variations in the upwellingcirculation. The resulting physical measurements provided a powerful data set withwhich to test the strength of the control of biological communities by physicalprocesses.

1983] 541Smith et al.: Physical control of phytoplankton communities
lOON
'\,
~
~"'~~~~~i'
~'\~~
--. . 1 ~~ ~-I::.
""9(;';-~\\: . -\ I
'"~
~,~ ""-..'"»'1
250.. .~ ,~
L-. ~~;~r;::::::'"'- "7P18"30'
Figure 1. The location of the current meters used to measure horizontal velocities in the studyarea. PS and PSS were surface arrays, whereas Agave (A), Mila (M), Ironwood (I), Lagarta(La), Lobivia (Lo), Euphorbia (E) and Parodia (P) were positioned below 20 m.
2. Materials and methods
The region studied was at 15S off the coast of San Juan, Peru (Fig. 1) for 52 daysfrom March-May, 1977. Five subsurface arrays of Aanderaa current meters (Agave,Ironwood, Lobivia, Lagarta and Mila, maintained by Dr. R. L. Smith, Oregon StateUniversity) and two additional arrays north and south of 15S (Euphorbia and Parodia)were moored for the entire period. Two surface arrays of V ACM current meters (PSand PSS) were also monitored (by Dr. D. Halpern, PMELjNOAA, Seattle) for thesame period. The surface and subsurface arrays at 15S were as close as possible to eachother but separated to prevent fouling. The data were low-pass filtered to removediurnal tidal and higher frequency fluctuations; the half power point was 46.6 h withthe half amplitude point at 40 h. A complete compendium of the data and methods ofanalysis is given in Brink et al. (1978).
The vertical velocity field was calculated by a variational calculus objective analysismethod using the horizontal current meter observations. This variational method
computes objectively adjusted values of both onshore velocities and longshore diver-gence through a cross-section such that the physical constraint of three dimensionalmass continuity for an incompressible fluid is satisfied, i.e.,
au av iJw - 0-+-+-ax ay az
\~j~,\k\~

[41,3Journal of Marine Research542
where u, v and ware the onshore, longshore and vertical velocity components in thex-y-z Cartesian coordinate system.
A modification of the variational formulation presented by O'Brien (1970) forcalculating vertical motions in the atmosphere was the basis for the calculation of thevertical velocity estimates used here. The general formulation of the problem followsthat of Sasaki (1958) and Stephens (1965). Let
a"e,as-
( ae, a2e;F1 e" &'"a7'
be a set of constraints for certain initial estimates ej. Also let e~ - e~(s), the ,oth
objectively modified estimate, and its derivatives be continuous in some region V andtake on prescribed values on the boundary of V.
We can then define a difference functional
where r j are Lagrangian multipliers and K; are Gauss precision moduli. The latter arerelated to the variance of the estimates (Whittaker and Robinson, 1944) by
~ 220"1
Now, the objectively modified values can be computed by requiring the first variationof E to vanish.
For the study region estimates of the cross-shelf velocity components, were availablefrom the current meter arrays at Agave/PSS, Mila/PS, and Ironwood (see Fig. 1).These arrays provided fairly high resolution in the vertical from near surface to nearbottom. Furthermore, these arrays were all within the upwelling zone as defined by theinternal Rossby radius of deformation (Hurlburt and Thompson, 1973). Thus, theareal coverage over the continental shelf in the plane normal to the coast wasconsidered to be very good. The longshore divergence was initially estimated from thedifference in the longshore velocity component between Mila and Parodia (Fig. 1). Thevertical resolution at Parodia and the horizontal spacing of these arrays made theestimates of the longshore divergence much less precise and thus the weighting factors(i.e. the Gauss precision moduli) were adjusted to reflect this uncertainty in theaccuracy of these initial estimates. Specifically, the weighting factor for the longshoredivergence was related to the maximum variance (O"max2) of the observations where asthe cross-shelf estimates were related to the individual variances (O"j2) of the observa-
tions.In the present context the estimates ej are Uj (cross-shelf velocity component), cJVi/cJy
(longshore divergence) and Wi (vertical velocity component). Since there were nomeasured vertical velocities, the initial estimates of Wi were set to zero. The boundary

1983] Smith et al.: Physical control of phytoplankton communities 543
conditions used were that u ~ 0 at the coast, w ~ 0 at the sea surface and no flownormal to the bottom. With these conditions and assumptions and using the physicalconstraints of three-dimensional mass continuity, the difference functional becomes
~)) dV( ~v' , U 1 ,
E UI, -ay-'~/' >'1
.,.
The vertical velocities were calculated by discretizing the functional, setting the firstvariation of the functional to zero and then solving the resultant set of linear equationsnumerically. One criterion for accepting the calculated vertical velocity estimates wasthat the adjusted cross-shelf velocity components could not vary more than onestandard deviation from its initial value.
Depths of mixed layers were determined from the temperature records on thesurface current meter arrays PS and PSS (Brink, 1979). Data were filtered with a halfpower point of two hours and decimated at hourly intervals. If the temperaturerecorded at a current meter agreed within 0.02°C with the shallowest instrument, thenthe mixed layer was assumed to extend at least to the depth of,that current meter. If notemperature agreed with the shallowest to within 0.02°C, the depth of the mixed layerwas assumed to be zero. Although density change would be a more accurate estimatorof mixed layer depth, salinity-induced density changes are rare because salinity isnearly constant in the upper 25 m (Huyer et al.. 1978). Therefore temperature changesprovided an accurate time series of mixed layer depths. The d T criterion used to definethe mixed layer depth is arbitrary, but the patterns of mixing obtained are notsubstantially different when greater temperature differences are used (Brink, 1979).
Trajectories of particles over the continental shelf were computed by adding thevertical motion of a particle to the U-, V-, and w-velocities of the water and computingthe distances moved in one-h intervals. Boundaries for the calculations were the shore,the bottom and 16 km offshore; the bathymetry is that used in numerical models forthis region (e.g., Preller and O'Brien, 1980). The result is the calculated trajectory of aparticle through time as it would have been influenced by the actual movement ofwater in 1977. All trajectories had the observed vertical mixing depths superimposedon them, so that if a particle was advected into the mixed layer its position was reset tothe bottom of the mixed layer. The rationale for this step was to maximize thepossibility of entrainment of a sub-population of phytoplankton by minimizing thedistance through which particles must sink prior to entering the onshore flow. Biomassdeterminations within the upper 50 m showed the homogeneity of phytoplanktondistribution within the mixed layer (Barber et al.. 1978). Molecular diffusive effectswere not included because the diffusive time scale is large when compared to theadvective time scale and would be important only in the viscous boundary layer, whichis much narrower than the upwelling zone (Hurlburt and Thompson, 1973).

[4'l~ 3Journal of Marine Research544
Table I. Mean vertical velocities in m d-motion toward the surface.
across the continental shelf. Positive values represent
Distance from shore (km)
Depth
(m)0
102030405060
120.000.971.416.038.95
11.8612.96
140.000.220.174.888.85
12.8115.52
160.00
-0.52-1.07
3.738.74
13.7511.09
20.004.968.533.56
-0.48-4.53-3.89
40.004.136.985.162.730.300.02
80.002.453.898.349.119.991.83
100.001.712.647.199.05
10.9210.40
00.00
60.003.295.436.755.945.153.92
3. ResultsThe calculated vertical velocities in the upper 60 m showed considerable cross-shelf
variation (Table 1) as did the measured u- and v-components of flow (Brink et al.,1978). A time series of the estimated vertical velocities at 20 m depth, 2 km from theshore (Fig. 3 in Brink et al., 1980) showed the calculated estimates to be dynamicallyconsistent with the longshore wind stress, longshore and cross-shelf velocity compo-nents, and the sea-surface temperatures. With the exception of the upper 20 m near theshelf break and the lower 20 m inshore, the mean vertical flow for the entirecontinental shelf was positive (i.e., upwelling occurred). The general trend reflected inTable 1 is that of a classical upwelling system: substantial vertical flux inshore and atintermediate depths, and little vertical displacement in surface waters as they move
offshore in the Ekman layer.The mean vertical flow is, however, not truly representative of the instantaneous
water motion off Peru. Substantial variation occurs over the entire continental shelf(Table 2). All positions in the upper 60 m at some time experienced negative verticaltransport (downward flow), and similarly, all experienced at some time substantialupward transport. Changes between the two extremes also occurred quite rapidly andmay be associated with the passage of coastal trapped waves. An example of such achange occurred on March 25 (Fig. 2) following the passage of a wave trough aroundMarch 23 (Brink et al., 1981). At hour 0 a strong reversal was occurring; i.e.,onshore-flowing surface water and descending water near the coast. Maximumw-velocities were -44.0 m d-J at 2 kIn offshore and a depth of 50 m. By hour 8 someoffshore and upward flow had begun. By hour 16 the offshore and upward flow haddeepened and strengthened, and by hour 24 strong positive vertical transport occurredthroughout the upper 60 m from the coast to 14 kIn offshore. Horizontal flow alsoreturned to a typical bilayered pattern by this time. It should be noted thatequatorward (i.e., upwelling favorable) winds occurred throughout this entire period aswell as the two weeks prior to March 25 (Brink et al., 1981). Similar abrupt reversalsof vertical and horizontal flow occurred throughout the 52-day period and can berelated to similar wave events. Heburn (1980) used a three-dimensional numerical~

1983]S
mith et al.: P
hysical control of phytoplankton comm
unities
-08,5~u';:'
'Su>~(,)°;:'...u>8=8'><~e'0c:~e=e'2~NU:0~ :U.c:on
--;cuc.-c8u.c:on~()~
E.:-4'-'U...0~..,e0.:8c~~Q
.=~e
Q'-" Q ~ .. 10 ~ <
:)- N- ... -0-
Q t 8
8 .
.00 t
88
..0
0 f 8
8 .
.00 t
88
..0
0 t g
g .
.QQ 188
..0
0
188
..0
0 t 8
8 .
.QQ I gg
..0
0
0- t N
o-~""":0-N
-I t ~
'" .
0\""-e-I t -c-~r-:~-1 f ~0\
.~
-ot"II f ~N
.
~ N t -on~-: NI t -~
~- r Q\
"C!
~o
N
0N t '"
r-~Q
;NN
f"INI t
~
~~.~
NN
- f ..,.
-\0'""':~\0-I t,...,,~--- t --~~
..N
~-I t
r-.~
-.;.r-.\0I t
~'O
~O
O;t"I
t"II f ~
.~~-
on
0..., f ""
"'-':"'",-=
""""I t
--.tN~
.
.Q\
Q\N
- t ~
:8 .
.0"1O
"IM-I t
1"\I"\~1"\
..c--
NN-I t
--.N0\
..N
O\NI t
0-v\v\"1-0r-- t
-
\C"'!
-on
vi-I t«"48:1""",r--"-
~ t t"I
NO
N
..-
r--t"It"II t M
~
N
..V
'IN
NN f
0on",!0..o\N- t
0-O
~-:-0O
MMI t
0-~
...'0;.O
N-I t ~
.
0-.",
NI t
on
S;~.\0
OINI t
~M
~Q
;~~
M
~ t N
""-0:~..-I t
~O
~\O
N,oNN t
v\v\'O
;~
.,oNNI t
'-t"
\0-:'C
!oO
\r')N
I t f"I
8~.0ID
f"I-I t
'"
f")"";
t"'!."'f")I t
Q\
-Mr--r;.;,oM-I f .N
~t"I.f'i.t"II
0\Q t ..,
:2'C!
.~'C
-M f~~
~\C
~~
- t t'\
o.N.-
.'"':-~
NN f
0\00
..0\
~NNI. t
l""-oriO
;~
~ t 0
0\-0..0\o.-I i
'"
~-:
\00;0\",onMIt ..--11'\0;0\C
~-I
545

Journal of Marine Research [41,3546
DISTANCE OFFSHORE (km)!.2 8 4 :;9'"
16 12 8
. I
012 8
"20~
"V...x
40-3
120
It
It.
It
IIIt
It. 't.L~ ~I~
I leot 5m/dIt. I.
Figure 2. Changes in the u- and w-components (left and right panel, respectively) of flow at 6-hintervals on March 25, 1977. Actual bathymetry is shown. Each full arrow equals 5 cm s -1 for
the horizontal velocity and 5 m d-' for the vertical velocity.

1983] 547Smith et al.: Physical control of phytoplankton communities
0IT!"V-t:x
~
Figure 3. Hypothetical cr~-shelf reseeding mechanism. Phytoplankton (solid circles) areadvected offshore in the surface layer but sink into the onshore-flowing layer. They then aremoved inshore and upwelled to the surface where a new bloom is initiated. The dotted linerepresents the observed mean depth of zero onshore / offshore motion.
model with a parameterization of the longshore currents to demonstrate the influenceof coastal trapped waves on the vertical motion of the pycnocline in the Peruvianupwelling system. Figures 17 and 18 in Heburn (1980) showed good agreementbetween the estimated vertical velocities derived by the variational technique and thevertical motions predicted by the numerical model. A comparison of the estimates fromthis method and those derived from drogue experiments (Fig. 4 in Stevenson et a/.,1980) also showed good qualitative and quantitative agreement. These comparisonsindicate that the calculated vertical velocities appear to be reasonable estimates of theflow during this period.
Trajectory analyses were computed to test the hypothesis that phytoplankton sinkfrom the offshore-flowing Ekman layer, enter the onshore-flowing waters and arecarried to the surface by vertical transport. A hypothetical illustration of this process isshown in Figure 3. This mechanism has been suggested as a means of "reseeding"newly upwelled waters with certain species of phytoplankton (Malone, 1975; Walsh eta/., 1980; Brink et a/., 1981) which increases the relative proportion of large, rapidlysinking species independent of growth rates or grazing pressures. However, theoffshore-flowing surface layer deepens and slows as the distance offshore increases(Brink et a/., 1978), which effectively reduces the spatial extent over which such areseeding might occur.
For the entire 52-day period we were unable to demonstrate a single occurrence of aparticle moving offshore (beyond 8 km from the coast), sinking from the surfaceEkman layer, entering the onshore flow, and finally being upwelled to the surface near

Journal of Marine Research548 [41,3
01 STANCE OFFSHORE (km)816 12 4 0
Start.
110~ ~, 0
r'1"U-t~..-
!
.~~
~o.-o..~~
120Symbol~
6a
Sinking Rate
1.0 mId2.0 mId3.0 mId
-130
Figure 4. Trajectory of particles with different sinking rates beginning March 22. 1977. Theparticles move onshore. are upwelled toward the surface. and then are advected off thecontinental shelf. Arrows indicate that the population was completely mixed to the positionindicate<i. Each symbOl represents a 6-h time interval.
the coast. Although complete "loops" were not observed, it was observed that particlesdid enter the onshore-flowing water, were transported upward into the surface Ekmanlayer, and advected offshore and ultimately off the continental shelf. One example ofthis type of trajectory occurred on March 22 (Fig. 4). This pattern illustrates theeffects of currents and their variability on the movement of planktonic organismswithin the defined ecosystem boundaries. But the total absence of reseeding andrelative infrequency of the pattern illustrated in Figure 4 emphasizes the lack oftwo-dimensional biological continuity during this period.
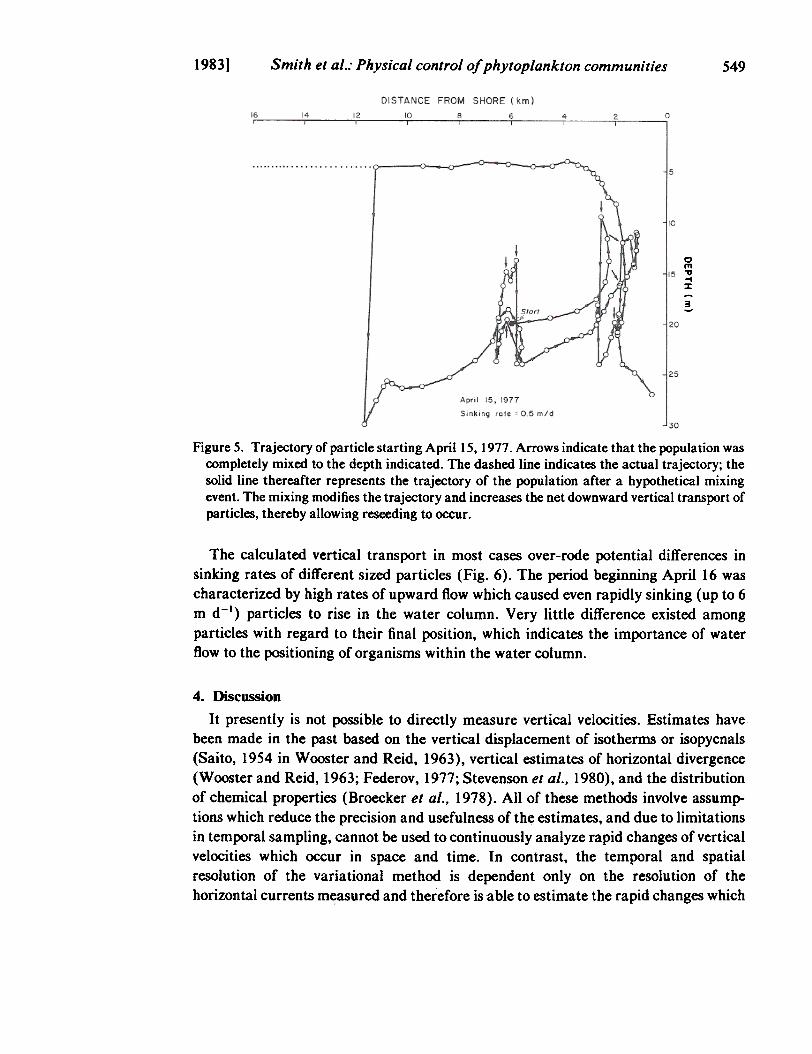
One potential mechanism to produce particle reseeding is by vertical mixing eventswhich "inject" organisms into the onshore-flowing waters from the surface layer,thereby completing the cycle. This potential can be seen in the trajectories of particlesfor April 15 (Fig. 5). The particle initially was at the bottom of the mixed layer (20 m)at 6 km offshore. It is advected onshore, is mixed to the bottom of the mixed layertwice, and after approximately 150 h is advected into the offshore-flowing surfacelayer. It's calculated trajectory was off the continental shelf; however, if a mixing eventhad occurred 11 km offshore, the particle would have then entered the onshore-flowagain and ultimately returned inshore. The potential for increasing net verticaltransport of organisms by mixing events into a layer with opposite flow may be largeand the effect on the entrainment process may be substantial.
."0. ..~-6 F '0.,.
If 00-0.--c, 6 4 0-~ 6._.6..0.
""'
1983] Smith et al.: Physical control of phytoplankton communities 549
0111"V-I%
!
Figure 5. Trajectory of particle starting April 15, 1977. Arrows indicate that the population wascompletely mixed to the depth indicated. The dashed line indicates the actual trajectory; thesolid line thereafter represents the trajectory of the population after a hypothetical mixingevent. The mixing modifies the trajectory and increases the net downward vertical transport ofparticles, thereby allowing reseeding to occur.
The calculated vertical transport in most cases over-rode potential differences insinking rates of different sized particles (Fig. 6). The period beginning April 16 wascharacterized by high rates of upward flow which caused even rapidly sinking (up to 6m d-1) particles to rise in the water column. Very little difference existed amongparticles with regard to their final position, which indicates the importance of waterflow to the positioning of organisms within the water column.
4. Discussion
It presently is not possible to directly measure vertical velocities. Estimates havebeen made in the past based on the vertical displacement of isotherms or isopycnals(Saito, 1954 in Wooster and Reid, 1963), vertical estimates of horizontal divergence(Wooster and Reid, 1963; Federov, 1977; Stevenson et aJ., 1980), and the distributionof chemical properties (Broecker et aJ., 1978). All of these methods involve assump-tions which reduce the precision and usefulness of the estimates, and due to limitationsin temporal sampling, cannot be used to continuously analyze rapid changes of verticalvelocities which occur in space and time. In contrast, the temporal and spatialresolution of the variational method is dependent only on the resolution of thehorizontal currents measured and therefore is able to estimate the rapid changes which

550 Journal of Marine Research [41,3
Figure 6. The effect of the vertical velocity of the water on the net vertical transport rates ofparticles with different sinking rates. All particles were initially at 20 m. Little spatialseparation among particles with different sinking rates occurred.
occur in an upwelling region. Although the 52-day mean vertical velocities (Table 1)are not different than might be expected in an upwelling system, large variationsoccurred in the upward flux of waters both in space and time (Table 2). The maximumpositive displacement rate in the upper 50 m was -44.4 m d-1 (-5.1 X 10⁻² cm S-I;negative velocities represent onshore flow), which is considerably greater than the rategenerally considered to occur in upwelling regions (e.g., 1 m d-' or 10-3 cm S-I;Wooster, 1981). The mean for the entire shelf (upper 60 m) was 5.65 m d-1(6.53 x 10⁻³ cm S-I). However, it must be remembered that the region at 155 exhibitspersistent. enhanced upwelling, so that vertical transport in this region is probablylarger than the mean w-velocity for the entire Peru coast. In view of this, the calculatedvertical fluxes appear to be reasonable estimates of the actual vertical transport whichoccurred during this period.
Although it has been hypothesized that the bilayered circulation pattern ofupwelling regions might act as a "reseeding" mechanism for plankton populations(Brink et al., 1981), we were unable to show a single occurrence during the 52-dayperiod tested. This generally resulted from the sinking rates of particles being muchsmaller than the vertical transport. Therefore a particle inshore was generally advectedtoward the surface and carried offshore in the surface Ekman layer. At offshorelocations the upward transport was less and the particles sank in the water column butbecause the shear zone between the opposite-flowing layers was deeper offshore (Brink

1983] 551Smith et al.: Physical control of phytoplankton communities
et a/., 1978), the particles did not sink fast enough to enter the onshore-flowing waters,and the hypothesized reseeding mechanism did not function. We do not know how thecurrents of other time periods compare to this 52-day period in 1977, but there is someevidence to indicate that in April-May, 1976 the shear layer was much shallower (ca.10 m, Brink et a/., 1980). It is also interesting to note that the surface biology in 1976was dominated by massive blooms of the migratory dinoflagellate Gymnodiniumsp/endens (Dugdale et a/., 1977). HuntSman et a/. (1981) concluded that the increasein population size of the dinoflagellate was due to advection from offshore and notsolely in situ growth. We suggest that coupled with advection and growth that thedinoflagellates were concentrated by utilizing the near-surface bilayered flow regime(i.e., periodically migrating into onshore-flowing waters), thereby maintaining andconcentrating the population on the shelf. Such a concentration could only occur if thedinoflagellates were able to migrate through the shear zone into onshore-flowingwaters. Because migration rates of up to 1 m h-1 have been observed for dinoflagellates(Eppley et al., 1968; Heaney and Eppley, 1981), it appears feasible that such aconcentration mechanism was operative during 1976.
The reseeding hypothesis is highly dependent on the magnitude of sinking rates.Early work (see Smayda, 1970) indicated that sinking rates of phytoplankton werehighly variable and strongly dependent not only on cell size but on physiological state.More recent work using sensitive isotopic techniques has shown that in both culturesand natural populations phytoplankton sink very slowly, usually less than 2 m d-1(Bienfang, 1979, 1981). In this study a wide range of sinking rates were tested rangingfrom 0.0 to 24.0 m d-', but no sinking rates resulted in reseeding. It should also benoted that the tested sinking rates were held constant throughout. It is possible thatelevated sinking rates occurred offshore as a result of nutrient depletion and a changein physiological state, thereby allowing cells to sink more rapidly and enter theonshore-flowing waters. However, we do not believe this occurred because nutrientconditions were nearly always near saturating levels over the entire shelf, so thatnutrient depletion would have been rare. Furthermore, because nitrate uptake isgenerally a function of light uptake (McCarthy, 1981), it is not clear that sinking rateswould be reduced once cells entered the onshore-flowing, nutrient-rich waters. Becausethe depth of zero flow averaged 24 m at 12 kin offshore (Brink et a/., 1978), cells wouldbe experiencing very low light levels (Barber et al., 1978) which would reduce nutrientuptake. If sinking rates were not rapidly and markedly reduced, the particles wouldsoon settle to the sediment surface.
There exists a potential for vertical mixing events to act as a mechanism wherebysurface plankton are mixed into shoreward-flowing water, thus increasing the netvertical transport of particles and increasing the probability of entrainment. Mixedlayer depths varied both spatially and temporally off Peru which resulted in aheterogeneous environment for the biological communities (Fig. 7). Although largediurnal and event-scale variations occur (Brink, 1979), the average mixed layer depthat PSS (6 kin offshore) was 5.58 m and was significantly greater than that at PS (12

_zoerI-
IS
Q.
1&1
0~
12
~..J .
01&1
Xi 4-
552
Figure 7. T
he temporal variations in m
ixed layer depths at 6 (PS
S) and 12 (P
S) km
offshore.
...
Journal of Marine R
esearch[41,3
kin offshore)
where the m
ean mixed
layer w
as 3.75 m
(p < .001; t-test).
This
difference occurred even though the maxim
um possible m
ixed layer depth we could
measure at P
SS
was 16 kin due to the vertical arrangem
ent of sensors. The mixed layer
depths at the
two
locations w
ere also significantly correlated
in tim
e (r
~
.80,
p < .001), w
hich implies that sim
ilar forces w
ere controlling both. T
he alongshorecom
ponent of winds w
as slightly higher at P
SS
(Brink
et al., 1978), so that the
difference in mixed layer depth could sim
ply be the result of greater w
ind stressinshore. C
ross-shelf variations in mixed layer depth also have biological im
plications.F
or example, shallow
offshore mixed
layers reduce the potential for
substantialincreases in the dow
nward flux of particles; conversely, relatively deep m
ixed layersinshore suggest that the dow
nward m
ovement of populations m
ay be occurring in spiteof the large positive vertical transport of the w
ater. We observed num
erous occasions inw
hich particles
move back and forth
within
the inshore region (8 kIn), but
thehypothesized reseeding ~
ttern (F
ig. 3) was obscured by repeated vertical m
ixing. Ifreseeding w
ere occurring within the inner shelf region, it w
ould further emphasize the
importance
of m
ixing as a
mechanism
to
increase downw
ard vertical
flux of

1983] 553Smith et al.: Physical control of phytoplankton communities
phytoplankton as well as the importance of the w-velocities of the water and theinsignificant contribution of passive sinking to the vertical positioning of phytoplank-ton.
Phytoplankton biomass and productivity were anomolously low during 1977, eventhough nutrient concentrations and growth rates were high over the entire shelf(Barber et al., 1978). We suggest that the major reason for the low productivity andbiomass was that the newly upwelled waters had reduced levels of phytoplanktonbiomass due to a disruption in the reseeding mechanism. The causes of such adisruption are uncertain, although Brink et al. (1981) suggested that one potentialmechanism might be coastal trapped waves, and Heburn (1980) showed that coastaltrapped waves play an important part in the Peruvian upwelling dynamics. Unfortu-nately it is impossible to test the importance of this and other potential disruptionswithout data to test the occurrence of reseeding in "normal" years, but reseeding hasbeen suggested as an important mechanism for controlling the size of phytoplankton inupwelling systems (Malone, 1975). Further work is needed to demonstrate the positiverelationship between recirculation and phytoplankton cell size.
Although much effort, both observational and experimental, has been placed on theeffects and interactions of nutrients (e.g., Parsons and Takahashi, 1973; Tilman, 1977)and grazing (e.g., Frost, 1972; Eppley et al., 1978) on phytoplankton communitystructure, our results indicate that the advective processes in upwelling systems are thedominant forces controlling the biomass and potentially the composition of phyto-plankton communities. These effects occurred rapidly and over-rode any bioticinteractions which were present. In systems where energetic physical processes occur(e.g. coastal regions, polar seas), it is imperative that a thorough appreciation of thephysical forces be determined in order to correctly interpret the biological processes ofthe ecosystem.
Acknowledgments. This research is a contribution of the Coastal Upwelling EcosystemAnalysis Program (Grant Number OCE 75-23722, OCE-7800611 and ATM-7920485). Drs.David Halpern and Robert Smith kindly provided the current meter data used in the circulationmodel, and Dr. Ken Brink provided the temperature data and additional constructive criticism.Ms. Beth Walker patiently typed the various drafts of the manuscript.
REFERENCESBarber, R. T., S. A. Huntsman, J. E. Kogelshatz, W. O. Smith, B. H. Jones and J. C. Paul. 1978.
Carbon, chlorophyll and light extinction from JOINT-II 1976 and 1977. CUEA Data Rpt.,49,476 pp.
Barber, R. T. and R. L. Smith. 1981. Coastal upwelling ecosystems, in Analysis of MarineEcosystems, A. R. Longhurst, ed., Academic Press, New York, 31-68.
Barber, R. T. and W. O. Smith, Jr. 1981. The role of circulation, sinking and vertical migrationin physical sorting of phytoplankton in the upwelling center at 15S, in Coastal Upwelling,F. A. Richards, ed., American Geophysical Union, Washington D.C., 366-371.
Bienfang, P. K. 1979. A new phytoplankton sinking rate method suitable for field use. Deep-SeaRes., 26. 719-729.
554 Journal of Marine Research [41,3
- 1981. Sinking rates of heterogeneous. temperate phytoplankton populations. J. Plankton
Res., 3. 235-253.Brink, K. H. 1979. Diurnal behavior of the mid-shelf surface mixed layer near 15S. CUEA
Newsletter, 8. 20-31.Brink, K. H.. D. Halpern and R. L. Smith. 1980. Circulation in the Peruvian upwelling system
near 15S. J. Geophys. Res., 85.4036-4048.Brink, K. H., B. H. Jones, J. C. van Leer, C. N. Mooers, D. W. Stuart. M. R. Stevenson, R. C.
Dugdale and G. W. Heburn. 1981. Physical and biological structure and variability in anupwelling center off Peru near 15S during March. 1977, in Coastal Upwelling, F. A.Richards, ed., American Geophysical Union, Washington, D.C., 473-495.
Brink, K. H., R. L. Smith and D. Halpern. 1978. A compendium of time series measurementsfrom moored instrumentation during the MAM phase of JOINT-II. CUEA Tech. Rpt., 45, 72
pp.Broecker, W; S., T. H. Teng and M. Stuiver. 1978. An estimate of the upwelling rate in the
equatorial Atlantic based on the distribution of bomb radiocarbon. J. Geophys. Res.. 83.6179-6186.
Cushing, D. H. 1976. Marine Ecology and Fisheries. Cambridge Univ. Press, Cambridge, 278pp.
Dugdale, R. C., J. J. Goering, R. T. Barber, R. L. Smith and T. T. Packard. 1977.Denitrification and hydrogen sulfide in the Peru upwelling region during 1976. Deep-SeaRes., 24, 601-608.
Eppley, R. W., O. Holm-Hansen and J. D. H. Strickland. 1968. Some observations on thevertical migration of dinoflagellates. J. Phycol., 4. 333-340.
Eppley, R. W., P. Koeller and G. T. Wallace. 1978. Stirring influences the phytoplanktonspecies composition within enclosed columns of seawater. J. Exp. Mar. Bioi. Ecol., 32.219-239.
Federov, K. N. 1977. Vertical velocity in the equatorial upwelling. Pol. Arch. Hydrobiol.. 24.51-57.
Frost, B. W. 1972. Effects of size and concentration of food particles on the feeding behavior ofthe marine planktonic copepod Calanuspacificus. Limnol. Oceanogr., 17. 805-815.
Heaney, S. I. and R. W. Eppley. 1981. Light. temperature and nitrogen as interacting factorsaffecting diel vertical migrations of dinoflagellates in culture. J. Plankton Res., 3.331-344.
Heburn, G. W. 1980. A numerical model of coastal upwelling off Peru including mixed layerdynamics. Ph.D. dissertation, Florida State University, 130 pp.
Huntsman, S. A., K. H. Brink, R. T. Barber and D. Blasco. 1981. The role of circulation andstability in controlling the relative abundance of dinoflagellates and diatoms over the P,erushelf, in Coastal Upwelling, F. A. Richards, ed., American Geophysical Union, Washington,D.C., 357-365.
Hurlburt, H. E. and J. D. Thompson. 1973. Coastal upwelling on a p:'plane. J. Phys. Oceanogr.,3. 16-32.
Huyer. A., W. E. Gilbert, R. Schramm and D. Barstow. 1978. CTD observations off the coast ofPeru. CUEA Data Rpt.. 55. 409 pp.
Kelley, J. C., T. E. Whitledge and R. C. Dugdale. 1975. Results of sea surface mapping in thePeru upwelling system. Limnol. Oceanogr., 20. 784-794.
Malone, T. C. 1975. Environmental control of phytoplankton cell size. Limnol. Oceanogr.. 20.495.
Margalef, R. 1979. Life-forms of phytoplankton as survival alternatives in an unstableenvironment. Oceanol. Acta. I. 493-509.

1983] Smith et al.: Physical control of phytoplankton communities 555
Mathieson, O. A. 1982. Adaptation of the anchoveta (Engraulis ringens J.) to the Peruvianupwelling system, in Bioproductivity of Upwelling Ecosystems, M. Vinogradov and R. T.Barber, eds., Elsevier, New York. (in press).
McCarthy, J. J. 1981. Uptake of major nutrients by estuarine plants, in Estuaries and Nutrients,B. J. Neilson and L. E. Cronin, cds., Humana Press, Clifton, New Jersey, 139-163.
O'Brien, J. J. 1970. Alternative solution to the classical vertical velocity problem. J. Appl.Meteor., 9. 197-203.
Parrish, R. H., C. S. Nelson and A. Bakun. 1981. Transport mechanisPls and reproductivesuccess of fishes in the California current. BioI. Oceanogr., 1. 175-203.
Parsons, T. R. and M. Takahashi. 1973. Environmental control of cell size. Limnol. Oceanogr.,18.511-515.
Peterson, W. T., C. B. Miller and A. Hutchinson. 1979. Zonation and maintenance of cope podpopulations in the Oregon upwelling zone. Deep-Sea Res., 26A, 467-494.
Preller, R., and J. J. O'Brien. 1980. The influence of bottom topography on upwelling off Peru. J.Phys. Oceanogr., 10. 1377-1398.
Ryther, J. H., D. Menzel, E. M. Hulbert. C. J. Lorenzen and N. Corwin. 1971. The productionand utilization of organic matter in the Peru coastal current. Invest. Pesq.. 35. 43-59.
Sasaki, Y. 1958. An objective analysis based on variational method. J. Meteor. Soc. Japan, 36.77-88.
Seliger, H. H., J. H. Carpenter, M. Loftus and W. D. McElroy. 1970. Mechanisms for theaccumulation of high concentrations of dinoflagellates in a bioluminescent bay. Limnol.Oceanogr,. 15. 234-245.
Seliger, H. H., K. R. McKinley, W. H. Biggley, R. B. Rivkin and K. Aspden. 1981.Phytoplankton patchiness and frontal regions. Mar. Bioi.. 61. 119-131.
Smayda, T. J. 1970. The suspension and sinking of phytoplankton in the sea. Oceanogr. Mar.Bioi. Ann. Rev., 8.353-414.
Smith, S. L., K. H. Brink, H. Santander, T. J. Cowles and A. Huyer. 1981. The effect ofadvection on variations in zooplankton at a single location near Cabo Nazen. Peru, in CoastalUpwelling, F. A. Richards, ed.. American Geophysical Union, Washington. D. C., 400-410.
Smith, W.O., Jr. and R. T. Barber. 1979. A carbon budget for the autotrophic ciliate.Mesodinium rubrum. J. Phycol..15. 27-33.
Stephens. J. J. 1965. A variational approach to numerical weather analysis and prediction. Rept.No.3, Atmos. Sci. Group, The University of Texas, Austin, 243 pp.
Stevenson, M. R., D. W. Stuart and G. W. Heburn. 1980. Short-term variations observed in thecirculation, heat content, and surface mixed layer of an upwelling plume off Cabo Niazca,Peru, in Coastal Upwelling, F. A. Richards. ed., American Geophysical Union, Washington,D. C., 125-133.
Tilman, D. 1977. Resource competition between planktonic algae: an experimental andtheoretical approach. Ecology, 58.338-348.
Tyler. M. A. and H. H. Seliger. 1978. Annuafsubsurface transport ofa red tide dinoflagellate toits bloom area: water circulation patterns and organism distributions in Chesapeake Bay.Limnol. Oceanogr., 23. 227-246.
Walsh, J. J., T. E. Whitledge, W. E. Esias, R. L. Smith. S. A. Huntsman. H. Santander andB. R. de Mendiola. 1980. The spawning habitat of the Peruvian anchovy, Engraulins ringens.Deep-Sea Res., 27 A. 1-27.
Whittaker, E. and G. Robinson. 1944. The Calculus of Observations. London, Blackie and Son,Ltd., 397 pp.

556 Journal of Marine Research [41, 3
.It
Wooster, W. S. 1981. An upwelling mythology, in Coastal Upwelling, F. A. Richards, ed.,American Geophysical Union, Washington, D.C., 1-3.
Wooster, W. S. and J. L. Reid, Jr. 1963. Eastern boundary currents, in The Sea, M. N. Hill, ed.,John Wiley and Sons, New York. Yolo 2, 253-280.
Wroblewski, J. S. 1982. Interaction of currents and vertical migration in maintaining Calanasmarshallae in the Oregon upwelling zone-a simulation. Deep-Sea Res., 29. 665-686.
t~
{,~
Received: 31 August, 1982; revised: 22 March, 1983.