fft in california: evaluation outcomes cricket mitchell, phd cimh consultant april 3, 2008
TRANSCRIPT
FFT in California: Evaluation Outcomes
Cricket Mitchell, PhD
CIMH Consultant
April 3, 2008
Overview
• FFT in California• Youth Referred for FFT• Youth Who Never Began• Youth Who Are Currently in FFT• Youth Who Dropped Out of FFT• Youth Who Completed FFT• Comparisons Between Youth Who Dropped
Out of and Youth Who Completed FFT• Process and Outcome Information for Youth
Who Completed FFT

FFT in California
• 2695 youth referred for FFT as of January 2008
• 28 CiMH Development Team FFT sites established to date– 4 cohorts– Sites in varying stages of training and
consultation
• 167 therapists trained to date– Range of 1-87 FFT clients each

FFT in California
• Clinical Services System (CSS)– Currently the only source of all CiMH FFT Development Team
data
• Strengths– Important clinical tool specific to FFT model– Tracks data at multiple levels
• Descriptives• Process• Outcomes
• Limitations– Hundreds of therapists entering data; increases potential for
error– Data owned and managed by FFT, Inc.

2695 Youth Referred for FFT
• 396 (14.7%) Never Began or Have Not Yet Begun
• 2299 (85.3%) FFT Participants– 687 (29.9% of participants) currently in process– 548 (23.8% of participants) dropped out of FFT– 703 (30.6% of participants) completed all phases of
FFT– 361 (15.7% of participants) status cannot be
determined based on available data

Never Began or Have Not Yet Begun
• 14.7% (n=396) of all youth referred for FFT
• 9.7% (n=260) of all youth referred for FFT have a therapist-documented “Never Began” reason– 52% declined services, never began– 32% made appointment, client never
attended– 16% never contacted

FFT Participants
• 85.3% (n=2229) of all youth referred for FFT• Status defined by available CSS data
– Dropped Out of FFT• A therapist-identified dropout reason OR a therapist-
identified never began reason with at least 1 session
– Completed FFT• No therapist-identified dropout or never began reason, at
least 1 session, AND any family member- or therapist-completed outcome indicator
– Currently in Process• No therapist-identified dropout or never began reason, at
least 1 session, AND no family member- or therapist-completed outcome indicator

FFT Participants
• Phase defined by available CSS data– Early
• One or more sessions in Engagement & Motivation AND no sessions in Behavior Change or Generalization
– Mid• One or more sessions in Behavior Change AND
no sessions in Generalization
– Late• One or more sessions in Generalization
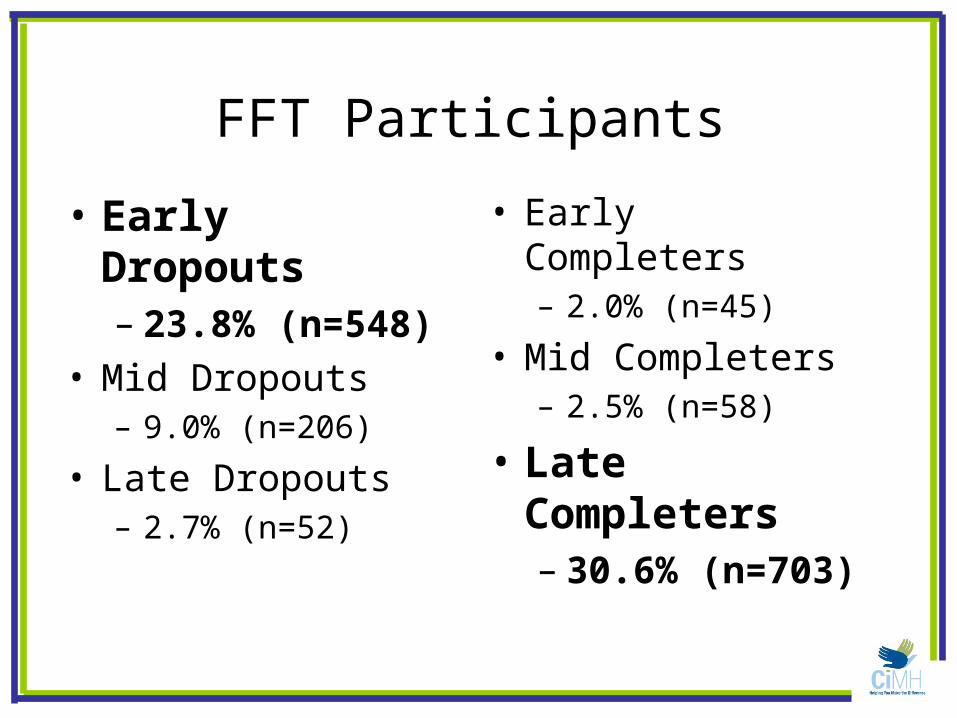
FFT Participants
• Early Dropouts– 23.8% (n=548)
• Mid Dropouts– 9.0% (n=206)
• Late Dropouts– 2.7% (n=52)
• Early Completers– 2.0% (n=45)
• Mid Completers– 2.5% (n=58)
• Late Completers– 30.6% (n=703)

FFT Participants: Currently in Process
• 29.9% (n=687) of participants• Average age = 14.9 years• 62.4% Male• Ethnicity*:
– 38% Hispanic– 33% White – 22% Black – 4% Biracial – 2% Asian– <1% American Indian– <1% Other
*Percentages may not equal 100 due to rounding.

FFT Participants: Currently in Process
• Current phase of FFT– Early
• 45.1% (n=310)
– Mid• 37.7% (n=259)
– Late• 17.2% (n=118)
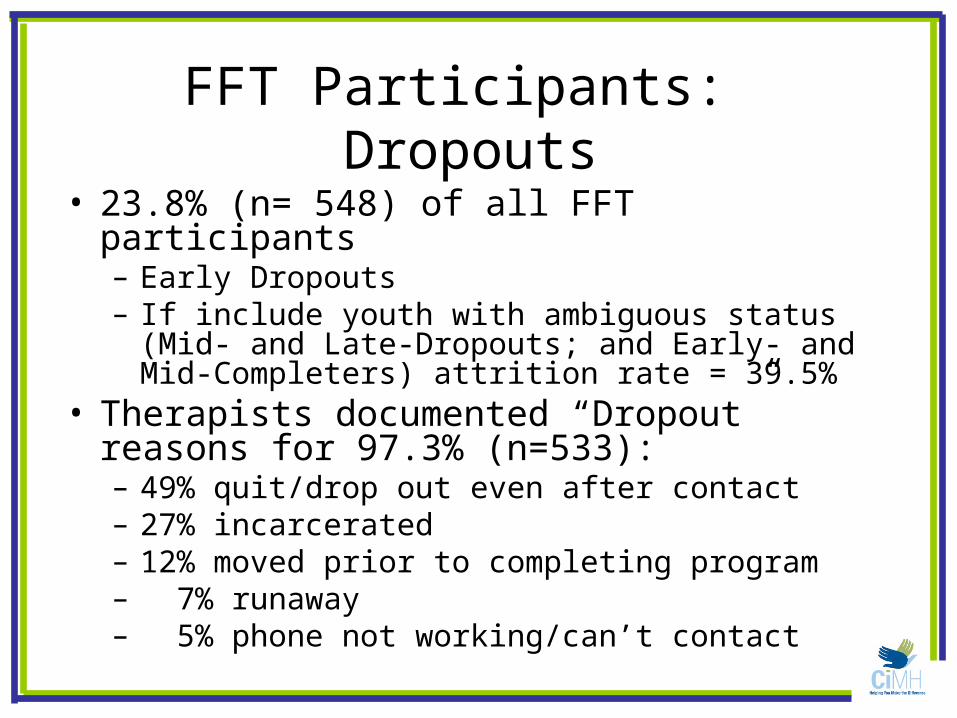
FFT Participants: Dropouts
• 23.8% (n= 548) of all FFT participants– Early Dropouts– If include youth with ambiguous status (Mid- and
Late-Dropouts; and Early- and Mid-Completers) attrition rate = 39.5%
• Therapists documented “Dropout” reasons for 97.3% (n=533):– 49% quit/drop out even after contact– 27% incarcerated– 12% moved prior to completing program– 7% runaway– 5% phone not working/can’t contact

FFT Participants: Dropouts
• 23.8% (n= 548) of all FFT participants • Average age = 16.0• 59.5% Male• Ethnicity*:
– 39% White – 35% Hispanic– 16% Black – 6% Biracial – 2% Asian– 1% American Indian– 1% Other– <1% Alaskan Native
*Percentages may not equal 100 due to rounding.

FFT Participants: Completers• 30.6% (n= 703) of all FFT participants• Average age = 16.3• 61.2% Male• Ethnicity*:
– 41% White – 38% Hispanic– 12% Black – 5% Biracial – 2% Asian– 2% Other– 1% American Indian
*Percentages may not equal 100 due to rounding.

Any Differences Between Dropouts and Completers?
• Age– No differences
• Gender– No differences
• Ethnicity– No differences

Any Differences Between Dropouts and Completers?
• Baseline Functioning – Youth Outcome Questionnaires (YOQ)– No differences in average scores for Youth Self-
Report, Mother Reports, or Father Reports– No differences in the percentage of youth above
and below the clinical cutpoint for Mother Reports or Father Reports
– Significant differences in the percentage of youth above and below the clinical cutpoint for Youth Self-Report (see graph on following slide)

Any Differences Between Dropouts and Completers?
Youth who dropped out of FFT self-reported YOQ scores that were above the clinical cutpoint at higher rates than youth who completed FFT.Chi-Square (df=1) = 8.08, p<.01
Baseline YOQ-Self-Report Clinical Cutpoint Information
44%34%
66%56%
0%
20%
40%
60%
80%
Dropped Completed
Below Cutpoint
Above Cutpoint
n=326 n=584

Any Differences Between Dropouts and Completers?
• Family members’ perceptions of the therapeutic process, therapeutic progress, and the therapeutic alliance – Counseling Process Questionnaires (CPQ) – Engagement & Motivation Phase– No differences in the average scores for the 16
core items for Youth, Mothers, or Fathers– No differences in the average percent of
improvement between items 17 and 18 for Youth or Fathers
– Significant differences in the average percent of improvement between items 17 and 18 for Mothers (see graph on following slide)

Any Differences Between Dropouts and Completers?
During the Engagement & Motivation phase, mothers of youth who completed FFT reported a higher rate of improvement from when they first came to FFT until “now” (the time the CPQ was completed) than mothers of youth who dropped out of FFT.t (df=439) = -3.19, p<.01
Percent Improvement Between CPQ Item 17 and Item 18 Engagement & Motivation Phase
Mother Reports
40%
80%
0%
20%
40%
60%
80%
100%
Dropped Completedn=90 n=351

Any Differences Between Dropouts and Completers?
• Therapist Outcome Measure (TOM)– Significant differences in therapist reports of
general family change since the beginning of FFT (see graph on following slide)

Any Differences Between Dropouts and Completers?
Chi-Square (df=6) = 716.34, p<.001
Therapist Report of General Family Change Since the Beginning of FFT
3% 0%
45%
1%
47%43%
4%
57%
0%
20%
40%
60%
80%
Dropped Completed
worse
no difference
a little or some better
a lot or very muchbetter
n=119 n=600
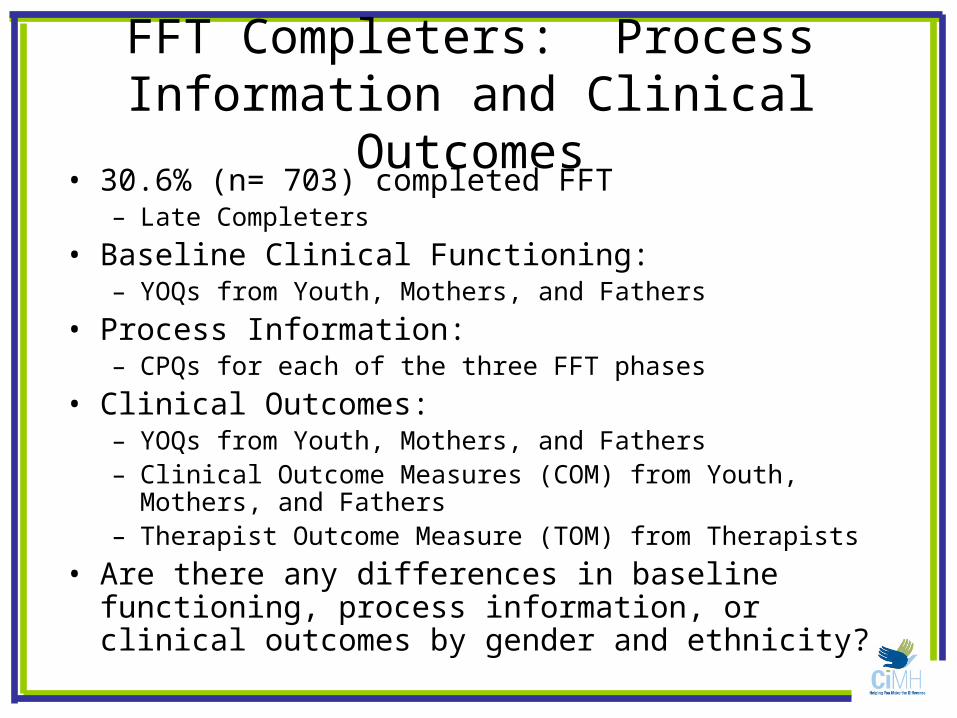
FFT Completers: Process Information and Clinical Outcomes
• 30.6% (n= 703) completed FFT – Late Completers
• Baseline Clinical Functioning:– YOQs from Youth, Mothers, and Fathers
• Process Information:– CPQs for each of the three FFT phases
• Clinical Outcomes:– YOQs from Youth, Mothers, and Fathers– Clinical Outcome Measures (COM) from Youth, Mothers, and
Fathers– Therapist Outcome Measure (TOM) from Therapists
• Are there any differences in baseline functioning, process information, or clinical outcomes by gender and ethnicity?

Baseline Clinical Functioning
Average YOQ Scores* for Youth Who Completed FFT (n=703)
n Range Average (sd)
Youth Self-Report 584 -11 – 171 54.50 (+ 31.4)
Mother Report 542 -13 – 196 70.71 (+ 36.0)
Father Report 197 -1 – 161 69.86 (+ 37.2)
*Scores range from -16 – 240; Higher scores indicate higher levels of impairment, or more problematic general functioning.

Baseline Clinical Functioning
Youth Outcome Questionnaire Clinical Cutpoint Information at Baseline
Youth Who Completed FFT (n=703)
26.90%
44.00%
25.10%
73.10%74.90%
56.00%
0%
20%
40%
60%
80%
100%
Youth Self Report Mother/MotherFigure
Father/FatherFigure
Per
cen
tag
e o
f Y
ou
th
Below Cutpoint
At or Above Cutpoint
n=584n=542 n=197

Any Differences in Baseline Clinical Functioning by Gender or Ethnicity?
• Youth general functioning as measured by the Average Scores on the Youth Outcome Questionnaires (YOQs)– YOQ-Self Report – Average Scores
• Significant differences by gender (see following slides)• No differences by ethnicity
– YOQ-Mother Report – Average Scores• No differences by gender• Significant differences by ethnicity (see following slides)
– YOQ-Father Report – Average Scores• No differences by gender or ethnicity

Any Differences in Baseline Clinical Functioning by Gender or Ethnicity?
Average YOQ-Self Report Scores at Baseline by Gender
61.49
50.29
20
40
60
80
Female Male
*
n=224 n=343
Female youth who completed FFT had higher self-reported YOQ scores at baseline than Male youth who completed FFT.F (df=2) = 5.27, p<.01

Any Differences in Baseline Clinical Functioning by Gender or Ethnicity?
Average YOQ-Mother Report Scores at Baseline by Ethnicity
61.6565.07
76.9379.83
20
40
60
80
Black Hispanic White Othern=55 n=203 n=201 n=48
* *
Mothers of youth who completed FFT reported higher YOQ scores at baseline for White youth and youth with other ethnicities than for Black and Hispanic youth.F (df=4) = 5.00, p<.01

Any Differences in Baseline Clinical Functioning by Gender or Ethnicity?
• Youth general functioning as measured by the Clinical Cutpoint Information on the Youth Outcome Questionnaires (YOQs)– YOQ-Self Report – Clinical Cutpoint Information
• Significant differences by gender (see following slides)• No differences by ethnicity
– YOQ-Mother Report – Clinical Cutpoint Information• No differences by gender• Significant differences by ethnicity (see following slides)
– YOQ-Father Report – Clinical Cutpoint Information• No differences by gender• Significant differences by ethnicity (see following slides)

Any Differences in Baseline Clinical Functioning by Gender or Ethnicity?
YOQ-Self Report Clinical Cutpoint Information at Baseline by Gender
49.00%
35.70%
51.00%
64.30%
0%
10%
20%
30%
40%
50%
60%
70%
Female Male
Below Cutpoint
At or Above Cutpoint
n=224 n=343
Significantly more Females than Males had YOQ-Self Report scores at baseline that were above the clinical cutpoint.Chi-Square (df=2) = 10.24, p<.01

Any Differences in Baseline Clinical Functioning by Gender or Ethnicity?
YOQ-Mother Report Clinical Cutpoint Information at Baseline by Ethnicity
18.90%
81.10%
29.10%12.50%
33.50%
66.50%70.90%
87.50%
0%
20%
40%
60%
80%
100%
Black Hispanic White Other
Below Cutpoint
At or Above Cutpoint
n=55 n=203 n=201 n=48
* *
Significantly more White youth and youth of other ethnicities had YOQ-Mother Report scores at baseline that were above the clinical cutpoint, as compared to Black and Hispanic youth.Chi-Square (df=4) = 16.33, p<.01

Any Differences in Baseline Clinical Functioning by Gender or Ethnicity?
YOQ-Father Report Clinical Cutpoint Information at Baseline by Ethnicity
19.00%22.20% 20.80%
42.60%
57.40%
77.80% 79.20%81.00%
0%
20%
40%
60%
80%
100%
Black Hispanic White Other
Below Cutpoint
At or Above Cutpoint
n=9 n=54 n=100 n=24
* **
Significantly more Black youth, White youth, and youth of other ethnicities had YOQ-Father Report scores at baseline that were above the clinical cutpoint, as compared to Hispanic youth.Chi-Square (df=4) = 11.36, p<.05

FFT Process Information
*Responses range from 1-7; Higher scores indicate higher rates of agreement.
Average CPQ Responses* for the Core 16 ItemsYouth Who Completed FFT (n=703)
Respondent
FFT Phase
Engagement & Motivation
Behavior Change Generalization
Youth5.03
(n=435)5.42
(n=418)5.60
(n=277)
Mother5.28
(n=383)5.69
(n=381)5.90
(n=249)
Father5.17
(n=162)5.56
(n=147)5.75
(n=92)

FFT Process Information
Percent Improvement from CPQ Item 17 to Item 18 by FFT Phase
Youth Who Completed FFT
95%
41%72%
59%
85%132%
195%
54%88%
0%
50%
100%
150%
200%
Engagement &Motivation
Behavior Change Generalization
Adolescent Client
Mother/Mother Figure
Father/Father Figure

Any Differences in FFT Process Information by Gender or Ethnicity?
• CPQ Core 16 Items– No differences by gender or ethnicity for Youth or
Mother Reports across all three phases of FFT– No differences by gender for Father Reports across
all three phases of FFT– No differences by ethnicity for Father Reports in
Behavior Change or Generalization Phases– Significant differences by ethnicity for Father Reports
in Engagement & Motivation• Fathers of Hispanic youth reported significantly higher
average CPQ scores on Items 1-16 than fathers of White youth, indicating higher rates of agreement with the core 16 CPQ items.
– Hispanic (n=43) = 5.53 (+.97)– White (n=87) = 4.98 (+.77)

Any Differences in FFT Process Information by Gender or Ethnicity?
• Percent Improvement Between CPQ Items 17 and 18– No differences by gender or ethnicity for
Youth, Mother, or Father Reports across all three phases of FFT

FFT Clinical Outcomes
Youth reported 22% improvement;
Mothers reported 26% improvement; and
Fathers reported 18% improvement in youth general functioning.
*All pre/post comparisons statistically significantly different, p<.001.
Youth Outcome Questionnaire (YOQ) DataYouth Who Completed FFT (n=703)
716955
4351
58
0
20
40
60
80
Youth Mother Father
Pre
Post
n=390 n=361
* **
n=114

FFT Clinical OutcomesYouth Outcome Questionnaire - Youth Self-Report
Pre/Post Clinical Information(n=390)
174 213
216 177
050
100150200250300350400
Pre Post
Nu
mb
er o
f Y
ou
th
At or Above Cutpoint
Below Cutpoint
Thirty-eight of the 174 (22%) youth who were below the clinical cutpoint on the YOQ prior to participation in FFT moved into the clinical range (above the cutpoint) after FFT.Seventy-seven of the 216 (36%) youth who were at or above the clinical cutpoint on the YOQ prior to participation in FFT moved into the non-clinical range (below the cutpoint) after FFT.

FFT Clinical Outcomes
Seven of the 96 (7%) youth who were below the clinical cutpoint on the YOQ prior to participation in FFT moved into the clinical range (above the cutpoint) after FFT.Ninety-six of the 265 (36%) youth who were at or above the clinical cutpoint on the YOQ prior to participation in FFT moved into the non-clinical range (below the cutpoint) after FFT.
Youth Outcome Questionnaire - Mother Report Pre/Post Clinical Information
(n=361)
96185
265176
050
100150200250300350400
Pre Post
Nu
mb
er o
f Y
ou
th
At or Above Cutpoint
Below Cutpoint

FFT Clinical Outcomes
Six of the 27 (22%) youth who were below the clinical cutpoint on the YOQ prior to participation in FFT moved into the clinical range (above the cutpoint) after FFT.Twenty of the 87 (23%) youth who were at or above the clinical cutpoint on the YOQ prior to participation in FFT moved into the non-clinical range (below the cutpoint) after FFT.
Youth Outcome Questionnaire - Father Report Pre/Post Clinical Information
(n=114)
27 41
87 73
0
40
80
120
Pre Post
Nu
mb
er o
f Y
ou
th
At or Above Cutpoint
Below Cutpoint

FFT Clinical Outcomes
COM and TOM Data: General Family Change Since the Beginning of FFT
3% 1% 3% 1%0% 0%1%1%
31% 32%39% 43%
67%66%58% 57%
0%
20%
40%
60%
80%
Youth Mother Father Therapist
worse
no difference
a little or some better
a lot or very much better
n=542 n=484 n=160 n=600

Any Differences in FFT Clinical Outcomes by Gender or Ethnicity?
• Average YOQ Total Scores– No differences by gender or ethnicity for Youth Self-
Report, Mother Reports, or Father Reports
• YOQ Clinical Cutpoint Status– No differences by gender or ethnicity for Youth Self-
Reports or Father Reports– No differences by ethnicity for Mother Reports– Significant differences by gender for Mother
Reports (see graph on following slide)

Any Differences in FFT Clinical Outcomes by Gender or Ethnicity?
According to Mother Reports, the majority of females had YOQ scores above the clinical cutpoint after FFT, while the majority of males had YOQ scores below the clinical cutpoint after FFT.Chi-Square (df=2) = 14.43, p<.01
Post YOQ - Mother Report Clinical Cutpoint Information
37%
57%63%
43%
0%
20%
40%
60%
80%
Female Male
Below Cutpoint
Above Cutpoint
n=142 n=235

Any Differences in FFT Clinical Outcomes by Gender or Ethnicity?
• COMs & TOM – General Family Change Since the Beginning of FFT– No differences by gender or ethnicity for
Youth, Mother, Father, or Therapist Reports

Summary
• Based on available CSS data…• At least 10% of referred youth never began FFT
– An additional 5% have either not yet begun, or have never began and a reason has not been documented
• 30% of referred youth are currently participating in FFT
• At least 24% of referred youth dropped out of FFT– The attrition rate increases if youth are included whose status
cannot be determined based on the available data.
• At least 31% of referred youth have completed FFT– The completion rate increases if youth are included whose
status cannot be determined based on the available data.

Summary
• Youth who never began, are currently in process, dropped out, and completed FFT do not vary by demographic characteristics (age, gender, ethnicity)
• Two interesting differences were identified among youth who dropped out of and youth who completed FFT:– Youth who dropped out of FFT self-reported YOQ scores that
were above the clinical cutpoint at higher rates than youth who completed FFT.
– During the Engagement & Motivation phase, mothers of youth who completed FFT reported a higher rate of improvement from when they first came to FFT until “now” (the time the CPQ was completed) than mothers of youth who dropped out of FFT.
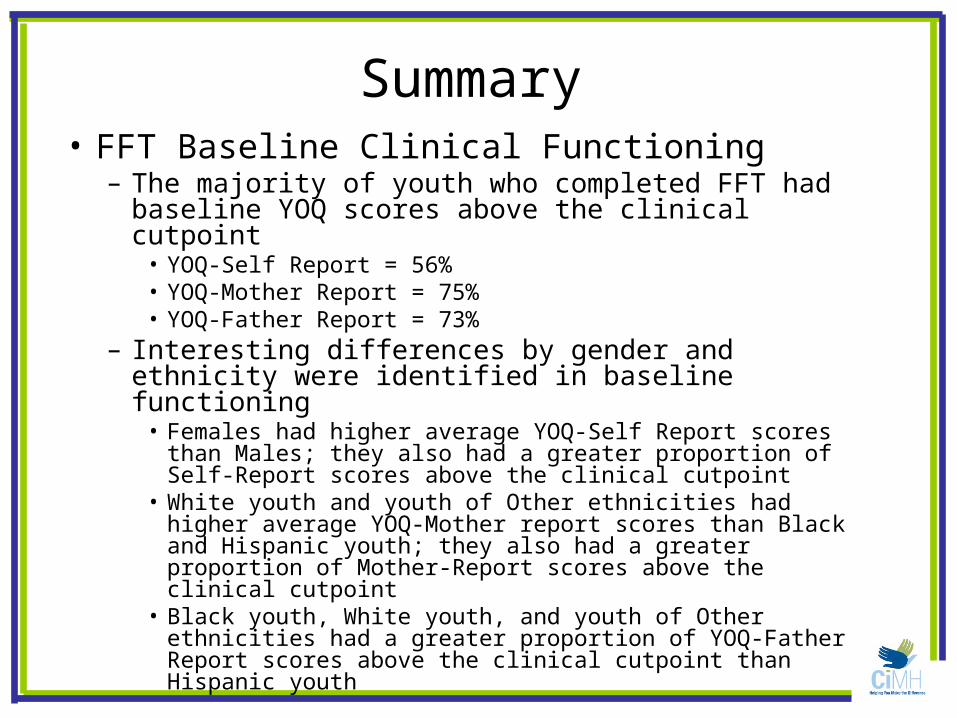
Summary• FFT Baseline Clinical Functioning
– The majority of youth who completed FFT had baseline YOQ scores above the clinical cutpoint
• YOQ-Self Report = 56%• YOQ-Mother Report = 75%• YOQ-Father Report = 73%
– Interesting differences by gender and ethnicity were identified in baseline functioning
• Females had higher average YOQ-Self Report scores than Males; they also had a greater proportion of Self-Report scores above the clinical cutpoint
• White youth and youth of Other ethnicities had higher average YOQ-Mother report scores than Black and Hispanic youth; they also had a greater proportion of Mother-Report scores above the clinical cutpoint
• Black youth, White youth, and youth of Other ethnicities had a greater proportion of YOQ-Father Report scores above the clinical cutpoint than Hispanic youth

Summary
• FFT Process Information– Family member reports on the core 16 CPQ
items do not vary across informant or across the three phases of FFT
– Family member reports of percent improvement (Items 17 and 18 on the CPQ) show a progressive increase across the three phases of FFT

Summary• FFT Clinical Outcomes
– Youth demonstrated significant improvements in general functioning
• YOQ-Self Report– 22% improvement in average scores– net shift of 10% from clinical to non-clinical range
• YOQ-Mother Report– 26% improvement in average scores– net shift of 25% from clinical to non-clinical range
• YOQ-Father Report– 18% improvement in average scores– net shift of 12% from clinical to non-clinical range
– The majority of all family members’ and therapists’ responses on the COMs and TOM report that “General Family Change Since the Beginning of FFT” is “A Lot or Very Much Better”