feynman diagrams. feynman vertices ib physics – particle physics each of the three basic...
TRANSCRIPT
Feynman Diagrams
IB Physics – Particle Physics
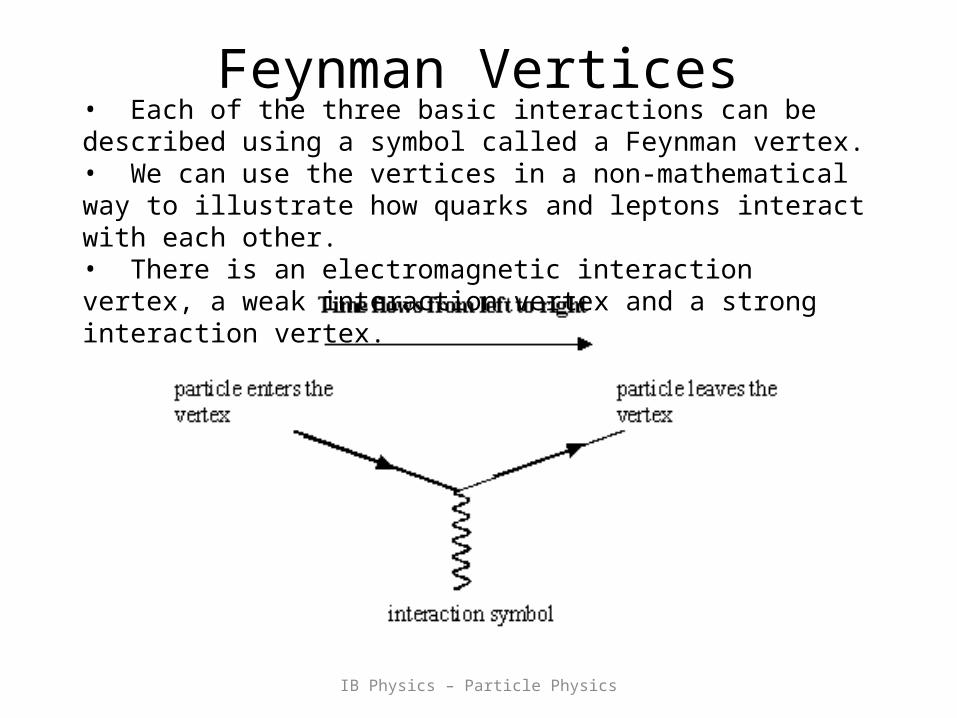
Feynman Vertices• Each of the three basic interactions can be described using a symbol called a Feynman vertex.• We can use the vertices in a non-mathematical way to illustrate how quarks and leptons interact with each other. • There is an electromagnetic interaction vertex, a weak interaction vertex and a strong interaction vertex.
IB Physics – Particle Physics
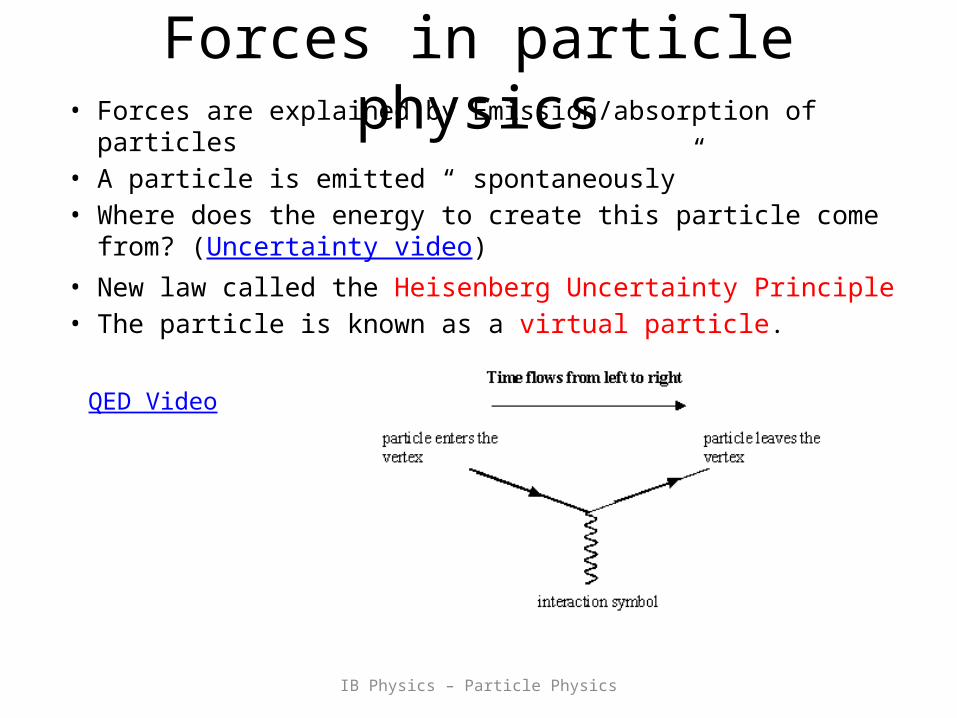
Forces in particle physics• Forces are explained by Emission/absorption of particles• A particle is emitted “ spontaneously”• Where does the energy to create this particle come from? (
Uncertainty video)• New law called the Heisenberg Uncertainty Principle• The particle is known as a virtual particle.
QED Video

IB Physics – Particle Physics
Uncertainty Principle
4
htE
In quantum mechanics it is possible to “borrow” an amount of energy
(from nowhere), DE for a limited amount of time Dt
A virtual W boson (mass 80 GeVc-2) is emitted in an interaction. How long does it exist for?
s
E
ht
27
199
34
101.4
106.110804
106.6
4
Data booklet
IB Physics – Particle Physics
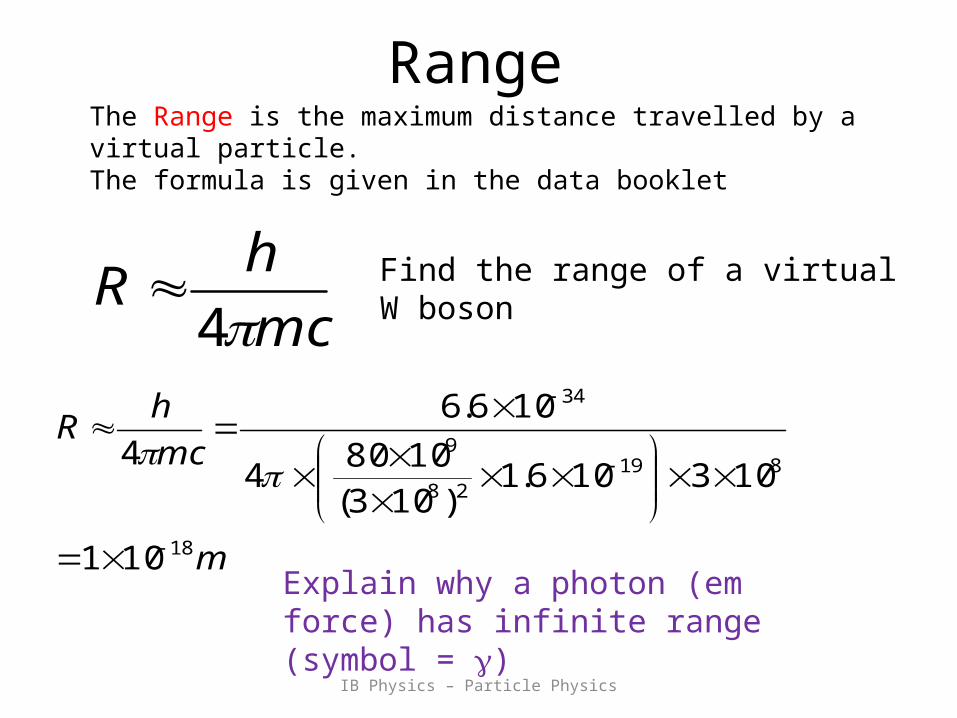
RangeThe Range is the maximum distance travelled by a virtual particle.The formula is given in the data booklet
mc
hR
4
m
mc
hR
18
81928
9
34
101
103106.1)103(
10804
106.6
4
Find the range of a virtual W boson
Explain why a photon (em force) has infinite range (symbol = )

IB Physics – Particle Physics
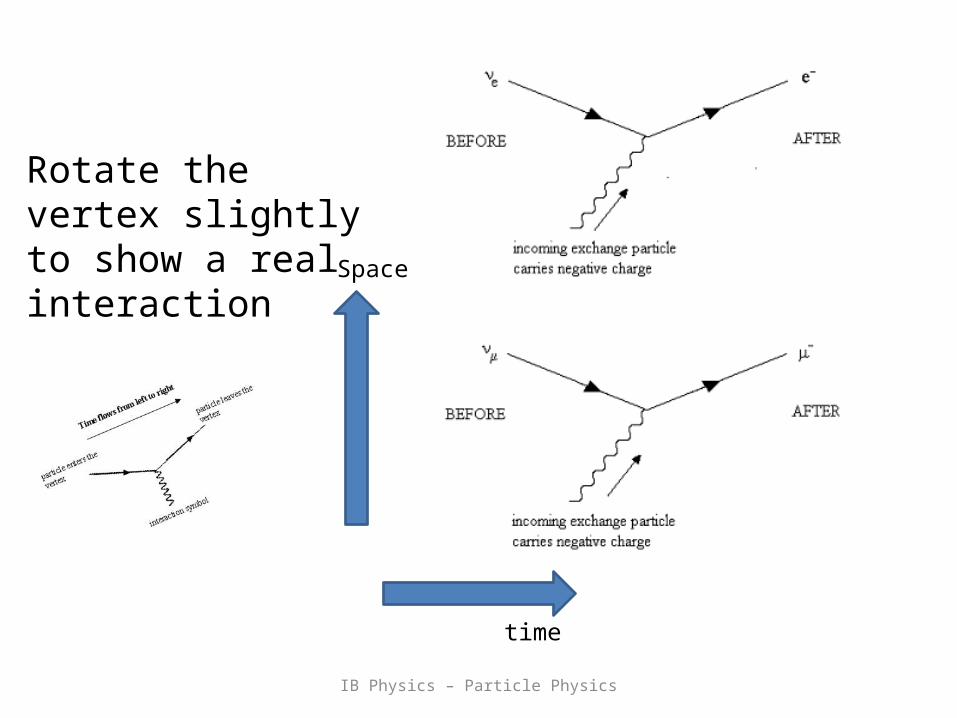
Drawing Feynman Diagrams• Each vertex has an arrow going in and one going out. These
represent a lepton – lepton or quark-quark transition.• Quarks or leptons are solid straight lines• Exchange particles are either wavy (Photons, W, Z) or curly (gluons).• Time flows from left to right• Arrows from left to right represent particles moving forward in
time.• Arrows from right to left represent antiparticles moving forward in
time. (think of them as moving left to right).• Vertices are linked by a line representing an exchange particle• Charge and colour are conserved at each vertex.
IB Physics – Particle Physics
Space
time
Rotate the vertex slightly to show a real interaction

IB Physics – Particle Physics
Use of Feynman diagramsFeynman diagrams may be used to calculate probabilities for fundamental processes.
The picture represents a mathematical process called the amplitude. For the em interaction
137
1
amplitude
EM
EM
The amplitude of the diagram is the product of the interaction strength for each vertex i.e.
EMEM amplitude
Probability of taking place process = (amplitude)2

IB Physics – Particle Physics
EM vertex
IB Physics – Particle Physics
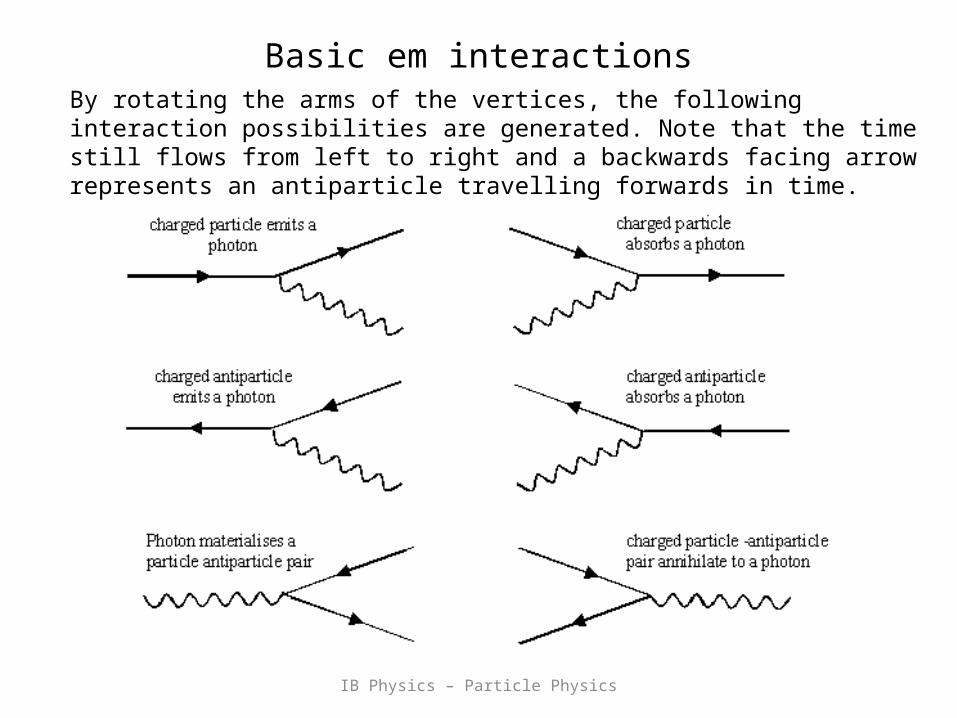
Basic em interactionsBy rotating the arms of the vertices, the following interaction possibilities are generated. Note that the time still flows from left to right and a backwards facing arrow represents an antiparticle travelling forwards in time.
IB Physics – Particle Physics
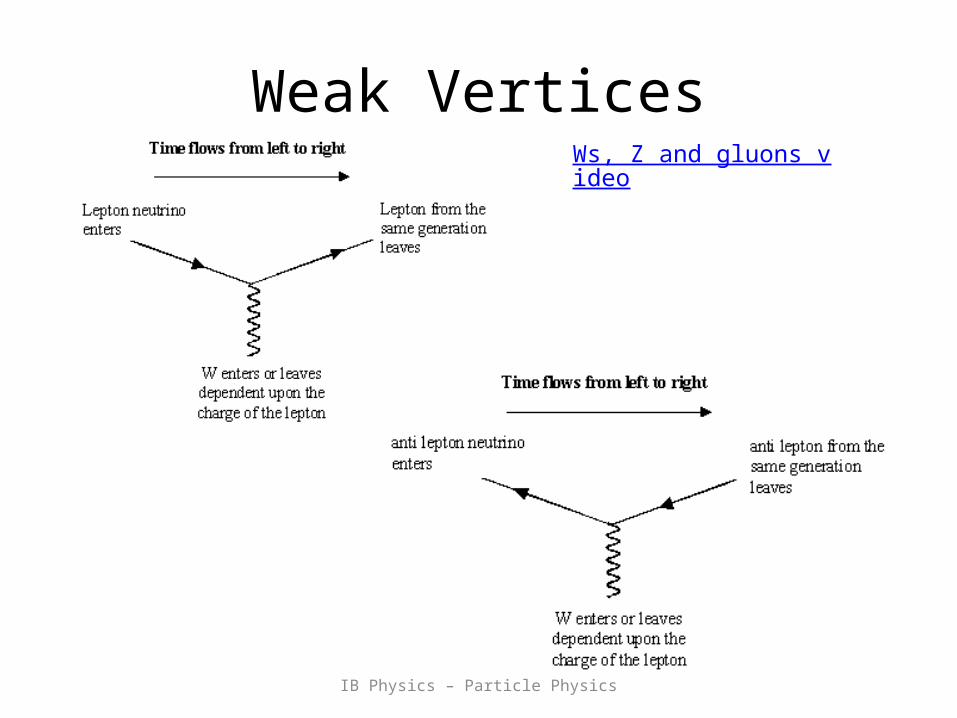
Weak VerticesWs, Z and gluons video
IB Physics – Particle Physics
IB Physics – Particle Physics
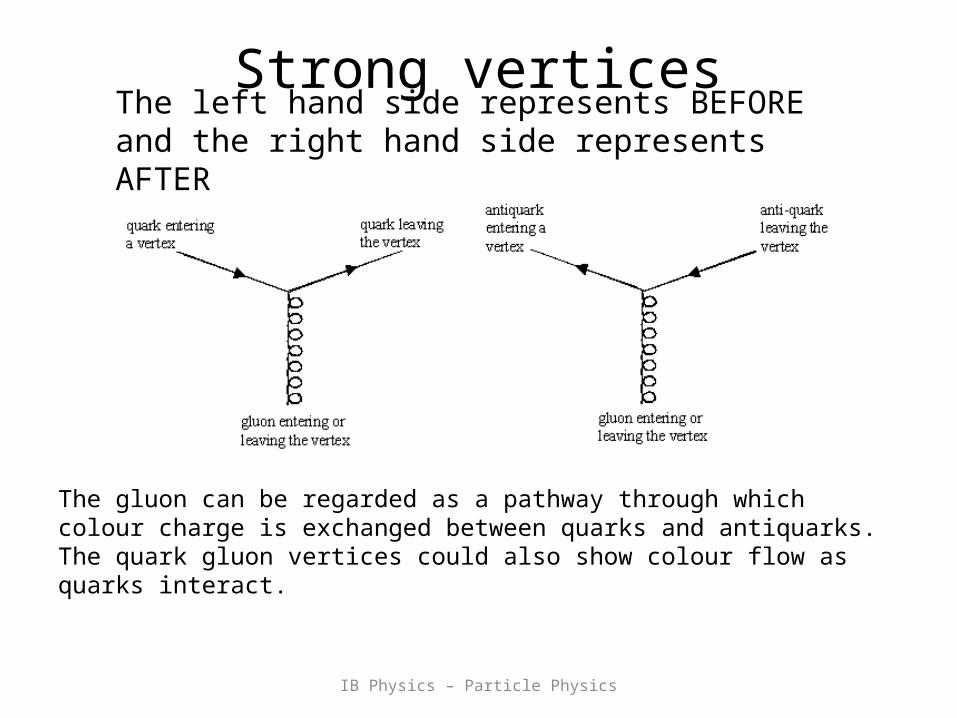
Strong vertices
The gluon can be regarded as a pathway through which colour charge is exchanged between quarks and antiquarks. The quark gluon vertices could also show colour flow as quarks interact.
The left hand side represents BEFORE and the right hand side represents AFTER

IB Physics – Particle Physics
Strong interactions
Annotate to show colour and flavour
IB Physics – Particle Physics
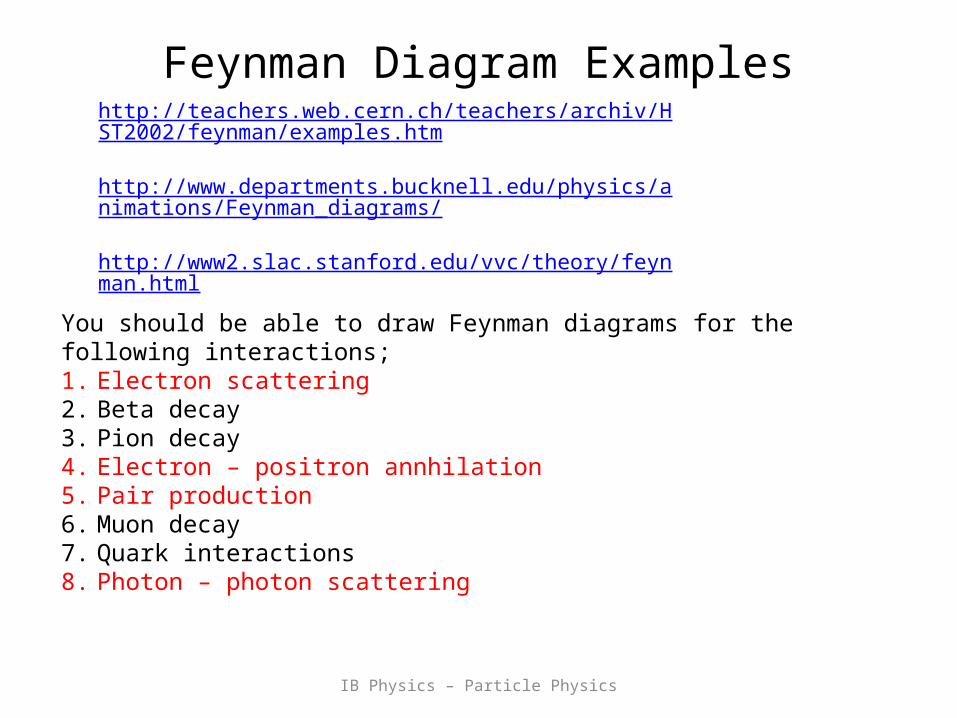
Feynman Diagram Exampleshttp://teachers.web.cern.ch/teachers/archiv/HST2002/feynman/examples.htm
http://www.departments.bucknell.edu/physics/animations/Feynman_diagrams/
http://www2.slac.stanford.edu/vvc/theory/feynman.html
You should be able to draw Feynman diagrams for the following interactions;1. Electron scattering2. Beta decay3. Pion decay4. Electron – positron annhilation5. Pair production6. Muon decay7. Quark interactions8. Photon – photon scattering
IB Physics – Particle Physics
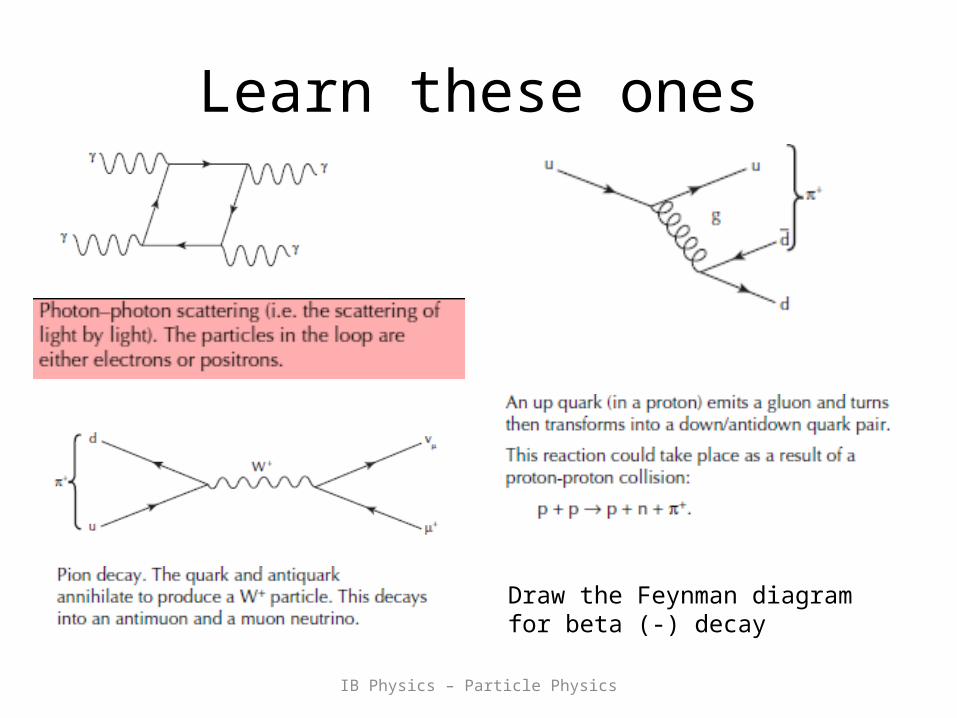
Learn these ones
Draw the Feynman diagram for beta (-) decay
IB Physics – Particle Physics
Strong force and gluon exchange
• Color force and strong force are essentially the same thing
• Colour force binds quarks together in hadrons by exchange of gluons
• Strong force binds colour-neutral particles together e.g. protons and neutrons in the nucleus.
IB Physics – Particle Physics
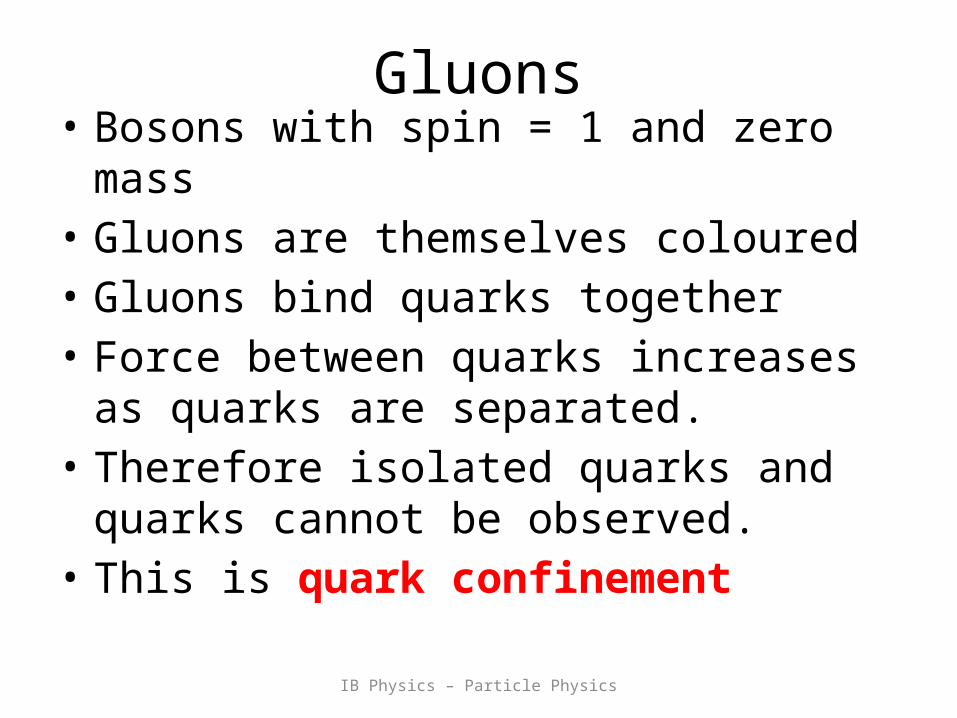
Gluons• Bosons with spin = 1 and zero mass• Gluons are themselves coloured• Gluons bind quarks together• Force between quarks increases as quarks are
separated.• Therefore isolated quarks and quarks cannot
be observed.• This is quark confinement

IB Physics – Particle Physics
Gluon colour• Quarks change colour through gluon exchange.• There are 6 coloured quarks and 2 colour neutral gluons
00 ,
,,,,,
GG
GGGGGGGBRBBGRGGRBR
Note: time should be horizontal
Click diagram for animation
IB Physics – Particle Physics
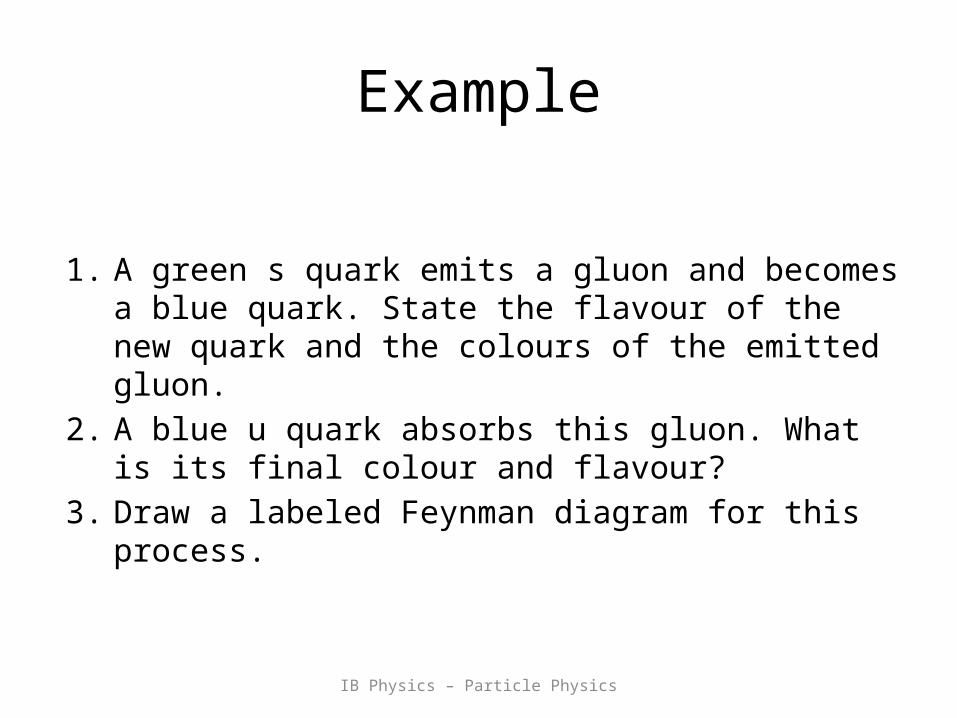
Example
1. A green s quark emits a gluon and becomes a blue quark. State the flavour of the new quark and the colours of the emitted gluon.
2. A blue u quark absorbs this gluon. What is its final colour and flavour?
3. Draw a labeled Feynman diagram for this process.
IB Physics – Particle Physics
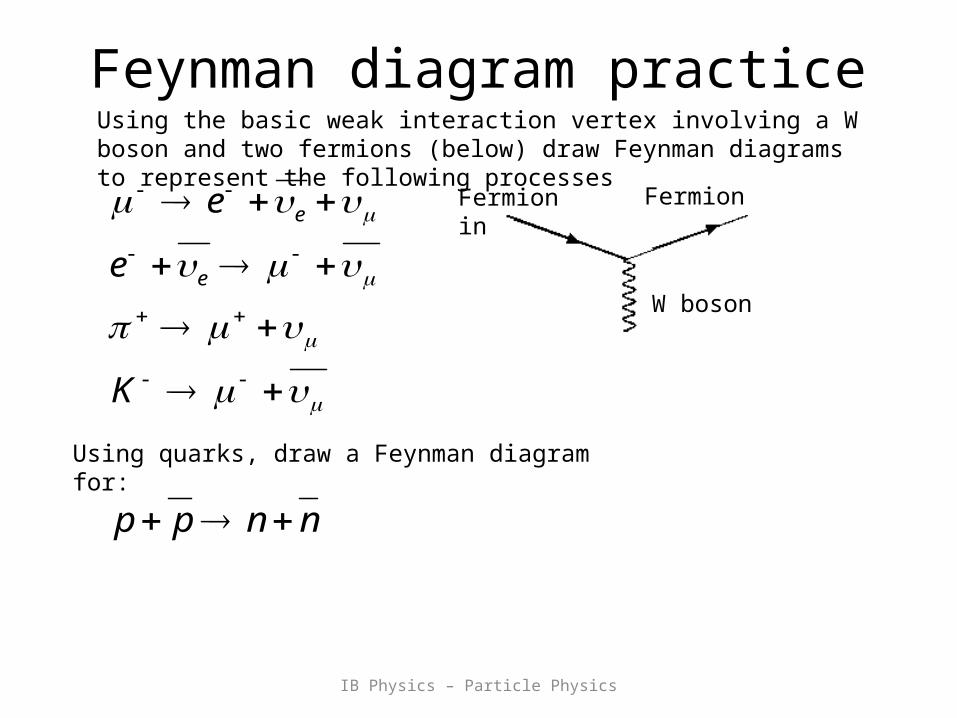
Feynman diagram practiceUsing the basic weak interaction vertex involving a W boson and two fermions (below) draw Feynman diagrams to represent the following processes
Fermion outFermion in
W boson
K
e
e
e
e
Using quarks, draw a Feynman diagram for:
nnpp
IB Physics – Particle Physics
Websites
• www.particleadventure.com• http://teachers.web.cern.ch/teachers/archiv/
HST2002/feynman/index.html