fews net afghanistan. outline description description population distribution population...
TRANSCRIPT

FEWS NET AfghanistanFEWS NET Afghanistan

OutlineOutline DescriptionDescription
Population distributionPopulation distribution poverty poverty Food InsecurityFood Insecurity Livelihood zonesLivelihood zones Agroclimatic factorsAgroclimatic factors
Rainfall/snowRainfall/snow AgricultureAgriculture WaterWater
Special events and FSSpecial events and FS ConflictConflict DroughtDrought
FEWS NET’s food security Monitoring toolsFEWS NET’s food security Monitoring tools Snow packSnow pack Supply-demandSupply-demand ground waterground water NDVINDVI RainfallRainfall Water equivalentWater equivalent wrsiwrsi
Monitoring 2003-2004Monitoring 2003-2004 Agriculture Hazard Index by DistrictAgriculture Hazard Index by District

Population=28,000,000, source landscanPopulation=28,000,000, source landscan 10% of pup, is semi-nomadic pastoralist- 10% of pup, is semi-nomadic pastoralist-
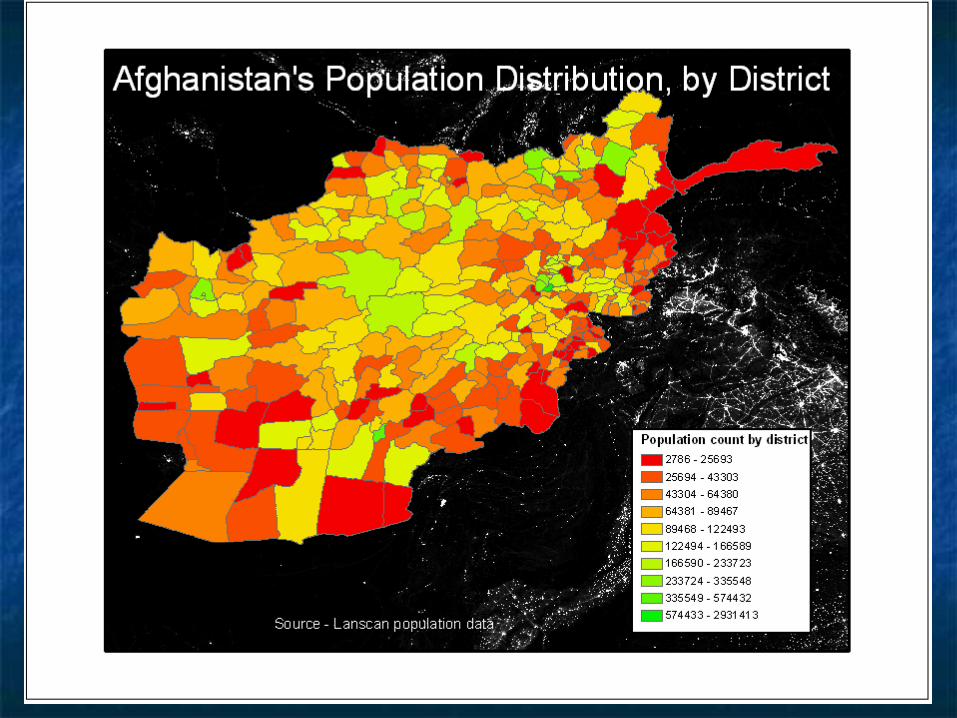
Population=28,000,000, source landscanPopulation=28,000,000, source landscan 10% of pup, is semi-nomadic pastoralist- 10% of pup, is semi-nomadic pastoralist-

Poverty DistributionPoverty Distributioncost of a typical rural Afghan household Af8,450 per person per year, equivalent to Af23 or US$0.43 per person/day for subsistence food consumption.
•52.8% of the rural population in Afghanistan is poor•lack of access to food is due to low incomes,
as opposed to lack of food supply. (NRVA)
Income: Employment, livestock, remittances and petty trade accounts for a significant portion of rural household income
The distribution of poverty, as measured by food consumption is 2,100 kilocalories per day per person

Food Insecurity (FI)Food Insecurity (FI)
20+ years of war and 4 years of drought has destroyed the economic structure of the people.
•Large amount of the pop is vulnerable.
•2002-03 WFP 300,000MT of food aid for 20% of pop.
The main reasons for FI :
•reliance on underground water for irrigation
•cold spells early in the planting season
•lack of off-farm income and limited employment
•reduction of livestock and herds
•limited access to fertilizer and improved-seeds
•the inflow of returnees and insecurity.


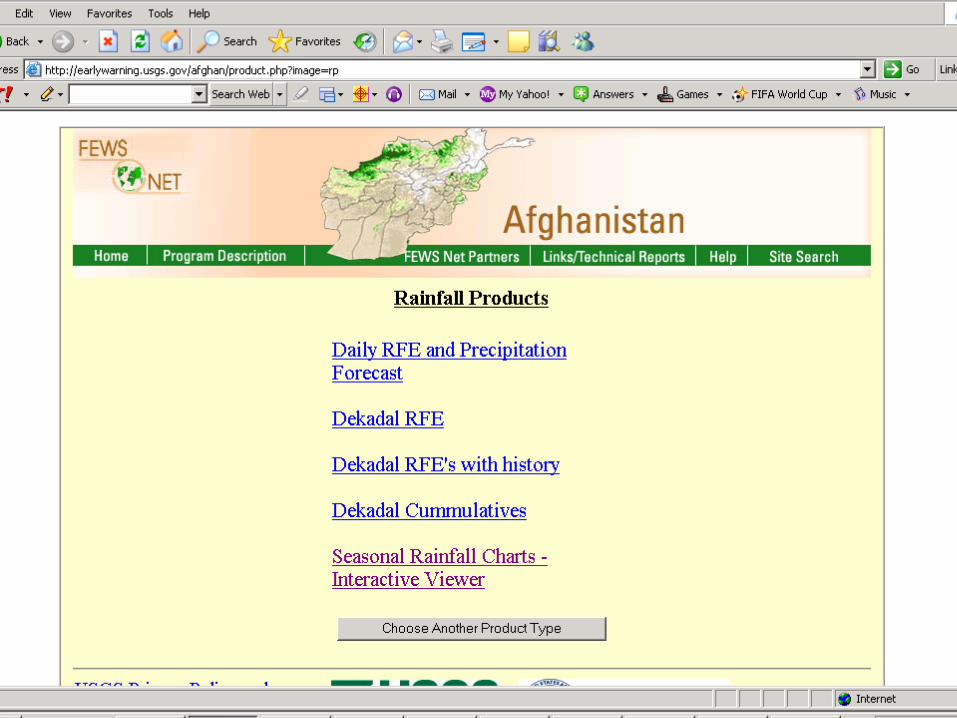
Rainfall/snowRainfall/snow
Starts on Sep on Starts on Sep on the north-east and the north-east and going to the south going to the south and west by Nov, and west by Nov, the peak months the peak months for rainfall are Feb, for rainfall are Feb, March, April which March, April which build up the snow.build up the snow.

AgricultureAgriculture
AgricultureAgriculture is the main is the main economic activityeconomic activity
12% of land is cultivated12% of land is cultivated 46% is pasture46% is pasture Wheat is the main crop, other Wheat is the main crop, other
cereal maiz, barely and ricecereal maiz, barely and rice Specialty crops, such as fruit Specialty crops, such as fruit
and nuts are consumed and nuts are consumed locally and are the main locally and are the main agricultural –food exportagricultural –food export
Opium poppy is the main Opium poppy is the main cash generatorcash generator
90% of wheat is planted in 90% of wheat is planted in the fall, 80% is irrigatedthe fall, 80% is irrigated

WaterWater
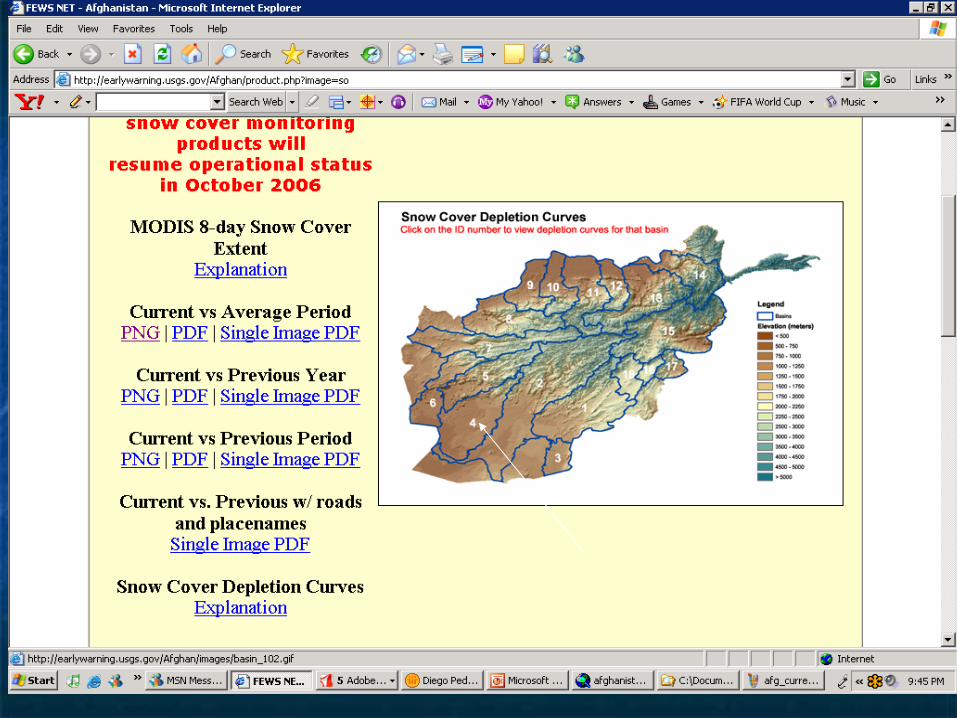
Most of Afghanistan’s Most of Afghanistan’s agricultural land is agricultural land is irrigated and depend not irrigated and depend not on the immediate rainfall on the immediate rainfall but on water released in but on water released in the spring from snow that the spring from snow that builds up during the builds up during the winter. So it is possible to winter. So it is possible to get a good idea on water get a good idea on water availability for the fall availability for the fall harvest, many months harvest, many months ahead of time, by ahead of time, by analyzing the snow build analyzing the snow build up.up.

dried agriculture land
Drought 1998-2001(02)Drought 1998-2001(02)
Recent drought Recent drought (1999-2001)(1999-2001)
Studies conducted Studies conducted by FAO, DCAAR and by FAO, DCAAR and SCA 60-70% of the SCA 60-70% of the under water under water channels and 85% channels and 85% of the shallow wells of the shallow wells dried out during the dried out during the drought. drought.
A dried up kariz (subtarranean canal)

Food Security MonitoringFood Security Monitoring
FEWS NET Agroclimatic FEWS NET Agroclimatic Monitoring ToolsMonitoring Tools


Irrigation Supply and Irrigation Supply and DemandDemand
Seasonal Irrigation Supply & Demand Irrigation Supply & Demand Anomaly (Median Year)

WRSIWRSI


Produces a graph for present period, would be good to have a historical


<>


irrigated
rain fed
Rangelands


Wells being monitored since 2004

Monitoring 2003-04Monitoring 2003-04

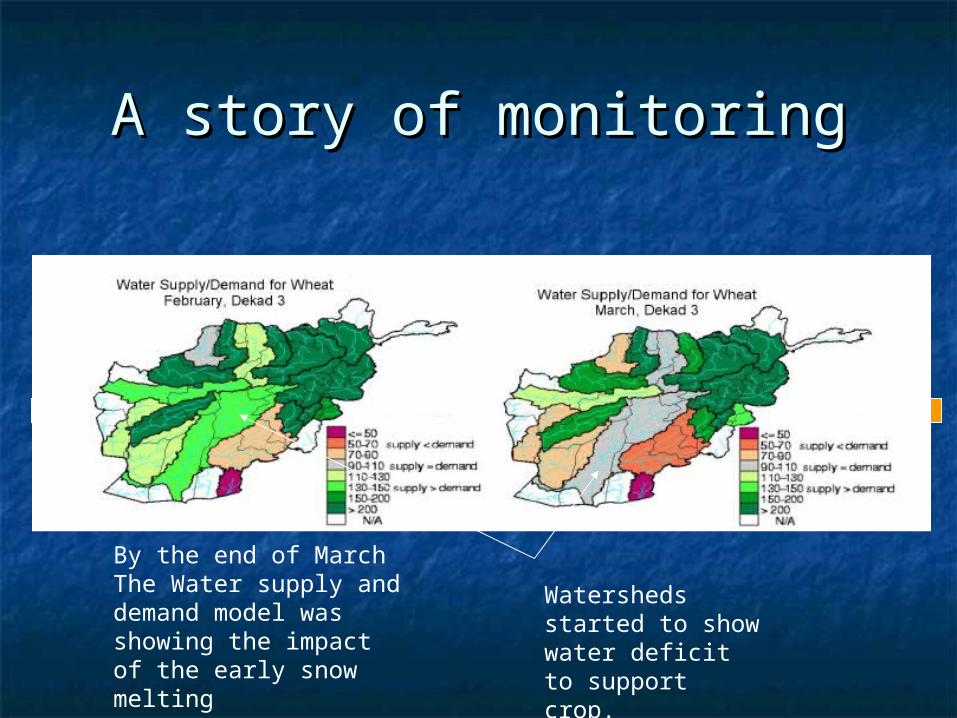
A story of monitoringA story of monitoring
Fall-03 Winter-04 Fall-04 Winter-05 Fall-05 Winter-06
Good snow build up
farmers reportedlysatisfied with the level of rainfall and expecting a goodseason if climate conditions remain similarly favorablein coming months.
Unseasonably high temperatures have caused the melting of the snow cover in much of the country. Rapid melting of snow shortens the period of percolation for ground water recharge
By Late Febaccumulatedprecipitation levels were similar to 2003, though well below the long-term average
A story of monitoringA story of monitoring
Fall-03 Winter-04 Fall-04 Winter-05 Fall-05 Winter-06
By the end of March The Water supply and demand model was showing the impact of the early snow melting
Watersheds started to show water deficit to support crop.

A story of monitoringA story of monitoring
Fall-03 Winter-04 Fall-04 Winter-05 Fall-05 Winter-06
By June, Most of the shallow wells providing water for human and livestockconsumption had dried out and some rivers had no water.
Agricultural crop failure in most of the provinces. As shown by the NDVI comparison with to 2003
Most of the karizes that were fully or partially functioning needed to be cleaned or rehabilitated. Two dams in Ghazni Province (Sardeh and Zana Khan Dams) were under rehabilitation and Sultan Dam needed to be rehabilitated.

A story of monitoringA story of monitoring
Fall-03 Winter-04 Fall-04 Winter-05 Fall-05 Winter-06
High temperature as well as very lowprecipitation had caused a severeshortage of drinking and irrigationwater in many parts of the country.
Field assessments indicated furtherdeclines in water sources compared to 2003 and recent drought years.
About 8000 families were reported as displaced due to water shortage

A story of monitoringA story of monitoring
Fall-03 Winter-04 Fall-04 Winter-05 Fall-05 Winter-06
By Dec 2004 large amounts of snow had fallen in most of the country.
Snow Depleation History, Basin 102
0.0000
0.2000
0.4000
0.6000
0.8000
1.0000
1.2000
273
297
321
345 1 25 49 73 97 12
114
5
Julian dates
% o
f S
no
w
2000-01
2001-02
2002-03
2003-04
2004-05
2005-06

Agriculture Hazard Index Agriculture Hazard Index by Districtby District

irrigated
rain fed
Rangelands


The Supply and demand ration gives a percent measurement of the correspondence between water supply and demand.


The supply and demand (SD) Hazard Index (SDHI) is calculated as I=1-0.02(SD’-50) for SD’<100, (SD’ is the anomaly). This index measures the risk for those areas that present deficit of water.

The SDHI is then multiplied by the %irrigated crop by district to obtain the Irrigated crop Hazard Index.


The NDVI Hazard Index (NDVIHI) is calculated as I=1-0.02(NDVI’-50) for NDVI’<100, (NDVI’ is the anomaly).


Name: Khosh Wa Firing
LVZ: Salangi Plains Mixed Farming
Pop: 95076
Name: Shahrak
LVZ: West-Central Highlands Agro-Pastoral
Pop: 83916
Name: Badhlani Jadid
LVZ: High cereal production
Pop:70273

ReferencesReferences
FEWS NET monthly reports 2003-FEWS NET monthly reports 2003-20062006
Documentation for FEWS toolsDocumentation for FEWS tools National Risk and Vulnerability
Assessment (NRVA) in Rural Afghanistan