fetal cardiac function and venous circulation...
TRANSCRIPT

LUND UNIVERSITY
PO Box 117221 00 Lund+46 46-222 00 00
Fetal Cardiac Function and Venous Circulation - Experiences with Velocity VectorImaging
Dahlbäck, Charlotte
Published: 2015-01-01
Link to publication
Citation for published version (APA):Dahlbäck, C. (2015). Fetal Cardiac Function and Venous Circulation - Experiences with Velocity Vector ImagingResearch Unit for Urogynaecology and Reproductive Pharmacology
General rightsCopyright and moral rights for the publications made accessible in the public portal are retained by the authorsand/or other copyright owners and it is a condition of accessing publications that users recognise and abide by thelegal requirements associated with these rights.
• Users may download and print one copy of any publication from the public portal for the purpose of privatestudy or research. • You may not further distribute the material or use it for any profit-making activity or commercial gain • You may freely distribute the URL identifying the publication in the public portal

1
Fetal Cardiac Function and Venous Circulation
Experiences with Velocity Vector Imaging
Charlotte Dahlbäck
DOCTORAL DISSERTATION by due permission of the Faculty of Medicine, Lund University, Sweden.
To be defended in the auditorium of the Dept. of Obstetrics and Gynecology, Skåne University Hospital, Malmö. 2015-10-02 at 09:00
Faculty opponent
Prof. Juha Rasanen

2
Organization
LUND UNIVERSITY
Document name
DOCTORAL DISSERTATION
Date of issue
Author(s) Charlotte Dahlbäck Sponsoring organization
Title and subtitle Fetal Cardiac Function and Venous Circulation – Experiences with Velocity Vector imaging
Abstract
Placental dysfunction resulting in intrauterine growth restriction (IUGR) is a common complication of pregnany and severe IUGR, with ensuing fetal hypoxia is an important cause of perinatal mortality and morbidity. Doppler studies of fetal and maternal vessels are routinely used for fetal surveillance and alterations in fetal venous blood flow has been demonstrated as a late sign of fetal compromise. However, the role of venous blood flow investigations in decisions on delivery has not been clearly defined and abnormal ductus venosus blood flow has shown moderate accuracy in predicting adverse perinatal outcome. The mechanisms behind ductus venosus dilatation in fetal hypoxia, the transmissions of pulses in the fetal venous system and the association between venous blood flow and cardiac function have also not been completely clarified.
We investigated ductus venosus and umbilical venous blood flow patterns and the association between alterations in the two vessels and adverse perinatal outcome. Changes in ductus venosus blood flow during systole occurred more rarely than diastolic changes and were more often associated with adverse periatal outcome. UV-pulsations seemed to be an independent indicator of fetal compromise, regardless of ductus venosus pulsatility index for veins (PIV), which was not a reliable indicator of fetal compromise as an isolated finding.
The heart is a crucial organ for fetal adaptation to placental insufficiency. Studies have indicated cardiac damage and remodelling during chronic hypoxia and estimations of cardiac function may therefore be useful for fetal surveillance in IUGR. The best suited parameters, however, remain to be established. Methods that analyze cardiac deformation have recently been developed and have shown promise. Using the novel speckle tracking technique Velocity Vector Imaging, strain, strain rate and velocity of the ventricular and atrial walls were measured in a cohort of 250 healthy fetuses and compared to results in a group of 38 fetuses with signs of impaired placental function. Reference ranges were constructed for the control group. Cardiac strain did not differ between the control and study groups and there was no association between ductus venosus PIV, umbilical vein pulsations and ventricular or atrial strain, strain rate or velocity. This indicates that during fetal hypoxia, circulatory redistribution results in preservation of cardiac deformation thereby maintaining cardiac output intact.
Key words: Doppler; venous; ductus venosus; umbilical vein; cardiac function; speckle tracking; strain; pregnancy; fetus
Classification system and/or index terms (if any): Faculty of Medicine Doctoral Dissertation. Series 2015:102
Supplementary bibliographical information: [email protected] Language: English
ISSN and key title:
1652-8220
ISBN
978-91-7619-181-1
Recipient’s notes Number of pages Price
Security classification
I, the undersigned, being the copyright owner of the abstract of the above-mentioned dissertation, hereby grant to all reference sources permission to publish and disseminate the abstract of the above-mentioned dissertation.
Signature Date

3
Fetal Cardiac Function and Venous Circulation
Experiences with Velocity Vector Imaging
Charlotte Dahlbäck

4
Copyright Charlotte Dahlbäck
Faculty of Medicine, Department of Obstetrics and Gynecology ISBN 978-91-7619-181-1 ISSN 1652-8220 Printed in Sweden by Media-Tryck, Lund University Lund 2015

5
To Hilda, Vidar and Sigvard

6
Contents
Contents 6 Abbreviations 8 List of original papers 9 Preface 10 Introduction 12
Physiology of fetal circulation 12 The fetal circulatory system 12 Fetal cardiac function 14 Fetal response to hypoxia and placental insufficiency 16
Methods for fetal surveillance 18 Ultrasound 18 Doppler ultrasound 19 Analysis of fetal blood flow velocity waveforms 20
Methods for assessment of fetal cardiac function 24 Parameters used to describe fetal cardiac function 24 Techniques for cardiac evaluation 26
Aims 28 Methods 29
Equipment 29 Study I and II 29
Study subjects 29 Blood flow velocity waveform recordings and analysis 30 Investigations on perinatal outcome 30
Study III and IV 31 Study subjects 31 Image acquisition 31 Analysis using Velocity Vector Imaging 32
Statistical analysis 33 Results and discussion 35
Study I and II 35

7
Association between DV blood flow and UV-pulsations 36 Perinatal outcome in relation to DV blood flow and UV-pulsations 41 Conclusions studies I and II 45
Study III and IV 45 Patient characteristics 45 Strain, strain rate and velocity measurements 46 Conclusions study III and IV 53
Summary in Swedish 55 Acknowledgements 58 References 60

8
Abbreviations
ARED absent or reversed end-diastolic flow of UA BEa base excess of umbilical artery BEv base excess of umbilical vein BFC blood flow class in the UA CTG cardiotocography CST clinical stress test DA ductus arteriosus DV ductus venosus DV-RAV ductus venosus reversed a-wave FVW flow velocity waveform FGR fetal growth restriction FHR fetal heart rate FO oval foramen IVC inferior vena cava LA left atrium LHV left hepatic vein LV left ventricle MHV middle hepatic vein MPI myocardial performance index NST non-stress test OR odds ratio pHa pH of umbilical artery pHv pH of umbilical vein PI pulsatility index RA right atrium RHV right hepatic vein RV right ventricle SD standard deviation SGA small for gestational age UA umbilical artery UV umbilical vein VVI Velocity Vector Imaging

9
List of original papers
This thesis is based on the following papers, which will be referred to in the text by their Roman numerals. The papers are appended at the end of the thesis.
I. C. Dahlbäck, M. Pihlsgård and S. Gudmundsson.
Abnormal ductus venosus pulsatility index in the absence of concurrent umbilical vein pulsations does not indicate worsening fetal condition.
Ultrasound Obstet Gynecol. 2013;42: 322-328.
II. C. Dahlbäck, O. Øra Myren and S. Gudmundsson
Investigations on ductus venosus blood flow patterns, umbilical vein pulsations and perinatal outcome.
Submitted manuscript
III. C. Dahlbäck and S. Gudmundsson
Increased pulsatility in the fetal ductus venosus is not related to altered cardiac strain in high-risk pregnancies.
Accepted 28 April 2015 in Journal of Maternal-Fetal and Neonatal Medicine
IV. C. Dahlbäck and S. Gudmundsson
Investigations on atrial function in fetuses with signs of impaired placental function.
Prenatal Diagn. 2015; 35: 605-611

10
Preface
The fetus, hidden inside the womb of its mother, was in the past completely inaccessible for examinations, diagnosis and treatment. It was considered as part of the pregnancy and not as an individual patient. This point of view has dramatically changed over the past 100 years, as the field of feto-maternal medicine has evolved.
The first records of fetal heart beat auscultation were presented by Marsac in the seventeenth century and followed by the introduction of the wooden fetoscope in 1821.1 Since then, several methods for monitoring fetal anatomy and wellbeing have emerged. However, achieving the goal of fetal surveillance – preventing fetal death - as defined by the American College of Obstetricians and Gynecologists in 2014, is still a challenging task.
Intrauterine growth restriction (IUGR) and placental insufficiency are common complications of pregnancy and severe IUGR is one of the main causes of perinatal mortality and morbidity, as well as a risk factor for chronic disease later in life. Timing delivery in cases of severe, early onset IUGR is problematic, as the practicing obstetrician has to balance the dangers of prematurity with the risk of intrauterine hypoxia.2
When a fetus needs to adapt to placental insufficiency and hypoxia, the heart is a crucial organ. Evaluations of cardiac function have been proposed as an addition to current methods for predicting adverse outcome and death in cases at risk. Studies indicate an altered cardiac function already in early stages of IUGR, but the debut and progression of fetal cardiac dysfunction across the stages of IUGR are largely unknown.3,4, 5Also, several difficulties are associated with estimations of fetal cardiac function and to date, ideal methods for investigation and parameters suitable for quantification of function remain to be established.6
Doppler ultrasound measurements of blood flow velocities in several fetal vessels are used routinely to identify IUGR fetuses at risk of hypoxia. Doppler changes in fetal vessels seem to appear in a sequential fashion, but with wide variations.7 Alteration in fetal venous blood flow (such as in the ductus venosus (DV) and umbilical vein (UV)) appear late in the process of fetal demise but DV alterations have shown only moderate predictive accuracy for adverse perinatal outcome.8

11
Fetal pulsating central venous blood flow patterns reflect the pressure in the right atrium (RA), and are seen as reflections of cardiac function. However, the connection between cardiac function and blood flow velocity patterns in the DV and UV is not fully understood.7 Furthermore, the propagation of pulses into the UV through the DV during hypoxia has also not been thoroughly studied.
Our work has been focused on employing the novel Velocity Vector Imaging (VVI) technique for studies of fetal cardiac function. This method, shown to have high sensitivity in adult cardiology, employs acoustic markers (speckles) of a 2D ultrasound image for calculation of cardiac wall velocity and deformation. Its potential advantages in diagnosis of fetal cardiac function include its angle-independence and low volume dependence compared to blood flow and M-mode based measurements. Deformation estimates changes in length of a myocardial segment and should hence reflect myocardial contractility more accurately than changes in ventricle dimensions.9 Using VVI, reference ranges over gestation were created in a cohort of healthy fetuses and the results were compared to those obtained in a cohort of fetuses with signs of placental dysfunction. We also investigated the relationships between the measured cardiac strain and venous blood flow in the high-risk group.
Moreover, in retrospective analyses of examinations performed at the Doppler unit at Skåne University hospital, Malmö, venous blood flow velocity waveforms of the ductus venosus and umbilical vein were investigated and abnormalities in these vessels were related to each other and to perinatal outcome.

12
Introduction
Physiology of fetal circulation
The fetal circulatory system
Several features distinguish the fetal from the post-natal circulatory system. The fetal ventricles pump in a parallel fashion with the left primarily supplying the coronary arteries and the upper body and the right being the main distributor to the lungs, the placenta and the lower body. Two arterial shunts connect the right and the left circulations. The oval foramen (FO) interlinks the two cardiac atria and the ductus arteriosus (DA) shunts part of the right ventricular output from the main pulmonary artery into the descending aorta.10
In the umbilical cord, two arteries transport deoxygenated blood from the fetus to the placenta, where they branch repeatedly, just beneath the amnion to form fine capillary networks: the chorionic villi. As the chorionic villi extend into the intervillous space, they are bathed in freely flowing maternal blood and this allows for transportation of oxygen, carbon dioxide, nutrients and waste across their endothelial surface. Blood with higher oxygen content is returned to the fetus through one single umbilical vein (the UV) and enters the fetal circulation through the hepatic veins and through the ductus venosus, (DV) a fetal shunt described in detail below.11
After birth the DA, DV and umbilical vessels constrict and collapse. As the lungs fill with air and expand, the blood flow from the right ventricle (RV) preferentially passes through the pulmonary artery to the lungs, before returning to the left atrium. The flow through the FO thereby diminishes and it is obliterated and closed.11
Umbilical vein, the ductus venosus and hepatic circulation From its insertion at the umbilicus, the UV ascends steeply at first. It then diverges and joins the transverse part of the left portal vein. Preceding this turn, the vessel branches and this is where the DV has its origin. The DV is a slender, cone-shaped vessel with unique structural properties and an inlet diameter that is much smaller than that of the UV.12 The UV pressure gradient (the difference in blood pressure
13
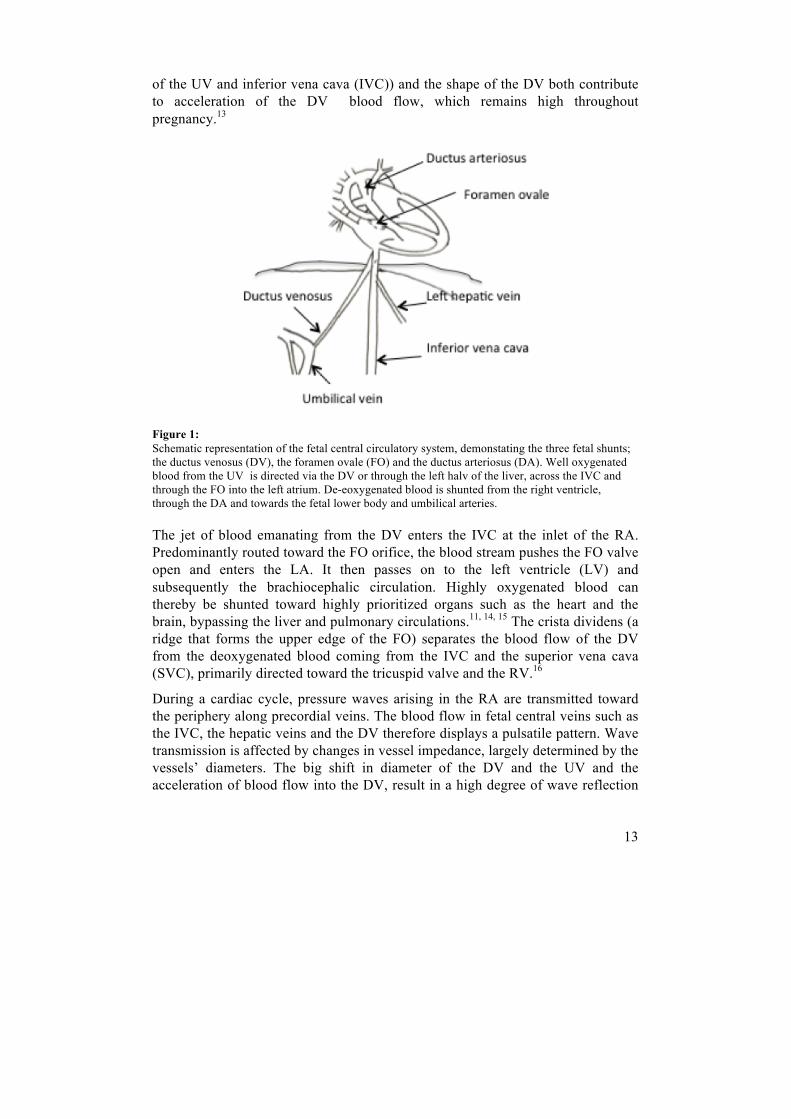
of the UV and inferior vena cava (IVC)) and the shape of the DV both contribute to acceleration of the DV blood flow, which remains high throughout pregnancy.13
Figure 1: Schematic representation of the fetal central circulatory system, demonstating the three fetal shunts; the ductus venosus (DV), the foramen ovale (FO) and the ductus arteriosus (DA). Well oxygenated blood from the UV is directed via the DV or through the left halv of the liver, across the IVC and through the FO into the left atrium. De-eoxygenated blood is shunted from the right ventricle, through the DA and towards the fetal lower body and umbilical arteries.
The jet of blood emanating from the DV enters the IVC at the inlet of the RA. Predominantly routed toward the FO orifice, the blood stream pushes the FO valve open and enters the LA. It then passes on to the left ventricle (LV) and subsequently the brachiocephalic circulation. Highly oxygenated blood can thereby be shunted toward highly prioritized organs such as the heart and the brain, bypassing the liver and pulmonary circulations.11, 14, 15 The crista dividens (a ridge that forms the upper edge of the FO) separates the blood flow of the DV from the deoxygenated blood coming from the IVC and the superior vena cava (SVC), primarily directed toward the tricuspid valve and the RV.16
During a cardiac cycle, pressure waves arising in the RA are transmitted toward the periphery along precordial veins. The blood flow in fetal central veins such as the IVC, the hepatic veins and the DV therefore displays a pulsatile pattern. Wave transmission is affected by changes in vessel impedance, largely determined by the vessels’ diameters. The big shift in diameter of the DV and the UV and the acceleration of blood flow into the DV, result in a high degree of wave reflection

14
at the DV/UV junction, which along with the large compliance of the UV, renders its blood flow steady, without pulsations, in normal late pregnancy.15
The hepatic veins drain into the IVC just below the diaphragm.17 The blood flow of the left hepatic vein joins that of the DV, directed toward the FO, while the blood from the right liver lobe joins the flow from the distal IVC. The liver has high developmental priority, as it is an important determinant of fetal growth and adaptation. In normal pregnancy, 70-80% of the umbilical blood flow perfuses the liver, while 20-30% is shunted through the DV. A slight decrease in the degree of shunting is seen in late pregnancy.18 In IUGR and during hypoxic conditions the level of shunting through the DV, sensitive to both active and passive regulation, has been shown to increase significantly.19-21
Fetal cardiac function
The normal cardiac cycle involves five major phases:
1) Isovolumetric relaxation phase, 2) Early diastole, 3) Atrial contraction period, 4) Isovolumetric contraction phase, and 5) Ejection period
The first three phases take place during diastole, when blood moves from the atria into the ventricles and the last two involve ventricular systole, with blood moving from the ventricles into the aorta and pulmonary artery.22 In order to achieve an adequate output, the ventricles must adapt to the demands and working conditions of the heart. A change in heart rate is one strategy and the fetal myocardium also has the ability, though limited, to respond to the Frank-Starling mechanism. 6, 10
Due to the arrangement of the fetal circulatory system, changes in preload and afterload affect the ventricles differently, compared to what is seen in the adult heart, and each ventricle must be considered separately. The LV preload is influenced by the pulmonary venous return, the FO size and by diastolic filling characteristics of the right side (as the FO allows transmission of flow and pressure from the RA to the LA).23 The LV output is primarily directed toward the upper body and the vascular resistance or pressure in this region influences the LV afterload.
The RV preload is primarily made up of the entire volume from the SVC and the fraction of IVC return that does not pass through the FO. Factors that influence right to left shunting modify RV preload. The RV output is directed in part toward the umbilical arteries and the fetal lower body, by means of DA-shunting, and in part toward the lungs through the left and right pulmonary arteries.11 Fetal RV afterload is thereby essentially determined by properties of these vascular beds. Due to its low resistance and high volume flow, the placenta plays a key role in

15
determining the RV afterload.6 Prior to birth, there is a right-heart dominance, with the RV contributing to 52-65% of the CO.24, 25 The right ventricular wall is thin (3-4 mm) and its muscle mass is approximately one-sixth that of the LV and post-natally it pumps against about one-sixth of the resistance of the LV.26
Characteristics of the fetal myocardium and myocyte contraction Ventricular ejection is initiated by electrical activation of the myocytes and their combined contraction force leads to an increase in cavity pressure. During the isovolumetric contraction phase, when all valves are closed, a change in ventricular geometry takes place. Eventually, the intracavitary pressure exceeds that of the aorta and pulmonary artery, and their respective valves are forced open. An overall deformation of the tissue ensues as the myocytes shorten, resulting in a reduction of internal ventricular size and the ejection of a certain blood volume into the circulation. Ventricular size and the total deformation that takes place during contraction determine the cardiac stroke volume.9
Figure 2: Overview of cardiac motion and deformation. Arrows describe the components and the major directions of deformation. The right ventricle is to the left in the picture and the left ventricle to the right.
The deformation of the myocardium during ejection is very complex. Myocyte organization in the ventricle walls is important for determining the properties of deformation and ensuring an efficient ejection. An activation of the myocytes of the LV leads to thickening of the myocardium in the radial direction and to longitudinal shortening, primarily by movement of the valve plane toward the apex. Rotation of the basal plane with regard to the apical plane also results in an overall torsion of the ventricle.27 In the RV, fiber orientation causes longitudinal function to prevail over circumferential shortening.26

16
The amount of force applied to an object (per unit area), and its elastic properties influence deformation. Deformation in a certain direction is the result of all forces acting in that direction. In the heart, the contraction force is one important source; another is the intracavitary pressure, perpendicular to the endocardial surface. The loading conditions and the local and global neighborhood, thereby influence deformation of a myocardial segment. In order to interpret changes in deformation perfectly, all involved forces should be investigated.9
The fetal myocardium has unique properties and undergoes significant maturational changes prior to birth. Being constructed primarily of non-contractile elements with fewer myocytes, it is stiffer compared to that of adults. Ventricular relaxation is also limited by the fluid-filled lungs that surround the fetal heart, and this contributes to its low compliance.28
Fetal response to hypoxia and placental insufficiency
Fetal hypoxemia triggers a number of compensatory responses, influenced by the underlying cause of hypoxia and the speed by which it evolves. Placental dysfunction is a common cause of fetal growth restriction and chronic hypoxia. It implies a failure of the placenta to meet the fetal demands for oxygen and nutrients, which increase as the pregnancy progresses.
In normal pregnancy, before 32 weeks of gestation, about one third of the fetal cardiac output (CO) is distributed to the placenta, and the degree then decreases to about 20%.29 The diameter and blood flow of the UV are both decreased in fetal growth restriction.21, 30 Several studies have confirmed that the fetal CO remains constant as long as the blood’s pH level is retained, but if acidemia arises, a decline in CO occurs.
During physiological conditions, blood flow to the fetal body is primarily directed toward the carcass (skeleton, muscle, skin and connective tissue) and the lungs, with only a small portion supplying the brain, heart, intestines, kidneys and adrenals. However, during hypoxia, a marked redistribution takes place, mediated by humoral (e.g. catecholamines, angiotensin, vasopressin), neuronal (mainly adrenergic) and paracrine (e.g. nitric oxide, prostaglandins) mechanisms.31 The preferential constriction of the fetal peripheral and pulmonary circulations results in a rise in fetal blood pressure and a redistribution of blood flow toward the brain, heart and adrenals. The venous return from the IVC to the heart is reduced, which results in and a greater relative contribution of oxygenated UV-blood flow to the CO.32 Increased placental resistance may result in an augmented RV afterload, which has been associated with cardiac hypertrophy, an increased myocardial demand for oxygen and increased coronary blood flow.33

17
In IUGR, an increased proportion of the UV blood flow bypasses the liver through the DV. The degree of shunting is determined by several factors, namely the resistance of the hepatic portal vasculature, pressure forces and fluid dynamics, and changes of the DV diameter in response to the actions of vasoactive agents. Intrahepatic redistribution directs UV blood flow away from the right liver lobe, favoring the left. This is associated with down-regulation of the glucose-insulin-IgF growth axis and decreased glycogen storage in the liver parenchyme.21
Chronic hypoxia causes the fetus to increase its erythrocyte production, and in the growth-restricted fetus an elevated hematocrit and high nucleated-blood cell counts are commonly seen. This may also reflect an ongoing consumption of erythrocytes (as well as platelets) in placental thrombi.34
At late stages of hypoxia, activation of baroreceptors results in vagal stimulation and slowing of the heart rate, notable on cardiotocography (CTG) as fetal heart rate decelerations. In cases of severe hypoxia, acidemia and acidosis occur. The brain stem becomes less responsive, autonomic reflexes are dulled and a direct myocardial depression leads to severe bradycardia, seen during the terminal stages of fetal demise.23
Intrauterine environment and cardiovascular development Today there is evidence, linking intrauterine growth patterns to risks of disease later in life. Studies have demonstrated associations between low birth weight and coronary heart disease, chronic obstructive lung disease, hypertension and diabetes (among others). A developmental model has been proposed, where nutrient supply to the fetus and events during intrauterine life lead to programing of important systems, such as the immune system, regulation of inflammation, anti-oxidant defense and stem cell number and quality. The way, in which these systems function, affects the risk for developing chronic disease later in life.35
Experiments suggest that adult cardiomyocyte numbers are set during prenatal life. Hemodynamic forces and circulating factors both regulate cardiomyocyte proliferation, and intrauterine hypoxia seems to lead to a reduction in cardiomyocyte numbers. Cardiomyocytes enlarge if systolic wall stress is increased with elevated systolic pressure. Factors that influence this pressure are arterial vessel constriction, protein concentration of the blood and vascular resistance of the placenta. Mechanical load, which increases the stress on the wall of the heart, increases the rate at which the myocardium matures and accelerates the rate at which it loses mononucleated cells and thus generative capacity. A decrease in systolic load seems to lead to a decrease in heart size and a reduced number of cells being active in the cell cycle.36

18
Methods for fetal surveillance
In the clinical setting, several techniques are used routinely to assess fetal wellbeing. These include continuous fetal heart rate monitoring with CTG, evaluation of biophysical profile using 2D ultrasound and Doppler examinations of fetal and maternal vessels for blood flow velocity patterns.
Several methods for evaluating fetal health have evolved gradually, with clinical application initiated before the tests were evaluated in randomized trials. Positive predictive values are often low, ranging from 10 to 40%. However, as negative predictive values for most tests are high (99.8% or more), a normal outcome is reassuring and many clinicians use antenatal testing to predict fetal wellness rather than illness. There is a wide range of normal biological variation, which also hampers easy quantification of a normal fetal biophysical performance. Abnormal fetal surveillance test results (CTG and biophysical profiling) have been associated with acidemia and hypoxemia, but they do not have the ability to reflect neither the severity, nor the duration of fetal compromise.37 This thesis deals primarily with 2D- and Doppler ultrasound techniques, which are described in detail in the following sections.
Ultrasound
An ultrasound image is formed when high-frequency sound waves are reflected in a structure. A transducer (probe) containing piezoelectric crystals produces the ultrasound waves by converting electrical signals into acoustic energy that is emitted into the tissue of interest. When passing through tissues with different acoustical impedances, part of the wave is reflected as an echo. A greater difference in density between tissues gives a larger echo and the depth of the tissue interface causing the echo can be determined by the time warranted for the return of the echo. The gathered acoustic information is converted back to electrical signals and an image can be displayed. Different transducers yield different ultrasound frequencies. Higher frequency transducers render better image resolution, but sound waves of lower frequencies penetrate tissues more effectively. For abdominal scanning, in obstetrics, a 3-5 MHz transducer is most commonly used.38 Low intensity grey-scale imaging ultrasound is regarded as a safe diagnostic tool and, in over than 30 years of use, no fetal harm has been demonstrated.39
Obstetric ultrasound has several clinical applications. Primarily, it is used for detection of number of fetuses, pregnancy dating, assessment of the fetal anatomy

19
and placenta location. Today it is also applied in e.g. estimates of fetal growth, fetal echocardiography and evaluations of the fetal biophysical profile.
Doppler ultrasound
When a sound wave is reflected on a moving object a shift in the observed frequency occurs. This phenomenon is known as the Doppler effect and it has found applications in areas as diverse as astronomy, radar, medical imaging and blood flow measurements.
In Doppler ultrasound, a transducer transmits pulses at fixed intervals. As pulses are reflected on moving objects (i.e. erythrocytes) the time required for return of the echo differs slightly between the pulses. These differences can be measured as a direct time difference or, more frequently, as a phase shift. The phase shift gives rise to what is commonly known as the Doppler frequency, dependent on the phase shift and the pulse repetition frequency. The size of the shift is proportional to the velocity of movement and the Doppler equation allows for calculation of blood flow velocity, as its other terms are constant:
Doppler shift = (2×V×f×cos θ)/c
V represents the velocity of the blood, f the frequency of the transmitted ultrasound, θ the angle between the beam and the direction of the flow and c the speed of sound in tissue. Two types of transducers are used, referred to as continuous and pulsed wave (or spectral) Doppler.40
Figure 3: Principles of Doppler ultrasound. A transducer emits a series of pulses that are reflected on the moving objects in the vessel. The difference between the T2 of consecutive pulses represents the phase shift, used in the Doppler equation.
Continuous wave Doppler has separate crystals for emitting and receiving sound wave signals. Its advantages include the ability to record high frequencies using low power output and being easy to use. It is however, non-selective, and records
20
all signals along its path. Visualization of vessels is also not possible. Commonly, it is used in simple fetal heart detectors.
Pulsed wave Doppler uses one crystal to transmit and receive the signal before transmitting the next ultrasound beam. It requires higher power than the continuous wave Doppler. A range gate circuit is set, which allows recording at a specified time after pulse emission. The detected Doppler shift thereby originates from a fixed depth, allowing precise targeting of the region of interest. Different Doppler frequencies are recorded, representing the various velocities of blood flow in the vessel under study and these are displayed as the blood flow velocity waveform (FVW). The variation in velocity is due to the blood’s non-viscous and inhomogeneous nature and the maximum velocity waveform is preferentially used in most clinical situations, as it is accurate and easy to locate. If a small sample volume is used during recording, there is a risk of not capturing all velocities in the examined vessel.
Blood flow velocity measurements are dependent on the insonation angle. If it does not exceed 60°, Doppler shift measurements are considered reliable.41 Particularly when measuring the true velocities (as opposed to indices), it is important to keep the insonation angle as low as possible as angle correction introduces a measurement error that increases with increasing insonation angle.
Analysis of fetal blood flow velocity waveforms
The blood FVW of several vascular beds, e.g. maternal uterine vessels, the umbilical artery (UA), the fetal middle cerebral artery (MCA) and central fetal venous vessels can be used for fetal surveillance and provide diverse information. While some identify a risk, others indicate more or less severe ongoing fetal compromise.
Doppler analysis of arterial blood flow velocity waveforms Increased resistance in the uterine arteries indicates impaired trophoblastic invasion. Elevated systolic/diastolic ratios (PI > 1.2) or early diastolic notching (created from reflected waves) have been associated with IUGR, maternal hypertension, preeclampsia and adverse perinatal outcome. Its usefulness as a screening test in a low-risk population is still debated.42, 43
UA blood FVW analysis has been proven valuable in high-risk pregnancies. The pulsatility index (given by the equation; PI=S-D/mean velocity) is the primary index used to assess resistance in the downstream placental bed. S corresponds to the maximal blood flow velocity during systole, D to end-diastole and “mean velocity” signifies the mean maximal velocity over the entire heartbeat.44 In cases

21
of decreased villous sprouting, villous atrophy or thrombosis, the placental resistance rises and the diastolic velocity in the UA falls. Correlation studies have confirmed histological placental vascular disease in the presence of high-resistance patterns.45
Initially the rise in UA PI is slow, typically contained within normal levels until > 50% of small placental arteries are affected. However, at high levels of vessel obliteration, the increase steepens. The placenta has great reserve capacity, emphasized by the fact that extensive disease is present when Doppler changes appear. A larger placental bed can accommodate more vessel obliteration before the PI rises, which is why UA blood FVW analysis has a lower sensitivity at term.46 UA Doppler is useful in surveillance of high-risk pregnancies as it gives a rough estimate of the degree of placental damage and the risk for fetal hypoxemia and acidemia. Abnormal UA Doppler findings are associated with increased risk of IUGR, fetal distress in utero and during labor, and need for early delivery, but as a primary screening tool, UA Doppler has not been proven useful.47, 48,49
FVW patterns can also be registered from fetal arteries, where the aorta and MCA are the ones most studied. Aortic flow has been studied as either PI, peak mean velocity, or by checking for presence or absence of diastolic forward flow. All of these measurements have been predictive of IUGR, perinatal morbidity and hypoxemia.7, 50 PI of the fetal MCA normally displays a lower diastolic flow and higher PI compared to the aorta and UA. In IUGR-fetuses, a redistribution of blood flow with a lowered cerebral flow resistance and decreased PI (“brain sparing”) may be seen. Low indices have been associated with decreased fetal arterial pO2 and fetal compromise, but brain sparing seems to be an early sign of hypoxia with a large overlap in the lower part of the normal range. A ratio of MCA/UA PI-indices has been shown to identify fetuses with neonatal morbidity.51 At late stages of fetal demise, MCA PI may again rise, which is thought to be due to brain edema or heart failure. 52
Doppler analysis of fetal venous blood flow velocity waveforms Fetal central veins display a pulsatile blood flow due to changes in pressure difference between the RA and the veins in question. The blood flow velocity of the DV reaches two peaks (the S- and D-waves) and two troughs (the ES- and a-waves) during each heartbeat (figure 4). The S-wave arises during systolic ventricular contraction. At the end of ventricular systole increased filling of the RA and the ascent of the closed AV-valves cause the atrial pressure to rise, resulting in the ES-wave. In early diastole, the AV-valves open and blood flows from the atria to the ventricles, leading to a pressure drop in the atria and increased blood velocities in the central veins. This event corresponds to the D-wave. At the end of diastole, during atrial contraction, an increased atrial pressure causes the second trough to arise, the a-wave. 53

22
Figure 4: Doppler recording of normal DV FVW with the timing of the S-, ES-, D- and a-waves marked.
Several venous Doppler indices have been described for semi-quantitative analysis of the complex venous waveform and the pulsatility index for veins (PIV) is the most widespread for DV FVW analysis. Alternatively, identifying absent or reversed blood flow during atrial contraction (DV-RAV) can be used.54
Figure 5: Doppler recording of DV FVW with increasing pulsatility across stages of fetal demise. A normal pattern is seen to the left and the picture furthest to the right displays a pattern with reversed a-wave blood flow.
Increased pulsatility of the DV may be due to augmented atrial contraction as in cardiac dysfunction or increased afterload. A more pronounced pulse wave may then reach further out in the periphery. Dilatation of the DV during fetal hypoxia can also cause the blood flow to become more pulsatile. A combination of factors might also be present. In cases of increased DV pulsatility, additional investigations of cardiac function may be useful to clarify the pathology behind the abnormal waveform. 55
There is substantial evidence to support the use of venous blood FVW analysis to predict adverse outcome and as an aid to time delivery in cases of severe growth restriction. DV-RAV, particularly of prolonged duration, was recently shown to increase the risk of stillbirth.56 However, meta-analysis of the DV FVW ability to predict adverse perinatal outcome (including studies with different DV PIV-thresholds and/or DV-RAV as cut-off) demonstrated moderate accuracy.8 A recent large multi-center study has investigated perinatal outcome depending on the basis for decision of delivery. Patients were randomized to three groups, in which either

23
fetal monitoring by CTG, early DV changes (PIV > 2 SD) or late DV changes (DV-RAV) were triggers for delivery. No difference in survival without neurodisability at 2 years of age was observed, but a larger proportion of the surviving infants in the group delivered based on late DV changes was free of neuroimpairment compared to those delivered based on reduced short-term variation in CTG-tracing.57
Blood flow velocity patterns of the UV have been studied and used for fetal surveillance in high-risk pregnancies, albeit to a lesser extent. Pulsations in the UV have been reported in cases of cord occlusion, fetal heart failure and imminent fetal asphyxia and are considered late signs of fetal hemodynamic deterioration.58 In cases of increased vascular tone or reduced diameter (e.g. with increased adrenergic drive, cord coiling or in early pregnancy) the threshold for pulsations is reduced.13 The connection between DV pulsatility and UV-pulsations has previously been scarcely described, and we investigate this relationship in studies I and II.
Figure 6 Doppler recordings of blood flow velocity in the UV displaying normal steady flow, single pulsations and double pulsations.
Doppler changes tend to appear in a sequential fashion, although with great variation. Generally, more pronounced Doppler changes are seen as the process of progressive placental dysfunction and hypoxia develops. Abnormalities in the fetal central venous circulation typically occur late in the process of fetal demise. They are often used to decide on delivery in cases of early IUGR, but to date no consensus exists on the best way to monitor these fetuses or what should trigger delivery.59 The results of several studies point out that Doppler measurements need to be used in combination and with appropriate theshold.8
Normal Single pulsations Double pulsations

24
Methods for assessment of fetal cardiac function
Fetal cardiac analysis may be valuable in several clinical situations but an ideal method for estimation of function remains to be discovered. There are several factors that make the fetal heart function difficult to evaluate, including the following:60
1) Rapid fetal heart rate and low blood pressure; 2) Smallness of the heart and involved blood volumes; 3) Variable fetal positioning; 4) Surrounding maternal tissues and amniotic fluid that hamper ultrasound imaging and prevent the use of ECG registration for image triggering; 5) Fetal cardiac wall movements that differ from those of the adult heart; 6) Maturation in the myocardium and changes in loading conditions that occur over gestation.
Cardiac function is currently mainly evaluated from parameters based on volumes (e.g. stroke volume or fractional area change), estimated by echocardiography. These measurements disclose no information on how volume changes are obtained or on the force necessary for ejection. In addition, they are load dependent, and changes in pressure or a general shift of volumes will influence them independently of the myocardial contractility.9 Other parameters that may be used in an attempt to define regional or global myocardial function are endocardial motion and myocardial wall thickening and thinning (deformation).61 Recent improvements in cardiac image acquisition and processing now permit non-invasive quantification of regional and global deformation. Tissue Doppler imaging (TDI) and speckle tracking (described below) are two techniques by which information on myocardial deformation can be obtained. They have been well studied in adult cardiology and proven sensitive markers for regional and global cardiac dysfunction.62 Promising attempts have in recent years been made for its application in the fetus.63, 64
Parameters used to describe fetal cardiac function
Cardiac output The combined ventricular output (CO) is a classical parameter used to assess hemodynamic function. It is the product of heart rate and stroke volume. Stroke volume is calculated from the ventricular volumes at end-diastole (ED) and end-systole (ES). It is influenced by cardiac preload, afterload and the myocardial contractility, but also by fetal respiration and movement.
CO = SV x (EDvolume – ESvolume)

25
The combined CO (from the RV and LV) is approximately 400-450 ml/kg/min during second half of pregnancy, and becomes abnormal at a late stage of deterioration.25 It may be expressed as the cardiac index (CO divided by the estimated fetal weight). As ventricular volume estimates are difficult, stroke volume is traditionally calculated from measurements of the aorta or pulmonary valve annulus diameters multiplied by flow across the annulus.22
Ejection fraction The ejection fraction (EF) is an index that estimates the percentage of blood ejected in each heart cycle (ED volume – ES volume) / ED volume). It assesses short-axis ventricular function and is an essential parameter in adult cardiology. In the fetus, however limitations in volume calculations hamper its usefulness. In addition, it may not always give true estimations of stroke volume and cardiac output and becomes abnormal at late stages of deterioration.6
Shortening fraction and annular displacement and velocity The shortening fraction (SF) estimates systolic function and is expressed as the ratio of ventricular ES and ED diameters. It may be used to measure the circumferential contractility (in the minor axis plane) or the longitudinal ventricular function (along the long axis). The SF remains relatively stable during second half of gestation, does not make assumptions about ventricular geometry or rely on volume calculations. However, it gives a crude estimation of contractility and measures only displacement of a single point in the myocardium. Another disadvantage is the difficulty in obtaining standardized measurements of the ED and ES diameters.22
Annular displacement measures the maximal change in position of the AV-valve annulus and ventricular free wall junction from ED to ES. It may be used for right or left longitudinal ventricular functions, respectively. Due to the fiber orientation of the two ventricles, it is best suited for the right ventricle. The speed of movement of the AV-valve annulus in systole can also be investigated and reflects the longitudinal systolic ventricular function. If measured in early (E’) and late (A’) diastole it instead reflects diastolic function. Both displacement and velocity measurements have been described as sensitive parameters for cardiac dysfunction but have not yet been fully evaluated in the fetus.22
Atrio-ventricular flow Blood flow velocities over the AV-valves during ventricular relaxation (E-wave) and during atrial contraction (A-wave) can be measured using Doppler ultrasound. The E/A ratio gives an estimation of cardiac diastolic function and ventricular relaxation. The ratio increases over gestation due to an increased E-wave velocity (with improving ventricular relaxation). Fused E/A waves can be observed in

26
cases of severe cardiac dysfunction (e.g. TTTS and aortic stenosis) but its correlation with isovolumetric relaxation time is weak.60 Limitations of the parameter include a large impact seen of fetal respiration and movement, temporarily fused E/A waves that can occur at high fetal heart rates and the fact that impaired ventricular relaxation may result in a variation of changes of the E/A ratio65.
Myocardial performance index (MPI or TEI index) The myocardial performance index (MPI) (also known as the Tei index) evaluates a combination of ventricular systolic and diastolic functions. It is calculated by the following equation: (ICT + IRT) / ET, where ICT signifies the isovolumetric contraction time, IRT the isovolumetric relaxation time and ET the ejection time66. The MPI is influenced by blood pressure and atrial function. Increased MPI has been seen in cases of intrauterine growth restriction, and in the recipient in twin-to-twin transfusion.3, 67 Normal values increase throughout gestation.68
Myocardial deformation – strain and strain rate Myocardial motion is defined as the distance covered by one point, determined by displacement and velocity, while the change in length or thickness of a myocardial segment (between two points) is known as deformation. Deformation is expressed as strain (%) and given by the following equation: (L-L0)/L0, where L represents the length of a myocardial segment and L0 its original length. The speed at which deformation takes place is referred to as strain rate (s-1). Cardiac strain is not affected by motion of the entire heart and is theoretically therefore more accurate than simple velocity measurements.9
Techniques for cardiac evaluation
Several different techniques may be employed for estimations of cardiac function. Conventional 2D ultrasound can be used for measurements of outflow tract diameters (for SV calculations). Ventricular volumes may also be estimated, for example by the biplane modified Simpsons’ approach, to calculate the EF. In these volume estimations, the geometrical assumptions that are made might not always be valid, which is a weakness of the method. In addition, small measurement errors are amplified when multiplied in calculation formulas.69
Cardiac dimensions (e.g. wall thickness and chamber diameter) and motion of cardiac structures can be recorded with M-mode ultrasound, which is primarily used for estimations of SF and annular displacement. Disadvantages of M-mode include its angle dependency and the difficulties associated with standardization of cursor placement.6
27
Conventional Doppler can be used for E/A ratio evaluations and estimations of SV. Time periods between opening and closing of different valves can be assessed and used for MPI calculations. In addition, by investigations of precordial veins, indirect information on cardiac function may be obtained.
Tissue Doppler Imaging (TDI) TDI uses frequency shifts in ultrasound waves to calculate myocardial or annular velocities. It may be applied online (spectral TDI) to estimate annular velocities, or off-line (color-coded TDI) to assess myocardial motion and deformation.
Spectral TDI can be used to evaluate longitudinal motion (when the cursor is placed below the AV-valve in an apical or basal 4-chamber view) by measuring peak annular velocities. The velocity of the annulus toward the Doppler cursor is displayed as a waveform and velocities reflect systolic (S’) or diastolic (E’ and A’) motion. Spectral TDI may also be used to estimate time periods for calculation of MPI. In color-coded TDI (C-TDI), velocity signals are obtained for each pixel of the image. From these velocities, strain and strain rate of each segment can be calculated off-line. For reliable measurements, an optimal clip acquisition with a high frame rate is critical.27
Speckle tracking Recently developed speckle tracking techniques are based on 2D B-mode ultrasound images, in which bright myocardial areas (speckles) are traced frame-by-frame. The endocardial border of the ventricle is marked manually in the 4-chamber view and the software automatically tracks the border between the endocardium and the cavity in subsequent frames. AV-valve movements are used to define a cardiac cycle. During post-processing off-line analysis, myocardial strain and strain rate can be quantified. Information on individual myocardial segments or on the average (global) function along the tracking line can be obtained. An advantage of this method is that it is theoretically angle-independent and may provide information on several points in the myocardium simultaneously.70
4D-STIC 4D-STIC is a technique that permits a 3D reconstruction of the fetal heart over time. It is based on a volume data set that contains an entire reconstructed heart cycle. From this volume, any target region of interest, at any stage of the cardiac cycle, can be obtained. This technique has been proposed to enable more accurate measurements of ventricular volumes to provide better estimations of cardiac output and ejection fraction. Mitral- and tricuspid annulus displacement can also be assessed during off-line analysis.

28
Aims
The overall aim of the studies included in this thesis, was to investigate the fetal responses to impaired placental function, with focus on cardiac function and venous blood flow.
The specific aims were:
1) To investigate relationships between blood flow patterns in the DV and the UV in high-risk pregnancies, clarifying how an abnormally pulsatile pattern in one of the vessels was related to the pattern of the other and how pathological signs in one, or both of the vessels were related to perinatal outcome.
2) To assess fetal cardiac ventricular function (strain, strain rate and velocity) using a novel speckle-tracking technique and construct normal reference ranges over gestation in a cohort of healthy fetuses.
3) To assess fetal cardiac atrial motion and deformation (strain, strain rate and velocity) with the same speckle tracking technique and construct reference ranges over gestation in the healthy cohort.
4) To compare results of strain, strain rate and velocity measurements of the healthy cohort to those obtained from a cohort of fetuses with signs of increased placental resistance and to investigate the relation between venous blood-flow patterns and cardiac function.
29
Methods
Equipment
Ultrasound investigations were performed using Sequoia (Siemens/Acuson, Mountain View, CA, USA) (studies I and II) or GE Voluson 730 and GE E8 (GE, Kretztechnik, Zipf, Austria) (all studies) ultrasound machines with 2-7 MHz transducers. The lowest high-pass filter available was used (always below 125 Hz). In studies III and IV, offline Velocity Vector Imaging analysis was performed using the Syngo VVI version 1 (Siemens Medical Solutions Inc.) at a Syngo Dynamics workstation.
Study I and II
Study subjects
Data was collected from the database at the perinatal Doppler unit at Skåne University Hospital in Malmö, containing information on all blood flow velocity examinations performed between 1993 and 2011 (in study I) and until 2013 (in study II) in high-risk pregnancies.
Inclusion and exclusion of cases The original search for study I included 58 878 blood flow examinations. Within this dataset, 11857 examinations contained a numeric value for the DV PIV and these were all included for analysis in the first part of study I, investigating the relation between occurrence of UV pulsations and DV PIV. The second part of study I investigated the association between DV PIV, UV-pulsations and perinatal outcome. For this purpose, examinations with DV PIV > 1,5 SD or UV-pulsations were included. The flow chart of figure 9 demonstrates inclusion/exclusion of cases. Study II was based on the cohort obtained in study I with addition of cases from the years 2012 and 2013.

30
Blood flow velocity waveform recordings and analysis
The UA-PI and fetal heart rate were recorded from a free-floating central part of the umbilical cord.
The DV blood FVW was registered and DV PIV calculated as described in studies I and II.71 Still images of the DV recordings were investigated manually. S-, ES- and a-wave blood flow velocities were recorded and ratios for S/ES, S/a and ES/a were calculated. Z-scores, describing deviation from gestational age mean were calculated for DV PIV and DV velocity ratios by the following formula: standard score = ((recorded PI value) – (population gestational age mean))/SD.72,73 In cases of an absent or retrograde flow in the DV a-wave, the a-wave velocity was expressed as 1 cm/s for statistical analysis of the velocity ratios, an approach in accordance with previous studies.74
The blood flow of the UV was recorded in a central section of the intra-abdominal part of the vein and in a free-floating part of the cord. Pulsations were defined as a rhythmic decrease in blood velocity exceeding 15% of the baseline maximum and were categorized as single or double, according to the criteria of Hofstaetter et al.58 The location of pulsations was noted as intra-abdominal and/or in a free loop of the umbilical cord.
Investigations on perinatal outcome
Data on perinatal outcomes were collected from the Skåne University Hospital labor register. The outcome parameters included: premature birth (< 37 weeks), extreme prematurity (< 34 weeks), birth weight < -15% of the mean (10th percentile), birth weight deviation < -22% of the mean (3rd percentile), Apgar-score < 7 at 5 minutes, pH < 7.1 in the umbilical artery, pH < 7.2 in the umbilical vein, admission to neonatal intensive care unit (NICU) and perinatal mortality. In study I gestational age at delivery and delivery by caesarean section were also recorded. The number of cases where information on outcome was available varied depending on the outcome variable.

31
Study III and IV
Study subjects
In studies III and IV, patients were recruited prospectively. Two cohorts were investigated, one containing 252 healthy fetuses and one with 38 fetuses (study III) and 40 fetuses (study IV) with suspected placental insufficiency.
Control group Women with uncomplicated singleton pregnancies, attending routine second- or third trimester ultrasound scanning at the Department of Obstetrics and Gynecology at Skåne University Hospital in Malmö (Sweden) were invited to participate in the study. A separate 2D ultrasonography scanning was performed by one investigator (CD), aiming at examining 10 fetuses per week at gestational ages 19 to 42.
Study group Women undergoing conventional fetal-placental Doppler examination due to suspected fetal intrauterine growth restriction, with an increased vascular resistance in the UA (pulsatility index (PI) >2 SD above mean for corresponding gestational age) were recruited to the study. A 2D video clip of the fetal cardiac four-chamber view was obtained as described below.
Data on perinatal outcome was obtained for the participants of the study.
Image acquisition
A clip of the fetal cardiac four-chamber view was recorded using B-mode (2D-grey scale imaging), stored at its original frame rate in dicom format and exported to a Syngo Dynamics workstation for later off-line analysis. Efforts were made to obtain high quality images with as high frame rate as possible. This was achieved by reducing B-mode image depth, narrowing sector width, avoiding fetal and maternal movements, using high resolution and capturing the entire length of the ventricle or atrium in question. The frame rate used in image acquisition was noted.
A cardiac cycle was identified by assessment of the movement of the mitral valve and end-diastole was defined by the complete closure of the valve. Heart rate was determined by the time interval between two consecutive end-diastolic frames and a single cardiac cycle was analyzed.

32
Analysis using Velocity Vector Imaging
B-mode images of the right and left ventricles were analyzed for velocity and deformation using the Syngo VVI version 1-software, according to the manufacturer’s instructions. In a still image of end-diastole, displaying good outlining of the endocardium, the ventricular or atrial wall in question was traced manually. The software generated velocity vectors, and the trace was adjusted when necessary. The software then calculated global peak longitudinal myocardial velocity (m/s), strain (%) and strain rate (s-1). In the following sections, these results will be referred to as RV or LV velocity, strain or strain rate, respectively.
Figure 7: Left cardiac ventricle with vectors displaying the direction and velocity of endocardial movement, calculated by the software ”Velocity Vector Imaging”. The yellow curves represent the velocities of different ventricular regions over time. The red and blue fields display direction of movement and the velocity along the ventricular wall (apex at the x-mark).
In study IV, the endocardium of the right and left atria was traced at diastole, just prior to atrial contraction. For the right atrial wall, tracing was started at the lateral edge of the atrio-ventricular (AV) valve and continued back to the inter-atrial septum. Care was taken not to include the valve in the analysis. The septum was not included in the trace because of the oval foramen movement.

33
Figure 8: Left atrium (left picture) and right atrium (right picture) with vectors depicting direction and velocity of movements of the atrial walls. The images are mirrored due to fetal orientation during image acquisition.
Peak global longitudinal cardiac strain of the ventricular systole of the right and left atria were calculated and are referred to below as RA strain(s) and LA strain(s), respectively. Peak global velocity during atrial contraction, measured in a radial fashion was calculated for the right and left atria (referred to as RA velocity and LA velocity, respectively).
Peak global strain rate during ventricular systole and during atrial contraction was calculated for the right atrium (RA strain rate(s) and RA strain rate(a), respectively).
Effects of gestational age, frame rate and heart rate on the different measurements were investigated. The lateral and posterior halves of the atrial walls were also investigated separately.
Statistical analysis
Statistical analysis was performed using SAS 9.2 (SAS Inc., Cary, NC, USA) and IBM SPSS Statistics version 21.
Investigations on distributions within groups For comparisons of proportions in independent groups with categorical outcome variables, the chi-square test was used. One-way Anova was used to investigate suspected differences between more than two groups with normally distributed, outcome variables. When comparing means in two groups with normally distributed data, dependent on each other, a paired sample t-tests were performed (e.g. in study IV for comparisons of the left and right atria). To investigate the
34
distributions within two independent groups, where the outcome variables were not normally distributed, the Mann-Whitney U test was used.
The Kruskal-Wallis test is the non-parametric equivalent for the method of ANOVA, applicable when the distributions within more than two groups are to be compared. In study I, the Kruskal-Wallis test was used for comparisons of continuous perinatal outcome variables, with UV-pulsations as explanatory variable. In study II, it was used to compare the different DV ratios and the DV-PIV Z-scores in the absence or presence of single or double UV-pulsations.
Regression analysis In regression analysis, the dependence of one variable (the dependent variable) on another variable (the independent variable) is investigated. In linear regression, the dependent variable is a continuous variable, whereas in logistic regression, it is binary. In multiple regression, the simultaneous relationship between one dependent variable and several independent variables, is investigated.
In studies III and IV, linear regression analysis was conducted in order to determine the relationship between myocardial strain, gestational age and frame rate. It was also used when comparing the controls with the study group and adjusting for gestational age, frame rate and birth weight deviance from mean.
Logistic regression analysis was performed to assess the relation of DV-PIV Z-score and presence of UV-pulsations (study I) and between DV-PIV, S/ES, S/a and ES/a Z-scores and presence of UV-pulsations (study II). In study I, multivariate logistic regression analysis was also performed for binary perinatal outcome variables, with UV-pulsations and DV-PIV Z-score group (1, 2, 3 or 4) as explanatory variables. In study II, DV-PIV Z-score, velocity ratios and UV-pulsations were used as explanatory variables. Odds ratios (OR) and confidence intervals (CI) were calculated.
Regression analysis with ordinary least squares and spline regression In study I, ordinary least squares regression was performed for continuous outcome variables with UV-pulsations =0 and DV-PIV Z-score group ≥ 4 as reference variables. Spline regression was performed to establish reference ranges of the control group in studies III and IV and to assess possible non-linearities in the relationship between strain/strain rate and gestational age. In study III, adjustments to a set frame rate were made using regression with ordinary least squares. Reference ranges are presented as mean ± 2 SD in studies III and IV.

35
Results and discussion
Study I and II
In the first part of study I we investigated blood flow velocity patterns in the UV at different DV PIV Z-scores. Figure 9 illustrates the procedure of patient inclusion.
Figure 9: Flow shart of inclusion and exclusion proceedings of studies I and II.
In the second part of the study, blood flow patterns of the two vessels (the DV and the UV), were related to perinatal outcome. For this purpose, only cases with a DV PIV of > 1.5 SD were included. Only the last examination prior to delivery was used for analysis.
Study II was based on the database created in study I, including cases with a DV PIV of >1.5 SD, + cases from 2012 and 2013.

36
Association between DV blood flow and UV-pulsations
DV PIV and UV-pulsations The presence or absence of UV-pulsations, and when applicable their location was studied in relation to the DV-PIV in study I. In the cohort of 11 863 patients, 468 cases (3,9%) with a DV-PIV Z-score > 2 were identified. In 154 cases (1,3%), UV-pulsations were recorded intra abdominally, and in 83 cases (0,7%) pulsations were seen in the umbilical cord.
Cases were also divided into 5 groups, based on their DV PIV Z-score level, and figure 10 displays the prevalence of UV pulsations for the different DV PIV groups (see also Table 1 of study I). The prevalence of single and double UV-pulsations (of any location) was recorded for the different DV PIV groups and the results are listed in Table 2 of study I.
Figure 10: Occurence of umbilical venous pulsations (%) (any type or location), for different levels of DV Z-scores.
An increasing DV PIV Z-score increased the OR for occurrence of UV-pulsations. This increase in pulsation rate was also seen when single and double pulsations were analyzed separately. These result are consistent with those of previous studies75 and support the theory that opening of the DV in hypoxia affects pulse propagation from fetal central veins into the UV.
The distribution of UV-pulsations (any type or location, intra-abdominally and in the umbilical cord) in relation to DV PIV Z-scores is presented in figure 11.
c)

37
Figure 11: Rate of UV-pulsations (%) in relation to DV Z-score level. a) any type of pulsation, b) intra abdominal UV-pulsations (single or double), c) UV-pulsations in the umbilical cord (single or double).
DV PIV Z-score levels were also studied in relation to placental resistance (blood flow class - BFC 0-3). The proportion of fetuses with a DV PIV > 2 SD increased with increasing BFC class, as did the prevalence of UV-pulsations. In cases of ARED blood flow in the UA, 34 out of 49 fetuses had a DV PIV Z-score of >2 and pulsations were found in 36 out of 49 cases. In 13 of these cases double pulsations were seen both in the intra-abdominal part and in the cord (data not shown). These are expected results as an augmentation in placental resistance increases the risk of fetal hypoxia, need for redistribution of blood flow and increased central venous pressure.
In the group with DV PIV Z-scores ≥4, 53.7% had a steady blood flow in the UV (Table 1 of study I). Cases with the greatest DV PIV pulsatility are expected to display a high degree of UV-pulsations that arise in response to changes in the DV. As the vessels are interlinked and an increase in DV pulsatility occurs at an earlier stage of fetal compromise as compared to UV-pulsations, elevated DV levels are expected to occur more frequently than UV-pulsations. The propagation of pressure waves depends on several factors, i.e. the compliance and elastic properties of the vessel wall, the geometry of the vessel, (factors all influencing the impedance), the viscosity of the blood and the length and inlet diameter of the vessel.76 The proportion of the wave reflected when traveling from the DV to the UV depends on the level of change in impedance that occurs at the junction between the two vessels, but studies on these factors are beyond the scope of this work.
Methodological errors, resulting in an overestimation of the DV PIV, may however contribute to the findings that even at a high degree of DV pulsatility, the UV flow is often kept steady. Placing the gate at the isthmic part of the vessel (from where the reference ranges have been established) is essential as the blood flow has a more pulsatile pattern in the part of the vessel closest to the IVC.72

38
Mistaking the DV for the middle hepatic vein (MHV) is another possibility, due to the close anatomical relation of the two vessels. The MHV has a similar, yet more pulsatile flow and, if measured instead of DV, gives the impression of a pathological PIV in the DV. The fetal heart rate also influences the pulse waveform in the IVC and DV, as described by Reed et. al.77 and Gudmundsson et. al78. In both tachy- and bradycardia the percentage of reverse flow during atrial contraction was increased, rending a more pulsatile pattern in the DV. Finally, uterine contractions, fetal breathing movements and the fetal position may all influence the DV PIV.
UV-pulsations and normal DV PIV There were no cases of double pulsations in the umbilical cord and a normal DV PIV, but an unexpected finding was the presence of double pulsations intra abdominally in nine cases with a DV PIV Z-score of < 1.5. Pregnancy outcome was affected in these cases (see below), indicating that pulsations in the UV is a sign of pathology, even if the DV blood flow velocity profile is normal. It is not evident how these pulsations arise and different factors may contribute in different cases. As previously mentioned, the proportion of a wave reflected at the junction between two vessels depends largely on the change in impedance at the junction. The DV, linking the UV to the IVC, is normally wider at the outlet into the IVC. Pressure waves are therefore transmitted into the DV at this junction and absorbed along the vessels length. If the outlet of the DV is squeezed (due to fetal position or anatomical variations), and the vessel further down is dilated (as in hypoxia), it may be possible for wave transmission into the UV, despite normal PIV values at the DV inlet. The size and compliance of the UV also influence its impedance and thereby the occurrence of pulses in the vessel. UV-pulsations have previously been associated with hyper-coiling of the umbilical cord, entanglement or true knots of the cord.47
In addition, there seems to be a redistribution of arterial abdominal flow during IUGR, with an increased blood flow to the liver from the hepatic arteries and the portal vein, as the UV flow to the right liver lobe is decreased.79 A possible explanation for the findings of UV-pulsations with a normal DV PIV might therefore be a transmission of pulses from the right hepatic artery situated near the UV. Incorrect measurements of the DV may also be responsible.
DV velocity ratios, DV PIV and UV-pulsations The DV PIV is the blood flow velocity index most commonly used during fetal surveillance. However, the individual peak velocities of the DV FVW reflect different events in the cardiac cycle and the DV PIV does not take all of these events into account. Calculations of the indices S/ES, ES/a and S/a were therefore made and investigations of their relation to UV-pulsations and to perinatal

39
outcome were conducted. The results were converted into Z-scores based on gestational age and a Z-score of 2 (corresponding to two standard deviations above the mean) was used as a cut-off.
The median and mean levels of individual DV indices in the presence or absence of pulsations in the UV are shown in Table 1. Differences between the groups were analyzed using the Kruskal-Wallis test. All indices showed a higher median for fetuses with UV-pulsations (intra-abdominal or in the umbilical cord).
Table 1: Mean and median values of DV PIV and velocity ratios in the presence and absence of single and multiphasic UV-pulsations.
The occurrence of UV-pulsations at DV velocity ratios, above or below 2SD, (Z-score >2) was studied and the results are presented in study II (Table 1). A Z-score of > 2 was associated with a significant increase in the rate of UV-pulsations for all indices, except S/a.
An elevated S/ES ratio (Z-score of > 2), corresponding primarily to changes in ventricular systole, was found less frequently compared to ratios reflecting blood flows during atrial contraction in ventricular diastole (DV PIV and S/a), particularly in fetuses delivered at term. The rate was comparable to that of UV-pulsations in the intra-abdominal part of the vein. Double pulsations were also common in fetuses with a S/ES Z-score >2. An S/a ratio of > 2 SD occurred in 53.8% of the cases with a DV PIV Z-score > 1.5 and was almost as common in full-term as in premature fetuses.
UV-pulsations
Single present
None Present (any type (81))
Double absent (41) Double present (40)
DV PIV Z-score
N 277 79 40 39 Mean 2.4 ± 2.0 5.3 ± 7.4 2.8 ± 4.2 7.9 ± 9.0 Median 2.1 3.4 1.8 5.6
S/a Z-score
N 266 80 41 40 Mean 6.3 ± 31.5 33.1 ± 76.7 9.0 ± 27.9 58.4 ± 100.6 Median 2.1 4.4 1.53 9.3
S/ES Z-score
N 277 81 41 40 Mean 1.3 ± 1.2 2.5 ± 5.5 0.79 ± 1.3 4.1 ± 7.4 Median 1.1 1.0 0.55 2.5
ES/a Z-score
N 266 80 41 39 Mean 4.1 ± 21.2 21.2± 51.7 7.2 ± 21.8 35.9 ± 68.0 Median 1.12 3.2 1.8 6.2

40
The prevalence of abnormal blood flow velocity waveforms in the UA, the uterine artery, the DV, and the UV at different gestational ages in the cohort are displayed in Table 2.
Table 2 Frequency of abnormal Doppler blood flow velocity patterns given as percentage at different gestational age periods. *p<0.05, **p<0.01 and ***p<0.001 for significant difference existing between groups.
Gestational age at birth < 34 weeks 34-37 weeks > 37 weeks Number (total 303) 52 40 211
Abnormal UA PI (>+2SD) 71.2*** 37.5*** 6.8***
ARED flow in UA 34.6*** 5.0*** 0***
Mean uterine PI > 1,2 51.9*** 17.5 16.1***
DV PIV > +2SD 68.6* 66.7 51.7*
DV reversed flow in diastole 15.7*** 0 0.5***
DV S/ES-ratio >+2SD 46.2*** 25.0 17.1***
DV ES/a-ratio >+2SD 57.7*** 27.5 27.3**
DV S/a-ratio > +2SD 67.3* 50.0 50.0*
UV-puls intra-abdominal 69.2*** 22.5 10.5***
Double UV-puls intra-abdominal 36.5*** 12.5 2.9***
UV-puls in the cord 50.2*** 12.5 2.3***
Double UV-puls in the cord 18.4*** 7.5 0.5***
In the group of extremely premature (<34w) fetuses, a DV Z-score of > 1.5 (which was an inclusion criteria for the study) was highly associated with an elevated PI in the UA, ARED flow in the UA and to pulsations in the UV. The prevalence of abnormal pulsatility index (PI) in the UA was 71.2%, while among full-term fetuses it was 6.8%, even though 51.7% of fetuses in this group displayed a DV PIV Z-score of > 2. For full-term fetuses, the prevalence of UV-pulsations was 10.5% and for extremely premature fetuses it was 69.2 %.
Particularly at full term, the S/ES ratio reflecting blood flow during ventricular systole, was less frequently abnormal (> 2SD) compared to diastolic indices (Table 2). Even though less frequent, abnormal S/ES ratios were associated with presence of umbilical vein pulsations (study II, Table 1) and adverse perinatal outcome. A recent study showed that the S/ES ratio was related to cardiac function while a-wave related ratios and the DV PIV were not.80 A high S/ES-ratio implies a severe decrease in forward flow during ventricular end-systole. This decrease could be due to several factors, including increased afterload in cases of high placental resistance, decreased preload due to a lower blood volume, decreased

41
cardiac compliance or contractility and heart failure81 and this is consistent with it being a ratio affected later in the process of fetal demise.
Analysis of the occurrence of UV-pulsations for different levels of the DV velocity ratios were made after classifying pulsations as single or double and dividing them depending on location (data not shown). In the group of fetuses with a S/ES Z-score of > 2, 11.8 % had double pulsations in the umbilical cord, and 25% had double pulsations intra abdominally, which were the highest levels found for any index. However, for all indices, except DV PIV, double pulsations were seen in the cord even when a Z-score of < 2 was found, which might suggest that DV PIV reflects opening of the DV more than the other indices.
The association between the DV velocity ratios, the DV PIV and pulsations in the UV was studied with logistic regression analysis with UV-pulsations as the explanatory variable. When pulsation of any type and location was studied, only the DV PIV Z-score had a significant main effect on the odds ratio (OR) of occurrence of UV-pulsations (B=0.272, p=0.005). The effect of the different indices on UV-pulsations, classified by the type and location of pulsation, was also studied. Regarded as main effect, only the DV PIV significantly increased the OR of both single and multiphasic pulsations in the umbilical cord, irrespective of the other velocity ratios.
Perinatal outcome in relation to DV blood flow and UV-pulsations
For analysis of perinatal outcome, cases with chromosomal abnormalities, cardiac malformations and multiple pregnancies were excluded (see figure 9) In general, less than one day passed between examination and delivery in cases of ARED flow in the UA; less than 2 days when there were UV-pulsations; and less than 6 days in cases with abnormal DV blood flow velocity without UV-pulsations. Doppler ultrasound of fetal blood flow was one of several methods used for fetal surveillance and decisions on delivery were based on several factors including gestational age, CTG, oligohydramniosis and failure to grow. Perinatal outcome in relation to occurrence of pulsations in the intra-abdominal part of the UV or in the UV of the cord (classified as single or double) is given in Table 4 of study I. Significant differences were seen between the groups for the following outcome variables: gestational age at delivery, birth weight and birth weight deviation from the mean, pHv, BEv, prevalence of SGA, 5-min Apgar score < 7 and admission the neonatal intensive care. The outcome tended to be worse in cases with UV-pulsations extending into the cord.

42
Figure 12: The odds ratio for occurence of SGA, preterm delivery and 5-min Apgar of < 7 in the presence and absence of UV-pulsations (any type or location).
The OR for SGA, 5-min Apgar < 7 and preterm delivery in the presence of UV-pulsations (when studied as main effect, regardless of DV PIV Z-score group) are shown in figure 12.
Perinatal outcome was also studied (study I) for the different groups of DV PIV Z-scores in the absence and/or presence of UV-pulsations and the results are shown in Table 5 of study I. Perinatal outcomes that were significantly related to UV-pulsations or DV PIV Z-score group (when studied as main effects) are listed below in Table 3.
Table 3 Outcome variables, for which influence was seen for UV-pulsations and DV PIV Z-score group respectively, when studied as main effect (see Table 5 in study I in appendix)
UV-pulsation DV PIV Z-score group Significant influence seen in the following outcome variables
Gest. age at delivery Gest. age at delivery Birth weight Birth weight pHa Prevalence of preterm delivery pHv BEv Prevalence of SGA Prevalence of Apgar < 7 at 5 min. Prevalence of preterm (<37 w) delivery

43
Frequencies of adverse perinatal outcomes in fetuses with abnormally high DV PIV, S/ES-, S/a- and ES/a-ratios (Z-score >2) were investigated and compared to outcomes of fetuses with Z-scores < 2. The results are displayed in Table 3 of study II.
When divided by gestational age (≥ or < 34 weeks), UV-pulsations, elevated S/ES and DV PIV, were associated with pHa < 7.1, pHv < 7.2 and NICU admission in late premature and full term fetuses. In this group, the other indices did not affect occurrence of any outcome variables. In the group of fetuses with gestational age < 34 weeks, DV PIV and S/ES were associated with an increased perinatal mortality. Sample sizes were however quite small, hampering analysis of the perinatal outcomes that occur rarely.
The effect of the different DV indices, the DV PIV and UV-pulsations on perinatal outcome was also studied using regression analysis with results comparable to those in Table 3 in study II. When studied as main effect, UV-pulsations were the variable most often associated with adverse perinatal outcome. The associations between abnormal ratios, presence of UV-pulsations, and adverse perinatal outcome were studied with binary logistic regression analysis with gestational age as a covariate. An S/ES ratio of > 2 SD, DV PIV > 2SD and all types of pulsations were associated with pHa < 7.1 and pHv < 7.2. S/ES > 2 SD was also associated with SGA. The DV ratios S/a and ES/a were not significantly associated to any adverse perinatal outcome variables when adjustments for gestational age were made.
A few fetuses displayed UV-pulsations and normal DV PIV-levels and this finding was associated with adverse perinatal outcome (described in detail in studies I and II). This fact indicates that pulsations in the UV constitute a pathological sign, even when the DV PIV is normal.
In study II, 15 fetuses had reversed blood flow in the DV during atrial contraction. This group had a poor outcome with a significantly increased frequency of all of adverse outcome variables except for weight deviation < -15% and pH in the umbilical artery < 7.1. In this group of fetuses, 80% (n=12) had pulsations in the UV, and 9 (60%) had multiphasic pulsations.
UV-pulsations have previously been shown to be a late finding in the development of placental insufficiency and fetal hypoxia and more closely related to adverse perinatal outcome than a high DV-PIV.82 Our studies confirm them to be more closely related to adverse perinatal outcome than an elevation in either the DV PIV or any other DV velocity ratio. The weak association between a DV PIV of > 2 SD, UV-pulsations and other signs of fetal compromise at term may have several explanations. Lower tolerance for abnormalities of Doppler findings and other pregnancy complications and a lower threshold for delivery at term probably explain why the more severe blood flow alterations were seen seldom in this
44
group. Mistaking hepatic veins, which are normally more pulsatile, for the DV, may give an incorrect pathological result. Also, placing the sample close to the IVC might lead to an overestimation of the DV-PIV as reference values are based on the inlet of the DV. Furthermore, fetal breathing, odd fetal position and uterine contractions might also affect the pulsatility of the DV, particularly the a-wave dependent diastolic indices.
A high degree of fetuses with gestational age > 36 weeks at birth were, however admitted to the NICU (34 patients (17%) in the total group, 24% with a DV PIV > 2SD, 31% with S/ES > 2SD and 83% in the presence of pulsations in the umbilical cord), the most common cause being hypoglycemia (diagnosed in 53% of the full-term fetuses admitted to the NICU).
An S/a ratio of > 2 SD, reflecting an altered DV blood flow during atrial contraction, was found frequently, even in absence of alterations in the UA and UV, particularly at term. This finding, however, had a low association to adverse pregnancy outcome and UV-pulsations. As this is a velocity ratio closely related to the DV-PIV and the one used for identification of fetal compromise prior to the emergence of the DV-PIV,83 this was unexpected. Changes in fetal central venous pressure and diastolic heart function might appear earlier in the process of fetal deterioration, compared to systolic changes. End-diastolic a-wave related indices might also be more susceptible to technical errors, compared to other indices. In addition, the cut-off level (+2SD) perhaps accounts for the findings and an ROC-curve (not shown) of S/a and UV-pulsations suggests that a Z-sore of 4.2 might be a cut-off level that better corresponds to an increased odds of pulsations.
Limitations of studies I and II Studies I and II were retrospective investigations on examinations previously performed. A weakness in these studies is that some of the outcome variables studied (i.e. e. gestational age at delivery, birth weight, prematurity and c. section) are consequences of the action of the managing physician. As the obstetrician knew the results of the blood flow investigation, levels of DV PIV Z-score and presence of UV-pulsations might have influenced the management of the patient and timing and method of delivery. The retrospective design, the impact of gestational age on perinatal outcome and the rare occurrence of several of the blood flow abnormalities and adverse perinatal outcomes also hamper analysis of associations between blood flow velocity patterns and perinatal outcome. Another limitation is that an investigation of DV PIV was only performed in 11965 of the 58 878 cases in the database. The vast majority of these examinations were performed before examination of DV PIV was routinely used in clinical practice. However, there is risk of selection bias, including more severe cases in the study.

45
Conclusions studies I and II
In conclusion, our studies show that the occurrence of UV-pulsations increases greatly with increasing DV PIV and that abnormal velocity ratios in the DV (S/ES, S/a and ES/a) are also associated with the presence of UV-pulsations. However, particularly in full-term fetuses, increased DV PIV and DV velocity ratios are often observed in the absence of UV pulsations or other indications of fetal compromise.
UV-pulsations seem to be an indicator of fetal compromise regardless of level of DV PIV and we did not find any substantial interactive, additive effects of the DV PIV Z-score and UV-pulsations on perinatal outcome, when occurring simultaneously. When indices taking into account individual systolic and diastolic peak velocities (S/a, S/ES, ES/a) in the DV were investigated, none seemed superior to UV-pulsations in predicting adverse perinatal outcome. A high S/ES ratio, reflecting changes in blood flow during ventricular systole, was seen much more seldom compared to ratios taking into account velocities of ventricular diastole, and was associated with several adverse perinatal outcome variables. Our results are consistent with those of earlier studies, where UV-pulsations were found to be a late finding in fetal chronic hypoxia and associated with adverse perinatal outcome. The factors influencing propagation of pulses through the DV and the mechanism behind pathological pulsations in the umbilical vein in fetuses exhibiting normal pulsatile pattern in the DV remain to be further investigated.
Study III and IV
Patient characteristics
In the control group, 248 out of the 250 pregnant women, originally recruited to the study were included for analysis (one patient was excluded due to early-onset pre-eclampsia and intrauterine growth restriction and one due to technical problems). The range of gestational ages was from 19 to 42 weeks. DV PIV was recorded in 143 of the controls, all results contained within the normal reference range.
The study group consisted of 38 patients in study III and 40 patients in study IV, all with signs of increased flow resistance in the UA (see articles III and IV). DV PIV was measured in 37 cases in study 3 and in 39 cases in study 4 and Z-scores were calculated. Patient characteristics and information on pregnancy outcome of the two groups are listed in studies III and IV (Table 1 of both papers).

46
Strain, strain rate and velocity measurements
The mean heart rate during recording was 136 (± 9.8) and ultrasound frame rates ranged between 30 and 212 (mean 80.4 ± 33.0). The maximal frame rate obtained decreased with gestational age.
Control Group - Ventricular measurements The right and left ventricles were investigated for global peak longitudinal velocity, strain and strain rate. Results for the control group (mean and standard deviation (SD)) are presented in Table 4.
Table 4: Results from the control group. Mean values and standard deviations of peak global longitudinal strain, strain rate and velocity of the right and left ventricles of the control group. N = number of cases, SD = standard deviation
Right ventricle Left ventricle
strain (%)
strain rate (s-1)
velocity (cm/s)
strain (%)
strain rate (s-1)
velocity (cm/s)
N Valid 248 248 248 248 248 248 Mean -14.63 -2.01 1.66 -15.14 -2.12 1.66 SD 4.07 0.58 0.50 4.0 0.59 0.52
No significant differences were found between strain values of the right and left ventricles (paired sample t-test). The strain rate of the left ventricle was slightly greater compared to the right ventricle (mean -2.12 and -2.01, respectively, p=0.006). Measured strain and strain rate values were unaltered and velocities of ventricular wall movements increased with gestational age.
Fetal heart rate had no effect on the calculated ventricular strain. The measured velocities of both ventricles decreased slightly with increasing heart rate, while strain rate increased slightly in both ventricles.
The VVI technique enables measurements of different segments of the heart and Table 5 displays strain values for the basal segments of the right and left ventricles.

47
Table 5 Mean peak strain, strain rate and velocity values of the basal segments of the right and left ventricles respectively.
Right ventricle Left ventricle strain (%)
±SD strain rate (s-1) ±SD
velocity (cm/s) ±SD
strain (%)±SD
strain rate (s-1) ±SD
velocity (cm/s) ±SD
Basal free wall
-19.8±10.3 -2.7± 1.4 2.5 ±1.1 -17.0±9.4 -2.4±1.3 2.2±0.98
Basal septal wall
-14.9±7.5 -1.9±1.0 -1.9±0.8 -11.5±7.7 -1.8±0.9 1.8±0.8
For investigations of fetal ventricles, recent studies employing speckle-tracking techniques have described normal values for global and regional deformation. Estimates of LV mean peak global strain values range from -15 to -25, and of the RV from -16 to -24. These studies employed a variation of study protocols, with fetuses of different gestational ages, and used different softwares for speckle-tracking analysis.84-88 Age-specific reference values, adapted to the ultrasound equipment and software employed are mandatory if this new method is to be of use in clinical practice.
We used global measurements of strain and strain rate for analysis, as opposed to estimates regional cardiac wall deformation for two reasons; Inadequate spatial resolution is a potential limitation of the method and measurements of strain are not recommended if the distance between adjacent segments is less than 2-5 mm apart.61 Segmental dysfunction is also less likely in the fetus, compared to in adults with coronary heart disease.
Image acquisition was obtained preferentially from the apical or basal view. However, if due to fetal positioning, this was not feasible, the angle available during examination was used. To assess if the insonation angle affected recordings of velocity, strain and strain rate, the results were divided into 5 groups, based on angle of acquisition (apex, base, side, apex (slightly angled) and base, (slightly angled)) and compared. For LV strain and strain rate, a significant difference was seen between the groups. Images acquired from the side had significantly greater values compared to images acquired from the base (slightly angled). For the RV, strain values obtained from the apex were significantly greater than those obtained from the base (slightly angled). In the RV, for measurements of velocity and strain rate, no significant differences were seen between the groups.
In concurrence with previous studies, a significant effect of frame rate was seen on strain and strain rate (in both ventricles), with values increasing with rising frame rates. No significant effect was seen for the measured velocities of the ventricular walls. The optimal frame rate for fetal analysis is unknown. In adults frame rates
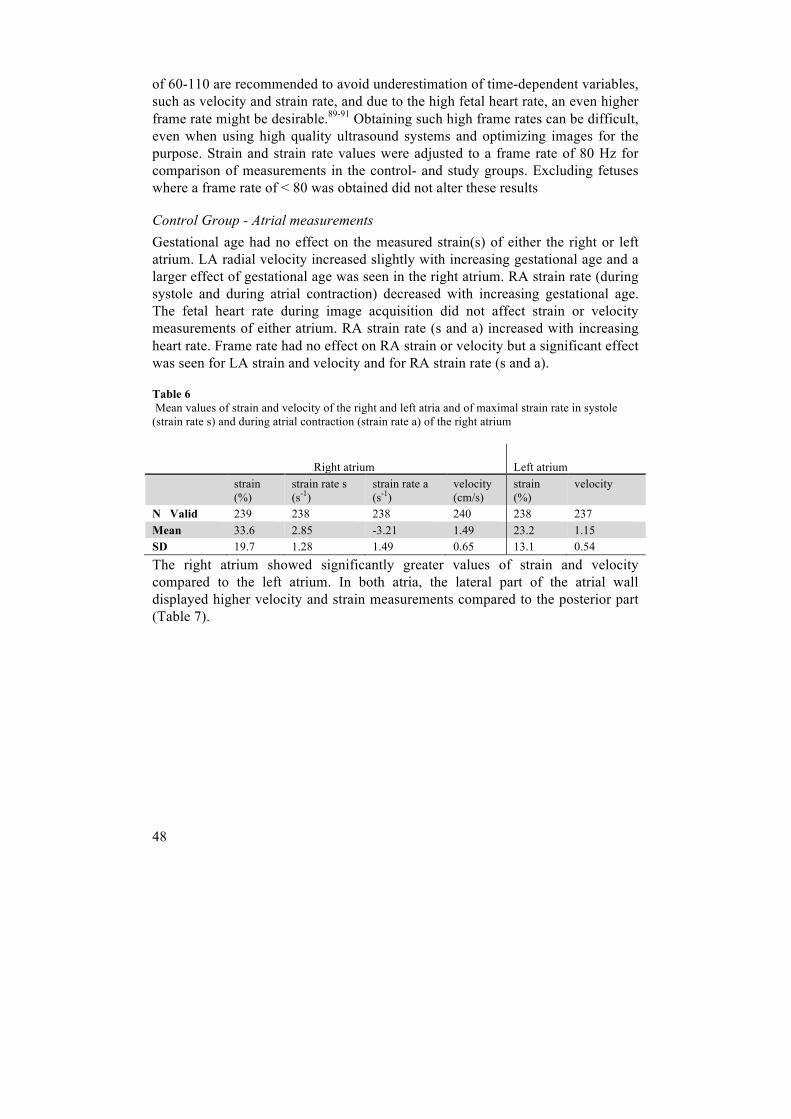
48
of 60-110 are recommended to avoid underestimation of time-dependent variables, such as velocity and strain rate, and due to the high fetal heart rate, an even higher frame rate might be desirable.89-91 Obtaining such high frame rates can be difficult, even when using high quality ultrasound systems and optimizing images for the purpose. Strain and strain rate values were adjusted to a frame rate of 80 Hz for comparison of measurements in the control- and study groups. Excluding fetuses where a frame rate of < 80 was obtained did not alter these results
Control Group - Atrial measurements Gestational age had no effect on the measured strain(s) of either the right or left atrium. LA radial velocity increased slightly with increasing gestational age and a larger effect of gestational age was seen in the right atrium. RA strain rate (during systole and during atrial contraction) decreased with increasing gestational age. The fetal heart rate during image acquisition did not affect strain or velocity measurements of either atrium. RA strain rate (s and a) increased with increasing heart rate. Frame rate had no effect on RA strain or velocity but a significant effect was seen for LA strain and velocity and for RA strain rate (s and a).
Table 6 Mean values of strain and velocity of the right and left atria and of maximal strain rate in systole (strain rate s) and during atrial contraction (strain rate a) of the right atrium
Right atrium Left atrium strain
(%) strain rate s (s-1)
strain rate a (s-1)
velocity (cm/s)
strain (%)
velocity
N Valid 239 238 238 240 238 237 Mean 33.6 2.85 -3.21 1.49 23.2 1.15 SD 19.7 1.28 1.49 0.65 13.1 0.54 The right atrium showed significantly greater values of strain and velocity compared to the left atrium. In both atria, the lateral part of the atrial wall displayed higher velocity and strain measurements compared to the posterior part (Table 7).

49
Table 7 Velocity, strain and strain rate measurements from the lateral and posterior halves of the right and left atrial walls of the control group and study group.
Control group Study group Mean SD Mean SD RAvelocity lateral 1.77 0.87 1.23 0.77 posterior 0.86 0.56 0.52 0.31 LAvelocity lateral 1.22 0.63 0.94 0.68 posterior 0.62 0.49 0.44 0.32 RAstrain(s) lateral 54.19 35.67 47.76 26.51 posterior 22.95 22.29 13.56 11.89 LAstrain(s) lateral 19.79 16.12 18.15 16.25 posterior 14.0 14.2 11.35 12.84 RAstrain rate(s) lateral 3.93 2.2 3.31 1.75 RAstrain rate(a) lateral -4.58 2.64 -3.99 2.44
This is the first study to present an analysis of atrial movements using a speckle-tracking technique. Reference ranges obtained were in line with those previously reported in adults.92
Technical issues Intraclass correlation (ICC) was calculated from repeated measurements. For the RA, it was 0.86 for velocity, 0.74 for strain rate(s), 0.82 for strain rate(a) and 0.31 for strain. For measurements of the LA, ICC was 0.93 for velocity and 0.57 for strain. For atrial measurements, strain measurements also displayed a wide distribution. For the RV, ICC was 0.48 for strain and for LV strain it was 0.54. The obtained frame rate of the image did not affect reproducibility. A low reproducibility in repeated measurements has been a concern in several studies by other groups, using VVI as well as other speckle tracking techniques. Cripsi et. al recently demonstrated good reproducibility for estimations of ventricular 2-D strain. They used the Echo-Pac system and employed a protocol where 10-12 cardiac cycles were investigated and the obtained measurements averaged. This approach, had it been applied, might have improved reproducibility in our study. The challenges involved with the technique are however several. Despite good quality B-mode images, obtaining a correct trace of the small fetal ventricles, not including the papillary muscles is difficult. The small distances between the tracking points also raise questions about its spatial resolution.
Comparison of the control group and study group For the ventricles, all 38 cases of the study group were analyzed successfully. Figure 13 shows LV and RV strain of the control- (stars) and study group (circles), plotted against gestational age. The estimated curves corresponding to the mean ±

50
2SD of the control group are shown. For the ventricles, data were adjusted for frame rate (see above).
Figure 13: Strain of the left and right ventricles of the control group (stars) and results from fetuses with increased umbilical artery vascular impedance (circles) plotted against gestational age in weeks. Curves corresponding to the mean ±2 SD of the control group are shown.
No differences were seen in fetal ventricular strain, velocity or strain rate between the groups.
In the study group RA strain(s) and velocity were successfully measured in 92.5%, LA strain(s) and velocity in 95% and RA strain rate(s and a) in 92.5% of cases. Atrial strain, velocity and right atrial strain rate were compared between the two

51
groups and results from the study group were evenly distributed within the reference range (see figure 13).
Figure 14: Measurements of peak average radial velocity and longitudinal strain of the right atrium. Results from the control group (stars) and results from fetuses with increased umbilical artery vascular impedance (circles) are plotted against gestational age. Curves corresponding to the mean ±2 SD of the control group are shown.
The mean values of strain, strain rate and velocity of the ventricles and atria of the study group and control group were also compared and adjustments for gestational age, frame rate and birth weight deviance from mean were made. No difference was observed between the groups.

52
The heart is a central organ in the fetal adaptive mechanisms to hypoxia. Studies have shown that cardiac output is maintained until late in the process of fetal demise but signs of subclinical cardiac dysfunction have been observed early in the process of growth restriction and placental insufficiency.3-5, 29, 33, 93, 94 We wanted to investigate if alterations in cardiac deformation could be detected in fetuses with impaired placental function, using the speckle tracking analysis software VVI. Peak global longitudinal strain, strain rate and velocity values of the right and left ventricles and atria do not seem to differ between the control and study groups, which indicates that cardiac wall deformation might be spared long in the process of fetal demise.19, 21
Strain analysis reflects the deformation of a segment, a ventricle or an atrium. How to physiologically and clinically interpret the results is not always straightforward. The degree of deformation depends on the force developed by the myocardium, but it is also determined by the working conditions (loading), tissue properties (elasticity) and the interaction of different cardiac segments.9 An integrated assessment of force, deformation, local and global geometry, and interaction with the environment is needed in order to fully assess the performance of an individual heart. Cardiac wall deformation contains longitudinal, circumferential and radial components, reflecting its muscle architecture. Different disease processes might independently affect these different components. Comparing results from studies, investigating various aspects of cardiac performance, is therefore difficult.
In IUGR, the amount of cardiac output that needs to be generated increases, as the afterload, particularly of the RV is increased. The ventricles remodel to cope with this. The ventricular cavity may be enlarged by dilatation and contractility can be slightly increased by hypertrophy. A slow chronic increase in volume load may therefore result in maintained, or even increased strain. A disadvantage of increasing the ventricular size is that this changes the geometry and alters the local curvature resulting in an increase in local wall stress with unaltered intra-cavitary pressure. A late effect of this is damage to myocytes and altered matrix proteins resulting in fibrosis and cell death. However, peak global longitudinal strain of the ventricles might be affected late in the process of fetal demise due to placental insufficiency as compared to the more volume dependent measures of peak annular displacement and MPI.95 Volume based parameters are highly load-dependent and changes in pressure and overall volume displacement will influence them independently of intrinsic contractility. In order to interpret results, information on loading conditions is required.
There was no correlation between right or left ventricular strain and DV PIV, or for RA velocity, strain or strain rate (s or a). UV-pulsations were seen in 10 cases

53
and showed no correlation to altered right or left ventricular or atrial strain, velocity or strain rate.
An increased pulsatility of DV blood flow may be due to opening of the shunt or to increased central venous pressure as a reflection of cardiac dysfunction, or both.7, 96 In moderate chronic hypoxia, the DV seems to open, with concurrent increased pulsatility, without signs of altered cardiac strain. Opening of the DV increases the flow of oxygenated blood mainly to the left side of the heart to supply, preferentially, the coronaries and the brain, exerting a heart-sparing effect. The number of cases with severely altered blood flow velocity patterns was low in the present material, hampering detection of possible alterations in deformation or velocity in very severe cases. In moderate hypoxia however, strain seems to be unaltered.
Problems in interpreting the findings of these studies include the potential pitfalls of VVI, a method not validated in the fetus, and originally designed for use in adult cardiology. As it is based on offline analysis of recorded B-mode images, the performance of the method reflects the quality of the available images to a great extent. Tracking of the endocardium of the fetal heart poses several challenges; the small size of the heart, a high heart rate, variable orientation of the fetus, fetal motion, the distance of the ultrasound probe from the fetal heart, and, at times, increased ultrasound absorption due to maternal adiposity, are all factors that can affect image quality and decrease tracking feasibility. As the size of the heart is small, variation in placement of the tracking points greatly affects the measured strain of the structure and despite high quality images this study obtained low reproducibility for strain and strain rate measurements of the ventricles.
Conclusions study III and IV
Employing Velocity Vector Imaging, a speckle tracking technique, estimations of deformation and velocity of the fetal atria and ventricles in a cohort of healthy fetuses and in fetuses with impaired placental function were obtained. Application of the technique for estimating atrial wall movement seemed to be feasible, which has not previously been shown. We did not find any alteration in peak global longitudinal strain, strain rate or velocity (for right or left ventricles and atria), in fetuses with signs of impaired placental function, compared to a cohort of healthy fetuses. There was also no correlation between right or left ventricular or atrial strain, strain rate or velocity and pulsatility index of the DV. This indicates that the DV might dilate in moderate chronic hypoxia without altered cardiac strain being present and that deformation of the myocardium (strain) and rate of deformation (strain rate) might be affected late in the process of fetal demise. However,

54
questions remain regarding the techniques optimal frame rate, reproducibility and spatial resolution, when applied in the fetus.
55
Summary in Swedish
I samband med graviditet genomgår livmodern stora förändringar och uppvisar en enorm anpassningsförmåga. Den erbjuder en plats som är väl skyddad mot infektioner, yttre våld, och annan påverkan och tillgodoser det växande barnets behov av näringämnen och syre. All syre- och näringstillförsel sker via den snillrika konstruktion som utgörs av mammans livmoder, den gemensamma moderkakan och barnets navelsträng. Funktionen i detta intrikata, tillfälliga organsystem och effekterna när det sviktar är fokus för mycket forskning.
Vid begränsad tillgång på syre och näring har barnet flera sätt att snåla med sina resurser. Mindre tillväxt är första åtgärden. I ett senare skede kan blodet i cirkulationen omfördelas så att de organ som är viktigast för överlevnad prioriteras. Förhållandevis mer blod går till hjärta och hjärna på bekostnad av bland annat lungor, armar, ben, njurar och lever. Ofta kan dessa mekanismer kompensera under lång tid, men vid uttalade förändringar uppkommer syrebrist även i de mest vitala organen och bestående skador kan uppstå. Om detta inträffar tidigt i graviditeten kan barnet behöva förlösas mycket prematurt, vilket medför risk för flera allvarliga komplikationer, både på kort och lång sikt. Ett flertal studier har funnit samband mellan låg födelsevikt och ökad risk för kroniska sjukdomar, såsom hjärt-kärlsjukdomar, diabetes och kronisk obstruktiv lungsjukdom, senare i livet.
Doppler ultraljud används idag rutinmässigt för undersökningar av flödet i både fetal och maternella blodkärl. Barn som är små beroende på genetiska förutsättningar kan härmed särskiljas från de med dålig tillväxt orsakad av bristande moderkaksfunktion. Det är emellertid en fortsatt utmaning att i tidig graviditet avgöra vilka tillväxthämmade foster som löper risk för allvarlig syrebrist och genast bör förlösas, och vilka som gynnas av att utvecklas i livmodern under ytterligare en period.
I samband med den omfördelning av blod som sker vid syrebrist, ökar flödet i ett blodkärl som är unikt för den fetala cirkulationen, ductus venosus (DV). Detta kärl bildar en direkt länk från navelvenen (transportören av syrerikt blod från moderkakan) till hjärtats högra förmak. Via en annan fetal struktur (foramen ovale), shuntas det syrerika blodet vidare till vänster förmak, vänster kammare och

56
fördelas sedan till kroppens organ, i första hand de prioriterade organen hjärta och hjärna.
Blodflödet i DV är normalt sett pulserande och avspeglar de tryckvågor som bildats i höger förmak i samband med hjärtats kontraktioner och som fortplantas längs de centrala venerna.
Två toppar med ökade blodflödeshastigheter (S och D) och två dalar med minskande hastigheter (ES och a) ses under ett hjärtslag. S motsvarar kontraktionen i hjärtats kammare (systole), då förmaken fylls med blod och D början av kamrarnas relaxationsfas (diastole), då klaffarna mellan förmak och kammare öppnar sig och förmaken töms. ES uppträder i slutet på systole när fyllnadsgraden i förmaken är hög och a i samband med förmakskontraktion. I klinisk praxis används främst ett index (PIV) för utvärdering av flödet i DV. Detta index beräknas som maxhastigheten i (S-a)/medelhastigheten över en hjärtcykel. Det ökar vid ökande pulsatilitet men avspeglar inte helt de olika faserna av flöde (beskrivna ovan) under en hjärtcykel. Andra potentiellt användbara DV-index är S/ES, ES/a och S/a.
Vid syrebrist vidgas DV och pulsationerna kan då bli kraftigare och nå längre perifert i cirkulationen. I uttalade fall ses även pulsationer i navelvenen, det blodkärl som matar DV med syrerikt blod och vars flöde normalt är jämnt. Både ökad pulsatilitet i DV och pulsationer i navelvenen har visats vara förknippade med syrebrist hos barnet och med sämre prognos. Många studier har genomförts avseende blodflödet i DV medan blodflödet i navelvenen är mindre utforskat.
DV-pulsatiliteten kan också vara ökad vid nedsatt hjärtfunktion och vid ökat tryck i den centrala cirkulationen, men förhållandet mellan DVs flöde och hjärtfunktion är ofullständigt studerat.
I delarbete I och II undersöktes i ett stort retrospektivt material, samband mellan blodflöde i navelven och DV, varvid förhållandena mellan DV PIV, S/ES, ES/a, S/a och navelvensflöde analyserades. Som förväntat ökade frekvensen av pulsationer i navelvenen med ökande pulsatilitet i DV PIV. Förhöjda nivåer av de övriga indexen var också associerat med ökad frekvens navelvenspulsationer. Ökad pulsatilitet i DV sågs dock ofta, även vid avsaknad av navelvenspulsationer eller andra tecken på fosterpåverkan, särskilt i fullgången graviditet.
Pulsationer i navelvenen var en indikator på fosterpåverkan oavsett DV PIV och var den faktor som var starkast associerad med dåligt perinatalt utfall. Även de enstaka fall, där pulsationer i navelvenen förekom trots normalt DV-flöde, var associerade med flera negativa utfallsvariabler. Detta styrker tidigare fynd av navelvenspulsationer som ett tecken på långt framskriden fosterhypoxi. Förhöjning av S/ES, det DV index som främst avspeglar flödet i systole, var betydligt mer sällsynt jämför med de andra studerade indexen, särskilt i fullgången

57
graviditet, och var associerat med ogynsamt perinatalt utfall. Vi fann också att S/a, det index som främst påverkas av DV-flödet under förmakskontraktioner frekvent var förhöjt, speciellt vid fullgången graviditet. Associationen till negativt perinatalt utfall var svagare än för de andra studerade variablerna, vilket indikerar att flödet i samband med hjärtats förmakskontraktion påverkas tidigt vid syrebrist.
Hjärtat har en central roll vid anpassning till olika livsbetingelser och vid uttalad syrebrist uppträder tecken till hjärtsvikt. I vissa studier har man sett tecken på förändrad hjärtfunktion redan vid tidiga stadier av svikande moderkaksfunktion. Utvärdering av barnets hjärtfunktionen skulle därför kunna vara ett komplement till dagens metoder för fosterövervakning. Att på ett objektivt sätt mäta hjärtfunktionen hos ett ofött barn är dock förknippat med ett flertal svårigheter, då hjärtat är litet, blodvolymerna är små och cirkulationen skiljer sig avsevärt från de postnatala förhållandena. Nya metoder för att upptäcka tidiga tecken till hjärtsvikt utvärderas kontinuerligt.
Delarbete III and IV syftade till att applicera en ny metod, kallad ”speckle tracking”, för skattning av hjärtfunktionen hos foster. Metoden är framtagen inom vuxenkardiologi där den har visat sig kunna registrera subtila förändringar i hjärtmuskulaturens rörelse. Med utgångspunkt i en 2-dimensionell ultraljudsbild kan hastigheten i hjärtväggarnas rörelser samt deformering av muskulaturen (i vilken grad avståendet mellan två punkter i muskulaturen ökar eller minskar) registreras. Friska foster i olika graviditetsveckor och foster med olika grader av dysfunktion i moderkakan undersöktes, referenskurvor utformades för den friska gruppen, och resultaten jämfördes.
Med denna metod befanns hjärtmuskelns rörelse vara likvärdig hos de sjuka och friska barnen, även i fall med uttalade blodflödesförändringar i DV och navelvenen. Dessa resultat talar för att hjärtats pumpförmåga påverkas sent i sjukdomsförloppet vid moderkaksdysfunktion. Hjärtat är ett av de organ som prioriteras högst när blodet som cirkulerar i kroppen fördelas i olika vävnader och verkar kunna upprätthålla funktion under lång tid. ”Speckle tracking” avspeglar dock bara en del av hjärtfunktionen och metoden är fortsatt ofullständigt utvärderad för användning inom prenatalmedicin.

58
Acknowledgements
This work was carried out in the deparment of obstetric and gynecology at Skåne Univeristy Hospital, Malmö. I wish to express my deepest gratitude to all who have contributed to this work, with particular thanks to:
Saemundur Gudmundsson, my supervisor, for your patience, enthusiasm and encouragement throughout the work of this thesis. Thank you for introducing me to fetal cardiology and perinatal research, and for generously sharing your time and knowledge with me.
Gisela Ghosh, my co-supervisor and colleague, for everything you have taught me, from the very first days when I, as a complete rookie, sat my foot in the obstetrics department. I appreciate your support and great advice in both clinical and scientific areas.
Pia Soikeli, Maria Nilsson and Pia Aprea at the prenatal Blood Flow Laboratory for your endless patience when I was working in the lab, for teaching me Doppler examinations, helping me recruiting patients and always offering encouragement and friendliness.
All midwifes at the ultrasound department for recruiting women to the study and for, with warmth, generosity, great knowledge and good spirits being inspirational and fun to work with.
Jan Ilver at MTA for all the technical support.
Tony Lavesson, head of OG in Helsingborg, for your interest in my work, for support, great mentorship and encouragement and for providing me with the time and opportunity to finish this thesis.
Andreas Herbst, Göran Lingman and Gunilla Bodelsson, for when being directors of OG in Malmö and/or Helsingborg, always supporting me, providing research friendly atmospheres and making this work possible.
Povilas Sladkevicius and Kjell Å Salvesen, for reading my manuscripts and for constructive criticism during the “half-time control”.
Colleagues, past and present, for support, encouragement, advice, and for your patience and willingness to take on a greater workload, when I was absent from clinical work.

59
All the staff at the Departments of Obstetrics and Gynecology in Malmö and Helsingborg for encouragement and support and for creating pleasant working environments.
My former and present roommates and colleagues Anna Fernlund, Sara Alson and Kristina Billberg for friendship, many great conversations and for making every workday begin and end on a good note.
Claes Ignell for your interest in my research, for involving me in the medical program in Helsingborg and for keeping me on schedule with the practical aspects of the thesis work.
My dear friend Maria Isacsson for sharing with me, all the joys, challenges, delights and disappointments that the different phases of life have had to offer, and for all the great laughs and good stories.
My friends, you know who you are, for encouragement, patience, support, and many great times.
My family, especially my parents, Karin and Björn, for your love and care, and for your unfailing faith in me. All the practical and psychological support that you’ve given me throughout the years is also not forgotten, and much appreciated.
Mats, my wonderful husband, for all your love, support and patience and for taking care of children, cooking, statistics and proof reading.
Hilda, Vidar and Sigvard for bringing, joy, love, new challenges and experiences to my life every day.
All women who generously volunteered to participate in these studies. Thank you very much for your contribution.

60
References
1. Solt I DMY. Fetal Surveillance Tests. In: Z. E. Z. Blazer S, ed. The embryo: Scientific Discovery and Medical Ethics Basel: Karger; 2005: 291-308. 2. Marsal K. Obstetric management of intrauterine growth restriction. Best practice & research Clinical obstetrics & gynaecology. 2009;23:857-70. 3. Crispi F, Hernandez Andrade E, Pelsers M, Plasencia W, Benavides-Serralde J, Eixarch ELN, F., Ahmed A, Glatz J, Nicolaides K and Gratacos E. Cardiac dysfunction and cell damage across clinical stages of severity in growth-restricted fetuses. Am J Obstet Gynecol. 2008;199:254.e8. 4. Comas M, Crispi F, Cruz-Martinez R, Martinez J, Figueras F and Gratacós E. Usefulness of myocardial tissue Doppler vs conventional echocardiography in the evaluation of cardiac dysfunction in early-onset intrauterine growth restriction. American Journal of Obstetrics & Gynecology. 2010;203:45.e1-7. 5. Girsen A, Ala-Kopsala M, Makikallio K, Vuolteenaho O and Rasanen J. Cardiovascular hemodynamics and umbilical artery N-terminal peptide of proB-type natriuretic peptide in human fetuses with growth restriction. Ultrasound Obstet Gynecol. 2007;29:296-303. 6. Godfrey ME, Messing B, Cohen SM, Valsky DV and Yagel S. Functional assessment of the fetal heart: a review. Ultrasound Obstet Gynecol. 2012;39:131-44. 7. Baschat AA. Examination of the fetal cardiovascular system. Semin Fetal Neonatal Med. 2011;16:2-12. 8. Morris KR. et. al. Systematic review and meta-analysis of the test accuracy of ductus venosus Doppler to predict compromise of fetal/neonatal wellbeing in high risk pregnancies with placental insufficiency. European Journal of Obstetrics and Gynecology and Reproductive Biology. 2010:3-12. 9. Bijnens B, Cikes M, Butakoff C, Sitges M and Crispi F. Myocardial Motion and Deformation: What Does It Tell Us and How Does It Relate to Function? Fetal Diagn Ther. 2012;32:5-16. 10. Yagel S SN, Gembruch U. Fetal Cardiology, Embryology, Genetics, Physiology, Echocardiographic Evaluation, Diagnosis and Perinatal Management of Cardiac Diseases. 2009:780. 11. Kiserud T. Physiology of the fetal circulation. Semin Fetal Neonatal Med. 2005;10:493-503. 12. Mavrides E, Moscoso G, Carvalho JS, Campbell S and Thilaganathan B. The human ductus venosus between 13 and 17 weeks of gestation: histological and morphometric studies. Ultrasound Obstet Gynecol. 2002;19:39-46. 13. Kiserud T. The ductus venosus. Seminars in perinatology. 2001;25:11-20.

61
14. Edelstone DI and Rudolph AM. Preferential streaming of ductus venosus blood to the brain and heart in fetal lambs. The American journal of physiology. 1979;237:H724-9. 15. Kiserud T. Fetal venous circulation-an update on hemodynamics. Journal of perinatal medicine. 2000;28:90-6. 16. Kiserud T, Eik-Nes SH, Blaas HG and Hellevik LR. Foramen ovale: an ultrasonographic study of its relation to the inferior vena cava, ductus venosus and hepatic veins. Ultrasound Obstet Gynecol. 1992;2:389-96. 17. Huisman TW, Gittenberger-de Groot AC and Wladimiroff JW. Recognition of a fetal subdiaphragmatic venous vestibulum essential for fetal venous Doppler assessment. Pediatr Res. 1992;32:338-41. 18. Kiserud T, Rasmussen S and Skulstad S. Blood flow and the degree of shunting through the ductus venosus in the human fetus. Am J Obstet Gynecol. 2000;182:147-53. 19. Bellotti M, Pennati G, De Gasperi C, Bozzo M, Battaglia FC and Ferrazzi E. Simultaneous measurements of umbilical venous, fetal hepatic, and ductus venosus blood flow in growth-restricted human fetuses. Am J Obstet Gynecol. 2004;190:1347-58. 20. Tchirikov M, Rybakowski C, Huneke B and Schroder HJ. Blood flow through the ductus venosus in singleton and multifetal pregnancies and in fetuses with intrauterine growth retardation. Am J Obstet Gynecol. 1998;178:943-9. 21. Kiserud T, Kessler J, Ebbing C and Rasmussen S. Ductus venosus shunting in growth-restricted fetuses and the effect of umbilical circulatory compromise. Ultrasound Obstet Gynecol. 2006;28:143-9. 22. Crispi FV-A, B.; Cruz-Lemini, M; Gratacós, E. Ultrasound assessment of fetal cardiac function. Australian Journal of Ultrasound in Medicine. 2013;16:158-167. 23. Reece AH, J. Clinical Obstetrics, the fetus and the mother. 2007:1311. 24. Rasanen J, Wood DC, Weiner S, Ludomirski A and Huhta JC. Role of the pulmonary circulation in the distribution of human fetal cardiac output during the second half of pregnancy. Circulation. 1996;94:1068-73. 25. Mielke G and Benda N. Cardiac output and central distribution of blood flow in the human fetus. Circulation. 2001;103:1662-8. 26. Lindqvist P, Calcutteea A and Henein M. Echocardiography in the assessment of right heart function. Eur J Echocardiogr. 2008;9:225-34. 27. Crispi F and Gratacós E. Fetal cardiac function: technical considerations and potential research and clinical applications. Fetal Diagn Ther. 2012;32:47-64. 28. Sedmera D. Function and form in the developing cardiovascular system. Cardiovascular research. 2011;91:252-9. 29. Kiserud T, Ebbing C, Kessler J and Rasmussen S. Fetal cardiac output, distribution to the placenta and impact of placental compromise. Ultrasound Obstet Gynecol. 2006;28:126-36. 30. Rizzo G, Capponi A, Cavicchioni O, Vendola M and Arduini D. Low cardiac output to the placenta: an early hemodynamic adaptive mechanism in intrauterine growth restriction. Ultrasound Obstet Gynecol. 2008;32:155-9. 31. Martin CB, Jr. Normal fetal physiology and behavior, and adaptive responses with hypoxemia. Seminars in perinatology. 2008;32:239-42.

62
32. Jensen A, Garnier Y and Berger R. Dynamics of fetal circulatory responses to hypoxia and asphyxia. European journal of obstetrics, gynecology, and reproductive biology. 1999;84:155-72. 33. Aburawi EH, Malcus P, Thuring A, Fellman V and Pesonen E. Coronary flow in neonates with impaired intrauterine growth. J Am Soc Echocardiogr. 2012;25:313-8. 34. Neerhof MG and Thaete LG. The fetal response to chronic placental insufficiency. Seminars in perinatology. 2008;32:201-5. 35. Barker DJ, Lampl M, Roseboom T and Winder N. Resource allocation in utero and health in later life. Placenta. 2012;33 Suppl 2:e30-4. 36. Thornburg K, Jonker S, O'Tierney P, Chattergoon N, Louey S, Faber J and Giraud G. Regulation of the cardiomyocyte population in the developing heart. Progress in biophysics and molecular biology. 2011;106:289-99. 37. Americal College of Obstetriciancs and Gynecologists whcp. Practice Bulletine - Clinical management guidelines for Obstetrician-Gynecologists. Obstet Gynecol. 2014;124:182-192. 38. Weldner B. Ultraljud: Studentlitteratur; 1998. 39. ISOUG safety commity. 40. Lee CD, C; Albaiges, G. Making Sense of Obstetric Doppler Ultrasound: Arnold publishers; 2003. 41. Gill RW. Doppler ultrasound--physical aspects. Seminars in perinatology. 1987;11:292-9. 42. Velauthar L, Plana MN, Kalidindi M, Zamora J, Thilaganathan B, Illanes SE, Khan KS, Aquilina J and Thangaratinam S. First-trimester uterine artery Doppler and adverse pregnancy outcome: a meta-analysis involving 55,974 women. Ultrasound Obstet Gynecol. 2014;43:500-7. 43. Sibai B, Dekker G and Kupferminc M. Pre-eclampsia. Lancet. 2005;365:785-99. 44. Almstrom H, Axelsson O, Cnattingius S, Ekman G, Maesel A, Ulmsten U, Arstrom K and Marsal K. Comparison of umbilical-artery velocimetry and cardiotocography for surveillance of small-for-gestational-age fetuses. Lancet. 1992;340:936-40. 45. Giles WB, Trudinger BJ and Baird PJ. Fetal umbilical artery flow velocity waveforms and placental resistance: pathological correlation. British journal of obstetrics and gynaecology. 1985;92:31-8. 46. Guidetti DA, Divon MY, Cavalieri RL, Langer O and Merkatz IR. Fetal umbilical artery flow velocimetry in postdate pregnancies. Am J Obstet Gynecol. 1987;157:1521-3. 47. Karsdorp VH, van Vugt JM, van Geijn HP, Kostense PJ, Arduini D, Montenegro N and Todros T. Clinical significance of absent or reversed end diastolic velocity waveforms in umbilical artery. Lancet. 1994;344:1664-8. 48. Alfirevic Z, Stampalija T and Medley N. Fetal and umbilical Doppler ultrasound in normal pregnancy. The Cochrane database of systematic reviews. 2015;4:Cd001450.

63
49. Beattie RB and Dornan JC. Antenatal screening for intrauterine growth retardation with umbilical artery Doppler ultrasonography. BMJ (Clinical research ed). 1989;298:631-5. 50. Bilardo CM, Nicolaides KH and Campbell S. Doppler measurements of fetal and uteroplacental circulations: relationship with umbilical venous blood gases measured at cordocentesis. Am J Obstet Gynecol. 1990;162:115-20. 51. Arias F. Accuracy of the middle-cerebral-to-umbilical-artery resistance index ratio in the prediction of neonatal outcome in patients at high risk for fetal and neonatal complications. Am J Obstet Gynecol. 1994;171:1541-5. 52. Rowlands DJ and Vyas SK. Longitudinal study of fetal middle cerebral artery flow velocity waveforms preceding fetal death. British journal of obstetrics and gynaecology. 1995;102:888-90. 53. Kiserud T and Eik-Nes SH. Ultrasonic velocimetry of the fetal ductus venosus. Lancet. 1991;338:1412. 54. Hecher K and Campbell S. Characteristics of fetal venous blood flow under normal circumstances and during fetal disease. Ultrasound Obstet Gynecol. 1996;7:68-83. 55. Baschat AA. Arterial and venous Doppler in the diagnosis and management of early onset fetal growth restriction. Early Hum Dev. 2005;81:877-87. 56. Turan OM, Turan S, Berg C, Gembruch U, Nicolaides KH, Harman CR and Baschat AA. Duration of persistent abnormal ductus venosus flow and its impact on perinatal outcome in fetal growth restriction. Ultrasound Obstet Gynecol. 2011;38:295-302. 57. Lees CC, Marlow N, van Wassenaer-Leemhuis A, Arabin B, Bilardo CM, Brezinka C, Calvert S, Derks JB, Diemert A, Duvekot JJ, Ferrazzi E, Frusca T, Ganzevoort W, Hecher K, Martinelli P, Ostermayer E, Papageorghiou AT, Schlembach D, Schneider KT, Thilaganathan B, Todros T, Valcamonico A, Visser GH and Wolf H. 2 year neurodevelopmental and intermediate perinatal outcomes in infants with very preterm fetal growth restriction (TRUFFLE): a randomised trial. Lancet. 2015;385:2162-72. 58. Hofstaetter C, Dubiel M and Gudmundsson S. Two types of umbilical venous pulsations and outcome of high-risk pregnancy. Early Hum Dev. 2001;61:111-7. 59. Savchev S, Figueras F and Gratacos E. Survey on the current trends in managing intrauterine growth restriction. Fetal diagnosis and therapy. 2014;36:129-35. 60. Van Mieghem TD, P.; Steenhaut, P.; Deprest, J. Methods for prenatal assessment of fetal cardiac function. Prenat Diagn. 2009;29:1193-1203. 61. D’hooge J, Heimdal A, Jamal F, Kukulski T, Bijnens B, Rademakers F, Hatle L, Suetens P and Sutherland G. Regional Strain and Strain Rate Measurements by Cardiac Ultrasound: Principles, Implementation and Limitations. Eur J Echocardiogr. 2000;1:154-170. 62. Shah AM and Solomon SD. Myocardial deformation imaging: current status and future directions. Circulation. 2012;125:e244-8. 63. Matsui HG, I.; Kulinskaya, E.; Gardiner, H.M. . Temporal and spatial performance of vector velocity imaging in the human fetal heart. Ultrasound Obstet Gynecol 2011;37:150-157.

64
64. Willruth AM, Geipel AK, Fimmers R and Gembruch UG. Assessment of right ventricular global and regional longitudinal peak systolic strain, strain rate and velocity in healthy fetuses and impact of gestational age using a novel speckle/feature-tracking based algorithm. Ultrasound Obstet Gynecol. 2011;37:143-9. 65. Hernandez-Andrade E, Benavides-Serralde JA, Cruz-Martinez R, Welsh A and Mancilla-Ramirez J. Evaluation of conventional Doppler fetal cardiac function parameters: E/A ratios, outflow tracts, and myocardial performance index. Fetal diagnosis and therapy. 2012;32:22-9. 66. Hernandez-Andrade E Lp-TJ, Figueroa-Diesel H, et al. A modified myocardial performance (Tei) index based on the use of valves clicks improves reproducibility of fetal left cardiac function assessment. Ultrasound in Obstetrics and Gynecology. 2005;26:227-232. 67. Cruz-Martinez R, Figueras F, Benavides-Serralde A, Crispi F, Hernandez-Andrade E and Gratacos E. Sequence of changes in myocardial performance index in relation to aortic isthmus and ductus venosus Doppler in fetuses with early-onset intrauterine growth restriction. Ultrasound Obstet Gynecol. 2011;38:179-84. 68. Cruz-Martinez R, Figueras F, Bennasar M, Garcia-Posadas R, Crispi F, Hernandez-Andrade E and Gratacos E. Normal reference ranges from 11 to 41 weeks' gestation of fetal left modified myocardial performance index by conventional Doppler with the use of stringent criteria for delimitation of the time periods. Fetal diagnosis and therapy. 2012;32:79-86. 69. Tutschek B and Schmidt KG. Techniques for assessing cardiac output and fetal cardiac function. Semin Fetal Neonatal Med. 2011;16:13-21. 70. Gardiner IGH. Assessment of Fetal Myocardial Deformation Using Speckle Tracking Techniques. Fetal Diagn Ther. 2012;32:39-46. 71. DeVore GR and Horenstein J. Ductus venosus index: a method for evaluating right ventricular preload in the second-trimester fetus. Ultrasound Obstet Gynecol. 1993;3:338-42. 72. Kessler J, Rasmussen S, Hanson M and Kiserud T. Longitudinal reference ranges for ductus venosus flow velocities and waveform indices. Ultrasound Obstet Gynecol. 2006;28:890-8. 73. Turan OM, Turan S, Sanapo L, Wilruth A, Berg C, Gembruch U, Harman CR and Baschat AA. Reference ranges for ductus venosus velocity ratios in pregnancies with normal outcomes. J Ultrasound Med. 2014;33:329-36. 74. Turan OM, Turan S, Sanapo L, Rosenbloom JI and Baschat AA. Semiquantitative classification of ductus venosus blood flow patterns. Ultrasound Obstet Gynecol. 2014;43:508-14. 75. Kiserud T, Eik-Nes SH, Blaas HG, Hellevik LR and Simensen B. Ductus venosus blood velocity and the umbilical circulation in the seriously growth-retarded fetus. Ultrasound Obstet Gynecol. 1994;4:109-14. 76. Kiserud T. Hemodynamics of the ductus venosus. European journal of obstetrics, gynecology, and reproductive biology. 1999;84:139-47. 77. Reed KL AC, Anderson CF, Shenker L, Sahn DJ. . Doppler studies of vena cava flows in human fetuses. Insights into normal and abnormal cardiac physiology. Circulation. 1990;Feb;81(2)::498-505.

65
78. Gudmundsson S, Gunnarsson GO, Hokegard KH, Ingemarsson J and Kjellmer I. Venous Doppler velocimetry in relationship to central venous pressure and heart rate during hypoxia in the ovine fetus. Journal of perinatal medicine. 1999;27:81-90. 79. Ebbing C, Rasmussen S, Godfrey KM, Hanson MA and Kiserud T. Redistribution pattern of fetal liver circulation in intrauterine growth restriction. Acta obstetricia et gynecologica Scandinavica. 2009;88:1118-23. 80. Sanapo L, Turan OM, Turan S, Ton J, Atlas M and Baschat AA. Correlation analysis of ductus venosus velocity indices and fetal cardiac function. Ultrasound Obstet Gynecol. 2014;43:515-519. 81. Baschat AA, Turan OM and Turan S. Ductus venosus blood-flow patterns: more than meets the eye? Ultrasound Obstet Gynecol. 2012;39:598-9. 82. Cheema R, Bayoumi MZ and Gudmundsson S. Multivascular Doppler surveillance in high risk pregnancies. The journal of maternal-fetal & neonatal medicine 2012;25:970-4. 83. Rizzo G, Capponi A, Arduini D and Romanini C. Ductus venosus velocity waveforms in appropriate and small for gestational age fetuses. Early Hum Dev. 1994;39:15-26. 84. Barker P HH, Li J, Miller S, Herlong J, Camitta M. Global Longitudinal Cardiac Strain and Strain Rate for Assessment of Fetal Cardiac Function: Novel Experience with Velocity Vector Imaging. ECHOCARDIOGRAPHY:. 2009;26:28-36. 85. Di Salvo G, Russo M, Paladini D, Felicetti MC, B., Tartaglione A, di Pietto L, Ricci C, Morelli C, Pacileo G and Calabro R. Two-dimensional strain to assess regional left and right ventricular longitudinal function in 100 normal foetuses. Eur J Echocardiogr. 2008;9:754-756. 86. Ishii T, McElhinney D, Harrild D, Marcus E, Sahn D, Truong U and Tworetzky W. Circumferential and Longitudinal Ventricular Strain in the Normal Human Fetus. Journal of the American Society of Echocardiography. 2012;25:105-111. 87. Kapusta L, Mainzer G, Weiner Z, Deutsch L, Khoury A, Haddad S and Lorber A. Second trimester ultrasound: reference values for two-dimensional speckle tracking-derived longitudinal strain, strain rate and time to peak deformation of the fetal heart. J Am Soc Echocardiogr 2012;25:1333-1341. 88. Younoszai A, Saudek D, Emery S and Thomas JD. Evaluation of Myocardial Mechanics in the Fetus by Velocity Vector Imaging. Journal of the American Society of Echocardiography. 2008;21:470-474. 89. Nesbitt GC, Mankad S and Oh JK. Strain imaging in echocardiography: methods and clinical applications. Int J Cardiovasc Imaging. 2009;25:9-22. 90. D’Hooge J, Bijnens B, Jamal F, Pislaru C, Pislaru S, Thoen J, Suetens P, Van de Werf F, Angermann C, Rademakers FE, Herregods MC and Sutherland GR. High frame rate myocardial integrated backscatter: does this change our understanding of this acoustic parameter? Eur J Echocardiogr. 2000;1:32-41. 91. Mondillo S, Galderisi M, Mele D, Cameli M, Lomoriello VS, Zaca V, Ballo P, D’Andrea A, Muraru D, Losi M, Agricola E, D’Errico A, Buralli S, Sciomer S, Nistri S and Badano L. Speckle-tracking echocardiography: a new technique for assessing myocardial function. J Ultrasound Med. 2011;30:71-83.

66
92. Jarnert C, Melcher A, Caidahl K, Persson H, Ryden L and Eriksson MJ. Left atrial velocity vector imaging for the detection and quantification of left ventricular diastolic function in type 2 diabetes. European journal of heart failure. 2008;10:1080-7. 93. Hecher K, Campbell S, Doyle P, Harrington K and Nicolaides K. Assessment of Fetal Compromise by Doppler Ultrasound Investigation of the Fetal Circulation. Circulation. 1995;91:129-138. 94. Turana S, Turana OM, Salimb M, Bergc C, Gembruchc U, Harmana CR and Baschat AA. Cardiovascular Transition to Extrauterine Life in Growth-Restricted Neonates: Relationship with Prenatal Doppler Findings. Fetal Diagn Ther. 2013;33:103-109. 95. Bahtiyar MO and Copel JA. Cardiac changes in the intrauterine growth-restricted fetus. Seminars in perinatology. 2008;32:190-3. 96. Baschat AA and Harman CR. Venous Doppler in the assessment of fetal cardiovascular status. Curr Opin Obstet Gynecol. 2006;18:156-163.