fertilizer sector in pakistan (2015)
TRANSCRIPT
2015
Meezan Bank Limited
Risk Management Department
For any feedback or queries, please contact:
M. Taha Ekram [email protected]
[SECTOR STUDY – FERTILIZERS]

Risk Management Department SECTOR STUDY - FERTILIZERS
R e s e a r c h , F I , M a r k e t & L i q u i d i t y R i s k
Page 2
List of Abbreviations
AC Ammonium Chloride
AN Ammonium Nitrate
AS Ammonium Sulphate
CAGR Compounded Annual Growth Rate
CAN Calcium Ammonium Nitrate
DAP Diammonium Phosphate
E&P Exploration and Production
GSA Gas Sale Agreement
IFA International Fertilizer Industry Association
MAP Monoammonium Phosphate
mmcfd Million cubic feet daily
MOP Potassium Chloride
mT Millions of Tons
MT Metric Tons
NFDC National Fertilizer Development Center
NP Nitro Phosphate
PACRA Pakistan Credit Rating Agency
PASSCO Pakistan Agricultural Storage and Services Corporation
SNGPL Sui Northern Gas Pipeline Limited
SOP Potassium Sulphate
SSGC Sui Southern Gas Company Limited
SSP Single Super Phosphate
TSP Triple Super Phosphate
UAN Urea Ammonium Nitrate
USDA United States Department of Agriculture

Risk Management Department SECTOR STUDY - FERTILIZERS
R e s e a r c h , F I , M a r k e t & L i q u i d i t y R i s k
Page 3
Table of Contents
1. Executive Summary.......................................................................................................................... 4
2. Introduction..................................................................................................................................... 5
3. Importance of Fertilizer Industry ...................................................................................................... 6
4. Fertilizer Types & Usage in Pakistan ................................................................................................. 7
5. Fertilizer Production Process............................................................................................................ 8
6. Fertilizers use by type of Crop .......................................................................................................... 9
7. Supply & Demand of Fertilizer Products ......................................................................................... 11
7.1 UREA ...................................................................................................................................... 11
7.2 DAP ........................................................................................................................................ 13
7.3 Other products ....................................................................................................................... 15
7.4 Ammonia ............................................................................................................................... 15
7.5 Factors affecting Prices & Demand of Fertilizer ...................................................................... 16
8. Fertilizer Manufacturers ................................................................................................................ 18
8.1 Fauji Fertilizer Company Limited (FFC) .................................................................................... 19
8.2 Fauji Fertilizer Bin Qasim Limited (FFBL) ................................................................................. 20
8.3 DH Fertilizers Limited (DHCL).................................................................................................. 21
8.4 Engro Fertilizers Limited (EFL)................................................................................................. 22
8.5 Fatima Fertilizer Company Limited (FATF)............................................................................... 23
9. Banking Credit to the Industry ....................................................................................................... 25
10. Gas Crisis ................................................................................................................................... 26
10.1 Coal Gasification..................................................................................................................... 28
10.2 LNG Import ............................................................................................................................ 29
11. Recommendation....................................................................................................................... 30

Risk Management Department SECTOR STUDY - FERTILIZERS
R e s e a r c h , F I , M a r k e t & L i q u i d i t y R i s k
Page 4
1. Executive Summary
Agriculture plays a vital role in Pakistan’s economy but the burgeoning population, shrinking area under
cultivation and regular floods have put increasing pressure on food resources. According to World Food Programme, more than 48 percent of the population is food insecure in Pakistan. Increased agricultural production and high crops yield is essential for food security which make the farming systems less
vulnerable to climate change. Amongst the many methods used to increase crop production, application of fertilizer in the right proportion has shown to have the most promising results. Food and Agriculture Organization (FAO) of the United Nations has estimated that contribution of fertilizer in increasing crop
productivity is about 50 per cent.
In Pakistan, Urea and DAP are the most widely used products accounting for 68% & 17% of total
fertilizer consumption. The choice of fertilizer to be used depends on climatic conditions, soil fertility and the crops being grown. The demand of fertilizer in Pakistan stands at 5.8 Million Tons while its capacity stands at 7.5 Million Tons.1 Though the domestic fertilizer manufacturers are self sufficient to
meet the local demand but due to gas curtailment the actual output falls short of demand. This gap is met through imports from the international market. Imports in the Kharif season 2015 (May-Sep) stood at 0.577 Million Tons whereas imports in Rabi season 2015-16 (Nov-Mar) is expected to be around 0.35
Million Tons.
Fertilizer producers market has an oligopoly market structure with power concentration in 2 main
players namely Engro and Fauji. Gas being the major raw material and used for both production as well as energy requirements. Concessionary and continuous gas supply agreements among some players with the government have put them at a competitive advantage over others. However, uncertainty prevails over future on the availability of gas at cheaper rates on account of depleting gas reserves in the
country. The prospects of getting gas from the upcoming projects namely Iran-Pakistan gas pipeline, TAPI Project and LNG imports have not yet materialized. But the major issue with imported gas remains of the cost feasibility as it is not viable to produce fertilizer with imported gas at current urea market
prices as the gas that is available to local manufacturers is at very concessionary rates which is less than $2 /MMBTU as compared with landed cost of LNG which is $8/MMBTU.2
Global demand for Urea stood at 185 MT in 2014 growing at a rate of 2%. In Pakistan, the gas shortage relaxed in the early months of 2015 allowing the companies to increase their production by better utilizing their installed capacity this year compared with last year when plants on the SNGPL network
faced worst ever shortage. Commodity prices remained under pressure, particularly for rice and sugarcane, where farmers were reluctant to invest in Nitrogen fertilizers. Therefore, the Urea market has declined by 4.5%, from 5.89 Million Tons in 2013 to 5.63 Million Tons in 2014. Increased demand in
2015 has also allowed the producers to increase the fertilizer production. Off take of fertilizer increased to 3,940K tons in the first half of 2015 compared to 3,503K tons in the first half of 20143. This marks a 12% year on year increase. In the short run, recent floods in Pakistan will negatively influence the
agricultural sector and hence reduce the demand of fertilizer. Moreover, Iran’s nuclear deal will restore the Iran-Pakistan gas pipeline and will improve the shortage of gas in the country.
1 http://www.blackseagrain.net/novosti/pakistan-import-of-0-38-million-tons-of-urea-for-kharif-planned
2 http://www.dawn.com/news/1172906
3 NFCD July 29, 2015

Risk Management Department SECTOR STUDY - FERTILIZERS
R e s e a r c h , F I , M a r k e t & L i q u i d i t y R i s k
Page 5
2. Introduction
Agriculture plays a vital role in Pakistan’s economy. The sector accounted for 20.9 percent of the Gross
Domestic Product (GDP) in 2014-15 and is a source of livelihood of 43.5 percent of rural population 4. Pakistan has a total area of 79.6 million hectares out of which 21.2 million hectares are cultivated; the rest of the territory is rangelands. Almost 80 percent of the cultivated area is irrigated. The country has
the world’s largest contiguous irrigation system. It is among the world’s top ten producers of wheat, cotton, sugarcane, mango, dates and oranges, and holds 13th position in rice production. Major crops (wheat, rice, cotton and sugar cane) contribute 6.5 percent, while minor crops – 2.3 percent of the
country’s GDP.
Important crops, such as wheat, rice, sugarcane maize and cotton account for 25.6 percent of the value
added in overall agriculture and 5.3 percent of GDP. The other crops account for 11.1 percent of the value added in overall agriculture and 2.3 percent of GDP. Livestock contributes 56.3 percent to agricultural value added much more than the combined contribution of important crops, other crops
and cotton ginning (39.6 percent). The production performance of important crops is given in Table
2.1.
Pakistan has a population of 188
million and is growing at a rate of 1.95% per annum.5 Rising food consumption because of better per capita income and growing
population is straining the existing resources. The country is further burdened with shrinking area under cultivation and regular floods that put increasing pressure on food
resources. According to World Food Programme (2009), more than 48 percent of the population is food insecure.
The country has been facing numerous natural disasters such as floods, earthquakes, landslides, draughts, and conflicts, such as the flood of 2010 which affected 20 million Pakistanis. Among the other problems that the country is facing includes water-logging, land erosion and conversion of arable land
for non agricultural uses. All these issues along with growing population have burdened the food resources in the country. According to World Food Programme (2009), more than 48 percent of the population is food insecure.
4 Economic Survey of Pakistan – Agriculture 2015
5 Economic Survey of Pakistan – Population, Labor Force and Employment - 2014
Table 2.1- (Production ‘000’ tons)
Year Cotton* Sugarcane Rice Maize Wheat
(000 bales)
2010-11 11,460 55,309 4,823 3,707 25,214
2011-12 13,595 58,397 6,160 4,338 23,473
2012-13 13,031 63,750 5,536 4,220 24,211
2013-14 12,769 66,469 6,798 4,944 25,979(P)
Growth -2% -4% -23% -7% -4%
Source: Pakistan Bureau of Statistics

Risk Management Department SECTOR STUDY - FERTILIZERS
R e s e a r c h , F I , M a r k e t & L i q u i d i t y R i s k
Page 6
3. Importance of Fertilizer Industry
Amongst the many methods used to increase crop yield, fertilizer is the most important and expensive
agriculture input. Contribution of balanced use of fertilizers towards increased in yield has been observed from 30 to 50 percent in different crop production regions in Pakistan. A 1 kg of fertilizer nutrient produces about 8 kg of cereals (wheat, maize and rice), 2.5 kg of cotton and 114 kg of stripped
sugarcane. Almost hundred percent soils in Pakistan are deficient in nitrogen; 80-90 percent are deficient in phosphorus and 30 percent in potassium. Widespread deficiencies of other micronutrients are also appearing in different areas. Soil fertility is continuously depleting due to mining of the essential
plant nutrients from the soils under intensive cultivation.6
Application of balanced fertilizer is the key in enhancing nutrient use efficiency of the applied plant
nutrients for maintain soil productivity. It ensures the application of fertilizers in optimum quantities and in right proportion through appropriate methods, which in turn results sustenance of soil fertility and crop productivity. Balanced fertilizer leads to building up soil health, while imbalanced fertilization
leads to soil mining and its sickness. Only soil building leads to a sustainable land use system where most food grain production continues to come from the existing agricultural land.
The Nitrogenous Fertilizers provide the plant with protein content, color and growth. The Phosphorous Fertilizers promote strong, healthy root development and helps plants mature more rapidly and thus aids in blooming and seed further formation. They are also critical for the synthesis of energy regulating
substances in plants. The Potassium Fertilizers allows the plants to resist diseases and promotes growth from root to stack. They also improve the size of grains and seeds, and provide winter hardiness to legumes and other crops.
Fertilizer industry constitutes around 3.4% of manufacturing of Pakistan. Pakistan is ranked 46th in the world in terms of fertilizer consumption. Fertilizer consumption in five major crops production (wheat, cotton, sugarcane, rice and maize) in Pakistan is about 87 percent. Fertilizer industry in Pakistan has
overall production capacity of around 7.5 million tons annually 7.
Presently, DAP is only produced by Fauji Fertilizer Bin-Qasim, which has a 45% market share of this
product whereas more than 80% of the market for urea is served by four producers collectively. The fertilizer sector, in its current state, is conducive for existing producers because of high barriers to entry for new entrants. Barriers to entry include the capital intensive nature of manufacturing operations, low
bargaining power of buyers and suppliers, lack of available substitutes and practically non–existent rivalry amongst existing producers.
The demand for urea is inelastic and price changes do not have a large impact on demand. However, demand for phosphatic fertilizers is more sensitive to changes in price. In the past, the government has provided price subsidies on phosphatic fertilizers whenever prices have escalated. This allowed a healthy
financial performance of all the major fertilizer producers of Pakistan.
6 Economic Survey of Pakistan – Agriculture 2015
7 “Business Climate in Pakistan-Challenges and Remedies” ICMAP

Risk Management Department SECTOR STUDY - FERTILIZERS
R e s e a r c h , F I , M a r k e t & L i q u i d i t y R i s k
Page 7
4. Fertilizer Types & Usage in Pakistan
Fertilizer products can be categorized according to
micronutrients i.e. nitrogen, phosphate, potash & complex fertilizers. Table 4.1 shows nutrient-wise fertilizer products. In terms of final products, Urea and
DAP are the most standardized products traded worldwide. The other products are not standardized or are intermediate products available in various combinations of chemical compounds.
Nitrogen, Phosphate and Potash are complementary products rather than substitutes. Products in the
“Complex” category tend to compete with other product lines due to their attribute of incorporating more than one nutrient content.
In Pakistan, Urea and DAP are the most widely used products accounting for 68% & 17% of total
fertilizer consumption on average from 2000/01 to 2010/11. Figure 4.1 shows product-wise average fertilizer off-take from 2000/01 to 2010/119.
The choice of fertilizer to be used can depend on climatic conditions, soil fertility and the crops
being grown. Since the job of any chemical fertilizer is to provide specific nutrients to plants, the extent to which these nutrients are already present in the soil is important and as such is a key factor in determining which fertilizers are to
be used and in what specific combinations or ratios.
However, the actual product mix often varies greatly from the ideal one. This is because apart from the above mentioned factors, pricing,
availability of raw material, economies of scale, distribution flows and incentives from the
government also play a vital role in influencing the demand for specific types of fertilizers.
Due to unbalanced fertilizer use in Pakistan growth in crop yields has not kept pace with fertilizer
consumption which has grown threefold in the previous three decades.10. Table 4.2 shows the actual & recommended use of different fertilizer products in Pakistan.
8 Fertilizers in Pakistan – Demand, Production and Imports; Engro EXIMP; March 30, 2011.
9 National Fertilizer Development Corporation (NFDC)
10 “Fertilizer use by crop in Pakistan” - FAO
Table 4.1 – Nutrient – wise product mix
Nitrogen Phosphate Potash Complex
Ammonia MAP MOP NPK
Urea DAP SOP NP
AN TSP NK
CAN SSP
AS
UAN
AC
Source: IFA
Table 4.2 - Fertilizer use and recommendation8
Nutrient Actual
(Kg/Acre) Recommended
(Kg/Acre)
Nitrogen 41 41
Phosphorous 9 20.5
Potassium 0.4 10.3
Urea 68%
CAN 5%
DAP 17%
NP 5%
Others 5%
Figure 4.1: Fertilizer Offtake by Product 2000/01 to 2010/11

Risk Management Department SECTOR STUDY - FERTILIZERS
R e s e a r c h , F I , M a r k e t & L i q u i d i t y R i s k
Page 8
To promote balanced fertilizer use farmer education is of primary importance. For example farmers often treat urea & DAP as substitutes even though they belong to different classes of nutrients with
additional urea being applied when DAP prices have risen.
To promote balanced fertilizer use farmer education is of primary importance. For example farmers
often treat urea & DAP as substitutes even though they belong to different classes of nutrients with additional urea being applied when DAP prices have risen.
It is important to maintain the NPK ratio. NPK ratio refers to the consumption of different nutrient types. Currently, Pakistan has a very poor NPK ratio. It is 3.8:1:0.04 which means that our farmers use 3.8 units of Nitrogen Fertilizer along with 0.04 units of Potash fertilizer, for every single unit of
Phosphate Fertilizer. On the contrary, 4:2:1 is the internationally recognized ratio. This hampers to attain the optimal level of production. There are various reasons for this abnormal consumption which include high prices of other components, low literacy rate and overall usage norm in the region.
5. Fertilizer Production Process
Urea is produced from synthetic ammonia and carbon dioxide. As large quantities of carbon dioxide are
produced during the ammonia manufacturing process as a byproduct from hydrocarbons (predominantly natural gas, less often petroleum derivatives), or occasionally from coal, urea production plants are almost always located adjacent to the site where the ammonia is manufactured.
Ammonia is the first product that is needed to produce urea and Natural gas can account for 65-75% of the cost of manufacturing Ammonia. Ammonia is produced by reacting nitrogen from the air with
hydrogen at high pressure and temperature in the presence of a catalyst. The hydrogen is produced by reacting natural gas with water at high temperature and pressure in the presence of a catalyst. Natural gas is also used as a process gas (i.e., an energy source) to generate the heat required in the ammonia production process, but this is a minor use.
11
Urea manufacturer must have low cost source of ammonia to ensure production. But ammonia is also dependent on raw material i.e. natural gas in case of Pakistan which they can shift to coal in future as the gas crisis worsens and its availability dwindles. FFC is already planning invest in coal powered boilers.
11
http://guichon-valves.com/faqs/nitrogen-fertilizers-manufacturing-process-of-nitrogen-fertilizers/
Risk Management Department SECTOR STUDY - FERTILIZERS
R e s e a r c h , F I , M a r k e t & L i q u i d i t y R i s k
Page 9
In case of DAP, which requires phosphoric and sulphuric acid along
with Urea. A separate process is required to prepare these acids which can be seen above. These
acids are also commercially prepared so a DAP manufacturer can also opt to purchase all the three raw materials and only mix it in its plant
if that is commercially viable.
Final produced Fertilizers are in
three basic states of matter which are solid, liquid and gas. All forms are of similar nature and provide similar results, depending on the applied nutrients during manufacture.
6. Fertilizers use by type of Crop There are more than 5 million farms in the country, 81 percent of which are smaller than 5 ha. Only 7 percent of the farms are larger than 20 ha, but they account for 40 percent of the farmed area. The total
cropped area in Pakistan is about 22.2 million ha. The share of food grain crops is 54 percent, followed by cotton and sugar cane 20 percent. Figure above shows that wheat is the main food crop. It occupies about 36.3
percent of the total cropped area, followed by
cotton with 14 percent, paddy with 9.5 percent, sugar cane with
4.5 percent, maize with 4.5 percent and other crops with 20.8 percent.
According to the fertilizer use survey five major crops: wheat, cotton, sugar cane, rice and
maize account for about 91% percent of fertilizer consumption. Wheat accounts
for about 50 %followed by cotton with a share of 25%. Sugar cane is the third crop;
nutrient use per ha is highest on this crop.
Table provides a comprehensive
Crop-wise of Usage of Fertilizers (Thousand nutrient tons)
Year Wheat
50% Rice
6.0% Maize 1.5%
Cotton 25%
Sugarcane 8%
Others 9.5%
Total 100%
2011-12 1930.45 231.65 57.91 965.23 308.87 366.79 3860.9
2012-13 1810.75 217.29 54.32 905.38 289.72 344.04 3621.5
2013-14 2044.55 245.35 61.34 1022.28 327.13 388.46 4089.1
Source: National Fertilizer Development Centre, Islamabad.
Source: FAO Pakistan

Risk Management Department SECTOR STUDY - FERTILIZERS
R e s e a r c h , F I , M a r k e t & L i q u i d i t y R i s k
Page 10
analysis of the yearly crop-wise usage of fertilizer in Pakistan. Others include fruits, pulses and various other commodities grown in the country.
Pricing Mechanism: The pricing of fertilizers, like for any other product, is based on various fundamental demand and supply side factors. The demand side in this case is influenced by seasonality and
affordability of the relevant fertilizers during the cropping seasons. Since crop cultivation in Pakistan follows the typical Rabi and Kharif cycle, fertilizer demand for both seasons varies, based on the crops cultivated during each season. Meanwhile, affordability is a function of prices experienced by farmers
during the preceding crop period. For instance, better prices realized by the farmer on cotton and rice crops will enhance their purchasing power for input procurement (including seeds and fertilizers) requirements for the wheat crop. Another means to improve farmers’ purchasing power is through fixation of an attractive procurement/support price by the government, alongside assigning a
procurement quota on such prices through an agency called the Pakistan Agriculture Storage and Services Corporation (PASSCO). This motivates a rational farmer to increase cultivation of the specific crop on the basis of the support prices fixed by the government.
Local Urea is available at lower rates in Pakistan, despite the fact that International price if Urea is lower than what is produced in Pakistan. However, imposition of 10% import duty along with high freight
charges and has made it expensive for the farmers. Government has also placed a cap on rising urea prices and the manufacturer of fertilizer is responsible to absorb the burden of increasing input costs.
Seasonality in Demand: Seasonality plays a critical role in fertilizer sales. There are two basic agricultural seasons in Pakistan are Kharif; with sowing begins in April and is harvested between October and December while Rabi begins in October or December and ends during April-May. Kharif crops are Rice,
sugar cane, cotton, maize and millet are while wheat, gram,
tobacco, barley, rapeseed and mustard are some of
the popular Rabi crops.
All sorts of fertilizers
are used in both agricultural seasons, DAP has a
comparatively higher consumption during Rabi due to its
application on wheat which is cultivated on more than eight
million hectares. Fertilizer demand is higher during July
and December and falls in April and October while global fertilizer demand last about five to nine months. Pakistani fertilizer cycles tend to exhibit shortest durations.

Risk Management Department SECTOR STUDY - FERTILIZERS
R e s e a r c h , F I , M a r k e t & L i q u i d i t y R i s k
Page 11
7. Supply & Demand of Fertilizer Products
7.1 UREA
Urea is the most concentrated solid, straight nitrogenous and most widely used fertilizer in the country.
Mostly it is manufactured in granular and prills forms. A significant gas curtailment, the industry could only produce 4.9 million metric tons of Urea in year 2014 against annual production capacity of 6.9 million metric tons which shows a reduction of 29%. However, this marks a 1% increase compared to
2013.
Pakistani urea market
shrank by 5% in 2014, compared to 2013. The Urea inventory at beginning of the year
was 321 thousand tons. Urea imports for the year 2014 stood at 769
thousand tons which was 20% lower than the imports of 967 thousand
tons during Jan-Dec 2013. Yearly valuation of sales and production are
shown in the chart.12
Off take of Urea dropped because the country faced production constraints along with delayed imports.
Ending inventory is projected to be 305 thousand tons by the end of December 2014. This also shows a 5% reduction on comparison to the closing inventory last year.
Plants on National Grid suffered more because of gas curtailment as their production loss is estimated to be at 200 thousand tons. However, Engro’s production showed an improvement of 17% during the period.
Government of Pakistan had imposed GIDC effective from Jan 01, 2012 on Feed and Fuel gas. The rate of GIDC was increased from Jan 01, 2014. GIDC on Feed gas has been increased to Rs 300 per MMBTU from
Rs 197 per MMBTU and Fuel gas to Rs 100 per MMBTU from Rs 50 per MMBTU. This was further increased to 150 MMBTU from July 01, 2014. This has affected the profitability of the Company during the period as FFBL has not passed on its impact to the customers.
A similar trend was seen in the first quarter of 2015 as well as the Gas curtailment continued and affected the overall production of Ammonia, Urea and DAP in terms of installed capacity. However some improvement in gas curtailment was observed during the first quarter of 2015.
12
Annual Reports FFBL - 2014
0
1000
2000
3000
4000
5000
6000
7000
2014 2013 2012 2011
Qu
anti
ty i
n T
ho
usa
nd
To
ns
Chart:7.1 - Industry Out Put Vs Offtake - Urea
Production
Sales

Risk Management Department SECTOR STUDY - FERTILIZERS
R e s e a r c h , F I , M a r k e t & L i q u i d i t y R i s k
Page 12
Urea industry sales during Jan-Mar 2015 are estimated at 1,504 thousand tons showing an increase of 6% as compared to 1,415 thousand tons sales during the same period of 2014. Except for FFBL, all
companies experienced an increase in the off take of Urea.
13Urea production for the first half of 2015 increased by 7% to 205M tons from 2.3M tons in the first half of 2014. This was followed by a
massive increase in the off take of Urea of about 12% to 2.9M tons compared to 2.6M tons for the first half of the year compared to the first half of the last year. Fatima played a
leading role by improving the production as more gas was made available. Therefore, higher production and profitability could be
expected from the Urea Industry in 2015.
Even though the country has the capacity to fully meet domestic demand, urea has had to be imported
over the previous several years to meet domestic demand as plants could not operate at required capacity due to gas curtailment. Since imported urea is expensive compared to that produced domestically, the GOP provides a subsidy to bring its price down. The graph illustrates the trend of
International and Domestic price of Urea.
In the International market, buyers are slow
to make purchases amid concerns over a further decline in prices as in the second quarter of 2015 new plants producing Urea
are expected to be setup in Algeria, Saudi Arabia and then in the US (during the third quarter). Low-cost production rates in the
Middle East have meant the producers are continuing to run plants despite significantly lower netbacks from markets such as Brazil and Thailand, while manufacturers in
Yuzhny have found some relief from discounted Russian gas rates. Egyptian supply remains down with exports unlikely
this summer due to severe gas curtailments. On the demand front, a pick-up in purchasing in Latin America is expected, while Pakistan and possibly India again will return to the markets with new import tenders. Demand from Europe and the US is also expected to resurface once the weather improves.
However, against the backdrop of ample supply, the general belief is prices will continue to underperform compared with last year’s levels.14
International Urea prices experienced a continuing downhill trend from mid 2012 as prices drop from US$ 500 FOB per metric ton in early 2012 to US $ 400 FOB per metric ton in early 2013 and now it stands at US $ 292 FOB per metric ton in July 2015, the lowest price during the year was US $ 253 FOB per
13
Engro Analyst -1Q2015 14
Urea - ICIS
Engro Analyst
Chart 7.2 - Market Share
Risk Management Department SECTOR STUDY - FERTILIZERS
R e s e a r c h , F I , M a r k e t & L i q u i d i t y R i s k
Page 13
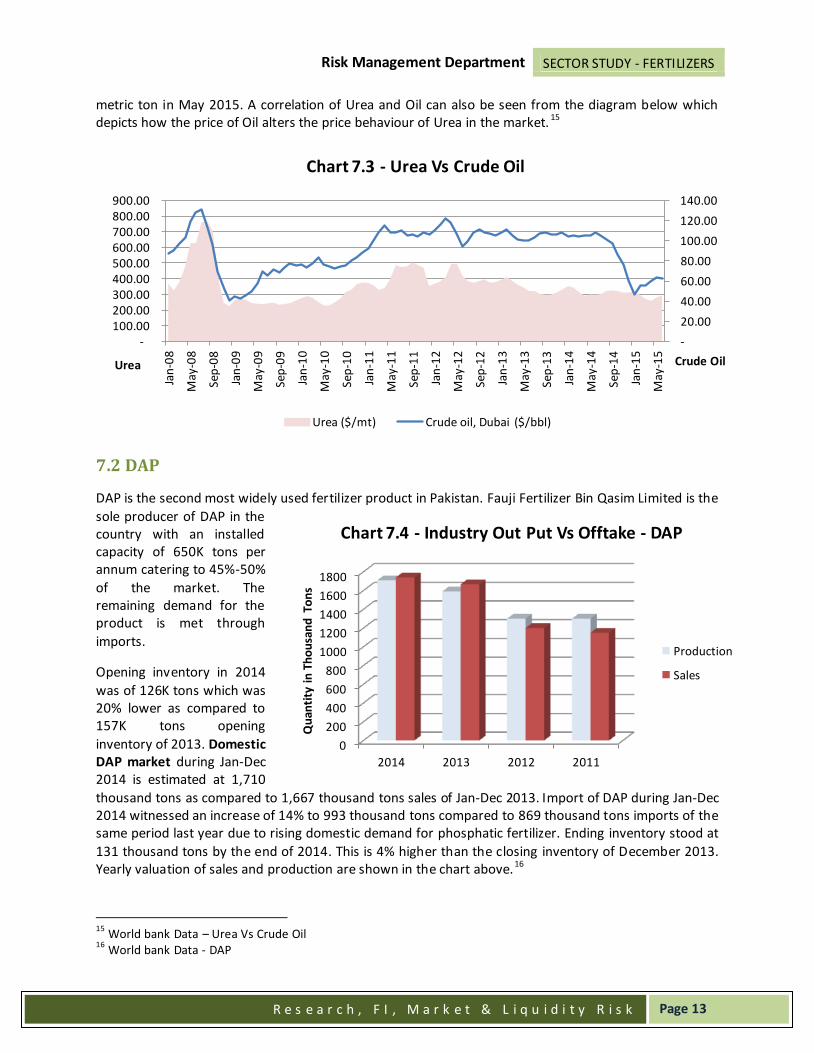
metric ton in May 2015. A correlation of Urea and Oil can also be seen from the diagram below which depicts how the price of Oil alters the price behaviour of Urea in the market. 15
7.2 DAP
DAP is the second most widely used fertilizer product in Pakistan. Fauji Fertilizer Bin Qasim Limited is the
sole producer of DAP in the country with an installed capacity of 650K tons per annum catering to 45%-50%
of the market. The remaining demand for the product is met through
imports.
Opening inventory in 2014
was of 126K tons which was 20% lower as compared to 157K tons opening
inventory of 2013. Domestic DAP market during Jan-Dec 2014 is estimated at 1,710
thousand tons as compared to 1,667 thousand tons sales of Jan-Dec 2013. Import of DAP during Jan-Dec 2014 witnessed an increase of 14% to 993 thousand tons compared to 869 thousand tons imports of the same period last year due to rising domestic demand for phosphatic fertilizer. Ending inventory stood at
131 thousand tons by the end of 2014. This is 4% higher than the closing inventory of December 2013. Yearly valuation of sales and production are shown in the chart above.16
15
World bank Data – Urea Vs Crude Oil 16
World bank Data - DAP
-
20.00
40.00
60.00
80.00
100.00
120.00
140.00
- 100.00 200.00 300.00 400.00 500.00 600.00 700.00 800.00 900.00
Jan
-08
May
-08
Sep
-08
Jan
-09
May
-09
Sep
-09
Jan
-10
May
-10
Sep
-10
Jan
-11
May
-11
Sep
-11
Jan
-12
May
-12
Sep
-12
Jan
-13
May
-13
Sep
-13
Jan
-14
May
-14
Sep
-14
Jan
-15
May
-15
Crude Oil Urea
Chart 7.3 - Urea Vs Crude Oil
Urea ($/mt) Crude oil, Dubai ($/bbl)
0
200
400
600
800
1000
1200
1400
1600
1800
2014 2013 2012 2011
Qu
anti
ty i
n T
ho
usa
nd
To
ns
Chart 7.4 - Industry Out Put Vs Offtake - DAP
Production
Sales
Risk Management Department SECTOR STUDY - FERTILIZERS
R e s e a r c h , F I , M a r k e t & L i q u i d i t y R i s k
Page 14
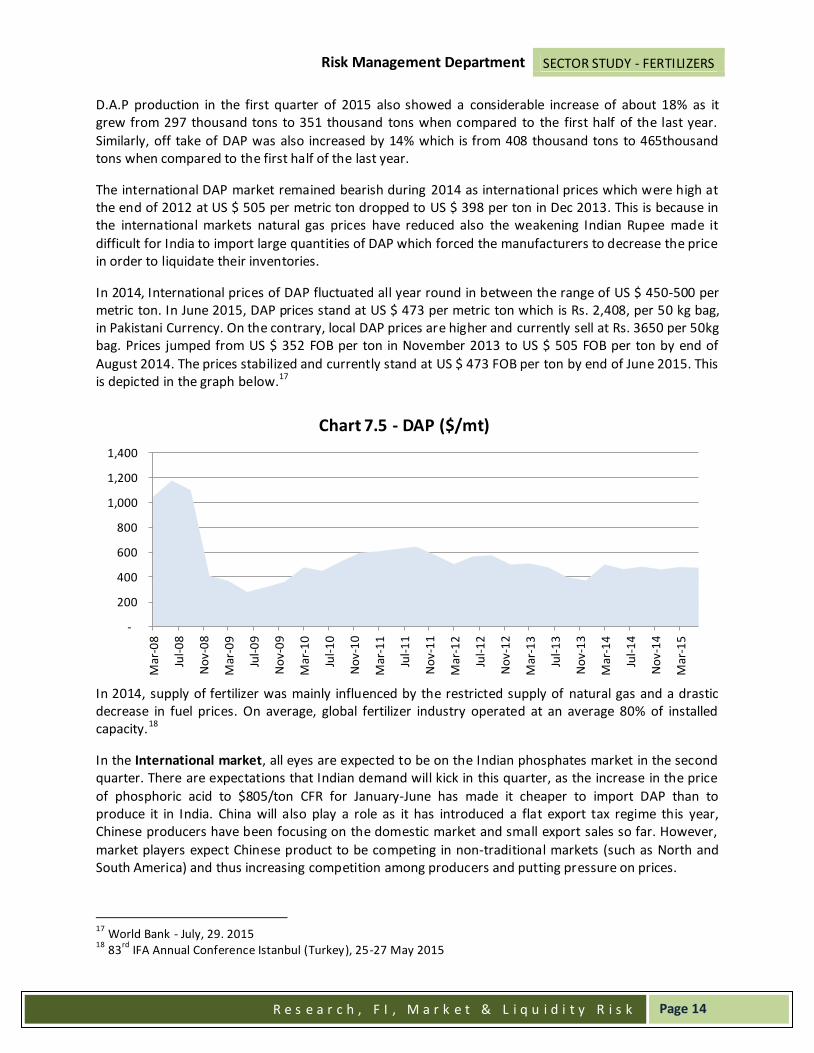
D.A.P production in the first quarter of 2015 also showed a considerable increase of about 18% as it grew from 297 thousand tons to 351 thousand tons when compared to the first half of the last year.
Similarly, off take of DAP was also increased by 14% which is from 408 thousand tons to 465thousand tons when compared to the first half of the last year.
The international DAP market remained bearish during 2014 as international prices which were high at the end of 2012 at US $ 505 per metric ton dropped to US $ 398 per ton in Dec 2013. This is because in the international markets natural gas prices have reduced also the weakening Indian Rupee made it
difficult for India to import large quantities of DAP which forced the manufacturers to decrease the price in order to liquidate their inventories.
In 2014, International prices of DAP fluctuated all year round in between the range of US $ 450-500 per metric ton. In June 2015, DAP prices stand at US $ 473 per metric ton which is Rs. 2,408, per 50 kg bag, in Pakistani Currency. On the contrary, local DAP prices are higher and currently sell at Rs. 3650 per 50kg bag. Prices jumped from US $ 352 FOB per ton in November 2013 to US $ 505 FOB per ton by end of
August 2014. The prices stabilized and currently stand at US $ 473 FOB per ton by end of June 2015. This is depicted in the graph below.17
In 2014, supply of fertilizer was mainly influenced by the restricted supply of natural gas and a drastic decrease in fuel prices. On average, global fertilizer industry operated at an average 80% of installed capacity.18
In the International market, all eyes are expected to be on the Indian phosphates market in the second quarter. There are expectations that Indian demand will kick in this quarter, as the increase in the price
of phosphoric acid to $805/ton CFR for January-June has made it cheaper to import DAP than to produce it in India. China will also play a role as it has introduced a flat export tax regime this year, Chinese producers have been focusing on the domestic market and small export sales so far. However,
market players expect Chinese product to be competing in non-traditional markets (such as North and South America) and thus increasing competition among producers and putting pressure on prices.
17
World Bank - July, 29. 2015 18
83rd
IFA Annual Conference Istanbul (Turkey), 25-27 May 2015
-
200
400
600
800
1,000
1,200
1,400
Mar
-08
Jul-
08
No
v-0
8
Mar
-09
Jul-
09
No
v-0
9
Mar
-10
Jul-
10
No
v-1
0
Mar
-11
Jul-
11
No
v-1
1
Mar
-12
Jul-
12
No
v-1
2
Mar
-13
Jul-
13
No
v-1
3
Mar
-14
Jul-
14
No
v-1
4
Mar
-15
Chart 7.5 - DAP ($/mt)
Risk Management Department SECTOR STUDY - FERTILIZERS
R e s e a r c h , F I , M a r k e t & L i q u i d i t y R i s k
Page 15
In other regions, demand is expected out of the US domestic market with spring application under way. With DAP barge prices under pressure lately and lackluster activity on the Mississippi river, buyers are
expected to start making purchases soon as the weather improves and especially if Moroccan, Russian and Chinese product arrives in the US at more competitive prices than domestic DAP.19
7.3 Other products
Apart from Urea & DAP, other products account for a combined 15% of total fertilizer consumption in
the country. These products include CAN, NP, NPK, SSP, MOP/SOP etc. These products are imported with demand for some products being partially met with domestic production. For example, Engro Fertilizers is the sole producer of NPK in the country which being a complex fertilizer partially caters to
the demand for Potash based products such as MOP & SOP which are imported.
Prices of these products are linked to international markets with demand falling when prices have risen
due to exchange rate devaluation or rise in international market prices. GOP has provided one-off subsidies on some products in the past.
The Phosphate market continued to recover from the slide in 2012 and registered an improvement by 5%, from 1,625 KT in 2013 to 1,709 KT in 2014; this was a consequence of under dosage by farmers in 2011 and 2012. Therefore, farmers moved towards balanced application in 2013 and 2014.
7.4 Ammonia
Ammonia is an important raw material in the manufacture of fertilizers. About 80% of the ammonia produced by industry is used in agriculture as fertilizer. Global ammonia production in 2014 was 144
million tons with Pakistan producing 2.6 million tons of it20. However, most of this material is used on local domestic markets so that only about 20 million tons is traded which determines the price in international markets.
A typical ammonia-producing plant first converts natural gas, LPG or petroleum naphtha into gaseous hydrogen. The method for producing hydrogen from hydrocarbons is referred to as "Steam Reforming".
The hydrogen is then combined with nitrogen to produce ammonia via the Haber-Bosch process.
In Pakistan, all fertilizer manufacturers have their own ammonia manufacturing plant which is almost
entirely used for the production fertilizers. Natural gas is the major ingredient used in making ammonia. It accounts for 80 percent or more of the cost of producing ammonia. Ammonia prices have been closely correlated with natural gas prices. The cost of natural gas is the major factor in determining the price of ammonia and the cost of ammonia is a major factor in determining the price of nitrogen
fertilizer. Furthermore, gas contracts globally are linked with crude oil prices; hence there is a direct relation with crude oil prices as well.
Ammonia prices have been falling
International Ammonia and Urea prices are also being driven downwards by low cost coal-based Chinese
producers. Although domestic demand in China and higher coal prices had supported urea prices until March 2013, urea prices have since fallen due to lower coal prices. Increased supply of coal from
19
DAP - ICIS 20
U.S. Geological Survey, Mineral Commodity Summaries, January 2015

Risk Management Department SECTOR STUDY - FERTILIZERS
R e s e a r c h , F I , M a r k e t & L i q u i d i t y R i s k
Page 16
Australia and Indonesia, as well as slower economic activity in China, were primary factors driving coal prices down. Lower urea also negatively impacted ammonia prices, as the commodity is used to create
urea. That development has made 80% of Chinese producers that use coal to make fertilizers much more competitive in the global market.
Amid worsening gas crisis Pakistan’s fertilizer manufacturers have to look for alternatives at the same time be competitive internationally as producing ammonia and urea with abnormally high gas prices, using imported LNG perhaps in the near future, will make it commercially unviable. Taking advantage
from the Chinese market, FFC is also considering making an investment to use two coal powered boilers to be used in the manufacture of fertilizers. Additional energy could be sold to add up to the national grid station.
The international ammonia market remains well supplied in 2015 and no major upward price movements are seen. Strong demand from the US failed to materialize in April and although increased natural gas curtailments in Trinidad and plant turnarounds in Algeria will squeeze supply for several
weeks, demand from agricultural and industrial users remains soft. Following a slide in the Gulf price, Indian buyers are targeting sub-$400/ton CFR for April and May spot business. In Asia, sentiment is expected to remain mostly soft, with demand from the chemicals sector stagnating and prices for
finished fertilizers under pressure. In the US, demand for ammonia is finally expected to awaken in April and May.21
7.5 Factors affecting Prices & Demand of Fertilizer
Price of urea in the domestic market is influenced by demand & supply dynamics, GOP subsidies on feed-gas & level of imports. GOP subsidies on feed-gas keep domestic prices lower than the international markets. Since domestic production does not fully meet demand, GOP imports urea and makes it available at subsidized rates. The amount as well as the timing of imports by the GOP also
impacts domestic prices.
On the other hand, DAP prices remain dependent on international markets since only about half the
local market is serviced by the sole DAP producer, FFBL. Thus, DAP prices are exposed to international price volatility and exchange rate movements, pushing the government to provide substantial subsidies.
The prices of locally produced Urea remained fairly stable throughout the year. In Pakistan, Average price of urea increased by 5% only, during the year, despite a sharp increase in GIDC. The international urea prices which averaged USD 322/ton during 2014, which is Rs. 2,264/bag (inclusive of all charges)
while local prices around 2014 averaged at Rs. 1,793/bag. China contributed to the oversupply situation and pulled the prices downwards by utilizing the coal based producers.
However, since the fertilizer industry is highly concentrated with FFC, FFBL and EFL, local prices are influenced to an extent by the market power of these players. This is confirmed by the fact that the Competition Commission of Pakistan had fined FFC & EFL a sum of Rs.8.6 billion for excessive pricing of
urea in 2010. The fertilizer manufacturers contend that the increase in prices was due to supply shortages & if they did not increase their prices, the difference was going to go into the dealers pockets without benefiting the end consumer or the farmer. This shows that the fertilizer market is partially
regulated in terms of controlling the price.
21
Ammonia - ICIS

Risk Management Department SECTOR STUDY - FERTILIZERS
R e s e a r c h , F I , M a r k e t & L i q u i d i t y R i s k
Page 17
Inconsistent gas allocation policies of the GOP as well as mistimed imports distort the market & result in speculation & hoarding by dealers/traders in anticipation of future price increases to the detriment of
farmers.
Demand for fertilizers is also influenced by the availability & affordability of relevant fertilizers during
the two cropping seasons – Rabi (Oct to Mar) and Kharif (Apr to Sep). Affordability is determined by farm incomes during the preceding cropping season. For example, better prices tapped in by the farmer on cotton and rice crops will enhance purchasing power for input procurement for the wheat crop in the
next immediate season. Thus there is a vicious circle of past profits. This can also be reversed if there is a bad crop in the initial season.
Other factors affecting fertilizer demand include natural disasters such as heavy rainfall and floods, farmer awareness regarding balanced fertilizer use, price expectations by farmers and nutrient depletion.
Availability of Rural Credit also plays a pivotal role since 50% of the total input cost accounts for fertilizers. There is a time lag of 6-7 months when the farmer uses the fertilizer until he is benefited in monetary terms. Several ADBP’s are often involved in credit programs. Kissan Window also plays a role
in assisting the farmers. Other micro-financing schemes with higher credit limits and lower rates would benefit the farmers.
Fertilizer companies or the distributors provide sales credit to the farmers which ease the rolling cash requirements for the farmer. This allows the farmer to use the fertilizer efficiently and generate a higher sales volume. This will translate to higher profits and can easily pay off the acquired credit.
Risk Management Department SECTOR STUDY - FERTILIZERS
R e s e a r c h , F I , M a r k e t & L i q u i d i t y R i s k
Page 18
Engro Fertilizer,
36%
FFC, 32%
FFBL, 9%
DH Fertilizer,
7%
Pak Arab Fertilizer,
1%
Fatima Fertilizer,
8%
Agri Tech, 7%
8. Fertilizer Manufacturers
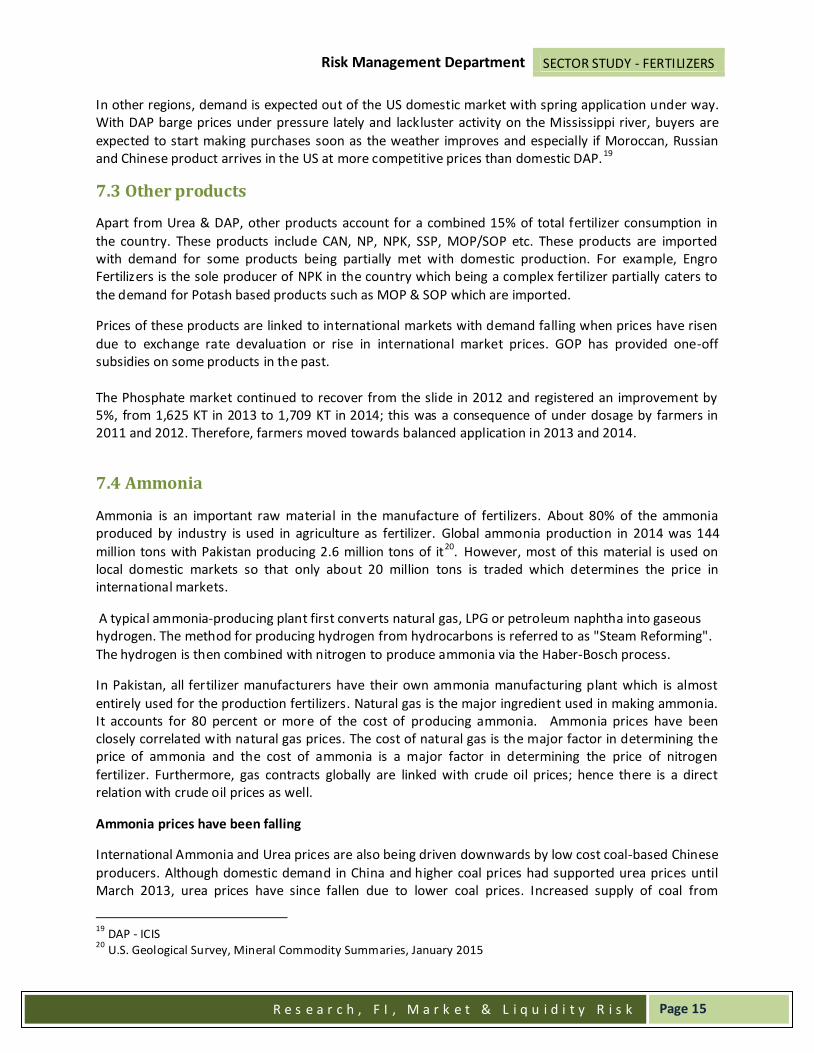
Fertilizer requirements in the country are met by both local production & imports. The domestic fertilizer industry is dominated by 3 groups holding the majority market share. These incude: Fauji Group (Fauji Fertilizers Company & Fauji Fertilizer Bin Qasim Limited), Engro/DH Corporation (Engro
Fertilizers Limited & DH Fertilizers Limited) and Fatima Group (Fatima Fertilizer Company & Pak Arab Fertilizers Limited). The two products that dominate the market are DAP and Urea. FFBL is the only producer of DAP, catering to about half of the total demand.
Product-wise capacity and market share summary is given in Table 4.1 below:
Table 8.1 – Fertilizer capacity and market share summary
Company Urea NP CAN DAP NPK SSP
000 Tons %
000 Tons %
000 Tons %
000 Tons
000 Tons
000 Tons
Fauji Group Fauji Fertilizer Company 2,048 32%
Fauji Fertilizer Bin Qasim 551 9%
650
Dawood Hercules Corporation Engro Fertilizer Limited 2,275 36%
100
DH Fertilizers Limited 445.5 7%
Fatima Group
Pak Arab Fertilizers Limited 92 1% 305 46% 450 52% Fatima Fertilizers Limited 500 8% 360 54% 420 48%
Azgard9 Agritech Limited 475 7%
90
6,387
665
870
650 100 90
Source: Annual Financial Statements of Companies
Urea market is closer to oligopolistic structure where two players namely
Fauji and Engro have combined share of more than 70%. Market share of each player in urea market is given on the
right. Though regulatory barriers are low as the country’s fertilizer policy remains
conducive towards investment, the industry dynamics are such that lead to an oligopolistic structure. The industry is highly capital intensive as is
corroborated by the cost incurred on the 0.5mT Fatima Fertilizer (USD 750m22)
22
FFCL, Corporate Briefing Program, Lahore Stock Exchange, March 27th
, 2012

Risk Management Department SECTOR STUDY - FERTILIZERS
R e s e a r c h , F I , M a r k e t & L i q u i d i t y R i s k
Page 19
and 1.3mT Engro Fertilizer (USD1.1 bn23) plants that became operational in 2010/11. The likelihood of additional investment in the industry are low in the near to medium term due to
increasing pressure on gas supplies which has significantly affected urea production. Presently the fertilizer industry is the second largest consumer of gas behind the power sector utilizing around 18% of overall gas supplies with consumption increasing at a CAGR of 2.43% over the last ten years24.
A breif overview of the major players in the industry is given below.
8.1 Fauji Fertilizer Company Limited (FFC)
FFC is a public limited company with 44.35% shares held by the Fauji Foundation. It has 3 urea
production facilities, located in Rahim Yar Khan & Ghotki. These plants have a combined capacity of 2.05 million tons per annum. FFC receives gas from Mari gas fields & has thus not faced curtailments that plants on the Sui network have faced. In 2013-14 the company produced 2.4 million tons of urea against
its installed capacity of 2.04 million tons whereas all the other manufacturers operated well below their nameplate capacities due to the restricted supply of gas. Capacity utilization slight reduced from 118% to 117% because of maintenance turnaround at Mirpur plant. FFC company produced 2,403 thousand
tons during the year which is 49% of the aggregate domestic output.
FFC posted a performance where overall sales stood at Rs.81.24 billion in 2014 up from Rs.74.48 billion
in 2013. Higher sales in past two years were mostly due to an increase in urea prices rather than an increase in volumes. However, Operating Profit reduced primarily due to an increase of cost due to imposition of GIDC (Gas Infrastructure Development Cess) and revision in gas prices. Net earnings stood
at Rs. 18.17 billion which caused the company to suffer a decline of 9.8% compared to the last year. Despite the fact that FFC experienced an increase in the price of Urea, the profitability was still compromised because of higher increase in cost for the period.
Significant diversification initiatives were also taken by the company including its involvement in financial sector, food business, power generation and offshore fertilizer projects. Rs. 1.86 billion were also generated from treasury operations.
FFC experienced a 29.6% increment in profit after tax, for the first quarter, which increased form Rs. 4.6 billion to Rs. 6 billion. A 9% increase in the sale of ‘Sona Urea’ accompanied by dividend earning from
associated companies including AKBL and income on GIDC accruals bolstered the earning for the company.
GIDC is to be imposed on all fertilizer manufacturers which will allow accumulating Rs. 100 billion per annum. FFC has been booking provisions since 2013 and hence will experience a minimal impact on its profitability. However, the company will soon exhaust its income from GIDC accruals after the
implementation. Any delays in implementation will remain positive for FFC.
In the backdrop of GIDC, Urea retail prices have declined from Rs. 1943/bag in January to Rs. 1896/bag
in March. FFC also expects to generate income from a diversified investment of two 50MW wind power generation plants and holds 35% stake in both projects. This will allow incremental income to the company and surplus energy will be sold to the national grid stations.
23
“Engro blames rival for gas supply disruptions”, The Express Tribune, June 21st
, 2012 24
Economic Survey of Pakistan, 2011/12

Risk Management Department SECTOR STUDY - FERTILIZERS
R e s e a r c h , F I , M a r k e t & L i q u i d i t y R i s k
Page 20
A summary of key financial figures & ratios of FFC is given below:
Table 8.2 – Fauji Fertilizer Company - Financial Highlights
Particulars 2011 2012 2013 2014
Sales (Rs. Bn) 55.22 74.32 74.48 81.24
Operating Profit (Rs. Bn) 29.98 30.44 28.36 24.67
Net Profit Margin (%) 40.73 28.04 27.03 22.37
ROE (%) 97.49 79.86 80.05 70.79
ROA (%) 40.5 34.23 29.68 20.99
Interest Cover (times) 43.2 32.05 39.91 31.91
EPS (Rs.) 17.68 16.38 15.83 14.28
Cash flow from Operations/Sales (times) 0.35 0.25 0.34 0.36
Financial Leverage Ratio 0.58 0.40 0.51 0.62
FFC is also considering the possibility of developing a coal powered boilers to boost production and this
will improve the net earnings of the company. This will also hedge against the gas curtailment and depleting gas reserves. However, further decisions on the case will be taken after a detailed technical, geographical and commercial evaluation and feasibility studies25.
8.2 Fauji Fertilizer Bin Qasim Limited (FFBL)
FFBL is a Granular urea and DAP manufacturing concern located in Eastern Zone of Bin Qasim, Karachi.
The company is listed on all the three stock exchanges of the country and has an annual urea production capacity of 0.55 million tons and DAP production capacity of 0.65 million tons. FFBL is the only DAP producer in Pakistan and is able to meet approximately half of the domestic demand for DAP.
FFBL is supplied gas by SSGC & faced a gas shortage of 41% this year compared to 38% last year. Total urea production stood at 225K tons in 2013 which dropped to 213K tons in 2014 against a constant
nameplate capacity of 551K tons. Similarly DAP dropped from 745K tons in 2013 to 702K in 2014 against a constant nameplate capacity of 650K tons.
FFBL has a 25% stake in Pakistan Moroc Phosphore S.A. Morocco (PMP) worth approximately Rs.2.1 Billion as on 31-Dec-14. PMP is a joint venture between FFBL, Fauji Foundation, Fauji Fertilizer Company Limited and Officie Cherifien Des Phosphates, Morocco. The purpose of the investment is to ensure long–term uninterrupted supply of phosphoric acid which is a basic raw material for manufacturing DAP
(Morocco currently possesses 85% of global phosphate reserves).
Gas curtailment remained the biggest challenge for fertilizer industry during the last year along with
higher GIDC. Major portion of increased cost burden was borne by the company and was not translated into higher prices. The same reason resulted in a fall in sales of 9.2% which caused a drastic fall in profitability of above 30%. Despite all difficulties, FFBL is in close coordination with the Government for
resolution of energy crisis since it produces its own electricity and supplies the surplus to KESC.
Continued problem of gas curtailment halted the production of Urea for 76 days, Ammonia for 40 days
and DAP for 30 days respectively. In addition to it, increase in GIDC by Rs 50/MMBTU to reach Rs 150/MMBTU also hurt the base line since FFBL did not pass it on to its customers.
25
Fauji Fertilizer Company Limited – Annual report 2014

Risk Management Department SECTOR STUDY - FERTILIZERS
R e s e a r c h , F I , M a r k e t & L i q u i d i t y R i s k
Page 21
Key financial figures & ratios of FFBL are given below which portray the declining performance of FFBL:
Table 8.3 – Fauji Fertilizer Bin Qasim - Financial Highlights
Particulars 2011 2012 2013 2014
Sales (Rs. Bn) 55.87 47.91 54.45 49.45
Profit Before Tax (Rs. Bn) 16.17 6.47 8.46 5.78
Net Profit Margin (%) 19.27 9.06 10.65 8.12
ROE (%) 78.96 34.35 45.15 30.73
ROA (%) 26.8 10.66 15.1 8.68
Interest Cover (times) 15.86 4.55 6.6 5.40
EPS (Rs.) 11.53 4.65 6.21 4.30
Cash flow from Operations/Sales (times)
14.95 3.01 18.25 17.20
Financial Leverage Ratio 0.83 0.99 0.82 1.15
The additional expense of repair and maintenance along with low level of production and sales resulted
in reduced profitability. DAP production maintained at high level in remaining three quarters whereas Urea production suffered due to consistent gas curtailment. The demand of DAP is always high in fourth quarter due to sowing of Rabi crops. FFBL had ever highest DAP sales in year 2013 due to higher
production and availability.
FFBL suffered a contraction in sales ,owing to lower production, during the first quarter of 2015 but has
improved its financial position in the next quarter by attaining volumetric growth of DAP, despite increasing cost of phosphoric acid. Delayed sowing of cotton, maize and other crops, because of higher rainfall during the early months of 2015 has improved phosphoric sales and fertilizer prices.
8.3 DH Fertilizers Limited (DHCL)
DH Fertilizers has a nameplate capacity of 445.5K tons per annum and contributes 7% to industry’s urea capacity. The plant is located in Sheikhupura, Punjab. DH Fertilizers manufactures and markets urea under the brand name "Bubber Sher". It is connected with the SNGPL network and faces severe gas
curtailment. This shortage limits the production of the company to only 42K tons which makes about 9% of the design capacity compared to 14% in the last year.
DHFL has also filed a written petition in the Lahore High Court against SNGPL due to the inequitable distribution of gas amongst competing fertilizer companies on its network. DHFL & Engro plants have received the least amount of gas from SNGPL in 2011 & 2012 and worsened the performance of the
company
Sales during 2014 stood at Rs.3.67 billion which worsened by approximately 25% compared to the last
year. However, the company managed to balance the profitability as it experienced a fall of only 12.6% as it dropped from Rs 3.89 billion to Rs 3.4 billion on account of higher share of profit from associated companies.
The improvement of gas curtailment and restriction on the import of urea has allowed an improvement in the sales volume of urea by 6% compared to the first quarter of the last year
Risk Management Department SECTOR STUDY - FERTILIZERS
R e s e a r c h , F I , M a r k e t & L i q u i d i t y R i s k
Page 22
During June 2015, DH Corporation has entered into an agreement with Pak Arab Fertilizers Limited (PAFL) for sale of its entire shareholding in DH Fertilizers Limited at approximately 2 billion. This process
started in 2012 when the memorandum was signed between the two parties but later DHFL decided not to go ahead with this sale. Although this was a prime business concern for DHFL, this sale is regarded as a positive initiative for the company as the fertilizer plant was consistently suffering losses. Dawood
Hercules experienced a sharp increase in its share price and a total of 1.586 million shares were traded immediately after the news.26
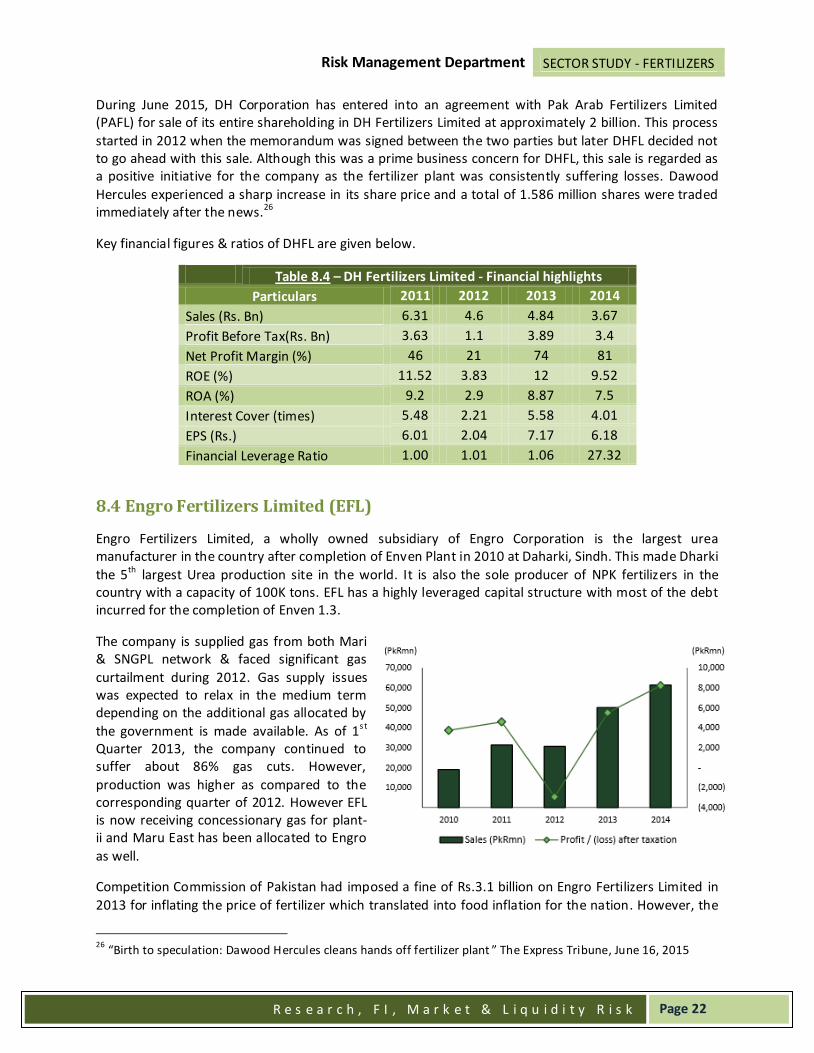
Key financial figures & ratios of DHFL are given below.
Table 8.4 – DH Fertilizers Limited - Financial highlights
Particulars 2011 2012 2013 2014
Sales (Rs. Bn) 6.31 4.6 4.84 3.67
Profit Before Tax(Rs. Bn) 3.63 1.1 3.89 3.4
Net Profit Margin (%) 46 21 74 81
ROE (%) 11.52 3.83 12 9.52
ROA (%) 9.2 2.9 8.87 7.5
Interest Cover (times) 5.48 2.21 5.58 4.01
EPS (Rs.) 6.01 2.04 7.17 6.18
Financial Leverage Ratio 1.00 1.01 1.06 27.32
8.4 Engro Fertilizers Limited (EFL)
Engro Fertilizers Limited, a wholly owned subsidiary of Engro Corporation is the largest urea manufacturer in the country after completion of Enven Plant in 2010 at Daharki, Sindh. This made Dharki
the 5th largest Urea production site in the world. It is also the sole producer of NPK fertilizers in the country with a capacity of 100K tons. EFL has a highly leveraged capital structure with most of the debt incurred for the completion of Enven 1.3.
The company is supplied gas from both Mari & SNGPL network & faced significant gas
curtailment during 2012. Gas supply issues was expected to relax in the medium term depending on the additional gas allocated by
the government is made available. As of 1s t Quarter 2013, the company continued to suffer about 86% gas cuts. However,
production was higher as compared to the corresponding quarter of 2012. However EFL is now receiving concessionary gas for plant-ii and Maru East has been allocated to Engro
as well.
Competition Commission of Pakistan had imposed a fine of Rs.3.1 billion on Engro Fertilizers Limited in
2013 for inflating the price of fertilizer which translated into food inflation for the nation. However, the
26
“Birth to speculation: Dawood Hercules cleans hands off fertilizer plant ” The Express Tribune, June 16, 2015

Risk Management Department SECTOR STUDY - FERTILIZERS
R e s e a r c h , F I , M a r k e t & L i q u i d i t y R i s k
Page 23
company is contesting this order through legal means. The Company has filed a writ in the Sindh High Court and stay has been granted against the recovery of the imposed fine.
Sales revenue for 2014 was Rs. 61,425 million which was higher by 23% as compared to the corresponding period (2013: Rs. 50,129 million). EFL also enjoyed a reduction in the financial charges
from Rs. 9.9 billion to Rs. 6.6 billion. However, gross profit for the year 2014 was Rs. 22,603 million as compared to Rs. 22,121 million for 2013 and showed a fall the gross profit margin. This decrease in gross profit is due to increased GIDC. This increase increased cost was born by the company and was not
translated into higher prices. Engro’s market share of Urea increased from 18% last year to 26% in 2013. Key financial figures & ratios are given above.
Table 8.5 - Engro Fertilizers Limited - Financial highlights
Particulars 2011 2012 2013 2014
Sales (Rs. Bn) 31.35 30.63 50.13 61.43
Profit Before Tax (Rs. Bn) 6.87 (3.95) 8.38 11.9
Net Profit Margin (%) 14.6 (9.6) 10.96 13.4
ROE (%) 24.6 (18.6) 26.9 27.57
ROA (%) 4.5 (3.0) 5 7.4
Interest Cover (times) 1.9 0.63 1.84 2.80
Total Assets Turnover 31 31 46 55.1
EPS (Rs.) 4.05 (2.59) 4.66 6.29
Financial Leverage Ratio 5.42 6.17 4.38 2.23
Engro Fertilizer receives 60 MMSCFD gas from Guddu/Mari Shallow all around 2014 which allowed both the plants to remain operational. The company currently receives concessionary gas for plant 2 (from March 2015) and also enjoyed an overall capacity utilization of 80%. However, a long term arrangement
for continuous availability of gas has not been made. Moreover, GIDC was also termed as unconstitutional and by the Supreme Court, yet it was re-imposed via Presidential Ordinance. EFL has challenged its validity and has acquired a stay order27 against the imposition of GIDC and are confident
of its reversal.
If GIDC would be imposed on EFERT, this would trim the forecast for 2015 and 2016 by 24% and 31%
respectively. If the additional cost would be transferred to the customers, they would have to raise their price by Rs. 165/bag and this will not be a viable option, considering the market situation. Moreover, the fertilizer industry does not have the ability to pass on the abruptly increasing gas price (feedstock and fuel stock) but EFL is immune to the following concerns because it benefits from the promised
concessionary gas to En-Ven plant and a predetermined tariff charges for Reti Maru.28
8.5 Fatima Fertilizer Company Limited (FATF)
Fatima Fertilizer Company Limited is engaged in manufacturing, producing, buying, marketing, importing
and exporting fertilizers and chemicals. Fatima Group was established in 1936 with trading of commodities and gradually entered into the manufacturing of various products. The Group is engaged in trading of commodities, manufacturing of fertilizers, textiles, sugar, mining and energy.
27
“Engro Fertilizer Limited” – Annual Report 2014 28
Foundation Research, April 2015

Risk Management Department SECTOR STUDY - FERTILIZERS
R e s e a r c h , F I , M a r k e t & L i q u i d i t y R i s k
Page 24
The manufacturing facility of the Company is located at Sadiqabad. The fertilizer complex is an
integrated production facility, capable of producing two intermediate products, Ammonia and Nitric Acid and four final products which are Urea, Calcium Ammonium Nitrate (CAN), Nitro Phosphate (NP) and Nitrogen Phosphorous Potassium (NPK) at Sadiqabad, Rahim Yar Khan.
The Complex has an approximate 56 Megawatts (MW) captive power plant in addition to off-sites and utilities. It has dedicated gas allocation of 110 MMCFD from Mari Gas Field. The Complex has an annual design capacity of 500,000 Metric Tons of Urea, 420,000 Metric Tons of Calcium Ammonium Nitrate
(CAN), 360,000 Metric Tons of Nitro Phosphate (NP). Fatima Fertilizer intends to acquire up to 35% shares of Midwest Fertilizer Corporation USA by issuing USD 300 million.
Fatima fertilizer generated highest production, sales and profitability I this period. Sales for NP and Urea remained in line with the production for the year. Overall sales grew from Rs. 33.5 billion to Rs. 36.17 billion. This increase was followed by an increase in profitability. A prime reason behind the success of
this year was improved availability of gas to the company. Despite additional costs including enhanced minimum wages and imposition of GIDC on the overall fertilizer industry.
Improved availability of the company’s products nation-wide was witnessed along with increased demand. Product wise contribution towards revenue remained tilted towards NP, with 40%, whereas CAN and UREA contributed 28% and 31% respectively. Nitric Acid contribution remained at 1% reflecting
sustained and positive demand in the local industry.
The company has achieved a notable reduction in finance cost for 9.65% or Rs. 402 million primarily because of efficient utilization of financial resources along with proficient negotiation of markup rates
with the lenders. The company experienced a drastic increase in profitability and hence share price in the first quarter of 2015 primarily because of continues plant operation while there was a maintenance closure of the plant
last year. This allowed the sales volume to boost by 24.5% compared to the same first quarter of 2014.29
29
Ismail Iqbal Securities Limited - July 28, 2015
Table 8.6 - Fatima Fertilizer Company Limited - Financial highlights
Particulars 2011 2012 2013 2014
Sales (Rs. Bn) 14.83 29.52 33.50 36.17
Profit Before Tax (Rs. Bn) 6.08 9.08 12.32 13.53
Net Profit Margin (%) 27.76 20.70 23.95 25.60
ROE (%) 14.67 21.11 24.49 25.19
ROA (%) 6.04 9.03 11.84 11.14
Interest Cover (times) 2.99 2.57 3.96 4.76
EPS (Rs.) 1.9 2.86 3.82 4.41
Financial Leverage Ratio 1.42 1.27 0.94 0.66

Risk Management Department SECTOR STUDY - FERTILIZERS
R e s e a r c h , F I , M a r k e t & L i q u i d i t y R i s k
Page 25
9. Banking Credit to the Industry
Owing to the capital intensive nature of the sector, capacity expansion projects during the last few years have pushed up banks’ overall credit exposure to the industry. As of Dec-2014 total outstanding facilities to the sector were approx. Rs.84.6 billion (approx. 1.7% of total bank advances). Engro Fertilizers Limited
& Fatima Fertilizers Company Limited are the two largest borrowers as they have set up new plants at considerable costs in recent years. Due to the cash nature of the business, working capital requirement are relatively low. The level of short-term borrowing is mostly dependent on import financing
requirement. Table 9.1 below shows outstanding financing facilities to the sector as of 31-Dec-2014.
Table 9.1 – Banking credit (Outstanding loans – PKR 000)
Company 2014 2013 2012 2011
Engro 44,004 55,821 63,378 66,305
DHFL 6,965 7,002 7,048 4,800
FFC 4,280 5,740 5,304 4,319
FFBL 5,032 9,993 11,225 8,124
Fatima 24,310 30,889 33,780 37,490
84,591 109,445 124,782 125,155
Source: Company financial reports

Risk Management Department SECTOR STUDY - FERTILIZERS
R e s e a r c h , F I , M a r k e t & L i q u i d i t y R i s k
Page 26
10. Gas Crisis
Natural Gas is the basic raw material for the manufacture of anhydrous ammonia and therefore fertilizer. This makes fertilizer industry the second largest consumer of gas in Pakistan. Natural gas is used as feedstock in the production of ammonia and also as fuel, therefore it accounts as 55% of the
overall production cost.
In recent times the industry has been facing shortage of gas and has increasingly become leveraged
resulting in earnings being more volatile. All the fertilizer producers, except for FFC, were coerced to underutilize their capacity and have to compromise on the potential production level and hence profitability.
The key risk factor for the industry is continued availability of feedstock gas and at subsidized rates. This risk has already
materialized for the industry as it has experienced significant gas curtailment resulting in production losses.
Maintained gas supply throughout the year allowed the fertilizer industry to show a
comparatively better performance in 2014. At the start of the year, GIDC on Feed gas was increased by 52% to reach PKR 300mmbtu while GIDC on Fuel gas was raised by 100% to PKR 100mmbtu. The Fuel gas rate was increased by an additional 50% in
Jul’14 which takes rate up to PKR 150mmbtu. Due to rising cost of the production essential gas, gross margins have deteriorated significantly.
This table illustrates that Pakistan has a nominal rate for gas compared to USA and Western Europe; however, Arabian Gulf and FSU enjoy extremely low gas prices which harms our local industry as it allows the globe to bring the international urea prices down.
Availability of natural gas in Pakistan has remained flat with supplies growing at a CAGR of only 4.77% between 2001/02 and 2010/1136 while demand has been increasing at a faster pace. Proven gas reserves in the country stand at approx. 27 TCF which at current consumption rates are expected to last
for about 18 years. Additional supplies can be generated by tapping ‘tight reservoirs’ which are more costly to bring to production but could double domestic reserves.
Fertilizer plants rely on the supply of gas both as a source of fuel & as the principal raw material (feedstock) in the production of urea. Feedstock accounts for three-fourths of the consumption of gas by the industry.
30
World Bank 31
IMF 32
SSGC 33
Canadian Gas Association 34
Bloomberg 35
IMF 36
Economic Survey of Pakistan, 2011/12
Table 10.1 - International Gas Prices $ per MBTU (2015)
Western Europe 6.9 - 10.230
USA 2.3 - 3.831
Pakistan 4.2 - 4.832
Canada 2.5 – 3.533
Arabian Gulf 1.8 - 2.734
Russia 7.5 - 9.035

Risk Management Department SECTOR STUDY - FERTILIZERS
R e s e a r c h , F I , M a r k e t & L i q u i d i t y R i s k
Page 27
The 2005 GOP Natural Gas Allocation & Management Policy placed fertilizer manufacturers at No.2 on the priority list for supply of gas after domestic/commercial consumers. However with overall
consumption increasing and with worsening electricity shortages coupled with the ballooning oil import bill, GOP decided in 2011/12 to divert gas supplies from fertilizer plants to IPPs moving the fertilizer sector down the priority list. Table below shows the gas suppliers & capacity utilization rates for the
seven fertilizer companies operating in the country in 2015.
Table 10.2: List of Companies with their Gas Suppliers & Urea Capacity Utilization in 2014
Company Gas Supplier Capacity
Utilization (%)
Fauji Fertilizer Company Mari 117%
Fauji Fertilizer Bin Qasim SSGC 59%
Engro Fertilizer Limited SNGPL / Mari 80%
DH Fertilizers Limited SNGPL 9%
Pak Arab Fertilizers Ltd. SNGPL 0%
Fatima Fertilizers Limited Mari 92%
Agritech Limited SNGPL 24%
Overall Capacity Utilization 78%
As the figures above reflect domestic urea production suffered due to gas curtailment with production dropping to 4.9 million tons in 2015 against installed capacity of 6.9 million tons. The non–availability of natural gas has led the government and private manufacturers to explore alternatives for load management and enhancing supplies. As a short term measure, the GOP has imposed a Gas
Infrastructure Development Cess (GIDC) on all sectors, except domestic and commercial, from January 1s t, 2012. With the imposition of GIDC, the cost of feed and fuel gas has increased by approx. 200%37 for old fertilizer plants. The only plants exempt from this increase were fertilizer plants with fixed price
contracts (Engro’s Enven & Fatima Fertilizers’ plants). The gas prices remained fairly stable in 2013. At start of 2014 GIDC was increased on feed gas by Rs 103/MMBTU and on fuel by Rs 50/MMBTU. The Fuel gas rate was increased by an additional 50% in Jul’14 which takes rate up to PKR 150mmbtu. The urea
price was increased to Rs 1,813/bag from Rs 1, 786/bag only partially transferring the gas cost increase. Due to rising cost of the production essential gas, gross margins have deteriorated significantly.
This precarious gas supply situation is expected to be brought under control up to a certain extent as the government has advised petroleum exploration and production (E&P) companies to negotiate Gas Sale Agreements (GSAs) with fertilizer manufacturers for direct sales to them from new and unutilized gas
fields on a fast track basis38. Engro’s En-Ven plant which was the worst hit in terms of gas curtailment has been able to secure 22 mmscfd additional gas from Mari field in the short term and produced at an 80% capacity utilization rate in 2014. Engro has also shown a 9% increase in the sales for the first quarter of 2015 compared to the first quarter of 2014.
As a medium-term solution, a consortium of four SNGPL based fertilizer manufacturers (Engro, Dawood, Pak Arab and Agritech) has approached OGDC, Mari and MOL for supply of 202 mmcfd gas from various
fields. GSA as well as tolling agreement has been signed between the fertilizer manufacturers and gas distribution companies. This gas was expected to be available by mid of 2014 and will meet approx. 80%
37
“The State of Pakistan’s Economy – 3rd
Quarterly Report 2011/12” – State Bank of Pakistan. 38
“E&P firms asked to negotiate with urea makers for direct sale”, The Nation, February 22nd
, 2013.
Risk Management Department SECTOR STUDY - FERTILIZERS
R e s e a r c h , F I , M a r k e t & L i q u i d i t y R i s k
Page 28
of the requirement of these manufacturers. To bring this gas to the plants, the fertilizer companies have to invest approx. $115 million with the sum being divided proportionately between the companies.
Gas fields, except for Kunnar Pasaki Deep and Makori East were operational since the
date mentioned above. From this allocation, ECC has temporarily allowed to use Reti Maru and Mari SML till LT solution is fully implemented. Capex on Kunnar Pasakhi
Deep field (KPD), the major source of gas, is deferred until formal ratification.
The govt. has increased the tax collection target through GIDC from Rs88bn in FY14E to Rs145bn in FY15 budget. Alongside, the govt. has also added a provision stating that it may levy any rate of GIDC on any category of gas consumers subject to maximum rate of Rs300/mmbtu. It may result in additional levy of
GIDC on fertilizer fuel stock gas supplies, which are currently being charged at Rs100/mmbtu, however, it is still a bit early to speculate on the govt.’s stance on GIDC rate change. First installment of PKR 4.2 Billion was paid in March 2015.
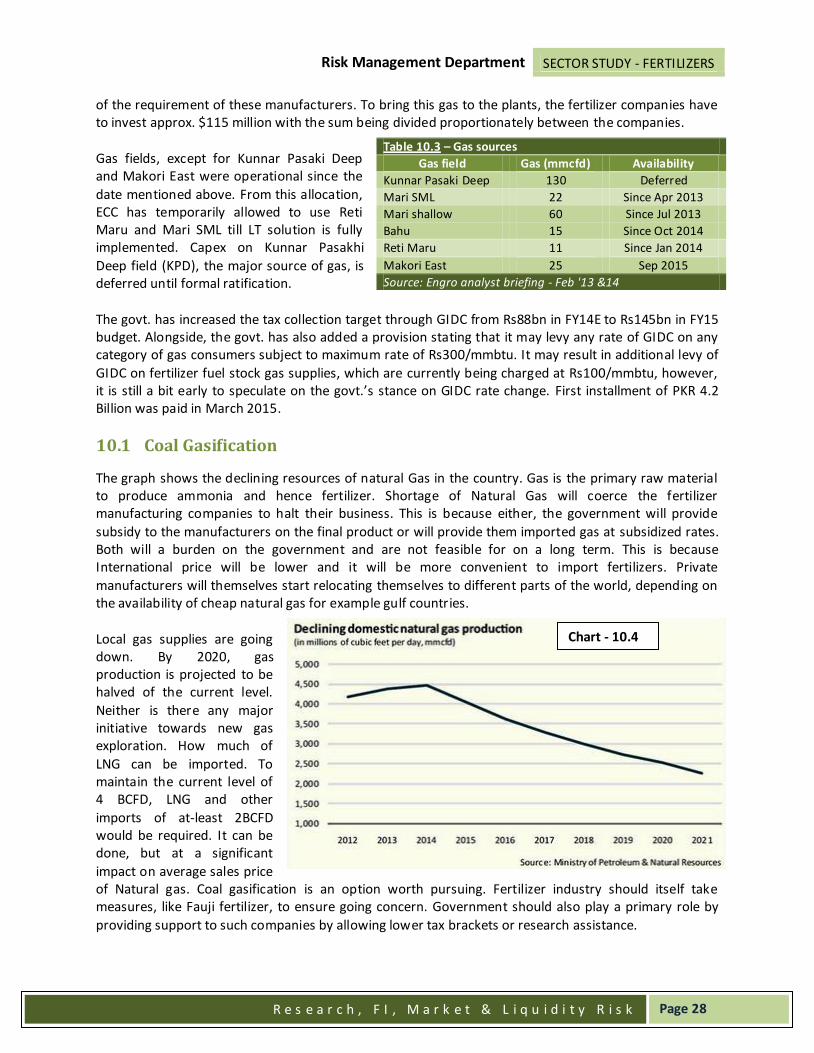
10.1 Coal Gasification
The graph shows the declining resources of natural Gas in the country. Gas is the primary raw material to produce ammonia and hence fertilizer. Shortage of Natural Gas will coerce the fertilizer manufacturing companies to halt their business. This is because either, the government will provide
subsidy to the manufacturers on the final product or will provide them imported gas at subsidized rates. Both will a burden on the government and are not feasible for on a long term. This is because International price will be lower and it will be more convenient to import fertilizers. Private
manufacturers will themselves start relocating themselves to different parts of the world, depending on the availability of cheap natural gas for example gulf countries.
Local gas supplies are going down. By 2020, gas production is projected to be halved of the current level.
Neither is there any major initiative towards new gas exploration. How much of
LNG can be imported. To maintain the current level of 4 BCFD, LNG and other
imports of at-least 2BCFD would be required. It can be done, but at a significant
impact on average sales price of Natural gas. Coal gasification is an option worth pursuing. Fertilizer industry should itself take measures, like Fauji fertilizer, to ensure going concern. Government should also play a primary role by
providing support to such companies by allowing lower tax brackets or research assistance.
Table 10.3 – Gas sources
Gas field Gas (mmcfd) Availability
Kunnar Pasaki Deep 130 Deferred
Mari SML 22 Since Apr 2013
Mari shallow 60 Since Jul 2013
Bahu 15 Since Oct 2014
Reti Maru 11 Since Jan 2014
Makori East 25 Sep 2015
Source: Engro analyst briefing - Feb '13 &14
Chart - 10.4
Risk Management Department SECTOR STUDY - FERTILIZERS
R e s e a r c h , F I , M a r k e t & L i q u i d i t y R i s k
Page 29
In the long run fertilizer manufacturers have to learn from Chinese experience and have to adopt coal based technologies from the production of urea as that is only resource that can provide sustainable
long term solution. Considerable investment has been made in local production infrastructure. The sector is well endowed with technical and management skills and is cash rich. Many Fertilizer companies can launch investment projects involving vertical integration.
Thar coal should be utilized as it is within 150-200 Km of a number of fertilizer plants and will prove to be a cheap alternative for the manufacturers.
10.2 LNG Import
Federal Minister for Petroleum and Natural Resources, Shahid Khaqan Abbasi has, reportedly, estimated the annual monetary impact of the imported fuel on the exchequer of at least $300 million or Rs 35 billion on account of costly fuel imports. 39 This LNG would be used by power sector and fertilizer sector.
It will address the power shortage of about 3,000-4,000 megawatts on a daily basis. While the current gap between gas supply and demand stands beyond 1.5bcfd.
If imported LNG is diverted to fertilizer sector at a higher price of $ 19 /mmbtu than it would make local producers inefficient viz a viz international counterparts as it would be cheaper to import urea than to make it. Currently Engro is getting gas at US$0.7/mmbtu compared this with LNG import price it would
increase the cost by more than 25 times. It is currently expected by the petroleum minister that the LNG cost will be around $ 8 /mmbtu. However, ministry of petroleum could not decide whether imported LNG would be used by the fertilizer industry or for power production in the country. Manufacturers of
fertilizer were not allowed to import LNG and only PSO is allowed to do so as per the directions of the government at a higher price of $16-18 per MMBTU.40 Importing LNG has also revealed several issues as ministries struggle to resolve a series of problems at
the port, in the gas transmission system and on the legal front. On the other hand, the Qatar Gas has declined to dispatch Q-Flex ship loaded with LNG for the time being.41 To temporarily sort the issue, Pakistan State Oil (PSO) requested Engro Corporation’s subsidiary Engro Elengy Terminal Limited (EETL)
to hurriedly unload its Floating Storage and Re-gasification Unit (FSRU) so that it could be dispatched to the Middle East for filling LNG. This will temporarily solve the issue but will cost ore than the traditional method. Moreover, payment mechanism for LNG has still not been implemented.
39
LNG imports to help save Rs 35 billion annually: experts – Brecorder April 23, 2015 40
No local gas for CNG, fertilizer and private power sectors – The news April 28, 2015 41
Import of LNG hits snag – Dawn Apr 13, 2015
Risk Management Department SECTOR STUDY - FERTILIZERS
R e s e a r c h , F I , M a r k e t & L i q u i d i t y R i s k
Page 30
11. Recommendation
The fertilizer industry is of strategic importance to the agriculture sector & domestic economy which is why the GOP has historically provided various incentives to encourage investment in the sector & keep fertilizer prices low. Government incentives have included conducive
investment policies, subsidies on feedstock & fuel gas, and direct subsidies on various fertilizer products.
After privatization & consolidation in the industry there are 7 remaining manufacturers in the domestic market all in the private sector. With the exception of Agritech Limited, the rest of the companies are backed by strong & stable groups with diversified business interests. Engro Fertilizers was highly leveraged due to the debt it assumed in setting up the Enven plant. It was
adversely affected because of the gas curtailment and experienced lower profits. However, last year it was consistently able to repay the loan as per schedule and regained the profitability level as the gas curtailment relaxed for Engro Fertilizer plant at lower rates.
Agritech was taken over by Azgard9 after its privatization along with Hazara Phosphate Limited (which was later merged into Agritech). However, the company was not able to sustain
operations profitably & has entered into an Equity Sale & Debt Swap Agreement with banks and other creditors to settle its debts & concentrate on its core textile business.
The industry has generally shown healthy & stable profit margins & strong fundamentals. Because demand has exceeded supply, manufacturers have generally been able to sell all their output. In recent years the gas crisis & erratic policies of the GOP have affected profits of the
industry. Additionally, floods & rains and fall in crop prices have also led to an overall reduction in urea consumption during the last 2 years.
The gas availability issue is expected to improve after the Kunnar Pasaki Deep gas field will provide 130 mmcfd after ratification from the government. It will also take 9 months in construction of the pipeline
However, the policy of providing subsidized gas to the sector is under review with the Minister of Water & Power labeling gas rates given to the fertilizer sector as unacceptable. This is because gas supply in the country is already well below demand and the gap is expected to
widen significantly in the coming years. If feed gas prices are bought in line with fuel gas prices it will translate into a 70% increase in gas costs for fertilizer manufacturers.
If gas subsidies to the sector are phased out manufacturers will try & pass on the increase in costs to consumers. However, the extent to which manufacturers are able to pass on the increased costs will depend on the prevailing international prices as domestic manufacturers
may not be able to be able to sell above international prices.
The only company to benefit from the above scenario is Fatima Fertilizer as its gas contract is
locked in for a period of 10 years allowing it gas at subsidized rates. Thus any increase in urea prices will go directly to its bottom line.

Risk Management Department SECTOR STUDY - FERTILIZERS
R e s e a r c h , F I , M a r k e t & L i q u i d i t y R i s k
Page 31
In the long run given the shortage of gas in the country, we can expect that subsidies will have to be reduced or done away with sooner or later. This will lead to an increase in fertilizer costs
and consequently crop prices. It is also possible that a free trade agreement is made with China which will allow cheaper imports into Pakistan as China is already using Coal to manufacture fertilizer. This will be a serious setback for the fertilizer industry.
After the removal of sanctions on Iran, Gas at lower rate is expected to fill in the deficit in Pakistan.
It is recommended not to increase the exposure until fertilizer manufacturers become capable and utilize coal to manufacture fertilizers. This is because the gas reserves in Pakistan will not last long and it is not viable to import natural gas for fertilizer industry as then the industry
cannot compete with the international industry.
Considering the above factors, it is recommended that exposure to the sector should not be
increased from existing levels until GOP policies regarding the sector are clear. This is because imported LNG will change the price structure of the existing companies and it is not clear how many of the firms will be able to sustain a healthy profit margin after getting a high cost LNG.