fertilizer distribution flows and logistic costs in brazil ... · they are the ports of itacoatiara...
TRANSCRIPT
© 2018 Da Costa Simões et al.407
International Food and Agribusiness Management ReviewVolume 21 Issue 3, 2018; DOI: 10.22434/IFAMR2017.0037
Received: 1 May 2017 / Accepted: 27 December 2017
OPEN ACCESS
Fertilizer distribution flows and logistic costs in Brazil: changes and benefits arising from investments in port terminals
RESEARCH ARTICLE
Débora da Costa Simões a, José Vicente Caixeta-Filhob, and Udatta S. Palekarc
aConsultant, Agroconsult, Rua Cônego Vicente Miguel Marino, 275 #234 C, Barra Funda 01135-020, São Paulo-SP, Brazil
bProfessor, “Luiz de Queiroz” Agricultural College (ESALQ), University of São Paulo (USP), Av. Pádua Dias 11, São Dimas 13418-900, Piracicaba-SP, Brazil
cProfessor, University of Illinois at Urbana-Champaign, College of Business, 4016 BIF, 515 East Gregory Drive, 61820 Champaign, IL, USA
Abstract
This study analyzes the impact of anticipated investments to alter Brazilian port infrastructure on fertilizer flows and fertilizer transportation logistics costs using a linear programming model designed for the task. The most notable among these investments are directed toward accelerating port development in Brazil’s “Northern-Arc”, thereby increasing fertilizer supply to new markets opening throughout the country’s expanding agricultural frontier, particularly in northern Mato Grosso state, while increasing supply to existing markets. Results from model runs show that the anticipated port infrastructure investments should ensure nationwide fertilizer logistics savings of US$ 845 million over the 2017 through 2025 period. Although these estimated benefits are outstanding, the study indicates that further expansion of Brazil’s port system, particularly in the Northern-Arc, presents additional opportunities. Model projections were that in 2025, after all planned infrastructure improvements are operational, port terminals will be near full capacity, which should make planning for future projects a current priority.
Keywords: fertilizer market, logistic flows, mathematical programming, Northern-ArcJEL code: C61, R41, R42
Corresponding author: [email protected]
http
://w
ww
.wag
enin
gena
cade
mic
.com
/doi
/10.
2243
4/IF
AM
R20
17.0
037
- T
uesd
ay, M
arch
20,
201
8 11
:29:
54 A
M -
Uni
vers
ity o
f M
inne
sota
- T
win
Citi
es I
P A
ddre
ss:1
34.8
4.17
.184
International Food and Agribusiness Management Review408
Da Costa Simões et al. Volume 21, Issue 3, 2018
1. Introduction
Primarily due to rapid agricultural production growth, the Brazilian fertilizer market grew from 16.4 million metric tons in 2000 to 32.2 million metric tons in 2014 (National Association of Fertilizer Diffusers – ANDA, 2015). This impressive growth rate calls for logistical investments to increase the country’s limited capacity to supply the fertilizer needed to meet increasing future demand. The challenge has been to demonstrate this reality to both public and private investors.
Over coming years, Brazilian agribusiness is expected to continue growing. Agroconsult (personal communication) estimates that by 2025 Brazilian grain production may surpass 310 million metric tons, an increase of more than 100 million metric tons from the 2015 figure. Over those ten years, the country will have been responsible for a 56% increase in the world’s supply of soy and a 16% increase in the world’s supply of corn. Given that Brazil has the largest amount of unexplored arable land in the world, a supportive government, presents favorable climatic and soil conditions for agriculture, and can competitively produce a wide range of products, these estimates are reasonable. Even with these advantages, Brazilian agricultural producers still need to prepare and fertilize the poor, acidic soils that predominate in the country. Consequently, the foreseen growth of Brazilian agricultural production, both through expansion and yield improvement, will certainly lead to a proportional increase in fertilizer demand, making the country’s fertilizer supply chain crucial to food security.
In 2015, Brazil was the world’s fourth largest fertilizer consumer by volume, behind China, India and the United States (IFA, 2015). Agroconsult (personal communication) estimates that Brazil will demand 43.6 million metric tons of fertilizer by 2025, an additional volume of 11.4 million metric tons over the 2014 value. The majority of Brazil’s fertilizer demand is satisfied through importation and it is estimated that demand for imported fertilizer will reach 33.1 million metric tons in 2025 (therefore, 76% of the country´s total demand), an increase of 38% over the volume imported in 2014 (Agroconsult, personal communication). In the coming years, fertilizer imports will continue to be needed to sustain Brazilian agricultural production growth.
The reliance on imports to satisfy the internal fertilizer market adds steps to the supply chain, making logistics planning crucial to transportation and storage company profits and to help insure that farmers can negotiate attractive pricing. The planning involved to economically and efficiently transport fertilizer in Brazil is both complex and often unrewarding due to the country’s degraded, muddled, and problematic logistics infrastructure. The costs to import fertilizer represent a significant percentage of the end consumer’s price and the Brazilian port complex adds an implicit cost: demurrage.
Besides the normal charges involved in the import process (maritime shipping, insurance, port expenditures and the Brazilian additional freight for the renovation of the merchant marin tax – AFRMM), the fertilizer industry imports often incur supplementary demurrage costs, i.e. fines for delays that occur when vessels are prevented from berthing and discharging cargo within the stipulated lay days and time. In Brazil, demurrage charges are always a possibility. Some Brazilian port delays are predictable, occurring due to seasonal port congestion (most often between June and September), others arise as the unpredictable aftereffect of a set of operational problems at ports, such as a lack of space for berthing, insufficient storage capacity, lack of equipment, or bureaucratic impediments.
Using the average prices for the main fertilizer products imported into Brazil in 2014 as a basis for comparison, Brazilian overland shipping expenditures alone add an additional 21.1% to the price of urea; 15.4% to the price of monoammonium phosphate (MAP), and 22.2% to the price of potassium chloride (KCl). After adding the other import logistics costs, such as maritime shipping charges, port costs, demurrage and the AFRMM tax, these percentages reach 40.1, 29.3 and 42.2%, respectively. This group of logistics chain factors penalizes fertilizer consumers as it dramatically raises costs associated with the international movement of products; and the penalty added to Brazilian import costs is larger than most, exceeding that of China and India.
http
://w
ww
.wag
enin
gena
cade
mic
.com
/doi
/10.
2243
4/IF
AM
R20
17.0
037
- T
uesd
ay, M
arch
20,
201
8 11
:29:
54 A
M -
Uni
vers
ity o
f M
inne
sota
- T
win
Citi
es I
P A
ddre
ss:1
34.8
4.17
.184
International Food and Agribusiness Management Review409
Da Costa Simões et al. Volume 21, Issue 3, 2018
In the 2016 Logistics Performance Index survey from the World Bank (2016), Brazil occupies the 55th position in a ranking of 160 countries, having scored 3.09 out of 5.00 points. In this same year, China scored 3.66 (46th place) and India scored 3.42 (35th position). When compared with the scores from other years, this score shows that Brazil’s performance is, at best, erratic, having fluctuated between 41st (2012) and 65th (2014). Moreover, of the six criteria that each country was judged by, aspects directly related to imports (customs and international shipment) had the lowest Brazilian scores in 2016.
Taking into consideration the recent policies driven by the Brazilian government, this study embodies three main measures that may reduce the Brazilian fertilizer industry’s total logistics costs: (1) improvements in port operations and processes intended 7to decrease demurrage expenses; (2) greater usage of the country’s railways and waterways – which in 2015 account for less than 5% of total fertilizer flows within Brazil; and (3) investment in new structures and port capacity, especially focusing on the development of the “Northern-Arc”1 corridors that will help reduce bottlenecks at Brazil’s southern ports and may loosen supply in some markets.
This study will analyze the effect of new investments in Brazilian port logistics infrastructure on the internal flows and final consumer cost of imported fertilizers from 2014 through 2025. It also contains an estimate of the potential volume of fertilizer that can arrive through the Northern-Arc ports alone and measures potential gains to Brazilian farmers, especially in Mato Grosso state, should they begin receiving imported fertilizer from these northern ports rather than southern ports.
2. Regional demand for imported fertilizer
The volume of imported fertilizer brought into each Brazilian mesoregion can be estimated based on the difference between the amount of fertilizer demanded in each market and the corresponding production or consumption of domestically produced fertilizer in that market. Demand was determined at the specific product level (i.e. urea, MAP, KCl, etc.) by mesoregion rather than at the aggregated fertilizer level to minimize estimation errors and produce more robust and accurate results. It was assumed that domestic production is preferred over imports; therefore, all types of fertilizers produced domestically are distributed among the demanding markets, preferably from the nearest site producing the specified type of fertilizer, with the remaining mesoregional demand for that type of fertilizer being supplied by imports.
This study used national fertilizer production data by product and Brazilian administrative region published by ANDA (2015).2 State level production was then estimated according to the production capacity available in each state using information found in ANDA’s 2014 Yearbook. ANDA also publishes data on total fertilizer raw material deliveries at the country level. The raw material market in each state is estimated by using main nutrient requirement formulas for each crop in a particular mesoregion and ANDA’s historical data regarding nutrient and raw material deliveries.
ANDA’s state, regional, and national data were extrapolated to the 46 mesoregions based on area under cultivation statistics provided by the Brazilian Institute of Geography and Statistics’ (IBGE) database (2015) for 2014 and Agroconsult’s projections for the years from 2015 through 2025 (Agroconsult, personal communication).3 The quantities of imported fertilizer needed to supply demand in each mesoregion through the year 2025 were then calculated under the assumption that imported fertilizers would be used to meet any shortfalls in domestic supply.
1 In this paper, ports in the “Northern-Arc” are those that are operational or planned and located on the Amazon River, one of its tributaries, or the northern Atlantic Coast. They are the ports of Itacoatiara (AM), Santarém (PA), Vila do Conde (PA), Itaqui (MA) and Miritituba (PA) unless otherwise noted.2 There are five Brazilian administrative regions: North, Northeast, Central-West, Southeast and South.3 The 46 mesoregions are noted in Supplementary Table S1.
http
://w
ww
.wag
enin
gena
cade
mic
.com
/doi
/10.
2243
4/IF
AM
R20
17.0
037
- T
uesd
ay, M
arch
20,
201
8 11
:29:
54 A
M -
Uni
vers
ity o
f M
inne
sota
- T
win
Citi
es I
P A
ddre
ss:1
34.8
4.17
.184
International Food and Agribusiness Management Review410
Da Costa Simões et al. Volume 21, Issue 3, 2018
Brazil was also separated into 12 alternative regions. These regions were not purposely aligned with the official Brazilian administrative regions but were determined in consonance with current imported fertilizer flows and state borders.
3. Port capacity, freight and other logistics costs
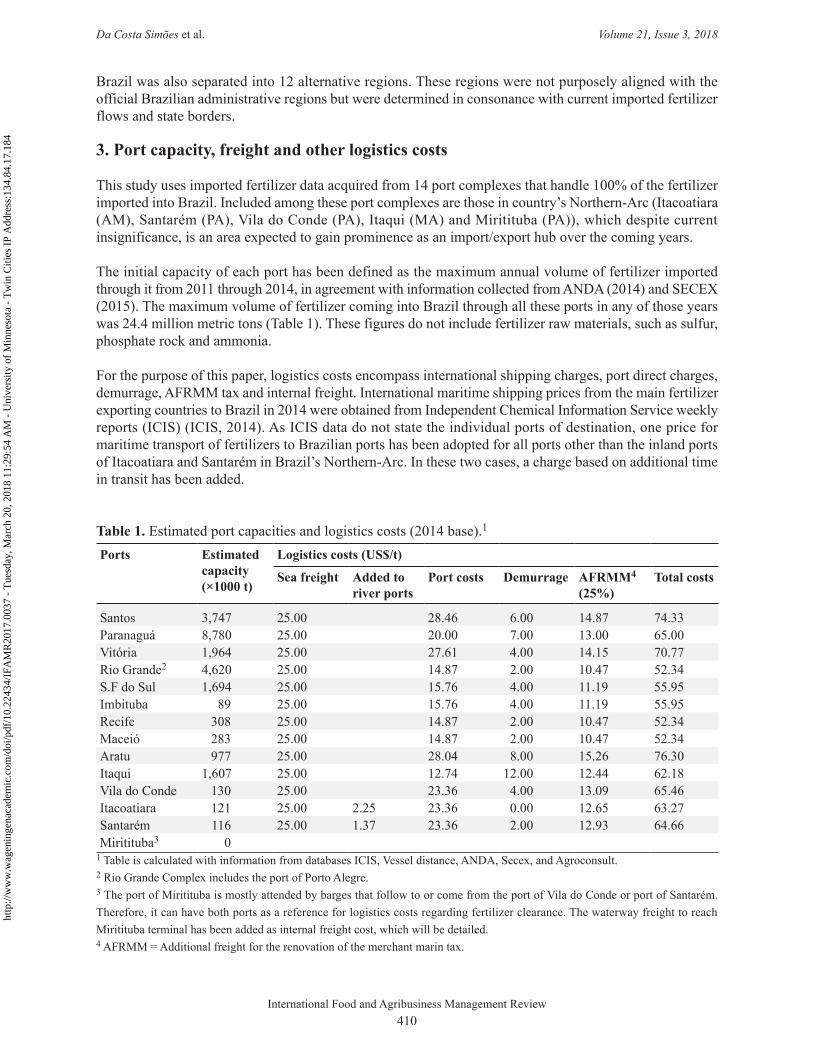
This study uses imported fertilizer data acquired from 14 port complexes that handle 100% of the fertilizer imported into Brazil. Included among these port complexes are those in country’s Northern-Arc (Itacoatiara (AM), Santarém (PA), Vila do Conde (PA), Itaqui (MA) and Miritituba (PA)), which despite current insignificance, is an area expected to gain prominence as an import/export hub over the coming years.
The initial capacity of each port has been defined as the maximum annual volume of fertilizer imported through it from 2011 through 2014, in agreement with information collected from ANDA (2014) and SECEX (2015). The maximum volume of fertilizer coming into Brazil through all these ports in any of those years was 24.4 million metric tons (Table 1). These figures do not include fertilizer raw materials, such as sulfur, phosphate rock and ammonia.
For the purpose of this paper, logistics costs encompass international shipping charges, port direct charges, demurrage, AFRMM tax and internal freight. International maritime shipping prices from the main fertilizer exporting countries to Brazil in 2014 were obtained from Independent Chemical Information Service weekly reports (ICIS) (ICIS, 2014). As ICIS data do not state the individual ports of destination, one price for maritime transport of fertilizers to Brazilian ports has been adopted for all ports other than the inland ports of Itacoatiara and Santarém in Brazil’s Northern-Arc. In these two cases, a charge based on additional time in transit has been added.
Table 1. Estimated port capacities and logistics costs (2014 base).1
Ports Estimated capacity (×1000 t)
Logistics costs (US$/t)
Sea freight Added to river ports
Port costs Demurrage AFRMM4 (25%)
Total costs
Santos 3,747 25.00 28.46 6.00 14.87 74.33Paranaguá 8,780 25.00 20.00 7.00 13.00 65.00Vitória 1,964 25.00 27.61 4.00 14.15 70.77Rio Grande2 4,620 25.00 14.87 2.00 10.47 52.34S.F do Sul 1,694 25.00 15.76 4.00 11.19 55.95Imbituba 89 25.00 15.76 4.00 11.19 55.95Recife 308 25.00 14.87 2.00 10.47 52.34Maceió 283 25.00 14.87 2.00 10.47 52.34Aratu 977 25.00 28.04 8.00 15.26 76.30Itaqui 1,607 25.00 12.74 12.00 12.44 62.18Vila do Conde 130 25.00 23.36 4.00 13.09 65.46Itacoatiara 121 25.00 2.25 23.36 0.00 12.65 63.27Santarém 116 25.00 1.37 23.36 2.00 12.93 64.66Miritituba3 0
1 Table is calculated with information from databases ICIS, Vessel distance, ANDA, Secex, and Agroconsult.2 Rio Grande Complex includes the port of Porto Alegre.3 The port of Miritituba is mostly attended by barges that follow to or come from the port of Vila do Conde or port of Santarém. Therefore, it can have both ports as a reference for logistics costs regarding fertilizer clearance. The waterway freight to reach Miritituba terminal has been added as internal freight cost, which will be detailed.4 AFRMM = Additional freight for the renovation of the merchant marin tax.
http
://w
ww
.wag
enin
gena
cade
mic
.com
/doi
/10.
2243
4/IF
AM
R20
17.0
037
- T
uesd
ay, M
arch
20,
201
8 11
:29:
54 A
M -
Uni
vers
ity o
f M
inne
sota
- T
win
Citi
es I
P A
ddre
ss:1
34.8
4.17
.184
International Food and Agribusiness Management Review411
Da Costa Simões et al. Volume 21, Issue 3, 2018
The average maritime freight rate for fertilizer shipped from foreign ports to Brazilian ports has been estimated to be US$ 25/mt, which is the average freight rate from two relevant fertilizer exporting origins, the ports of Yuznhy, Ukraine and Vancouver, Canada, to the Northern-Arc port of Vila do Conde. The duration of the maritime portion of the import process is also relevant as it is used to estimate the additional cost for fertilizer shipment via waterway from Vila do Conde to the inland Brazilian ports of Santarém and Itacoatiara. The voyage to Santarém takes 17 additional hours, which results in a supplementary charge of US$ 1.37/mt; the voyage to Itacoatiara takes an additional 28 hours, which results in a supplementary charge of US$ 2.25/mt. The journey time data came from Vessel Distance (2015) and considers the shortest sea route between selected ports.
A 25% AFRMM tax has also been applied to the maritime shipping cost and to overall port costs, including demurrage. All the costs by port of arrival in Brazil and these ports’ fertilizer import capacities are presented in Table 1.
Internal freight costs between Brazilian ports and the study’s 12 fertilizer demanding regions have been calculated based on the following equation developed by ESALQ-LOG (personal communication):
Fij = 13.54590 + 0.026130 × Rij + 0.01307 × Wij + 5.00000 × MIj (1)
where:Fij = total cost to move freight from Brazilian port i to destination j;Rj = total road distance between Brazilian port i, to destination j;Wj = total waterway distance from Brazilian port i, to destination j;MIj = dummy variable associated with additional shipping costs from Brazilian port i, to inland ports
(equal to 1 for the ports of Miritituba or Itacoatiara, 0 otherwise).
The waterway mode has been taken into account only for the routes beginning at the port of Itacoatiara and transshipped to the Porto Velho-RO terminal and from the ports of Vila do Conde and Santarém and transshipped to the river port of Miritituba. In these cases, additional shipping costs have been added to the total freight shipping costs shown in Equation (1).
In absence of any official truck road network for trucks or for trucks carrying fertilizer, the distance between a Brazilian port and the fertilizer’s destination was determined using data obtained from Google Maps. As a criterion, for sake of simplicity, it is assumed that quickest routes are sufficient, i.e. the quickest routes have been selected since shipping costs are usually lower in these cases. River distances are based on information from the Brazilian National Water Transport Agency (ANTAQ, 2014).
4. Mathematical model
The mathematical structure of linear programming adopted in this study follows the main features of the “transportation problem” optimization model. According to Jensen (1999) and Sharma et al. (2012), the transportation problem seeks to minimize the costs involved in moving products from a number of origins or sources to a set of destinations while satisfying some constraints.
As mentioned by Sharma et al. (2012), the transportation problem was firstly presented by Hitchcock (1941) and further discussed by Koopman (1949) in his reference work about the utilization of the transportation system. Since then, this method evolved in order to include multi-objective problems such as minimizing costs and duration of the flow concomitantly. The same technique might be applied to evaluate the competitiveness and feasibility of existing or new logistic projects. The results obtained can help both private and public sectors to better allocate their scarce resources and improve returns by identifying opportunities, choosing the best locations and planning the most suitable size of the investment, among other benefits derived from measuring and analyzing such flows and costs.
http
://w
ww
.wag
enin
gena
cade
mic
.com
/doi
/10.
2243
4/IF
AM
R20
17.0
037
- T
uesd
ay, M
arch
20,
201
8 11
:29:
54 A
M -
Uni
vers
ity o
f M
inne
sota
- T
win
Citi
es I
P A
ddre
ss:1
34.8
4.17
.184
International Food and Agribusiness Management Review412
Da Costa Simões et al. Volume 21, Issue 3, 2018
Milanez et al. (2010), for instance, developed a mathematical model to estimate the logistics infrastructure required to support future demand for ethanol in Brazil. Frias et al. (2013) planned the best logistic network for a company from the petrochemical industry whereas Hamad and Gualda (2014) did the same for agribusiness companies but also measuring the impact of seasonality and taxes. Besides, this method is quite often adopted in a number of studies and reports aiming at guiding public policies and new investments in infrastructure, especially focusing on Brazilian grains export flows (ANTT, 2014; Caixeta-Filho, 2010; MAPA, 2013).
There is no tradition, however, in developing optimization models for the fertilizer industry in Brazil. Some few examples come from Carvalho (2009), who developed a model to estimate the best location for fertilizer blending units in the Center-West region, as well as Pereira et al. (2016), who design and implemented a model to adjust and plan the logistic network for nitrogen fertilizers produced by Petrobras due to the company’s new investments in the country.
To achieve the purpose of this study, the model developed is comprehensive. Regarding supply, the model considers 14 points of Brazilian origins. Those 14 origins are comprised by the main Brazilian ports used for current fertilizer importation and the Northern-Arc port complexes, which have the potential to play an important role in the future. The demand side is represented by 46 demanding mesoregions defined by their agricultural profile and current logistic characteristics. For each mesoregion, a municipality of reference has been selected according to its relevance in the mesoregion’s agricultural production. The state of Mato Grosso, for example, was broken into four mesoregions with the following reference cities: North – Sorriso, South – Rondonópolis, East – Canarana, and West – Campo Novo do Parecis. The complete list mesoregions, their corresponding reference municipalities, the states they are located in, and the ports that supply their imported fertilizer can be found in Supplementary Figure S1.
In order to make uncluttered graphic illustration of the study’s results possible and to clarify our tables and discussions, the outcomes from analysis of each of the 46 mesoregions’ data were ascribed to one of this study’s 12 regions depending on the mesoregions location. The regions were defined respecting state borders and the fertilizer supply chain’s current logistics structure. The 12 regions’ boundaries are graphically depicted in Supplementary Figure S2.
The general structure of the imported fertilizer transportation model’s objective function (2 and 3) and its constraints (4 and 5) are presented below:
MinZ = 14∑i=1
46∑j=1
Cij Xij (2)
where:
Cij = Si + Pi + Ei + Ti + Fij (3)
subject to:14∑i=1
Xij = Dj, for all j (4)46∑j=1
≤ 0i , for all i (5)
in which:Z = value of the objective function;Xij = volume of fertilizer transported between Brazilian port i and destination mesoregion j;Cij = total logistic cost from Brazilian port i to destination mesoregion j;Si = maritime cost of transport to Brazilian port i;Pi = port costs at Brazilian port i;Ei = demurrage expenses at Brazilian port i;
http
://w
ww
.wag
enin
gena
cade
mic
.com
/doi
/10.
2243
4/IF
AM
R20
17.0
037
- T
uesd
ay, M
arch
20,
201
8 11
:29:
54 A
M -
Uni
vers
ity o
f M
inne
sota
- T
win
Citi
es I
P A
ddre
ss:1
34.8
4.17
.184
International Food and Agribusiness Management Review413
Da Costa Simões et al. Volume 21, Issue 3, 2018
Ti = AFRMM tax at Brazilian port i;Fij = freight cost from Brazilian port i to destination mesoregion j;Dj = volume of imported fertilizer demanded by destination mesoregion j;Oi = Brazilian port j capacity to receive imported fertilizer.
The fertilizer mathematical model was solved using the Simplex method for linear programming problems and run with the help of the Solver Premium Platform (FrontLine Solvers version 2015, Frontline Systems Inc, Incline Village, NV, USA).
5. New investments in port infrastructure: possible scenarios
A number of companies intend to invest in the Brazilian fertilizer sector as the sector’s outlook is very positive. Two projects to increase domestic production should be in operation within the time-frame considered in this paper. One is a Petrobrás’ facility planned for Três Lagoas in the state of Mato Grosso do Sul. That facility will add approximately 1 million metric tons of urea to the market beginning in 2020. The other project is the expansion of KCl production undertaken by Vale do Doce in the state of Sergipe that will more than double its 2015 level of production by 2020 (ANDA, 2013).
Attention is being given to the improvement of Brazil’s road, railway, and port transportation infrastructure. In June 2015, the Brazilian government announced the second phase of the Brazilian Logistic Investments Program 2015-2018, which will continue modernization of the country’s transport infrastructure. The Program relies primarily on private sector initiatives. Investments in Brazil’s port sector that directly impact imported fertilizer flows are expected to reach approximately US$ 15.9 billion (Brasil, 2015).
The Program proposes that four new port terminals dedicated to fertilizer handling be constructed: two at the Port of Santos, one at the Port of Santarém, and one at the Port of Itaqui (Brasil, 2015; Government of Maranhão, 2015). Program proposals also include construction of a new berth at the port of São Francisco do Sul that will increase the port’s current fertilizer import capacity (A Notícia, 2015). New investment is also planned for the Port of Paranaguá to expand the terminal at Antonina and for the Port of Rio Grande. Moreover, the Paranaguá and Antonina Port Administration (APPA) has announced that it may dedicate an extra berth for fertilizer shipments to keep pace with internal demand growth (APPA, 2015; Global Fert, 2015; Zero Hora, 2015).
Demurrage expenses should drop when these port investments become operational. Since this potential impact is difficult to measure, the effects of similar measures adopted by APPA at Paranaguá in 2012 and 2013 have been adopted as a proxy. Using this proxy, a demurrage cost reduction of 30% is expected for all ports receiving investments except for Itaqui, where a 40% decrease was set due to current critical storage levels (Vargas, 2015). All other costs were maintained at 2014 prices.
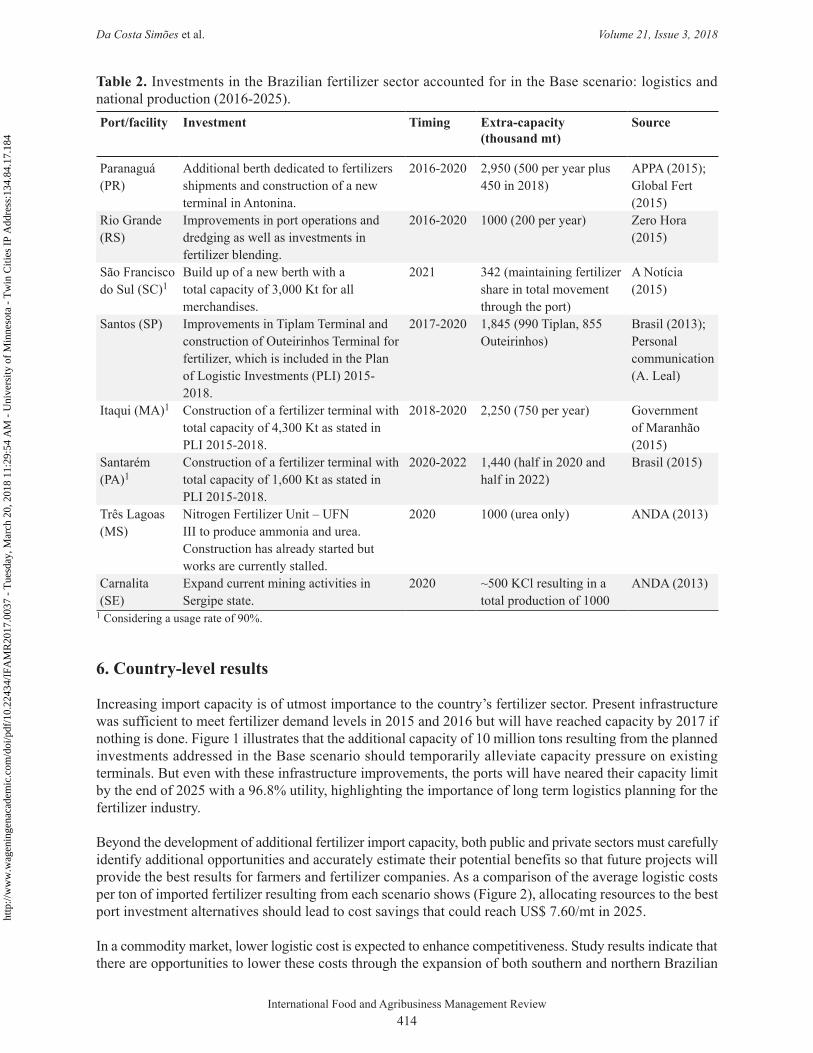
All investments taken into consideration in this study’s Base scenario are summarized in Table 2 as are their impacts on import capacity or domestic fertilizer production.
In order to enrich the analysis, three alternative scenarios were constructed. Scenario 2 considers that no investments in the Northern-Arc ports will have resulted in operational facilities by 2025; consequently, additional fertilizer demand will be entirely supplied through southern ports. In this case, demurrage costs were maintained at 2014 levels. Scenario 3 does not restrict the capacities of Northern-Arc ports, simulating that maximum optimal volume can be imported through these terminals as all projected facilities are operational and have been upgraded. Finally, since new fertilizer terminals are already planned for the Northern-Arc ports of Santarém and Itaqui, Scenario 4 will focus the analysis on the other Northern-Arc ports: Vila do Conde, Miritituba, and Itacoatiara.
http
://w
ww
.wag
enin
gena
cade
mic
.com
/doi
/10.
2243
4/IF
AM
R20
17.0
037
- T
uesd
ay, M
arch
20,
201
8 11
:29:
54 A
M -
Uni
vers
ity o
f M
inne
sota
- T
win
Citi
es I
P A
ddre
ss:1
34.8
4.17
.184
International Food and Agribusiness Management Review414
Da Costa Simões et al. Volume 21, Issue 3, 2018
6. Country-level results
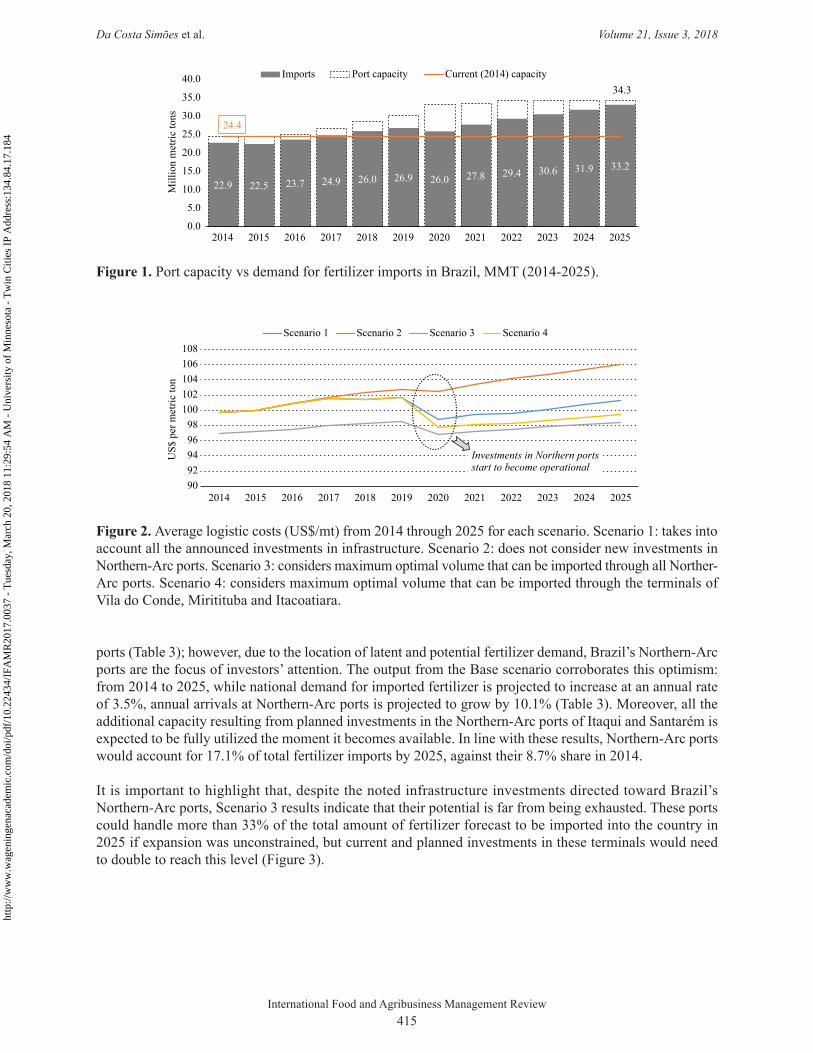
Increasing import capacity is of utmost importance to the country’s fertilizer sector. Present infrastructure was sufficient to meet fertilizer demand levels in 2015 and 2016 but will have reached capacity by 2017 if nothing is done. Figure 1 illustrates that the additional capacity of 10 million tons resulting from the planned investments addressed in the Base scenario should temporarily alleviate capacity pressure on existing terminals. But even with these infrastructure improvements, the ports will have neared their capacity limit by the end of 2025 with a 96.8% utility, highlighting the importance of long term logistics planning for the fertilizer industry.
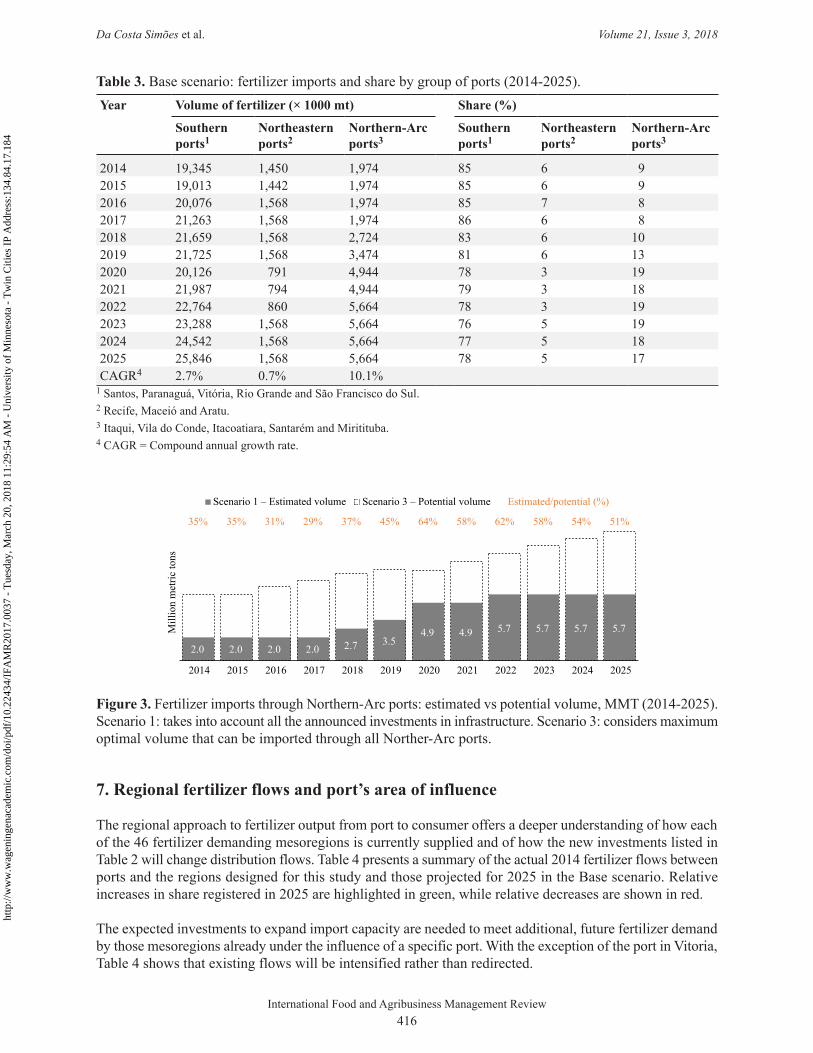
Beyond the development of additional fertilizer import capacity, both public and private sectors must carefully identify additional opportunities and accurately estimate their potential benefits so that future projects will provide the best results for farmers and fertilizer companies. As a comparison of the average logistic costs per ton of imported fertilizer resulting from each scenario shows (Figure 2), allocating resources to the best port investment alternatives should lead to cost savings that could reach US$ 7.60/mt in 2025.
In a commodity market, lower logistic cost is expected to enhance competitiveness. Study results indicate that there are opportunities to lower these costs through the expansion of both southern and northern Brazilian
Table 2. Investments in the Brazilian fertilizer sector accounted for in the Base scenario: logistics and national production (2016-2025).Port/facility Investment Timing Extra-capacity
(thousand mt)Source
Paranaguá (PR)
Additional berth dedicated to fertilizers shipments and construction of a new terminal in Antonina.
2016-2020 2,950 (500 per year plus 450 in 2018)
APPA (2015); Global Fert (2015)
Rio Grande (RS)
Improvements in port operations and dredging as well as investments in fertilizer blending.
2016-2020 1000 (200 per year) Zero Hora (2015)
São Francisco do Sul (SC)1
Build up of a new berth with a total capacity of 3,000 Kt for all merchandises.
2021 342 (maintaining fertilizer share in total movement through the port)
A Notícia (2015)
Santos (SP) Improvements in Tiplam Terminal and construction of Outeirinhos Terminal for fertilizer, which is included in the Plan of Logistic Investments (PLI) 2015-2018.
2017-2020 1,845 (990 Tiplan, 855 Outeirinhos)
Brasil (2013); Personal communication (A. Leal)
Itaqui (MA)1 Construction of a fertilizer terminal with total capacity of 4,300 Kt as stated in PLI 2015-2018.
2018-2020 2,250 (750 per year) Government of Maranhão (2015)
Santarém (PA)1
Construction of a fertilizer terminal with total capacity of 1,600 Kt as stated in PLI 2015-2018.
2020-2022 1,440 (half in 2020 and half in 2022)
Brasil (2015)
Três Lagoas (MS)
Nitrogen Fertilizer Unit – UFN III to produce ammonia and urea. Construction has already started but works are currently stalled.
2020 1000 (urea only) ANDA (2013)
Carnalita (SE)
Expand current mining activities in Sergipe state.
2020 ~500 KCl resulting in a total production of 1000
ANDA (2013)
1 Considering a usage rate of 90%.
http
://w
ww
.wag
enin
gena
cade
mic
.com
/doi
/10.
2243
4/IF
AM
R20
17.0
037
- T
uesd
ay, M
arch
20,
201
8 11
:29:
54 A
M -
Uni
vers
ity o
f M
inne
sota
- T
win
Citi
es I
P A
ddre
ss:1
34.8
4.17
.184
International Food and Agribusiness Management Review415
Da Costa Simões et al. Volume 21, Issue 3, 2018
ports (Table 3); however, due to the location of latent and potential fertilizer demand, Brazil’s Northern-Arc ports are the focus of investors’ attention. The output from the Base scenario corroborates this optimism: from 2014 to 2025, while national demand for imported fertilizer is projected to increase at an annual rate of 3.5%, annual arrivals at Northern-Arc ports is projected to grow by 10.1% (Table 3). Moreover, all the additional capacity resulting from planned investments in the Northern-Arc ports of Itaqui and Santarém is expected to be fully utilized the moment it becomes available. In line with these results, Northern-Arc ports would account for 17.1% of total fertilizer imports by 2025, against their 8.7% share in 2014.
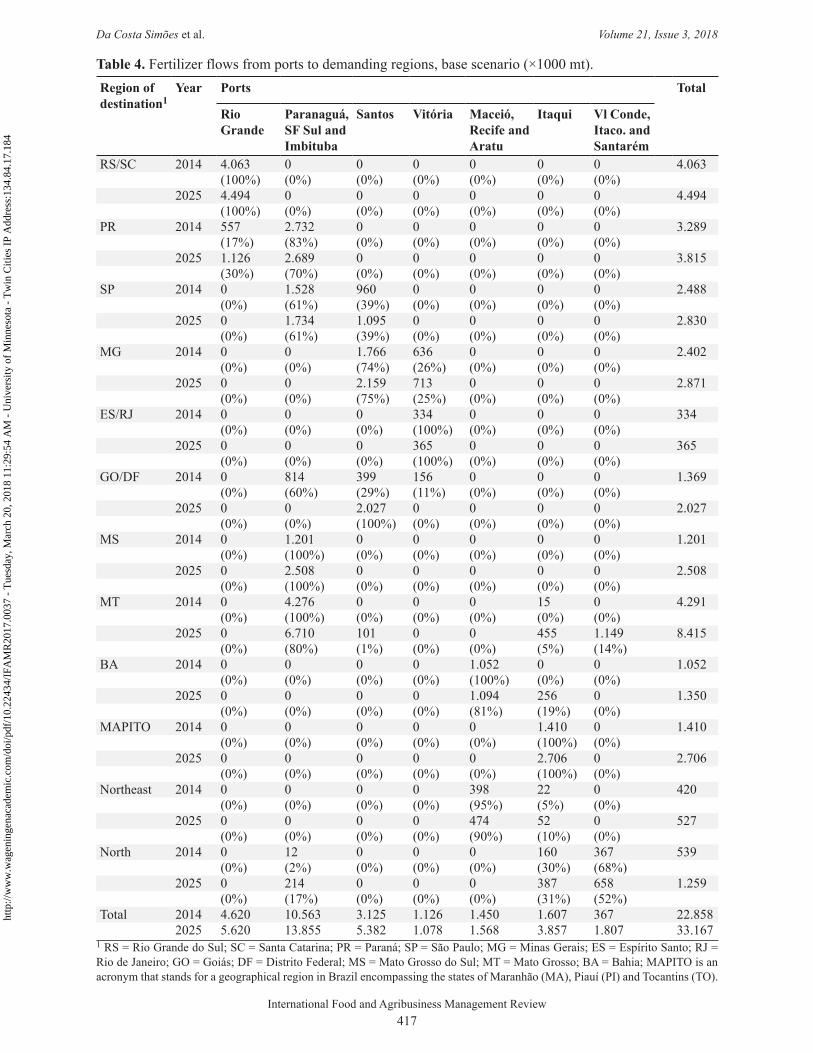
It is important to highlight that, despite the noted infrastructure investments directed toward Brazil’s Northern-Arc ports, Scenario 3 results indicate that their potential is far from being exhausted. These ports could handle more than 33% of the total amount of fertilizer forecast to be imported into the country in 2025 if expansion was unconstrained, but current and planned investments in these terminals would need to double to reach this level (Figure 3).
Figure 1. Port capacity vs demand for fertilizer imports in Brazil, MMT (2014-2025).
22.9 22.5 23.7 24.9 26.0 26.9 26.0 27.8 29.4 30.6 31.9 33.2
34.3
24.4
0.0
5.0
10.0
15.0
20.0
25.0
30.0
35.0
40.0
2014 2015 2016 2017 2018 2019 2020 2021 2022 2023 2024 2025
Mill
ion
met
ric to
ns
Imports Port capacity Current (2014) capacity
Figure 2. Average logistic costs (US$/mt) from 2014 through 2025 for each scenario. Scenario 1: takes into account all the announced investments in infrastructure. Scenario 2: does not consider new investments in Northern-Arc ports. Scenario 3: considers maximum optimal volume that can be imported through all Norther-Arc ports. Scenario 4: considers maximum optimal volume that can be imported through the terminals of Vila do Conde, Miritituba and Itacoatiara.
9092949698
100102104106108
2014 2015 2016 2017 2018 2019 2020 2021 2022 2023 2024 2025
US$
per
met
ric to
n
Scenario 1 Scenario 2 Scenario 3 Scenario 4
Investments in Northern portsstart to become operational
http
://w
ww
.wag
enin
gena
cade
mic
.com
/doi
/10.
2243
4/IF
AM
R20
17.0
037
- T
uesd
ay, M
arch
20,
201
8 11
:29:
54 A
M -
Uni
vers
ity o
f M
inne
sota
- T
win
Citi
es I
P A
ddre
ss:1
34.8
4.17
.184
International Food and Agribusiness Management Review416
Da Costa Simões et al. Volume 21, Issue 3, 2018
7. Regional fertilizer flows and port’s area of influence
The regional approach to fertilizer output from port to consumer offers a deeper understanding of how each of the 46 fertilizer demanding mesoregions is currently supplied and of how the new investments listed in Table 2 will change distribution flows. Table 4 presents a summary of the actual 2014 fertilizer flows between ports and the regions designed for this study and those projected for 2025 in the Base scenario. Relative increases in share registered in 2025 are highlighted in green, while relative decreases are shown in red.
The expected investments to expand import capacity are needed to meet additional, future fertilizer demand by those mesoregions already under the influence of a specific port. With the exception of the port in Vitoria, Table 4 shows that existing flows will be intensified rather than redirected.
Table 3. Base scenario: fertilizer imports and share by group of ports (2014-2025).Year Volume of fertilizer (× 1000 mt) Share (%)
Southern ports1
Northeastern ports2
Northern-Arc ports3
Southern ports1
Northeastern ports2
Northern-Arc ports3
2014 19,345 1,450 1,974 85 6 92015 19,013 1,442 1,974 85 6 92016 20,076 1,568 1,974 85 7 82017 21,263 1,568 1,974 86 6 82018 21,659 1,568 2,724 83 6 102019 21,725 1,568 3,474 81 6 132020 20,126 791 4,944 78 3 192021 21,987 794 4,944 79 3 182022 22,764 860 5,664 78 3 192023 23,288 1,568 5,664 76 5 192024 24,542 1,568 5,664 77 5 182025 25,846 1,568 5,664 78 5 17CAGR4 2.7% 0.7% 10.1%
1 Santos, Paranaguá, Vitória, Rio Grande and São Francisco do Sul.2 Recife, Maceió and Aratu.3 Itaqui, Vila do Conde, Itacoatiara, Santarém and Miritituba.4 CAGR = Compound annual growth rate.
Figure 3. Fertilizer imports through Northern-Arc ports: estimated vs potential volume, MMT (2014-2025). Scenario 1: takes into account all the announced investments in infrastructure. Scenario 3: considers maximum optimal volume that can be imported through all Norther-Arc ports.
2.0 2.0 2.0 2.0 2.7 3.54.9 4.9 5.7 5.7 5.7 5.7
35% 35% 31% 29% 37% 45% 64% 58% 62% 58% 54% 51%
2014 2015 2016 2017 2018 2019 2020 2021 2022 2023 2024 2025
Mill
ion
met
ric to
ns
Scenario 1 – Estimated volume Scenario 3 – Potential volume Estimated/potential (%)
http
://w
ww
.wag
enin
gena
cade
mic
.com
/doi
/10.
2243
4/IF
AM
R20
17.0
037
- T
uesd
ay, M
arch
20,
201
8 11
:29:
54 A
M -
Uni
vers
ity o
f M
inne
sota
- T
win
Citi
es I
P A
ddre
ss:1
34.8
4.17
.184
International Food and Agribusiness Management Review417
Da Costa Simões et al. Volume 21, Issue 3, 2018
Table 4. Fertilizer flows from ports to demanding regions, base scenario (×1000 mt).Region of destination1
Year Ports Total
Rio Grande
Paranaguá, SF Sul and Imbituba
Santos Vitória Maceió, Recife and Aratu
Itaqui Vl Conde, Itaco. and Santarém
RS/SC 2014 4.063 0 0 0 0 0 0 4.063(100%) (0%) (0%) (0%) (0%) (0%) (0%)
2025 4.494 0 0 0 0 0 0 4.494(100%) (0%) (0%) (0%) (0%) (0%) (0%)
PR 2014 557 2.732 0 0 0 0 0 3.289(17%) (83%) (0%) (0%) (0%) (0%) (0%)
2025 1.126 2.689 0 0 0 0 0 3.815(30%) (70%) (0%) (0%) (0%) (0%) (0%)
SP 2014 0 1.528 960 0 0 0 0 2.488(0%) (61%) (39%) (0%) (0%) (0%) (0%)
2025 0 1.734 1.095 0 0 0 0 2.830(0%) (61%) (39%) (0%) (0%) (0%) (0%)
MG 2014 0 0 1.766 636 0 0 0 2.402(0%) (0%) (74%) (26%) (0%) (0%) (0%)
2025 0 0 2.159 713 0 0 0 2.871(0%) (0%) (75%) (25%) (0%) (0%) (0%)
ES/RJ 2014 0 0 0 334 0 0 0 334(0%) (0%) (0%) (100%) (0%) (0%) (0%)
2025 0 0 0 365 0 0 0 365(0%) (0%) (0%) (100%) (0%) (0%) (0%)
GO/DF 2014 0 814 399 156 0 0 0 1.369(0%) (60%) (29%) (11%) (0%) (0%) (0%)
2025 0 0 2.027 0 0 0 0 2.027(0%) (0%) (100%) (0%) (0%) (0%) (0%)
MS 2014 0 1.201 0 0 0 0 0 1.201(0%) (100%) (0%) (0%) (0%) (0%) (0%)
2025 0 2.508 0 0 0 0 0 2.508(0%) (100%) (0%) (0%) (0%) (0%) (0%)
MT 2014 0 4.276 0 0 0 15 0 4.291(0%) (100%) (0%) (0%) (0%) (0%) (0%)
2025 0 6.710 101 0 0 455 1.149 8.415(0%) (80%) (1%) (0%) (0%) (5%) (14%)
BA 2014 0 0 0 0 1.052 0 0 1.052(0%) (0%) (0%) (0%) (100%) (0%) (0%)
2025 0 0 0 0 1.094 256 0 1.350(0%) (0%) (0%) (0%) (81%) (19%) (0%)
MAPITO 2014 0 0 0 0 0 1.410 0 1.410(0%) (0%) (0%) (0%) (0%) (100%) (0%)
2025 0 0 0 0 0 2.706 0 2.706(0%) (0%) (0%) (0%) (0%) (100%) (0%)
Northeast 2014 0 0 0 0 398 22 0 420(0%) (0%) (0%) (0%) (95%) (5%) (0%)
2025 0 0 0 0 474 52 0 527(0%) (0%) (0%) (0%) (90%) (10%) (0%)
North 2014 0 12 0 0 0 160 367 539(0%) (2%) (0%) (0%) (0%) (30%) (68%)
2025 0 214 0 0 0 387 658 1.259(0%) (17%) (0%) (0%) (0%) (31%) (52%)
Total 2014 4.620 10.563 3.125 1.126 1.450 1.607 367 22.8582025 5.620 13.855 5.382 1.078 1.568 3.857 1.807 33.167
1 RS = Rio Grande do Sul; SC = Santa Catarina; PR = Paraná; SP = São Paulo; MG = Minas Gerais; ES = Espírito Santo; RJ = Rio de Janeiro; GO = Goiás; DF = Distrito Federal; MS = Mato Grosso do Sul; MT = Mato Grosso; BA = Bahia; MAPITO is an acronym that stands for a geographical region in Brazil encompassing the states of Maranhão (MA), Piauí (PI) and Tocantins (TO).
http
://w
ww
.wag
enin
gena
cade
mic
.com
/doi
/10.
2243
4/IF
AM
R20
17.0
037
- T
uesd
ay, M
arch
20,
201
8 11
:29:
54 A
M -
Uni
vers
ity o
f M
inne
sota
- T
win
Citi
es I
P A
ddre
ss:1
34.8
4.17
.184
International Food and Agribusiness Management Review418
Da Costa Simões et al. Volume 21, Issue 3, 2018
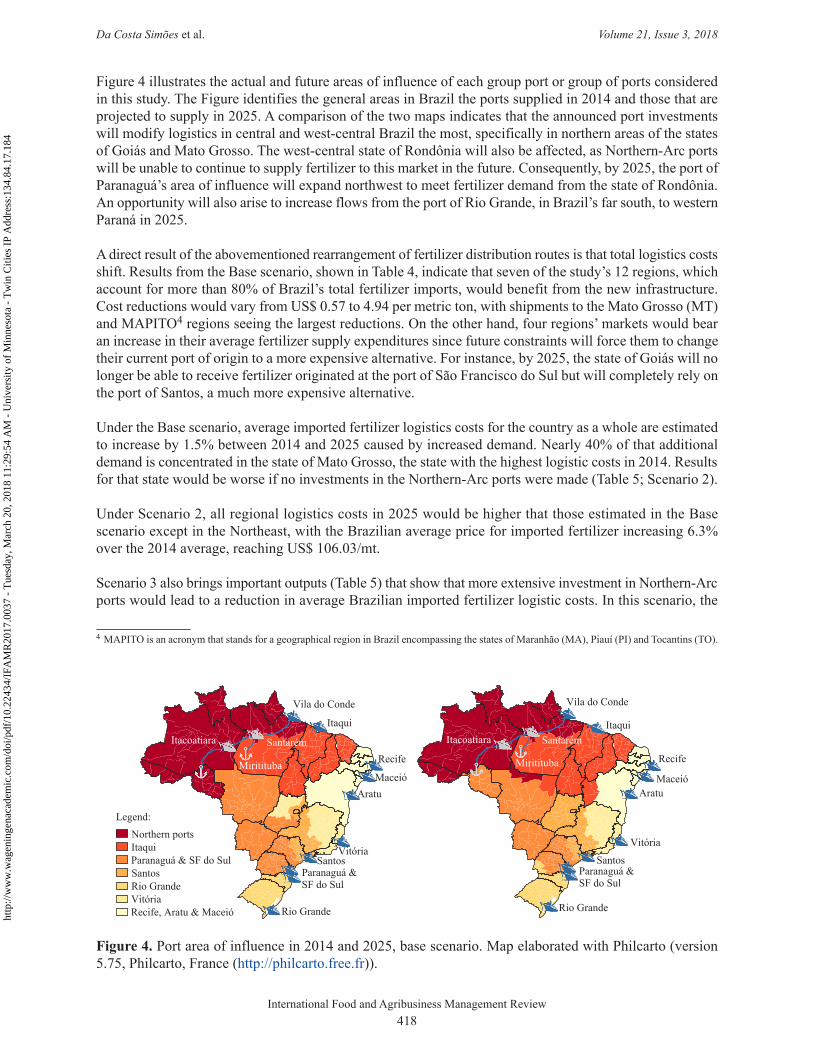
Figure 4 illustrates the actual and future areas of influence of each group port or group of ports considered in this study. The Figure identifies the general areas in Brazil the ports supplied in 2014 and those that are projected to supply in 2025. A comparison of the two maps indicates that the announced port investments will modify logistics in central and west-central Brazil the most, specifically in northern areas of the states of Goiás and Mato Grosso. The west-central state of Rondônia will also be affected, as Northern-Arc ports will be unable to continue to supply fertilizer to this market in the future. Consequently, by 2025, the port of Paranaguá’s area of influence will expand northwest to meet fertilizer demand from the state of Rondônia. An opportunity will also arise to increase flows from the port of Rio Grande, in Brazil’s far south, to western Paraná in 2025.
A direct result of the abovementioned rearrangement of fertilizer distribution routes is that total logistics costs shift. Results from the Base scenario, shown in Table 4, indicate that seven of the study’s 12 regions, which account for more than 80% of Brazil’s total fertilizer imports, would benefit from the new infrastructure. Cost reductions would vary from US$ 0.57 to 4.94 per metric ton, with shipments to the Mato Grosso (MT) and MAPITO4 regions seeing the largest reductions. On the other hand, four regions’ markets would bear an increase in their average fertilizer supply expenditures since future constraints will force them to change their current port of origin to a more expensive alternative. For instance, by 2025, the state of Goiás will no longer be able to receive fertilizer originated at the port of São Francisco do Sul but will completely rely on the port of Santos, a much more expensive alternative.
Under the Base scenario, average imported fertilizer logistics costs for the country as a whole are estimated to increase by 1.5% between 2014 and 2025 caused by increased demand. Nearly 40% of that additional demand is concentrated in the state of Mato Grosso, the state with the highest logistic costs in 2014. Results for that state would be worse if no investments in the Northern-Arc ports were made (Table 5; Scenario 2).
Under Scenario 2, all regional logistics costs in 2025 would be higher that those estimated in the Base scenario except in the Northeast, with the Brazilian average price for imported fertilizer increasing 6.3% over the 2014 average, reaching US$ 106.03/mt.
Scenario 3 also brings important outputs (Table 5) that show that more extensive investment in Northern-Arc ports would lead to a reduction in average Brazilian imported fertilizer logistic costs. In this scenario, the
4 MAPITO is an acronym that stands for a geographical region in Brazil encompassing the states of Maranhão (MA), Piauí (PI) and Tocantins (TO).
Figure 4. Port area of influence in 2014 and 2025, base scenario. Map elaborated with Philcarto (version 5.75, Philcarto, France (http://philcarto.free.fr)).
Itacoatiara Santarém
Miritituba
Rio Grande
SantosVitória
Itaqui
Vila do Conde
Aratu
Recife
Maceió
Paranaguá & SF do Sul
Itacoatiara Santarém
Miritituba
Rio Grande
Paranaguá & SF do Sul
Santos
Vitória
Itaqui
Vila do Conde
Aratu
Recife
Maceió
Recife, Aratu & MaceióVitóriaRio GrandeSantosParanaguá & SF do SulItaquiNorthern ports
Legend:
http
://w
ww
.wag
enin
gena
cade
mic
.com
/doi
/10.
2243
4/IF
AM
R20
17.0
037
- T
uesd
ay, M
arch
20,
201
8 11
:29:
54 A
M -
Uni
vers
ity o
f M
inne
sota
- T
win
Citi
es I
P A
ddre
ss:1
34.8
4.17
.184
International Food and Agribusiness Management Review419
Da Costa Simões et al. Volume 21, Issue 3, 2018
Northern-Arc ports of Vila do Conde, Santarém, Itacoatiara, Miritituba and Itaqui face no limits on expansion to supply fertilizer markets. Most other opportunities for increased logistics savings are likely to continue to be in northern Brazil and in the more centrally located states of Mato Grosso and Goiás. Fertilizer logistics costs in Mato Grosso and Goiás would be even lower if transport bottlenecks at the port of Paranaguá, the states’ major source of imported fertilizer, were removed.
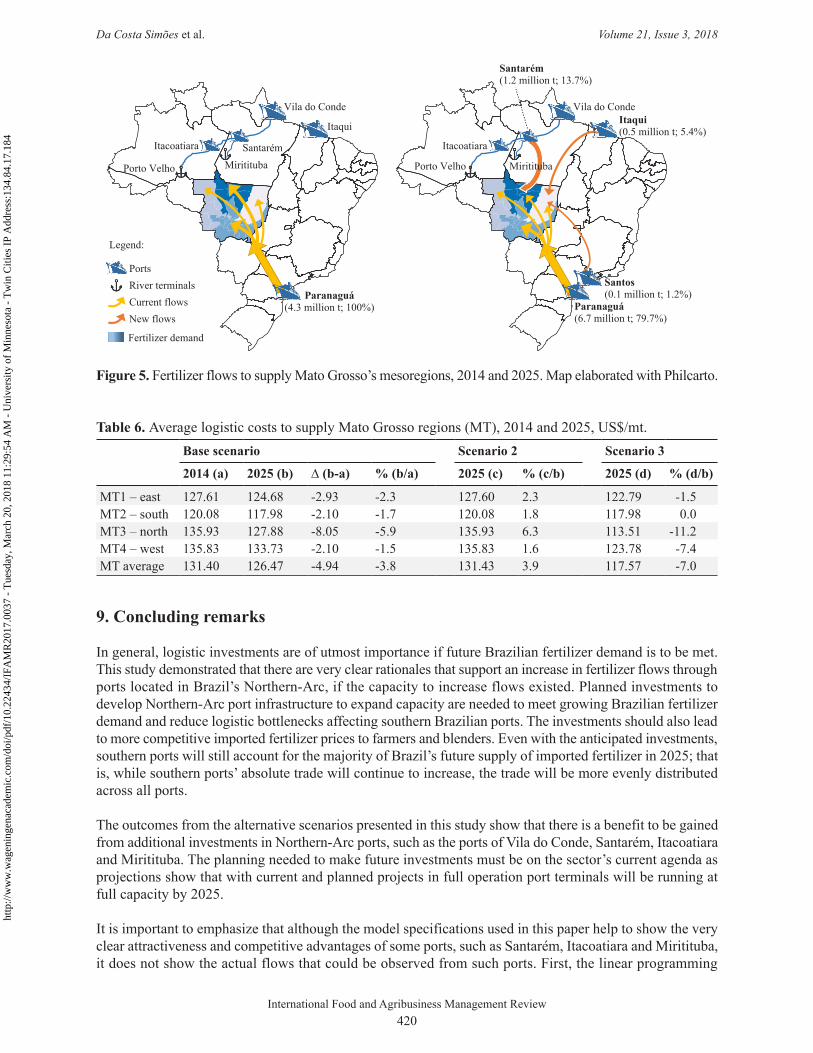
8. Results for the state of Mato Grosso
Regarding the state of Mato Grosso, that has a very large territorial size, central location and complex logistics, it was divided into four separate mesoregions: North, South, East, and West. The port of Paranaguá is currently the only port supplying the state’s fertilizer demand, as shown in Figure 5. In the future, planned projects will create new flows that will economically supply the state’s North mesoregion from the Northern-Arc port of Santarém, and East mesoregion from the ports of Itaqui and Santos. Considering the constraints on Northern-Arc port capacity, one of the main results of this study is the estimate that the port of Paranaguá will continue to supply 70.7% of the North mesoregion’s fertilizer demand, 34.8% of the East mesoregion’s demand, and 79.7% of the state’s total demand in 2025. That port will remain the supplier of 100% of the South and West mesoregions imported fertilizer.
The evolution of logistics costs to import fertilizer into Mato Grosso, shown below in Table 6, is a reflection of the flow changes noted in the previous paragraph. While savings opportunities will occur countrywide, Mato Grosso’s North region (MT3) will receive the greatest cost benefits under the Base scenario, with a potential supply cost reduction of 5.9%, or US$ 8.05 per metric ton in 2025 from the 2014 level. Results from this scenario show that farmers and blenders in MT3-North will save up to US$ 164.4 million between 2015 and 2025 if projects are concluded within the expected timelines, which is equivalent to the 2014 cost of 500 thousand metric tons of product. One should remark that, for the entire state of Mato Grosso, savings under the Base scenario would reach US$ 212.4 million between 2014 and 2025, or the 2014 cost of 640.4 thousand metric tons of fertilizer. On the other hand, if there were no investments in Northern-Arc ports and import supply continued to rely solely on the port of Paranaguá (Scenario 2; Table 6) and logistic costs would remain stable.
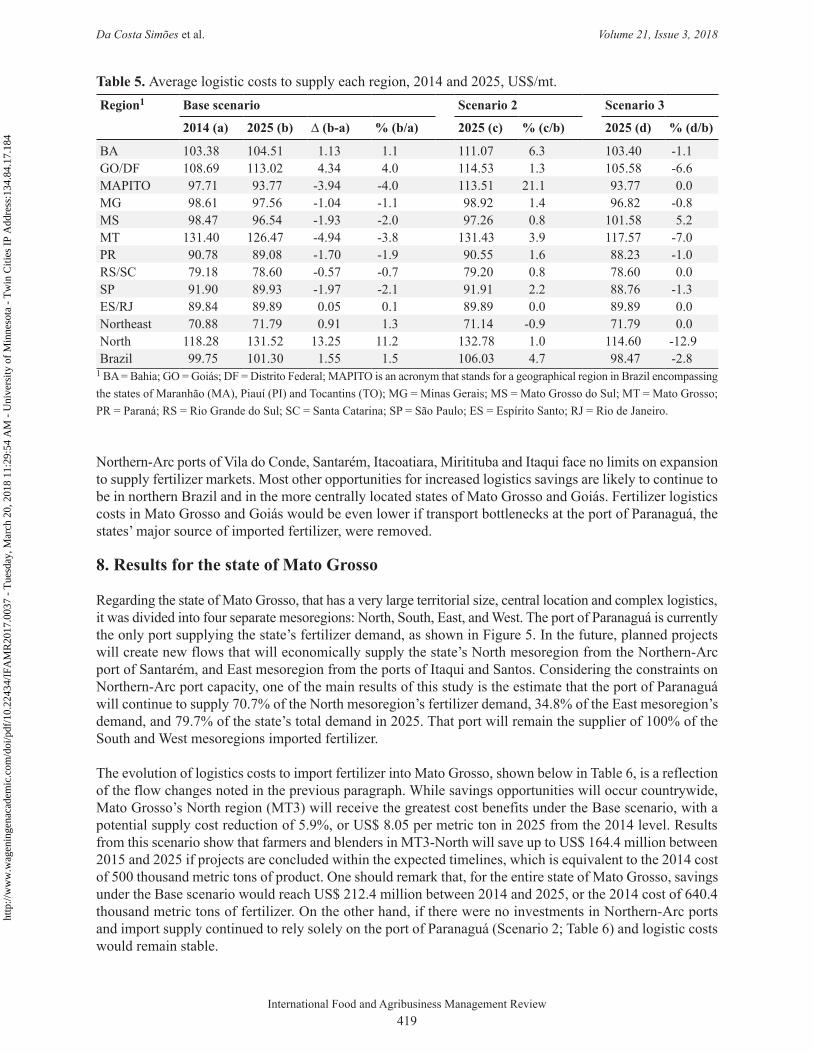
Table 5. Average logistic costs to supply each region, 2014 and 2025, US$/mt.Region1 Base scenario Scenario 2 Scenario 3
2014 (a) 2025 (b) ∆ (b-a) % (b/a) 2025 (c) % (c/b) 2025 (d) % (d/b)
BA 103.38 104.51 1.13 1.1 111.07 6.3 103.40 -1.1GO/DF 108.69 113.02 4.34 4.0 114.53 1.3 105.58 -6.6MAPITO 97.71 93.77 -3.94 -4.0 113.51 21.1 93.77 0.0MG 98.61 97.56 -1.04 -1.1 98.92 1.4 96.82 -0.8MS 98.47 96.54 -1.93 -2.0 97.26 0.8 101.58 5.2MT 131.40 126.47 -4.94 -3.8 131.43 3.9 117.57 -7.0PR 90.78 89.08 -1.70 -1.9 90.55 1.6 88.23 -1.0RS/SC 79.18 78.60 -0.57 -0.7 79.20 0.8 78.60 0.0SP 91.90 89.93 -1.97 -2.1 91.91 2.2 88.76 -1.3ES/RJ 89.84 89.89 0.05 0.1 89.89 0.0 89.89 0.0Northeast 70.88 71.79 0.91 1.3 71.14 -0.9 71.79 0.0North 118.28 131.52 13.25 11.2 132.78 1.0 114.60 -12.9Brazil 99.75 101.30 1.55 1.5 106.03 4.7 98.47 -2.8
1 BA = Bahia; GO = Goiás; DF = Distrito Federal; MAPITO is an acronym that stands for a geographical region in Brazil encompassing the states of Maranhão (MA), Piauí (PI) and Tocantins (TO); MG = Minas Gerais; MS = Mato Grosso do Sul; MT = Mato Grosso; PR = Paraná; RS = Rio Grande do Sul; SC = Santa Catarina; SP = São Paulo; ES = Espírito Santo; RJ = Rio de Janeiro.
http
://w
ww
.wag
enin
gena
cade
mic
.com
/doi
/10.
2243
4/IF
AM
R20
17.0
037
- T
uesd
ay, M
arch
20,
201
8 11
:29:
54 A
M -
Uni
vers
ity o
f M
inne
sota
- T
win
Citi
es I
P A
ddre
ss:1
34.8
4.17
.184
International Food and Agribusiness Management Review420
Da Costa Simões et al. Volume 21, Issue 3, 2018
9. Concluding remarks
In general, logistic investments are of utmost importance if future Brazilian fertilizer demand is to be met. This study demonstrated that there are very clear rationales that support an increase in fertilizer flows through ports located in Brazil’s Northern-Arc, if the capacity to increase flows existed. Planned investments to develop Northern-Arc port infrastructure to expand capacity are needed to meet growing Brazilian fertilizer demand and reduce logistic bottlenecks affecting southern Brazilian ports. The investments should also lead to more competitive imported fertilizer prices to farmers and blenders. Even with the anticipated investments, southern ports will still account for the majority of Brazil’s future supply of imported fertilizer in 2025; that is, while southern ports’ absolute trade will continue to increase, the trade will be more evenly distributed across all ports.
The outcomes from the alternative scenarios presented in this study show that there is a benefit to be gained from additional investments in Northern-Arc ports, such as the ports of Vila do Conde, Santarém, Itacoatiara and Miritituba. The planning needed to make future investments must be on the sector’s current agenda as projections show that with current and planned projects in full operation port terminals will be running at full capacity by 2025.
It is important to emphasize that although the model specifications used in this paper help to show the very clear attractiveness and competitive advantages of some ports, such as Santarém, Itacoatiara and Miritituba, it does not show the actual flows that could be observed from such ports. First, the linear programming
Figure 5. Fertilizer flows to supply Mato Grosso’s mesoregions, 2014 and 2025. Map elaborated with Philcarto.
Paranaguá(4.3 million t; 100%)
Itaqui
Vila do Conde
Itacoatiara SantarémMirititubaPorto Velho
PortsRiver terminalsCurrent flowsNew flows
Legend:
Fertilizer demand
Paranaguá(6.7 million t; 79.7%)
Itaqui(0.5 million t; 5.4%)
Vila do Conde
Itacoatiara
MirititubaPorto Velho
Santos(0.1 million t; 1.2%)
Santarém(1.2 million t; 13.7%)
Table 6. Average logistic costs to supply Mato Grosso regions (MT), 2014 and 2025, US$/mt.Base scenario Scenario 2 Scenario 3
2014 (a) 2025 (b) ∆ (b-a) % (b/a) 2025 (c) % (c/b) 2025 (d) % (d/b)
MT1 – east 127.61 124.68 -2.93 -2.3 127.60 2.3 122.79 -1.5MT2 – south 120.08 117.98 -2.10 -1.7 120.08 1.8 117.98 0.0MT3 – north 135.93 127.88 -8.05 -5.9 135.93 6.3 113.51 -11.2MT4 – west 135.83 133.73 -2.10 -1.5 135.83 1.6 123.78 -7.4MT average 131.40 126.47 -4.94 -3.8 131.43 3.9 117.57 -7.0
http
://w
ww
.wag
enin
gena
cade
mic
.com
/doi
/10.
2243
4/IF
AM
R20
17.0
037
- T
uesd
ay, M
arch
20,
201
8 11
:29:
54 A
M -
Uni
vers
ity o
f M
inne
sota
- T
win
Citi
es I
P A
ddre
ss:1
34.8
4.17
.184
International Food and Agribusiness Management Review421
Da Costa Simões et al. Volume 21, Issue 3, 2018
technique solves the mathematical model considering that all the agents are working together in a stable, well-coordinated market with perfect information, which is unlikely. Despite trading companies exerting some form of oligopoly power, they do not know in advance which port a competitor may use. The port with the cheapest available product at one time may not remain the optimum choice a very short time later.
Secondly, the model was not designed to adjust for the possibility that trading companies may choose to load or off-load product at a sub-optimal port, which often occurs to avoid congestion and delay when using the otherwise optimal choice. Northern-Arc ports are frequently the sub-optimal option of choice. It is recommended when traders select the optimal fertilizer supply port, they include proxies for capacity values in their sensitivity analysis, which would normally be carried out using linear programming software.
As Brazilian markets expand, the type of modeling applied in this study can be used to help convince potential investors – public and private – that the application of resources and innovative talent to address Brazilian logistical issues would be to their and society’s benefit.
Acknowledgement
The authors would like to acknowledge the support from the following entities when developing this article: Agroconsult, ESALQ-LOG, PECEGE and the ADM Institute for the Prevention of Post-Harvest Loss.
Supplementary material
Supplementary material can be found online at https://doi.org/10.22434/IFAMR2017.0037.
Table S1. The 46 mesoregions based on area under cultivation statistics provided by the IBGE database (2015) for 2014 and Agroconsult.
Figure S1. The 46 mesoregions and port terminals.Figure S2. The 12 regions in Tables 4 and 5.
References
A Notícia. 2015. Infraestrutura: Novo berço no Porto de São Francisco do Sul e BR-280 entram no pacote de concessões do governo federal. Joinville, June 9, 2015. Available at: http://tinyurl.com/yazdxrul.
Brasil. 2013. 1ª Consulta Pública dos Arrendamentos Portuários: Santos e Pará. Available at: http://tinyurl.com/yb223afc.
Brasil. 2015. Logistic investments program 2015-2018: ports. Available at: http://tinyurl.com/ycataemm.Brazilian Institute of Geography and Statistics (IBGE). 2015. Produção Agrícola Municipal. Available at:
http://tinyurl.com/yco4pbdu.Bureau of Foreign Trade (SECEX). 2015. The system of analysis of foreign trade information – Aliceweb.
Available at: http://tinyurl.com/ycudcuca.Caixeta-Filho, J.V. 2010. Desafios para a Otimização da Logística Agroindustrial Brasileira. In: 48° Congresso
da Sociedade Brasileira de Economia, Administração e Sociologia Rural (SOBER), Campo Grande, Tecnologias, Desenvolvimento e Integração Social. Available at: http://tinyurl.com/y7hoenr7.
Carvalho, L. 2009. Estudo de Localização de Fábricas Misturadoras de Adubo na região Centro-oeste Brasileira Utilizando um Modelo de Programação Linear. Dissertação (Mestrado – Programa de Pós-Graduação em Engenharia de Produção / Processos e Gestão de Operações) – Escola de Engenharia de São Carlos da Universidade de São Paulo, São Carlos, Brazil.
Frias, L.F., I. Farias and P. Wanke. 2013. Planejamento de redes logísticas: um estudo de caso na indústria petroquímica brasileira. Revista de Administração Mackenzie 14(4): 222-250.
Global Fert. 2015. Entrevista: Diretor da APPA destaca retração da importação de fertilizantes em 2015. Campinas, September. 30, 2015. Available at: http://tinyurl.com/y7d8h7jg.
http
://w
ww
.wag
enin
gena
cade
mic
.com
/doi
/10.
2243
4/IF
AM
R20
17.0
037
- T
uesd
ay, M
arch
20,
201
8 11
:29:
54 A
M -
Uni
vers
ity o
f M
inne
sota
- T
win
Citi
es I
P A
ddre
ss:1
34.8
4.17
.184
International Food and Agribusiness Management Review422
Da Costa Simões et al. Volume 21, Issue 3, 2018
Government of Maranhão. 2015. Investimentos anunciados devem elevar em 30% o volume de cargas do Porto do Itaqui. Available at: http://tinyurl.com/ybz5nmtb.
Hamad, R., and N. Gualda. 2014. Modelagem de redes logísticas com demandas sazonais: influência do custo de estoque e do crédito de ICMS. Journal of Transport Literature 8(2): 295-324.
Hitchcock, F.L. 1941. The distribution of product from several source to numerous localities. Journal of Mathematics and Physics 20: 224-230.
ICIS. 2015. The market weekly world. Weekly freight rate indicators. All 2014 reports. Database available at https://www.icis.com.
International Fertilizer Association (IFA). 2015. Statistics database: IFADATA. Available from: http://ifadata.fertilizer.org/ucSearch.aspx.
Jensen, P. 1999. Network flow programming methods. In: Operations Research Methods. University of Texas. Chapter 5. Available at: http://tinyurl.com/ya52flbn.
Koopman, T.C. 1949. Optimum utilization of transportation system. Econometrica 17: 136-146.Milanez, A., D.Nyko, J. Garcia and C.O. Xavier. 2010. Logística para o etanol: situação atual e desafios
futuros, BNDES Setorial n. 31, p. 49-98, Banco Nacional de Desenvolvimento Econômico e Social, Rio de Janeiro, Brazil.
Ministry of Agriculture and Livestock (MAPA) and Ministry of Transportation; Special Ports Secretariat (MT). 2013. Análise das Rotas Alternativas para Escoamento da Safra Agrícola. Porto de Santos: ações prioritárias. Relatório Final. Brazilian Federal Government, Brasília, DF, Brazil.
National Agency of Land Transportation (ANTT). 2014. Estudo de Demanda. Ferrovia Norte-Sul: Trecho Porto Nacional/TO – Estrela d’Oeste/SP. Relatório 1. Available at: http://tinyurl.com/ybo3pvfa.
National Association of Fertilizer Diffusors (ANDA). 2013. Indústria Nacional de Matérias-Primas para Fertilizantes: Investimentos 2013-2018. 3° Congresso Brasileiro de Fertilizantes. São Paulo, August 26, 2015. Available at: http://tinyurl.com/yc3oq3jw.
National Association of Fertilizer Diffusors (ANDA). 2014. Anuário Estatístico do Setor de Fertilizantes 2014. ANDA, São Paulo, Brazil.
National Association of Fertilizer Diffusors (ANDA). 2015. Statistics spreadsheets (1998-2015). Available at: http://tinyurl.com/yac3f8u9.
National Water Transport Agency (ANTAQ). 2014. Hidrovias Brasileiras. Indicadores de Transporte de Cargas: Tonelada Útil Transportada (t) e Tonelada Quilômetro Útil (TKU) 2013. Available at: http://tinyurl.com/y89y7d4d.
Pereira, A.A., M.A. Oliveira, I.C. Leal Júnior. 2016. Custo de transporte e alocação da demanda: análise da rede logística de uma produtora brasileira de fertilizantes nitrogenados. Journal of Transport Literature 10(4): 5-9.
Port Administration of Paranaguá and Antonina (APPA). 2015. Notícias. Empresa russa de fertilizante poderá ampliar investimentos em Antonina. Available at: http://tinyurl.com/ya72gte9.
Sharma, G., S.H. Abbas and V.K. Gupta. 2012. Solving transportation problem with the various method of linear programming problem. Asian Journal of Current Engeneering and Maths 1(3): 81-83.
Vargas, C. 2015. Mercado de Fertilizante and Logística no Brasil. Fórum ABAG Estadão 2015. São Paulo, SP. Available at: http://tinyurl.com/y9kxuams.
Vessel Distance. 2015. Port distance calculation: routing. Available at: https://www.vesseltracker.com/en/Routing.html.
World Bank. 2016. Logistics performance index – LPI. Available at: http://lpi.worldbank.org/international/global.
Zero Hora. 2015. Campo Aberto com Gisele Loeblein: Como é o projeto de expansão da Yara no Rio Grande do Sul. Porto Alegre. Available at: http://tinyurl.com/yc9wseow.
http
://w
ww
.wag
enin
gena
cade
mic
.com
/doi
/10.
2243
4/IF
AM
R20
17.0
037
- T
uesd
ay, M
arch
20,
201
8 11
:29:
54 A
M -
Uni
vers
ity o
f M
inne
sota
- T
win
Citi
es I
P A
ddre
ss:1
34.8
4.17
.184