fertility trends in northern ireland naomi o’neill - nisra 2007 bsps conference – st andrew’s
TRANSCRIPT
Fertility Trends Fertility Trends in Northern in Northern
IrelandIreland
Naomi O’Neill - NISRANaomi O’Neill - NISRA
2007 BSPS Conference – St 2007 BSPS Conference – St Andrew’sAndrew’s

Summary of PresentationSummary of Presentation
Birth registration processBirth registration process Trends in births and fertility levels in Trends in births and fertility levels in
Northern Ireland compared to other Northern Ireland compared to other countriescountries
The Eastern European migration The Eastern European migration effecteffect
ConclusionConclusion

Birth RegistrationBirth Registration
Must be registered with General Must be registered with General Register Office (GRO)Register Office (GRO) 26 Local Government District offices26 Local Government District offices Some maternity units in local hospitalSome maternity units in local hospital
42 days from birth to registration42 days from birth to registration Specified group of informants e.g. Specified group of informants e.g.
parents, grandparents etcparents, grandparents etc Child’s and parent’s details collected Child’s and parent’s details collected
at registrationat registration

Form of ParticularsForm of Particulars

Birth CertificateBirth Certificate

Newspaper Headlines
1717thth November, November, 2004 – 2004 –
Irish NewsIrish News

Newspaper Headlines
88thth April, 2005 – Tyrone Times April, 2005 – Tyrone Times

Newspaper Headlines
1010thth July 2007 – Irish News July 2007 – Irish News

Live Births Registered in Northern Ireland, 1922-2006P
20,000
22,000
24,000
26,000
28,000
30,000
32,000
34,000
36,000
1922 1928 1934 1940 1946 1952 1958 1964 1970 1976 1982 1988 1994 2000 2006
Year
Num
ber o
f Birth
s
1947
1964 - “Baby Boom”
2002

Total Period Fertility Rate in Northern Ireland, 1975-2006P
1.60
1.80
2.00
2.20
2.40
2.60
2.80
3.00
1975 1978 1981 1984 1987 1990 1993 1996 1999 2002 2005
Year
Tot
al F
ertilit
y R
ate

TPFR for UK Countries and ROI, 1975-2006P
1.25
1.50
1.75
2.00
2.25
2.50
2.75
3.00
3.25
3.50
1975 1978 1981 1984 1987 1990 1993 1996 1999 2002 2005
Year
Tot
al F
ertilit
y R
ate
England Wales Scotland Northern Ireland Republic of Ireland

Live Births in Northern Ireland by Age of Mother, 1975-2006P
0
1,000
2,000
3,000
4,000
5,000
6,000
7,000
8,000
9,000
10,000
1975 1978 1981 1984 1987 1990 1993 1996 1999 2002 2005
Year
Num
ber o
f Birth
s
15-19 20-24 25-29 30-34 35-39 40-44

Fertility Rates in Northern Ireland by Age of Mother, 1976-2006P
0
20
40
60
80
100
120
140
160
180
200
15 17 19 21 23 25 27 29 31 33 35 37 39 41 43
Age of Mother
Fertili
ty R
ate
(per
1,00
0 fe
mal
es)
1976 1986 1996 2006
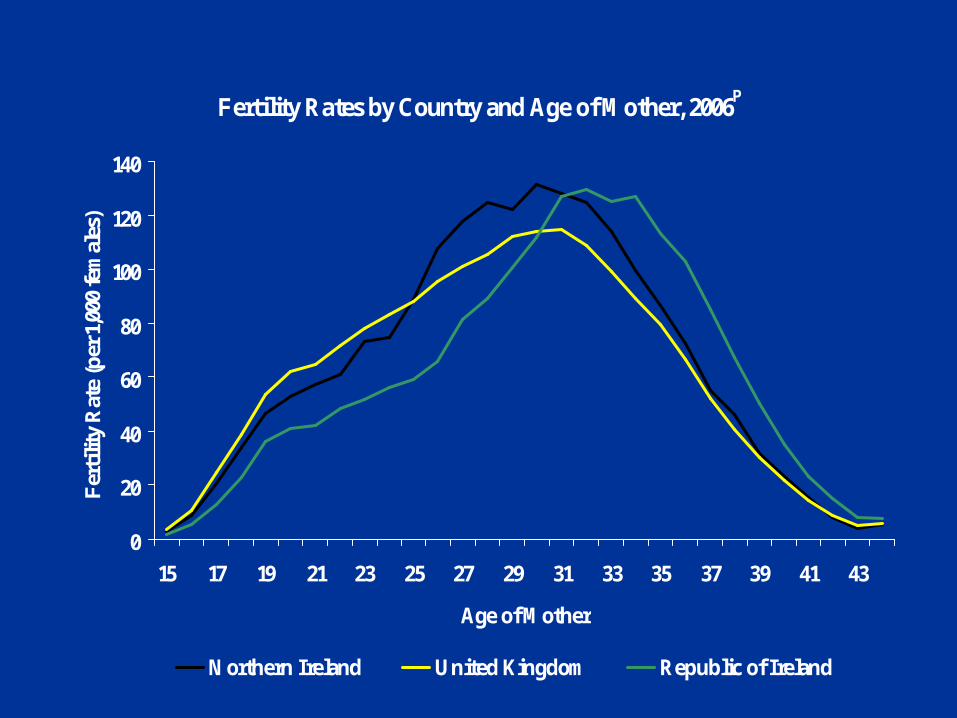
Fertility Rates by Country and Age of Mother, 2006P
0
20
40
60
80
100
120
140
15 17 19 21 23 25 27 29 31 33 35 37 39 41 43
Age of Mother
Fer
tilit
y R
ate
(per
1,0
00 fe
mal
es)
Northern Ireland United Kingdom Republic of Ireland

Live Births in Northern Ireland by Marital Status, 1975-2006P
0%
20%
40%
60%
80%
100%
1975 1978 1981 1984 1987 1990 1993 1996 1999 2002 2005
Year
Per
cent
age
of A
ll Birth
s
Married Not Married Same address Different address Mother only

Live Births Outside Marriage by Country, 1975-2006P
0%
5%
10%
15%
20%
25%
30%
35%
40%
45%
50%
1975 1978 1981 1984 1987 1990 1993 1996 1999 2002 2005
Registration Year
Per
cent
age
of B
irth
s O
utsi
de M
arriag
e
Northern Ireland England & Wales Scotland Republic of Ireland

Social ClassSocial Class Individual social class is allocated to each childIndividual social class is allocated to each child
If father is present – allocated father’s social classIf father is present – allocated father’s social class Otherwise – allocated mother’s social classOtherwise – allocated mother’s social class
Change from SOC90 to SOC2000 in 2002 Change from SOC90 to SOC2000 in 2002 Post 2002 data can be categorised into two Post 2002 data can be categorised into two
groupsgroups High to MediumHigh to Medium – Higher managerial, lower – Higher managerial, lower
managerial, intermediate and small employers and managerial, intermediate and small employers and own account workersown account workers
Medium to LowMedium to Low – Lower supervisory, Semi-routine, – Lower supervisory, Semi-routine, Routine, never worked, long-term unemployed and Routine, never worked, long-term unemployed and not classifiednot classified

Live Births in Northern Ireland by Social Class, 2002-2006P
8,000
9,000
10,000
11,000
12,000
13,000
2002 2003 2004 2005 2006
Registration Year
Num
ber o
f Birth
s
High to Medium Medium to Low

Live Births Classified by Mother’s Country of Live Births Classified by Mother’s Country of Birth, 2001-2007Birth, 2001-2007PP
Mother’s Mother’s Country of Country of BirthBirth
Registration YearRegistration Year
20012001 20042004 20052005 20062006PP
2007 2007
Q1-Q2Q1-Q2PP
ALL BIRTHSALL BIRTHS 21,96221,962 22,31822,318 22,32822,328 23,27223,272 12,13812,138
Northern Northern IrelandIreland 18,99418,994 19,05919,059 19,03919,039 19,61119,611 10,16610,166
Rest of UKRest of UK 1,5531,553 1,4041,404 1,4601,460 1,4751,475 731731
Republic of Republic of IrelandIreland 724724 689689 706706 736736 375375
A8 CountriesA8 Countries 1212 3434 110110 390390 321321
All Other All Other Countries/UnknCountries/Unknownown
679679 1,1321,132 1,0131,013 1,0601,060 545545
P Provisional Data

Live Births Classified by Mother’s Country of Live Births Classified by Mother’s Country of Birth, 2001-2007Birth, 2001-2007P P (Percentages)(Percentages)
Mother’s Mother’s Country of Country of BirthBirth
Registration YearRegistration Year
20012001 20042004 20052005 20062006PP
2007 2007
Q1-Q2Q1-Q2PP
ALL BIRTHSALL BIRTHS 100.0100.0 100.0100.0 100.0100.0 100.0100.0 100.0100.0
Northern Northern IrelandIreland 86.586.5 85.485.4 85.385.3 84.384.3 83.883.8
Rest of UKRest of UK 7.17.1 6.36.3 6.56.5 6.36.3 6.06.0
Republic of Republic of IrelandIreland 3.33.3 3.13.1 3.23.2 3.23.2 3.13.1
A8 CountriesA8 Countries 0.10.1 0.20.2 0.50.5 1.71.7 2.62.6
All Other All Other Countries/UnknCountries/Unknownown
3.13.1 5.15.1 4.54.5 4.64.6 4.54.5
P Provisional Data

Live Births in Northern Ireland by Mother and Father's Country of
Birth, 2006P
0%
10%
20%
30%
40%
50%
60%
70%
80%
90%
100%
NI Rest of UK ROI A8 Other
Mother's Country of Birth
Per
cent
age
of F
athe
r's Fro
m S
ame
Cou
ntry
Gro
up a
s M
othe
r
Same as MCOB Different to MCOB

Live Births in Northern Ireland by Mother's Country of Birth and
Age, 2006P
0%
5%
10%
15%
20%
25%
30%
35%
40%
45%
Under 15 15-19 20-24 25-29 30-34 35-39 40-44 45+
Age of Mother
Per
cent
age
of A
ll Birth
s
NI Rest of UK ROI A8 Other

Live Births in Northern Ireland by Marital Status and Mother's
Country of Birth, 2006P
0%
20%
40%
60%
80%
100%
NI Rest of UK ROI A8 Other
Mother's Country of Birth
Per
centa
ge o
f All
Birth
s
Inside Marriage Outside Marriage

Live Births in Northern Ireland by Mother's Country of Birth and
Social Class, 2006P
0%
20%
40%
60%
80%
100%
NI Rest of UK ROI A8 Other
Mother's Country of Birth
Perc
enta
ge o
f all
Birt
hs
High to Medium Medium to Low
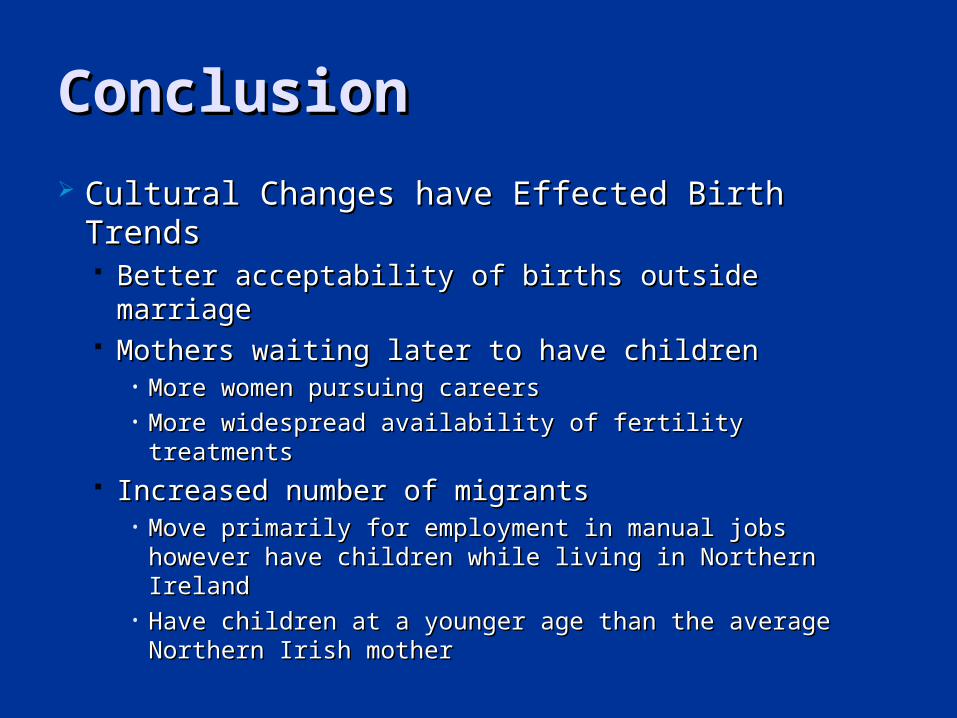
ConclusionConclusion
Cultural Changes have Effected Birth Cultural Changes have Effected Birth TrendsTrends Better acceptability of births outside marriageBetter acceptability of births outside marriage Mothers waiting later to have childrenMothers waiting later to have children
• More women pursuing careersMore women pursuing careers• More widespread availability of fertility treatmentsMore widespread availability of fertility treatments
Increased number of migrantsIncreased number of migrants• Move primarily for employment in manual jobs Move primarily for employment in manual jobs
however have children while living in Northern however have children while living in Northern Ireland Ireland
• Have children at a younger age than the average Have children at a younger age than the average Northern Irish motherNorthern Irish mother

Data AvailableData Available
Provisional Monthly DataProvisional Monthly Data Published one month in arrearsPublished one month in arrears
Provisional Quarterly DataProvisional Quarterly Data Published one quarter in arrearsPublished one quarter in arrears
Provisional Annual DataProvisional Annual Data Published in March of the following yearPublished in March of the following year
Finalised Annual DataFinalised Annual Data Published in November of the following yearPublished in November of the following year


WEBSITEWEBSITE www.nisra.gov.uk/demographywww.nisra.gov.uk/demography
EMAIL QUERIESEMAIL QUERIES [email protected]@dfpni.gov.uk
TELEPHONE QUERIESTELEPHONE QUERIES 02890 34816002890 348160
POSTAL ADDRESSPOSTAL ADDRESS Demography & Methodology BranchDemography & Methodology Branch
McAuley HouseMcAuley House2-14 Castle Street2-14 Castle StreetBelfastBelfastBT1 1SABT1 1SA