fertiliser use survey - 290518 - teagasc
TRANSCRIPT
Teagasc National Farm Survey
FERTILISER USE SURVEY
2005-2015
Emma Dillon1, Cathal Buckley1, Brian Moran1,
John Lennon1 and David Wall2
1Rural Economy and Development Programme
2Crops Environment and Land Use Programme
Teagasc
ISBN: 978-1-84170-645-0
2
ACKNOWLEDGEMENTS
The authors wish to thank all who contributed to the National
Farm Survey 2015 – to the farmers who participate voluntarily
and the Central Statistics Office for sample selection and
provision of national population weights. Grateful
acknowledgement is also due to the Teagasc research staff
involved in the collection and validation of the farm level data: P.
Bryce, J. Colgan, A Curley, L. Deane, L. Delaney, P. Harnett, P.
Hayes, P. Healy, P. Madden, E. McGrath, M. Nicholson, J.
Robinson, J. Teehan and to M. Moloney for the administration of
the survey. Finally, to K. Hanrahan, T.Donnellan, K. Richards and
J. Spink for helpful comments received.
3
Table of Contents
Table of Contents....................................................................................................................................3
List of Tables ...........................................................................................................................................5
List of Figures ..........................................................................................................................................7
Executive Summary.................................................................................................................................9
1. Introduction ..................................................................................................................................13
1.1 Data.......................................................................................................................................13
1.2 Measurement........................................................................................................................14
1.3 Definition of key variables ....................................................................................................14
1.4 Validation of results ..............................................................................................................17
1.5 Comparison with previous surveys .......................................................................................18
2. Demand drivers.............................................................................................................................19
2.1 Fertiliser prices......................................................................................................................19
2.2 Farm output prices................................................................................................................20
2.3 Weather ................................................................................................................................20
2.4 Regulatory changes...............................................................................................................21
3. Results...........................................................................................................................................22
3.1 Fertiliser Use on Grazed Grassland 2005-2015.................................................................22
3.1.1 Fertiliser Use on Grazed Grassland by Nitrate Zone.....................................................22
3.1.2 Fertiliser Use on Grazed Grassland by Land Use Class..................................................25
3.1.3 Fertiliser Use on Grazed Grassland by Farm System ....................................................28
3.1.4 Fertiliser Use on Grazed Grassland by Organic N Stocking rate ...................................31
3.2 Fertiliser Use on Silage Area 2005-2015 ...........................................................................39
3.2.1 Fertiliser Use on Silage Area by Nitrate Zone ...............................................................39
3.2.2 Fertiliser Use on Silage Area by Land Use Class ............................................................42
3.2.3 Fertiliser Use on Silage Area by Farm System...............................................................45
3.2.4 Fertiliser Use on Silage Area by Organic N stocking Rate .............................................48
3.3 Fertiliser Use on Hay Area 2005-2015 ..............................................................................52
3.4 Fertiliser Use on Total Grassland Area 2005-2015 ...........................................................53
3.4.1 Fertiliser Use on Total Grassland Area by Nitrate Zone................................................53
3.4.2 Fertiliser Use on Total Grassland Area by Land Use Class ............................................56
3.4.3 Fertiliser Use on Total Grassland Area by Farm System ...............................................59
3.4.4 Fertiliser Use on Total Grassland Area by Organic N Stocking rate ..............................62
3.4.5 Fertiliser Compounds use on Grassland .......................................................................65

4
3.4.6 Percentage of N applied to Grassland by Fertiliser type ..............................................65
3.4.7 Percentage of P applied to Grassland by Fertiliser type ...............................................66
3.4.8 Percentage of K applied to Grassland by Fertiliser type...............................................67
3.4.9 Percentage of total fertiliser applied to Grassland by Fertiliser type...........................68
3.5 Fertiliser Use on Main Cereal Crops 2005-2015 ...............................................................69
3.5.1 Fertiliser Use on Main Cereal Crops by Nitrate Zone....................................................69
3.5.2 Fertiliser Use on Main Cereal Crops by Land Use Class ................................................71
3.5.3 Fertiliser use on individual Main Cereal Crops .............................................................75
3.5.4 Fertiliser Compounds use on Main Cereal crops ..........................................................79
3.5.5 Percentage of N applied to Main Cereals by Fertiliser type .........................................79
3.5.6 Percentage of P applied to Main Cereals by Fertiliser type..........................................80
3.5.7 Percentage of K applied to Main Cereals by Fertiliser type..........................................81
3.5.8 Percentage of total fertiliser applied to Main Cereals by Fertiliser type......................82
3.6 Fertiliser Use on Other Tillage Crops 2005-2015 ..............................................................83
3.7 Fertiliser Use on Selected Root Crops 2005-2015............................................................85
3.8 Fertiliser use by Agri-Environmental Scheme participation 2005-2015 ...........................86
3.8.1 Fertiliser applications on Grassland by Agri-Environmental Scheme participation .....86
3.8.2 Fertiliser applications on main cereals by Agri-Environmental Scheme participation .89
3.9 Lime usage ........................................................................................................................92
References ............................................................................................................................................95
Appendix 1: Units of Measurement......................................................................................................96
Appendix 2: Report Methodology ........................................................................................................97
Appendix 3: Results by NUTS 3 regions and Organic N stocking rate...................................................98
5
List of TablesTable 1: Organic N excretion rates by animal type.........................................................................................16
Table 2: Average farm size, NFS farms and farm population by Nitrate Zone - Grazing Area..........................22
Table 3: Average farm size, NFS farms and farm population by Land Use Class - Grazing Area ......................25
Table 4: Average farm size, NFS farms and farm population by Farming System - Grazing Area ....................28
Table 5: Average Farm size, NFS farms and farm population by Org. N stocking rate – Grazing Area .............31
Table 6: Average farm size, NFS farms and farm population Dairy Farms by Org. N - Grazing Area................34
Table 7: Average farm size, NFS farms and farm population Cattle Farms by Org. N - Grazing Area...............36
Table 8: Average farm size, NFS farms and farm population Sheep Farms by Org. N - Grazing Area ..............37
Table 9: Average farm size, NFS farms and farm population by Nitrate Zone – Silage Area............................39
Table 10: Average farm size, NFS farms and farm population by Land Use Class – Silage Area ......................42
Table 11: Average farm size, NFS farms and farm population by Farm System – Silage Area .........................45
Table 12: Average farm size, NFS farms and farm population All Farms by Organic N - Silage Area ...............48
Table 13: Average farm size, NFS farms and farm population by Nitrate Zone – Hay Area.............................52
Table 14: Average farm size, NFS farms and farm population by Nitrate Zone – Grassland Area ...................53
Table 15: Average farm size, NFS farm and farm population by Land Use Class – Grassland Area..................56
Table 16: Average farm size, NFS farms and farm population by farm system – Grassland Area....................59
Table 17: Average farm size, NFS farms and farm population by Org. N stocking rate – Grassland ................62
Table 18: N Fertiliser Compounds applied to grassland (%)............................................................................65
Table 19: P Fertiliser Compounds applied to grassland (%) ............................................................................66
Table 20: K Fertiliser Compounds applied to grassland (%) ............................................................................67
Table 21: Top 20 ranked fertilisers applied to Grassland by quantity.............................................................68
Table 22: Average farm size and NFS farm numbers by Nitrate Zone – Main Cereal Crops.............................69
Table 23: Average farm size and NFS farm numbers by Land Use Class – Main Cereal Crops .........................72
Table 24: Number of farms and average cereal area grown of main cereal crops - by cereal type .................75
Table 25: N Fertilisers compounds applied to main cereals (%)......................................................................79
Table 26: P Fertiliser compounds applied to main cereals (%)........................................................................80
Table 27: K Fertilisers compounds applied to main cereals (%) ......................................................................81
Table 28: Top 20 fertilisers use on cereals ranked on quantity (%).................................................................82
Table 29: Average farm size and NFS farm numbers growing other tillage crops ...........................................83
Table 30: Average N applications on other tillage crops (kg ha-1
) ...................................................................83
Table 31: Average P applications on other tillage crops (kg ha-1
) ...................................................................84
Table 32: Average K applications other tillage crops (kg ha-1
) ........................................................................84
Table 33: Average farm size, NFS farm numbers and farm population – selected Roots Crops ......................85
Table 34: Number of farms with Grassland by Agri-Environmental Scheme participation .............................86
Table 35: Average Area (ha) by Agri-Environmental Scheme participation ....................................................86
Table 36: N (kg per ha) applied by Agri-Environmental Scheme participation................................................87
Table 37: P (kg per ha) applied by Agri-Environmental Scheme participation ................................................88
Table 38: K (kg per ha) applied by Agri-Environmental Scheme participation ................................................88
Table 39: Number of cereal farms by Agri-Environmental Scheme participation ...........................................89
Table 40: Average area (ha) under cereals by Agri-Environmental Scheme participation...............................90
Table 41: N (kg per ha) applied to main cereals by Agri-Environmental Scheme participation.......................90
Table 42: P (kg per ha) applied to main cereals by Agri-Environmental Scheme participation .......................91
Table 43: K (kg per ha) applied to main cereals by Agri-Environmental Scheme participation .......................91
Table 44a: Estimated 2015 Farm Population Distribution ..............................................................................97
Table 44b: Estimated 2005 Farm Population Distribution ..............................................................................97
Table 45: Average farm size, NFS farms and farm population by Region – Grazing Area................................98
Table 46: N, P, K on Grazing Area by Region ..................................................................................................98
Table 47: Average farm size, NFS farms and farm population by Region – Silage Area...................................99
Table 48: N, P, K on Silage Area by Region .....................................................................................................99

6
Table 49: Average farm size, NFS farms and farm population by Region – Grassland Area ..........................100
Table 50: N, P, K on Grassland Area by Region.............................................................................................100
Table 51: Average farm size, NFS farms and farm population by Region – Cereal Area................................101
Table 52: N, P, K on Cereal Area by Region ..................................................................................................101
Table 53: Fertiliser application rates for grazing on dairy farms at different stocking rates .........................102
Table 54: Fertiliser application rates for grazing on cattle farms at different stocking rates ........................103
Table 55: Fertiliser application rates for grazing on sheep farms at different stocking rates ........................104
Table 56: Fertiliser application rates for grazing on all farms at different stocking rates..............................105
7
List of Figures
Figure 1: Nitrate Zone designation in Ireland under the EU Nitrates Directive ...............................................15
Figure 2: National Fertilisers Sales (DAFM) & Fertiliser application data (Teagasc NFS) 2005-2015................17
Figure 3: Price index for N, P, K fertilisers from 2005 to 2015.........................................................................19
Figure 4: Agricultural output price indices for milk, cattle, sheep and cereals from 2005 to 2015..................20
Figure 5: Total rainfall across four Teagasc based weather stations 2005-2015 .............................................21
Figure 6: N use on Grazing Area by Nitrate Zone............................................................................................23
Figure 7: P use on Grazing Area by Nitrate Zone ............................................................................................23
Figure 8: K use on Grazing Area by Nitrate Zone ............................................................................................24
Figure 9: N use on Grazing Area by Land Use Class.........................................................................................26
Figure 10: P use on Grazing Area by Land Use Class .......................................................................................26
Figure 11: K use on Grazing Area by Land Use Class .......................................................................................27
Figure 12: N use on Grazing Area by Farm System .........................................................................................29
Figure 13: P use on Grazing Area by Farm System..........................................................................................29
Figure 14: K use on Grazing Area by Farm System..........................................................................................30
Figure 15: N use on Grazing Area by Organic N stocking rate category ..........................................................32
Figure 16: P use on Grazing Area by Organic N stocking rate category ...........................................................32
Figure 17: K use on Grazing Area by Organic N stocking rate category...........................................................33
Figure 18: Dairy farm population distribution by N stocking rate band (2005-2015) ......................................35
Figure 19: Cattle population distribution by N stocking rate band (2005-2015) .............................................36
Figure 20: Sheep population distribution by N stocking rate band (2005-2015) .............................................38
Figure 21: N use on Silage Area by Nitrate Zone ............................................................................................40
Figure 22: P use on Silage Area by Nitrate Zone.............................................................................................40
Figure 23: K use on Silage Area by Nitrate Zone.............................................................................................41
Figure 24: N use on Silage Area by Land Use Class .........................................................................................43
Figure 25: P on Silage Area by Land Use Class ................................................................................................43
Figure 26: K use on Silage Area by Land Use Class..........................................................................................44
Figure 27: N use on Silage Area by Farm System ............................................................................................46
Figure 28: P use on Silage by Farm System.....................................................................................................46
Figure 29: K use on Silage Area by Farm System ............................................................................................47
Figure 30: N use on Silage Area by Organic N stocking rate – All farms ..........................................................49
Figure 31: P use on Silage Area by Organic N stocking rate – All farms ..........................................................50
Figure 32: K use on Silage Area by Organic N stocking rate – All farms ..........................................................51
Figure 33: N, P and K use on Hay area............................................................................................................52
Figure 34: N use on Total Grassland Area by Nitrate Zone .............................................................................54
Figure 35: P use on Total Grassland Area by Nitrate Zone..............................................................................55
Figure 36: K use on Total Grassland Area by Nitrate Zone..............................................................................55
Figure 37: N use on Total Grassland Area by Land Use Class ..........................................................................57
Figure 38: P use on Total Grassland Area by Land Use Class...........................................................................57
Figure 39: K use on Grassland Area by Land Use Class ...................................................................................58
Figure 40: N use on Total Grassland Area by Farm System.............................................................................60
Figure 41: P use on Total Grassland Area by Farm System .............................................................................60
Figure 42: K use on Grassland Area by Farm System ......................................................................................61
Figure 43: N use on Total Grassland Area by Organic N stocking rate ............................................................63
Figure 44: P use on Total Grassland Area by Organic N stocking rate .............................................................63
Figure 45: K use on Total Grassland Area by Organic N stocking rate.............................................................64
Figure 46: N use on Cereals by Nitrate Zone ..................................................................................................70
Figure 47: P use on Cereals by Nitrate Zone ...................................................................................................70
Figure 48: K use on Cereals by Nitrate Zone...................................................................................................71
8
Figure 49: N use on Cereals by Land Use Class ...............................................................................................72
Figure 50: P use on Cereals by Land Use Class................................................................................................73
Figure 51: K use on Cereals by Land Use Class................................................................................................74
Figure 52: N use on individual cereal crops ....................................................................................................76
Figure 53: P use on individual cereals crops ...................................................................................................77
Figure 54: K use on individual Cereals crops...................................................................................................78
Figure 55: N, P, K use for selected Root Crops................................................................................................85
Figure 56: Percentage of farms using Lime by Nitrate Zone ...........................................................................92
Figure 57: Percentage of farms using Lime by Land Use Class ........................................................................92
Figure 58: Percentage of farms using Lime by Farm System ...........................................................................93
Figure 59: Percentage of farms using Lime by Organic N Stocking Rate..........................................................94
9
Executive Summary
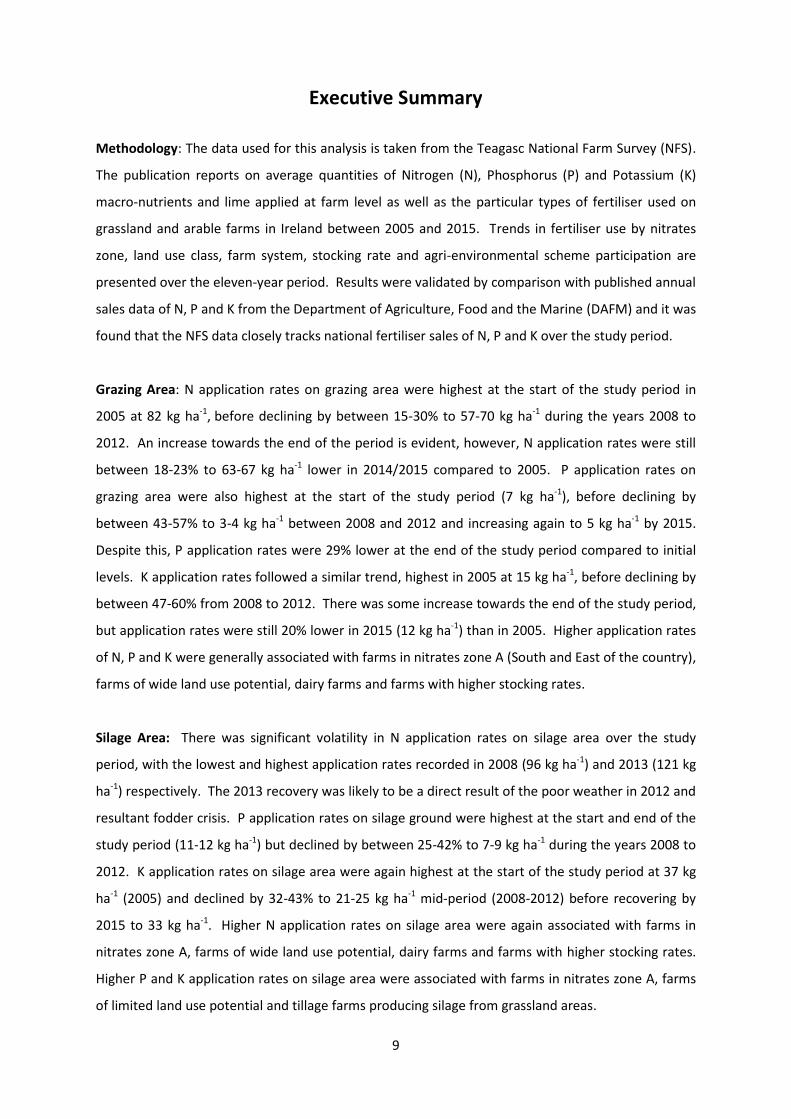
Methodology: The data used for this analysis is taken from the Teagasc National Farm Survey (NFS).
The publication reports on average quantities of Nitrogen (N), Phosphorus (P) and Potassium (K)
macro-nutrients and lime applied at farm level as well as the particular types of fertiliser used on
grassland and arable farms in Ireland between 2005 and 2015. Trends in fertiliser use by nitrates
zone, land use class, farm system, stocking rate and agri-environmental scheme participation are
presented over the eleven-year period. Results were validated by comparison with published annual
sales data of N, P and K from the Department of Agriculture, Food and the Marine (DAFM) and it was
found that the NFS data closely tracks national fertiliser sales of N, P and K over the study period.
Grazing Area: N application rates on grazing area were highest at the start of the study period in
2005 at 82 kg ha-1, before declining by between 15-30% to 57-70 kg ha-1 during the years 2008 to
2012. An increase towards the end of the period is evident, however, N application rates were still
between 18-23% to 63-67 kg ha-1 lower in 2014/2015 compared to 2005. P application rates on
grazing area were also highest at the start of the study period (7 kg ha-1), before declining by
between 43-57% to 3-4 kg ha-1 between 2008 and 2012 and increasing again to 5 kg ha-1 by 2015.
Despite this, P application rates were 29% lower at the end of the study period compared to initial
levels. K application rates followed a similar trend, highest in 2005 at 15 kg ha-1, before declining by
between 47-60% from 2008 to 2012. There was some increase towards the end of the study period,
but application rates were still 20% lower in 2015 (12 kg ha-1) than in 2005. Higher application rates
of N, P and K were generally associated with farms in nitrates zone A (South and East of the country),
farms of wide land use potential, dairy farms and farms with higher stocking rates.
Silage Area: There was significant volatility in N application rates on silage area over the study
period, with the lowest and highest application rates recorded in 2008 (96 kg ha-1) and 2013 (121 kg
ha-1) respectively. The 2013 recovery was likely to be a direct result of the poor weather in 2012 and
resultant fodder crisis. P application rates on silage ground were highest at the start and end of the
study period (11-12 kg ha-1) but declined by between 25-42% to 7-9 kg ha-1 during the years 2008 to
2012. K application rates on silage area were again highest at the start of the study period at 37 kg
ha-1 (2005) and declined by 32-43% to 21-25 kg ha-1 mid-period (2008-2012) before recovering by
2015 to 33 kg ha-1. Higher N application rates on silage area were again associated with farms in
nitrates zone A, farms of wide land use potential, dairy farms and farms with higher stocking rates.
Higher P and K application rates on silage area were associated with farms in nitrates zone A, farms
of limited land use potential and tillage farms producing silage from grassland areas.
10
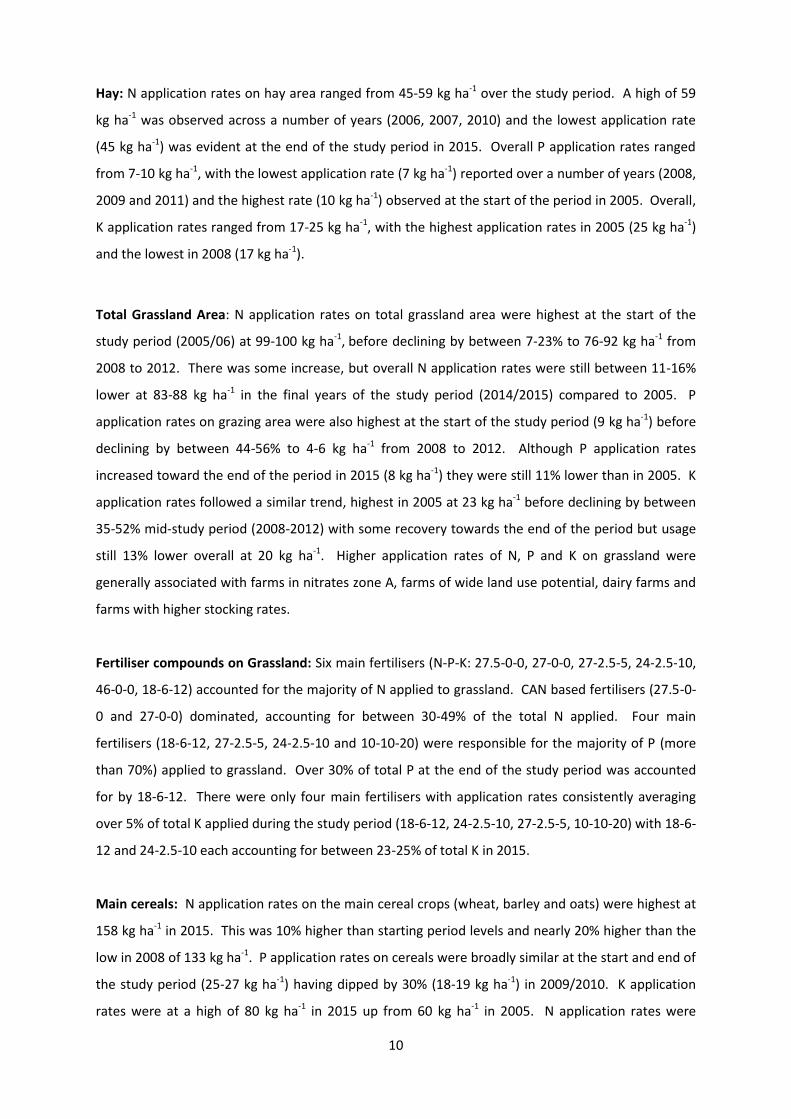
Hay: N application rates on hay area ranged from 45-59 kg ha-1 over the study period. A high of 59
kg ha-1 was observed across a number of years (2006, 2007, 2010) and the lowest application rate
(45 kg ha-1) was evident at the end of the study period in 2015. Overall P application rates ranged
from 7-10 kg ha-1, with the lowest application rate (7 kg ha-1) reported over a number of years (2008,
2009 and 2011) and the highest rate (10 kg ha-1) observed at the start of the period in 2005. Overall,
K application rates ranged from 17-25 kg ha-1, with the highest application rates in 2005 (25 kg ha-1)
and the lowest in 2008 (17 kg ha-1).
Total Grassland Area: N application rates on total grassland area were highest at the start of the
study period (2005/06) at 99-100 kg ha-1, before declining by between 7-23% to 76-92 kg ha-1 from
2008 to 2012. There was some increase, but overall N application rates were still between 11-16%
lower at 83-88 kg ha-1 in the final years of the study period (2014/2015) compared to 2005. P
application rates on grazing area were also highest at the start of the study period (9 kg ha-1) before
declining by between 44-56% to 4-6 kg ha-1 from 2008 to 2012. Although P application rates
increased toward the end of the period in 2015 (8 kg ha-1) they were still 11% lower than in 2005. K
application rates followed a similar trend, highest in 2005 at 23 kg ha-1 before declining by between
35-52% mid-study period (2008-2012) with some recovery towards the end of the period but usage
still 13% lower overall at 20 kg ha-1. Higher application rates of N, P and K on grassland were
generally associated with farms in nitrates zone A, farms of wide land use potential, dairy farms and
farms with higher stocking rates.
Fertiliser compounds on Grassland: Six main fertilisers (N-P-K: 27.5-0-0, 27-0-0, 27-2.5-5, 24-2.5-10,
46-0-0, 18-6-12) accounted for the majority of N applied to grassland. CAN based fertilisers (27.5-0-
0 and 27-0-0) dominated, accounting for between 30-49% of the total N applied. Four main
fertilisers (18-6-12, 27-2.5-5, 24-2.5-10 and 10-10-20) were responsible for the majority of P (more
than 70%) applied to grassland. Over 30% of total P at the end of the study period was accounted
for by 18-6-12. There were only four main fertilisers with application rates consistently averaging
over 5% of total K applied during the study period (18-6-12, 24-2.5-10, 27-2.5-5, 10-10-20) with 18-6-
12 and 24-2.5-10 each accounting for between 23-25% of total K in 2015.
Main cereals: N application rates on the main cereal crops (wheat, barley and oats) were highest at
158 kg ha-1 in 2015. This was 10% higher than starting period levels and nearly 20% higher than the
low in 2008 of 133 kg ha-1. P application rates on cereals were broadly similar at the start and end of
the study period (25-27 kg ha-1) having dipped by 30% (18-19 kg ha-1) in 2009/2010. K application
rates were at a high of 80 kg ha-1 in 2015 up from 60 kg ha-1 in 2005. N application rates were

11
highest on winter crops. The highest application rates on average over the period were associated
with winter wheat (190 kg ha-1), winter barley (166 kg ha-1) and winter oats (146 kg ha-1)
respectively. Of the spring crops the highest average N application rates were associated with
malting barley (129 kg ha-1), spring barley (125 kg ha-1) and spring oats (105 kg ha-1) respectively.
Application rates of P over the study period were highest on winter and spring barley at 26 and 24 kg
ha-1 respectively. Whereas the other cereal crops had average P application rates of 21-22 kg ha-1
over the period. Average K application rates were highest across winter crops, with winter wheat
and winter barley having similar average applications rates over the study period at 77 kg ha-1
followed by winter oats at 69 kg ha-1. Of the spring crops, average K application rates were highest
across malting barley (66 kg ha-1) followed by spring barley (58 kg ha-1) and spring oats (55 kg ha-1).
CAN based fertilisers (27.5-0-0 and 27-0-0) on average accounted for over 60% of total N fertiliser
applied to the main cereal crops over the study period. On average 60% of total P applied to the
main cereal crops was derived from two fertilisers 18-6-12 (31%) and 10-10-20 (29%). Three main
fertilisers (18-6-12, 10-10-20 and 0-0-50) accounted for over 50% of total K applied to the main
cereal crops from 2005-2015.
Other Tillage crops: Fodder beet, maize, oilseed rape and peas/beans are grouped here as other
tillage crops. N application rates varied by crop type over the period ranging from 138-172 kg ha-1
for fodder beet, from 137-179 kg ha-1 for oilseed rape and from 120-165 kg ha-1 for maize. N applied
to peas and beans was much lower, ranging from 0 to 33 kg ha-1. P application rates also varied by
crop type, ranging from 43-54 kg ha-1 on fodder beet, from 27-39 kg ha-1 on maize, from 11-32 kg ha-
1 on oilseed rape and from 14 to 24 kg ha-1 on peas and beans. Similarly, K application rates ranged
from 153-210 kg ha-1 for fodder beet, from 75-95 kg ha-1 for maize, from 40-84 kg ha-1 for oilseed
rape and from 53 to 88 kg ha-1 for peas and beans.
Selected Root Crops: N application rates on selected root crops (potatoes, sugar beet, fodder rape,
turnips and kale) ranged from 106-151 kg ha-1 over the study period with rates at their highest in
2005 (151 kg ha-1) falling between 17-30% thereafter. P application rates ranged between 39-59 kg
ha-1 from 2005-2015 with the highest rate reported in 2006 (59 kg ha-1) with a subsequent decline of
34% to a low of 39 kg ha-1 in 2015. K application rates ranged from 131-197 kg ha-1 over the period,
highest in 2007 (197 kg ha-1) followed by a decline of 34% to a period low of 131 kg ha-1 by 2015.
Agri-environmental scheme participation: Fertiliser application rates on total grassland area over
the period 2005-2015 were on average nearly 36% lower for agri-environmental scheme participants
(49-79 kg ha-1) compared to non-participants (87-123 kg ha-1). N applications rates were 45% lower

12
on grazing, 13% lower on silage and 8% lower on hay area for scheme participants. P application
rates on total grassland area were on average almost 38% lower for scheme participants (4-7 kg ha-1)
compared to non-participants (5-11 kg ha-1) over the eleven year period. The differential across
grazing, silage and hay area for P was 45%, 16% and 7% respectively. K application rates across total
grassland area were on average 34% lower for scheme participants (12-18 kg ha-1) compared to non-
participants (12-27 kg ha-1). The differential across grazing, silage and hay area for K was 40%, 17%
and 7% respectively. N application rates on the main cereal crops for non-scheme participants were
on average 1.15 times higher at 150 kg ha-1 compared to scheme participants where the average rate
applied was 130 kg ha-1 over the study period. Average P application rates on cereal area over the
study period were broadly similar across scheme participants and non-participants, where the
average application rate over the period was 23 kg ha-1 for non-participants compared to 21 kg ha-1
for scheme participants. K application rates on cereal area were also broadly similar, where the
average rate applied for non agri-environmental participants was 64 kg ha-1 compared to 62 kg ha-1
for those participating in a scheme.
Liming: On average just over 20% of farms were using lime year-on-year over the study period. The
lowest rate of liming was evident in 2006 at 16% and the highest liming rate over the period was
recorded in 2013 at 26% of total farms. Higher rates of liming were associated with farms of wide
land use potential, dairy farms and farms with higher stocking rates.
13
1. Introduction
This publication reports the quantities of macro-nutrients, Nitrogen (N), Phosphorus (P) and
Potassium (K) and lime applied on Irish farms over the period 2005 to 2015. These data were
collected through the Teagasc National Farm Survey (NFS) which contains information on the types
of fertiliser used on both grassland and arable farms in Ireland on an annual basis. It should be
noted that organic manure use is not included in this analysis. Trends for chemical fertiliser use only
are presented by nitrates zone, land use class, farm system, stocking rate band and agri-
environmental scheme participation. This is the fourth such fertiliser use survey which covers an
important eleven year period (2005-2015) during which the EU Nitrates Directive came into
operation bringing with it significant changes to chemical fertiliser management both at farm and
field level. The EU Nitrates Directive Good Agricultural Practice (GAP) measures were first
introduced in Ireland in 2006 through statutory instrument (S.I.) No. 378 of 2006 and were
subsequently updated through Statutory Instruments S.I. 101 of 2009, S.I. 610 of 2010 and S.I. 31 of
2014 over the study period. The main aim of these regulations is to prevent pollution of surface
waters and groundwater from agricultural sources and protect and improve water quality. These
regulations regulate fertiliser use on farms and set down legal maximum application rates for N and
P as well as a range of other measures.
1.1 Data
The data used for this analysis is taken from the Teagasc National Farm Survey (NFS). The Teagasc
NFS has been carried out annually since 1972 and fulfils Ireland’s statutory obligation to provide data
on farm output, costs and income to the European Commission through the Farm Accountancy Data
Network of the European Union (FADN). Over time, there has been an increased appreciation that
data relating to the environmental aspects of agriculture are of growing importance and this has led
to the collection of data beyond FADN requirements, such as quantities and types of chemical
fertilisers used at farm level which is the foundation of this report. These data have been collected
in Ireland for an extensive period and are now being collected (from 2016) across all other EU FADN
countries.
The NFS is based on a nationally representative random sample which is selected annually in
conjunction with the Central Statistics Office (CSO). Each farm is assigned a weighting factor so that
the results of the survey are representative of the national population of farms. The 2015 results for
example are based on a sample of 898 farms which represents 84,259 farms nationally. Farms are
classified into major farming systems according to the standardised EU typology used by the FADN.
14
The NFS generally reports results across six main farm systems namely: dairying, dairying with other
enterprises, cattle rearing, cattle with other systems, mainly sheep and tillage systems. These
systems refer to the dominant enterprise in each group. For the purposes of this report the dairy
and cattle systems were further merged and results are presented for four farm systems; namely
dairy, cattle, sheep and tillage. The Teagasc NFS methodology dictates that data is only published
where there are at least 10 farms in a cell. Where this criteria is not met the symbol “-“ is used in
the results tables to indicate there was an insufficient number of holdings to report national results.
1.2 Measurement
The report uses metric measurements throughout, and in the tables usages of the nutrients N, P and
K are presented in elemental form. To facilitate comparisons with other surveys and reports (both
national and international) a range of conversion factors for metric, imperial and popular units and
for conversion between elemental P and K and their oxide forms are listed in Appendix 1.
1.3 Definition of key variables
Grassland: Total grassland area refers to the total area (hectares) under silage, hay and grazing. It
excludes area under arable crops and rough grazing. Rough grazing is not included, as the definition
of this area is that of ground that cannot be fertilised (however, it should be noted that rough
grazing is eligible for inclusion in Organic N stocking rate calculations under the Nitrates Directive).
Silage: Silage area is defined as the area of ground in hectares cut at least once yearly for
silage.
Hay: Hay area is the area of ground in hectares cut at least once yearly for hay.
Grazing: Grazing area is defined as total grassland area in hectares less area dedicated to
hay and silage.
Please Note: Within the Teagasc NFS the application of nutrients to grassland is recorded according
to the use made of the area at different periods throughout the year. As such, when an area is being
used for silage, the nutrients applied are recorded under the silage crop, and when the same area is
then later used for grazing, the nutrients used are recorded under the grazing heading. As a result,
the area used for grazing only is recorded as the grazing area, and the areas under hay or silage are
recorded as such even though they are grazed for part of the year. This approach results in an
underestimation of the grazing area and therefore an overestimation of the rates of N, P and K
applied per hectare on grazing land if the area of aftermath grazing is not taken into account. In
order to estimate more accurately the use of nutrients on grazing land the approach of Lalor et al.
15
(2010) is used. This procedure assumes that the use of nutrients for grazing, silage and hay
aftermaths are the same rates as those used for the grazing only areas, but in proportion to their
yields. The yields of grazed grass from areas harvested once, twice, or three times per annum for
silage or hay are assumed to be approximately 50%, 25% and 10% respectively, of the total annual
yield. In calculating the N, P and K per grazed hectare, the amount recorded by the NFS for grazing is
divided by the grazing area plus 50% of the area cut once for silage or hay, plus 25% of the area cut
twice for silage or hay, plus 10% of any area cut three times. In this context average areas reported
for grazing and silage will not tally with that for total grassland as some silage area is grazed and this
proportional area is added to the total grazing area, while silage area is deemed to remain
unchanged.
Arable Area: Results are presented for areas in hectares dedicated to individual crops. The Teagasc
NFS collects data on areas dedicated to different individual crops as well as the nutrients applied to
those areas.
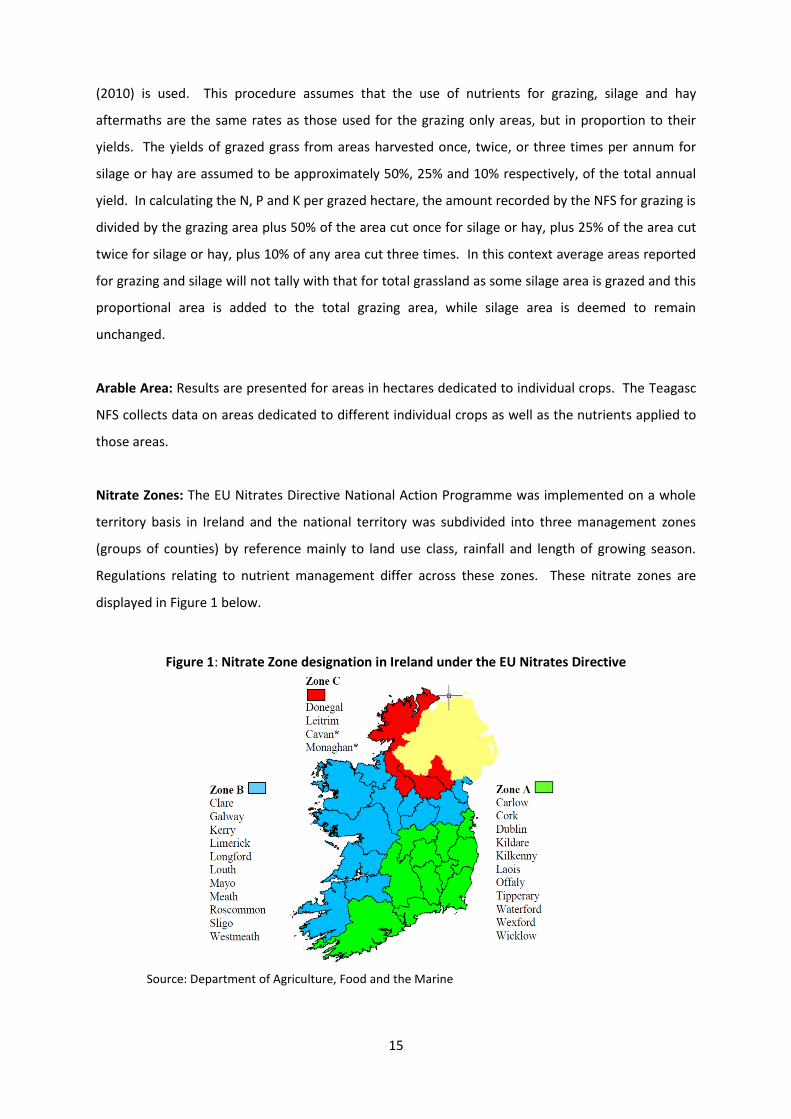
Nitrate Zones: The EU Nitrates Directive National Action Programme was implemented on a whole
territory basis in Ireland and the national territory was subdivided into three management zones
(groups of counties) by reference mainly to land use class, rainfall and length of growing season.
Regulations relating to nutrient management differ across these zones. These nitrate zones are
displayed in Figure 1 below.
Figure 1: Nitrate Zone designation in Ireland under the EU Nitrates Directive
Source: Department of Agriculture, Food and the Marine

16
Nutrient usage by zone is presented in this report which is a departure from the regional approach
(NUTS3 level) utilised in the previous report (Lalor et al., 2010). However, additional results relating
to these regions are also contained in Appendix 3.
Land use class: In line with previous reports (Coulter et al., 2002, 2005 and Lalor et al., 2010) the
categorisation of farms into different land use classes follows the classification of Gardiner and
Radford (1980). Land use class is a qualitative method by which the range of potential uses of a soil
can be expressed. There are six classes varying from wide, moderately wide, somewhat limited,
limited, very limited and extremely limited. For the purposes of this report they are amalgamated
into four classes by combining the bottom three classes into a single range described as limited. The
wide land use has no limitation on land use, the moderately wide class has minor limitations due to
soil texture, altitude or climatic conditions and the somewhat limited class has more significant use
limitations associated with soil texture, altitude or climatic conditions. Finally the limited category
has significant limitation on land use based on attitude, slope, soil texture or drainage.
Farm system: Within the Teagasc NFS, farms are classified into major farming systems according to
the standardised EU typology used by FADN (a more detailed explanation can be found in Dillon et
al., 2017). This report displays results for the four dominant farm systems namely, dairy, cattle,
sheep and tillage.
Organic N stocking rate: Is derived based on Organic N excretion rates (e.g. a dairy cow = 85 kg of
organic N) as set down in the GAP regulations of Statutory Instrument number 31 of 2014 (see
Table 1) and the definition of grassland area set out above.
Table 1: Organic N excretion rates by animal type
Livestock Type* Total N kg/year
Dairy cow 85
Suckler cow 65
Cattle (0-1 year old) 24
Cattle (1-2 years old) 57
Cattle (> 2 years) 65
Mountain ewe & lambs 7
Lowland ewe & lambs 13
Mountain hogget 4
Lowland hogget 6
*See Table 6 of S.I No. 31 of 2014

17
Agri-environmental schemes: Participation or non-participation in agri-environmental schemes is
recorded within the Teagasc NFS dataset as a binary (yes/no) variable. Over the time period in
question the relevant schemes were REPS (Rural Environment Protection Scheme), the Agri-
Environment Options Scheme (AEOS) and the Green Low Carbon Agri-Environment (GLAS) scheme.
1.4 Validation of results
Aggregated data on fertiliser use (N, P and K) from the Teagasc NFS for the period 2005-2015 were
validated by comparison with published annual sales data from the Department of Agriculture, Food
and the Marine (DAFM, 2017). Aggregate results from both data sources contained in Figure 2
below confirms the accuracy of the Teagasc NFS fertiliser application data given that it generally
tracks national fertiliser sales over the period. However, it should be noted that some differences
arise due to the potential carryover of stocks on farms and the fact that DAFM sales figures are
compiled on the basis of the fertiliser sales year running from October 1st to September 30th,
whereas the Teagasc NFS fertiliser use data is compiled for the calendar year in which it is applied.
Figure 2: National Fertilisers Sales (DAFM) & Fertiliser application data (Teagasc NFS) 2005-2015
Source: Department of Agriculture Food and the Marine & Teagasc National Farm Survey
0
50
100
150
200
250
300
350
400
2005 2006 2007 2008 2009 2010 2011 2012 2013 2014 2015
Fert
ilise
rvo
lum
e('
00
0to
nn
es)
N Sales P Sales K Sales N NFS P NFS K NFS
18
1.5 Comparison with previous surveys
It should be noted that the results in this report are not directly comparable with previous fertiliser
use survey reports (Lalor et al., 2010, Coulter et al., 2002, 2005) as the methodology has been
updated to reflect best practice for the publication of data in line with EU Farm Accountancy Data
Network (FADN) standards. All statistics presented in this report are population weighted to be
reflective of Irish farming based on a national basis by farm size and system.
19
2. Demand drivers
This report presents data on macro-nutrients (N, P and K) usage on Irish farms over an eleven year
period (2005-2015) across multiple dimensions. However, many factors external to the farm gate
can influence fertiliser application rates. These include (but not exclusively) fertiliser prices, farm
output prices, weather or changes to prevailing regulations. This report does not aim to assign
causality to changes in fertiliser application rates over the period; however, results from the analysis
suggest fertiliser application rates are affected by changes in these external factors. Within this
context, developments in external factors are presented below to assist the reader in their
interpretation of the results.
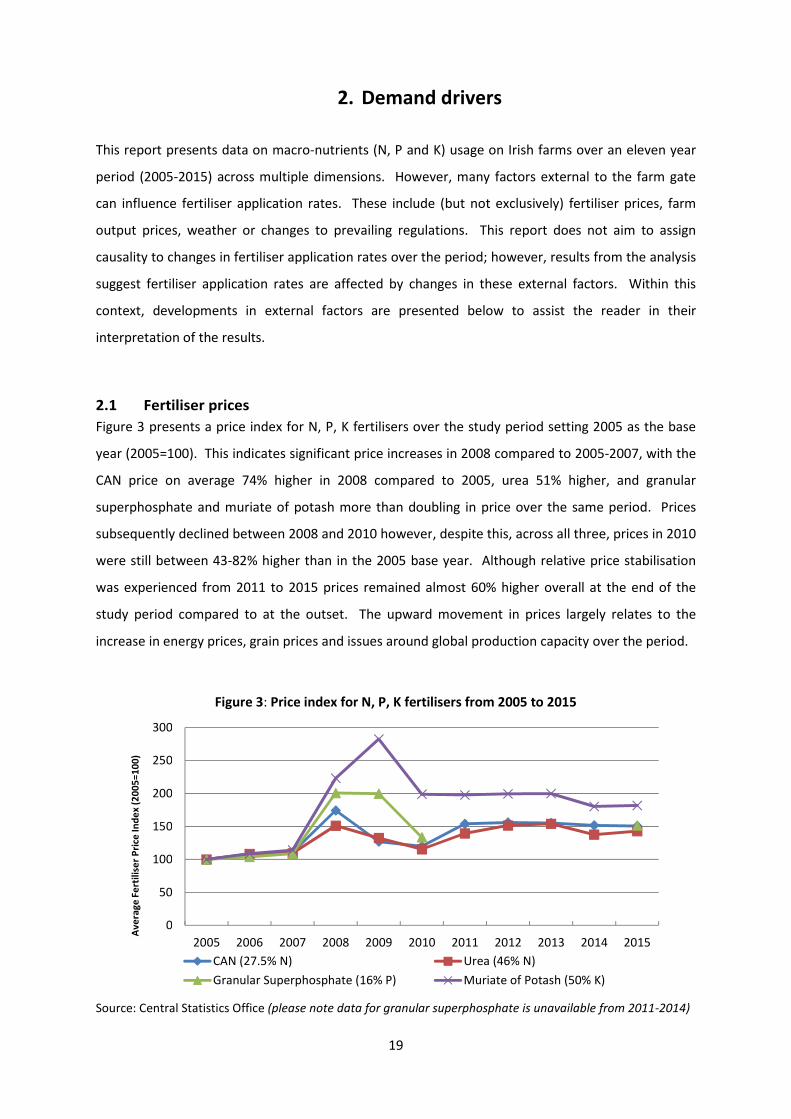
2.1 Fertiliser prices
Figure 3 presents a price index for N, P, K fertilisers over the study period setting 2005 as the base
year (2005=100). This indicates significant price increases in 2008 compared to 2005-2007, with the
CAN price on average 74% higher in 2008 compared to 2005, urea 51% higher, and granular
superphosphate and muriate of potash more than doubling in price over the same period. Prices
subsequently declined between 2008 and 2010 however, despite this, across all three, prices in 2010
were still between 43-82% higher than in the 2005 base year. Although relative price stabilisation
was experienced from 2011 to 2015 prices remained almost 60% higher overall at the end of the
study period compared to at the outset. The upward movement in prices largely relates to the
increase in energy prices, grain prices and issues around global production capacity over the period.
Figure 3: Price index for N, P, K fertilisers from 2005 to 2015
Source: Central Statistics Office (please note data for granular superphosphate is unavailable from 2011-2014)
0
50
100
150
200
250
300
2005 2006 2007 2008 2009 2010 2011 2012 2013 2014 2015
Ave
rage
Fert
ilise
rP
rice
Ind
ex
(20
05
=10
0)
CAN (27.5% N) Urea (46% N)
Granular Superphosphate (16% P) Muriate of Potash (50% K)

20
2.2 Farm output prices
Changes in output prices (milk, livestock and crops) can influence the demand for fertilisers at the
farm level. In general, higher intensity and higher income systems such as dairying tend to have a
greater demand for fertiliser, with more price inelastic demand due to income effects. While these
effects can explain differences in fertiliser demand between different farm systems, changes in
output prices can also affect year-on-year demand across individual farm systems. In this context an
agricultural output price index is presented in Figure 4 to illustrate changes in output prices across
the four farm systems reported here, with a base year of 2005. Figure 4 indicates that there is
significant price volatility in output prices for milk, cereals, cattle and sheep over the study period.
For example milk price was nearly 20% lower in 2009 compared to the base year (2005) and was
then nearly 40% higher in 2013. The situation on cereal farms is even more dramatic, with an almost
doubling in prices in 2013 (compared to 2005). It should be noted that there may be a lag between
output price changes and fertiliser purchase decisions. In addition, the timing of fertiliser purchase
will differ across farm systems throughout the year.
Figure 4: Agricultural output price indices for milk, cattle, sheep and cereals from 2005 to 2015
Source: Central Statistics Office
2.3 Weather
Prevailing weather condition (e.g. rainfall and temperature) can influence availability and utilisation
of fertilisers. For example higher rainfall years tend to be associated with weaker crop growth and
less availability of nutrients for agricultural production due to reduced nutrient concentrations in soil
solution. For example, 2012-2013 is associated with weaker growth conditions in Ireland (where
persistent lower spring temperatures in 2013 following high rainfall in 2012) which led to a national
80
100
120
140
160
180
200
2005 2006 2007 2008 2009 2010 2011 2012 2013 2014 2015
Agr
icu
ltu
ralP
rice
Ind
ice
s(2
00
5=1
00
Milk Cattle Sheep Cereals
21
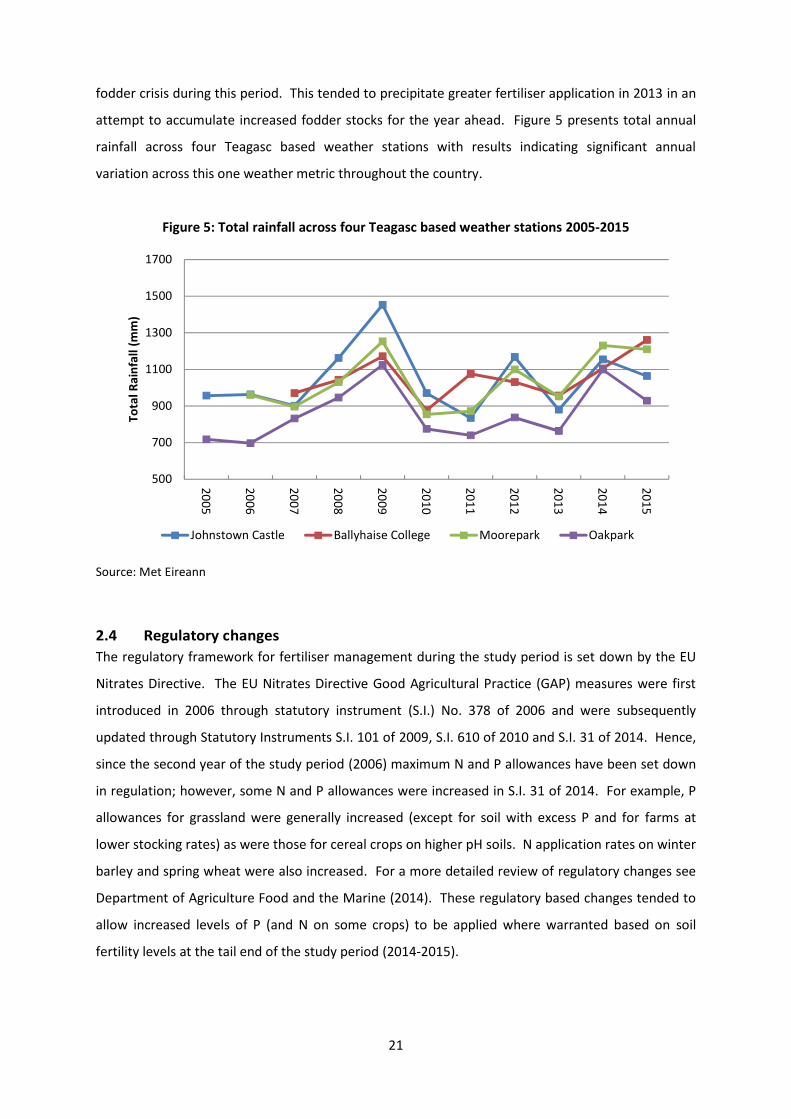
fodder crisis during this period. This tended to precipitate greater fertiliser application in 2013 in an
attempt to accumulate increased fodder stocks for the year ahead. Figure 5 presents total annual
rainfall across four Teagasc based weather stations with results indicating significant annual
variation across this one weather metric throughout the country.
Figure 5: Total rainfall across four Teagasc based weather stations 2005-2015
Source: Met Eireann
2.4 Regulatory changes
The regulatory framework for fertiliser management during the study period is set down by the EU
Nitrates Directive. The EU Nitrates Directive Good Agricultural Practice (GAP) measures were first
introduced in 2006 through statutory instrument (S.I.) No. 378 of 2006 and were subsequently
updated through Statutory Instruments S.I. 101 of 2009, S.I. 610 of 2010 and S.I. 31 of 2014. Hence,
since the second year of the study period (2006) maximum N and P allowances have been set down
in regulation; however, some N and P allowances were increased in S.I. 31 of 2014. For example, P
allowances for grassland were generally increased (except for soil with excess P and for farms at
lower stocking rates) as were those for cereal crops on higher pH soils. N application rates on winter
barley and spring wheat were also increased. For a more detailed review of regulatory changes see
Department of Agriculture Food and the Marine (2014). These regulatory based changes tended to
allow increased levels of P (and N on some crops) to be applied where warranted based on soil
fertility levels at the tail end of the study period (2014-2015).
500
700
900
1100
1300
1500
1700
20
05
20
06
20
07
20
08
20
09
20
10
20
11
20
12
20
13
20
14
20
15
Tota
lRai
nfa
ll(m
m)
Johnstown Castle Ballyhaise College Moorepark Oakpark

22
3. Results
3.1 Fertiliser Use on Grazed Grassland 2005-2015
3.1.1 Fertiliser Use on Grazed Grassland by Nitrate Zone
Table 2 outlines the profile of farms with grazed grassland by nitrate zone over the period 2005 to
2015. The average grazing area across farms in all zones ranged from 31 to 33 hectares over this
period. The average area under grazing tended to be largest in zone A (33 hectares) and smallest in
zone C (27 hectares). This is reflective of the geographical location of these farms, with zone A
located in the South and East and zone C in the Border region. Nationally, these data indicate that
41% of the farms with grazing area were in zone A over the period, with 46% in zone B and only 12%
in the smaller zone C.
Table 2: Average farm size, NFS farms and farm population by Nitrate Zone - Grazing Area
Year 2005 2006 2007 2008 2009 2010 2011 2012 2013 2014 2015
Average area (ha) – grazing area
Zone A 34 34 33 33 34 33 34 35 33 33 32
Zone B 29 30 30 31 31 30 31 32 32 30 30
Zone C 27 27 27 26 27 27 28 30 28 25 26
All Zones 31 31 31 31 32 31 32 33 32 31 31
No. of Teagasc NFS farms with grazing area
Zone A 524 514 525 532 505 493 516 503 502 477 477
Zone B 384 387 384 365 358 341 325 323 333 326 321
Zone C 121 119 113 117 111 118 112 103 104 105 103
All Zones 1,029 1,020 1,022 1,014 974 952 953 929 939 908 901
% of Total farm population with grazing area*
Zone A 41% 41% 42% 42% 42% 42% 42% 42% 42% 40% 40%
Zone B 46% 46% 46% 46% 46% 46% 46% 46% 46% 47% 47%
Zone C 12% 12% 12% 12% 12% 12% 12% 12% 12% 13% 13%*National population weights applied to Teagasc NFS farms
Figure 6 illustrates N applied on grazed grassland (kg ha-1) by nitrate zone. Results indicate a general
decline of approximately (30%) in N applied between 2005 and 2008 across all zones, with the
reduction in 2008 associated with high fertiliser prices. N use subsequently increased slightly in
2009/10, with a further decline until 2013 - a year associated with poor growing conditions and a
national fodder shortage. Following this increase in 2013, application rates further declined by 12%
on average across all zones. Results indicate that N application rates in zone A were significantly
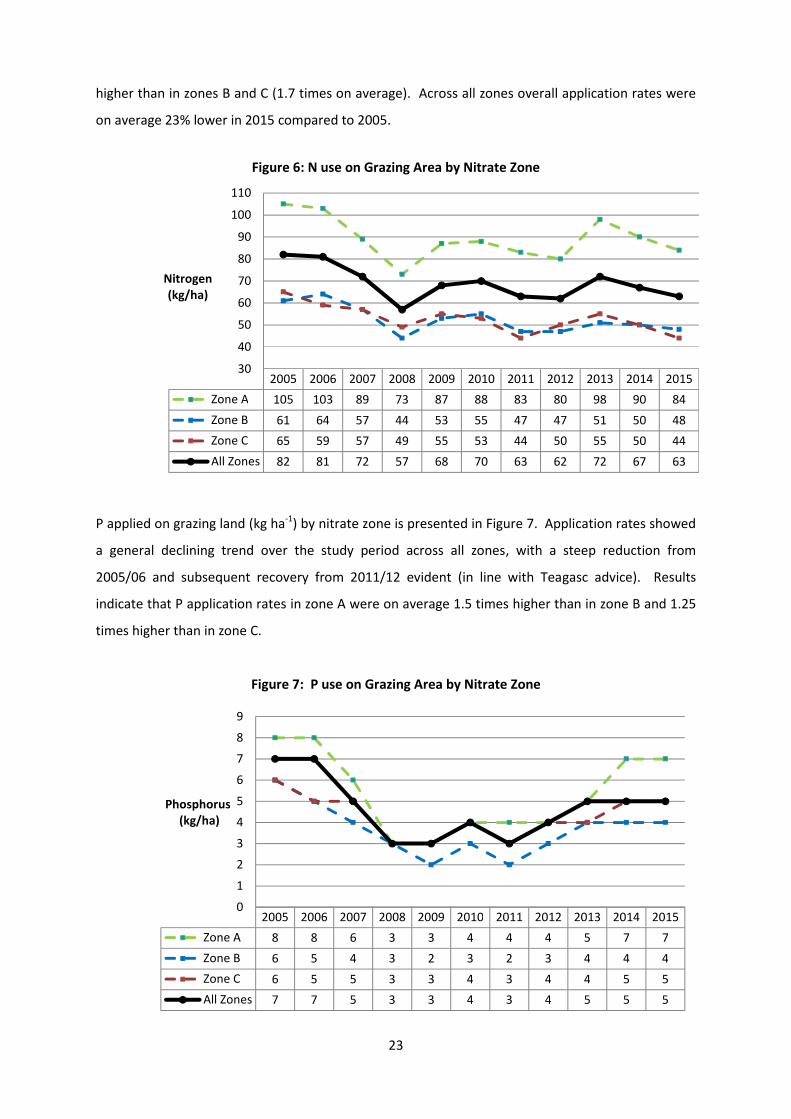
23
higher than in zones B and C (1.7 times on average). Across all zones overall application rates were
on average 23% lower in 2015 compared to 2005.
Figure 6: N use on Grazing Area by Nitrate Zone
P applied on grazing land (kg ha-1) by nitrate zone is presented in Figure 7. Application rates showed
a general declining trend over the study period across all zones, with a steep reduction from
2005/06 and subsequent recovery from 2011/12 evident (in line with Teagasc advice). Results
indicate that P application rates in zone A were on average 1.5 times higher than in zone B and 1.25
times higher than in zone C.
Figure 7: P use on Grazing Area by Nitrate Zone
2005 2006 2007 2008 2009 2010 2011 2012 2013 2014 2015
Zone A 105 103 89 73 87 88 83 80 98 90 84
Zone B 61 64 57 44 53 55 47 47 51 50 48
Zone C 65 59 57 49 55 53 44 50 55 50 44
All Zones 82 81 72 57 68 70 63 62 72 67 63
30
40
50
60
70
80
90
100
110
Nitrogen(kg/ha)
2005 2006 2007 2008 2009 2010 2011 2012 2013 2014 2015
Zone A 8 8 6 3 3 4 4 4 5 7 7
Zone B 6 5 4 3 2 3 2 3 4 4 4
Zone C 6 5 5 3 3 4 3 4 4 5 5
All Zones 7 7 5 3 3 4 3 4 5 5 5
0
1
2
3
4
5
6
7
8
9
Phosphorus(kg/ha)

24
Average P application rates were in the order of 50 per cent lower during the middle of the period
(2008-2012) and 15-30 per cent lower at the end (2013-2015) compared to those at the outset.
Overall, P usage declined by 29% on average across all zones from 2005 to 2015 with the largest
decline found in zone B at 33%. The equivalent figure for zones A and C were 13% and 17% lower
respectively.
Figure 8 illustrates K applied on grazing land (kg ha-1) by nitrate zone. Results indicate that average K
application rates in zone A were 1.5 times higher than in both zones B and C over the study period.
Average K application rates were 40-60 per cent lower during the middle of the period (2008-2012)
and 20 per cent lower at the end (2013-2015) compared to the start. The decline is most evident in
zone B, with K use in 2015 almost half that of 2005. On the other hand, K usage in zones A and C has
increased since 2011/12 and was almost back to 2005 levels in 2015.
Figure 8: K use on Grazing Area by Nitrate Zone
2005 2006 2007 2008 2009 2010 2011 2012 2013 2014 2015
Zone A 18 17 14 9 7 11 10 10 13 17 17
Zone B 14 12 11 6 6 7 6 7 9 9 8
Zone C 12 10 9 6 6 7 6 7 9 10 11
All Zones 15 14 12 7 6 9 8 8 11 12 12
0
2
4
6
8
10
12
14
16
18
20
Potassium(kg/ha)

25
3.1.2 Fertiliser Use on Grazed Grassland by Land Use Class
Table 3 outlines the area of grazed grassland across farms by land use class over the study period.
Farms of wide land use class tended to be slightly larger (at 34 hectares) than those on more limited
soils (30-31 hectares). On average, 30% of farms nationally are in the wide land use category, 19%
fall into the moderately wide land use class, 21% into the somewhat limited category and 30% into
the limited category. Farms can thus be generally divided in two, with half on wide/moderately wide
soils and the other half on limited/somewhat limited soils.
Table 3: Average farm size, NFS farms and farm population by Land Use Class - Grazing Area
Year 2005 2006 2007 2008 2009 2010 2011 2012 2013 2014 2015
Average area (ha) – grazing area
Limited 28 29 30 30 30 30 31 32 33 32 32
Somewhat Limited 31 29 30 30 31 30 30 33 33 31 32
Moderately Wide 31 31 30 31 30 29 31 31 30 28 29
Wide 34 34 34 34 34 34 34 35 33 32 31
All Soils 31 31 31 31 32 31 32 33 32 31 31
No. of Teagasc NFS Farms with grazing area
Limited 321 311 307 295 282 278 260 255 245 233 234
Moderately Wide 172 180 179 177 176 170 168 160 171 166 167
Somewhat Limited 190 188 184 189 184 186 189 187 194 189 189
Wide 346 341 352 353 332 316 335 318 323 305 303
All Soils 1029 1020 1022 1014 974 950 952 920 933 893 893
% of Total farm population with grazing area*
Limited 33% 31% 31% 30% 30% 30% 29% 29% 29% 28% 29%
Moderately Wide 18% 20% 19% 20% 20% 20% 20% 19% 18% 18% 18%
Somewhat Limited 20% 20% 19% 20% 20% 22% 21% 22% 23% 25% 23%
Wide 29% 29% 30% 30% 30% 29% 31% 30% 30% 29% 29%*National population weights applied to Teagasc NFS farms
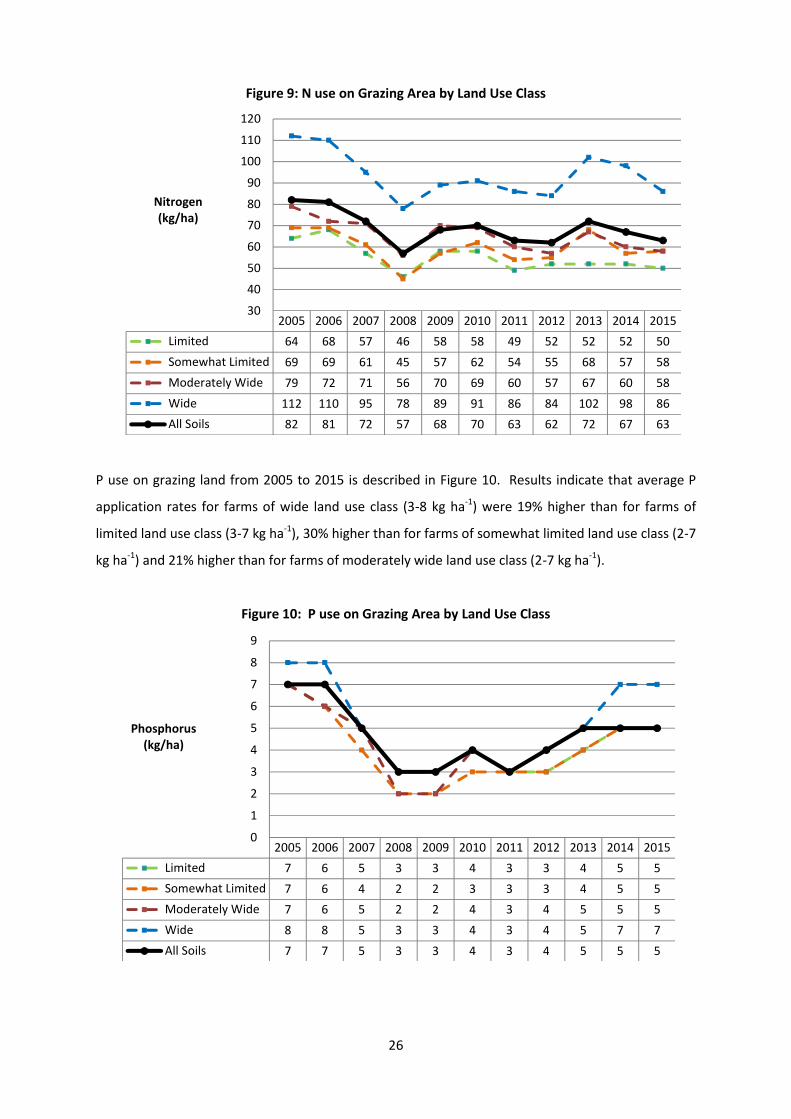
Figure 9 indicates that average N application rates on grazing area were 48% higher (84-112 kg ha-1)
for farms of wide land use class compared to those farms of moderately wide land use class (56-79
kg ha-1), 57% higher than for farms of somewhat limited land use class (45-69 kg ha-1) and over 70%
higher than for farms of limited land use class (46-64 kg ha-1). The highest application rates were
recorded at the start of the study period (2005/2006) for all land use classes with the lowest rates
recorded in 2008 (30% lower than at the start of the study period). Although there was some
recovery in the intervening years (and in 2013 in particular), N application rates were on average 12-
23% lower at the end of the study period (2013-2015) across all classes compared to at the outset.
26
Figure 9: N use on Grazing Area by Land Use Class
P use on grazing land from 2005 to 2015 is described in Figure 10. Results indicate that average P
application rates for farms of wide land use class (3-8 kg ha-1) were 19% higher than for farms of
limited land use class (3-7 kg ha-1), 30% higher than for farms of somewhat limited land use class (2-7
kg ha-1) and 21% higher than for farms of moderately wide land use class (2-7 kg ha-1).
Figure 10: P use on Grazing Area by Land Use Class
2005 2006 2007 2008 2009 2010 2011 2012 2013 2014 2015
Limited 64 68 57 46 58 58 49 52 52 52 50
Somewhat Limited 69 69 61 45 57 62 54 55 68 57 58
Moderately Wide 79 72 71 56 70 69 60 57 67 60 58
Wide 112 110 95 78 89 91 86 84 102 98 86
All Soils 82 81 72 57 68 70 63 62 72 67 63
30
40
50
60
70
80
90
100
110
120
Nitrogen(kg/ha)
2005 2006 2007 2008 2009 2010 2011 2012 2013 2014 2015
Limited 7 6 5 3 3 4 3 3 4 5 5
Somewhat Limited 7 6 4 2 2 3 3 3 4 5 5
Moderately Wide 7 6 5 2 2 4 3 4 5 5 5
Wide 8 8 5 3 3 4 3 4 5 7 7
All Soils 7 7 5 3 3 4 3 4 5 5 5
0
1
2
3
4
5
6
7
8
9
Phosphorus(kg/ha)
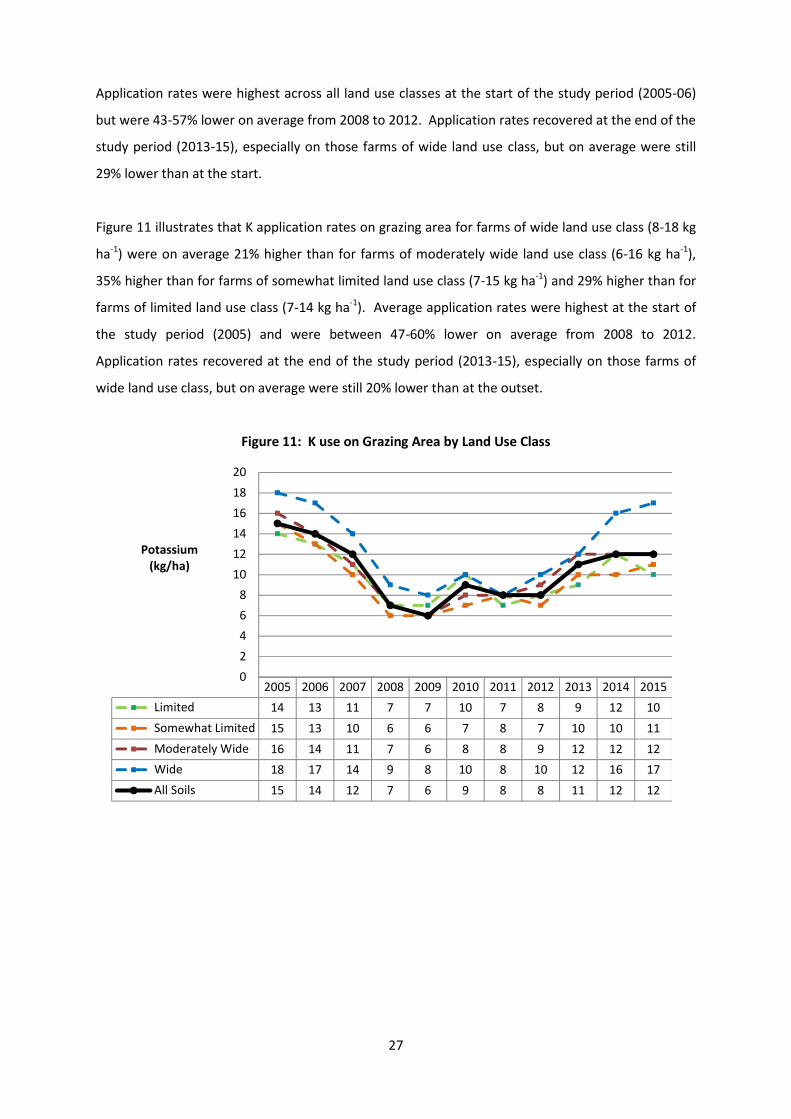
27
Application rates were highest across all land use classes at the start of the study period (2005-06)
but were 43-57% lower on average from 2008 to 2012. Application rates recovered at the end of the
study period (2013-15), especially on those farms of wide land use class, but on average were still
29% lower than at the start.
Figure 11 illustrates that K application rates on grazing area for farms of wide land use class (8-18 kg
ha-1) were on average 21% higher than for farms of moderately wide land use class (6-16 kg ha-1),
35% higher than for farms of somewhat limited land use class (7-15 kg ha-1) and 29% higher than for
farms of limited land use class (7-14 kg ha-1). Average application rates were highest at the start of
the study period (2005) and were between 47-60% lower on average from 2008 to 2012.
Application rates recovered at the end of the study period (2013-15), especially on those farms of
wide land use class, but on average were still 20% lower than at the outset.
Figure 11: K use on Grazing Area by Land Use Class
2005 2006 2007 2008 2009 2010 2011 2012 2013 2014 2015
Limited 14 13 11 7 7 10 7 8 9 12 10
Somewhat Limited 15 13 10 6 6 7 8 7 10 10 11
Moderately Wide 16 14 11 7 6 8 8 9 12 12 12
Wide 18 17 14 9 8 10 8 10 12 16 17
All Soils 15 14 12 7 6 9 8 8 11 12 12
0
2
4
6
8
10
12
14
16
18
20
Potassium(kg/ha)
28
3.1.3 Fertiliser Use on Grazed Grassland by Farm System
Table 4 outlines grazing area by farm system over the study period. Dairy farms on average had the
largest area under grazed grass between 2005 and 2015 (39 hectares). This was 37% higher than on
cattle farms (29 hectares), 20% higher than on sheep farms (33 hectares) and 85% higher than on
tillage farms (21 hectares) on average. In terms of the proportion of farms represented by the
Teagasc NFS sample nationally, over half were cattle farms (53%) and 25% were in dairying with the
remaining farms either sheep (14%) or tillage (7%) on average.
Table 4: Average farm size, NFS farms and farm population by Farming System - Grazing Area
Year 2005 2006 2007 2008 2009 2010 2011 2012 2013 2014 2015
Average Area (ha) – grazing area
Cattle 29 28 29 29 29 29 29 30 29 28 27
Dairy 38 38 38 39 40 39 39 41 40 41 41
Sheep 31 31 32 33 31 32 32 34 38 34 34
Tillage 22 24 23 22 22 19 21 21 21 19 20
All Systems 31 31 31 31 32 31 32 33 32 31 31
No. of Teagasc NFS farms with grazing area
Cattle 368 381 404 421 413 395 386 366 369 365 360
Dairy 447 416 390 378 353 346 355 361 372 353 347
Sheep 144 148 144 125 122 125 123 119 118 120 126
Tillage 70 74 84 90 86 85 88 82 80 70 68
All Systems 1029 1019 1022 1014 974 951 952 928 939 908 901
% of Total farm population with grazing area*
Cattle 53% 53% 53% 53% 53% 53% 53% 53% 53% 55% 55%
Dairy 26% 26% 26% 26% 26% 25% 25% 25% 25% 21% 22%
Sheep 14% 14% 14% 14% 14% 14% 14% 14% 14% 16% 16%
Tillage 7% 6% 6% 7% 7% 8% 7% 7% 7% 8% 7%*National population weights applied to Teagasc NFS farms
N application rates on grazing area across the different farm systems presented in Figure 12
indicates that N application rates on dairy farms (111-152 kg ha-1) were on average over 3 times
greater than those on cattle and sheep farms (30-52 kg ha-1) and twice as high as on tillage farms
(52-80 kg ha-1). Average N application rates were highest across all farm systems at the beginning of
the study period (2005/06) but declined by between 15-30% on average during 2008-2012. A
recovery in usage is reported from 2008 and again in 2013, however, application rates at the end of
the study period (2013-2015) were lower than at the outset ranging from 12 to 23% reduction on
average across all systems. The largest decline over the period is reported on sheep and tillage
farms at close to 40% with more modest reductions reported on dairy and cattle farms at 15% and
22% respectively.

29
Figure 12: N use on Grazing Area by Farm System
Figure 13 illustrates P application rates by farm system on grazing area. Application rates on dairy
farms (4-10 kg ha-1) were on average 90-100% higher than on cattle and sheep farms (2-6 kg ha-1)
between 2005 and 2015. Average application rates were highest across all farm systems at the start
of the study period (2005/06), but declined by between 43-57% on average from 2008 to 2012
across all systems. Application rates increased at the end of the study period (2013-15), especially
on dairy and sheep farms, but on average were still 29% lower than at the start across all farms. The
largest decline in P usage was evident on tillage and cattle farms at 38% and 33% respectively.
Figure 13: P use on Grazing Area by Farm System
2005 2006 2007 2008 2009 2010 2011 2012 2013 2014 2015
Cattle 50 48 44 32 42 46 37 37 47 42 39
Dairy 152 150 131 111 129 128 127 124 140 139 129
Sheep 48 52 44 30 33 38 30 30 33 33 30
Tillage 80 77 68 59 65 56 47 52 66 50 49
All Systems 82 81 72 57 68 70 63 62 72 67 63
20
40
60
80
100
120
140
160
Nitrogen(kg/ha)
2005 2006 2007 2008 2009 2010 2011 2012 2013 2014 2015
Cattle 6 5 4 2 2 4 2 3 4 4 4
Dairy 10 10 6 4 4 5 5 5 7 9 9
Sheep 6 4 4 2 2 3 2 3 3 4 5
Tillage 8 7 8 4 3 4 4 5 6 6 5
All Systems 7 7 5 3 3 4 3 4 5 5 5
0
2
4
6
8
10
12
Phosphorus(kg/ha)
30
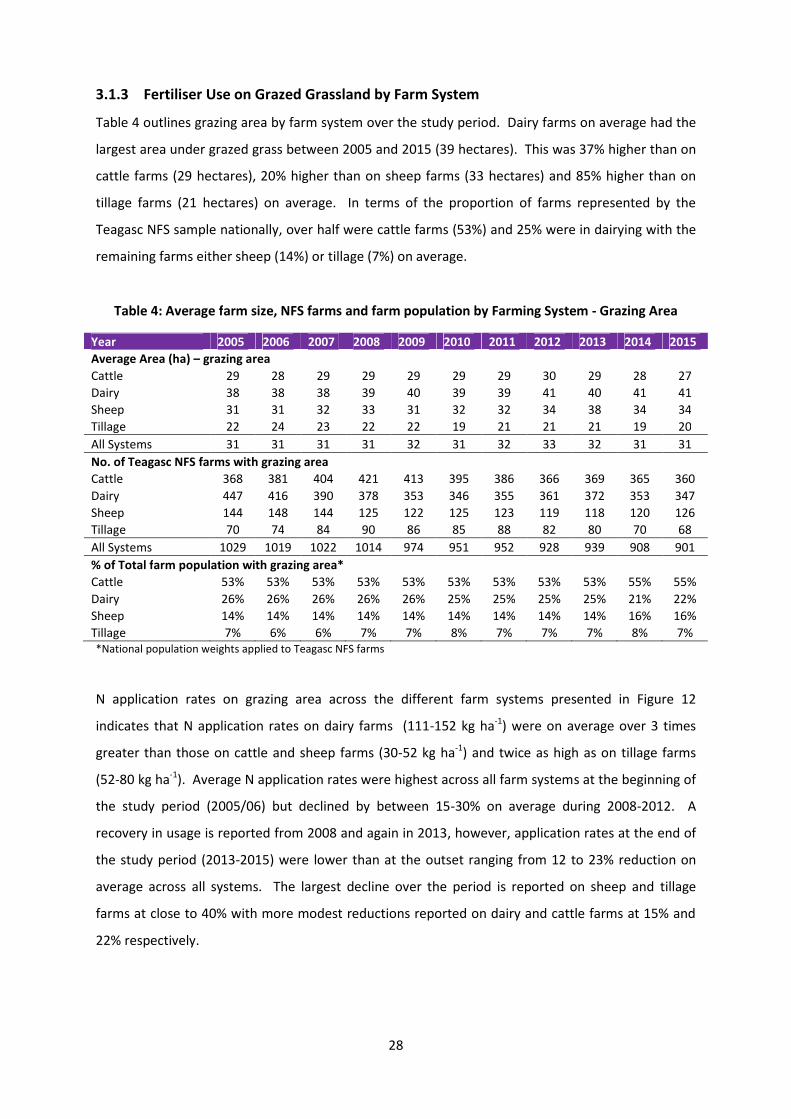
A similar picture with regard to K use is evident across systems from 2005 to 2015 (Figure 14), with a
general decline during the first half of the period with some recovery from 2009 and most
significantly from 2012. Recovery is most evident on dairy farms, with K application rates in 2015
close to 2005 levels (only down 5% on average). Similarly, K usage in 2015 on sheep farms was also
close to 2005 levels (down 10% on average). The decline in K usage on cattle and tillage farms was
larger over the period at 30% and 22% respectively. Average K application rates on dairy farms (9-22
kg ha-1) were 7% higher than on tillage farms (8-21 kg ha-1), 78% higher than on cattle farms (6-13 kg
ha-1) and 122% higher than on sheep farms (4-10 kg ha-1). Across all farms average K usage was 20%
lower in 2015 than in 2005.
Figure 14: K use on Grazing Area by Farm System
2005 2006 2007 2008 2009 2010 2011 2012 2013 2014 2015
Cattle 13 12 10 6 6 8 6 7 8 10 9
Dairy 22 20 15 10 9 11 12 12 17 20 21
Sheep 10 9 8 5 4 6 4 6 7 8 9
Tillage 18 21 18 13 8 12 11 13 15 15 14
All Systems 15 14 12 7 6 9 8 8 11 12 12
0
5
10
15
20
25
Potassium(kg/ha)

31
3.1.4 Fertiliser Use on Grazed Grassland by Organic N Stocking rate
Table 5 outlines grazing area, sample and population statistics across a range of Organic N (ON)
stocking rate bands. Stocking rate refers to total grassland stocking rate, rather than on the grazing
platform in isolation. The largest average grazing area over the study period was associated with
farms in the 170-210 kg ON ha-1 category at nearly 35 hectares, followed by the 130-170 kg ON ha-1
category at 33 hectares. The average grazing area across the <85, 85-130 and >210 kg ON ha-1
categories was 30-31 hectares. On average over the study period 28%, 37%, 22%, 9%, 4% of the
population fell into the <85 , 85-130, 130-170, 170-210 and >210 kg ON ha-1 categories respectively.
Table 5: Average Farm size, NFS farms and farm population by Org. N stocking rate – Grazing Area
Year 2005 2006 2007 2008 2009 2010 2011 2012 2013 2014 2015
Average area (ha) – grazing area
< 85 kg ON ha-1
30 31 32 31 30 30 30 33 34 31 32
85-130 kg ON ha-1
29 29 30 31 29 30 31 31 30 28 28
130-170 kg ON ha-1
35 34 34 33 34 33 33 33 33 32 33
170-210 kg ON ha-1
32 31 33 34 39 35 34 37 36 37 38
> 210 kg ON ha-1
24 30 26 31 30 32 34 30 31 30 31
All Farms 31 31 31 31 32 31 32 33 32 31 31
No. of Teagasc NFS farms with grazing area
< 85 kg ON ha-1
162 195 224 226 236 250 271 235 224 230 232
85-130 kg ON ha-1
332 331 342 349 338 317 295 291 289 275 265
130-170 kg ON ha-1
277 281 261 269 225 218 220 229 222 211 204
170-210 kg ON ha-1
166 138 133 103 113 107 106 121 131 126 125
> 210 kg ON ha-1
92 75 62 67 62 60 61 53 73 66 75
All Farms 1029 1020 1022 1014 974 952 953 929 939 908 901
% of Total farm population with grazing area*
< 85 kg ON ha-1
20% 23% 25% 26% 28% 30% 33% 29% 28% 31% 31%
85-130 kg ON ha-1
39% 38% 39% 39% 39% 37% 35% 38% 36% 35% 37%
130-170 kg ON ha-1
23% 23% 22% 24% 21% 21% 20% 21% 21% 21% 19%
170-210 kg ON ha-1
12% 11% 10% 7% 8% 8% 8% 9% 9% 8% 8%
> 210 kg ON ha-1
6% 5% 4% 4% 4% 4% 4% 4% 5% 4% 5%*National population weights applied to Teagasc NFS farms
N fertiliser application rates on grazing area were highest for the most intensively stocked category
of >210 kg ON ha-1, with application rates ranging from 185-224 kg ha-1 over the study period. This
was in the order of 9 and 4 times higher than the two lowest stocked categories (<85, 85-130 kg ON
ha-1) respectively and was 102% and 31% higher than the 130-170, 170-210 kg ON ha-1 categories.
Application rates tended to peak at the start of the study period and then followed a general
declining trend, with a period low in 2008 across all categories. Application rates increased
somewhat in 2010 and 2013 on average across all stocking rate categories, before declining towards
the end of the study period, as illustrated in Figure 15. Application rates were on average 23% lower
at the end of the period compared to starting period levels across all stocking rate categories.

32
Figure 15: N use on Grazing Area by Organic N stocking rate category
Figure 16 presents average P application rates on grazing area by organic N stocking rate and these
were again highest for the most intensively stocked category of >210 kg ON ha-1 ranging from 5-15
kg ha-1 over the study period. This was 3.5 and 2 times higher than the two lowest stocked
categories (<85, 85-130 kg ON ha-1) respectively and was 41% and 23% higher than the 130-170, 170-
210 kg ON ha-1 categories.
Figure 16: P use on Grazing Area by Organic N stocking rate category
2005 2006 2007 2008 2009 2010 2011 2012 2013 2014 2015
< 85 28 28 23 17 23 27 21 20 22 17 17
85-130 54 57 56 41 51 57 48 45 56 49 46
130-170 105 106 93 79 98 101 98 93 106 107 100
170-210 166 165 156 139 142 143 150 153 158 157 145
> 210 213 224 216 185 210 195 191 187 198 200 180
All Rates 82 81 72 57 68 70 63 62 72 67 63
30507090
110130150170190210230
Nitrogen(kg/ha)
2005 2006 2007 2008 2009 2010 2011 2012 2013 2014 2015
< 85 5 4 3 1 2 2 2 2 2 2 2
85-130 6 6 5 3 2 4 3 4 5 5 5
130-170 8 8 6 4 4 5 5 5 6 8 9
170-210 11 11 7 5 3 5 5 5 7 10 9
> 210 15 15 10 5 6 5 5 6 9 10 10
All Rates 7 7 5 3 3 4 3 4 5 5 5
0
2
4
6
8
10
12
14
16
Phosphorus(kg/ha)
33
Again, application rates were generally higher at the start of the study period (2005/2006) and then
declined by 43-57% across all rates mid-study period (2008-2012) before recovering at the end of
the period (except for the highest and lowest stocking rate bands).
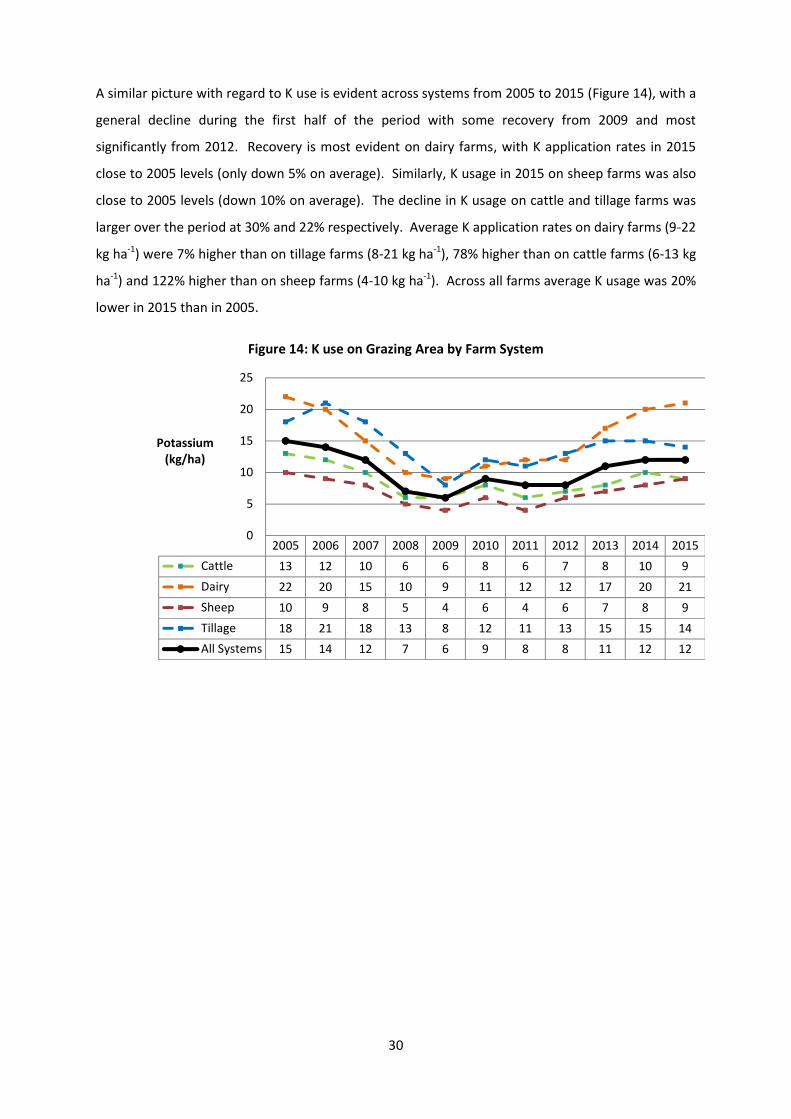
Average K application rates across total grassland area were again highest for the most intensively
stocked category of >210 kg ON ha-1 ranging from 9-33 kg ha-1 over the study period as is evident
from Figure 17. This was approximately 4 times and twice as high as the two lowest stocked
categories (<85, 85-130 kg ON ha-1) respectively and 46% and 14% higher than the 130-170, 170-210
kg ON ha-1 categories. Application rates generally peaked at the start of the study period
(2005/2006) and then declined by 47-53% across all rates mid-study period (2008-2012), before
recovering at the end of the period (except for the highest and lowest stocking rate bands).
Figure 17: K use on Grazing Area by Organic N stocking rate category
Nutrient use by stocking rate was also considered by farm system and Table 6 displays data on N, P
and K usage on dairy farms for the years 2005, 2010 and 2015. Results confirm that dairy farms are
more intensive, with higher stocking rates and higher fertiliser application rates for grazed grassland
compared to cattle and sheep farms (data for which are contained in Table 7 and Table 8). The
higher average nutrient usage on dairy farms (particularly for N) is reflective of the higher enterprise
2005 2006 2007 2008 2009 2010 2011 2012 2013 2014 2015
< 85 8 8 7 3 4 6 4 4 5 4 4
85-130 13 12 11 7 6 9 7 9 11 12 12
130-170 18 16 14 9 9 12 12 12 13 18 19
170-210 24 24 18 13 9 13 14 13 19 23 24
> 210 31 33 24 15 11 9 11 13 24 27 24
All Rates 15 14 12 7 6 9 8 8 11 12 12
0
5
10
15
20
25
30
35
Potassium(kg/ha

34
margins and consequently the higher economic optimum N rate, as well as greater nutrient removal
in milk. Across dairy farms, a decline in both N and P application rates is evident across stocking rate
bands over the period, with marginal increases in K application rates reported for both the 130-170
kg ON ha-1 and 170-210 kg ON ha-1 categories.
Table 6: Average farm size, NFS farms and farm population Dairy Farms by Org. N - Grazing Area
YearOrg N
Stocking Rate
NFS
Farms
Farm
Pop.% Pop. N (kg/ha)
P
(kg/ha)
K
(kg/ha)
Area
(ha)
2005 < 85 kg ON ha-1 17 923 5% 44 4 8 42
2005 85-130 kg ON ha-1 74 4,022 20% 90 8 18 34
2005 130-170 kg ON ha-1 165 7,087 36% 135 9 20 42
2005 170-210 kg ON ha-1 124 5,079 25% 192 11 24 39
2005 > 210 kg ON ha-1 67 2,847 14% 260 17 35 30
2010 < 85 kg ON ha-1 18 1,811 9% 39 2 5 30
2010 85-130 kg ON ha-1 66 4,306 22% 82 4 10 39
2010 130-170 kg ON ha-1 130 7,107 36% 127 5 12 41
2010 170-210 kg ON ha-1 83 4,244 21% 163 5 13 38
2010 > 210 kg ON ha-1 49 2,489 12% 203 5 9 39
2015 < 85 kg ON ha-1 10 1,073 6% 29 2 4 48
2015 85-130 kg ON ha-1 55 3,887 21% 73 6 13 39
2015 130-170 kg ON ha-1 115 5,443 29% 130 9 21 44
2015 170-210 kg ON ha-1 104 4,942 27% 164 10 27 43
2015 > 210 kg ON ha-1 63 3,216 17% 188 10 25 33
35
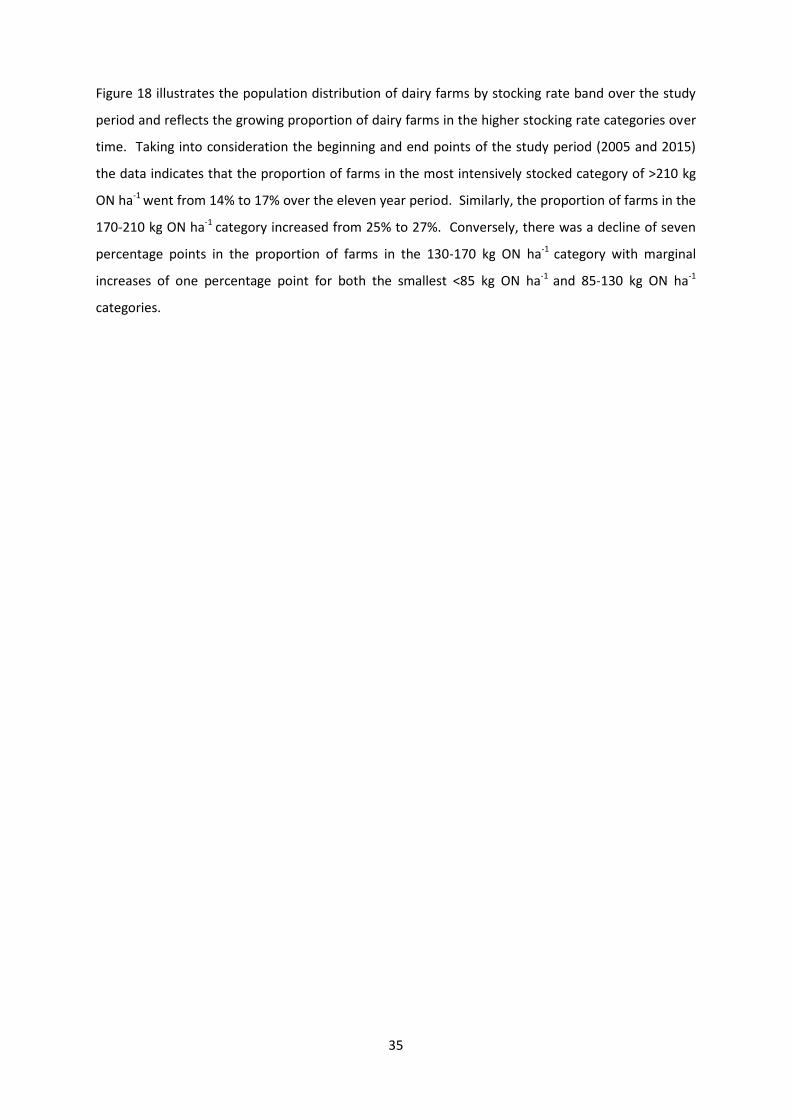
Figure 18 illustrates the population distribution of dairy farms by stocking rate band over the study
period and reflects the growing proportion of dairy farms in the higher stocking rate categories over
time. Taking into consideration the beginning and end points of the study period (2005 and 2015)
the data indicates that the proportion of farms in the most intensively stocked category of >210 kg
ON ha-1 went from 14% to 17% over the eleven year period. Similarly, the proportion of farms in the
170-210 kg ON ha-1 category increased from 25% to 27%. Conversely, there was a decline of seven
percentage points in the proportion of farms in the 130-170 kg ON ha-1 category with marginal
increases of one percentage point for both the smallest <85 kg ON ha-1 and 85-130 kg ON ha-1
categories.
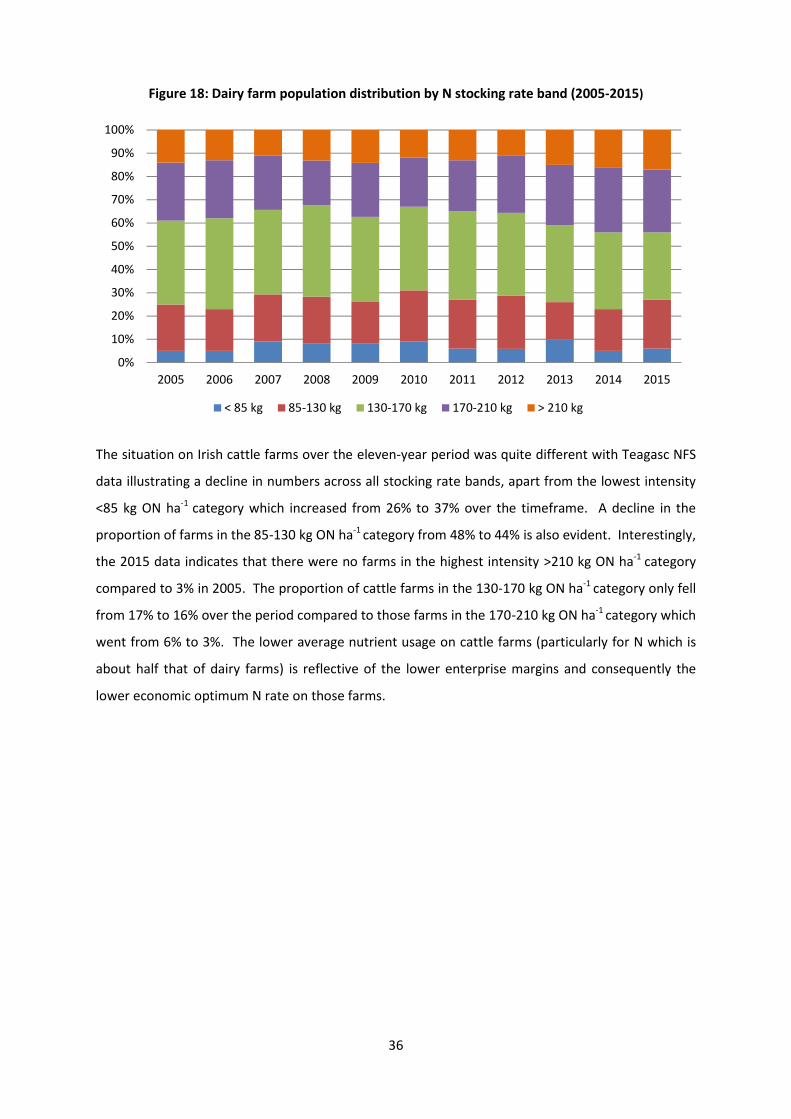
36
Figure 18: Dairy farm population distribution by N stocking rate band (2005-2015)
The situation on Irish cattle farms over the eleven-year period was quite different with Teagasc NFS
data illustrating a decline in numbers across all stocking rate bands, apart from the lowest intensity
<85 kg ON ha-1 category which increased from 26% to 37% over the timeframe. A decline in the
proportion of farms in the 85-130 kg ON ha-1 category from 48% to 44% is also evident. Interestingly,
the 2015 data indicates that there were no farms in the highest intensity >210 kg ON ha-1 category
compared to 3% in 2005. The proportion of cattle farms in the 130-170 kg ON ha-1 category only fell
from 17% to 16% over the period compared to those farms in the 170-210 kg ON ha-1 category which
went from 6% to 3%. The lower average nutrient usage on cattle farms (particularly for N which is
about half that of dairy farms) is reflective of the lower enterprise margins and consequently the
lower economic optimum N rate on those farms.
0%
10%
20%
30%
40%
50%
60%
70%
80%
90%
100%
2005 2006 2007 2008 2009 2010 2011 2012 2013 2014 2015
< 85 kg 85-130 kg 130-170 kg 170-210 kg > 210 kg
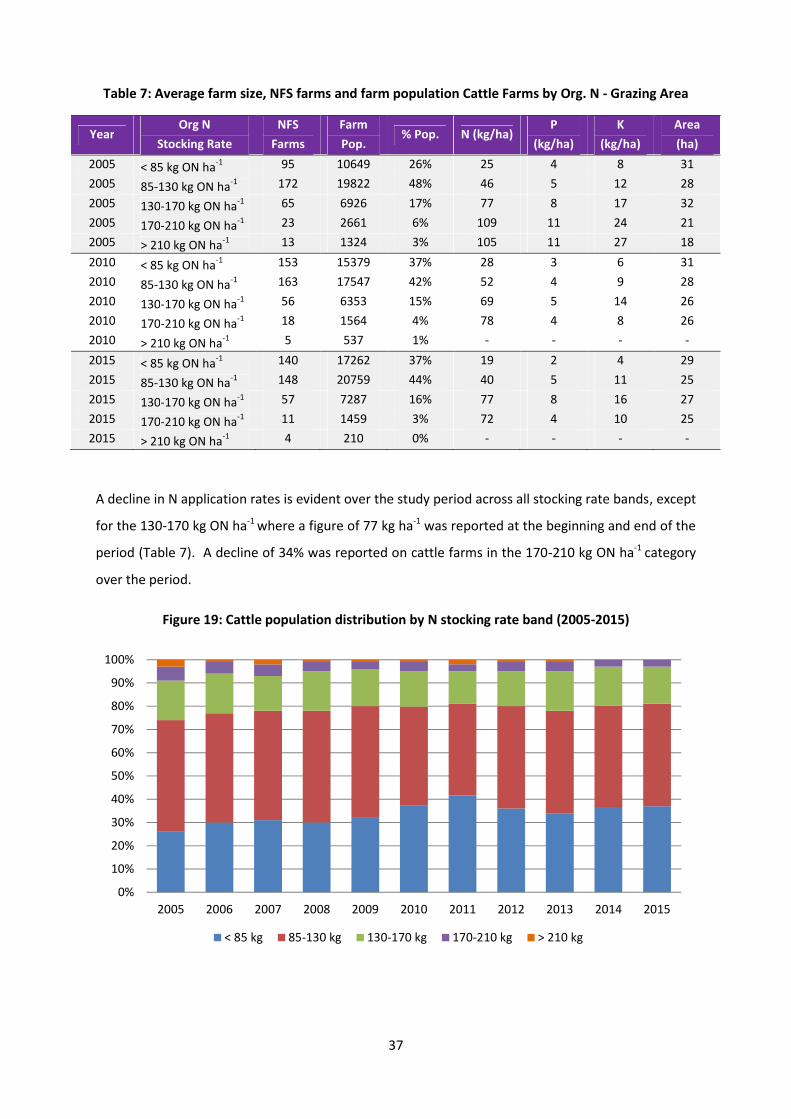
37
Table 7: Average farm size, NFS farms and farm population Cattle Farms by Org. N - Grazing Area
YearOrg N
Stocking Rate
NFS
Farms
Farm
Pop.% Pop. N (kg/ha)
P
(kg/ha)
K
(kg/ha)
Area
(ha)
2005 < 85 kg ON ha-1 95 10649 26% 25 4 8 31
2005 85-130 kg ON ha-1 172 19822 48% 46 5 12 28
2005 130-170 kg ON ha-1 65 6926 17% 77 8 17 32
2005 170-210 kg ON ha-1 23 2661 6% 109 11 24 21
2005 > 210 kg ON ha-1 13 1324 3% 105 11 27 18
2010 < 85 kg ON ha-1 153 15379 37% 28 3 6 31
2010 85-130 kg ON ha-1 163 17547 42% 52 4 9 28
2010 130-170 kg ON ha-1 56 6353 15% 69 5 14 26
2010 170-210 kg ON ha-1 18 1564 4% 78 4 8 26
2010 > 210 kg ON ha-1 5 537 1% - - - -
2015 < 85 kg ON ha-1 140 17262 37% 19 2 4 29
2015 85-130 kg ON ha-1 148 20759 44% 40 5 11 25
2015 130-170 kg ON ha-1 57 7287 16% 77 8 16 27
2015 170-210 kg ON ha-1 11 1459 3% 72 4 10 25
2015 > 210 kg ON ha-1 4 210 0% - - - -
A decline in N application rates is evident over the study period across all stocking rate bands, except
for the 130-170 kg ON ha-1 where a figure of 77 kg ha-1 was reported at the beginning and end of the
period (Table 7). A decline of 34% was reported on cattle farms in the 170-210 kg ON ha-1 category
over the period.
Figure 19: Cattle population distribution by N stocking rate band (2005-2015)
0%
10%
20%
30%
40%
50%
60%
70%
80%
90%
100%
2005 2006 2007 2008 2009 2010 2011 2012 2013 2014 2015
< 85 kg 85-130 kg 130-170 kg 170-210 kg > 210 kg

38
Average P application rates either declined or remained stable across cattle farms over the study
period, with most change evident on farms in the 170-210 kg ON ha-1 category, on which P usage
went from 11 kg ha-1 in 2005 to 4 kg ha-1 in 2015. A similar situation is apparent with regard to K
usage, with the largest decline (from 24 kg ha-1 to 10 kg ha-1) in the 170-210 kg ON ha-1 category also.
Teagasc NFS data on sheep farms also reflects a dramatic increase in the proportion of holdings in
the least intensive stocking rate category <85 kg ON ha-1 over the period, the figure going from 27%
in 2005 to 42% in 2015. Some variation in nutrient use is evident, with increased usage not
necessarily correlated with stocking rate intensity. N and P application rates generally declined over
the period across farms of all levels of intensity. Average K usage increased over the period for
those farms in the <85 kg ON ha-1 and 130-170 kg ON ha-1 categories, with a decline in usage
reported for farms in the 85-130 kg ON ha-1 category. Fertiliser usage on sheep farms >170 kg ON ha-
1 are not reported here due to the small number of farms in the sample (N<10). In contrast to the
increase in prevalence of sheep farms in the lowest intensity category <85 kg ON ha-1 over the
period, the proportion of farms in the 85-130 kg ON ha-1 fell from 43% to 37%.
Table 8: Average farm size, NFS farms and farm population Sheep Farms by Org. N - Grazing Area
YearOrg N
Stocking Rate
NFS
Farms
Farm
Pop.% Pop.
N
(kg/ha)
P
(kg/ha)
K
(kg/ha)
Area
(ha)
2005 < 85 kg ON ha-1 37 3042 27% 28 7 7 33
2005 85-130 kg ON ha-1 62 4771 43% 46 5 11 32
2005 130-170 kg ON ha-1 29 2354 21% 66 3 10 27
2005 170-210 kg ON ha-1 9 595 5% - - - -
2005 > 210 kg ON ha-1 7 351 3% - - - -
2010 < 85 kg ON ha-1 47 3973 36% 20 2 4 39
2010 85-130 kg ON ha-1 53 4895 44% 47 4 8 28
2010 130-170 kg ON ha-1 21 2083 19% 61 3 7 27
2010 170-210 kg ON ha-1 2 81 1% - - - -
2010 > 210 kg ON ha-1 2 81 1% - - - -
2015 < 85 kg ON ha-1 58 5722 42% 11 3 4 44
2015 85-130 kg ON ha-1 40 5032 37% 38 6 12 26
2015 130-170 kg ON ha-1 21 2313 17% 65 8 18 30
2015 170-210 kg ON ha-1 5 330 2% - - - -
2015 > 210 kg ON ha-1 2 144 1% - - - -

39
A decline (although smaller) in the proportion of farms in the 130-170 kg ON ha-1 category also
occurred, with the figure going from 21% in 2005 to 17% in 2015. Likewise, the proportion of higher
intensity sheep farms also declined by 3 percentage points and 2 percentage points respectively for
those in the 170-210 kg ON ha-1 and >210 kg ON ha-1 categories.
Figure 20: Sheep population distribution by N stocking rate band (2005-2015)
0%
10%
20%
30%
40%
50%
60%
70%
80%
90%
100%
2005 2006 2007 2008 2009 2010 2011 2012 2013 2014 2015
< 85 kg 85-130 kg 130-170 kg 170-210 kg > 210 kg
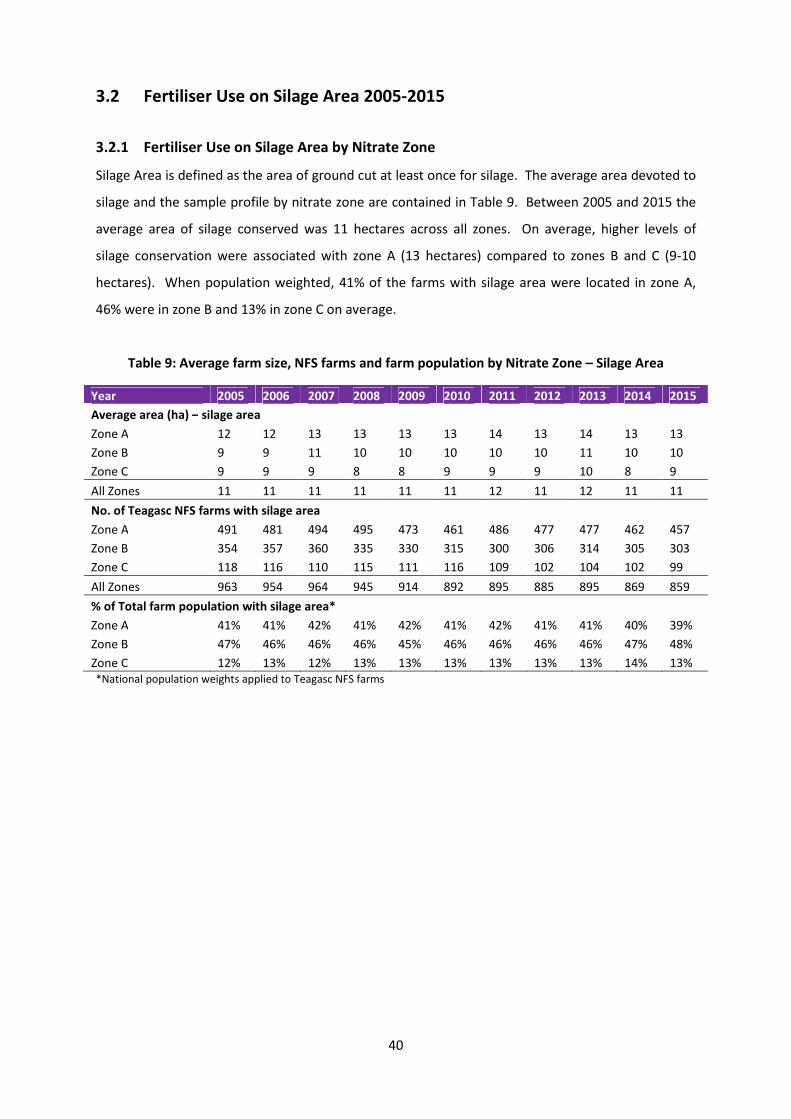
40
3.2 Fertiliser Use on Silage Area 2005-2015
3.2.1 Fertiliser Use on Silage Area by Nitrate Zone
Silage Area is defined as the area of ground cut at least once for silage. The average area devoted to
silage and the sample profile by nitrate zone are contained in Table 9. Between 2005 and 2015 the
average area of silage conserved was 11 hectares across all zones. On average, higher levels of
silage conservation were associated with zone A (13 hectares) compared to zones B and C (9-10
hectares). When population weighted, 41% of the farms with silage area were located in zone A,
46% were in zone B and 13% in zone C on average.
Table 9: Average farm size, NFS farms and farm population by Nitrate Zone – Silage Area
Year 2005 2006 2007 2008 2009 2010 2011 2012 2013 2014 2015
Average area (ha) – silage area
Zone A 12 12 13 13 13 13 14 13 14 13 13
Zone B 9 9 11 10 10 10 10 10 11 10 10
Zone C 9 9 9 8 8 9 9 9 10 8 9
All Zones 11 11 11 11 11 11 12 11 12 11 11
No. of Teagasc NFS farms with silage area
Zone A 491 481 494 495 473 461 486 477 477 462 457
Zone B 354 357 360 335 330 315 300 306 314 305 303
Zone C 118 116 110 115 111 116 109 102 104 102 99
All Zones 963 954 964 945 914 892 895 885 895 869 859
% of Total farm population with silage area*
Zone A 41% 41% 42% 41% 42% 41% 42% 41% 41% 40% 39%
Zone B 47% 46% 46% 46% 45% 46% 46% 46% 46% 47% 48%
Zone C 12% 13% 12% 13% 13% 13% 13% 13% 13% 14% 13%*National population weights applied to Teagasc NFS farms
41
Figure 21 illustrates N applied on silage area by nitrate zone. Results indicate that average N
application rates in zone A (112-138 kg ha-1) were 22% higher than in zone C (94-114 kg ha-1) and
33% higher than in zone B (83-107 kg ha-1) over the study period. Significant volatility in application
rates can be seen, with the lowest and highest application rates generally recorded in 2008 and 2013
across all zones and an overall decline across zones of 14% since 2013. By nitrate zone, a 5% decline
from 2005 to 2015 is reported for zone A and 10% for zone B with a marginal increase in N use (3%)
evident in zone C.

42
Figure 21: N use on Silage Area by Nitrate Zone
P applied to silage area (kg ha-1) by nitrate zone is detailed in Figure 22. Results indicate that P
application rates in zone A were on average 14 per cent higher (7-13 kg ha-1) compared to zone B (6-
11 kg ha-1) and 6% higher than in zone C (7-12 kg ha-1). The highest application rates were recorded
in 2005 (except for zone C) and the lowest application rates were reported in 2008/09 across all
zones. A dramatic decline in P usage is evident from 2006 to 2009, with recovery thereafter and
usage back to 2005 levels in 2015 for zone B, a modest increase in zone C and a small decrease in
zone A.
Figure 22: P use on Silage Area by Nitrate Zone
2005 2006 2007 2008 2009 2010 2011 2012 2013 2014 2015
Zone A 128 125 120 112 125 132 122 114 138 129 121
Zone B 96 105 83 79 93 107 93 86 104 92 86
Zone C 99 100 94 95 101 103 95 104 109 114 102
All Zones 111 114 101 96 109 118 107 102 121 111 104
50
70
90
110
130
150
Nitrogen(kg/ha)
2005 2006 2007 2008 2009 2010 2011 2012 2013 2014 2015
Zone A 13 13 10 8 7 9 8 9 11 12 11
Zone B 11 10 8 6 7 8 8 8 11 10 10
Zone C 10 10 9 7 8 10 7 9 12 12 11
All Zones 12 11 9 7 7 9 8 9 11 11 11
4
6
8
10
12
14
Phosphorus(kg/ha)

43
K use on silage area (kg ha-1) across nitrate zones is illustrated in Figure 23. Results indicate that
average K application rates in zone A (21-39 kg ha-1) were 12 per cent higher than in zone B (20-35 kg
ha-1) and 16 per cent higher than in zone C (19-30 kg ha-1) over the study period. Average K
application rates were 20-46 per cent lower during the middle of the period (2008-2011) and 8-15
per cent lower at the end (2013-2015) compared to the start for all zones, except for zone C which
had similar application rates at the start and end of the study period.
Figure 23: K use on Silage Area by Nitrate Zone
2005 2006 2007 2008 2009 2010 2011 2012 2013 2014 2015
Zone A 39 36 31 26 21 27 25 26 33 36 35
Zone B 35 32 27 20 20 24 24 25 31 31 30
Zone C 30 30 28 22 20 24 19 25 31 31 30
All Zones 37 33 29 23 21 25 24 25 32 33 33
15
20
25
30
35
40
Potassium(kg/ha)
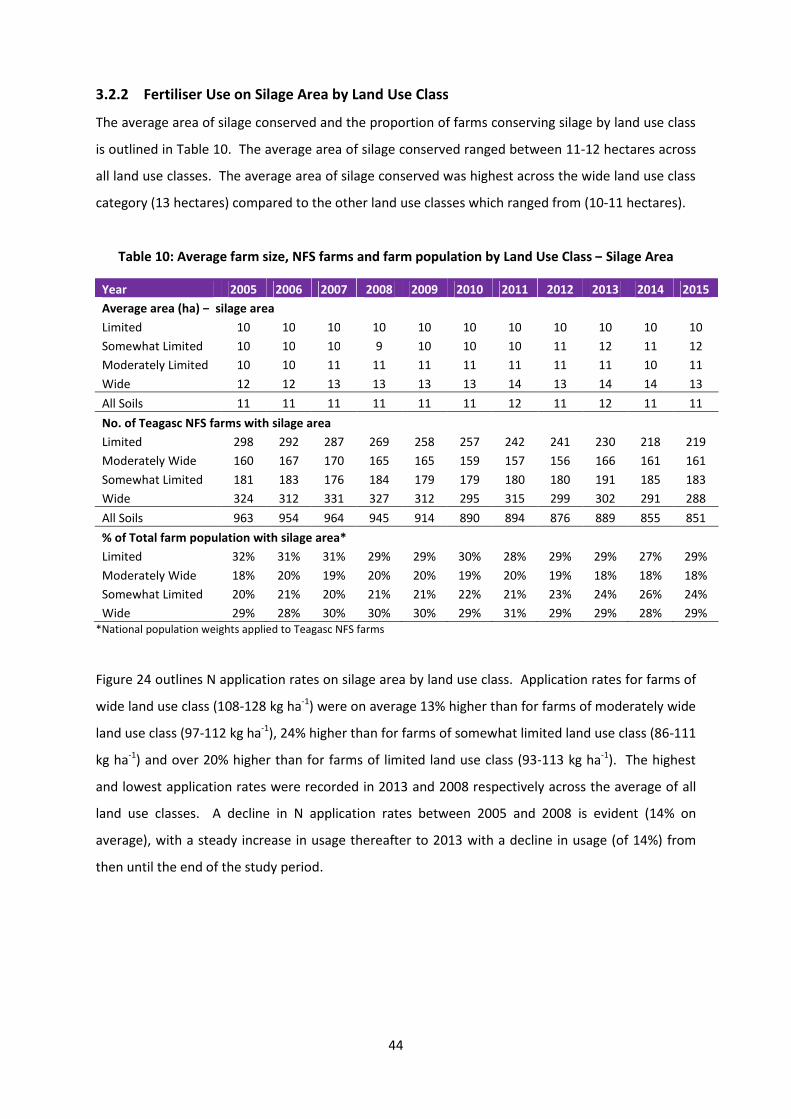
44
3.2.2 Fertiliser Use on Silage Area by Land Use Class
The average area of silage conserved and the proportion of farms conserving silage by land use class
is outlined in Table 10. The average area of silage conserved ranged between 11-12 hectares across
all land use classes. The average area of silage conserved was highest across the wide land use class
category (13 hectares) compared to the other land use classes which ranged from (10-11 hectares).
Table 10: Average farm size, NFS farms and farm population by Land Use Class – Silage Area
Year 2005 2006 2007 2008 2009 2010 2011 2012 2013 2014 2015
Average area (ha) – silage area
Limited 10 10 10 10 10 10 10 10 10 10 10
Somewhat Limited 10 10 10 9 10 10 10 11 12 11 12
Moderately Limited 10 10 11 11 11 11 11 11 11 10 11
Wide 12 12 13 13 13 13 14 13 14 14 13
All Soils 11 11 11 11 11 11 12 11 12 11 11
No. of Teagasc NFS farms with silage area
Limited 298 292 287 269 258 257 242 241 230 218 219
Moderately Wide 160 167 170 165 165 159 157 156 166 161 161
Somewhat Limited 181 183 176 184 179 179 180 180 191 185 183
Wide 324 312 331 327 312 295 315 299 302 291 288
All Soils 963 954 964 945 914 890 894 876 889 855 851
% of Total farm population with silage area*
Limited 32% 31% 31% 29% 29% 30% 28% 29% 29% 27% 29%
Moderately Wide 18% 20% 19% 20% 20% 19% 20% 19% 18% 18% 18%
Somewhat Limited 20% 21% 20% 21% 21% 22% 21% 23% 24% 26% 24%
Wide 29% 28% 30% 30% 30% 29% 31% 29% 29% 28% 29%*National population weights applied to Teagasc NFS farms
Figure 24 outlines N application rates on silage area by land use class. Application rates for farms of
wide land use class (108-128 kg ha-1) were on average 13% higher than for farms of moderately wide
land use class (97-112 kg ha-1), 24% higher than for farms of somewhat limited land use class (86-111
kg ha-1) and over 20% higher than for farms of limited land use class (93-113 kg ha-1). The highest
and lowest application rates were recorded in 2013 and 2008 respectively across the average of all
land use classes. A decline in N application rates between 2005 and 2008 is evident (14% on
average), with a steady increase in usage thereafter to 2013 with a decline in usage (of 14%) from
then until the end of the study period.

45
Figure 24: N use on Silage Area by Land Use Class
Average P application rates on silage area by land use class are reported in Figure 25. Results
indicate that P usage was highest on soils of limited land use potential, ranging from 9-12 kg ha-1
over the study period. This was on average 9% higher than for those of wide land use class, 14%
higher than for farms of somewhat limited land use class and 16% higher than for farms of limited
land use.
Figure 25: P on Silage Area by Land Use Class
2005 2006 2007 2008 2009 2010 2011 2012 2013 2014 2015
Limited 103 113 95 93 102 110 98 96 108 107 100
Somewhat Limited 103 96 87 86 98 105 102 93 111 108 99
Moderately Wide 110 112 105 97 108 116 110 103 126 107 97
Wide 128 128 118 108 123 133 119 113 135 124 119
All Soils 111 114 101 96 109 118 107 102 121 111 104
50
70
90
110
130
150
Nitrogen(kg/ha)
2005 2006 2007 2008 2009 2010 2011 2012 2013 2014 2015
Limited 12 12 11 9 8 10 9 10 12 12 11
Somewhat Limited 12 10 9 7 7 9 8 8 10 12 10
Moderately Wide 12 10 9 6 7 9 9 9 12 12 11
Wide 12 12 9 7 7 7 7 7 10 11 11
All Soils 12 11 9 7 7 9 8 9 11 11 11
4
6
8
10
12
14
Phosphorus(kg/ha)

46
Application rates were broadly similar at the start and end of the study period across all land use
classes, but declined significantly in the middle of the study period, between 25-42% between 2007
and 2012 on average. P use on silage area increased by almost 40% on average across all land use
classes since 2011 in line with Teagasc advice, with the largest impact evident on soils of wide use
class where the increase was almost 60%.
Figure 26 reports average K application rates over time on silage area by land use class. Again K
usage was highest on land of limited use potential over the study period, ranging from 22-37 kg ha-1.
This was 8% higher on average than on farms of somewhat limited land use, 6% higher than for
farms of wide land use potential and 5% higher than for farms of moderate land use potential.
Application rates were at their highest in 2005 for all land use classes, but declined significantly in
the middle of the study period, between 32-43% over the years 2008-2012 on average. The increase
in usage was largest on limited and somewhat limited soils. However, application rates across all
land use classes were on average still 11% lower in 2015 than at the start of the study period.
Figure 26: K use on Silage Area by Land Use Class
2005 2006 2007 2008 2009 2010 2011 2012 2013 2014 2015
Limited 37 35 30 27 22 30 27 28 32 33 31
Somewhat Limited 36 32 28 22 20 26 24 23 32 32 31
Moderately Wide 35 29 29 21 20 24 24 28 36 36 34
Wide 39 36 30 24 20 23 22 23 30 33 34
All Soils 37 33 29 23 21 25 24 25 32 33 33
15
20
25
30
35
40
Potassium(kg/ha)
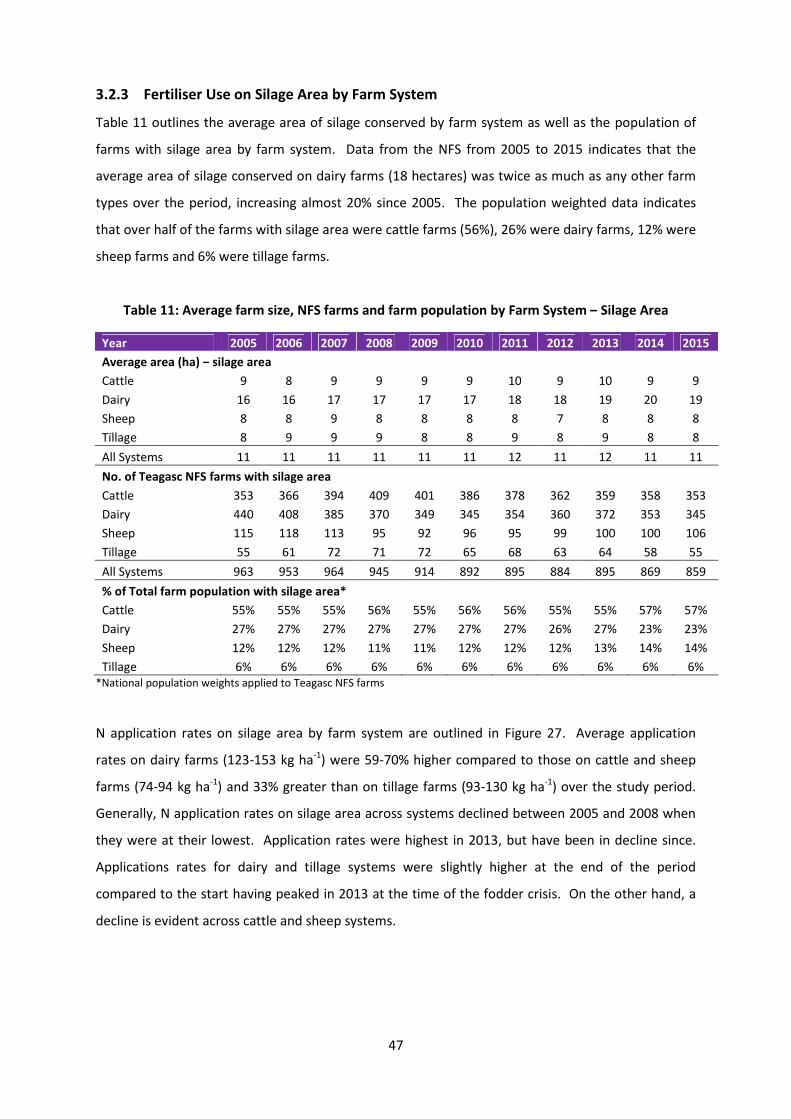
47
3.2.3 Fertiliser Use on Silage Area by Farm System
Table 11 outlines the average area of silage conserved by farm system as well as the population of
farms with silage area by farm system. Data from the NFS from 2005 to 2015 indicates that the
average area of silage conserved on dairy farms (18 hectares) was twice as much as any other farm
types over the period, increasing almost 20% since 2005. The population weighted data indicates
that over half of the farms with silage area were cattle farms (56%), 26% were dairy farms, 12% were
sheep farms and 6% were tillage farms.
Table 11: Average farm size, NFS farms and farm population by Farm System – Silage Area
Year 2005 2006 2007 2008 2009 2010 2011 2012 2013 2014 2015
Average area (ha) – silage area
Cattle 9 8 9 9 9 9 10 9 10 9 9
Dairy 16 16 17 17 17 17 18 18 19 20 19
Sheep 8 8 9 8 8 8 8 7 8 8 8
Tillage 8 9 9 9 8 8 9 8 9 8 8
All Systems 11 11 11 11 11 11 12 11 12 11 11
No. of Teagasc NFS farms with silage area
Cattle 353 366 394 409 401 386 378 362 359 358 353
Dairy 440 408 385 370 349 345 354 360 372 353 345
Sheep 115 118 113 95 92 96 95 99 100 100 106
Tillage 55 61 72 71 72 65 68 63 64 58 55
All Systems 963 953 964 945 914 892 895 884 895 869 859
% of Total farm population with silage area*
Cattle 55% 55% 55% 56% 55% 56% 56% 55% 55% 57% 57%
Dairy 27% 27% 27% 27% 27% 27% 27% 26% 27% 23% 23%
Sheep 12% 12% 12% 11% 11% 12% 12% 12% 13% 14% 14%
Tillage 6% 6% 6% 6% 6% 6% 6% 6% 6% 6% 6%*National population weights applied to Teagasc NFS farms
N application rates on silage area by farm system are outlined in Figure 27. Average application
rates on dairy farms (123-153 kg ha-1) were 59-70% higher compared to those on cattle and sheep
farms (74-94 kg ha-1) and 33% greater than on tillage farms (93-130 kg ha-1) over the study period.
Generally, N application rates on silage area across systems declined between 2005 and 2008 when
they were at their lowest. Application rates were highest in 2013, but have been in decline since.
Applications rates for dairy and tillage systems were slightly higher at the end of the period
compared to the start having peaked in 2013 at the time of the fodder crisis. On the other hand, a
decline is evident across cattle and sheep systems.
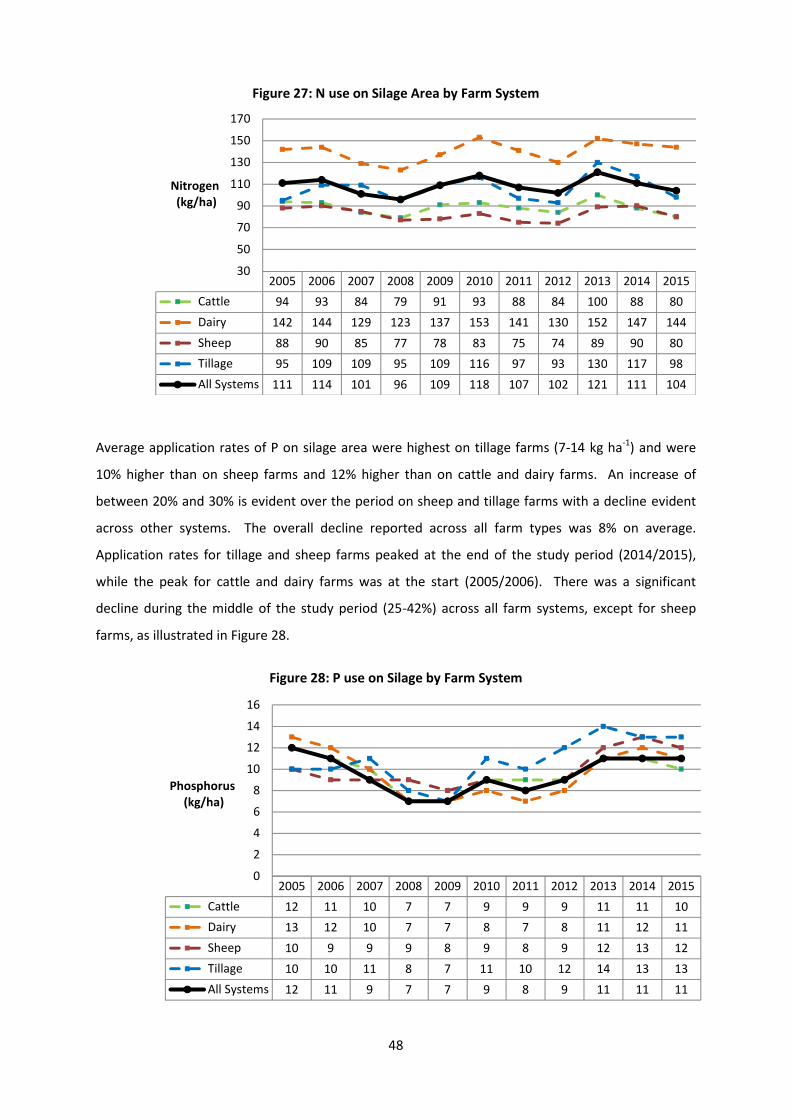
48
Figure 27: N use on Silage Area by Farm System
Average application rates of P on silage area were highest on tillage farms (7-14 kg ha-1) and were
10% higher than on sheep farms and 12% higher than on cattle and dairy farms. An increase of
between 20% and 30% is evident over the period on sheep and tillage farms with a decline evident
across other systems. The overall decline reported across all farm types was 8% on average.
Application rates for tillage and sheep farms peaked at the end of the study period (2014/2015),
while the peak for cattle and dairy farms was at the start (2005/2006). There was a significant
decline during the middle of the study period (25-42%) across all farm systems, except for sheep
farms, as illustrated in Figure 28.
Figure 28: P use on Silage by Farm System
2005 2006 2007 2008 2009 2010 2011 2012 2013 2014 2015
Cattle 94 93 84 79 91 93 88 84 100 88 80
Dairy 142 144 129 123 137 153 141 130 152 147 144
Sheep 88 90 85 77 78 83 75 74 89 90 80
Tillage 95 109 109 95 109 116 97 93 130 117 98
All Systems 111 114 101 96 109 118 107 102 121 111 104
30
50
70
90
110
130
150
170
Nitrogen(kg/ha)
2005 2006 2007 2008 2009 2010 2011 2012 2013 2014 2015
Cattle 12 11 10 7 7 9 9 9 11 11 10
Dairy 13 12 10 7 7 8 7 8 11 12 11
Sheep 10 9 9 9 8 9 8 9 12 13 12
Tillage 10 10 11 8 7 11 10 12 14 13 13
All Systems 12 11 9 7 7 9 8 9 11 11 11
0
2
4
6
8
10
12
14
16
Phosphorus(kg/ha)

49
Figure 29 reports average K application rates on silage area by farm system. Results indicate that K
usage was again highest on tillage farms (22-42 kg ha-1) on average, 9% higher than on dairy farms,
21% higher than on cattle farms and 26% higher than on sheep farms over the study period.
Application rates for tillage and sheep farms peaked at the end of the study period (2014/2015)
whereas the highest usage on cattle and dairy farms was reported at the outset (2005/2006). There
was a significant decline during the middle of the study period (32-43% on average) across the
majority of farm systems except tillage. K application rates for silage increased 56% on tillage farms
from 2005 to 2015, with a general decline across other farm types, except for sheep farms where
there was a marginal increase of 3%. Overall, the data reports a 48% decline across all systems from
2005 to 2008 with a 57% recovery from 2009 to 2015.
Figure 29: K use on Silage Area by Farm System
2005 2006 2007 2008 2009 2010 2011 2012 2013 2014 2015
Cattle 34 32 30 21 21 26 24 25 31 29 30
Dairy 43 37 30 26 20 25 24 24 33 38 36
Sheep 30 26 25 25 20 22 23 25 33 32 31
Tillage 27 35 33 29 22 33 29 37 40 40 42
All Systems 37 33 29 23 21 25 24 25 32 33 33
0
5
10
15
20
25
30
35
40
45
50
Potassium(kg/ha)

50
3.2.4 Fertiliser Use on Silage Area by Organic N stocking Rate
The variation in silage area by organic N stocking rate is evident from Table 12. Data from the
Teagasc NFS from 2005 to 2015 indicates that silage area tends to be smaller on less intensive
holdings, as is to be expected. The average area for those farms in the <85 kg ON ha-1 ranged from 7
to 8 hectares over the period, with the corresponding figure on farms in the 85-130 kg ON ha-1
ranging from 9 to 11 hectares and 13 to 14 hectares for farms in the 130-170 kg ON ha-1 category.
More intensively stocked farms (>170kg ON ha-1) reported silage area of between 14 and 20
hectares on average over the study period.
Table 12: Average farm size, NFS farms and farm population All Farms by Organic N - Silage Area
Year 2005 2006 2007 2008 2009 2010 2011 2012 2013 2014 2015
Average Area (ha) – silage area
< 85 kg ON ha-1
7 7 8 7 7 8 8 8 8 7 8
85-130 kg ON ha-1
9 9 10 10 10 10 11 10 10 10 10
130-170 kg ON ha-1
13 13 14 13 13 13 14 14 14 14 14
170-210 kg ON ha-1
15 14 16 17 19 17 18 18 19 20 19
> 210 kg ON ha-1
14 17 16 17 18 19 19 17 19 19 18
All Rates 11 11 11 11 11 11 12 11 12 11 11
No. of Teagasc NFS Farms – farms with silage area
Year 2005 2006 2007 2008 2009 2010 2011 2012 2013 2014 2015
< 85 kg ON ha-1
140 168 193 186 200 216 239 208 197 202 203
85-130 kg ON ha-1
309 308 333 334 322 300 277 280 280 269 260
130-170 kg ON ha-1
268 274 252 263 224 214 217 225 218 208 199
170-210 kg ON ha-1
159 135 129 101 111 105 103 120 129 125 124
> 210 kg ON ha-1
87 69 58 62 57 57 59 52 71 65 73
All Rates 963 954 965 946 914 892 895 885 895 869 859
% of Population
Year 2005 2006 2007 2008 2009 2010 2011 2012 2013 2014 2015
< 85 kg ON ha-1
19% 22% 24% 23% 25% 28% 32% 27% 27% 28% 29%
85-130 kg ON ha-1
39% 38% 40% 40% 40% 38% 35% 38% 37% 37% 38%
130-170 kg ON ha-1
24% 24% 22% 25% 22% 22% 21% 22% 22% 22% 19%
170-210 kg ON ha-1
12% 12% 10% 8% 8% 8% 8% 9% 9% 9% 9%
> 210 kg ON ha-1
7% 5% 4% 4% 4% 4% 4% 4% 5% 4% 5%
All Rates 101% 101% 100% 100% 99% 100% 100% 100% 100% 100% 100%*National population weights applied to Teagasc NFS farms
The data indicates that the proportion of farms with silage area in the lowest stocking rate band <85
kg ON ha-1 increased by ten percentage points from 19% to 29% over the period. At the other end of
the scale, there was a marginal decrease (two percentage points) in the proportion of farms in the
most intensive category >210 kg ON ha-1. The proportion in the 85-130 kg ON ha-1 category
remained unchanged at 39%, whereas a decline of five and three percentage points respectively is
evident in the remaining categories 130-170 kg ON ha-1 and 170-210 kg ON ha-1.

51
Figure 30 illustrates a decline in average N usage for silage production over the study period on less
intensive farms, with a 23% decline on those farms in the <85 kg ON ha-1 category where average N
application rates ranged from 61-82 kg ha-1. Similarly a 13% decline is reported on those farms in
the 85-130 kg ON ha-1 category with N application rates ranging from 84-107 kg ha-1 on average. For
those farms >130 kg ON ha-1 N use increased between 3 and 8% over the period. A correlation
between levels of intensity and increased N usage can be seen from Figure 30 which indicates that
average N application rates were more than twice as high on the most intensive farms (139-173 kg
ha-1) compared to the least intensive farms and more than one and a half times higher than on those
farms in the 85-130 kg ON ha-1 category. Average N application rates ranged from 108 to 138 kg ha-1
on those farms in the 130-170 kg ON ha-1 category and 122 to 152 kg ha-1 on those in the 170-210 kg
ON ha-1 category over the time period.
Figure 30: N use on Silage Area by Organic N stocking rate – All farms
There is less variation in P usage across stocking rate bands over the period according to Figure 31,
which indicates that average application rates ranged from 7-11 kg ha-1 on farms <85 kg ON ha-1, 7-
12 kg ha-1 on farms of 85-130 kg ON ha-1 and 7-13 kg ha-1 on farms of 130-170 kg ON ha-1. Unlike
with N usage, there is no clear correlation between farm intensity and P usage with average
application rates only marginally higher on those farms in the 170-210 kg ON ha-1 and >210 kg ON ha-
2005 2006 2007 2008 2009 2010 2011 2012 2013 2014 2015
< 85 79 81 74 68 76 82 74 69 80 73 61
85-130 97 94 91 84 95 104 96 91 107 99 84
130-170 119 133 112 108 124 134 126 111 138 126 127
170-210 141 141 132 122 145 152 140 140 151 148 145
> 210 150 139 144 145 141 164 165 147 173 157 162
All Rates 111 114 101 96 109 118 107 102 121 111 104
30
50
70
90
110
130
150
170
190
Nitrogen(kg/ha)

52
1 categories, with average application rates ranging from 6 to 14 kg ha-1 and 5 to 14 kg ha-1
respectively. A general decline in P usage, ranging from 8% to 28%, is evident over the period across
farms of all levels of intensity, except from those in the 130-170 kg ON ha-1 category, where average
P application rates increased by 8% over the period 2005-2015.
Figure 31: P use on Silage Area by Organic N stocking rate – All farms
A decline in average K usage across stocking rate bands over the study period can be seen from
Figure 32, with the largest reduction (23%) evident on the least intensive farms <85 kg ON ha-1.
Despite a general reduction in K application rates over the period, recovery towards starting levels
can be seen across some farm categories e.g. 130-170 kg ON ha-1. There was much variation in
application rates across stocking rate bands over the period, particularly on farms in the >210 kg ON
ha-1 where K application rates ranged from 19 to 43 kg ha-1 on average and farms in the 170-210 kg
ON ha-1 category where rates ranged from 18 to 41 kg ha-1. Average K application rates ranged from
19 to 30 kg ha-1 on farms <85 kg ON ha-1, 22 to 34 kg ha-1 on farms in the 85-130 kg ON ha-1 category
and 22 to 38 kg ha-1 on farms of 130-170 kg ON ha-1. On average K usage was marginally higher over
the period on those farms in the latter category, with the differential largest (1.3 times higher) on
those farms compared to those in the <85 kg ON ha-1 category.
2005 2006 2007 2008 2009 2010 2011 2012 2013 2014 2015
< 85 11 11 9 7 7 8 9 8 10 10 8
85-130 12 11 10 7 8 10 9 9 12 11 11
130-170 12 12 10 7 8 8 9 8 11 12 13
170-210 14 12 9 7 6 8 6 8 10 13 11
> 210 14 11 9 7 5 8 6 9 12 11 13
All Rates 12 11 9 7 7 9 8 9 11 11 11
0
2
4
6
8
10
12
14
16
Phosphorus(kg/ha)

53
Figure 32: K use on Silage Area by Organic N stocking rate – All farms
2005 2006 2007 2008 2009 2010 2011 2012 2013 2014 2015
< 85 30 29 24 21 19 23 23 21 26 25 23
85-130 34 32 30 22 22 28 26 27 34 32 32
130-170 38 35 31 24 22 26 26 25 33 36 37
170-210 41 38 31 27 18 27 18 27 32 40 35
> 210 43 34 28 29 14 19 20 24 35 36 41
All Rates 37 33 29 23 21 25 24 25 32 33 33
0
5
10
15
20
25
30
35
40
45
50
Potassium(kg/ha)
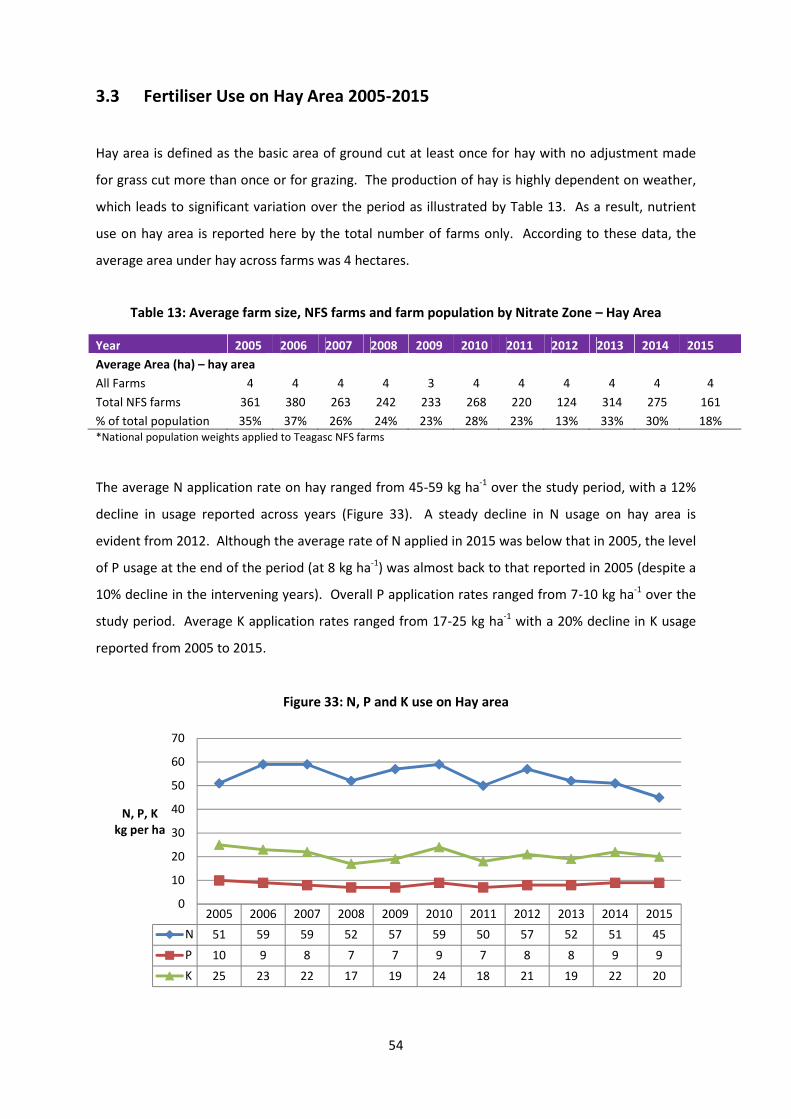
54
3.3 Fertiliser Use on Hay Area 2005-2015
Hay area is defined as the basic area of ground cut at least once for hay with no adjustment made
for grass cut more than once or for grazing. The production of hay is highly dependent on weather,
which leads to significant variation over the period as illustrated by Table 13. As a result, nutrient
use on hay area is reported here by the total number of farms only. According to these data, the
average area under hay across farms was 4 hectares.
Table 13: Average farm size, NFS farms and farm population by Nitrate Zone – Hay Area
Year 2005 2006 2007 2008 2009 2010 2011 2012 2013 2014 2015
Average Area (ha) – hay area
All Farms 4 4 4 4 3 4 4 4 4 4 4
Total NFS farms 361 380 263 242 233 268 220 124 314 275 161
% of total population 35% 37% 26% 24% 23% 28% 23% 13% 33% 30% 18%*National population weights applied to Teagasc NFS farms
The average N application rate on hay ranged from 45-59 kg ha-1 over the study period, with a 12%
decline in usage reported across years (Figure 33). A steady decline in N usage on hay area is
evident from 2012. Although the average rate of N applied in 2015 was below that in 2005, the level
of P usage at the end of the period (at 8 kg ha-1) was almost back to that reported in 2005 (despite a
10% decline in the intervening years). Overall P application rates ranged from 7-10 kg ha-1 over the
study period. Average K application rates ranged from 17-25 kg ha-1 with a 20% decline in K usage
reported from 2005 to 2015.
Figure 33: N, P and K use on Hay area
2005 2006 2007 2008 2009 2010 2011 2012 2013 2014 2015
N 51 59 59 52 57 59 50 57 52 51 45
P 10 9 8 7 7 9 7 8 8 9 9
K 25 23 22 17 19 24 18 21 19 22 20
0
10
20
30
40
50
60
70
N, P, Kkg per ha

55
3.4 Fertiliser Use on Total Grassland Area 2005-2015
3.4.1 Fertiliser Use on Total Grassland Area by Nitrate Zone
Grassland is defined as the total area of pasture on the holding. This includes land dedicated to
grazing, silage and hay but excludes area under arable crops and rough grazing (defined as ground
that cannot be fertilised). Data from the NFS on the average grassland area across zones and the
population represented from 2005 to 2015 are contained in Table 14. The average area dedicated to
grassland across the three zones over the period was 38 hectares. The average area under grassland
tended to be largest in zone A (41 hectares) and smallest in zone C (32 hectares) which is reflective
of the geographical location of these farms. When population weighted, 41% of the farms with
grazing area were in zone A, with 46% in zone B and only 12% in the smaller zone C on average. It
should be noted as outlined in section 1.3 that average areas reported for grazing and silage will not
tally with that for total grassland as some silage area is grazed and this proportional area is added to
the total grazing area, while silage area is deemed to remain unchanged.
Table 14: Average farm size, NFS farms and farm population by Nitrate Zone – Grassland Area
Year 2005 2006 2007 2008 2009 2010 2011 2012 2013 2014 2015
Average Area (ha) – grassland area
Zone A 41 41 41 40 41 41 42 42 42 41 40
Zone B 35 35 36 36 36 36 36 37 38 36 36
Zone C 32 32 32 31 32 32 33 36 34 31 31
All Zones 37 37 38 37 38 38 38 39 40 37 37
No. of Teagasc NFS farms with grassland area
Zone A 524 514 525 532 505 493 516 503 502 477 477
Zone B 384 387 384 365 358 341 325 323 333 326 321
Zone C 121 119 113 117 111 118 112 103 104 105 103
All Zones 1029 1020 1022 1014 974 952 953 929 939 908 901
% of Total farm population with grassland area*
Zone A 41% 41% 42% 42% 42% 42% 42% 42% 42% 40% 40%
Zone B 46% 46% 46% 46% 46% 46% 46% 46% 46% 47% 47%
Zone C 12% 12% 12% 12% 12% 12% 12% 12% 12% 13% 13%*National population weights applied to Teagasc NFS farms
Figure 34 illustrates N applied on total grassland area (kg ha-1) by nitrate zone. Average N
application rates ranged between 76-100 kg ha-1 across all zones over the period. Application rates
were typically 54-60% higher in zone A (94-124 kg ha-1) compared to zone B (59-82 kg ha-1) and zone
C (64-81 kg ha-1) on average. Post 2005/2006, application rates declined in general and were 23%
lower in 2008 compared to starting period levels. Applications rates recovered to near starting
period levels in 2013, before declining again towards the end of the study period. Overall, a 16%
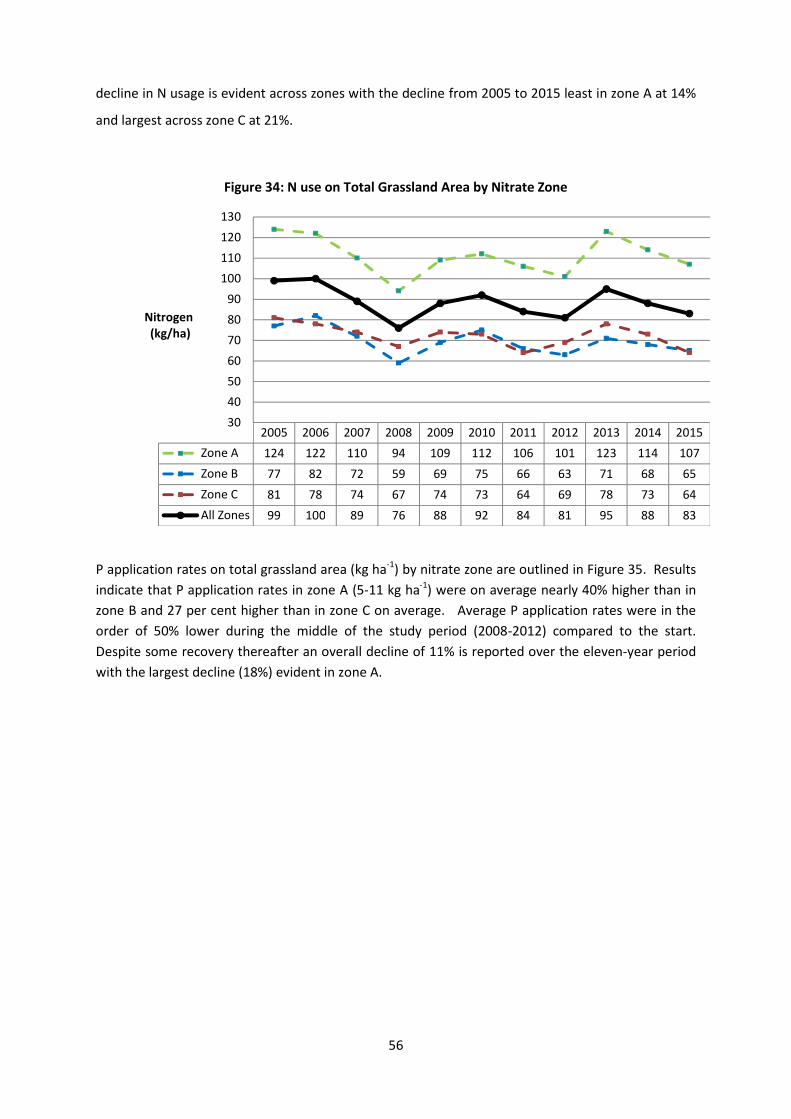
56
decline in N usage is evident across zones with the decline from 2005 to 2015 least in zone A at 14%
and largest across zone C at 21%.
Figure 34: N use on Total Grassland Area by Nitrate Zone
P application rates on total grassland area (kg ha-1) by nitrate zone are outlined in Figure 35. Results
indicate that P application rates in zone A (5-11 kg ha-1) were on average nearly 40% higher than in
zone B and 27 per cent higher than in zone C on average. Average P application rates were in the
order of 50% lower during the middle of the study period (2008-2012) compared to the start.
Despite some recovery thereafter an overall decline of 11% is reported over the eleven-year period
with the largest decline (18%) evident in zone A.
2005 2006 2007 2008 2009 2010 2011 2012 2013 2014 2015
Zone A 124 122 110 94 109 112 106 101 123 114 107
Zone B 77 82 72 59 69 75 66 63 71 68 65
Zone C 81 78 74 67 74 73 64 69 78 73 64
All Zones 99 100 89 76 88 92 84 81 95 88 83
30
40
50
60
70
80
90
100
110
120
130
Nitrogen(kg/ha)

57
Figure 35: P use on Total Grassland Area by Nitrate Zone
K usage on average ranged from 11-23 kg ha-1 across zones over the reporting period. Application
rates were in the order of 40% higher in zone A (13-26 kg ha-1) compared to zones B and C. Average
application rates declined by between 39-52% from the start of the study period to the middle
(2008-2012) before recovering towards the end (with the exception of zone B) where usage was 29%
lower in 2015 than in 2005.
Figure 36: K use on Total Grassland Area by Nitrate Zone
2005 2006 2007 2008 2009 2010 2011 2012 2013 2014 2015
Zone A 11 11 8 5 5 6 6 6 8 10 9
Zone B 8 7 6 4 4 5 4 5 6 6 6
Zone C 8 7 6 4 5 6 5 5 7 7 7
All Zones 9 9 7 4 4 6 5 5 7 8 8
0
2
4
6
8
10
12
Phosphorus(kg/ha)
2005 2006 2007 2008 2009 2010 2011 2012 2013 2014 2015
Zone A 26 25 21 16 13 17 16 17 22 25 25
Zone B 21 19 17 11 10 13 12 12 16 16 15
Zone C 19 17 15 11 10 13 10 12 17 17 17
All Zones 23 21 19 13 11 15 14 14 19 20 20
0
5
10
15
20
25
30
Potassium(kg/ha)
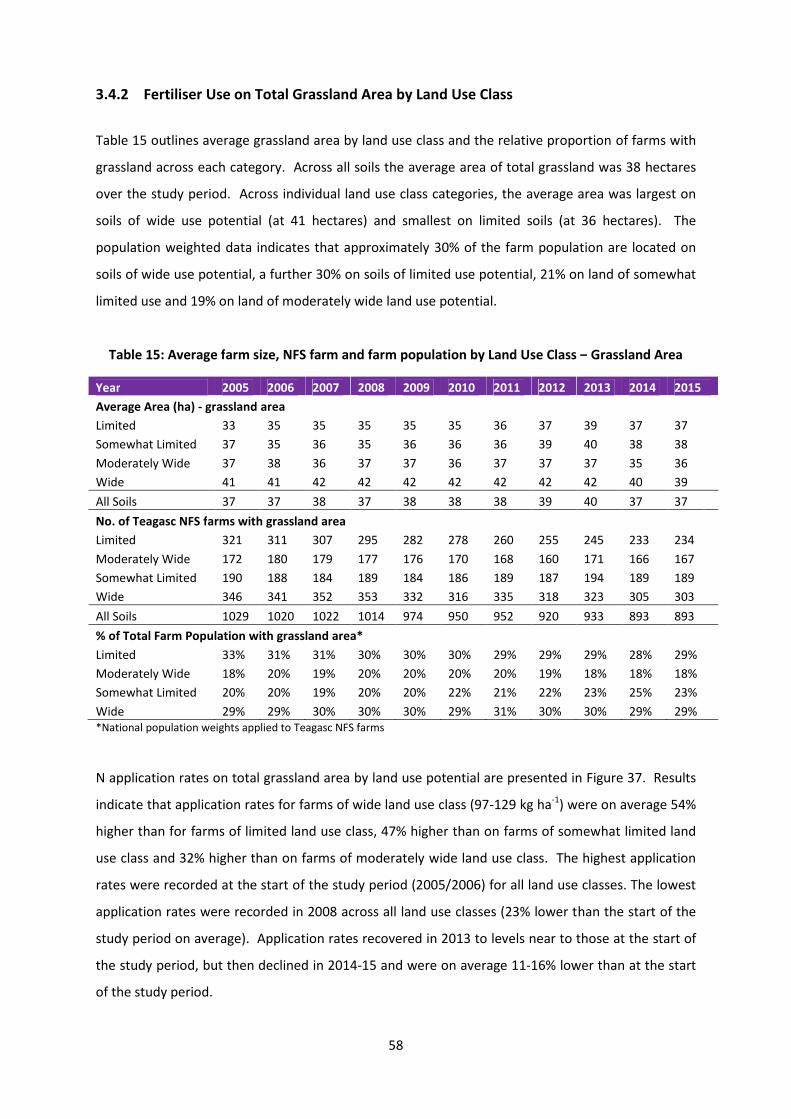
58
3.4.2 Fertiliser Use on Total Grassland Area by Land Use Class
Table 15 outlines average grassland area by land use class and the relative proportion of farms with
grassland across each category. Across all soils the average area of total grassland was 38 hectares
over the study period. Across individual land use class categories, the average area was largest on
soils of wide use potential (at 41 hectares) and smallest on limited soils (at 36 hectares). The
population weighted data indicates that approximately 30% of the farm population are located on
soils of wide use potential, a further 30% on soils of limited use potential, 21% on land of somewhat
limited use and 19% on land of moderately wide land use potential.
Table 15: Average farm size, NFS farm and farm population by Land Use Class – Grassland Area
Year 2005 2006 2007 2008 2009 2010 2011 2012 2013 2014 2015
Average Area (ha) - grassland area
Limited 33 35 35 35 35 35 36 37 39 37 37
Somewhat Limited 37 35 36 35 36 36 36 39 40 38 38
Moderately Wide 37 38 36 37 37 36 37 37 37 35 36
Wide 41 41 42 42 42 42 42 42 42 40 39
All Soils 37 37 38 37 38 38 38 39 40 37 37
No. of Teagasc NFS farms with grassland area
Limited 321 311 307 295 282 278 260 255 245 233 234
Moderately Wide 172 180 179 177 176 170 168 160 171 166 167
Somewhat Limited 190 188 184 189 184 186 189 187 194 189 189
Wide 346 341 352 353 332 316 335 318 323 305 303
All Soils 1029 1020 1022 1014 974 950 952 920 933 893 893
% of Total Farm Population with grassland area*
Limited 33% 31% 31% 30% 30% 30% 29% 29% 29% 28% 29%
Moderately Wide 18% 20% 19% 20% 20% 20% 20% 19% 18% 18% 18%
Somewhat Limited 20% 20% 19% 20% 20% 22% 21% 22% 23% 25% 23%
Wide 29% 29% 30% 30% 30% 29% 31% 30% 30% 29% 29%*National population weights applied to Teagasc NFS farms
N application rates on total grassland area by land use potential are presented in Figure 37. Results
indicate that application rates for farms of wide land use class (97-129 kg ha-1) were on average 54%
higher than for farms of limited land use class, 47% higher than on farms of somewhat limited land
use class and 32% higher than on farms of moderately wide land use class. The highest application
rates were recorded at the start of the study period (2005/2006) for all land use classes. The lowest
application rates were recorded in 2008 across all land use classes (23% lower than the start of the
study period on average). Application rates recovered in 2013 to levels near to those at the start of
the study period, but then declined in 2014-15 and were on average 11-16% lower than at the start
of the study period.
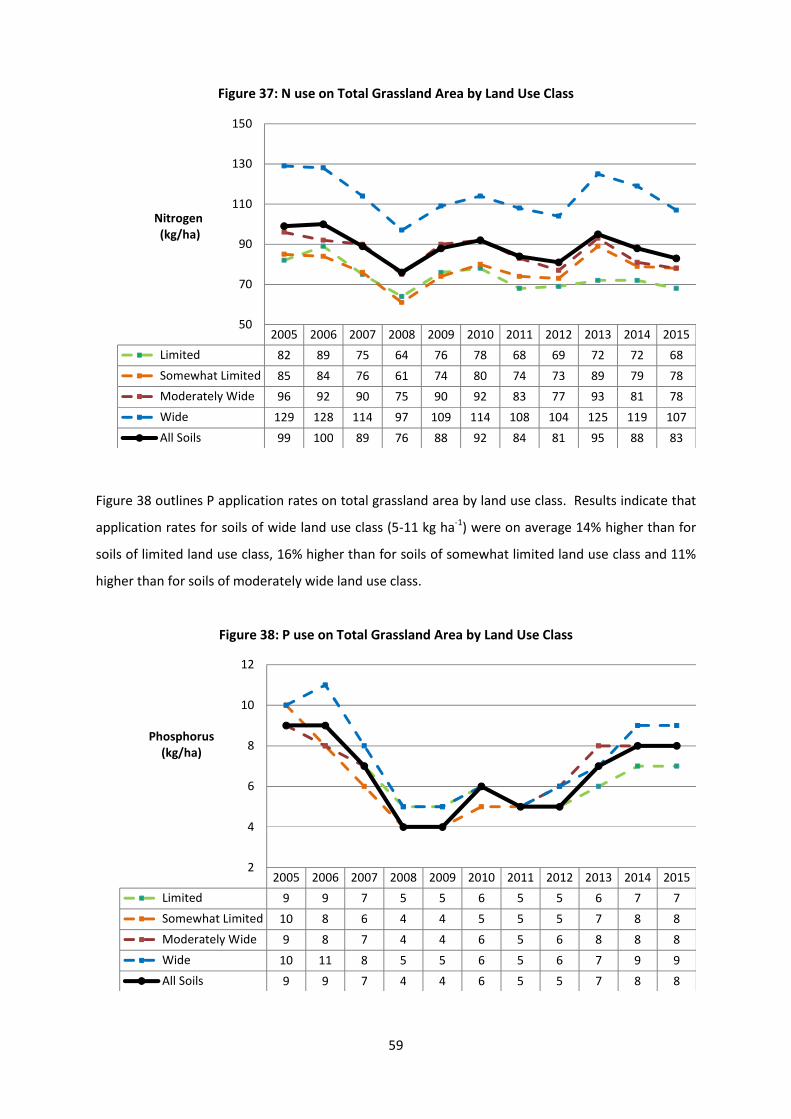
59
Figure 37: N use on Total Grassland Area by Land Use Class
Figure 38 outlines P application rates on total grassland area by land use class. Results indicate that
application rates for soils of wide land use class (5-11 kg ha-1) were on average 14% higher than for
soils of limited land use class, 16% higher than for soils of somewhat limited land use class and 11%
higher than for soils of moderately wide land use class.
Figure 38: P use on Total Grassland Area by Land Use Class
2005 2006 2007 2008 2009 2010 2011 2012 2013 2014 2015
Limited 82 89 75 64 76 78 68 69 72 72 68
Somewhat Limited 85 84 76 61 74 80 74 73 89 79 78
Moderately Wide 96 92 90 75 90 92 83 77 93 81 78
Wide 129 128 114 97 109 114 108 104 125 119 107
All Soils 99 100 89 76 88 92 84 81 95 88 83
50
70
90
110
130
150
Nitrogen(kg/ha)
2005 2006 2007 2008 2009 2010 2011 2012 2013 2014 2015
Limited 9 9 7 5 5 6 5 5 6 7 7
Somewhat Limited 10 8 6 4 4 5 5 5 7 8 8
Moderately Wide 9 8 7 4 4 6 5 6 8 8 8
Wide 10 11 8 5 5 6 5 6 7 9 9
All Soils 9 9 7 4 4 6 5 5 7 8 8
2
4
6
8
10
12
Phosphorus(kg/ha)
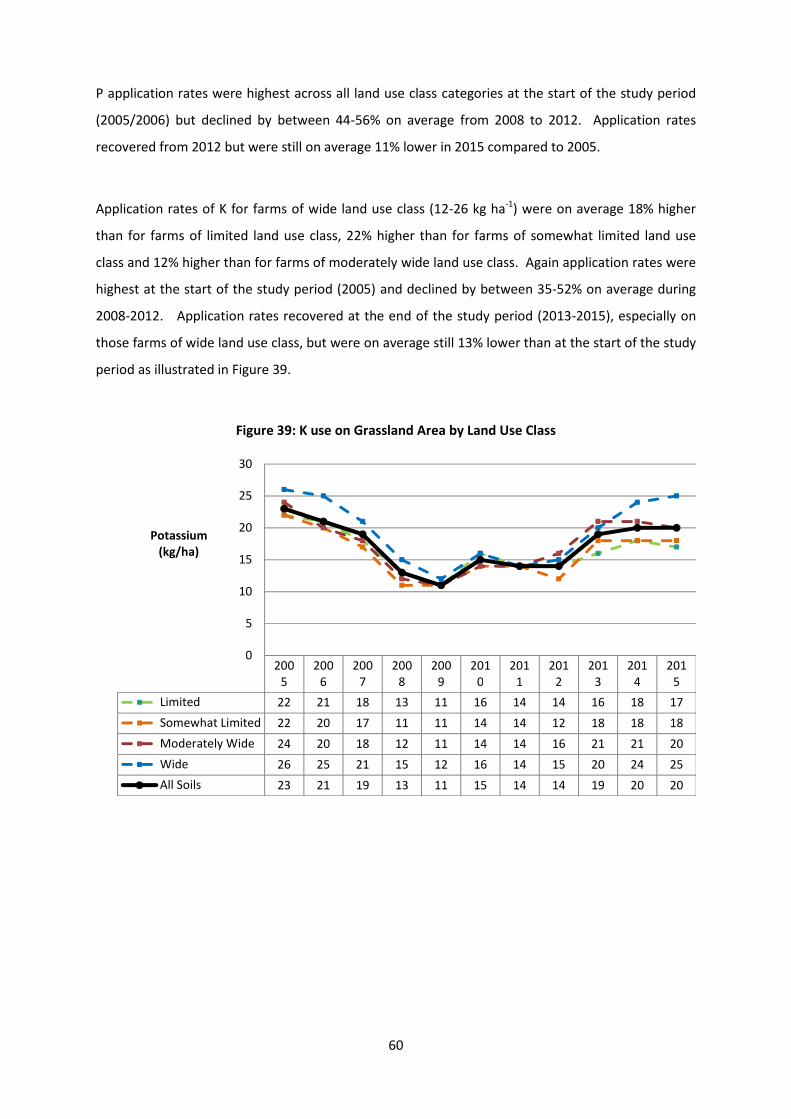
60
P application rates were highest across all land use class categories at the start of the study period
(2005/2006) but declined by between 44-56% on average from 2008 to 2012. Application rates
recovered from 2012 but were still on average 11% lower in 2015 compared to 2005.
Application rates of K for farms of wide land use class (12-26 kg ha-1) were on average 18% higher
than for farms of limited land use class, 22% higher than for farms of somewhat limited land use
class and 12% higher than for farms of moderately wide land use class. Again application rates were
highest at the start of the study period (2005) and declined by between 35-52% on average during
2008-2012. Application rates recovered at the end of the study period (2013-2015), especially on
those farms of wide land use class, but were on average still 13% lower than at the start of the study
period as illustrated in Figure 39.
Figure 39: K use on Grassland Area by Land Use Class
2005
2006
2007
2008
2009
2010
2011
2012
2013
2014
2015
Limited 22 21 18 13 11 16 14 14 16 18 17
Somewhat Limited 22 20 17 11 11 14 14 12 18 18 18
Moderately Wide 24 20 18 12 11 14 14 16 21 21 20
Wide 26 25 21 15 12 16 14 15 20 24 25
All Soils 23 21 19 13 11 15 14 14 19 20 20
0
5
10
15
20
25
30
Potassium(kg/ha)
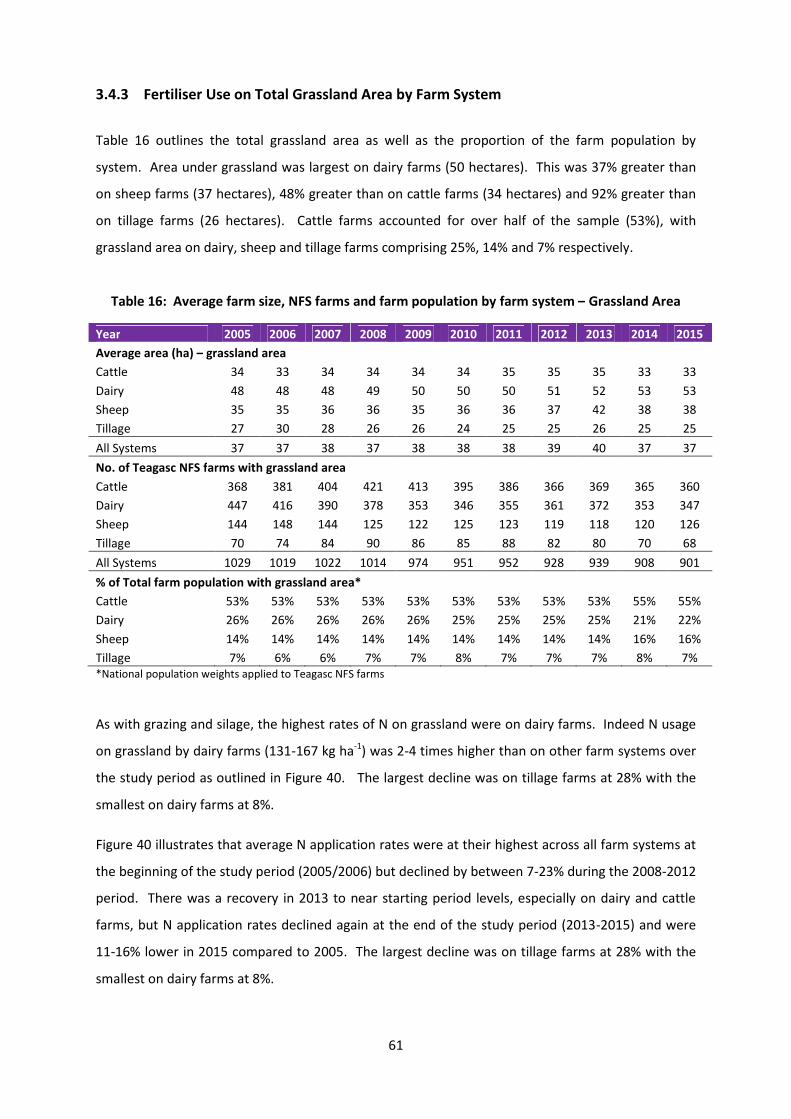
61
3.4.3 Fertiliser Use on Total Grassland Area by Farm System
Table 16 outlines the total grassland area as well as the proportion of the farm population by
system. Area under grassland was largest on dairy farms (50 hectares). This was 37% greater than
on sheep farms (37 hectares), 48% greater than on cattle farms (34 hectares) and 92% greater than
on tillage farms (26 hectares). Cattle farms accounted for over half of the sample (53%), with
grassland area on dairy, sheep and tillage farms comprising 25%, 14% and 7% respectively.
Table 16: Average farm size, NFS farms and farm population by farm system – Grassland Area
Year 2005 2006 2007 2008 2009 2010 2011 2012 2013 2014 2015
Average area (ha) – grassland area
Cattle 34 33 34 34 34 34 35 35 35 33 33
Dairy 48 48 48 49 50 50 50 51 52 53 53
Sheep 35 35 36 36 35 36 36 37 42 38 38
Tillage 27 30 28 26 26 24 25 25 26 25 25
All Systems 37 37 38 37 38 38 38 39 40 37 37
No. of Teagasc NFS farms with grassland area
Cattle 368 381 404 421 413 395 386 366 369 365 360
Dairy 447 416 390 378 353 346 355 361 372 353 347
Sheep 144 148 144 125 122 125 123 119 118 120 126
Tillage 70 74 84 90 86 85 88 82 80 70 68
All Systems 1029 1019 1022 1014 974 951 952 928 939 908 901
% of Total farm population with grassland area*
Cattle 53% 53% 53% 53% 53% 53% 53% 53% 53% 55% 55%
Dairy 26% 26% 26% 26% 26% 25% 25% 25% 25% 21% 22%
Sheep 14% 14% 14% 14% 14% 14% 14% 14% 14% 16% 16%
Tillage 7% 6% 6% 7% 7% 8% 7% 7% 7% 8% 7%*National population weights applied to Teagasc NFS farms
As with grazing and silage, the highest rates of N on grassland were on dairy farms. Indeed N usage
on grassland by dairy farms (131-167 kg ha-1) was 2-4 times higher than on other farm systems over
the study period as outlined in Figure 40. The largest decline was on tillage farms at 28% with the
smallest on dairy farms at 8%.
Figure 40 illustrates that average N application rates were at their highest across all farm systems at
the beginning of the study period (2005/2006) but declined by between 7-23% during the 2008-2012
period. There was a recovery in 2013 to near starting period levels, especially on dairy and cattle
farms, but N application rates declined again at the end of the study period (2013-2015) and were
11-16% lower in 2015 compared to 2005. The largest decline was on tillage farms at 28% with the
smallest on dairy farms at 8%.

62
Figure 40: N use on Total Grassland Area by Farm System
Application rates of P on grassland by farm system are illustrated in Figure 41. Application rates on
dairy farms (5-13 kg ha-1) were 7% greater than on tillage farms, 44% higher than on cattle farms and
nearly 80% higher than on sheep farms on average over the study period. Average application rates
were highest across all farm systems at the start of the study period (2005/2006), but declined by
between 44-56% from 2008-2012. Application rates recovered at the end of the study period (2013-
2015), especially on sheep farms, but on average were still 11% lower than at the start.
Figure 41: P use on Total Grassland Area by Farm System
2005 2006 2007 2008 2009 2010 2011 2012 2013 2014 2015
Cattle 67 65 61 49 60 64 56 54 68 60 56
Dairy 167 168 149 131 149 153 150 145 164 162 153
Sheep 60 65 57 41 44 49 42 40 45 48 41
Tillage 95 96 89 76 85 81 67 69 91 76 68
All Systems 99 100 89 76 88 92 84 81 95 88 83
30
50
70
90
110
130
150
170
190
Nitrogen(kg/ha)
2005 2006 2007 2008 2009 2010 2011 2012 2013 2014 2015
Cattle 8 8 6 4 4 6 5 5 6 7 7
Dairy 13 12 8 6 5 7 6 7 9 11 11
Sheep 7 6 5 3 3 4 3 4 5 6 7
Tillage 10 9 10 6 5 8 7 8 9 9 8
All Systems 9 9 7 4 4 6 5 5 7 8 8
0
2
4
6
8
10
12
14
Phosphorus(kg/ha)

63
K application rates over the period were on average similar across dairy and tillage farms at 23 kg ha-
1, this was 53% greater than average application rates across cattle farms and was nearly double
that of sheep farms. Application rates were highest at the start of the study period (2005/2006) and
declined by between 35-52% during 2008-2012 across all farm systems. The average decline over the
period was 13%, tillage farms were back to 2005 levels in 2015 but all others were still below where
they were at the outset of the study period. Although K use on dairy farms in 2015 was still 9%
below that of 2005 rates were still relatively higher than for the other farm systems. The largest
decline in usage (of 20%) is reported on cattle farms over the period. In line with Teagasc advice a
large increase in K usage is evident from 2011 particularly for dairy farms (up 61%) and sheep farms
(up 75%).
Figure 42: K use on Grassland Area by Farm System
2005 2006 2007 2008 2009 2010 2011 2012 2013 2014 2015
Cattle 20 18 17 11 11 14 12 13 16 17 16
Dairy 32 29 23 17 14 18 18 18 25 30 29
Sheep 16 14 13 9 7 10 8 10 12 14 14
Tillage 24 28 25 20 14 22 19 22 25 26 24
All Systems 23 21 19 13 11 15 14 14 19 20 20
0
5
10
15
20
25
30
35
Potassium(kg/ha)
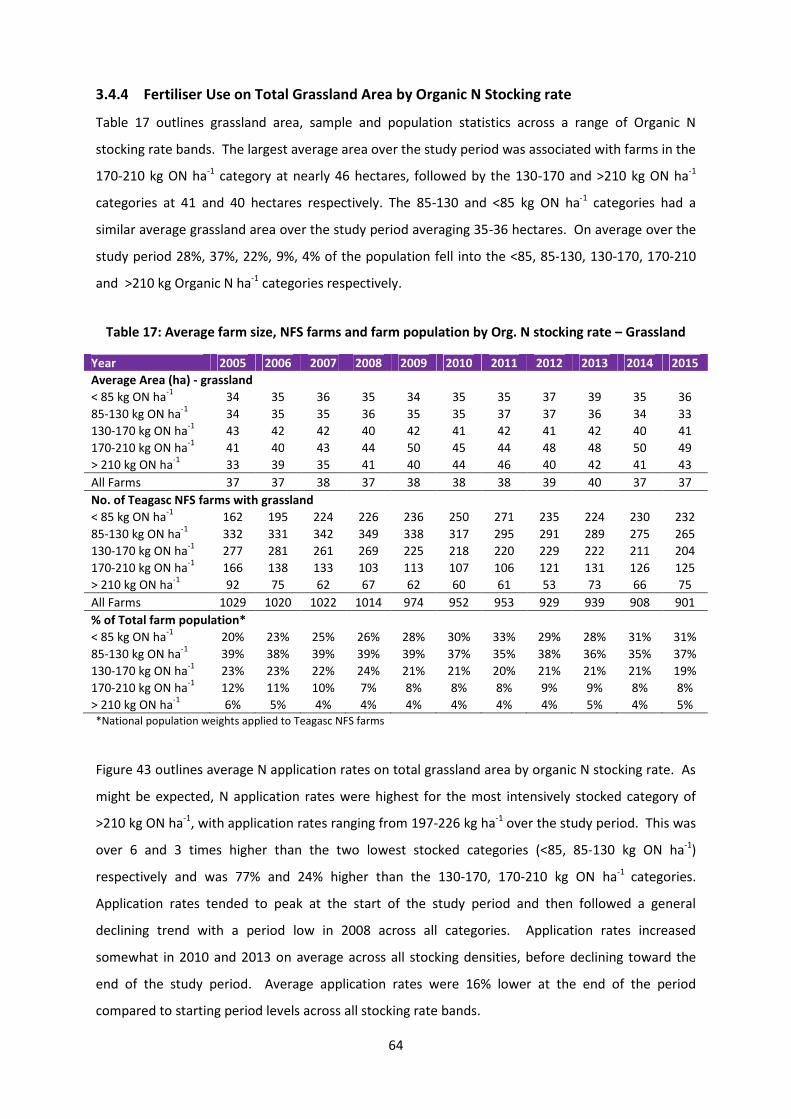
64
3.4.4 Fertiliser Use on Total Grassland Area by Organic N Stocking rate
Table 17 outlines grassland area, sample and population statistics across a range of Organic N
stocking rate bands. The largest average area over the study period was associated with farms in the
170-210 kg ON ha-1 category at nearly 46 hectares, followed by the 130-170 and >210 kg ON ha-1
categories at 41 and 40 hectares respectively. The 85-130 and <85 kg ON ha-1 categories had a
similar average grassland area over the study period averaging 35-36 hectares. On average over the
study period 28%, 37%, 22%, 9%, 4% of the population fell into the <85, 85-130, 130-170, 170-210
and >210 kg Organic N ha-1 categories respectively.
Table 17: Average farm size, NFS farms and farm population by Org. N stocking rate – Grassland
Year 2005 2006 2007 2008 2009 2010 2011 2012 2013 2014 2015
Average Area (ha) - grassland
< 85 kg ON ha-1
34 35 36 35 34 35 35 37 39 35 36
85-130 kg ON ha-1
34 35 35 36 35 35 37 37 36 34 33
130-170 kg ON ha-1
43 42 42 40 42 41 42 41 42 40 41
170-210 kg ON ha-1
41 40 43 44 50 45 44 48 48 50 49
> 210 kg ON ha-1
33 39 35 41 40 44 46 40 42 41 43
All Farms 37 37 38 37 38 38 38 39 40 37 37
No. of Teagasc NFS farms with grassland
< 85 kg ON ha-1
162 195 224 226 236 250 271 235 224 230 232
85-130 kg ON ha-1
332 331 342 349 338 317 295 291 289 275 265
130-170 kg ON ha-1
277 281 261 269 225 218 220 229 222 211 204
170-210 kg ON ha-1
166 138 133 103 113 107 106 121 131 126 125
> 210 kg ON ha-1
92 75 62 67 62 60 61 53 73 66 75
All Farms 1029 1020 1022 1014 974 952 953 929 939 908 901
% of Total farm population*
< 85 kg ON ha-1
20% 23% 25% 26% 28% 30% 33% 29% 28% 31% 31%
85-130 kg ON ha-1
39% 38% 39% 39% 39% 37% 35% 38% 36% 35% 37%
130-170 kg ON ha-1
23% 23% 22% 24% 21% 21% 20% 21% 21% 21% 19%
170-210 kg ON ha-1
12% 11% 10% 7% 8% 8% 8% 9% 9% 8% 8%
> 210 kg ON ha-1
6% 5% 4% 4% 4% 4% 4% 4% 5% 4% 5%*National population weights applied to Teagasc NFS farms
Figure 43 outlines average N application rates on total grassland area by organic N stocking rate. As
might be expected, N application rates were highest for the most intensively stocked category of
>210 kg ON ha-1, with application rates ranging from 197-226 kg ha-1 over the study period. This was
over 6 and 3 times higher than the two lowest stocked categories (<85, 85-130 kg ON ha-1)
respectively and was 77% and 24% higher than the 130-170, 170-210 kg ON ha-1 categories.
Application rates tended to peak at the start of the study period and then followed a general
declining trend with a period low in 2008 across all categories. Application rates increased
somewhat in 2010 and 2013 on average across all stocking densities, before declining toward the
end of the study period. Average application rates were 16% lower at the end of the period
compared to starting period levels across all stocking rate bands.
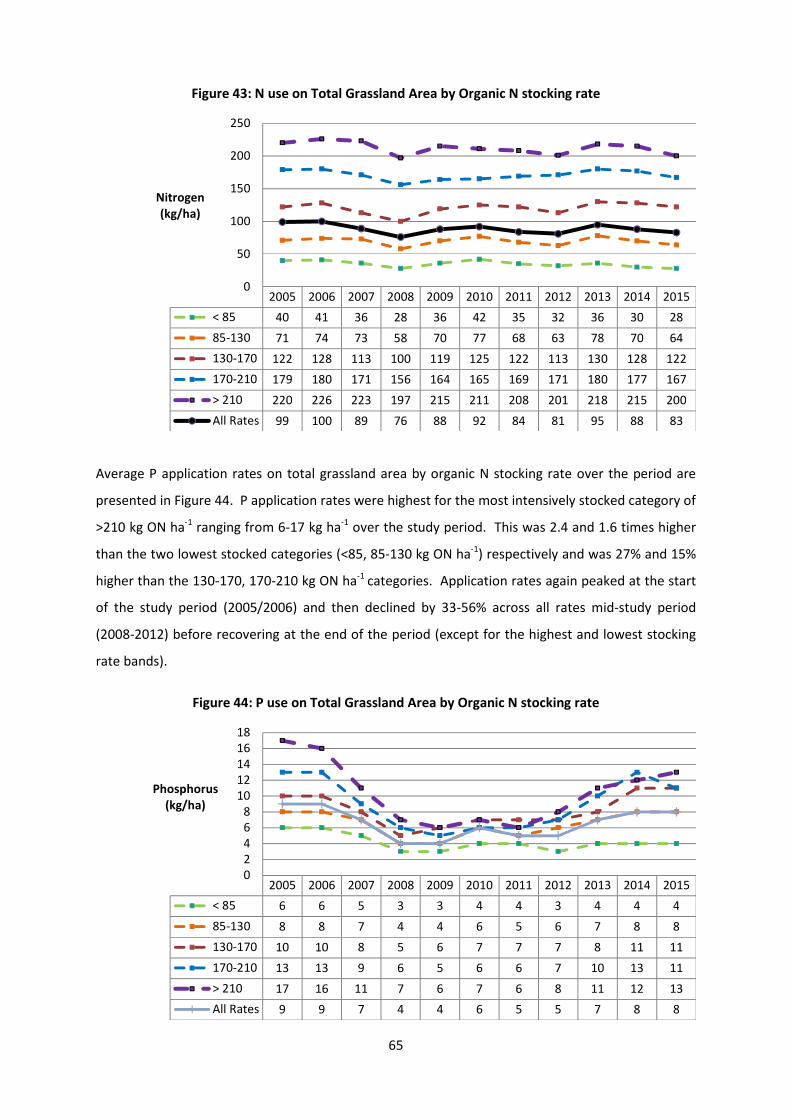
65
Figure 43: N use on Total Grassland Area by Organic N stocking rate
Average P application rates on total grassland area by organic N stocking rate over the period are
presented in Figure 44. P application rates were highest for the most intensively stocked category of
>210 kg ON ha-1 ranging from 6-17 kg ha-1 over the study period. This was 2.4 and 1.6 times higher
than the two lowest stocked categories (<85, 85-130 kg ON ha-1) respectively and was 27% and 15%
higher than the 130-170, 170-210 kg ON ha-1 categories. Application rates again peaked at the start
of the study period (2005/2006) and then declined by 33-56% across all rates mid-study period
(2008-2012) before recovering at the end of the period (except for the highest and lowest stocking
rate bands).
Figure 44: P use on Total Grassland Area by Organic N stocking rate
2005 2006 2007 2008 2009 2010 2011 2012 2013 2014 2015
< 85 40 41 36 28 36 42 35 32 36 30 28
85-130 71 74 73 58 70 77 68 63 78 70 64
130-170 122 128 113 100 119 125 122 113 130 128 122
170-210 179 180 171 156 164 165 169 171 180 177 167
> 210 220 226 223 197 215 211 208 201 218 215 200
All Rates 99 100 89 76 88 92 84 81 95 88 83
0
50
100
150
200
250
Nitrogen(kg/ha)
2005 2006 2007 2008 2009 2010 2011 2012 2013 2014 2015
< 85 6 6 5 3 3 4 4 3 4 4 4
85-130 8 8 7 4 4 6 5 6 7 8 8
130-170 10 10 8 5 6 7 7 7 8 11 11
170-210 13 13 9 6 5 6 6 7 10 13 11
> 210 17 16 11 7 6 7 6 8 11 12 13
All Rates 9 9 7 4 4 6 5 5 7 8 8
02468
1012141618
Phosphorus(kg/ha)
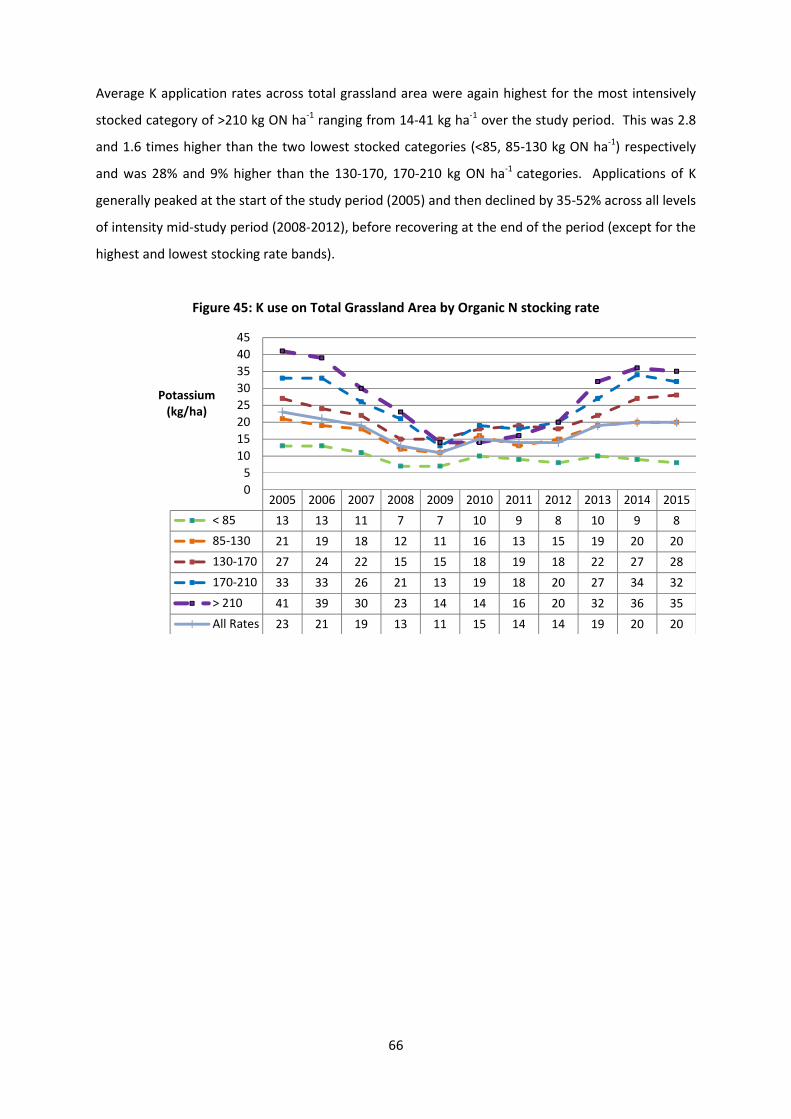
66
Average K application rates across total grassland area were again highest for the most intensively
stocked category of >210 kg ON ha-1 ranging from 14-41 kg ha-1 over the study period. This was 2.8
and 1.6 times higher than the two lowest stocked categories (<85, 85-130 kg ON ha-1) respectively
and was 28% and 9% higher than the 130-170, 170-210 kg ON ha-1 categories. Applications of K
generally peaked at the start of the study period (2005) and then declined by 35-52% across all levels
of intensity mid-study period (2008-2012), before recovering at the end of the period (except for the
highest and lowest stocking rate bands).
Figure 45: K use on Total Grassland Area by Organic N stocking rate
2005 2006 2007 2008 2009 2010 2011 2012 2013 2014 2015
< 85 13 13 11 7 7 10 9 8 10 9 8
85-130 21 19 18 12 11 16 13 15 19 20 20
130-170 27 24 22 15 15 18 19 18 22 27 28
170-210 33 33 26 21 13 19 18 20 27 34 32
> 210 41 39 30 23 14 14 16 20 32 36 35
All Rates 23 21 19 13 11 15 14 14 19 20 20
0
5
10
15
20
25
30
35
40
45
Potassium(kg/ha)

67
3.4.5 Fertiliser Compounds use on Grassland
3.4.6 Percentage of N applied to Grassland by Fertiliser type
Table 18 outlines the percentage of N applied to grassland through various fertilisers over the study
period. Six main fertilisers accounted for the majority of N applied to grassland (>8% in all cases).
CAN based fertilisers (27.5-0-0 and 27-0-0) were dominant, accounting for between 30-49% of the
total N applied over the study period. The next most important was 27-2.5-5, this accounted for
between 14-28% of total N applied between 2005-2015, however the relative importance of this
fertiliser in percentage terms declined towards the end of the study period. A similar trend was
observed for 24-2.5-10, this accounted for between 8-15% of total N applied over the period. The
importance of this fertiliser declined during the middle of the study period, but recovered towards
the end. Urea (46-0-0) accounted for between 11-17% of total N applied; application rates peaked
in 2008/2009 at 17%, but declined to below starting period level at the end of the period (10-12%).
The only other fertiliser averaging over 2% of total N applied was 18-6-12, this accounted for
between 3-9% over the study period, with major increases observed in this fertiliser at the end of
the study period (2014-2015).
Table 18: N Fertiliser Compounds applied to grassland (%)
Fertiliser Type 2005 2006 2007 2008 2009 2010 2011 2012 2013 2014 2015
27.5 - 0 - 0 23.7 28.5 28.2 27.6 29.8 26.6 25.9 26.1 24.9 22.1 20.2
27 - 2.5 - 5 27.3 25.4 23.6 18.9 14.4 12.7 12.8 16.3 15.7 15.2 15.3
27 - 0 - 0 6.3 5.1 8.9 13.6 18.9 19.8 19.8 17.0 16.4 14.7 14.9
24 - 2.5 - 10 14.6 13.0 12.6 11.4 8.3 9.8 9.8 10.4 12.2 11.2 12.4
46 - 0 - 0 13.4 12.5 11.8 17.0 17.0 15.9 16.6 13.6 10.7 12.0 12.1
18 - 6 - 12 5.5 5.5 5.3 4.0 3.5 4.4 3.7 4.0 5.6 7.8 8.2
23 - 0 - 0 0.5 0.6 0.6 0.9 0.5 0.7 1.5 1.6 1.8 1.6 2.2
23 - 2.5 - 5 1.4 1.5 1.1 0.7 0.5 1.1 1.4 2.0 1.8 1.5 2.0
24 - 2.2 - 4.5 0.3 0.5 0.6 0.3 1.1 2.1 2.5 2.2 2.5 2.1 1.5
10 - 10 - 20 0.8 0.7 0.4 0.3 0.2 0.6 0.7 0.5 0.7 1.2 1.2
19 - 0 - 15 0.1 0.2 1.1 0.9 0.5 0.7 0.7 0.5 0.6 1.1 0.9
26 - 0 - 0 - 0.1 0.2 0.2 0.3 0.4 0.4 0.7 1.0 0.9 0.6
24 - 2 - 5 - - - 0.1 - - 0.1 0.7 0.3 1.3 0.5
42 - 0 - 0 - - - - - - - - - 0.1 0.5
20 - 2 - 12 - - - - - - - - 0.1 0.1 0.4
20 - 4 - 10 0.5 0.4 0.4 0.2 0.1 0.2 0.2 0.2 0.1 0.2 0.4
23 - 2.5 - 10 0.2 0.1 0.1 0.1 0.1 0.1 0.1 - 0.2 0.3 0.4
24 - 0 - 0 0.2 - 0.2 - - - - - 0.2 0.2 0.4
26.5 - 0 - 0 0.2 0.2 0.4 0.1 0.8 0.4 0.4 0.4 0.5 0.4 0.4
21 - 0 - 0 - - - - 0.1 0.2 0.2 0.1 - 0.4 0.3
Other 5.0 5.7 4.5 3.7 3.9 4.3 3.2 3.7 4.7 5.6 5.2
Total 100% 100% 100% 100% 100% 100% 100% 100% 100% 100% 100%

68
3.4.7 Percentage of P applied to Grassland by Fertiliser type
Table 19 outlines the percentage of P applied to grassland through various fertilisers over the study
period. Four main fertilisers were responsible for the majority of P applied to grassland. On average
18-6-12 accounted for between 21-32% of total P applied to grassland, this fertiliser grew in
importance over the course of the study period. The next largest contribution of total P was
associated with 27-2.5-5 which accounted for between 16-33% over the study period, the
importance of this fertiliser declined significantly over time from approximately 30% of total P in
2005 to 17% in 2015. The third most important P based fertiliser was 24-2.5-10, which accounted
for between 14-22% of total P applied during 2005-2015. Again the importance of this fertiliser
declined at the end of the study period. The last major fertiliser was 10-10-20, this accounted for
between 6-15% over the period, peaking in the final two years of the study period.
Table 19: P Fertiliser Compounds applied to grassland (%)
Fertiliser Type 2005 2006 2007 2008 2009 2010 2011 2012 2013 2014 2015
18 - 6 - 12 21.0 22.2 25.3 24.9 26.4 26.5 22.9 22.2 28.0 31.3 32.1
27 - 2.5 - 5 29.2 28.7 31.5 32.6 30.4 21.2 22.2 25.2 21.7 16.8 16.5
24 - 2.5 - 10 17.6 16.5 19.0 22.1 19.6 18.5 19.0 18.1 19.0 14.0 15.1
10 - 10 - 20 9.3 8.5 6.0 4.7 5.6 10.3 13.1 8.9 10.5 14.6 13.9
23 - 2.5 - 5 1.7 1.9 1.8 1.4 1.2 2.2 2.9 3.7 2.9 1.9 2.6
0 - 7 - 30 4.6 4.2 2.8 3.1 1.5 2.9 3.5 2.6 1.9 3.0 2.5
24 - 2.2 - 4.5 0.3 0.6 0.7 0.5 2.2 3.4 4.3 3.3 3.4 2.3 1.6
18 - 20 - 0 - - - - - - - - 0.1 0.1 1.1
20 - 21 - 0 - - - - - - - - - - 0.9
20 - 4 - 10 1.1 1.1 1.2 0.8 0.4 0.7 0.6 0.5 0.3 0.5 0.9
0 - 10 - 20 3.1 3.3 2.8 1.2 0.8 2.0 2.4 2.0 1.2 0.9 0.8
0 - 16 - 0 0.9 0.9 - - 0.2 0.7 0.2 0.6 0.4 0.5 0.6
0 - 27 - 0 - - - - - - - - - 0.3 0.6
10 - 5 - 25 - - - - - - 0.1 0.1 0.1 0.2 0.6
14 - 16 - 0 - - - - - - - 0.4 0.2 2.0 0.6
25 - 4 - 0 1.0 0.5 1.1 1.1 0.6 1.1 0.1 0.3 0.6 0.6 0.6
0 - 11 - 0 - - - - - - - - - - 0.5
22 - 4 - 8 0.4 - 0.4 0.1 0.1 - 0.5 - 0.7 0.4 0.5
23 - 2.5 - 10 0.2 0.1 0.2 0.3 0.1 0.1 0.2 - 0.2 0.4 0.5
24 - 2 - 5 - - - 0.1 - - 0.2 1.0 0.3 1.3 0.5
Other 9.6 11.5 7.2 7.1 10.9 10.4 7.8 11.1 8.5 8.9 7.0
Total 100% 100% 100% 100% 100% 100% 100% 100% 100% 100% 100%

69
3.4.8 Percentage of K applied to Grassland by Fertiliser type
There were only four main fertilisers with application rates consistently averaging over 5% of total K
applied over the study period. Except for the final two years of the study period, 24-2.5-10 was the
most popular K based fertiliser applied averaging between 21-31% of total K. For the final two years
of the study period, 18-6-12 was the most common K based fertiliser applied. This accounted for
between 16-25% of total K applied to grassland over the study period. At the start of the study
period (2005-2009) 27-2.5-5 was responsible for the second highest levels of K applied (23-24%) but
this declined to approximately 13% at the end of the study period. Finally, 10-10-20 averaged
between 3-12% of total K applied over the study period, peaking during the final years of the study
period as outlined in Table 20.
Table 20: K Fertiliser Compounds applied to grassland (%)
Fertiliser Type 2005 2006 2007 2008 2009 2010 2011 2012 2013 2014 2015
18 - 6 - 12 17.0 18.4 18.6 17.2 20.0 20.2 16.6 16.9 21.0 24.3 24.7
24 - 2.5 - 10 28.5 27.4 27.9 30.5 29.8 28.2 27.6 27.6 28.5 21.8 23.2
27 - 2.5 - 5 23.6 23.8 23.2 22.5 23.0 16.2 16.1 19.2 16.3 13.1 12.7
10 - 10 - 20 7.5 7.0 4.4 3.2 4.2 7.9 9.5 6.8 7.9 11.4 10.7
0 - 0 - 50 1.1 1.6 2.2 3.7 1.4 1.9 3.8 3.8 4.2 4.0 4.8
0 - 7 - 30 8.0 7.5 4.4 4.5 2.4 4.8 5.5 4.3 3.0 5.0 4.2
19 - 0 - 15 0.3 0.8 4.7 4.8 3.4 3.6 3.5 2.4 2.6 4.2 3.3
23 - 2.5 - 5 1.4 1.6 1.3 1.0 0.9 1.7 2.1 2.8 2.2 1.5 2.0
24 - 2.2 - 4.5 0.2 0.5 0.5 0.3 1.7 2.7 3.2 2.6 2.6 1.8 1.2
10 - 5 - 25 - - - - - - 0.1 0.2 0.2 0.5 1.1
20 - 2 - 12 - - - - - - - - 0.2 0.2 1.0
20 - 4 - 10 1.1 1.1 1.1 0.7 0.4 0.6 0.5 0.5 0.3 0.5 0.8
13.5 - 0 - 12.5 - - - - - - - - - - 0.7
18 - 2.5 - 14 0.4 1.0 1.2 1.1 2.0 1.3 0.8 0.9 0.8 0.8 0.7
23 - 2.5 - 10 0.4 0.2 0.3 0.4 0.2 0.2 0.3 0 0.4 0.6 0.7
0 - 10 - 20 2.5 2.8 2.1 0.8 0.6 1.5 1.8 1.5 0.9 0.7 0.6
10 - 6 - 26 - - - - - - - - - - 0.5
13 - 6 - 20 0.1 - - - - 0.2 0.2 0.4 0.3 0.7 0.5
24 - 2 - 5 - - - 0.1 - - 0.2 1.0 0.3 1.2 0.5
21 - 2.2 - 10 - 0.2 - - 0.2 - 0.7 1.1 0.9 0.9 0.4
Other 7.9 6.1 8.1 9.2 9.8 9.0 7.5 8.0 7.4 6.8 5.7
Total 100% 100% 100% 100% 100% 100% 100% 100% 100% 100% 100%

70
3.4.9 Percentage of total fertiliser applied to Grassland by Fertiliser type
Table 20 outlines the percentage of total fertiliser applied to grassland in volume terms by fertiliser
type. In all, six main fertilisers accounted for the majority of fertiliser applied. CAN based fertilisers
(27.5-0-0 and 27-0-0) were dominant and accounted for between 28-50% of the total quantity of
fertilisers applied over the study period. CAN application rates peaked in 2010 at close to 50%. The
next largest fertiliser in quantity terms was 27-2.5-5, which accounted for between 12-26% of total
fertiliser applied over the period. The importance of this fertiliser declined over the study period.
Next largest in quantity terms was 24-2.5-10, this accounted for between 9-16% of total fertiliser
applied over the study period. The other two fertilisers that were responsible for volumes of 10% or
greater over the study period were 18-6-12 and urea (46-0-0). The 18-6-12 fertiliser volumes ranged
from 5-12% and urea volumes ranged from 6-11% over the study period.
Table 21: Top 20 ranked fertilisers applied to Grassland by quantity
Fertiliser 2005 2006 2007 2008 2009 2010 2011 2012 2013 2014 2015
27.5 - 0 - 0 22.2 27.2 26.7 27.1 29.9 25.9 25.3 25.1 23.4 20.3 18.5
27 - 2.5 - 5 26.0 24.7 22.8 18.9 14.7 12.6 12.7 16.0 15.0 14.1 14.2
27 - 0 - 0 6.0 5.0 8.6 13.6 19.4 19.7 19.7 16.7 15.7 13.7 13.9
24 - 2.5 - 10 15.7 14.2 13.7 12.8 9.5 11.0 10.9 11.5 13.2 11.8 13.0
18 - 6 - 12 7.8 8.0 7.6 6.0 5.3 6.5 5.5 5.9 8.1 11.0 11.5
46 - 0 - 0 7.5 7.2 6.7 10 10.2 9.3 9.7 7.9 6.0 6.6 6.6
10 - 10 - 20 2.1 1.8 1.1 0.7 0.7 1.5 1.9 1.4 1.8 3.1 3.0
23 - 0 - 0 0.6 0.7 0.6 1.0 0.6 0.8 1.7 1.8 2.0 1.8 2.4
23 - 2.5 - 5 1.5 1.7 1.3 0.8 0.6 1.3 1.6 2.3 2.0 1.6 2.2
24 - 2.2 - 4.5 0.3 0.6 0.6 0.3 1.2 2.3 2.8 2.4 2.7 2.2 1.5
19 - 0 - 15 0.1 0.3 1.6 1.3 0.7 0.9 0.9 0.7 0.8 1.5 1.2
0 - 7 - 30 1.5 1.3 0.7 0.6 0.3 0.6 0.7 0.6 0.5 0.9 0.8
26 - 0 - 0 - 0.1 0.2 0.2 0.4 0.4 0.4 0.7 1.0 0.9 0.6
0 - 0 - 50 0.1 0.2 0.2 0.3 0.1 0.1 0.3 0.3 0.4 0.4 0.5
20 - 2 - 12 - - - - - - - - 0.1 0.1 0.5
20 - 4 - 10 0.6 0.6 0.6 0.3 0.1 0.2 0.2 0.2 0.1 0.3 0.5
24 - 2 - 5 - - - 0.1 - - 0.1 0.8 0.3 1.3 0.5
21 - 0 - 0 0.1 - - - 0.1 0.2 0.3 0.1 - 0.5 0.4
23 - 2.5 - 10 0.2 0.1 0.1 0.2 0.1 0.1 0.1 - 0.2 0.3 0.4
Other 7.7 6.3 6.9 5.8 6.1 6.6 5.2 5.6 6.7 7.6 7.8
Total 100% 100% 100% 100% 100% 100% 100% 100% 100% 100% 100%

71
3.5 Fertiliser Use on Main Cereal Crops 2005-2015
Results are presented in this section for the main cereal crops namely wheat, barley and oats.
3.5.1 Fertiliser Use on Main Cereal Crops by Nitrate Zone
Table 22 illustrates that the growing of cereals is most prevalent in zone A where the area under
cereals ranged between 19-29 hectares over the period 2005-2015, with the average area increasing
over the study period. The area dedicated to cereal crops was smallest in zone C at between 8-14
hectares. The area under cereals in zone B ranged between 19-27 hectares. Given variation in both
cereal area and the composition of cereals grown, one would assume differing patterns of fertiliser
usage across the respective nitrate zones. Overall, the majority of farms with cereal area were in
zone A (71%) with 21% in zone B and 8% in zone C on average.
Table 22: Average farm size and NFS farm numbers by Nitrate Zone – Main Cereal Crops
Year 2005 2006 2007 2008 2009 2010 2011 2012 2013 2014 2015
Average Area (ha) – main cereals
Zone A 19 22 22 24 24 26 27 28 28 28 29
Zone B 20 24 19 20 22 23 26 20 20 27 26
Zone C 8 11 9 8 11 7 8 8 7 14 10
All Zones 18 22 20 22 23 23 25 24 24 27 27
No. of Teagasc NFS farms with main cereals
Zone A 144 138 153 167 137 123 137 129 118 108 101
Zone B 46 39 40 43 40 40 43 39 34 30 30
Zone C 22 14 18 20 17 24 21 17 16 12 11
All Zones 212 191 211 230 194 187 201 185 168 150 142
% of Total farm population with main cereals*
Zone A 68% 73% 73% 72% 72% 65% 67% 69% 70% 74% 73%
Zone B 24% 22% 20% 20% 20% 23% 24% 21% 21% 19% 20%
Zone C 8% 5% 7% 8% 8% 12% 9% 11% 9% 6% 7%*National population weights applied to Teagasc NFS farms
Figure 46 outlines N application rates across the main cereals by nitrate zone. Results indicate
similar application rates across zones A and B on average (146-148 kg ha-1), with application rates
higher in zone B at the start and in zone A at the end of the study period. Average N application
rates on cereal area were 20% lower (117 kg ha-1) in zone C compared to the other zones. However,
application rates in zone C did increase significantly (24-30%) at the end of the study period
(2014/2015) compared to the start of the period. As approximately 70% of cereal farms are located
in zone A, the trend in this zone tends to determine the trend across all zones. Application rates in
zone A increased by 13% from 2005 to 2015.
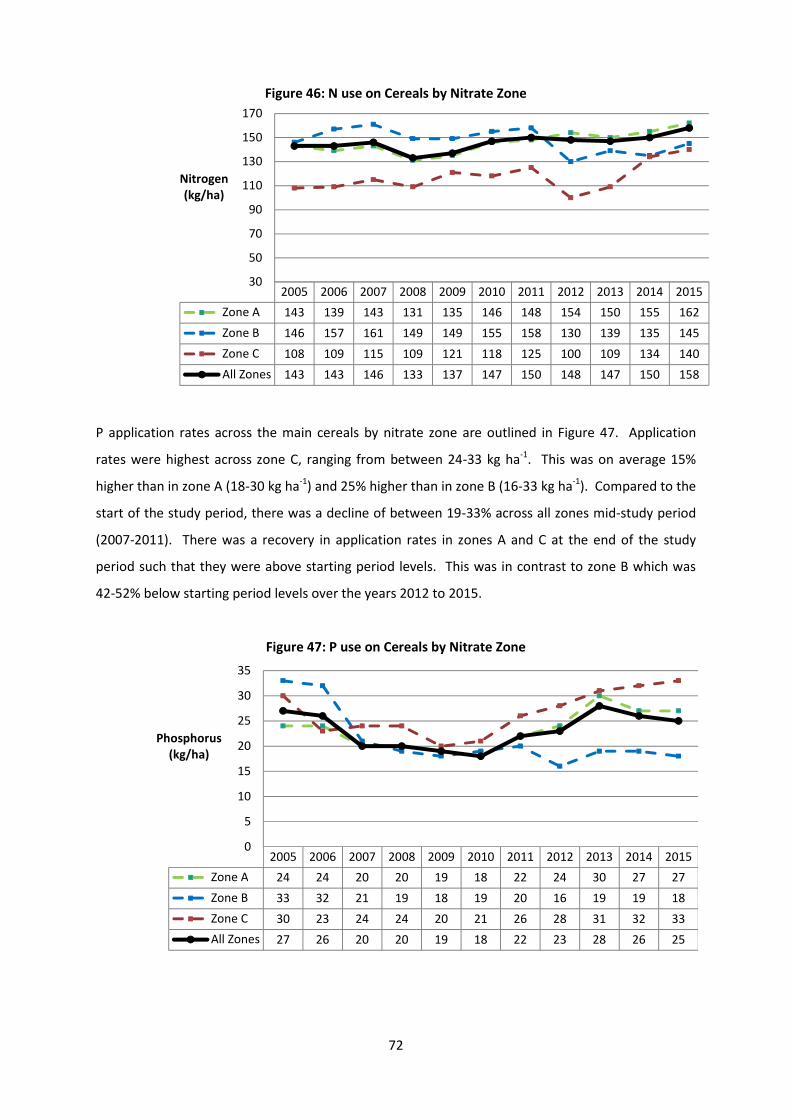
72
Figure 46: N use on Cereals by Nitrate Zone
P application rates across the main cereals by nitrate zone are outlined in Figure 47. Application
rates were highest across zone C, ranging from between 24-33 kg ha-1. This was on average 15%
higher than in zone A (18-30 kg ha-1) and 25% higher than in zone B (16-33 kg ha-1). Compared to the
start of the study period, there was a decline of between 19-33% across all zones mid-study period
(2007-2011). There was a recovery in application rates in zones A and C at the end of the study
period such that they were above starting period levels. This was in contrast to zone B which was
42-52% below starting period levels over the years 2012 to 2015.
Figure 47: P use on Cereals by Nitrate Zone
2005 2006 2007 2008 2009 2010 2011 2012 2013 2014 2015
Zone A 143 139 143 131 135 146 148 154 150 155 162
Zone B 146 157 161 149 149 155 158 130 139 135 145
Zone C 108 109 115 109 121 118 125 100 109 134 140
All Zones 143 143 146 133 137 147 150 148 147 150 158
30
50
70
90
110
130
150
170
Nitrogen(kg/ha)
2005 2006 2007 2008 2009 2010 2011 2012 2013 2014 2015
Zone A 24 24 20 20 19 18 22 24 30 27 27
Zone B 33 32 21 19 18 19 20 16 19 19 18
Zone C 30 23 24 24 20 21 26 28 31 32 33
All Zones 27 26 20 20 19 18 22 23 28 26 25
0
5
10
15
20
25
30
35
Phosphorus(kg/ha)
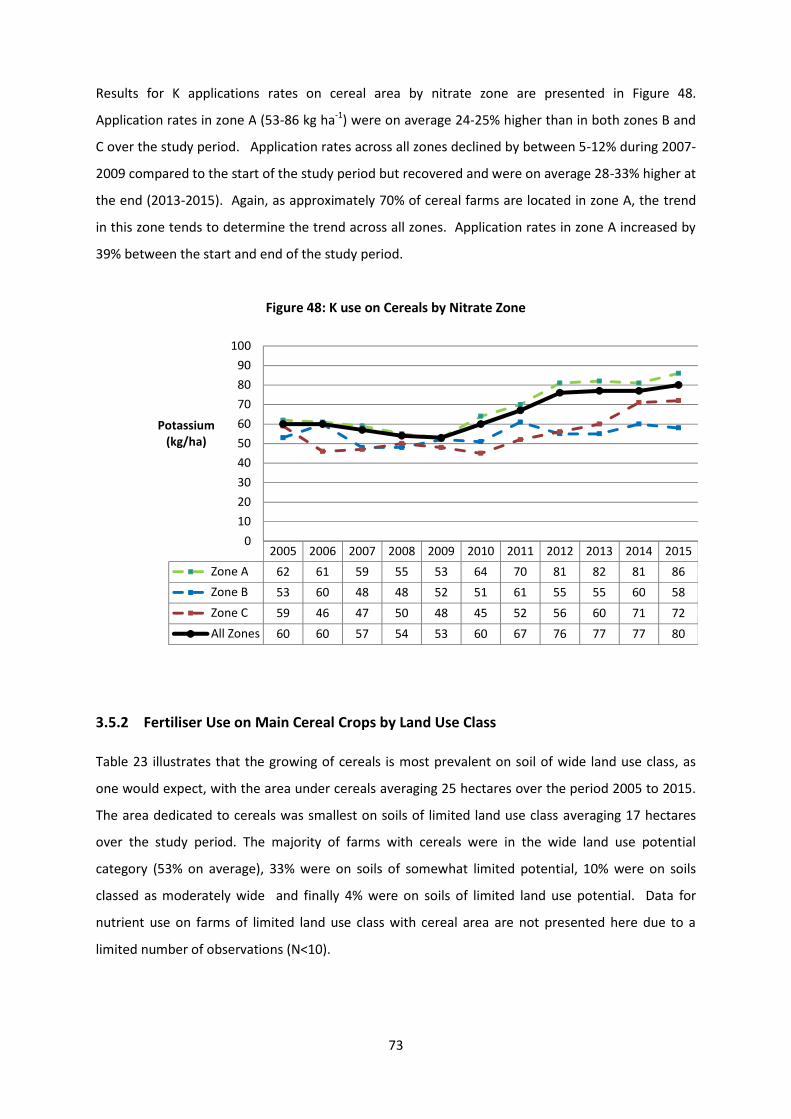
73
Results for K applications rates on cereal area by nitrate zone are presented in Figure 48.
Application rates in zone A (53-86 kg ha-1) were on average 24-25% higher than in both zones B and
C over the study period. Application rates across all zones declined by between 5-12% during 2007-
2009 compared to the start of the study period but recovered and were on average 28-33% higher at
the end (2013-2015). Again, as approximately 70% of cereal farms are located in zone A, the trend
in this zone tends to determine the trend across all zones. Application rates in zone A increased by
39% between the start and end of the study period.
Figure 48: K use on Cereals by Nitrate Zone
3.5.2 Fertiliser Use on Main Cereal Crops by Land Use Class
Table 23 illustrates that the growing of cereals is most prevalent on soil of wide land use class, as
one would expect, with the area under cereals averaging 25 hectares over the period 2005 to 2015.
The area dedicated to cereals was smallest on soils of limited land use class averaging 17 hectares
over the study period. The majority of farms with cereals were in the wide land use potential
category (53% on average), 33% were on soils of somewhat limited potential, 10% were on soils
classed as moderately wide and finally 4% were on soils of limited land use potential. Data for
nutrient use on farms of limited land use class with cereal area are not presented here due to a
limited number of observations (N<10).
2005 2006 2007 2008 2009 2010 2011 2012 2013 2014 2015
Zone A 62 61 59 55 53 64 70 81 82 81 86
Zone B 53 60 48 48 52 51 61 55 55 60 58
Zone C 59 46 47 50 48 45 52 56 60 71 72
All Zones 60 60 57 54 53 60 67 76 77 77 80
0
10
20
30
40
50
60
70
80
90
100
Potassium(kg/ha)
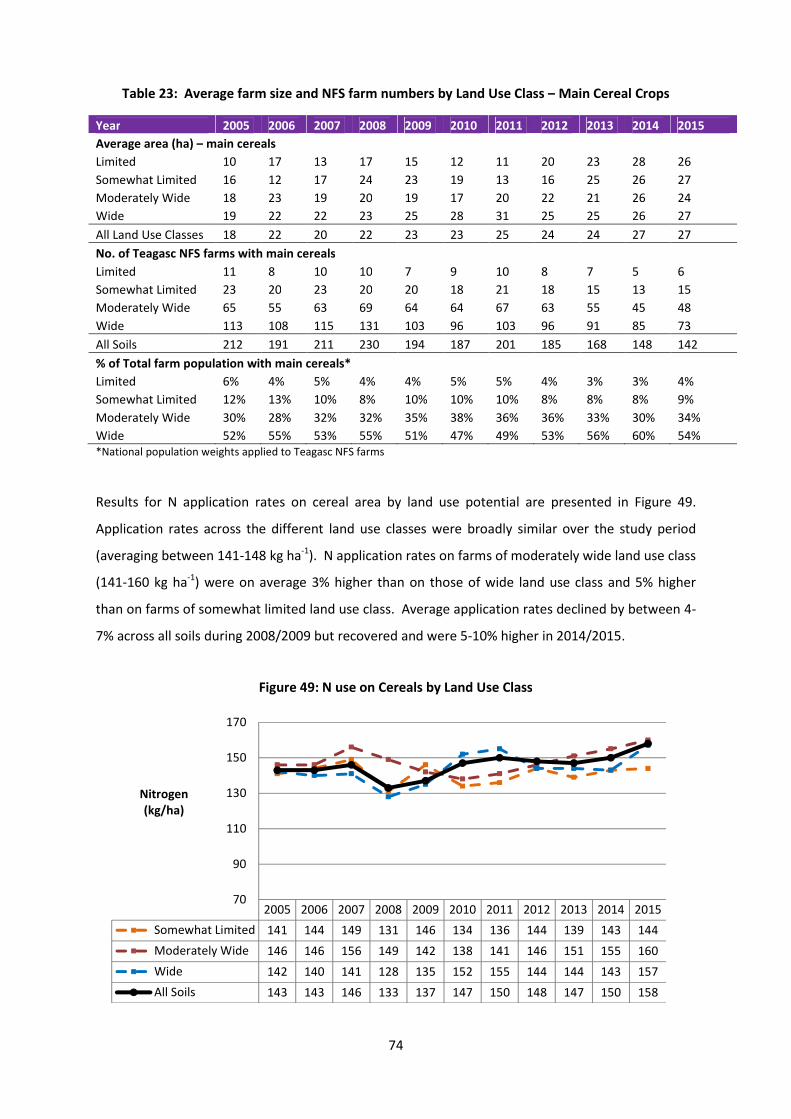
74
Table 23: Average farm size and NFS farm numbers by Land Use Class – Main Cereal Crops
Year 2005 2006 2007 2008 2009 2010 2011 2012 2013 2014 2015
Average area (ha) – main cereals
Limited 10 17 13 17 15 12 11 20 23 28 26
Somewhat Limited 16 12 17 24 23 19 13 16 25 26 27
Moderately Wide 18 23 19 20 19 17 20 22 21 26 24
Wide 19 22 22 23 25 28 31 25 25 26 27
All Land Use Classes 18 22 20 22 23 23 25 24 24 27 27
No. of Teagasc NFS farms with main cereals
Limited 11 8 10 10 7 9 10 8 7 5 6
Somewhat Limited 23 20 23 20 20 18 21 18 15 13 15
Moderately Wide 65 55 63 69 64 64 67 63 55 45 48
Wide 113 108 115 131 103 96 103 96 91 85 73
All Soils 212 191 211 230 194 187 201 185 168 148 142
% of Total farm population with main cereals*
Limited 6% 4% 5% 4% 4% 5% 5% 4% 3% 3% 4%
Somewhat Limited 12% 13% 10% 8% 10% 10% 10% 8% 8% 8% 9%
Moderately Wide 30% 28% 32% 32% 35% 38% 36% 36% 33% 30% 34%
Wide 52% 55% 53% 55% 51% 47% 49% 53% 56% 60% 54%*National population weights applied to Teagasc NFS farms
Results for N application rates on cereal area by land use potential are presented in Figure 49.
Application rates across the different land use classes were broadly similar over the study period
(averaging between 141-148 kg ha-1). N application rates on farms of moderately wide land use class
(141-160 kg ha-1) were on average 3% higher than on those of wide land use class and 5% higher
than on farms of somewhat limited land use class. Average application rates declined by between 4-
7% across all soils during 2008/2009 but recovered and were 5-10% higher in 2014/2015.
Figure 49: N use on Cereals by Land Use Class
2005 2006 2007 2008 2009 2010 2011 2012 2013 2014 2015
Somewhat Limited 141 144 149 131 146 134 136 144 139 143 144
Moderately Wide 146 146 156 149 142 138 141 146 151 155 160
Wide 142 140 141 128 135 152 155 144 144 143 157
All Soils 143 143 146 133 137 147 150 148 147 150 158
70
90
110
130
150
170
Nitrogen(kg/ha)

75
Figure 50 presents results for P application rates on cereal area by land use potential. P application
rates were highest on soils of wide land use class (19-28 kg ha-1), which were on average 6% higher
than on farms of somewhat limited land use class and 16% higher than on farms of moderately wide
land use class. Average application rates declined by between 15-33% over the 2007-2012 period
compared to starting period levels but recovered towards the end of the study period (except for
those farms in the somewhat limited category).
Figure 50: P use on Cereals by Land Use Class
A 35% decline in P application rates is evident on soils of somewhat limited use over the period.
Similarly, on soils of wide use potential there was a 32% decline in use from 2005 to 2010 with
recovery to 2015 where the average amount applied stood at 26 kg ha-1 only 2kg ha-1 less than in
2005. Figure 51 indicates a 33% increase in K use over the period with an average application rate
across all soil groups of 66 kg ha-1 in 2015. A steady increase is evident from 2009 in particular with
average usage 51% higher in 2015 than 2009. Across the individual groups, K use on soils of wide
use class increased by 39% over the period to 79 kg ha-1 with a similar increase evident (38%) on soils
of moderately limited use where the average rate applied was 76 kg ha-1. K usage was typically 12%
lower on soils of limited use compared to all others but an 87% increase is evident from 2009. A 9%
decline in usage is reported on soils of somewhat limited use where the average application rate
reported in 2015 was 68 kg ha-1.
2005 2006 2007 2008 2009 2010 2011 2012 2013 2014 2015
Somewhat Limited 31 26 17 17 19 20 27 24 27 20 20
Moderately Wide 22 24 16 14 14 17 21 23 25 27 24
Wide 28 26 23 23 21 19 21 23 28 25 26
All Soils 27 26 20 20 19 18 22 23 28 26 25
10
20
30
40
Potassium(kg/ha)
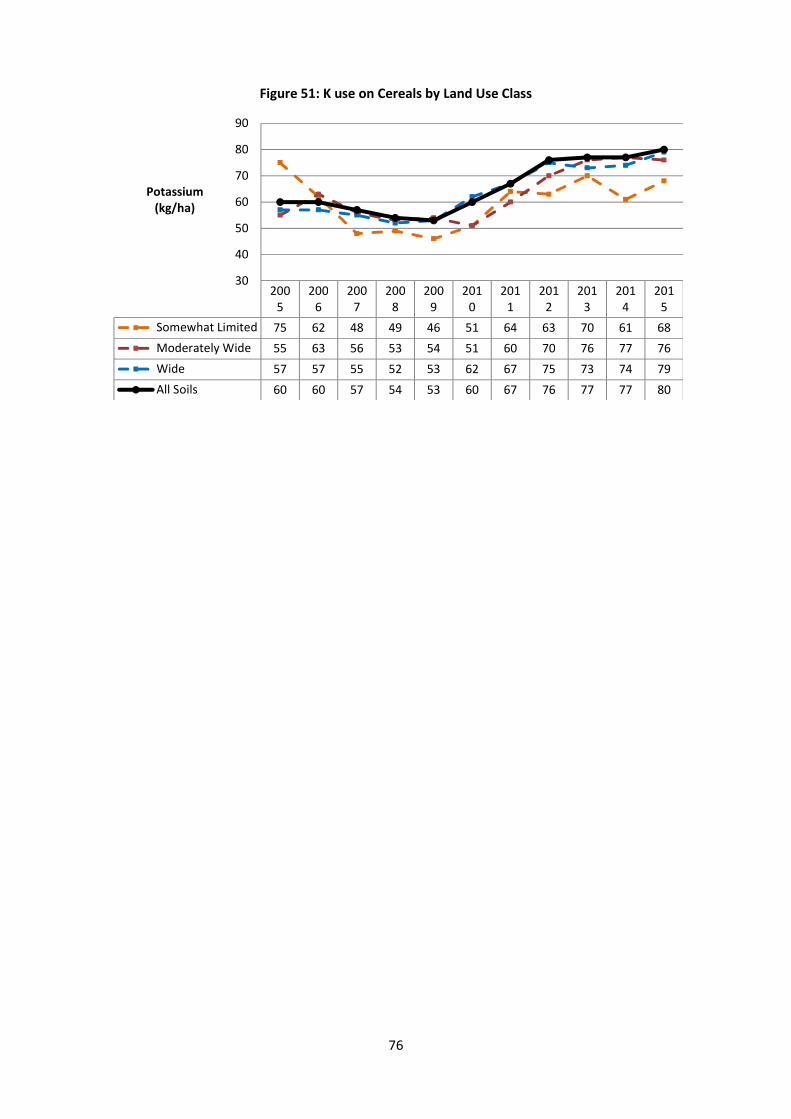
76
Figure 51: K use on Cereals by Land Use Class
2005
2006
2007
2008
2009
2010
2011
2012
2013
2014
2015
Somewhat Limited 75 62 48 49 46 51 64 63 70 61 68
Moderately Wide 55 63 56 53 54 51 60 70 76 77 76
Wide 57 57 55 52 53 62 67 75 73 74 79
All Soils 60 60 57 54 53 60 67 76 77 77 80
30
40
50
60
70
80
90
Potassium(kg/ha)
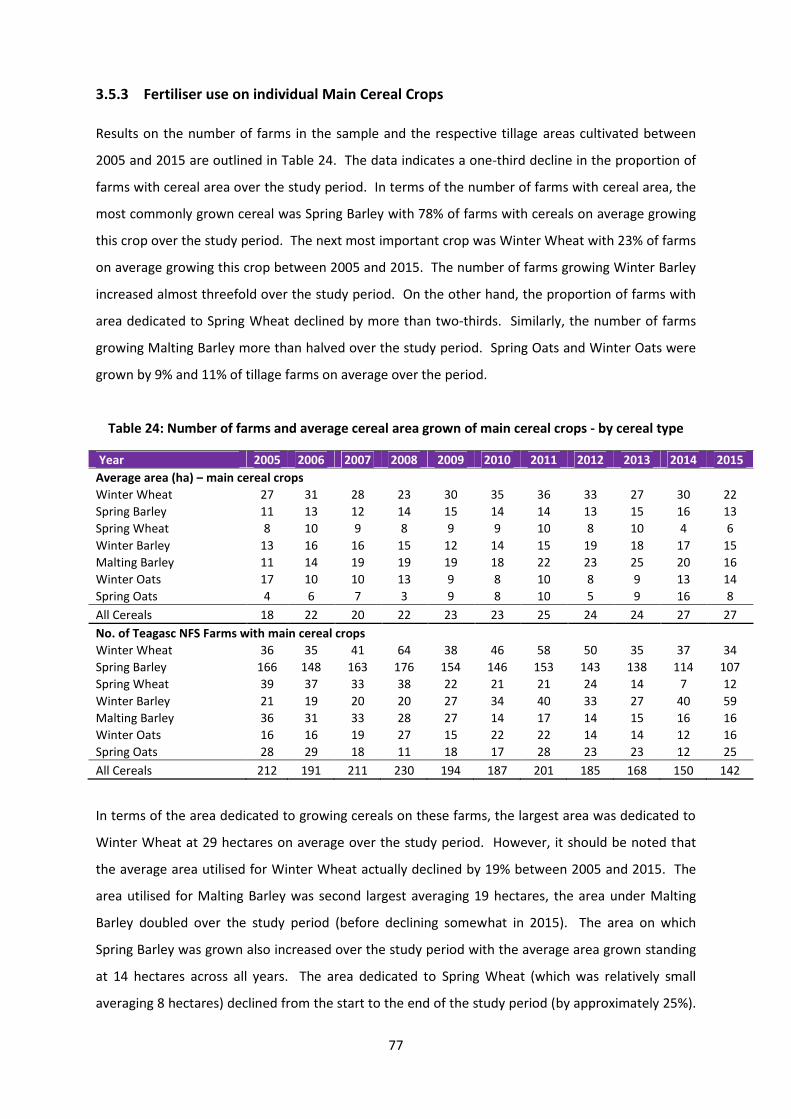
77
3.5.3 Fertiliser use on individual Main Cereal Crops
Results on the number of farms in the sample and the respective tillage areas cultivated between
2005 and 2015 are outlined in Table 24. The data indicates a one-third decline in the proportion of
farms with cereal area over the study period. In terms of the number of farms with cereal area, the
most commonly grown cereal was Spring Barley with 78% of farms with cereals on average growing
this crop over the study period. The next most important crop was Winter Wheat with 23% of farms
on average growing this crop between 2005 and 2015. The number of farms growing Winter Barley
increased almost threefold over the study period. On the other hand, the proportion of farms with
area dedicated to Spring Wheat declined by more than two-thirds. Similarly, the number of farms
growing Malting Barley more than halved over the study period. Spring Oats and Winter Oats were
grown by 9% and 11% of tillage farms on average over the period.
Table 24: Number of farms and average cereal area grown of main cereal crops - by cereal type
Year 2005 2006 2007 2008 2009 2010 2011 2012 2013 2014 2015
Average area (ha) – main cereal crops
Winter Wheat 27 31 28 23 30 35 36 33 27 30 22
Spring Barley 11 13 12 14 15 14 14 13 15 16 13
Spring Wheat 8 10 9 8 9 9 10 8 10 4 6
Winter Barley 13 16 16 15 12 14 15 19 18 17 15
Malting Barley 11 14 19 19 19 18 22 23 25 20 16
Winter Oats 17 10 10 13 9 8 10 8 9 13 14
Spring Oats 4 6 7 3 9 8 10 5 9 16 8
All Cereals 18 22 20 22 23 23 25 24 24 27 27
No. of Teagasc NFS Farms with main cereal crops
Winter Wheat 36 35 41 64 38 46 58 50 35 37 34
Spring Barley 166 148 163 176 154 146 153 143 138 114 107
Spring Wheat 39 37 33 38 22 21 21 24 14 7 12
Winter Barley 21 19 20 20 27 34 40 33 27 40 59
Malting Barley 36 31 33 28 27 14 17 14 15 16 16
Winter Oats 16 16 19 27 15 22 22 14 14 12 16
Spring Oats 28 29 18 11 18 17 28 23 23 12 25
All Cereals 212 191 211 230 194 187 201 185 168 150 142
In terms of the area dedicated to growing cereals on these farms, the largest area was dedicated to
Winter Wheat at 29 hectares on average over the study period. However, it should be noted that
the average area utilised for Winter Wheat actually declined by 19% between 2005 and 2015. The
area utilised for Malting Barley was second largest averaging 19 hectares, the area under Malting
Barley doubled over the study period (before declining somewhat in 2015). The area on which
Spring Barley was grown also increased over the study period with the average area grown standing
at 14 hectares across all years. The area dedicated to Spring Wheat (which was relatively small
averaging 8 hectares) declined from the start to the end of the study period (by approximately 25%).
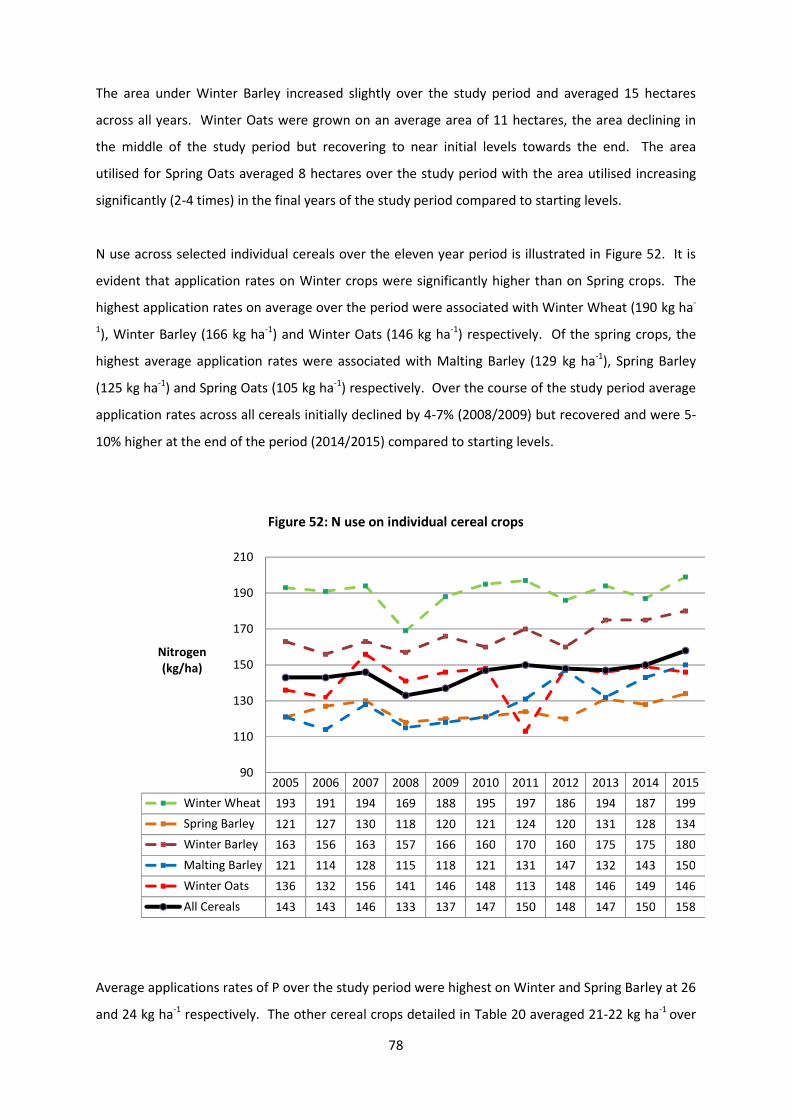
78
The area under Winter Barley increased slightly over the study period and averaged 15 hectares
across all years. Winter Oats were grown on an average area of 11 hectares, the area declining in
the middle of the study period but recovering to near initial levels towards the end. The area
utilised for Spring Oats averaged 8 hectares over the study period with the area utilised increasing
significantly (2-4 times) in the final years of the study period compared to starting levels.
N use across selected individual cereals over the eleven year period is illustrated in Figure 52. It is
evident that application rates on Winter crops were significantly higher than on Spring crops. The
highest application rates on average over the period were associated with Winter Wheat (190 kg ha-
1), Winter Barley (166 kg ha-1) and Winter Oats (146 kg ha-1) respectively. Of the spring crops, the
highest average application rates were associated with Malting Barley (129 kg ha-1), Spring Barley
(125 kg ha-1) and Spring Oats (105 kg ha-1) respectively. Over the course of the study period average
application rates across all cereals initially declined by 4-7% (2008/2009) but recovered and were 5-
10% higher at the end of the period (2014/2015) compared to starting levels.
Figure 52: N use on individual cereal crops
Average applications rates of P over the study period were highest on Winter and Spring Barley at 26
and 24 kg ha-1 respectively. The other cereal crops detailed in Table 20 averaged 21-22 kg ha-1 over
2005 2006 2007 2008 2009 2010 2011 2012 2013 2014 2015
Winter Wheat 193 191 194 169 188 195 197 186 194 187 199
Spring Barley 121 127 130 118 120 121 124 120 131 128 134
Winter Barley 163 156 163 157 166 160 170 160 175 175 180
Malting Barley 121 114 128 115 118 121 131 147 132 143 150
Winter Oats 136 132 156 141 146 148 113 148 146 149 146
All Cereals 143 143 146 133 137 147 150 148 147 150 158
90
110
130
150
170
190
210
Nitrogen(kg/ha)

79
the period. Results indicate that P use across selected cereals declined by between 19-33% during
2007-2011 compared to starting period levels. There was a recovery in application rates in 2013
(except for Winter Oats) followed by a decline in 2014/2015 (4-7% lower on average compared to
starting period levels). Malting Barley went against the general trend showing an increase of
between 30-55% between 2012 and 2015 compared to starting period levels. On the other hand,
application rates on Winter Oats (at 20 kg ha-1) were down 43% in 2015 compared to 2005.
Figure 53: P use on individual cereals crops
Average K application rates were highest across winter crops as illustrated by Figure 54. Winter
Wheat and Barley had similar average applications rates over the study period at 77 kg ha-1, followed
by Winter Oats at 69 kg ha-1. Of the spring crops, average application rates were highest on Malting
Barley (66 kg ha-1) followed by Spring Barley (58 kg ha-1) and Spring Oats (55 kg ha-1). Winter Wheat
and Malting Barley showed consistent increases in application rates over the study period, indeed
application rates for these crops were over 50% higher towards the end of the period (2012-2015)
compared to at the outset. Application rates of K on Spring and Winter Barley declined by between
12-38% during the middle of the study period (2008-2010) before a recovery was seen for Spring
Barley with K application rates 19% higher at the end of the study period. This was in contrast to
Winter Barley where K application rates were 5-7% lower at the end of the period (2013-2015)
compared to the start. K application rates on Spring and Winter Oats declined by between 5-40%
2005 2006 2007 2008 2009 2010 2011 2012 2013 2014 2015
Winter Wheat 28 29 20 19 18 14 19 17 31 19 25
Spring Barley 25 25 22 21 21 20 24 26 27 28 25
Winter Barley 32 37 22 24 11 20 21 30 31 29 26
Malting Barley 20 19 18 16 14 20 20 26 28 31 30
Winter Oats 37 20 15 23 17 19 18 25 26 25 21
All Cereals 27 26 20 20 19 18 22 23 28 26 25
0
5
10
15
20
25
30
35
40
Phosphorus(kg/ha)

80
during 2006-2011 (except for Spring Oats in 2007). K application rates across both crops recovered
at the end of the study period and were between 28-44% higher in 2014-2015.
Figure 54: K use on individual Cereals crops
2005 2006 2007 2008 2009 2010 2011 2012 2013 2014 2015
Winter Wheat 58 68 58 60 68 81 86 94 90 85 94
Spring Barley 57 58 55 50 48 48 57 61 70 68 68
Winter Barley 85 88 78 73 53 68 79 88 79 79 81
Malting Barley 52 51 56 49 52 64 63 78 89 85 89
Winter Oats 75 60 54 64 61 63 52 72 73 84 100
All Cereals 60 60 57 54 53 60 67 76 77 77 80
30
40
50
60
70
80
90
100
110
Potassium(kg/ha)
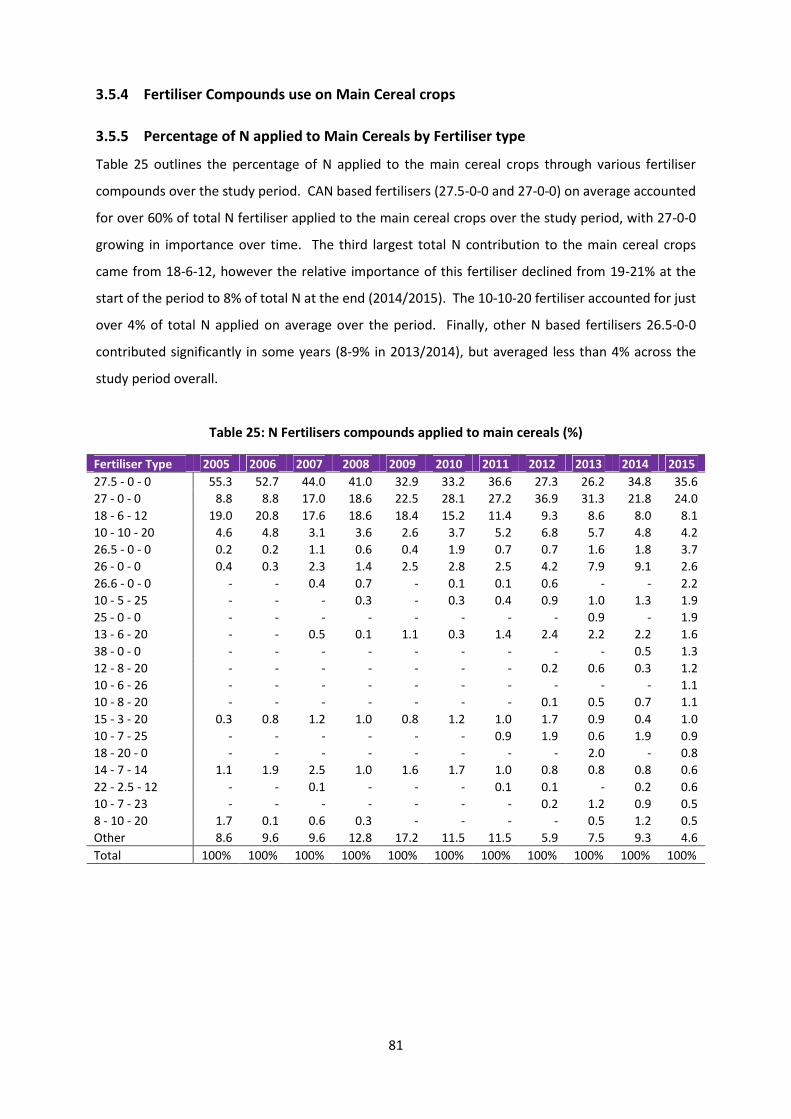
81
3.5.4 Fertiliser Compounds use on Main Cereal crops
3.5.5 Percentage of N applied to Main Cereals by Fertiliser type
Table 25 outlines the percentage of N applied to the main cereal crops through various fertiliser
compounds over the study period. CAN based fertilisers (27.5-0-0 and 27-0-0) on average accounted
for over 60% of total N fertiliser applied to the main cereal crops over the study period, with 27-0-0
growing in importance over time. The third largest total N contribution to the main cereal crops
came from 18-6-12, however the relative importance of this fertiliser declined from 19-21% at the
start of the period to 8% of total N at the end (2014/2015). The 10-10-20 fertiliser accounted for just
over 4% of total N applied on average over the period. Finally, other N based fertilisers 26.5-0-0
contributed significantly in some years (8-9% in 2013/2014), but averaged less than 4% across the
study period overall.
Table 25: N Fertilisers compounds applied to main cereals (%)
Fertiliser Type 2005 2006 2007 2008 2009 2010 2011 2012 2013 2014 2015
27.5 - 0 - 0 55.3 52.7 44.0 41.0 32.9 33.2 36.6 27.3 26.2 34.8 35.6
27 - 0 - 0 8.8 8.8 17.0 18.6 22.5 28.1 27.2 36.9 31.3 21.8 24.0
18 - 6 - 12 19.0 20.8 17.6 18.6 18.4 15.2 11.4 9.3 8.6 8.0 8.1
10 - 10 - 20 4.6 4.8 3.1 3.6 2.6 3.7 5.2 6.8 5.7 4.8 4.2
26.5 - 0 - 0 0.2 0.2 1.1 0.6 0.4 1.9 0.7 0.7 1.6 1.8 3.7
26 - 0 - 0 0.4 0.3 2.3 1.4 2.5 2.8 2.5 4.2 7.9 9.1 2.6
26.6 - 0 - 0 - - 0.4 0.7 - 0.1 0.1 0.6 - - 2.2
10 - 5 - 25 - - - 0.3 - 0.3 0.4 0.9 1.0 1.3 1.9
25 - 0 - 0 - - - - - - - - 0.9 - 1.9
13 - 6 - 20 - - 0.5 0.1 1.1 0.3 1.4 2.4 2.2 2.2 1.6
38 - 0 - 0 - - - - - - - - - 0.5 1.3
12 - 8 - 20 - - - - - - - 0.2 0.6 0.3 1.2
10 - 6 - 26 - - - - - - - - - - 1.1
10 - 8 - 20 - - - - - - - 0.1 0.5 0.7 1.1
15 - 3 - 20 0.3 0.8 1.2 1.0 0.8 1.2 1.0 1.7 0.9 0.4 1.0
10 - 7 - 25 - - - - - - 0.9 1.9 0.6 1.9 0.9
18 - 20 - 0 - - - - - - - - 2.0 - 0.8
14 - 7 - 14 1.1 1.9 2.5 1.0 1.6 1.7 1.0 0.8 0.8 0.8 0.6
22 - 2.5 - 12 - - 0.1 - - - 0.1 0.1 - 0.2 0.6
10 - 7 - 23 - - - - - - - 0.2 1.2 0.9 0.5
8 - 10 - 20 1.7 0.1 0.6 0.3 - - - - 0.5 1.2 0.5
Other 8.6 9.6 9.6 12.8 17.2 11.5 11.5 5.9 7.5 9.3 4.6
Total 100% 100% 100% 100% 100% 100% 100% 100% 100% 100% 100%
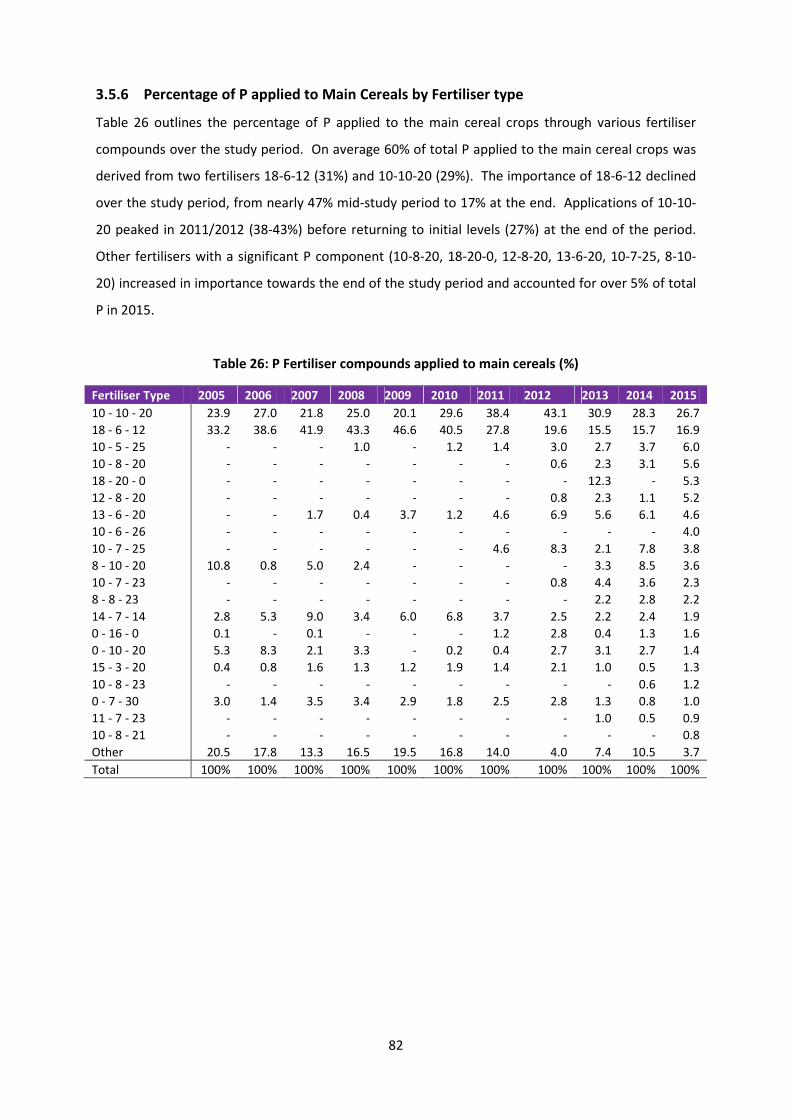
82
3.5.6 Percentage of P applied to Main Cereals by Fertiliser type
Table 26 outlines the percentage of P applied to the main cereal crops through various fertiliser
compounds over the study period. On average 60% of total P applied to the main cereal crops was
derived from two fertilisers 18-6-12 (31%) and 10-10-20 (29%). The importance of 18-6-12 declined
over the study period, from nearly 47% mid-study period to 17% at the end. Applications of 10-10-
20 peaked in 2011/2012 (38-43%) before returning to initial levels (27%) at the end of the period.
Other fertilisers with a significant P component (10-8-20, 18-20-0, 12-8-20, 13-6-20, 10-7-25, 8-10-
20) increased in importance towards the end of the study period and accounted for over 5% of total
P in 2015.
Table 26: P Fertiliser compounds applied to main cereals (%)
Fertiliser Type 2005 2006 2007 2008 2009 2010 2011 2012 2013 2014 2015
10 - 10 - 20 23.9 27.0 21.8 25.0 20.1 29.6 38.4 43.1 30.9 28.3 26.7
18 - 6 - 12 33.2 38.6 41.9 43.3 46.6 40.5 27.8 19.6 15.5 15.7 16.9
10 - 5 - 25 - - - 1.0 - 1.2 1.4 3.0 2.7 3.7 6.0
10 - 8 - 20 - - - - - - - 0.6 2.3 3.1 5.6
18 - 20 - 0 - - - - - - - - 12.3 - 5.3
12 - 8 - 20 - - - - - - - 0.8 2.3 1.1 5.2
13 - 6 - 20 - - 1.7 0.4 3.7 1.2 4.6 6.9 5.6 6.1 4.6
10 - 6 - 26 - - - - - - - - - - 4.0
10 - 7 - 25 - - - - - - 4.6 8.3 2.1 7.8 3.8
8 - 10 - 20 10.8 0.8 5.0 2.4 - - - - 3.3 8.5 3.6
10 - 7 - 23 - - - - - - - 0.8 4.4 3.6 2.3
8 - 8 - 23 - - - - - - - - 2.2 2.8 2.2
14 - 7 - 14 2.8 5.3 9.0 3.4 6.0 6.8 3.7 2.5 2.2 2.4 1.9
0 - 16 - 0 0.1 - 0.1 - - - 1.2 2.8 0.4 1.3 1.6
0 - 10 - 20 5.3 8.3 2.1 3.3 - 0.2 0.4 2.7 3.1 2.7 1.4
15 - 3 - 20 0.4 0.8 1.6 1.3 1.2 1.9 1.4 2.1 1.0 0.5 1.3
10 - 8 - 23 - - - - - - - - - 0.6 1.2
0 - 7 - 30 3.0 1.4 3.5 3.4 2.9 1.8 2.5 2.8 1.3 0.8 1.0
11 - 7 - 23 - - - - - - - - 1.0 0.5 0.9
10 - 8 - 21 - - - - - - - - - - 0.8
Other 20.5 17.8 13.3 16.5 19.5 16.8 14.0 4.0 7.4 10.5 3.7
Total 100% 100% 100% 100% 100% 100% 100% 100% 100% 100% 100%
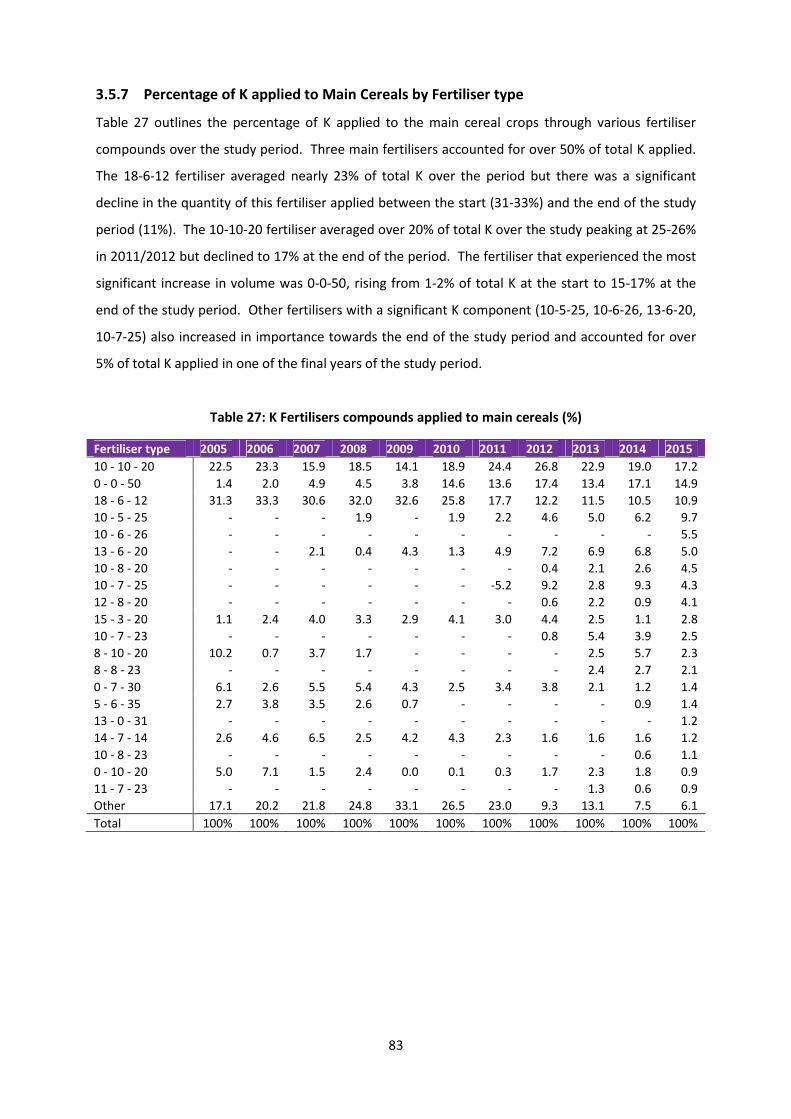
83
3.5.7 Percentage of K applied to Main Cereals by Fertiliser type
Table 27 outlines the percentage of K applied to the main cereal crops through various fertiliser
compounds over the study period. Three main fertilisers accounted for over 50% of total K applied.
The 18-6-12 fertiliser averaged nearly 23% of total K over the period but there was a significant
decline in the quantity of this fertiliser applied between the start (31-33%) and the end of the study
period (11%). The 10-10-20 fertiliser averaged over 20% of total K over the study peaking at 25-26%
in 2011/2012 but declined to 17% at the end of the period. The fertiliser that experienced the most
significant increase in volume was 0-0-50, rising from 1-2% of total K at the start to 15-17% at the
end of the study period. Other fertilisers with a significant K component (10-5-25, 10-6-26, 13-6-20,
10-7-25) also increased in importance towards the end of the study period and accounted for over
5% of total K applied in one of the final years of the study period.
Table 27: K Fertilisers compounds applied to main cereals (%)
Fertiliser type 2005 2006 2007 2008 2009 2010 2011 2012 2013 2014 2015
10 - 10 - 20 22.5 23.3 15.9 18.5 14.1 18.9 24.4 26.8 22.9 19.0 17.2
0 - 0 - 50 1.4 2.0 4.9 4.5 3.8 14.6 13.6 17.4 13.4 17.1 14.9
18 - 6 - 12 31.3 33.3 30.6 32.0 32.6 25.8 17.7 12.2 11.5 10.5 10.9
10 - 5 - 25 - - - 1.9 - 1.9 2.2 4.6 5.0 6.2 9.7
10 - 6 - 26 - - - - - - - - - - 5.5
13 - 6 - 20 - - 2.1 0.4 4.3 1.3 4.9 7.2 6.9 6.8 5.0
10 - 8 - 20 - - - - - - - 0.4 2.1 2.6 4.5
10 - 7 - 25 - - - - - - -5.2 9.2 2.8 9.3 4.3
12 - 8 - 20 - - - - - - - 0.6 2.2 0.9 4.1
15 - 3 - 20 1.1 2.4 4.0 3.3 2.9 4.1 3.0 4.4 2.5 1.1 2.8
10 - 7 - 23 - - - - - - - 0.8 5.4 3.9 2.5
8 - 10 - 20 10.2 0.7 3.7 1.7 - - - - 2.5 5.7 2.3
8 - 8 - 23 - - - - - - - - 2.4 2.7 2.1
0 - 7 - 30 6.1 2.6 5.5 5.4 4.3 2.5 3.4 3.8 2.1 1.2 1.4
5 - 6 - 35 2.7 3.8 3.5 2.6 0.7 - - - - 0.9 1.4
13 - 0 - 31 - - - - - - - - - - 1.2
14 - 7 - 14 2.6 4.6 6.5 2.5 4.2 4.3 2.3 1.6 1.6 1.6 1.2
10 - 8 - 23 - - - - - - - - - 0.6 1.1
0 - 10 - 20 5.0 7.1 1.5 2.4 0.0 0.1 0.3 1.7 2.3 1.8 0.9
11 - 7 - 23 - - - - - - - - 1.3 0.6 0.9
Other 17.1 20.2 21.8 24.8 33.1 26.5 23.0 9.3 13.1 7.5 6.1
Total 100% 100% 100% 100% 100% 100% 100% 100% 100% 100% 100%
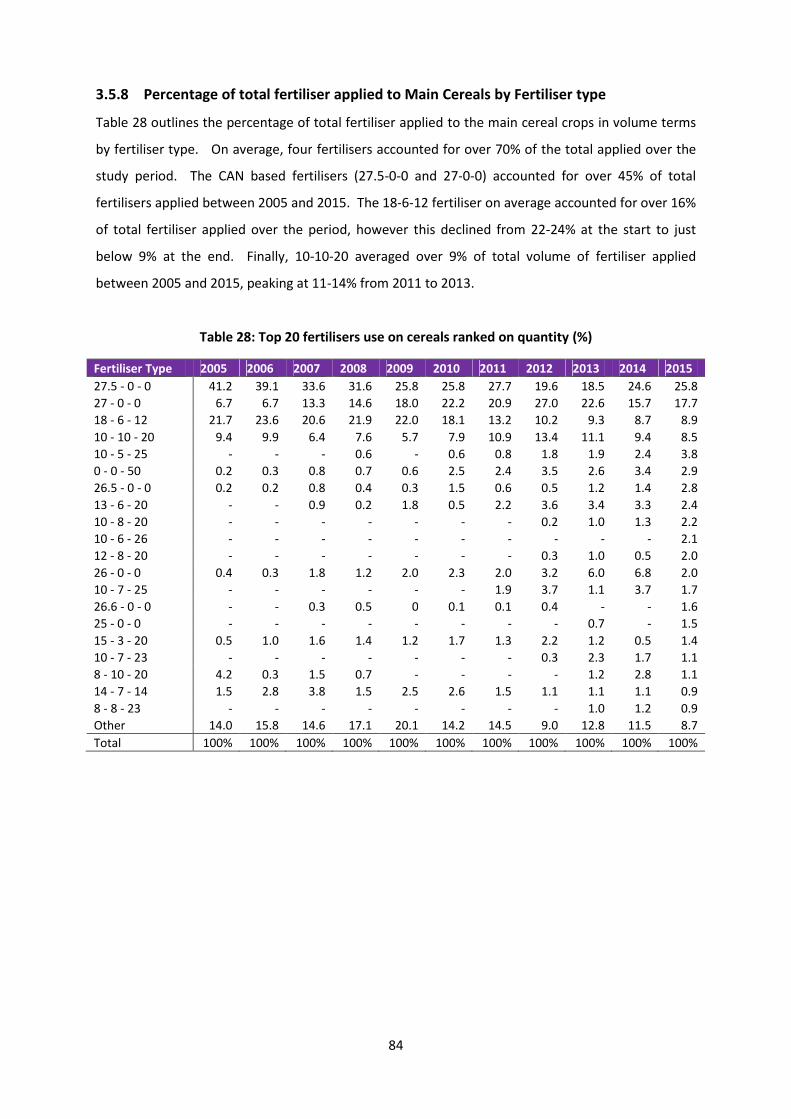
84
3.5.8 Percentage of total fertiliser applied to Main Cereals by Fertiliser type
Table 28 outlines the percentage of total fertiliser applied to the main cereal crops in volume terms
by fertiliser type. On average, four fertilisers accounted for over 70% of the total applied over the
study period. The CAN based fertilisers (27.5-0-0 and 27-0-0) accounted for over 45% of total
fertilisers applied between 2005 and 2015. The 18-6-12 fertiliser on average accounted for over 16%
of total fertiliser applied over the period, however this declined from 22-24% at the start to just
below 9% at the end. Finally, 10-10-20 averaged over 9% of total volume of fertiliser applied
between 2005 and 2015, peaking at 11-14% from 2011 to 2013.
Table 28: Top 20 fertilisers use on cereals ranked on quantity (%)
Fertiliser Type 2005 2006 2007 2008 2009 2010 2011 2012 2013 2014 2015
27.5 - 0 - 0 41.2 39.1 33.6 31.6 25.8 25.8 27.7 19.6 18.5 24.6 25.8
27 - 0 - 0 6.7 6.7 13.3 14.6 18.0 22.2 20.9 27.0 22.6 15.7 17.7
18 - 6 - 12 21.7 23.6 20.6 21.9 22.0 18.1 13.2 10.2 9.3 8.7 8.9
10 - 10 - 20 9.4 9.9 6.4 7.6 5.7 7.9 10.9 13.4 11.1 9.4 8.5
10 - 5 - 25 - - - 0.6 - 0.6 0.8 1.8 1.9 2.4 3.8
0 - 0 - 50 0.2 0.3 0.8 0.7 0.6 2.5 2.4 3.5 2.6 3.4 2.9
26.5 - 0 - 0 0.2 0.2 0.8 0.4 0.3 1.5 0.6 0.5 1.2 1.4 2.8
13 - 6 - 20 - - 0.9 0.2 1.8 0.5 2.2 3.6 3.4 3.3 2.4
10 - 8 - 20 - - - - - - - 0.2 1.0 1.3 2.2
10 - 6 - 26 - - - - - - - - - - 2.1
12 - 8 - 20 - - - - - - - 0.3 1.0 0.5 2.0
26 - 0 - 0 0.4 0.3 1.8 1.2 2.0 2.3 2.0 3.2 6.0 6.8 2.0
10 - 7 - 25 - - - - - - 1.9 3.7 1.1 3.7 1.7
26.6 - 0 - 0 - - 0.3 0.5 0 0.1 0.1 0.4 - - 1.6
25 - 0 - 0 - - - - - - - - 0.7 - 1.5
15 - 3 - 20 0.5 1.0 1.6 1.4 1.2 1.7 1.3 2.2 1.2 0.5 1.4
10 - 7 - 23 - - - - - - - 0.3 2.3 1.7 1.1
8 - 10 - 20 4.2 0.3 1.5 0.7 - - - - 1.2 2.8 1.1
14 - 7 - 14 1.5 2.8 3.8 1.5 2.5 2.6 1.5 1.1 1.1 1.1 0.9
8 - 8 - 23 - - - - - - - - 1.0 1.2 0.9
Other 14.0 15.8 14.6 17.1 20.1 14.2 14.5 9.0 12.8 11.5 8.7
Total 100% 100% 100% 100% 100% 100% 100% 100% 100% 100% 100%
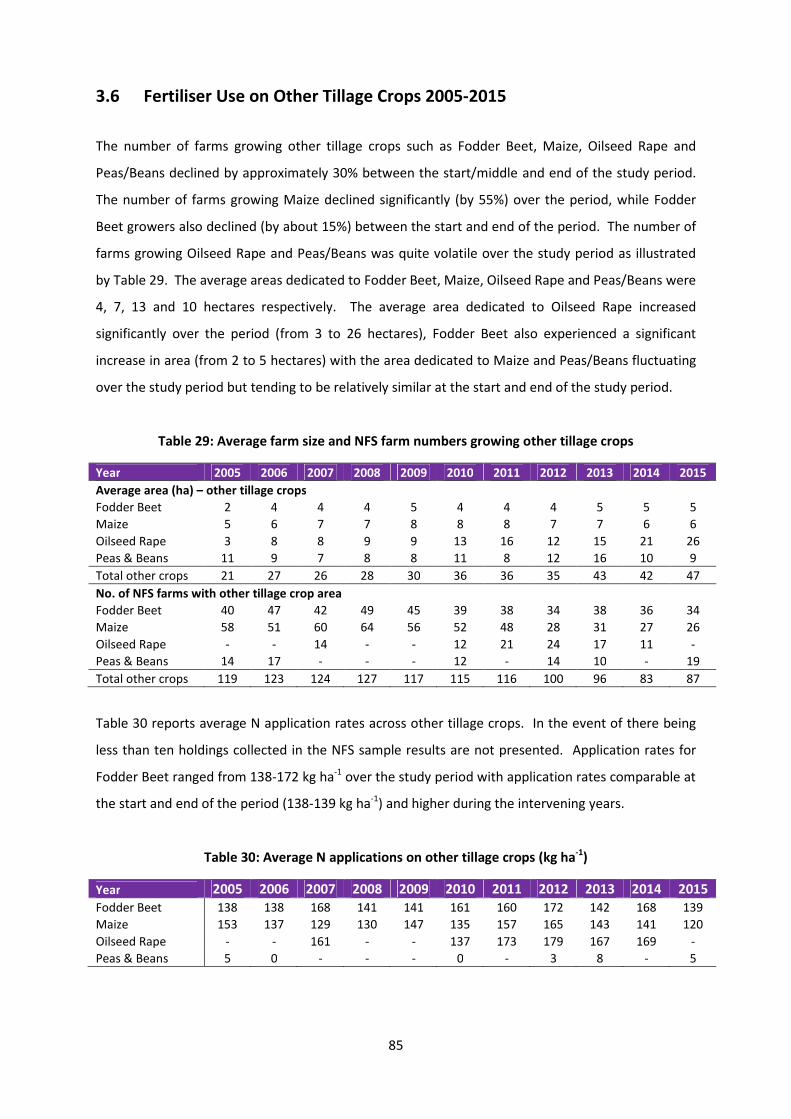
85
3.6 Fertiliser Use on Other Tillage Crops 2005-2015
The number of farms growing other tillage crops such as Fodder Beet, Maize, Oilseed Rape and
Peas/Beans declined by approximately 30% between the start/middle and end of the study period.
The number of farms growing Maize declined significantly (by 55%) over the period, while Fodder
Beet growers also declined (by about 15%) between the start and end of the period. The number of
farms growing Oilseed Rape and Peas/Beans was quite volatile over the study period as illustrated
by Table 29. The average areas dedicated to Fodder Beet, Maize, Oilseed Rape and Peas/Beans were
4, 7, 13 and 10 hectares respectively. The average area dedicated to Oilseed Rape increased
significantly over the period (from 3 to 26 hectares), Fodder Beet also experienced a significant
increase in area (from 2 to 5 hectares) with the area dedicated to Maize and Peas/Beans fluctuating
over the study period but tending to be relatively similar at the start and end of the study period.
Table 29: Average farm size and NFS farm numbers growing other tillage crops
Year 2005 2006 2007 2008 2009 2010 2011 2012 2013 2014 2015
Average area (ha) – other tillage crops
Fodder Beet 2 4 4 4 5 4 4 4 5 5 5
Maize 5 6 7 7 8 8 8 7 7 6 6
Oilseed Rape 3 8 8 9 9 13 16 12 15 21 26
Peas & Beans 11 9 7 8 8 11 8 12 16 10 9
Total other crops 21 27 26 28 30 36 36 35 43 42 47
No. of NFS farms with other tillage crop area
Fodder Beet 40 47 42 49 45 39 38 34 38 36 34
Maize 58 51 60 64 56 52 48 28 31 27 26
Oilseed Rape - - 14 - - 12 21 24 17 11 -
Peas & Beans 14 17 - - - 12 - 14 10 - 19
Total other crops 119 123 124 127 117 115 116 100 96 83 87
Table 30 reports average N application rates across other tillage crops. In the event of there being
less than ten holdings collected in the NFS sample results are not presented. Application rates for
Fodder Beet ranged from 138-172 kg ha-1 over the study period with application rates comparable at
the start and end of the period (138-139 kg ha-1) and higher during the intervening years.
Table 30: Average N applications on other tillage crops (kg ha-1)
Year 2005 2006 2007 2008 2009 2010 2011 2012 2013 2014 2015Fodder Beet 138 138 168 141 141 161 160 172 142 168 139
Maize 153 137 129 130 147 135 157 165 143 141 120
Oilseed Rape - - 161 - - 137 173 179 167 169 -
Peas & Beans 5 0 - - - 0 - 3 8 - 5

86
Application rates for maize ranged from 120-165 kg ha-1 over the period, with highest rates recorded
in 2011/2012 (157-165 kg ha-1) and lowest at the end of the period (120 kg ha-1). N applied to
Oilseed Rape ranged from 137-179 kg ha-1 for reported years. Finally, application rates of N for
Peas/Beans ranged from 0 to 33 kg ha-1 for reported years as outlined in Table 31.
P applications across other tillage crops are reported in Table 31. Application rates for Fodder Beet
ranged from 43-54 kg ha-1 over the study period with application rates comparable at the start and
end of the period and generally lower during the intervening years. P application rates for Maize
ranged from 27-39 kg ha-1 with highest rates recorded at the start and end of the study period. P
applied to Oilseed Rape ranged from 11-32 kg ha-1 for reported years. Finally, application rates of P
for Peas and Beans ranged from 14 to 24 kg ha-1 over the period 2005-2015 as outlined in Table 31.
Table 31: Average P applications on other tillage crops (kg ha-1)
Year 2005 2006 2007 2008 2009 2010 2011 2012 2013 2014 2015
Fodder Beet 54 49 43 44 48 47 51 45 45 50 53
Maize 38 36 32 39 34 33 31 27 38 36 37
Oilseed Rape - - 27 - - 11 23 24 32 18 -
Peas & Beans 14 18 - - - 20 - 24 18 - 19
Table 32 reports K application rates across other tillage crops with rates for Fodder Beet ranging
from 153-210 kg ha-1, comparable at the start and end of the study period. Application rates for
Maize ranged from 75-95 kg ha-1 over the period with highest rates recorded for 2013/2014 (94-95
kg ha-1) and lowest rates for 2006/2007 (75 kg ha-1). K rates applied to Oilseed Rape ranged from 40-
84 kg ha-1 for reported years. Finally, application rates for Peas and Beans ranged from 53 to 88 kg
ha-1 over the study period, with higher rates evident in later years.
Table 32: Average K applications other tillage crops (kg ha-1)
Year 2005 2006 2007 2008 2009 2010 2011 2012 2013 2014 2015
Fodder Beet 180 153 161 164 166 172 188 178 170 210 185
Maize 80 75 75 91 78 88 90 78 94 95 85
Oilseed Rape - - 71 - - 40 62 60 79 84 -
Peas & Beans 53 57 - - - 68 - 74 88 - 65

87
3.7 Fertiliser Use on Selected Root Crops 2005-2015
The root crops described here are Potatoes, Sugar Beet, Fodder Rape, Turnips and Kale. As the land
area occupied is relatively small across the sample the data is discussed across all farms for these
various crops. The average area utilised for root crops over the period ranged from 4 to 6 hectares.
More than three quarters of farms with root crops were located in zone A with 13% in zone B and
9% in zone C.
Table 33: Average farm size, NFS farm numbers and farm population – selected Roots Crops
Year 2005 2006 2007 2008 2009 2010 2011 2012 2013 2014 2015
Average Area (ha) – selected root crops
All Farms 6 6 5 4 5 5 5 4 4 4 5
No. of Teagasc NFS Farms with selected root crops
All Farms 126 95 84 86 78 75 78 59 70 65 55
N application rates on root crops ranged from 106-151 kg ha-1 over the study period, N application
rates were at their highest at the start of the period (151 kg ha-1) and were between 17-30% lower
thereafter. P application rates ranged between 39-59 kg ha-1 over the study period, the peak
application rate was in 2006 (59 kg ha-1) and this declined by 34% to a period low of 39 kg ha-1 at the
end of the study period. K application rates ranged from 131-197 kg ha-1 over the period, the peak
application rate was in 2007 (197 kg ha-1) and this declined by 34% to a period low of 131 kg ha-1 at
the end of the study period in 2015.
Figure 55: N, P, K use for selected Root Crops
2005 2006 2007 2008 2009 2010 2011 2012 2013 2014 2015
Nitrogen 151 110 115 123 122 107 106 133 118 125 108
Phosphorus 52 59 53 50 53 47 46 48 43 42 39
Potassium 168 154 197 156 152 147 163 158 139 156 131
0
50
100
150
200
250
N, P, K(kg/ha)
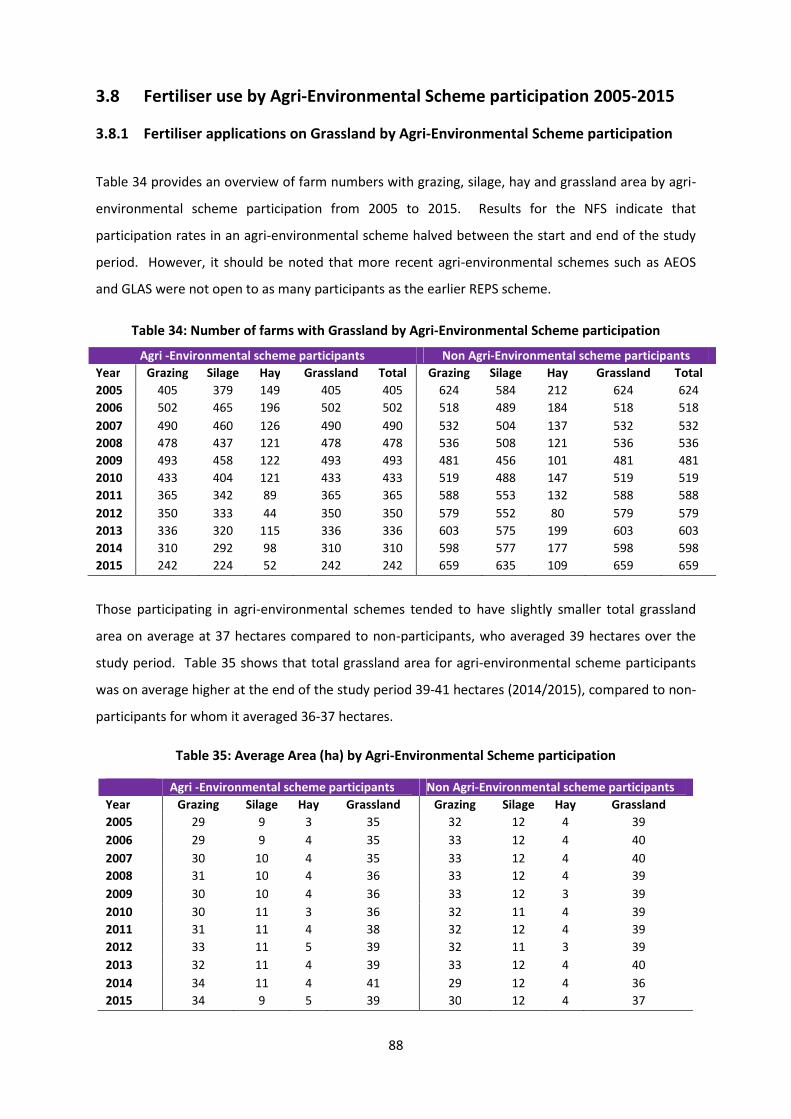
88
3.8 Fertiliser use by Agri-Environmental Scheme participation 2005-2015
3.8.1 Fertiliser applications on Grassland by Agri-Environmental Scheme participation
Table 34 provides an overview of farm numbers with grazing, silage, hay and grassland area by agri-
environmental scheme participation from 2005 to 2015. Results for the NFS indicate that
participation rates in an agri-environmental scheme halved between the start and end of the study
period. However, it should be noted that more recent agri-environmental schemes such as AEOS
and GLAS were not open to as many participants as the earlier REPS scheme.
Table 34: Number of farms with Grassland by Agri-Environmental Scheme participation
Agri -Environmental scheme participants Non Agri-Environmental scheme participants
Year Grazing Silage Hay Grassland Total Grazing Silage Hay Grassland Total
2005 405 379 149 405 405 624 584 212 624 624
2006 502 465 196 502 502 518 489 184 518 518
2007 490 460 126 490 490 532 504 137 532 532
2008 478 437 121 478 478 536 508 121 536 536
2009 493 458 122 493 493 481 456 101 481 481
2010 433 404 121 433 433 519 488 147 519 519
2011 365 342 89 365 365 588 553 132 588 588
2012 350 333 44 350 350 579 552 80 579 579
2013 336 320 115 336 336 603 575 199 603 603
2014 310 292 98 310 310 598 577 177 598 598
2015 242 224 52 242 242 659 635 109 659 659
Those participating in agri-environmental schemes tended to have slightly smaller total grassland
area on average at 37 hectares compared to non-participants, who averaged 39 hectares over the
study period. Table 35 shows that total grassland area for agri-environmental scheme participants
was on average higher at the end of the study period 39-41 hectares (2014/2015), compared to non-
participants for whom it averaged 36-37 hectares.
Table 35: Average Area (ha) by Agri-Environmental Scheme participation
Agri -Environmental scheme participants Non Agri-Environmental scheme participants
Year Grazing Silage Hay Grassland Grazing Silage Hay Grassland
2005 29 9 3 35 32 12 4 39
2006 29 9 4 35 33 12 4 40
2007 30 10 4 35 33 12 4 40
2008 31 10 4 36 33 12 4 39
2009 30 10 4 36 33 12 3 39
2010 30 11 3 36 32 11 4 39
2011 31 11 4 38 32 12 4 39
2012 33 11 5 39 32 11 3 39
2013 32 11 4 39 33 12 4 40
2014 34 11 4 41 29 12 4 36
2015 34 9 5 39 30 12 4 37
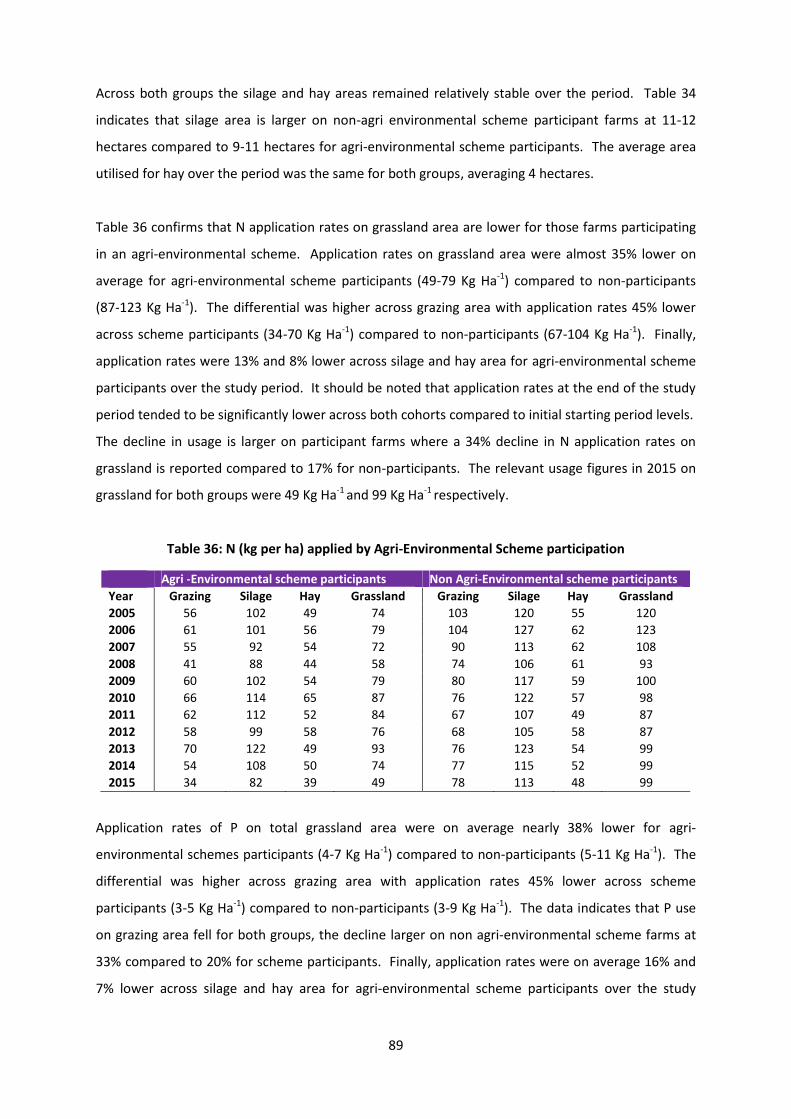
89
Across both groups the silage and hay areas remained relatively stable over the period. Table 34
indicates that silage area is larger on non-agri environmental scheme participant farms at 11-12
hectares compared to 9-11 hectares for agri-environmental scheme participants. The average area
utilised for hay over the period was the same for both groups, averaging 4 hectares.
Table 36 confirms that N application rates on grassland area are lower for those farms participating
in an agri-environmental scheme. Application rates on grassland area were almost 35% lower on
average for agri-environmental scheme participants (49-79 Kg Ha-1) compared to non-participants
(87-123 Kg Ha-1). The differential was higher across grazing area with application rates 45% lower
across scheme participants (34-70 Kg Ha-1) compared to non-participants (67-104 Kg Ha-1). Finally,
application rates were 13% and 8% lower across silage and hay area for agri-environmental scheme
participants over the study period. It should be noted that application rates at the end of the study
period tended to be significantly lower across both cohorts compared to initial starting period levels.
The decline in usage is larger on participant farms where a 34% decline in N application rates on
grassland is reported compared to 17% for non-participants. The relevant usage figures in 2015 on
grassland for both groups were 49 Kg Ha-1 and 99 Kg Ha-1 respectively.
Table 36: N (kg per ha) applied by Agri-Environmental Scheme participation
Agri -Environmental scheme participants Non Agri-Environmental scheme participants
Year Grazing Silage Hay Grassland Grazing Silage Hay Grassland
2005 56 102 49 74 103 120 55 120
2006 61 101 56 79 104 127 62 123
2007 55 92 54 72 90 113 62 108
2008 41 88 44 58 74 106 61 93
2009 60 102 54 79 80 117 59 100
2010 66 114 65 87 76 122 57 98
2011 62 112 52 84 67 107 49 87
2012 58 99 58 76 68 105 58 87
2013 70 122 49 93 76 123 54 99
2014 54 108 50 74 77 115 52 99
2015 34 82 39 49 78 113 48 99
Application rates of P on total grassland area were on average nearly 38% lower for agri-
environmental schemes participants (4-7 Kg Ha-1) compared to non-participants (5-11 Kg Ha-1). The
differential was higher across grazing area with application rates 45% lower across scheme
participants (3-5 Kg Ha-1) compared to non-participants (3-9 Kg Ha-1). The data indicates that P use
on grazing area fell for both groups, the decline larger on non agri-environmental scheme farms at
33% compared to 20% for scheme participants. Finally, application rates were on average 16% and
7% lower across silage and hay area for agri-environmental scheme participants over the study
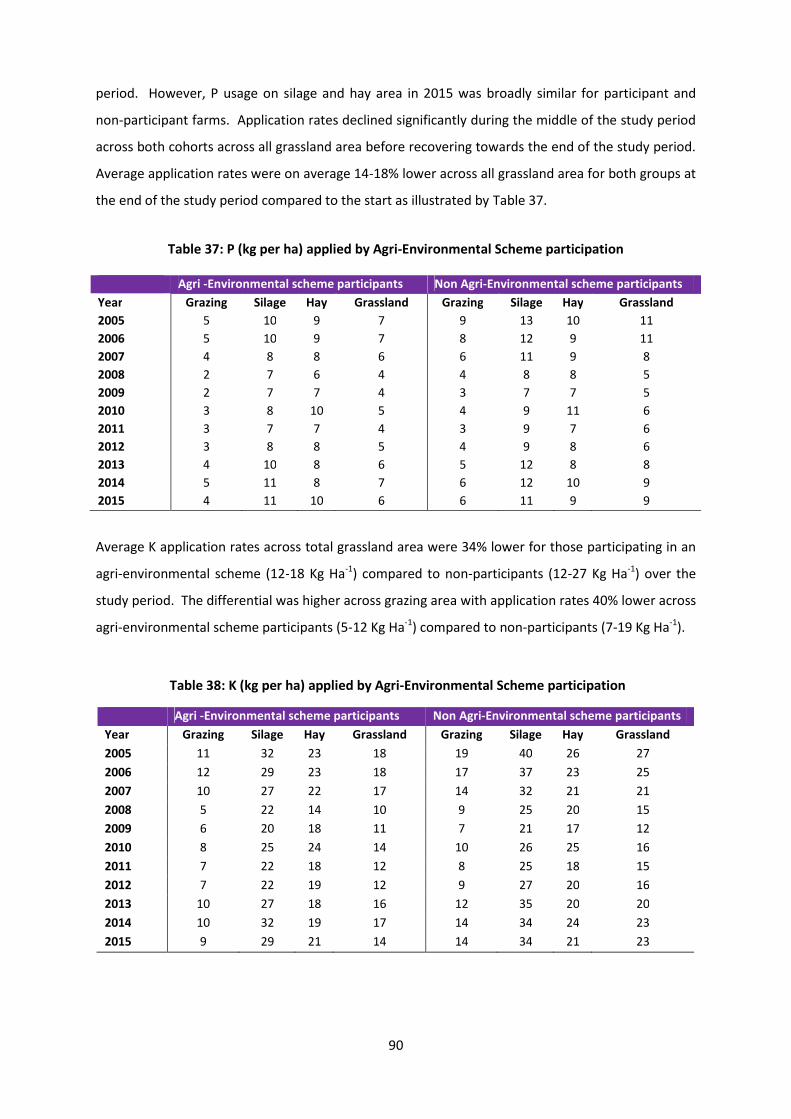
90
period. However, P usage on silage and hay area in 2015 was broadly similar for participant and
non-participant farms. Application rates declined significantly during the middle of the study period
across both cohorts across all grassland area before recovering towards the end of the study period.
Average application rates were on average 14-18% lower across all grassland area for both groups at
the end of the study period compared to the start as illustrated by Table 37.
Table 37: P (kg per ha) applied by Agri-Environmental Scheme participation
Average K application rates across total grassland area were 34% lower for those participating in an
agri-environmental scheme (12-18 Kg Ha-1) compared to non-participants (12-27 Kg Ha-1) over the
study period. The differential was higher across grazing area with application rates 40% lower across
agri-environmental scheme participants (5-12 Kg Ha-1) compared to non-participants (7-19 Kg Ha-1).
Table 38: K (kg per ha) applied by Agri-Environmental Scheme participation
Agri -Environmental scheme participants Non Agri-Environmental scheme participants
Year Grazing Silage Hay Grassland Grazing Silage Hay Grassland
2005 11 32 23 18 19 40 26 27
2006 12 29 23 18 17 37 23 25
2007 10 27 22 17 14 32 21 21
2008 5 22 14 10 9 25 20 15
2009 6 20 18 11 7 21 17 12
2010 8 25 24 14 10 26 25 16
2011 7 22 18 12 8 25 18 15
2012 7 22 19 12 9 27 20 16
2013 10 27 18 16 12 35 20 20
2014 10 32 19 17 14 34 24 23
2015 9 29 21 14 14 34 21 23
Agri -Environmental scheme participants Non Agri-Environmental scheme participants
Year Grazing Silage Hay Grassland Grazing Silage Hay Grassland
2005 5 10 9 7 9 13 10 11
2006 5 10 9 7 8 12 9 11
2007 4 8 8 6 6 11 9 8
2008 2 7 6 4 4 8 8 5
2009 2 7 7 4 3 7 7 5
2010 3 8 10 5 4 9 11 6
2011 3 7 7 4 3 9 7 6
2012 3 8 8 5 4 9 8 6
2013 4 10 8 6 5 12 8 8
2014 5 11 8 7 6 12 10 9
2015 4 11 10 6 6 11 9 9

91
Finally, application rates were 17% and 7% lower across silage and hay area for agri-environment
scheme participants on average over the study period. K application rates declined significantly
during the middle of the study period across both cohorts (30-50% between 2008 and 2012) for all
grassland areas before recovering towards the end of the study period. Application rates were on
average 15-22% lower across all grassland area for both groups at the end of the study period
compared to initial levels as illustrated by Table 38.
3.8.2 Fertiliser applications on main cereals by Agri-Environmental Scheme participation
Table 39 reports the number of farms growing the main cereal crops by agri-environmental scheme
participation. Farms with cereal area participating in an agri-environmental scheme declined by 52%
compared to a 23% decline for non-scheme participants. Of the three main cereal crops, Spring
Barley is most prevalent; however this has experienced a decline over the study period especially
across agri-environmental scheme participants (where the number has more than halved). On the
other hand, an increase in the number of farms with Winter Barley is apparent (although the
numbers are small) across agri-environmental scheme participants. The number of farms with
Winter Wheat is higher on non-participant versus participant farms.
Table 39: Number of cereal farms by Agri-Environmental Scheme participation
Agri -Environmental scheme participants Non Agri-Environmental scheme participants
Year WinterWheat
SpringBarley
WinterBarley
AllCereals
WinterWheat
SpringBarley
WinterBarley
AllCereals
2005 4 58 4 70 32 108 17 142
2006 8 77 8 90 27 71 11 101
2007 8 70 6 89 33 93 14 122
2008 21 79 5 98 43 97 15 132
2009 15 74 13 91 23 80 14 103
2010 13 64 6 79 33 82 28 108
2011 20 53 11 73 38 100 29 128
2012 15 41 8 57 35 102 25 128
2013 8 41 5 51 27 97 22 117
2014 8 31 9 45 29 83 31 105
2015 5 24 10 33 29 83 49 109
Table 40 reflects the fact that cereal area on non-participant farms was generally larger averaging 26
hectares compared to 18 hectares for agri-environmental scheme participating farms. The average
area utilised for the most popular crop, Spring Barley, was similar at 13-14 hectares.

92
Table 40: Average area (ha) under cereals by Agri-Environmental Scheme participation
Agri -Environmental scheme participants Non Agri-Environmental scheme participants
Year WinterWheat
SpringBarley
WinterBarley
AllCereals
WinterWheat
SpringBarley
WinterBarley
AllCereals
2005 - 10 - 11 28 12 16 22
2006 - 11 - 14 33 15 20 28
2007 - 11 - 14 28 13 16 26
2008 15 14 - 17 26 15 17 25
2009 18 13 9 17 39 17 17 28
2010 46 14 - 19 28 14 15 25
2011 35 14 11 22 35 13 17 27
2012 14 15 - 20 37 12 18 24
2013 - 15 - 20 29 16 16 25
2014 - 15 - 26 24 16 17 26
2015 - 11 11 18 23 14 16 28
Average N application rates across both groups for the main cereals are contained in Table 41. The
average annual application rate for non-participants over the period was 1.15 times higher at 150 Kg
Ha-1 compared to scheme participants where the average rate applied was 130 Kg Ha-1.
Table 41: N (kg per ha) applied to main cereals by Agri-Environmental Scheme participation
Agri -Environmental scheme participants Non Agri-Environmental scheme participants
Year WinterWheat
SpringBarley
WinterBarley
AllCereals
WinterWheat
SpringBarley
WinterBarley
AllCereals
2005 - 111 - 111 200 129 166 153
2006 - 118 - 115 196 135 151 156
2007 - 123 - 128 196 133 160 155
2008 128 115 - 118 183 123 150 143
2009 167 112 169 124 195 125 162 145
2010 191 118 - 136 196 126 159 151
2011 191 123 170 147 201 125 167 149
2012 187 113 - 136 178 124 152 146
2013 - 131 - 138 194 131 161 147
2014 - 116 - 146 169 130 166 146
2015 - 129 160 127 199 134 177 160
N application rates on cereal area for scheme participants tended to increase over the study period
and were 14% higher at the end compared to at the outset. This contrasts to non-scheme
participants where N application rates tended to be lower across the study period compared to
initial starting levels (except for the final year which was 5% higher). Given the decline in the
number of farms with cereal area participating in agri-environmental schemes over the period,
limited data is available for Winter Wheat and Winter Barley in particular.
P usage on cereal area is broadly similar across scheme participants and non-participants with the
average application rates over the period marginally higher for non-participants at 23 Kg Ha-1
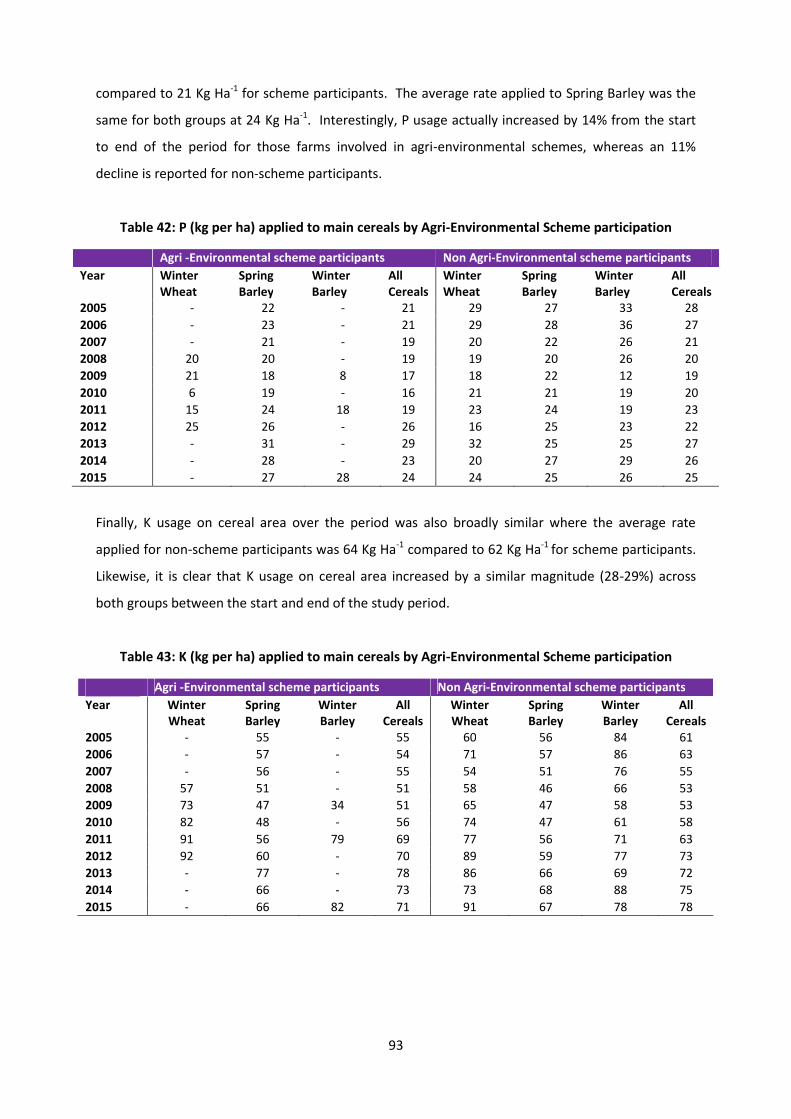
93
compared to 21 Kg Ha-1 for scheme participants. The average rate applied to Spring Barley was the
same for both groups at 24 Kg Ha-1. Interestingly, P usage actually increased by 14% from the start
to end of the period for those farms involved in agri-environmental schemes, whereas an 11%
decline is reported for non-scheme participants.
Table 42: P (kg per ha) applied to main cereals by Agri-Environmental Scheme participation
Agri -Environmental scheme participants Non Agri-Environmental scheme participants
Year WinterWheat
SpringBarley
WinterBarley
AllCereals
WinterWheat
SpringBarley
WinterBarley
AllCereals
2005 - 22 - 21 29 27 33 28
2006 - 23 - 21 29 28 36 27
2007 - 21 - 19 20 22 26 21
2008 20 20 - 19 19 20 26 20
2009 21 18 8 17 18 22 12 19
2010 6 19 - 16 21 21 19 20
2011 15 24 18 19 23 24 19 23
2012 25 26 - 26 16 25 23 22
2013 - 31 - 29 32 25 25 27
2014 - 28 - 23 20 27 29 26
2015 - 27 28 24 24 25 26 25
Finally, K usage on cereal area over the period was also broadly similar where the average rate
applied for non-scheme participants was 64 Kg Ha-1 compared to 62 Kg Ha-1 for scheme participants.
Likewise, it is clear that K usage on cereal area increased by a similar magnitude (28-29%) across
both groups between the start and end of the study period.
Table 43: K (kg per ha) applied to main cereals by Agri-Environmental Scheme participation
Agri -Environmental scheme participants Non Agri-Environmental scheme participants
Year WinterWheat
SpringBarley
WinterBarley
AllCereals
WinterWheat
SpringBarley
WinterBarley
AllCereals
2005 - 55 - 55 60 56 84 61
2006 - 57 - 54 71 57 86 63
2007 - 56 - 55 54 51 76 55
2008 57 51 - 51 58 46 66 53
2009 73 47 34 51 65 47 58 53
2010 82 48 - 56 74 47 61 58
2011 91 56 79 69 77 56 71 63
2012 92 60 - 70 89 59 77 73
2013 - 77 - 78 86 66 69 72
2014 - 66 - 73 73 68 88 75
2015 - 66 82 71 91 67 78 78

94
3.9 Lime usage
Figure 56 presents the percentage of farms using lime by nitrate zone. Just over 20% of farms across
all zones were using lime over the study period on average. The proportion of farms liming was
highest in zone C (27%) followed by zone A (25%), while the lowest proportion of farms apply lime
was associated with zone B at 14% on average.
Figure 56: Percentage of farms using Lime by Nitrate Zone
Results on the use of lime by land use class are presented in Figure 57. The proportion of farms
liming was highest on soils of a wide land use potential, averaging 26% over the study period. There
was a general upward trend in the percentage of farms using lime use amongst this cohort over the
study period.
Figure 57: Percentage of farms using Lime by Land Use Class
2005 2006 2007 2008 2009 2010 2011 2012 2013 2014 2015
Zone A 22% 19% 22% 24% 21% 24% 31% 24% 31% 27% 28%
Zone B 10% 12% 12% 17% 14% 14% 17% 10% 20% 17% 12%
Zone C 30% 23% 23% 28% 21% 32% 24% 26% 29% 26% 26%
All Zones 18% 16% 18% 21% 18% 20% 24% 18% 26% 22% 20%
0%
5%
10%
15%
20%
25%
30%
35%
% of Farms
2005 2006 2007 2008 2009 2010 2011 2012 2013 2014 2015
Limited 14% 16% 17% 22% 13% 16% 19% 15% 24% 21% 17%
Somewhat Limited 17% 11% 16% 19% 19% 18% 20% 16% 23% 20% 22%
Moderately Wide 22% 16% 16% 17% 20% 19% 23% 19% 25% 22% 17%
Wide 21% 19% 22% 28% 22% 29% 33% 23% 31% 29% 29%
All Soils 18% 16% 18% 22% 18% 21% 25% 19% 26% 24% 22%
0%
5%
10%
15%
20%
25%
30%
35%
40%
% of Farms

95
The percentage of farms applying lime across the moderately wide, somewhat limited and limited
soil class was 20%, 17% and 18% respectively on average over the period. Generally, liming rates
were higher at the end of the study period than at the outset.
Figure 58 presents the percentage of farmers using lime by farm system. Dairying was associated
with the highest level of liming on average, with 32% of dairy farms applying lime over the study
period (tending to increase over the period). Tillage farms had the second highest level of liming
with 25% of tillage farms applying lime on average (again tending to increase over the period). On
average, 15 and 20% of cattle and sheep farms respectively tended to apply lime over the study
period, with the proportion again increasing from the beginning to the end of the period in question.
Figure 58: Percentage of farms using Lime by Farm System
Figure 59 illustrates the percentage of farmers using lime by organic N stocking rate and indicates
that lime usage is correlated to stocking intensity, with only 10-16% of farms in the <85 Kg ON Ha-1
stocking rate band applying lime over the period, compared to 14-55% of farms at the other end of
the spectrum (>210 Kg ON Ha-1). There is some variation year-on-year across groups, with between
19% and 22% of farms in the 85-130 Kg ON Ha-1 category applying lime from 2005 to 2015, 19-32%
in the 130-170 Kg ON Ha-1 category and 20-48% in the 30-170 Kg ON Ha-1 category.
2005 2006 2007 2008 2009 2010 2011 2012 2013 2014 2015
Cattle 12% 11% 13% 16% 14% 15% 18% 14% 18% 16% 16%
Dairy 28% 25% 27% 34% 25% 35% 40% 29% 42% 41% 35%
Sheep 17% 18% 20% 26% 21% 14% 20% 13% 24% 24% 19%
Tillage 30% 14% 21% 23% 20% 20% 27% 27% 36% 32% 28%
All Systems 18% 16% 18% 22% 18% 21% 25% 19% 26% 24% 21%
0%
5%
10%
15%
20%
25%
30%
35%
40%
45%
% of Farms

96
Figure 59: Percentage of farms using Lime by Organic N Stocking Rate
2005 2006 2007 2008 2009 2010 2011 2012 2013 2014 2015
< 85 10% 14% 17% 20% 16% 12% 13% 12% 15% 16% 13%
85-130 16% 14% 17% 18% 15% 17% 24% 16% 27% 20% 18%
130-170 22% 19% 20% 26% 25% 28% 32% 22% 31% 28% 30%
170-210 28% 23% 20% 32% 25% 33% 48% 34% 44% 38% 39%
>210 23% 14% 20% 32% 23% 49% 41% 31% 33% 55% 33%
All Rates 18% 16% 18% 22% 18% 21% 25% 19% 26% 24% 22%
0%
10%
20%
30%
40%
50%
60%
% of farms
97
References
Central Statistics Office (2018). Agricultural Input and Output Price Indices by Agricultural Product.Available at:http://www.cso.ie/px/pxeirestat/Database/eirestat/Agricultural%20Input%20and%20Output%20Price%20Indices/Agricultural%20Input%20and%20Output%20Price%20Indices_statbank.asp?SP=Agricultural%20Input%20and%20Output%20Price%20Indices&Planguage=0
Coulter, B.S., Murphy, W.E., Culleton, N., Finnerty, E. and Connolly, L. (2002). A survey of fertiliseruse in 2000 for grassland and arable crops. Teagasc, Johnstown Castle, Wexford. ISBN No. 1-84170-295-1.
Coulter, B.S., Murphy, W.E., Culleton, N., Quinlan, G. and Connolly, L. (2005). A survey of fertiliseruse from 2001-2003 for grassland and arable crops. Teagasc. ISBN No. 1-84170-389-3.
Department of Agriculture Food and the Marine (2014).Explanatory handbook for Good Agricultural Practice for the Protection of Waters Regulation 2014.https://www.agriculture.gov.ie/media/migration/ruralenvironment/environment/nitrates/NitratesExplanatoryhandbook14Mar2014.pdf
Department of Agriculture, Food and Marine (2017). Fertiliser Sales 2005-2015. Department ofAgriculture, Fisheries and Food, Dublin.
Dillon, E., Moran, B., Donnellan, T. (2017). Teagasc National Farm Survey 2016 Results. Available:https://www.teagasc.ie/media/website/publications/2017/NFS-2016-Final-Report.pdf
Gardiner, M.J. and Radford, T. (1980). Soil associations and their land use potential (Explanatorybulletin to soil map of Ireland), Soil Survey Bulletin No. 36. An Forás Talúntais, Dublin.
Government of Ireland (2006). European Communities (Good Agricultural Practice for Protection ofWaters) Regulations (2006). S.I. No. 378 of 2006. Published by the Stationery Office, GovernmentPublications Office, Dublin.
Government of Ireland (2009). European Communities (Good Agricultural Practice for Protection ofWaters) Regulations (2009). S.I. No. 101 of 2009. Published by the Stationery Office, GovernmentPublications Office, Dublin.
Government of Ireland (2010). European Communities (Good Agricultural Practice for Protection ofWaters) Regulations (2010). S.I. No. 610 of 2010. Published by the Stationery Office, GovernmentPublications Office, Dublin.
Government of Ireland (2014). European Communities (Good Agricultural Practice for Protection ofWaters) Regulations (2010). S.I. No. 31 of 2014. Published by the Stationery Office, GovernmentPublications Office, Dublin.
Lalor, S.T.J., Coulter, B. S., Quinlan, G. and Connolly, L. (2010). A Survey of Fertiliser Use in Irelandfrom 2004-2008 for Grassland and Arable Crops. Teagasc. ISBN No. 1-84170-557-8.

98
Appendix 1: Units of Measurement
Metric Imperial1 kg
1kg/ha
1kg/ha
1tonne/ha
1m3/ha
1 kg/m3
2 units
0.81 units/acre
0.91 lb/acre
0.4 tons/acre
89.0 gallons/acre
9.09 units/1000 gallons
Imperial Metric
1 ton/acre
1 unit/acre
1 lb/acre
1 unit/ton
1000 gallons/acre
1 unit/1000 gallons
2.51 tonnes/ha
1.24 kg/ha
1.1 kg/ha
0.492 kg/tonne
11.2 m3/ha
0.110 kg/m3
Element to Oxide
P to P2O5
K to K2O
Multiply by 2.291
Multiply by 1.205
Oxide to Element
P2O5 to P
K2O to K
Multiply by 0.436
Multiply by 0.830
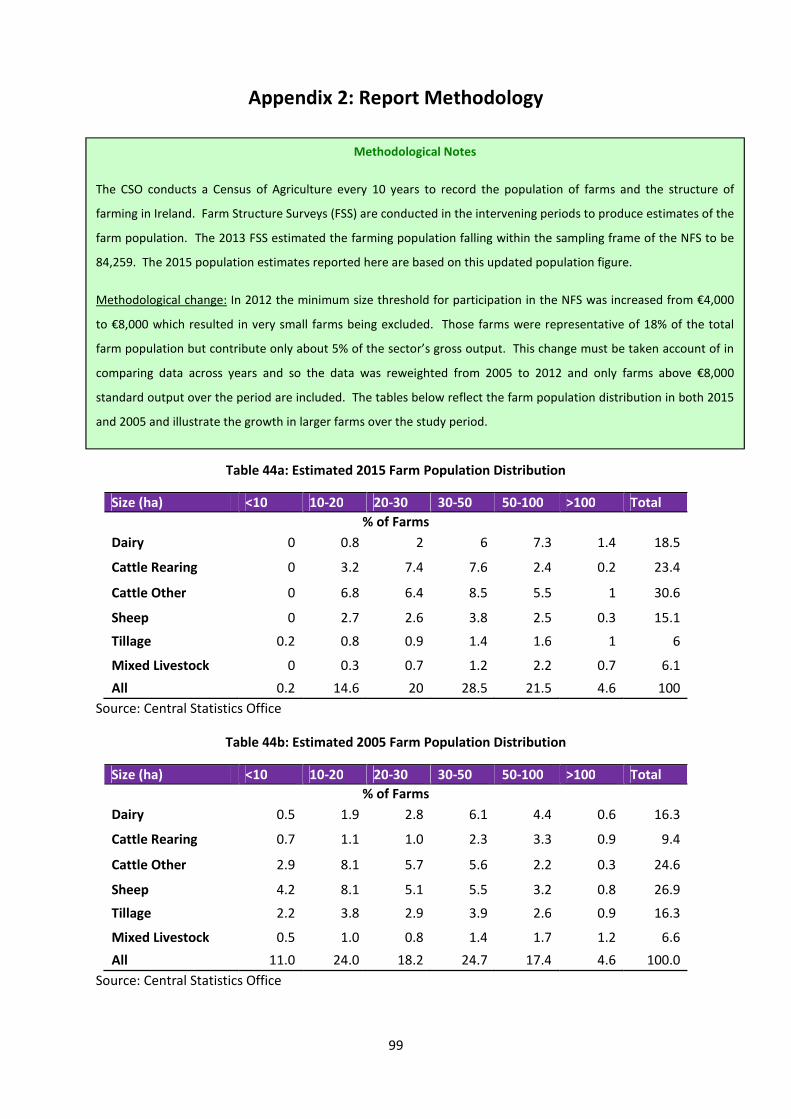
99
Appendix 2: Report Methodology
Farms in the Teagasc NFS are assigned to six farm systems on the basis of farm gross output, as
calculated on a standard output basis. Standard output measures are applied to each animal and
crop output on the farm and only farms with a standard output of €8,000 or more, the equivalent of
6 dairy cows, 6 hectares of wheat or 14 suckler cows, are included in the sample. Farms are then
classified as one of the six farm systems on the basis of the main outputs of the farm. Farms falling
into the Pigs and Poultry System are not included in the survey, due to the inability to obtain a
representative sample of these systems. Due to the small number of farms falling into the Mixed
Livestock system these farms are not reported here.
Table 44a: Estimated 2015 Farm Population Distribution
Size (ha) <10 10-20 20-30 30-50 50-100 >100 Total
% of Farms
Dairy 0 0.8 2 6 7.3 1.4 18.5
Cattle Rearing 0 3.2 7.4 7.6 2.4 0.2 23.4
Cattle Other 0 6.8 6.4 8.5 5.5 1 30.6
Sheep 0 2.7 2.6 3.8 2.5 0.3 15.1
Tillage 0.2 0.8 0.9 1.4 1.6 1 6
Mixed Livestock 0 0.3 0.7 1.2 2.2 0.7 6.1
All 0.2 14.6 20 28.5 21.5 4.6 100
Source: Central Statistics Office
Table 44b: Estimated 2005 Farm Population Distribution
Size (ha) <10 10-20 20-30 30-50 50-100 >100 Total
% of Farms
Dairy 0.5 1.9 2.8 6.1 4.4 0.6 16.3
Cattle Rearing 0.7 1.1 1.0 2.3 3.3 0.9 9.4
Cattle Other 2.9 8.1 5.7 5.6 2.2 0.3 24.6
Sheep 4.2 8.1 5.1 5.5 3.2 0.8 26.9
Tillage 2.2 3.8 2.9 3.9 2.6 0.9 16.3
Mixed Livestock 0.5 1.0 0.8 1.4 1.7 1.2 6.6
All 11.0 24.0 18.2 24.7 17.4 4.6 100.0
Source: Central Statistics Office
Methodological Notes
The CSO conducts a Census of Agriculture every 10 years to record the population of farms and the structure of
farming in Ireland. Farm Structure Surveys (FSS) are conducted in the intervening periods to produce estimates of the
farm population. The 2013 FSS estimated the farming population falling within the sampling frame of the NFS to be
84,259. The 2015 population estimates reported here are based on this updated population figure.
Methodological change: In 2012 the minimum size threshold for participation in the NFS was increased from €4,000
to €8,000 which resulted in very small farms being excluded. Those farms were representative of 18% of the total
farm population but contribute only about 5% of the sector’s gross output. This change must be taken account of in
comparing data across years and so the data was reweighted from 2005 to 2012 and only farms above €8,000
standard output over the period are included. The tables below reflect the farm population distribution in both 2015
and 2005 and illustrate the growth in larger farms over the study period.

100
Appendix 3: Results by NUTS 3 regions and Organic N stocking rate
Table 45: Average farm size, NFS farms and farm population by Region – Grazing Area
2005 2006 2007 2008 2009 2010 2011 2012 2013 2014 2015
Average Area (ha)
Border 28 28 28 28 28 28 28 30 29 26 26
Mid East 37 38 38 36 36 37 36 38 35 33 33
Midlands 33 32 33 33 35 34 35 36 34 33 33
South 30 30 31 31 31 31 31 33 34 33 33
South East 35 35 35 35 35 34 34 35 33 33 33
South West 34 34 34 35 34 34 34 35 34 34 33
West 26 26 27 26 26 26 27 27 27 25 25
All Regions 31 31 31 31 32 31 32 33 32 31 31
No. Teagasc NFS Farms
Border 162 166 160 169 164 171 166 154 155 155 154
Mid East 108 107 120 128 122 120 123 103 104 108 106
Midlands 96 99 111 115 114 116 119 114 117 124 124
South 244 240 231 230 213 182 185 204 195 164 157
South East 171 164 165 162 159 170 183 180 184 176 178
South West 110 107 103 86 81 74 68 69 71 73 75
West 138 137 132 124 121 119 109 105 113 108 107
All Regions 1029 1020 1022 1014 974 952 953 929 939 908 901
% of Population
Border 16% 16% 16% 16% 16% 16% 16% 16% 16% 18% 17%
Mid East 8% 8% 8% 8% 8% 8% 8% 8% 8% 8% 8%
Midlands 10% 10% 10% 10% 10% 10% 10% 10% 10% 10% 10%
South 18% 19% 19% 19% 18% 18% 18% 18% 18% 17% 17%
South East 15% 15% 15% 15% 15% 16% 16% 16% 16% 15% 15%
South West 13% 13% 13% 13% 13% 13% 13% 13% 13% 12% 12%
West 19% 19% 19% 19% 18% 19% 19% 19% 19% 20% 20%
Table 46: N, P, K on Grazing Area by Region
N (kg/ha) 2005 2006 2007 2008 2009 2010 2011 2012 2013 2014 2015
Border 61 63 56 44 53 50 45 49 59 49 43
Mid East 73 66 64 52 60 62 55 58 63 60 60
Midlands 63 69 61 46 65 64 51 47 64 55 51
South 130 125 105 85 92 96 95 95 103 104 87
South East 111 103 91 76 91 89 87 82 100 93 90
South West 59 77 60 48 62 67 59 59 75 66 75
West 50 48 47 35 45 52 39 37 44 44 40
All Regions 82 81 72 57 68 70 63 62 72 67 63
Phosphorous (kg/ha) 2005 2006 2007 2008 2009 2010 2011 2012 2013 2014 2015
Border 6 6 4 2 3 4 3 3 4 4 5
Mid East 7 4 4 2 2 3 3 4 4 6 7
Midlands 7 6 4 3 3 4 3 3 4 5 5
South 9 9 7 4 4 4 3 4 5 7 6
South East 9 9 5 3 3 5 4 5 6 8 8
South West 6 5 4 3 3 3 3 3 4 4 5
West 6 6 5 2 3 4 3 3 4 5 4
All Regions 7 7 5 3 3 4 3 4 5 5 5
K (kg/ha) 2005 2006 2007 2008 2009 2010 2011 2012 2013 2014 2015
Border 13 11 9 5 6 7 6 6 9 9 10
Mid East 13 10 9 6 5 8 6 9 12 13 12
Midlands 16 16 13 7 7 12 8 9 10 13 12
South 19 18 16 10 10 8 9 10 13 16 15
South East 19 18 12 9 7 11 10 11 13 18 18
South West 13 11 10 8 6 7 9 7 10 11 12
West 14 13 12 5 7 9 8 7 10 11 9
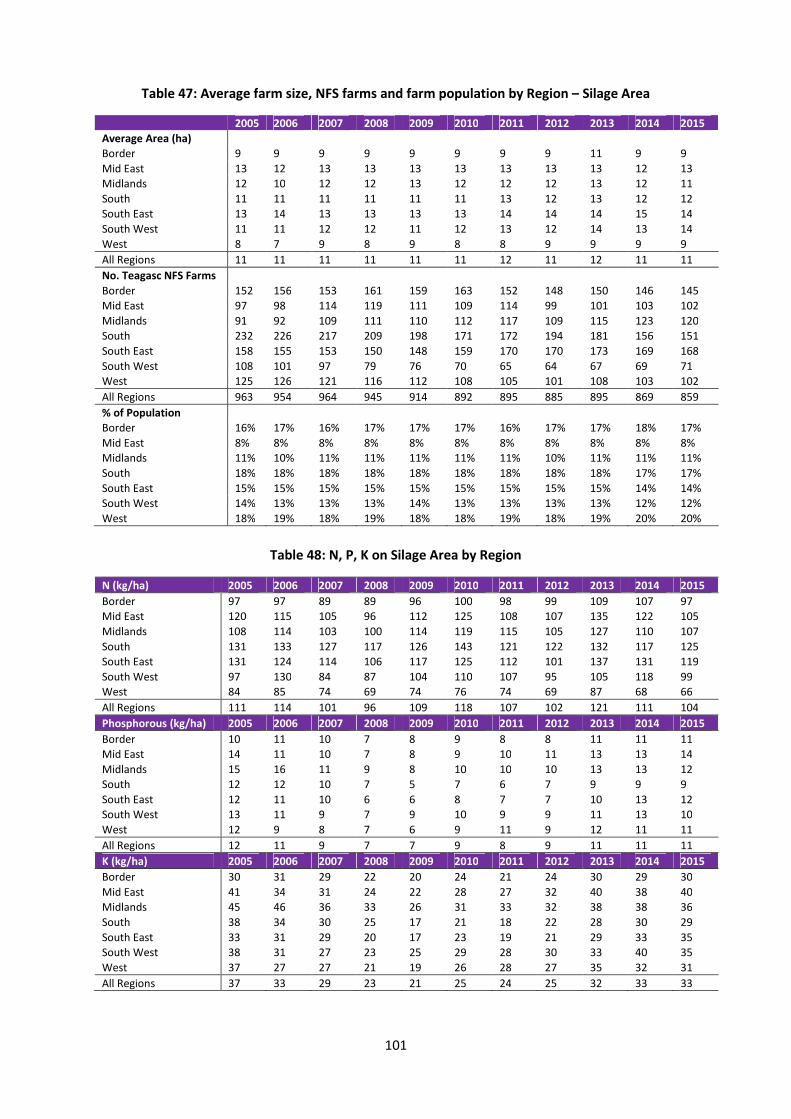
101
Table 47: Average farm size, NFS farms and farm population by Region – Silage Area
2005 2006 2007 2008 2009 2010 2011 2012 2013 2014 2015
Average Area (ha)
Border 9 9 9 9 9 9 9 9 11 9 9
Mid East 13 12 13 13 13 13 13 13 13 12 13
Midlands 12 10 12 12 13 12 12 12 13 12 11
South 11 11 11 11 11 11 13 12 13 12 12
South East 13 14 13 13 13 13 14 14 14 15 14
South West 11 11 12 12 11 12 13 12 14 13 14
West 8 7 9 8 9 8 8 9 9 9 9
All Regions 11 11 11 11 11 11 12 11 12 11 11
No. Teagasc NFS Farms
Border 152 156 153 161 159 163 152 148 150 146 145
Mid East 97 98 114 119 111 109 114 99 101 103 102
Midlands 91 92 109 111 110 112 117 109 115 123 120
South 232 226 217 209 198 171 172 194 181 156 151
South East 158 155 153 150 148 159 170 170 173 169 168
South West 108 101 97 79 76 70 65 64 67 69 71
West 125 126 121 116 112 108 105 101 108 103 102
All Regions 963 954 964 945 914 892 895 885 895 869 859
% of Population
Border 16% 17% 16% 17% 17% 17% 16% 17% 17% 18% 17%
Mid East 8% 8% 8% 8% 8% 8% 8% 8% 8% 8% 8%
Midlands 11% 10% 11% 11% 11% 11% 11% 10% 11% 11% 11%
South 18% 18% 18% 18% 18% 18% 18% 18% 18% 17% 17%
South East 15% 15% 15% 15% 15% 15% 15% 15% 15% 14% 14%
South West 14% 13% 13% 13% 14% 13% 13% 13% 13% 12% 12%
West 18% 19% 18% 19% 18% 18% 19% 18% 19% 20% 20%
Table 48: N, P, K on Silage Area by Region
N (kg/ha) 2005 2006 2007 2008 2009 2010 2011 2012 2013 2014 2015
Border 97 97 89 89 96 100 98 99 109 107 97
Mid East 120 115 105 96 112 125 108 107 135 122 105
Midlands 108 114 103 100 114 119 115 105 127 110 107
South 131 133 127 117 126 143 121 122 132 117 125
South East 131 124 114 106 117 125 112 101 137 131 119
South West 97 130 84 87 104 110 107 95 105 118 99
West 84 85 74 69 74 76 74 69 87 68 66
All Regions 111 114 101 96 109 118 107 102 121 111 104
Phosphorous (kg/ha) 2005 2006 2007 2008 2009 2010 2011 2012 2013 2014 2015
Border 10 11 10 7 8 9 8 8 11 11 11
Mid East 14 11 10 7 8 9 10 11 13 13 14
Midlands 15 16 11 9 8 10 10 10 13 13 12
South 12 12 10 7 5 7 6 7 9 9 9
South East 12 11 10 6 6 8 7 7 10 13 12
South West 13 11 9 7 9 10 9 9 11 13 10
West 12 9 8 7 6 9 11 9 12 11 11
All Regions 12 11 9 7 7 9 8 9 11 11 11
K (kg/ha) 2005 2006 2007 2008 2009 2010 2011 2012 2013 2014 2015
Border 30 31 29 22 20 24 21 24 30 29 30
Mid East 41 34 31 24 22 28 27 32 40 38 40
Midlands 45 46 36 33 26 31 33 32 38 38 36
South 38 34 30 25 17 21 18 22 28 30 29
South East 33 31 29 20 17 23 19 21 29 33 35
South West 38 31 27 23 25 29 28 30 33 40 35
West 37 27 27 21 19 26 28 27 35 32 31
All Regions 37 33 29 23 21 25 24 25 32 33 33
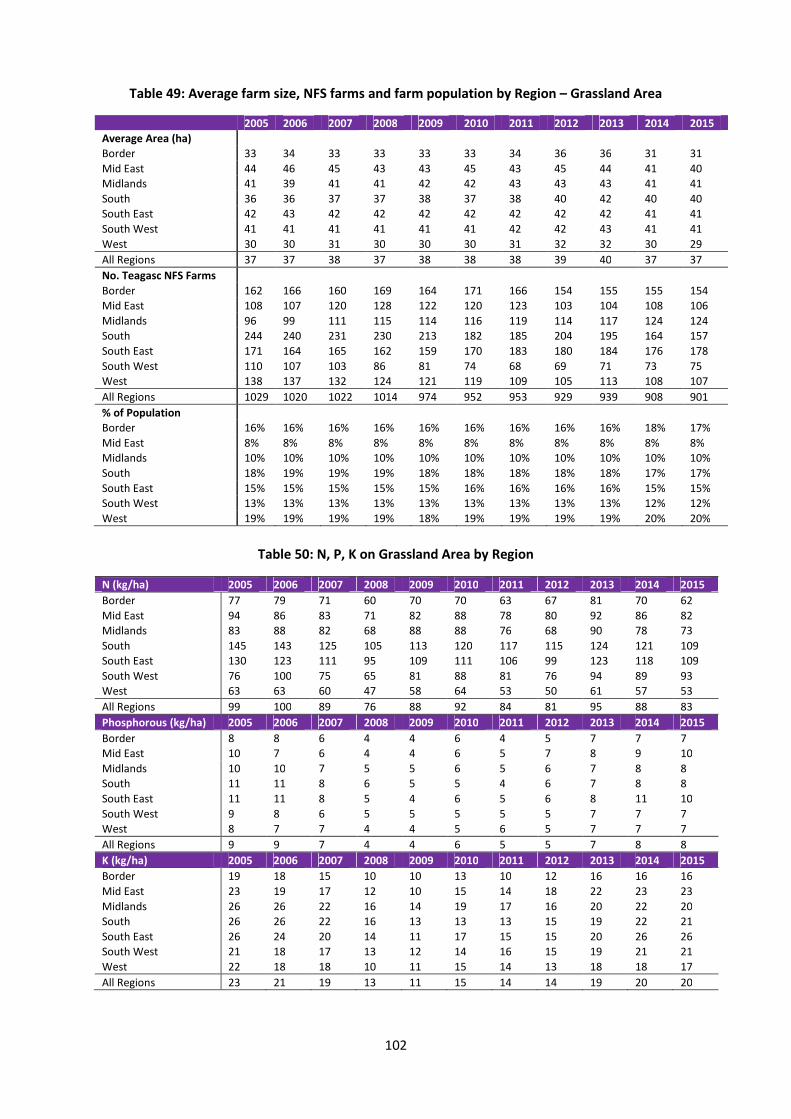
102
Table 49: Average farm size, NFS farms and farm population by Region – Grassland Area
2005 2006 2007 2008 2009 2010 2011 2012 2013 2014 2015
Average Area (ha)
Border 33 34 33 33 33 33 34 36 36 31 31
Mid East 44 46 45 43 43 45 43 45 44 41 40
Midlands 41 39 41 41 42 42 43 43 43 41 41
South 36 36 37 37 38 37 38 40 42 40 40
South East 42 43 42 42 42 42 42 42 42 41 41
South West 41 41 41 41 41 41 42 42 43 41 41
West 30 30 31 30 30 30 31 32 32 30 29
All Regions 37 37 38 37 38 38 38 39 40 37 37
No. Teagasc NFS Farms
Border 162 166 160 169 164 171 166 154 155 155 154
Mid East 108 107 120 128 122 120 123 103 104 108 106
Midlands 96 99 111 115 114 116 119 114 117 124 124
South 244 240 231 230 213 182 185 204 195 164 157
South East 171 164 165 162 159 170 183 180 184 176 178
South West 110 107 103 86 81 74 68 69 71 73 75
West 138 137 132 124 121 119 109 105 113 108 107
All Regions 1029 1020 1022 1014 974 952 953 929 939 908 901
% of Population
Border 16% 16% 16% 16% 16% 16% 16% 16% 16% 18% 17%
Mid East 8% 8% 8% 8% 8% 8% 8% 8% 8% 8% 8%
Midlands 10% 10% 10% 10% 10% 10% 10% 10% 10% 10% 10%
South 18% 19% 19% 19% 18% 18% 18% 18% 18% 17% 17%
South East 15% 15% 15% 15% 15% 16% 16% 16% 16% 15% 15%
South West 13% 13% 13% 13% 13% 13% 13% 13% 13% 12% 12%
West 19% 19% 19% 19% 18% 19% 19% 19% 19% 20% 20%
Table 50: N, P, K on Grassland Area by Region
N (kg/ha) 2005 2006 2007 2008 2009 2010 2011 2012 2013 2014 2015
Border 77 79 71 60 70 70 63 67 81 70 62
Mid East 94 86 83 71 82 88 78 80 92 86 82
Midlands 83 88 82 68 88 88 76 68 90 78 73
South 145 143 125 105 113 120 117 115 124 121 109
South East 130 123 111 95 109 111 106 99 123 118 109
South West 76 100 75 65 81 88 81 76 94 89 93
West 63 63 60 47 58 64 53 50 61 57 53
All Regions 99 100 89 76 88 92 84 81 95 88 83
Phosphorous (kg/ha) 2005 2006 2007 2008 2009 2010 2011 2012 2013 2014 2015
Border 8 8 6 4 4 6 4 5 7 7 7
Mid East 10 7 6 4 4 6 5 7 8 9 10
Midlands 10 10 7 5 5 6 5 6 7 8 8
South 11 11 8 6 5 5 4 6 7 8 8
South East 11 11 8 5 4 6 5 6 8 11 10
South West 9 8 6 5 5 5 5 5 7 7 7
West 8 7 7 4 4 5 6 5 7 7 7
All Regions 9 9 7 4 4 6 5 5 7 8 8
K (kg/ha) 2005 2006 2007 2008 2009 2010 2011 2012 2013 2014 2015
Border 19 18 15 10 10 13 10 12 16 16 16
Mid East 23 19 17 12 10 15 14 18 22 23 23
Midlands 26 26 22 16 14 19 17 16 20 22 20
South 26 26 22 16 13 13 13 15 19 22 21
South East 26 24 20 14 11 17 15 15 20 26 26
South West 21 18 17 13 12 14 16 15 19 21 21
West 22 18 18 10 11 15 14 13 18 18 17
All Regions 23 21 19 13 11 15 14 14 19 20 20
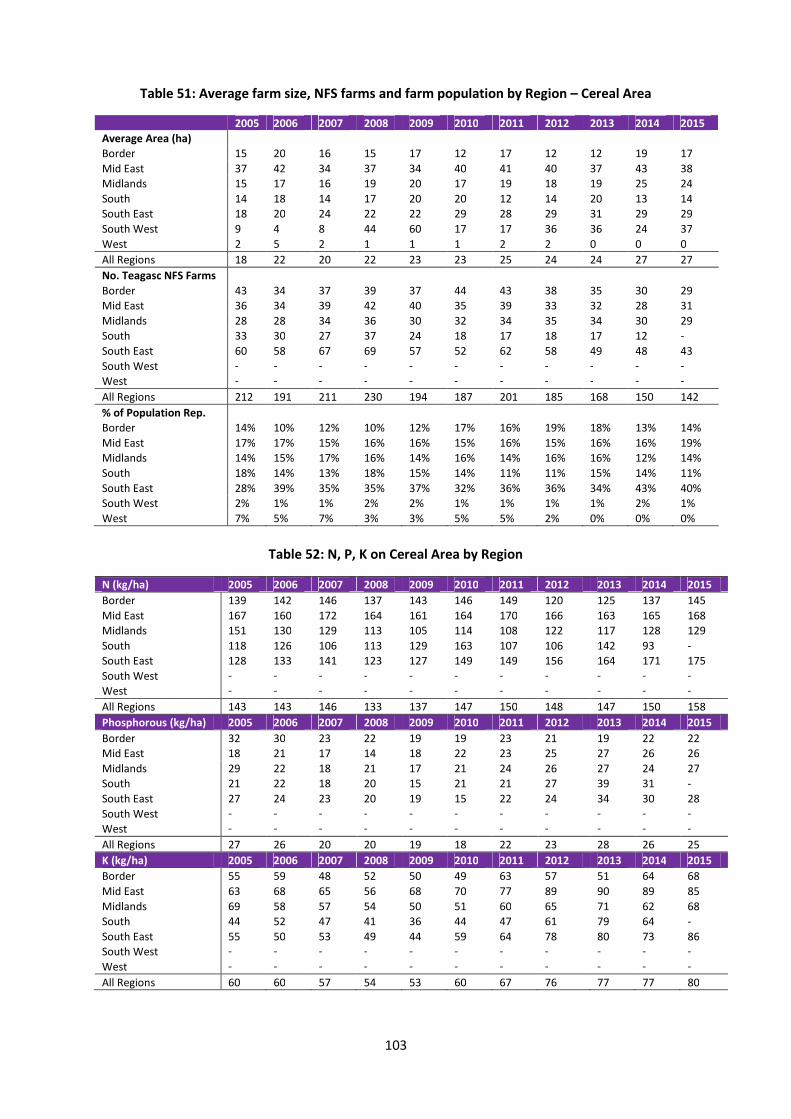
103
Table 51: Average farm size, NFS farms and farm population by Region – Cereal Area
2005 2006 2007 2008 2009 2010 2011 2012 2013 2014 2015
Average Area (ha)
Border 15 20 16 15 17 12 17 12 12 19 17
Mid East 37 42 34 37 34 40 41 40 37 43 38
Midlands 15 17 16 19 20 17 19 18 19 25 24
South 14 18 14 17 20 20 12 14 20 13 14
South East 18 20 24 22 22 29 28 29 31 29 29
South West 9 4 8 44 60 17 17 36 36 24 37
West 2 5 2 1 1 1 2 2 0 0 0
All Regions 18 22 20 22 23 23 25 24 24 27 27
No. Teagasc NFS Farms
Border 43 34 37 39 37 44 43 38 35 30 29
Mid East 36 34 39 42 40 35 39 33 32 28 31
Midlands 28 28 34 36 30 32 34 35 34 30 29
South 33 30 27 37 24 18 17 18 17 12 -
South East 60 58 67 69 57 52 62 58 49 48 43
South West - - - - - - - - - - -
West - - - - - - - - - - -
All Regions 212 191 211 230 194 187 201 185 168 150 142
% of Population Rep.
Border 14% 10% 12% 10% 12% 17% 16% 19% 18% 13% 14%
Mid East 17% 17% 15% 16% 16% 15% 16% 15% 16% 16% 19%
Midlands 14% 15% 17% 16% 14% 16% 14% 16% 16% 12% 14%
South 18% 14% 13% 18% 15% 14% 11% 11% 15% 14% 11%
South East 28% 39% 35% 35% 37% 32% 36% 36% 34% 43% 40%
South West 2% 1% 1% 2% 2% 1% 1% 1% 1% 2% 1%
West 7% 5% 7% 3% 3% 5% 5% 2% 0% 0% 0%
Table 52: N, P, K on Cereal Area by Region
N (kg/ha) 2005 2006 2007 2008 2009 2010 2011 2012 2013 2014 2015
Border 139 142 146 137 143 146 149 120 125 137 145
Mid East 167 160 172 164 161 164 170 166 163 165 168
Midlands 151 130 129 113 105 114 108 122 117 128 129
South 118 126 106 113 129 163 107 106 142 93 -
South East 128 133 141 123 127 149 149 156 164 171 175
South West - - - - - - - - - - -
West - - - - - - - - - - -
All Regions 143 143 146 133 137 147 150 148 147 150 158
Phosphorous (kg/ha) 2005 2006 2007 2008 2009 2010 2011 2012 2013 2014 2015
Border 32 30 23 22 19 19 23 21 19 22 22
Mid East 18 21 17 14 18 22 23 25 27 26 26
Midlands 29 22 18 21 17 21 24 26 27 24 27
South 21 22 18 20 15 21 21 27 39 31 -
South East 27 24 23 20 19 15 22 24 34 30 28
South West - - - - - - - - - - -
West - - - - - - - - - - -
All Regions 27 26 20 20 19 18 22 23 28 26 25
K (kg/ha) 2005 2006 2007 2008 2009 2010 2011 2012 2013 2014 2015
Border 55 59 48 52 50 49 63 57 51 64 68
Mid East 63 68 65 56 68 70 77 89 90 89 85
Midlands 69 58 57 54 50 51 60 65 71 62 68
South 44 52 47 41 36 44 47 61 79 64 -
South East 55 50 53 49 44 59 64 78 80 73 86
South West - - - - - - - - - - -
West - - - - - - - - - - -
All Regions 60 60 57 54 53 60 67 76 77 77 80

104
Table 53: Fertiliser application rates for grazing on dairy farms at different stocking ratesYear Org N No of Farms Pop. % Pop. N P K Area
2005 < 85 kg ON ha-1
17 923 5% 44 4 8 42
2005 85-130 kg ON ha-1
74 4022 20% 90 8 18 34
2005 130-170 kg ON ha-1
165 7087 36% 135 9 20 42
2005 170-210 kg ON ha-1
124 5079 25% 192 11 24 39
2005 > 210 kg ON ha-1
67 2847 14% 260 17 35 30
2006 < 85 kg ON ha-1
16 1029 5% 38 3 8 34
2006 85-130 kg ON ha-1
70 3638 18% 89 7 14 38
2006 130-170 kg ON ha-1
173 7770 39% 136 9 17 43
2006 170-210 kg ON ha-1
99 4932 25% 193 12 24 35
2006 > 210 kg ON ha-1
58 2588 13% 266 16 35 31
2007 < 85 kg ON ha-1
24 1860 9% 36 3 8 33
2007 85-130 kg ON ha-1
69 4088 20% 84 5 11 37
2007 130-170 kg ON ha-1
149 7150 36% 119 6 15 41
2007 170-210 kg ON ha-1
102 4667 23% 175 7 18 41
2007 > 210 kg ON ha-1
46 2191 11% 246 11 26 32
2008 < 85 kg ON ha-1
18 1623 8% 22 1 3 32
2008 85-130 kg ON ha-1
69 4070 20% 68 4 10 39
2008 130-170 kg ON ha-1
156 7839 39% 100 4 9 41
2008 170-210 kg ON ha-1
80 3762 19% 155 5 13 42
2008 > 210 kg ON ha-1
55 2663 13% 201 6 16 34
2009 < 85 kg ON ha-1
15 1583 8% 33 2 4 30
2009 85-130 kg ON ha-1
61 3573 18% 80 2 5 40
2009 130-170 kg ON ha-1
133 7266 36% 120 4 9 43
2009 170-210 kg ON ha-1
92 4655 23% 156 4 10 43
2009 > 210 kg ON ha-1
52 2880 14% 225 6 12 32
2010 < 85 kg ON ha-1
18 1811 9% 39 2 5 30
2010 85-130 kg ON ha-1
66 4306 22% 82 4 10 39
2010 130-170 kg ON ha-1
130 7107 36% 127 5 12 41
2010 170-210 kg ON ha-1
83 4244 21% 163 5 13 38
2010 > 210 kg ON ha-1
49 2489 12% 203 5 9 39
2011 < 85 kg ON ha-1
15 1218 6% 34 2 4 36
2011 85-130 kg ON ha-1
62 4075 21% 71 3 8 41
2011 130-170 kg ON ha-1
142 7334 38% 120 5 14 41
2011 170-210 kg ON ha-1
85 4373 22% 171 5 15 37
2011 > 210 kg ON ha-1
51 2521 13% 216 5 11 38
2012 < 85 kg ON ha-1
15 1149 6% 36 2 5 40
2012 85-130 kg ON ha-1
66 4476 23% 68 4 11 41
2012 130-170 kg ON ha-1
139 6964 36% 119 5 13 42
2012 170-210 kg ON ha-1
98 4862 25% 177 6 14 40
2012 > 210 kg ON ha-1
43 2071 11% 198 6 13 37
2013 < 85 kg ON ha-1
16 1913 10% 30 2 5 30
2013 85-130 kg ON ha-1
59 3210 16% 90 6 13 44
2013 130-170 kg ON ha-1
131 6381 33% 132 7 15 43
2013 170-210 kg ON ha-1
107 5040 26% 183 8 21 39
2013 > 210 kg ON ha-1
59 2978 15% 207 9 24 36
2014 < 85 kg ON ha-1
11 880 5% 20 2 4 52
2014 85-130 kg ON ha-1
58 3358 18% 78 6 15 39
2014 130-170 kg ON ha-1
122 6106 33% 133 8 19 45
2014 170-210 kg ON ha-1
107 5168 28% 176 11 26 42
2014 > 210 kg ON ha-1
55 2857 16% 213 11 28 32
2015 < 85 kg ON ha-1
10 1073 6% 29 2 4 48
2015 85-130 kg ON ha-1
55 3887 21% 73 6 13 39
2015 130-170 kg ON ha-1
115 5443 29% 130 9 21 44
2015 170-210 kg ON ha-1
104 4942 27% 164 10 27 43
2015 > 210 kg ON ha-1
63 3216 17% 188 10 25 33

105
Table 54: Fertiliser application rates for grazing on cattle farms at different stocking rates
Year Org N No of Farms Pop. % Pop. N P K Area
2005 < 85 kg ON ha-1
95 10649 26% 25 4 8 31
2005 85-130 kg ON ha-1
172 19822 48% 46 5 12 28
2005 130-170 kg ON ha-
165 6926 17% 77 8 17 32
2005 170-210 kg ON ha-
123 2661 6% 109 11 24 21
2005 > 210 kg ON ha-1
13 1324 3% 105 11 27 18
2006 < 85 kg ON ha-1
117 12255 30% 28 4 8 32
2006 85-130 kg ON ha-1
173 19406 47% 48 5 11 28
2006 130-170 kg ON ha-
162 6946 17% 68 7 16 26
2006 170-210 kg ON ha-
122 2225 5% 108 10 21 26
2006 > 210 kg ON ha-1
7 548 1% - - - -
2007 < 85 kg ON ha-1
130 12874 31% 21 3 6 33
2007 85-130 kg ON ha-1
183 19306 47% 50 5 11 28
2007 130-170 kg ON ha-
161 6243 15% 62 5 15 26
2007 170-210 kg ON ha-
121 2084 5% 100 7 19 22
2007 > 210 kg ON ha-1
9 874 2% - - - -
2008 < 85 kg ON ha-1
133 12413 30% 16 2 3 33
2008 85-130 kg ON ha-1
194 19943 48% 32 2 6 28
2008 130-170 kg ON ha-
171 6945 17% 58 4 9 27
2008 170-210 kg ON ha-
117 1622 4% 70 6 13 20
2008 > 210 kg ON ha-1
6 458 1% - - - -
2009 < 85 kg ON ha-1
142 13188 32% 23 2 4 33
2009 85-130 kg ON ha-1
187 20065 48% 45 2 6 27
2009 130-170 kg ON ha-
167 6658 16% 67 4 10 28
2009 170-210 kg ON ha-
113 1221 3% 75 3 6 24
2009 > 210 kg ON ha-1
4 249 1% - - - -
2010 < 85 kg ON ha-1
153 15379 37% 28 3 6 31
2010 85-130 kg ON ha-1
163 17547 42% 52 4 9 28
2010 130-170 kg ON ha-
156 6353 15% 69 5 14 26
2010 170-210 kg ON ha-
118 1564 4% 78 4 8 26
2010 > 210 kg ON ha-1
5 537 1% - - - -
2011 < 85 kg ON ha-1
164 17200 42% 22 2 4 31
2011 85-130 kg ON ha-1
151 16386 40% 41 2 6 30
2011 130-170 kg ON ha-
152 5964 14% 67 4 9 26
2011 170-210 kg ON ha-
112 1151 3% 84 3 11 23
2011 > 210 kg ON ha-1
7 679 2% - - - -
2012 < 85 kg ON ha-1
139 14734 36% 20 2 4 32
2012 85-130 kg ON ha-1
157 18369 44% 39 3 8 30
2012 130-170 kg ON ha-
150 6243 15% 64 5 11 25
2012 170-210 kg ON ha-
118 1653 4% 86 4 9 30
2012 > 210 kg ON ha-1
2 383 1% - - - -
2013 < 85 kg ON ha-1
136 14130 34% 25 3 6 31
2013 85-130 kg ON ha-1
155 18159 44% 48 4 9 28
2013 130-170 kg ON ha-
156 6944 17% 82 6 12 27
2013 170-210 kg ON ha-
117 1589 4% 84 5 11 30
2013 > 210 kg ON ha-1
5 560 1% - - - -
2014 < 85 kg ON ha-1
139 17174 37% 18 2 4 29
2014 85-130 kg ON ha-1
160 20546 44% 44 5 11 27
2014 130-170 kg ON ha-
152 7773 17% 87 8 19 25
2014 170-210 kg ON ha-
112 1390 3% 84 6 13 26
2014 > 210 kg ON ha-1
2 94 0% - - - -
2015 < 85 kg ON ha-1
140 17262 37% 19 2 4 29
2015 85-130 kg ON ha-1
148 20759 44% 40 5 11 25
2015 130-170 kg ON ha-
157 7287 16% 77 8 16 27
2015 170-210 kg ON ha-
111 1459 3% 72 4 10 25
2015 > 210 kg ON ha-1
4 210 0% - - - -
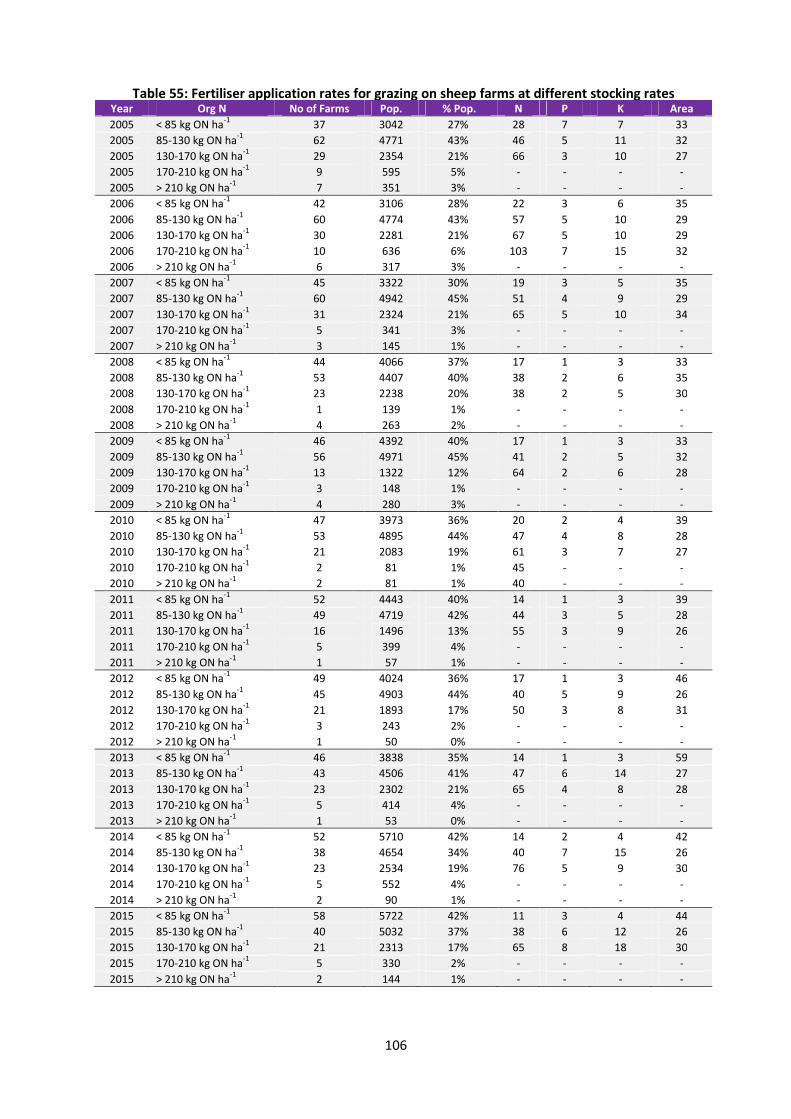
106
Table 55: Fertiliser application rates for grazing on sheep farms at different stocking ratesYear Org N No of Farms Pop. % Pop. N P K Area
2005 < 85 kg ON ha-1
37 3042 27% 28 7 7 33
2005 85-130 kg ON ha-1
62 4771 43% 46 5 11 32
2005 130-170 kg ON ha-1
29 2354 21% 66 3 10 27
2005 170-210 kg ON ha-1
9 595 5% - - - -
2005 > 210 kg ON ha-1
7 351 3% - - - -
2006 < 85 kg ON ha-1
42 3106 28% 22 3 6 35
2006 85-130 kg ON ha-1
60 4774 43% 57 5 10 29
2006 130-170 kg ON ha-1
30 2281 21% 67 5 10 29
2006 170-210 kg ON ha-1
10 636 6% 103 7 15 32
2006 > 210 kg ON ha-1
6 317 3% - - - -
2007 < 85 kg ON ha-1
45 3322 30% 19 3 5 35
2007 85-130 kg ON ha-1
60 4942 45% 51 4 9 29
2007 130-170 kg ON ha-1
31 2324 21% 65 5 10 34
2007 170-210 kg ON ha-1
5 341 3% - - - -
2007 > 210 kg ON ha-1
3 145 1% - - - -
2008 < 85 kg ON ha-1
44 4066 37% 17 1 3 33
2008 85-130 kg ON ha-1
53 4407 40% 38 2 6 35
2008 130-170 kg ON ha-1
23 2238 20% 38 2 5 30
2008 170-210 kg ON ha-1
1 139 1% - - - -
2008 > 210 kg ON ha-1
4 263 2% - - - -
2009 < 85 kg ON ha-1
46 4392 40% 17 1 3 33
2009 85-130 kg ON ha-1
56 4971 45% 41 2 5 32
2009 130-170 kg ON ha-1
13 1322 12% 64 2 6 28
2009 170-210 kg ON ha-1
3 148 1% - - - -
2009 > 210 kg ON ha-1
4 280 3% - - - -
2010 < 85 kg ON ha-1
47 3973 36% 20 2 4 39
2010 85-130 kg ON ha-1
53 4895 44% 47 4 8 28
2010 130-170 kg ON ha-1
21 2083 19% 61 3 7 27
2010 170-210 kg ON ha-1
2 81 1% 45 - - -
2010 > 210 kg ON ha-1
2 81 1% 40 - - -
2011 < 85 kg ON ha-1
52 4443 40% 14 1 3 39
2011 85-130 kg ON ha-1
49 4719 42% 44 3 5 28
2011 130-170 kg ON ha-1
16 1496 13% 55 3 9 26
2011 170-210 kg ON ha-1
5 399 4% - - - -
2011 > 210 kg ON ha-1
1 57 1% - - - -
2012 < 85 kg ON ha-1
49 4024 36% 17 1 3 46
2012 85-130 kg ON ha-1
45 4903 44% 40 5 9 26
2012 130-170 kg ON ha-1
21 1893 17% 50 3 8 31
2012 170-210 kg ON ha-1
3 243 2% - - - -
2012 > 210 kg ON ha-1
1 50 0% - - - -
2013 < 85 kg ON ha-1
46 3838 35% 14 1 3 59
2013 85-130 kg ON ha-1
43 4506 41% 47 6 14 27
2013 130-170 kg ON ha-1
23 2302 21% 65 4 8 28
2013 170-210 kg ON ha-1
5 414 4% - - - -
2013 > 210 kg ON ha-1
1 53 0% - - - -
2014 < 85 kg ON ha-1
52 5710 42% 14 2 4 42
2014 85-130 kg ON ha-1
38 4654 34% 40 7 15 26
2014 130-170 kg ON ha-1
23 2534 19% 76 5 9 30
2014 170-210 kg ON ha-1
5 552 4% - - - -
2014 > 210 kg ON ha-1
2 90 1% - - - -
2015 < 85 kg ON ha-1
58 5722 42% 11 3 4 44
2015 85-130 kg ON ha-1
40 5032 37% 38 6 12 26
2015 130-170 kg ON ha-1
21 2313 17% 65 8 18 30
2015 170-210 kg ON ha-1
5 330 2% - - - -
2015 > 210 kg ON ha-1
2 144 1% - - - -
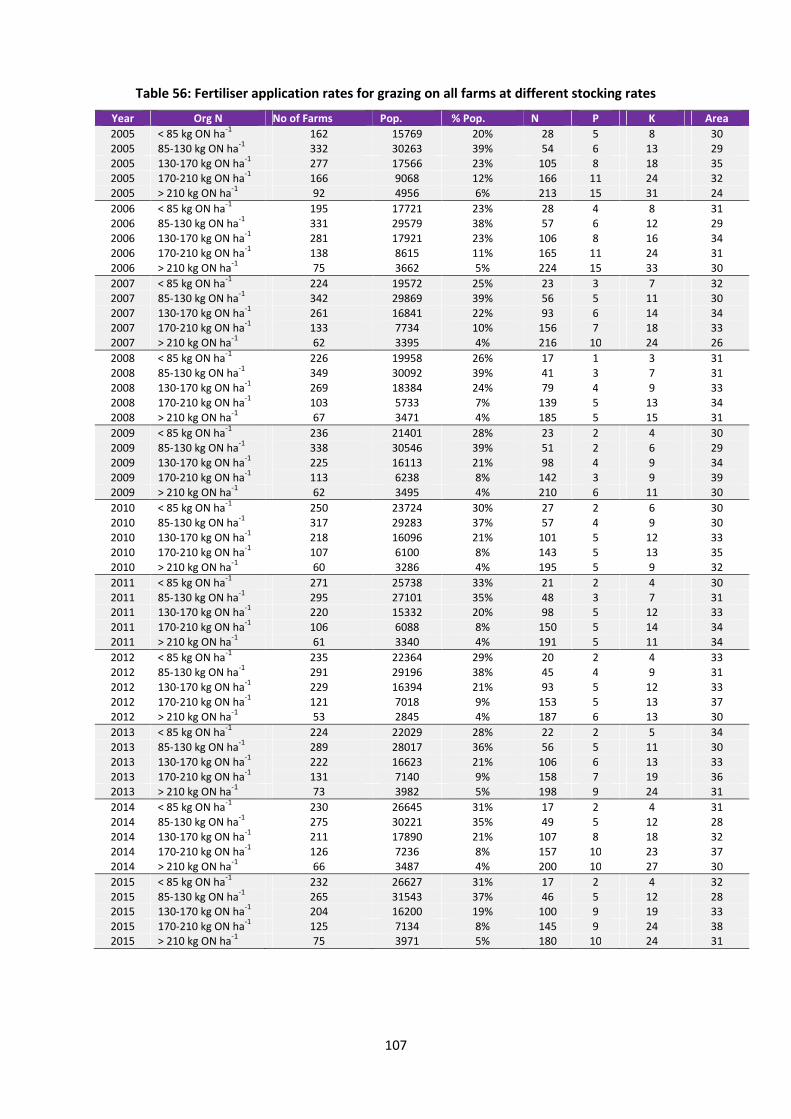
107
Table 56: Fertiliser application rates for grazing on all farms at different stocking rates
Year Org N No of Farms Pop. % Pop. N P K Area
2005 < 85 kg ON ha-1
162 15769 20% 28 5 8 302005 85-130 kg ON ha
-1332 30263 39% 54 6 13 29
2005 130-170 kg ON ha-1
277 17566 23% 105 8 18 352005 170-210 kg ON ha
-1166 9068 12% 166 11 24 32
2005 > 210 kg ON ha-1
92 4956 6% 213 15 31 24
2006 < 85 kg ON ha-1
195 17721 23% 28 4 8 312006 85-130 kg ON ha
-1331 29579 38% 57 6 12 29
2006 130-170 kg ON ha-1
281 17921 23% 106 8 16 342006 170-210 kg ON ha
-1138 8615 11% 165 11 24 31
2006 > 210 kg ON ha-1
75 3662 5% 224 15 33 30
2007 < 85 kg ON ha-1
224 19572 25% 23 3 7 322007 85-130 kg ON ha
-1342 29869 39% 56 5 11 30
2007 130-170 kg ON ha-1
261 16841 22% 93 6 14 342007 170-210 kg ON ha
-1133 7734 10% 156 7 18 33
2007 > 210 kg ON ha-1
62 3395 4% 216 10 24 26
2008 < 85 kg ON ha-1
226 19958 26% 17 1 3 312008 85-130 kg ON ha
-1349 30092 39% 41 3 7 31
2008 130-170 kg ON ha-1
269 18384 24% 79 4 9 332008 170-210 kg ON ha
-1103 5733 7% 139 5 13 34
2008 > 210 kg ON ha-1
67 3471 4% 185 5 15 31
2009 < 85 kg ON ha-1
236 21401 28% 23 2 4 302009 85-130 kg ON ha
-1338 30546 39% 51 2 6 29
2009 130-170 kg ON ha-1
225 16113 21% 98 4 9 342009 170-210 kg ON ha
-1113 6238 8% 142 3 9 39
2009 > 210 kg ON ha-1
62 3495 4% 210 6 11 30
2010 < 85 kg ON ha-1
250 23724 30% 27 2 6 302010 85-130 kg ON ha
-1317 29283 37% 57 4 9 30
2010 130-170 kg ON ha-1
218 16096 21% 101 5 12 332010 170-210 kg ON ha
-1107 6100 8% 143 5 13 35
2010 > 210 kg ON ha-1
60 3286 4% 195 5 9 32
2011 < 85 kg ON ha-1
271 25738 33% 21 2 4 302011 85-130 kg ON ha
-1295 27101 35% 48 3 7 31
2011 130-170 kg ON ha-1
220 15332 20% 98 5 12 332011 170-210 kg ON ha
-1106 6088 8% 150 5 14 34
2011 > 210 kg ON ha-1
61 3340 4% 191 5 11 34
2012 < 85 kg ON ha-1
235 22364 29% 20 2 4 332012 85-130 kg ON ha
-1291 29196 38% 45 4 9 31
2012 130-170 kg ON ha-1
229 16394 21% 93 5 12 332012 170-210 kg ON ha
-1121 7018 9% 153 5 13 37
2012 > 210 kg ON ha-1
53 2845 4% 187 6 13 30
2013 < 85 kg ON ha-1
224 22029 28% 22 2 5 342013 85-130 kg ON ha
-1289 28017 36% 56 5 11 30
2013 130-170 kg ON ha-1
222 16623 21% 106 6 13 332013 170-210 kg ON ha
-1131 7140 9% 158 7 19 36
2013 > 210 kg ON ha-1
73 3982 5% 198 9 24 31
2014 < 85 kg ON ha-1
230 26645 31% 17 2 4 312014 85-130 kg ON ha
-1275 30221 35% 49 5 12 28
2014 130-170 kg ON ha-1
211 17890 21% 107 8 18 322014 170-210 kg ON ha
-1126 7236 8% 157 10 23 37
2014 > 210 kg ON ha-1
66 3487 4% 200 10 27 30
2015 < 85 kg ON ha-1
232 26627 31% 17 2 4 322015 85-130 kg ON ha
-1265 31543 37% 46 5 12 28
2015 130-170 kg ON ha-1
204 16200 19% 100 9 19 332015 170-210 kg ON ha
-1125 7134 8% 145 9 24 38
2015 > 210 kg ON ha-1
75 3971 5% 180 10 24 31