ferrozine assay for simple and cheap iron analysis of
TRANSCRIPT

doi.org/10.26434/chemrxiv.6815672.v1
Ferrozine Assay for Simple and Cheap Iron Analysis of Silica-Coated IronOxide NanoparticlesHattie Ring, Zhe Gao, Nathan D. Klein, Michael Garwood, John C. Bischof, Christy L. Haynes
Submitted date: 13/07/2018 • Posted date: 16/07/2018Licence: CC BY-NC-ND 4.0Citation information: Ring, Hattie; Gao, Zhe; D. Klein, Nathan; Garwood, Michael; Bischof, John C.; Haynes,Christy L. (2018): Ferrozine Assay for Simple and Cheap Iron Analysis of Silica-Coated Iron OxideNanoparticles. ChemRxiv. Preprint.
The Ferrozinen assay is applied as an accurate and rapid method to quantify the iron content of iron oxidenanoparticles (IONPs) and can be used in biological matrices. The addition of ascorbic aqcid accelerates thedigestion process and can penetrate an IONP core within a mesoporous and solid silica shell. This newdigestion protocol avoids the need for hydrofluoric acid to digest the surrounding silica shell and provides andaccessible alternative to inductively coupled plasma methods. With the updated digestion protocol, thequantitative range of the Ferrozine assay is 1 - 14 ppm.
File list (2)
download fileview on ChemRxiv2018Jul13_FerrozineManuscript_SI_SUBMITTED.pdf (585.37 KiB)
download fileview on ChemRxiv2018Jul13_FerrozineManuscript_SUBMITTED.pdf (636.24 KiB)

Supplementary Information
Ferrozine assay for simple and cheap iron analysis of silica-coated iron oxide
nanoparticles
Hattie .L. Ring, Zhe Gao, Nathan Klein, Michael Garwood, John C. Bischof and Christy L. Haynes
University of Minnesota, Minneapolis, MN, USA
Supplemental Figure:
Figure S1. Bias measurement for each IONP, acid condition, and Ferrozine assay development time. The high bias (> 3) of the HCl 3
h condition for msIONP and ssIONP is shown in the smaller bar graph to the right of the original plots.
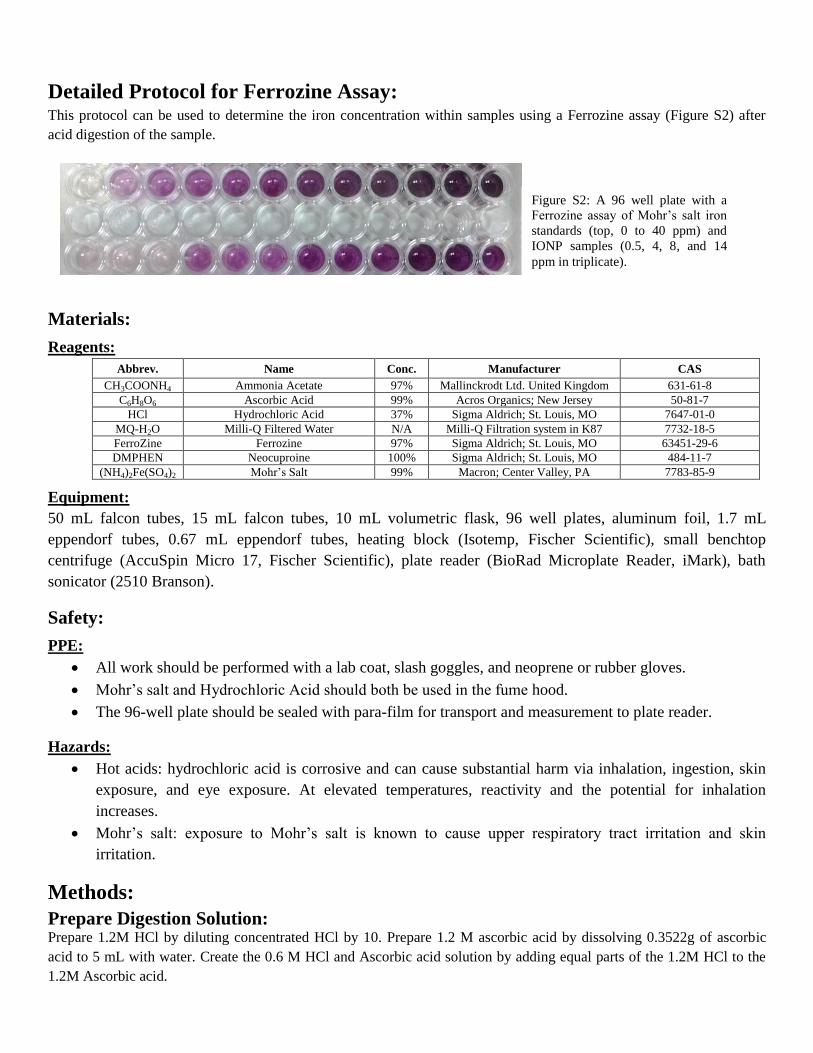
Detailed Protocol for Ferrozine Assay: This protocol can be used to determine the iron concentration within samples using a Ferrozine assay (Figure S2) after
acid digestion of the sample.
Materials:
Reagents:
Abbrev. Name Conc. Manufacturer CAS
CH3COONH4 Ammonia Acetate 97% Mallinckrodt Ltd. United Kingdom 631-61-8
C6H8O6 Ascorbic Acid 99% Acros Organics; New Jersey 50-81-7
HCl Hydrochloric Acid 37% Sigma Aldrich; St. Louis, MO 7647-01-0
MQ-H2O Milli-Q Filtered Water N/A Milli-Q Filtration system in K87 7732-18-5
FerroZine Ferrozine 97% Sigma Aldrich; St. Louis, MO 63451-29-6
DMPHEN Neocuproine 100% Sigma Aldrich; St. Louis, MO 484-11-7
(NH4)2Fe(SO4)2 Mohr’s Salt 99% Macron; Center Valley, PA 7783-85-9
Equipment:
50 mL falcon tubes, 15 mL falcon tubes, 10 mL volumetric flask, 96 well plates, aluminum foil, 1.7 mL
eppendorf tubes, 0.67 mL eppendorf tubes, heating block (Isotemp, Fischer Scientific), small benchtop
centrifuge (AccuSpin Micro 17, Fischer Scientific), plate reader (BioRad Microplate Reader, iMark), bath
sonicator (2510 Branson).
Safety:
PPE:
All work should be performed with a lab coat, slash goggles, and neoprene or rubber gloves.
Mohr’s salt and Hydrochloric Acid should both be used in the fume hood.
The 96-well plate should be sealed with para-film for transport and measurement to plate reader.
Hazards:
Hot acids: hydrochloric acid is corrosive and can cause substantial harm via inhalation, ingestion, skin
exposure, and eye exposure. At elevated temperatures, reactivity and the potential for inhalation
increases.
Mohr’s salt: exposure to Mohr’s salt is known to cause upper respiratory tract irritation and skin
irritation.
Methods:
Prepare Digestion Solution: Prepare 1.2M HCl by diluting concentrated HCl by 10. Prepare 1.2 M ascorbic acid by dissolving 0.3522g of ascorbic
acid to 5 mL with water. Create the 0.6 M HCl and Ascorbic acid solution by adding equal parts of the 1.2M HCl to the
1.2M Ascorbic acid.
Figure S2: A 96 well plate with a
Ferrozine assay of Mohr’s salt iron
standards (top, 0 to 40 ppm) and
IONP samples (0.5, 4, 8, and 14
ppm in triplicate).
All solutions should be clear. Over time, degraded ascorbic acid will have a yellow tinge. If a yellow color is observed in
the solution, new acid solutions need to be prepared. Note that the ascorbic acid is more stable when stored separately
from the hydrochloric acid. The 0.6 M HCl and ascorbic acid is typically stable for less than 1 week, whereas the 1.2 M
ascorbic acid solution is stable for approximately 2 weeks.
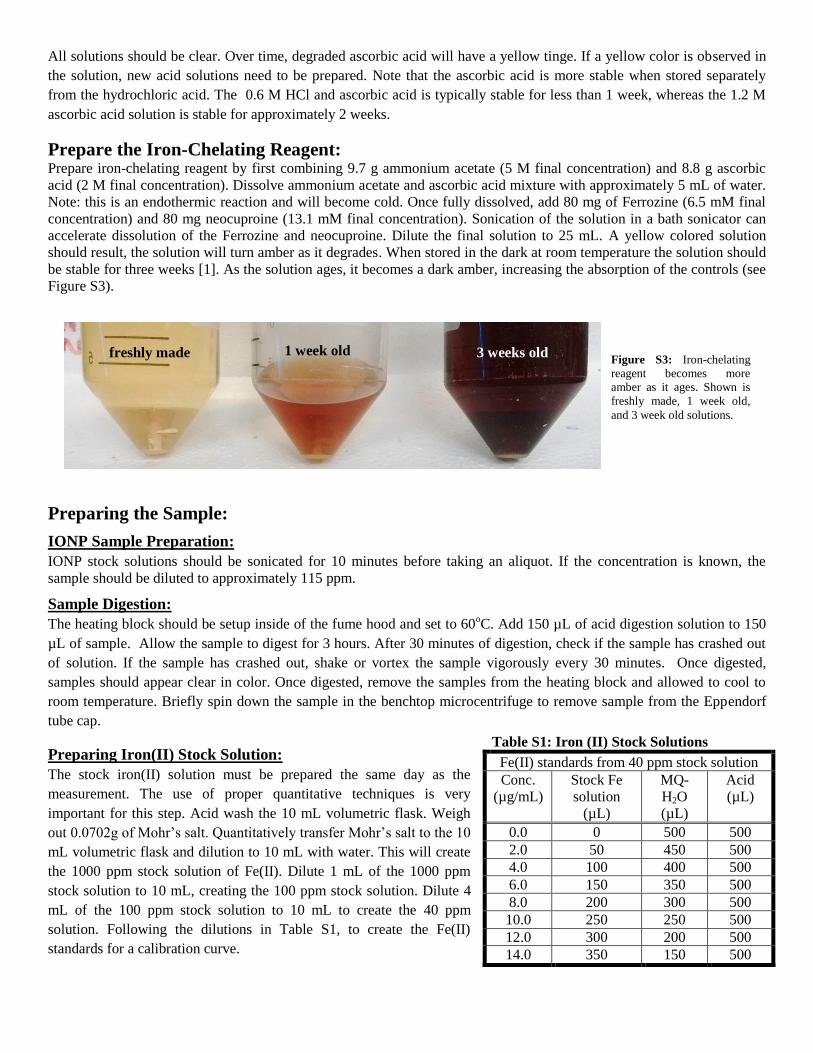
Prepare the Iron-Chelating Reagent: Prepare iron-chelating reagent by first combining 9.7 g ammonium acetate (5 M final concentration) and 8.8 g ascorbic
acid (2 M final concentration). Dissolve ammonium acetate and ascorbic acid mixture with approximately 5 mL of water.
Note: this is an endothermic reaction and will become cold. Once fully dissolved, add 80 mg of Ferrozine (6.5 mM final
concentration) and 80 mg neocuproine (13.1 mM final concentration). Sonication of the solution in a bath sonicator can
accelerate dissolution of the Ferrozine and neocuproine. Dilute the final solution to 25 mL. A yellow colored solution
should result, the solution will turn amber as it degrades. When stored in the dark at room temperature the solution should
be stable for three weeks [1]. As the solution ages, it becomes a dark amber, increasing the absorption of the controls (see
Figure S3).
Preparing the Sample:
IONP Sample Preparation:
IONP stock solutions should be sonicated for 10 minutes before taking an aliquot. If the concentration is known, the
sample should be diluted to approximately 115 ppm.
Sample Digestion:
The heating block should be setup inside of the fume hood and set to 60oC. Add 150 µL of acid digestion solution to 150
µL of sample. Allow the sample to digest for 3 hours. After 30 minutes of digestion, check if the sample has crashed out
of solution. If the sample has crashed out, shake or vortex the sample vigorously every 30 minutes. Once digested,
samples should appear clear in color. Once digested, remove the samples from the heating block and allowed to cool to
room temperature. Briefly spin down the sample in the benchtop microcentrifuge to remove sample from the Eppendorf
tube cap.
Preparing Iron(II) Stock Solution:
The stock iron(II) solution must be prepared the same day as the
measurement. The use of proper quantitative techniques is very
important for this step. Acid wash the 10 mL volumetric flask. Weigh
out 0.0702g of Mohr’s salt. Quantitatively transfer Mohr’s salt to the 10
mL volumetric flask and dilution to 10 mL with water. This will create
the 1000 ppm stock solution of Fe(II). Dilute 1 mL of the 1000 ppm
stock solution to 10 mL, creating the 100 ppm stock solution. Dilute 4
mL of the 100 ppm stock solution to 10 mL to create the 40 ppm
solution. Following the dilutions in Table S1, to create the Fe(II)
standards for a calibration curve.
Table S1: Iron (II) Stock Solutions
Fe(II) standards from 40 ppm stock solution
Conc.
(µg/mL)
Stock Fe
solution
(µL)
MQ-
H2O
(µL)
Acid
(µL)
0.0 0 500 500
2.0 50 450 500
4.0 100 400 500
6.0 150 350 500
8.0 200 300 500
10.0 250 250 500
12.0 300 200 500
14.0 350 150 500
freshly made 1 week old 3 weeks old Figure S3: Iron-chelating
reagent becomes more
amber as it ages. Shown is
freshly made, 1 week old,
and 3 week old solutions.

Ferrozine Assay:
If the solution concentration is known, it is best to have at least two samples fall within the 1 – 14 ppm concentration
range. A discrepancy between these two measurements is indicative of an error in dilution often caused by uncalibrated
pipets. If the concentration is unknown, serial 4x dilutions are recommended. All Dilutions should be performed in
Eppendorf tubes with a dilution 1:1 H2O:Acid.
Add 140 µL of each sample or standard to a well in the 96 well plate. Then add 70 µL of the iron-chelating reagent. Seal
the 96 well plate with parafilm. Cover the 96 well plate with aluminum foil. Allow the assay to develop for at least 30
minutes. Read the assay with UV/Vis plate reader. 562 nm is the optimal wavelength [2], however, measurements at 540
or 570 nm also have a linear correlation with iron concentration.
Troubleshooting: Table S2 lists common problems with the Ferrozine assay and troubleshooting measures.
Table S2: Ferrozine Troubleshooting
Color change does not occur with
standards The standards prepared with Mohr’s salt must be prepared the day of use
and will degrade within 24 h [1]. However, ferric chloride has been reported
to remain stable for up to a week [3].
The pH of the standards and samples should be between 4 – 9 [2].
The control standard indicates the
presence of iron Ensure that all glassware has been acid washed before use.
Individually test reagents to determine which reagent has iron
contamination. If the ascorbic acid or ammonia acetate contain the iron
impurity, run ascorbic acid and ammonia acetate solution through a Chelex
resin column before adding the Ferrozine and neuocuprion to the chelating
solution [1].
Two measurements of the same
sample within the dynamic range
of the Ferrozine assay gives
different values
Check the calibration of micropipets used for dilution.
Perform troubleshooting listed below for potential interference agents.
Color change is lower than
anticipated with samples Sources of interference include:
o Copper (I) – should be removed with neocuproine [1]
o Cobalt(II) [1]
o Iron(III) – see note below
o Oxalate [2]
o Cyanide – removed by heating [2]
o Nitrite – removed by heating [2]
Comparison with a secondary
method indicates an inconsistent
result
Check that the standards and samples are measured with the same matrix.
Ensure that iron standard salt is quantitatively transferred before dilution.
Note: all troubleshooting recommendations listed above will also impact the
accuracy of the iron quantification.
Interfering Agents – Iron (III):
The presence of iron(III) is an interfering agent for the Ferrozine
assay and therefore, the presence of ascorbic acid to ensure a full
reduction to iron(II) is vital. Both the digestion and Ferrozine
assay give symptoms when there is a presence of high iron(III)
(see Figure S4). Digested samples with high concentrations of
iron(III) appear yellow and transparent. Samples digested with
ascorbic acid, and hence without iron(III) should appear clear.
Furthermore, a Ferrozine assay performed on a sample with a high
iron(III) content will acquire a reddish hue potentially with a
precipitant. High concentrations of iron(III) can be caused by old
Normal High Fe3
Figure S4: Symptoms of
ascorbic acid degradation.
Samples digested with
ascorbic acid should be clear
(top left). A yellow solution
indicates the presence of high
Fe3+ (top right). A typical
Ferrozine assay has a
purple/fuchsia color tone
(bottom left). When a lot of
Fe3+ is present, the Ferrozine
assay takes on a
reddish/magenta hue.

ascorbic acid, which only has a 2 years shelf life, under ideal storage conditions [4].
References: 1. Fish, W.W., Rapid colorimetric micromethod for the quantitation of complexed iron in biological samples.
Methods in enzymology, 1988. 158: p. 357-364. 2. Stookey, L.L., Ferrozine---a new spectrophotometric reagent for iron. Analytical Chemistry, 1970. 42(7): p. 779-
781. 3. Hedayati, M., et al., An optimised spectrophotometric assay for convenient and accurate quantitation of
intracellular iron from iron oxide nanoparticles. International Journal of Hyperthermia, 2017: p. 1-9. 4. Kennedy, J., et al., The use of reversed-phase HPLC for the determination of purity and stability on storage of L-
ascorbic acid samples. J. Micronutr. Anal., 1989(5): p. 281-289.

download fileview on ChemRxiv2018Jul13_FerrozineManuscript_SI_SUBMITTED.pdf (585.37 KiB)

1
Ferrozine Assay for Simple and Cheap Iron Analysis
of Silica-Coated Iron Oxide Nanoparticles
Hattie L. Ringa,b
, Zhe Gaoa,c
, Nathan Kleina, Michael Garwood
b, John C. Bischof
c, Christy L.
Haynesa,*
a Department of Chemistry;
b Center for Magnetic Resonance Research;
c Department of
Mechanical Engineering, University of Minnesota, Minneapolis, MN.
KEYWORDS: Iron Oxide Nanoparticles, IONPs, Ferrozine assay, Silica-coating, Mesoporous
Silica Nanoparticles, Silica Nanoparticles.
ABSTRACT: The Ferrozine assay is applied as an accurate and rapid method to quantify the iron
content of iron oxide nanoparticles (IONPs) and can be used in biological matrices. The addition
of ascorbic acid accelerates the digestion process and can penetrate an IONP core within a
mesoporous or solid silica shell. This new digestion protocol avoids the need for hydrofluoric
acid to digest the surrounding silica shell and provides an accessible alternative to inductively
coupled plasma methods. With the updated digestion protocol, the quantitative range of the
Ferrozine assay is 1 – 14 ppm.
INTRODUCTION:
The Ferrozine assay is a simple and accurate colorimetry assay for iron quantification. The
chelator, 3-(2-pyridyl)-5,6-bis(4-pheylsulfonic acid)-1,2,4-triazine (Ferrozine), absorbs at 562
nm when bound to ferrous iron, allowing for quantification [1, 2]. The original protocol by
Carter et. al. was developed for the quantification of endogenous iron in blood[3]. Since its
inception, the Ferrozine assay has been applied to the detection of iron within a variety of
biological and geological samples [1, 4-9].
Inductively coupled plasma (ICP) methods are considered the gold standard for iron
quantification and have a lower limit which ranges from ppb – ppt based on the detection method
[10, 11]. However, several challenges are associated with using ICP methods, such as the costly
equipment, necessary weekly maintenance, special training, and great care to remove any
impurities since ICP is very sensitive to interferences caused by polyatomic and environmental
iron contamination [12]. Therefore, the Ferrozine assay can provide a cheaper and more
accessible iron quantification method.

2
Iron-oxide nanoparticles (IONPs) are receiving increased attention based on their potential for
biomedical applications such as MRI contrast, hyperthermia therapy, regenerative medicine, cell
targeting, and drug delivery [13-19]. Quantification of iron content is vital for accurate IONP
characterization and IONP interaction within in situ systems. Ferrozine assay procedures have
been applied to IONPs within samples containing biological cells [20-24]. However, in
performing a comparison between Ferrozine assay, Ferene assay, and ICP-OES, Hedayati et. al.
commented on the importance of full IONP digestion to ensure accurate iron quantification [24].
Silica-based coatings are a promising candidate to enhance IONP stability against aggregation
and degradation when deployed within biological solutions [25, 26]. The synthesis of the silica
shell can be easily tailored to adjust physical parameters, such as shell thickness, surface
functionality, and porosity [27, 28]. However, silica-based coatings provide an additional
challenge for iron quantification, since hydrofluoric acid is necessary to dissolve the silica shell.
With the Ferrozine assay in particular, the presence of silica has been documented to effect the
iron quantification due to the potential to hinder full digestion of the IONP [29]. Herein, we
demonstrate a digestion method which fully dissolves an IONP encased in a mesoporous or solid
silica shell and the impact this digestion has on the Ferrozine assay.
EXPERIMENTAL SECTION:
Materials and Reagents:
Ammonium acetate (631-51-8) was purchased from Mallinckrodt Ltd, United Kingdom.
Ascorbic acid (50-81-7) was purchased from Acros Organics, USA. Mohr’s salt (7783-85-9) was
acquired from Macron, USA. Concentrated hydrochloric acid (7647-01-0), Ferrozine (63451-29-
6), neocuproine (484-11-7), and polyvinylpyrrolidone (PVP-10, average molecular weight
10,000) were purchased from Sigma Aldrich, USA. Chlorotrimethylsilane (TMS, >99%) was
purchased form Fluka, USA. 2-[methoxy(polyethyleneoxy)-propyl]9-12-trimethoxysilane (PEG-
silane, molecular weight 596-725 g/mol, 9-12 EO) was obtained from Gelest, Inc., USA. All
reagents were used as received. All glassware used during this procedure was acid washed with
concentrated hydrochloric acid.
Iron Oxide Nanoparticles:
This experiment compared the same IONP core without a shell, with a mesoporous silica shell
(msIONP), and with a solid silica shell (ssIONP). The IONP core was purchased from Ferrotec
(EMG-308; Bedford, NH, USA). The msIONPs were synthesized as described previously [30].
The shell thickness was measured using transmission electron microscopy (TEM) to be 15 ± 3
nm. The ssIONPs were synthesized following a modified Stober synthesis[31]. The stability of
the IONPs during synthesis was maintained using PVP-10 at the same ratio used for the msIONP
synthesis (2:3 IONP:PVP-10) [30]. After the solid silica shell was condensed around the IONP
core, PEG-silane and TMS were added. The TEOS:PEG-silane:TMS ratio was kept at 80:20:3.
The shell thickness was measured to be 17 ± 2 nm by TEM. The msIONPs and ssIONPs were
stored after lyophilization. The msIONPs and ssIONPs were dispersed in water. All stock
solutions were sonicated for 10 minutes before use and diluted to approximately 230 ppm for
iron concentration validation.

3
Silica shell thickness was verified using transmission electron microscopy (TEM). TEM was
performed on a Tecnai T12 transmission electron microscope operating at 120 kV. Nanoparticle
samples were deposited on a 200 mesh copper TEM grid with carbon and Formvar supports (Ted
Pella, Inc) by briefly dipping the grid into an ethanol or aqueous suspension of silica-coated
IONPs and allowing the grid to air-dry.
Sample Digestion:
Samples were digested at 600 µL volumes in a block heater set to 60oC. Literature precedent
IONP digestion methods for a Ferrozine assay varied in acid and concentration. In particular,
hydrochloric acid ranged from 0.3 to 12 M [20-23]. Kalambur et. al. deviated from the use of
only hydrochloric acid for digestion to a combination of both hydrochloric and ascorbic acid
[22]. We selected 0.3 M concentrations to return to the acid concentration recommendation from
Fish et. al. [1]. A comparison was made between samples digested in 0.3 M hydrochloric and 0.3
M ascorbic acids or only 0.3 M hydrochloric acid. Digestion times were varied between 3 and 24
h. Samples were assessed every 30 minutes during digestion to check if the IONPs had crashed
out of solution. If the IONPs had crashed out of solution, the samples were agitated by vortexing
for 5 s. Each digested sample was split into two portions, one for analysis by Ferrozine assay and
the other for ICP-OES.
Colorimetric Assay:
A detailed description of both the sample digestion and colorimetric assay is given in the
supplemental information. The iron-chelating reagent was prepared by dissolving ammonium
acetate, ascorbic acid, Ferrozine, and neocuproine in water to have final concentrations of 5 M, 2
M, 6.5 mM, and 13.1 mM, respectively. Each assay was prepared within a 96-well plate. Each
individual well had a ratio of 2:1 sample:iron-chelating reagent. The assay was allowed to
incubate at room temperature in the dark for 0.5, 1, 2, and 24 h. The absorption was measured at
570 nm using a BioRad Microplate Reader, iMark (Hercules, CA, USA). An internal calibration
was prepared on the 96-well plate using an iron (II) stock solution prepared from Mohr’s salt.
The iron (II) stock solution was prepared on the date of use and was prepared at concentrations
0.0
0.5
1.0
1.5
2.0
2.5
3.0
3.5
0 10 20 30 40 50
Ab
sorp
tio
n (
arb
.)
[Fe] (ppm)
Figure 1: An iron(II) standard calibration for Ferrozine assay using Mohr’s salt. The measurements range from
0 to 40 ppm demonstrating the limit of the linear range (1 – 14 ppm). Error bars demonstrate the standard
deviation of the absorption measurements (n = 3).

4
of 0 to 40 ppm. The digested IONP samples were diluted to approximate concentrations ranging
from 0.5 to 20 ppm for further analysis. As shown in Figure 1, with our experimental setup, we
observed the linear range to be between 1 – 14 ppm. This assay has been demonstrated to
quantify iron concentrations as low as 42 ppb by increasing the development time of the assay
[32]. The results of the assay were compared to iron concentrations measured using inductively
coupled plasma-optimal emission spectroscopy (ICP-OES).
Iron Concentration Validation:
ICP-OES of the iron concentration was performed on a Thermo Scientific iCAP 6500 dual-view
ICP-OES (West Palm Beach, FL, USA) with 1150W power. To fully dissolve the silica shell, a
5% by volume concentration of hydrofluoric acid was obtained by adding trace metal grade
concentration hydrofluoric acid to the digested samples. The samples were subsequently diluted
to an approximate iron concentration of 1.5 ppm and 2% nitric acid by volume, using trace metal
grade concentrated nitric acid. Calibration standards were prepared using single-element
standard solutions (SPEX CertiPrep) in 2% nitric acid with an yttrium internal standard.
Bland-Altman Assessment:
The iron concentrations measured by ICP-OES and in the linear range (1 – 14 ppm, see Figure 1)
of the Ferrozine assay were compared using a ratio Bland-Altman assessment [33]. If the
methods perfectly matched, the bias should be 1. A positive bias indicates the Ferrozine assay
Figure 2: Digestion solution color change. Digested IONPs appear clear in color, while undigested IONPs have a
brown hue. IONP cores (EMG-308) all become a clear color under all digestion solutions and time points. IONPs
with a silica shell (msIONPs & ssIONPs) maintained an obvious brown hue when digested in hydrochloric acid
for 3 h. Although difficult to distinguish within the image, the 24 h hydrochloric acid digestion of ssIONP still
maintained a subtle brown hue. A black outline was added to images of samples with difficult to distinguish edges.
5
measures a lower iron concentration compared to ICP-OES. Statistical analysis was performed
using GraphPad Prism 7.01.
RESULTS & DISCUSSION:
The change in solution color was an indication of the progress of digestion. During digestion,
samples were observed to change from a brown opaque solution to a transparent clear (Figure 2).
The presence of the silica shell was observed to have a visual impact on the speed of IONP
digestion. Both msIONPs and ssIONPs maintained a brown hue when digested in only
hydrochloric acid for 3 h. Furthermore, the ssIONPs were not fully clear after 24 h in
hydrochloric acid. All three nanoparticles visually appeared to be fully digested after three hours
in the hydrochloric and ascorbic acid mixture. The observation of a clear solution under the same
conditions but at 24 h indicates that the presence of the silica shell delays the digestion process.
Although solutions appeared clear earlier (for some solutions as quick as 30 min), the 3 h time
point was used to compare directly with the digestion efficacy of only hydrochloric acid.
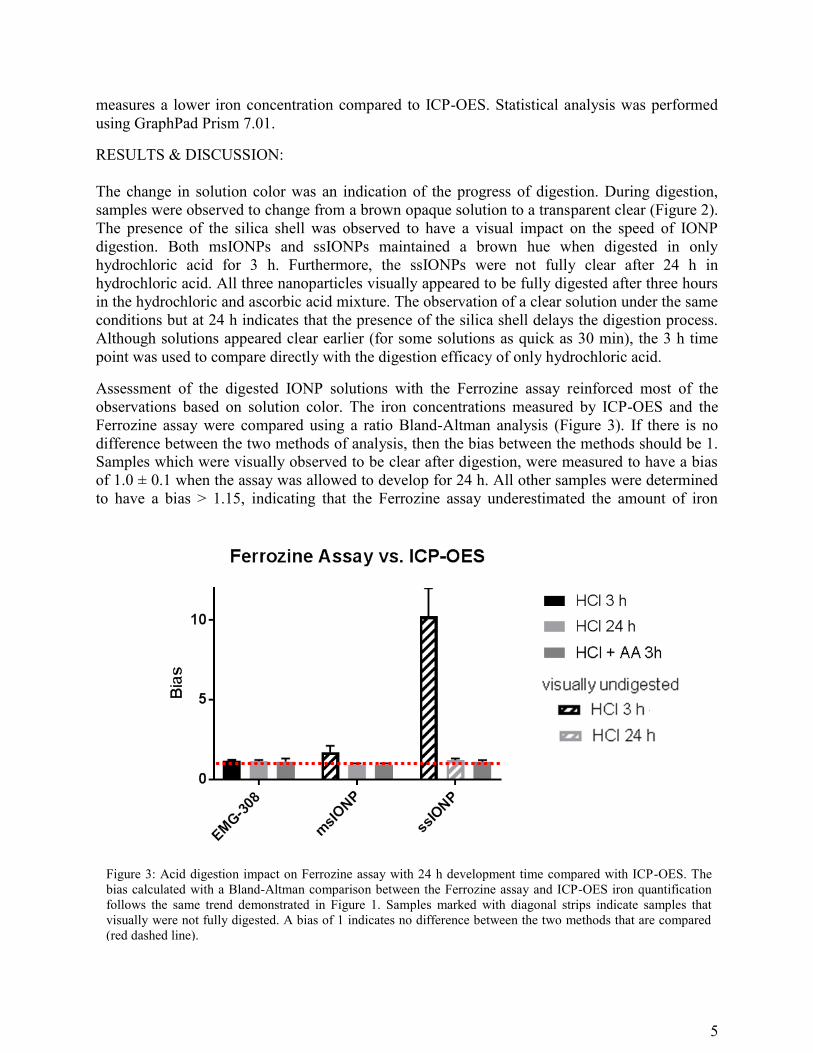
Assessment of the digested IONP solutions with the Ferrozine assay reinforced most of the
observations based on solution color. The iron concentrations measured by ICP-OES and the
Ferrozine assay were compared using a ratio Bland-Altman analysis (Figure 3). If there is no
difference between the two methods of analysis, then the bias between the methods should be 1.
Samples which were visually observed to be clear after digestion, were measured to have a bias
of 1.0 ± 0.1 when the assay was allowed to develop for 24 h. All other samples were determined
to have a bias > 1.15, indicating that the Ferrozine assay underestimated the amount of iron
Figure 3: Acid digestion impact on Ferrozine assay with 24 h development time compared with ICP-OES. The
bias calculated with a Bland-Altman comparison between the Ferrozine assay and ICP-OES iron quantification
follows the same trend demonstrated in Figure 1. Samples marked with diagonal strips indicate samples that
visually were not fully digested. A bias of 1 indicates no difference between the two methods that are compared
(red dashed line).
6
present per sample. This observation matches the variation between ICP-MS and the Ferene
spectroscopic assay used by Hedayati et. al.[24]. When the assay was developed for shorter time
durations (30 min, 1 h, and 2 h), the solution color change was not always a reliable indication of
complete digestion.
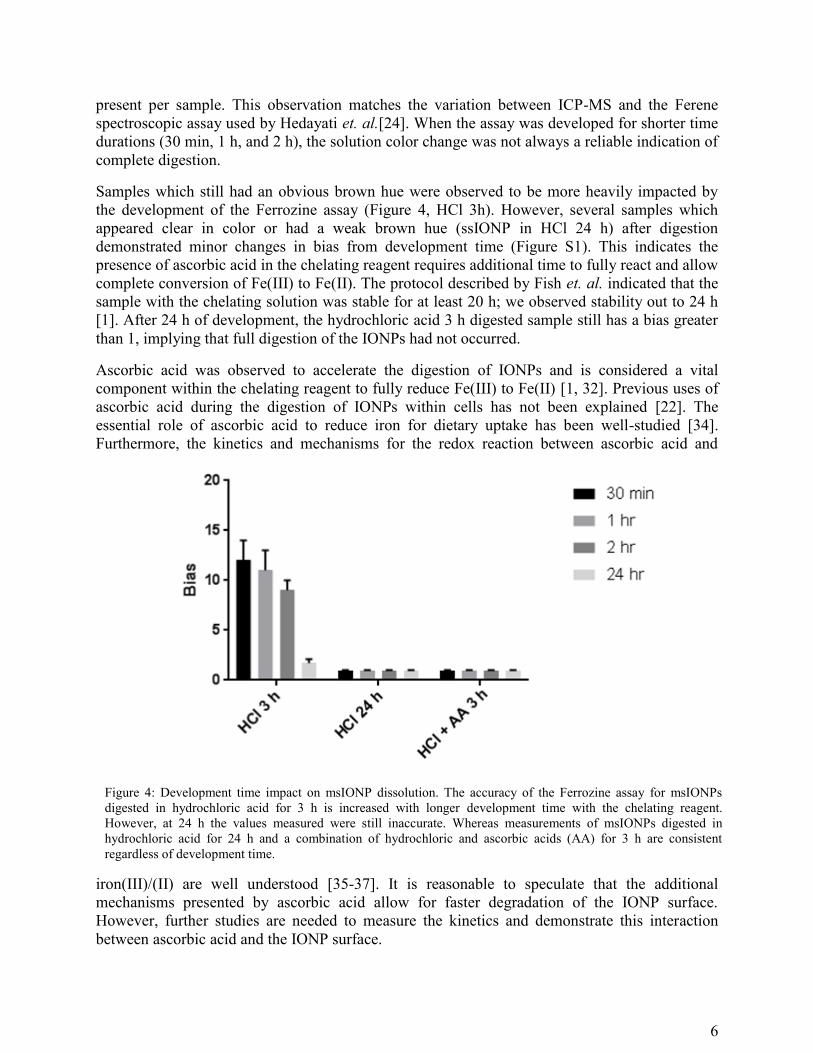
Samples which still had an obvious brown hue were observed to be more heavily impacted by
the development of the Ferrozine assay (Figure 4, HCl 3h). However, several samples which
appeared clear in color or had a weak brown hue (ssIONP in HCl 24 h) after digestion
demonstrated minor changes in bias from development time (Figure S1). This indicates the
presence of ascorbic acid in the chelating reagent requires additional time to fully react and allow
complete conversion of Fe(III) to Fe(II). The protocol described by Fish et. al. indicated that the
sample with the chelating solution was stable for at least 20 h; we observed stability out to 24 h
[1]. After 24 h of development, the hydrochloric acid 3 h digested sample still has a bias greater
than 1, implying that full digestion of the IONPs had not occurred.
Ascorbic acid was observed to accelerate the digestion of IONPs and is considered a vital
component within the chelating reagent to fully reduce Fe(III) to Fe(II) [1, 32]. Previous uses of
ascorbic acid during the digestion of IONPs within cells has not been explained [22]. The
essential role of ascorbic acid to reduce iron for dietary uptake has been well-studied [34].
Furthermore, the kinetics and mechanisms for the redox reaction between ascorbic acid and
iron(III)/(II) are well understood [35-37]. It is reasonable to speculate that the additional
mechanisms presented by ascorbic acid allow for faster degradation of the IONP surface.
However, further studies are needed to measure the kinetics and demonstrate this interaction
between ascorbic acid and the IONP surface.
Figure 4: Development time impact on msIONP dissolution. The accuracy of the Ferrozine assay for msIONPs
digested in hydrochloric acid for 3 h is increased with longer development time with the chelating reagent.
However, at 24 h the values measured were still inaccurate. Whereas measurements of msIONPs digested in
hydrochloric acid for 24 h and a combination of hydrochloric and ascorbic acids (AA) for 3 h are consistent
regardless of development time.
7
The digestion of the IONP core indicates that acid was able to pass through both the mesoporous
and solid silica shell. The hydrothermal treatment, used with the msIONPs investigated herein,
has been previously observed to inhibit the degradation of IONPs by 1 M hydrochloric acid [38].
It is more surprising that digestion of the IONP core was possible through a solid silica shell.
However, Pinho et. al. explored the impact of solid silica shell thickness on magnetic resonance
relaxivity, demonstrating water diffusion through the solid silica shell at shell thicknesses less
than 30 nm [28]. Furthermore, solid silica shells have been demonstrated to have an
ultramicroporous or microporous structure dependent on the washing procedures used after
synthesis [39]. Therefore, it is reasonable that our solid silica shell, which was 17 nm thick,
would allow passage of acid through the shell. It should be anticipated that a thicker solid silica
shell would necessitate a longer digestion time.
As IONPs are more heavily investigated for biomedical applications, it is becoming more
common to use the Ferrozine assay to validate doses and performance [20-23, 40]. The original
Ferrozine assay protocols were developed as an alternative to ICP-OES for endogenous sources
of iron within the body. These protocols were optimized to remove effects from interference
agents that are common within biological specimens, such as copper [1]. When developing a
Ferrozine assay protocol for a new IONP, it is important to realize there can be potential
interference caused by degraded products of the IONP surface coatings. Specific concerns would
be degraded components that could form oxalates, cyanide, and nitrites [41]. Additionally, as
observed in this work and by others [24], full digestion of the IONP is essential for accurate iron
quantification. Therefore, verification of this assay when it is initially applied to a new IONP
formulation is recommended.
CONCLUSIONS:
Iron quantification with the Ferrozine assay has been verified for IONPs and demonstrated for
IONPs with solid and mesoporous silica shells. The presence of ascorbic acid during the
digestion step was observed to accelerate digestion. The inclusion of ascorbic acid during the
digestion step of the assay was essential to achieve full digestion of the IONP in the presence of
a silica shell and avoided the need to use hydrofluoric acid to fully digest the silica shell.
Additionally, for the investigated IONPs, no interference between the surfactants on the IONP
and the Ferrozine assay were observed.
Corresponding Author
A-14, 139 Smith Hall, 207 Pleasant St SE, Minneapolis, MN 55455-0431. [email protected]
Funding Sources
The authors acknowledge support from NSF under the Center for Sustainable Nanotechnology,
CHE-1503408 and NSF CBET 1336659, NIH P41 EB015894.
ACKNOWLEDGMENT

8
HLR thanks Anirudh Sharma, Katie Hurley, and Daniel Bakke for discussion related to this
method. ICP-OES was acquired through the University of Minnesota Geochemical Lab. Parts of
the work were carried out in the Characterization Facility, University of Minnesota, which
receives partial support from NSF through the MRSEC program.
REFERENCES
1. Fish, W.W., Rapid colorimetric micromethod for the quantitation of complexed iron in biological samples. Methods in enzymology, 1988. 158: p. 357-364.
2. Stookey, L.L., Ferrozine---a new spectrophotometric reagent for iron. Analytical Chemistry, 1970. 42(7): p. 779-781. 3. Carter, P., Spectrophotometric determination of serum iron at the submicrogram level with a new reagent (ferrozine).
Analytical Biochemistry, 1971. 40(2): p. 450-458. 4. Riemer, J., et al., Colorimetric ferrozine-based assay for the quantitation of iron in cultured cells. Analytical
biochemistry, 2004. 331(2): p. 370-375. 5. Viollier, E., et al., The ferrozine method revisited: Fe(II)/Fe(III) determination in natural waters. Applied Geochemistry,
2000. 15(6): p. 785-790. 6. Rebouche, C.J., C.L. Wilcox, and J.A. Widness, Microanalysis of non-heme iron in animal tissues. Journal of Biochemical
and Biophysical Methods, 2004. 58(3): p. 239-251. 7. Tamarit, J., et al., Colorimetric assay for the quantitation of iron in yeast. Analytical Biochemistry, 2006. 351(1): p. 149-
151. 8. To, T.B., et al., New Method for the Direct Determination of Dissolved Fe(III) Concentration in Acid Mine Waters.
Environmental Science & Technology, 1999. 33(5): p. 807-813. 9. Carpenter, C.E. and E. Clark, Evaluation of Methods Used in Meat Iron Analysis and Iron Content of Raw and Cooked
Meats. Journal of Agricultural and Food Chemistry, 1995. 43(7): p. 1824-1827. 10. Pröfrock, D. and A. Prange, Inductively Coupled Plasma–Mass Spectrometry (ICP-MS) for Quantitative Analysis in
Environmental and Life Sciences: A Review of Challenges, Solutions, and Trends. Applied Spectroscopy, 2012. 66(8): p. 843-868.
11. Fassel, V.A. and R.N. Kniseley, Inductively Coupled Plasma-Optical Emission Spectroscopy. Analytical Chemistry, 1974. 46(13): p. 1110A-1120A.
12. Skoog, D.A., J.F. Holler, and T.A. Nieman, Principles of Instrumental Analysis. 5th ed. 1997, North Miami Beach, FL: Murray Media.
13. Corot, C., et al., Recent advances in iron oxide nanocrystal technology for medical imaging. Advanced Drug Delivery Reviews, 2006. 58(14): p. 1471-1504.
14. Sun, C., J.S.H. Lee, and M. Zhang, Magnetic nanoparticles in MR imaging and drug delivery. Advanced Drug Delivery Reviews, 2008. 60(11): p. 1252-1265.
15. Ros, P.R., et al., Hepatic MR imaging with ferumoxides: a multicenter clinical trial of the safety and efficacy in the detection of focal hepatic lesions. Radiology, 1995. 196(2): p. 481-488.
16. Dennis, C.L., et al., Nearly complete regression of tumors via collective behavior of magnetic nanoparticles in hyperthermia. Nanotechnology, 2009. 20(39): p. 395103.
17. Wei Wu and Zhaohui Wu and Taekyung Yu and Changzhong Jiang and Woo-Sik, K., Recent progress on magnetic iron oxide nanoparticles: synthesis, surface functional strategies and biomedical applications. Science and Technology of Advanced Materials, 2015. 16(2): p. 023501.
18. Zhang, J., et al., Quantification and biodistribution of iron oxide nanoparticles in the primary clearance organs of mice using T1 contrast for heating. Magnetic Resonance in Medicine, 2017. 78(2): p. 702-712.
19. Gao, X., et al., In vivo cancer targeting and imaging with semiconductor quantum dots. Nat Biotechnol, 2004. 22(8): p. 969-76.
20. Cassim, S.M., et al., Development of Novel Magnetic Nanoparticles for Hyperthermia Cancer Therapy. Proceedings of SPIE, 2011. 7901: p. 790115.
21. Etheridge, M.L., et al., Accounting for biological aggregation in heating and imaging of magnetic nanoparticles. Technology, 2014. 02(03): p. 214-228.
22. Kalambur, V.S., E.K. Longmire, and J.C. Bischof, Cellular level loading and heating of superparamagnetic iron oxide nanoparticles. Langmuir, 2007. 23(24): p. 12329-36.
23. Tong, S., et al., Size-Dependent Heating of Magnetic Iron Oxide Nanoparticles. ACS Nano, 2017. 24. Hedayati, M., et al., An optimised spectrophotometric assay for convenient and accurate quantitation of intracellular
iron from iron oxide nanoparticles. International Journal of Hyperthermia, 2017: p. 1-9. 25. Hurley, K.R., et al., Predictable Heating and Positive MRI Contrast from a Mesoporous Silica-Coated Iron Oxide
Nanoparticle,. Mol. Pharm., 2016. 13(7): p. 2172-83.
9
26. Liberman, A., et al., Synthesis and surface functionalization of silica nanoparticles for nanomedicine. Surface science reports, 2014. 69(2-3): p. 132-158.
27. Lin, Y.-S. and C.L. Haynes, Synthesis and Characterization of Biocompatible and Size-Tunable Multifunctional Porous Silica Nanoparticles. Chemistry of Materials, 2009. 21(17): p. 3979-3986.
28. Pinho, S.L.C., et al., Relaxometric Studies of γ-Fe2O3@SiO2 Core Shell Nanoparticles: When the Coating Matters. The Journal of Physical Chemistry C, 2012. 116(3): p. 2285-2291.
29. Anastácio, A.S., et al., Limitations of the ferrozine method for quantitative assay of mineral systems for ferrous and total iron. Geochimica et Cosmochimica Acta, 2008. 72(20): p. 5001-5008.
30. Hurley, K.R., et al., Predictable Heating and Positive MRI Contrast from a Mesoporous Silica-Coated Iron Oxide Nanoparticle. Molecular Pharmaceutics, 2016.
31. Stöber, W., A. Fink, and E. Bohn, Controlled growth of monodisperse silica spheres in the micron size range. Journal of Colloid and Interface Science, 1968. 26(1): p. 62-69.
32. Jeitner, T.M., Optimized ferrozine-based assay for dissolved iron. 2014. 454: p. 36–37. 33. Giavarina, D., Understanding Bland Altman analysis. Biochemia medica, 2015. 25(2): p. 141-151. 34. Lynch, S.R. and J.D. Cook, INTERACTION OF VITAMIN C AND IRON*. Annals of the New York Academy of Sciences,
1980. 355(1): p. 32-44. 35. Baensch, B., et al., Is the oxidation of L-ascorbic acid by aquated iron(III) ions in acidic aqueous solution substitution-
or electron-transfer-controlled? A combined chloride, pH, temperature, and pressure dependence study. 1991. 36. Hsieh, Y.-H.P. and Y.P. Hsieh, Kinetics of Fe(III) Reduction by Ascorbic Acid in Aqueous Solutions. J. Agric. Food Chem.,
2000. 37. Hynes, M.J. and D.F. Kelly, The reduction of iron(III) by ascorbic acid. Chemical Communications, 1988. 38. Hurley, K.R., et al., Effects of Mesoporous Silica Coating and Post-Synthetic Treatment on the Transverse Relaxivity of
Iron Oxide Nanoparticles. Chemistry of materials : a publication of the American Chemical Society, 2013. 25(9): p. 1968-1978.
39. Bazuła, P.A., et al., Highly microporous monodisperse silica spheres synthesized by the Stöber process. Microporous and Mesoporous Materials, 2014. 200: p. 317-325.
40. Patil, U.S., et al., In Vitro/In Vivo Toxicity Evaluation and Quantification of Iron Oxide Nanoparticles. International Journal of Molecular Sciences, 2015. 16(10): p. 24417-24450.
41. Stookey, L.L., Ferrozine—a new spectrophotometric reagent for iron. Analytical Chemistry, 1970. 42(7): p. 779-781.

download fileview on ChemRxiv2018Jul13_FerrozineManuscript_SUBMITTED.pdf (636.24 KiB)