ferc coal and transmission conference peabody.pdf · connecticut 4,256 13% 16,539 51% 406 1% 7,988...
TRANSCRIPT
FERC
Coal and Transmission Conference
May 13, 2005

2Source: Energy Information Administration, March 2005.
8.1¢ 30%
6.1¢65%
5.8¢94%
5.6¢10%
5.7¢64%
5.0¢96%
7.0¢74%
6.1¢7%
6.5¢74%
7.2¢88%
8.6¢50%
11.3¢1%
5.8¢95%
6.6¢48%
7.8¢42%
6.5¢82%
6.3¢65%
6.6¢56%
6.1¢86%
6.9¢49%
7.6¢38%
6.9¢70%
5.8¢51%
7.1¢ 35%
7.0¢59%
5.6¢98%
6.8¢87%
9.4¢1%
12.0¢16%
7.0¢42%
6.1¢56%
6.7¢65%
6.2¢ 41%
4.6¢ 92%
6.5¢45%
8.1¢55%
5.1¢99%
7.0¢62%
6.1¢ 60%
5.0¢0%
10.8¢8%
15.6¢15%
NH 11.4¢ 17%VT 11.1¢ 0% MA 10.8¢ 22% RI 10.8¢ 0%CT 10.4¢ 13%NJ 10.2¢ 19%DE 7.3¢ 65%MD 7.2¢ 52%
¢ = average retail price per kilowatt hour for 2004
% = percent of total generation from coal for 2004 < 6.0¢
≥ 6.0¢ - < 7.0¢≥ 7.0¢ - < 8.5¢≥ 8.5¢ Hydro
Retail Cost Per kWh & Percent of Coal GenerationRetail Cost Per kWh & Percent of Coal Generation
Low-Cost Electricity from Coal:Over 51% of U.S. Electricity is from
Coal
3
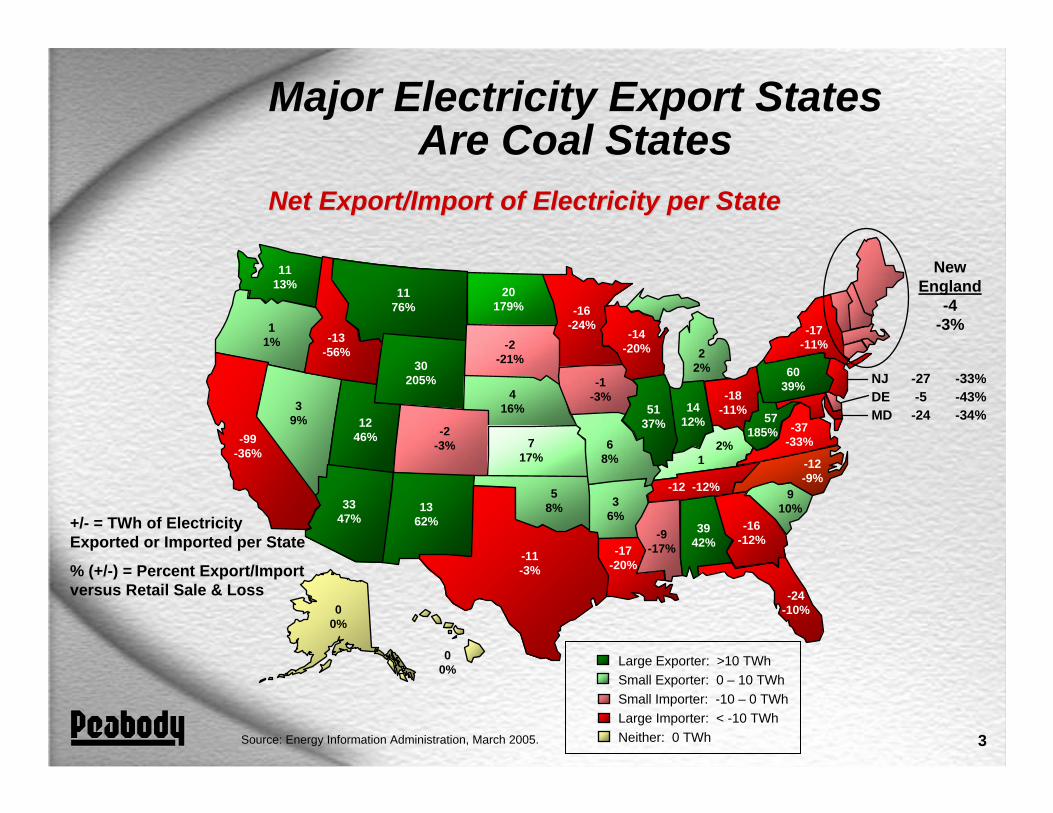
Net Export/Import of Electricity per StateNet Export/Import of Electricity per State
Major Electricity Export StatesAre Coal States
Source: Energy Information Administration, March 2005.
-24-10%
1176%
20179%
1113%
416%
30205%
-2-3%
11%
717%
1362%
39%
-99-36%
1246%
-2-21%
-11-3%
-1-3%
-16-24%
58%
68%
5137%
3347%
-14-20%
36%
-17 -20%
22%
1412%
-18-11%
NewEngland
-4-3%-17
-11%
-9-17%
3942%
-16-12%
9 10%
2%1
-37-33%
6039%
57185%
-12-9%
-12 -12%
-13-56%
00%
00%
NJ -27 -33%DE -5 -43%MD -24 -34%
+/- = TWh of Electricity Exported or Imported per State
% (+/-) = Percent Export/Import versus Retail Sale & Loss
Large Exporter: >10 TWhSmall Exporter: 0 – 10 TWhSmall Importer: -10 – 0 TWhLarge Importer: < -10 TWhNeither: 0 TWh
4
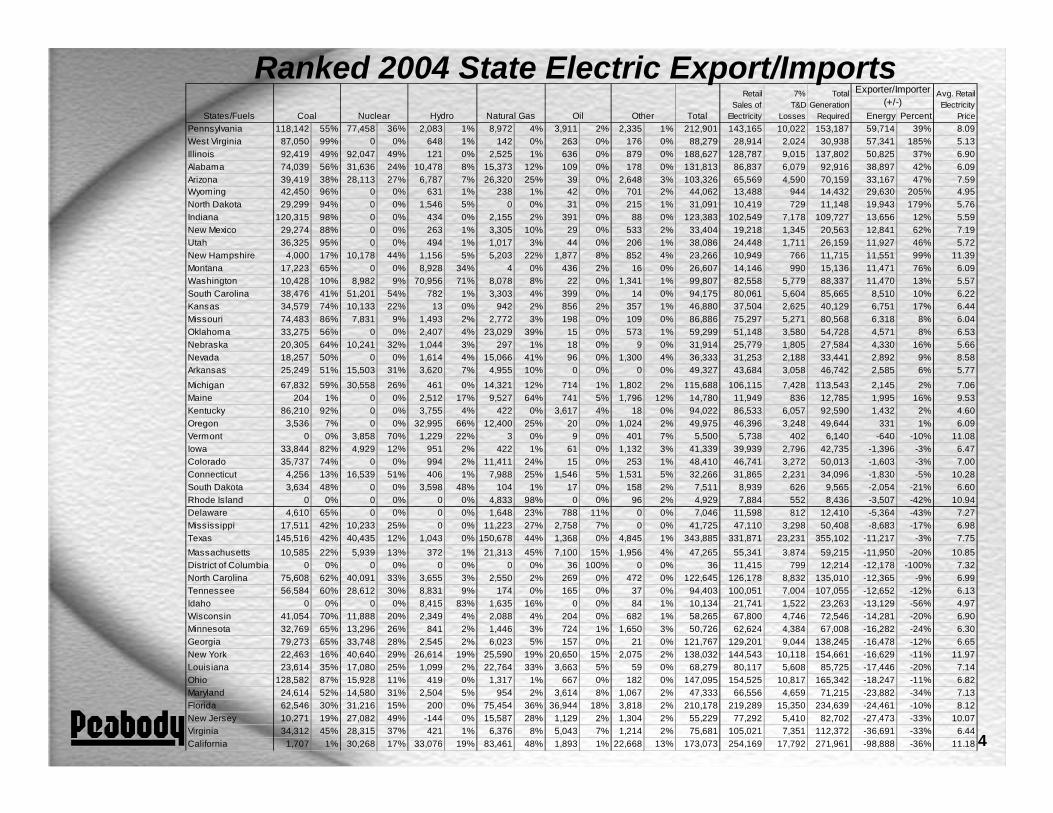
Ranked 2004 State Electric Export/Imports Energy Percent
Pennsylvania 118,142 55% 77,458 36% 2,083 1% 8,972 4% 3,911 2% 2,335 1% 212,901 143,165 10,022 153,187 59,714 39% 8.09West Virginia 87,050 99% 0 0% 648 1% 142 0% 263 0% 176 0% 88,279 28,914 2,024 30,938 57,341 185% 5.13Illinois 92,419 49% 92,047 49% 121 0% 2,525 1% 636 0% 879 0% 188,627 128,787 9,015 137,802 50,825 37% 6.90Alabama 74,039 56% 31,636 24% 10,478 8% 15,373 12% 109 0% 178 0% 131,813 86,837 6,079 92,916 38,897 42% 6.09Arizona 39,419 38% 28,113 27% 6,787 7% 26,320 25% 39 0% 2,648 3% 103,326 65,569 4,590 70,159 33,167 47% 7.59Wyoming 42,450 96% 0 0% 631 1% 238 1% 42 0% 701 2% 44,062 13,488 944 14,432 29,630 205% 4.95North Dakota 29,299 94% 0 0% 1,546 5% 0 0% 31 0% 215 1% 31,091 10,419 729 11,148 19,943 179% 5.76Indiana 120,315 98% 0 0% 434 0% 2,155 2% 391 0% 88 0% 123,383 102,549 7,178 109,727 13,656 12% 5.59New Mexico 29,274 88% 0 0% 263 1% 3,305 10% 29 0% 533 2% 33,404 19,218 1,345 20,563 12,841 62% 7.19Utah 36,325 95% 0 0% 494 1% 1,017 3% 44 0% 206 1% 38,086 24,448 1,711 26,159 11,927 46% 5.72New Hampshire 4,000 17% 10,178 44% 1,156 5% 5,203 22% 1,877 8% 852 4% 23,266 10,949 766 11,715 11,551 99% 11.39Montana 17,223 65% 0 0% 8,928 34% 4 0% 436 2% 16 0% 26,607 14,146 990 15,136 11,471 76% 6.09Washington 10,428 10% 8,982 9% 70,956 71% 8,078 8% 22 0% 1,341 1% 99,807 82,558 5,779 88,337 11,470 13% 5.57South Carolina 38,476 41% 51,201 54% 782 1% 3,303 4% 399 0% 14 0% 94,175 80,061 5,604 85,665 8,510 10% 6.22Kansas 34,579 74% 10,133 22% 13 0% 942 2% 856 2% 357 1% 46,880 37,504 2,625 40,129 6,751 17% 6.44Missouri 74,483 86% 7,831 9% 1,493 2% 2,772 3% 198 0% 109 0% 86,886 75,297 5,271 80,568 6,318 8% 6.04Oklahoma 33,275 56% 0 0% 2,407 4% 23,029 39% 15 0% 573 1% 59,299 51,148 3,580 54,728 4,571 8% 6.53Nebraska 20,305 64% 10,241 32% 1,044 3% 297 1% 18 0% 9 0% 31,914 25,779 1,805 27,584 4,330 16% 5.66Nevada 18,257 50% 0 0% 1,614 4% 15,066 41% 96 0% 1,300 4% 36,333 31,253 2,188 33,441 2,892 9% 8.58Arkansas 25,249 51% 15,503 31% 3,620 7% 4,955 10% 0 0% 0 0% 49,327 43,684 3,058 46,742 2,585 6% 5.77Michigan 67,832 59% 30,558 26% 461 0% 14,321 12% 714 1% 1,802 2% 115,688 106,115 7,428 113,543 2,145 2% 7.06Maine 204 1% 0 0% 2,512 17% 9,527 64% 741 5% 1,796 12% 14,780 11,949 836 12,785 1,995 16% 9.53Kentucky 86,210 92% 0 0% 3,755 4% 422 0% 3,617 4% 18 0% 94,022 86,533 6,057 92,590 1,432 2% 4.60Oregon 3,536 7% 0 0% 32,995 66% 12,400 25% 20 0% 1,024 2% 49,975 46,396 3,248 49,644 331 1% 6.09Vermont 0 0% 3,858 70% 1,229 22% 3 0% 9 0% 401 7% 5,500 5,738 402 6,140 -640 -10% 11.08Iowa 33,844 82% 4,929 12% 951 2% 422 1% 61 0% 1,132 3% 41,339 39,939 2,796 42,735 -1,396 -3% 6.47Colorado 35,737 74% 0 0% 994 2% 11,411 24% 15 0% 253 1% 48,410 46,741 3,272 50,013 -1,603 -3% 7.00Connecticut 4,256 13% 16,539 51% 406 1% 7,988 25% 1,546 5% 1,531 5% 32,266 31,865 2,231 34,096 -1,830 -5% 10.28South Dakota 3,634 48% 0 0% 3,598 48% 104 1% 17 0% 158 2% 7,511 8,939 626 9,565 -2,054 -21% 6.60Rhode Island 0 0% 0 0% 0 0% 4,833 98% 0 0% 96 2% 4,929 7,884 552 8,436 -3,507 -42% 10.94Delaware 4,610 65% 0 0% 0 0% 1,648 23% 788 11% 0 0% 7,046 11,598 812 12,410 -5,364 -43% 7.27Mississippi 17,511 42% 10,233 25% 0 0% 11,223 27% 2,758 7% 0 0% 41,725 47,110 3,298 50,408 -8,683 -17% 6.98Texas 145,516 42% 40,435 12% 1,043 0% 150,678 44% 1,368 0% 4,845 1% 343,885 331,871 23,231 355,102 -11,217 -3% 7.75Massachusetts 10,585 22% 5,939 13% 372 1% 21,313 45% 7,100 15% 1,956 4% 47,265 55,341 3,874 59,215 -11,950 -20% 10.85District of Columbia 0 0% 0 0% 0 0% 0 0% 36 100% 0 0% 36 11,415 799 12,214 -12,178 -100% 7.32North Carolina 75,608 62% 40,091 33% 3,655 3% 2,550 2% 269 0% 472 0% 122,645 126,178 8,832 135,010 -12,365 -9% 6.99Tennessee 56,584 60% 28,612 30% 8,831 9% 174 0% 165 0% 37 0% 94,403 100,051 7,004 107,055 -12,652 -12% 6.13Idaho 0 0% 0 0% 8,415 83% 1,635 16% 0 0% 84 1% 10,134 21,741 1,522 23,263 -13,129 -56% 4.97Wisconsin 41,054 70% 11,888 20% 2,349 4% 2,088 4% 204 0% 682 1% 58,265 67,800 4,746 72,546 -14,281 -20% 6.90Minnesota 32,769 65% 13,296 26% 841 2% 1,446 3% 724 1% 1,650 3% 50,726 62,624 4,384 67,008 -16,282 -24% 6.30Georgia 79,273 65% 33,748 28% 2,545 2% 6,023 5% 157 0% 21 0% 121,767 129,201 9,044 138,245 -16,478 -12% 6.65New York 22,463 16% 40,640 29% 26,614 19% 25,590 19% 20,650 15% 2,075 2% 138,032 144,543 10,118 154,661 -16,629 -11% 11.97Louisiana 23,614 35% 17,080 25% 1,099 2% 22,764 33% 3,663 5% 59 0% 68,279 80,117 5,608 85,725 -17,446 -20% 7.14Ohio 128,582 87% 15,928 11% 419 0% 1,317 1% 667 0% 182 0% 147,095 154,525 10,817 165,342 -18,247 -11% 6.82Maryland 24,614 52% 14,580 31% 2,504 5% 954 2% 3,614 8% 1,067 2% 47,333 66,556 4,659 71,215 -23,882 -34% 7.13Florida 62,546 30% 31,216 15% 200 0% 75,454 36% 36,944 18% 3,818 2% 210,178 219,289 15,350 234,639 -24,461 -10% 8.12New Jersey 10,271 19% 27,082 49% -144 0% 15,587 28% 1,129 2% 1,304 2% 55,229 77,292 5,410 82,702 -27,473 -33% 10.07Virginia 34,312 45% 28,315 37% 421 1% 6,376 8% 5,043 7% 1,214 2% 75,681 105,021 7,351 112,372 -36,691 -33% 6.44California 1,707 1% 30,268 17% 33,076 19% 83,461 48% 1,893 1% 22,668 13% 173,073 254,169 17,792 271,961 -98,888 -36% 11.18
Avg. Retail Electricity
Price(+/-)
Exporter/Importer
Total
7% T&D
Losses
Total Generation
RequiredNatural Gas Oil Other
Retail Sales of
ElectricityStates/Fuels Coal Nuclear Hydro

5
Middle US Source of Excess CoalTransmission Upgrades Needed to Unlock
Low Capacity Coal Plant RegionsCoal Plant Capacity Factors by Region
68% 69% 70% 71%74%
79%75% 75% 76% 76%
81% 83% 83%83%
69%
87%84%
70%
0%
10%
20%
30%
40%
50%
60%
70%
80%
90%
MAIN PJM ECAR NPCC SERC MAPP SPP WECC ERCOT
2004 Projected 2010*
* Peabody 2010 projections assume announced retirements of existing plants and regional transmission upgrades occur.
Stranded Middle Stranded Middle US Coal RegionUS Coal Region
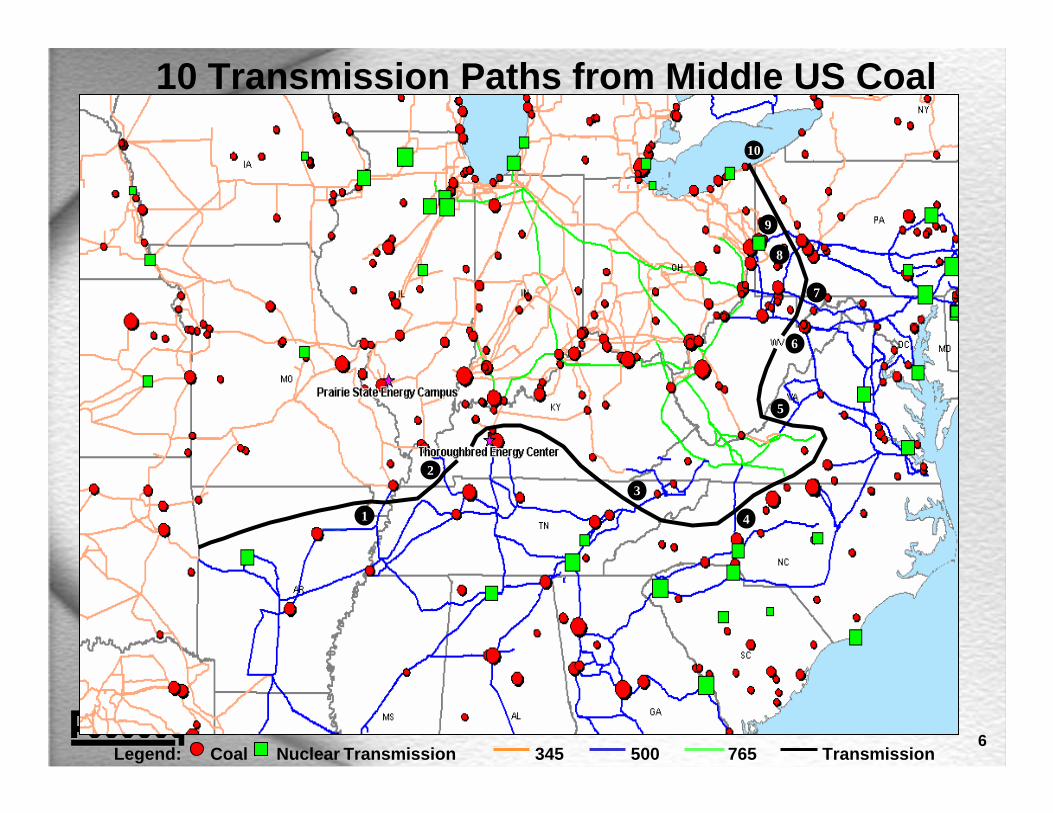
6NuclearCoal Transmission Legend: 345 500 765 Transmission
1
23
4
5
6
7
8
9
10
10 Transmission Paths from Middle US Coal
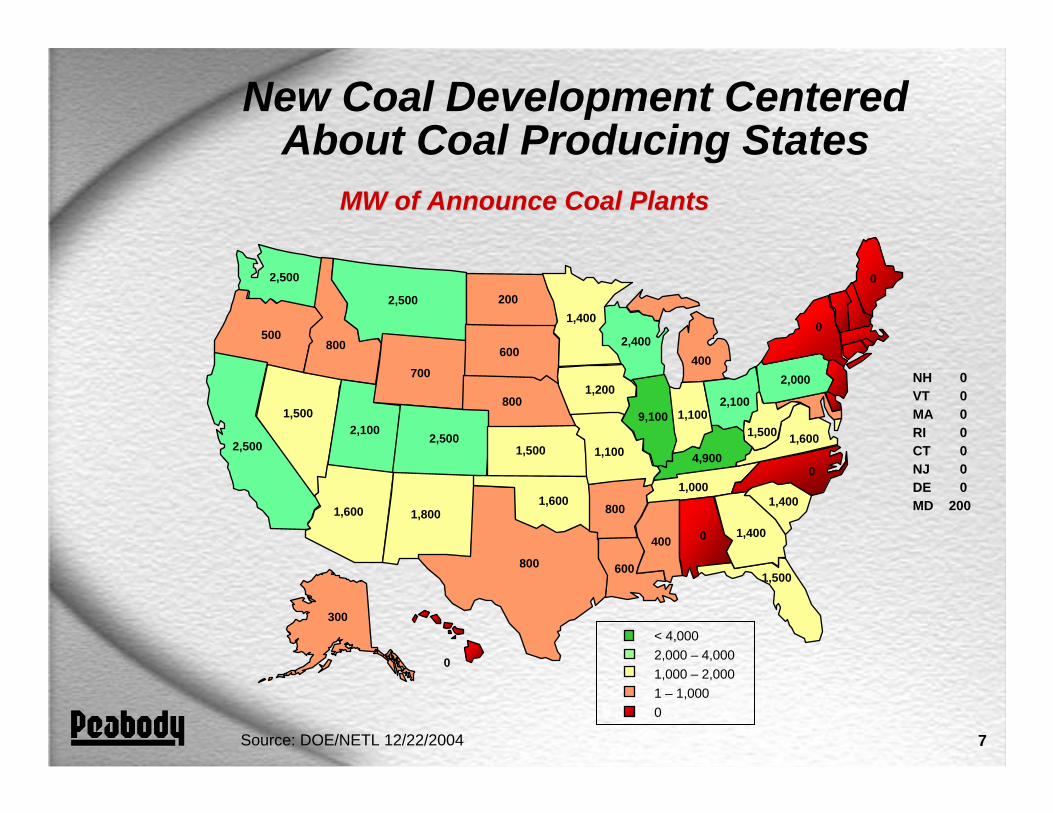
7Source: DOE/NETL 12/22/2004
1,500
2,500 200
2,500
800
700
2,500
500
1,500
1,800
1,500
2,5002,100
600
800
1,200
1,400
1,600
1,100
9,100
1,600
2,400
800
600
400
1,1002,100
0
0
400 0 1,400
1,400
4,9001,600
2,000
1,500
01,000
800
300
0
NH 0VT 0MA 0RI 0CT 0NJ 0DE 0MD 200
< 4,0002,000 – 4,0001,000 – 2,0001 – 1,0000
MW of Announce Coal PlantsMW of Announce Coal Plants
New Coal Development Centered About Coal Producing States

8
Major Coal Supply BasinsCost and Location Favor New Coal Plants in Illinois
Basin (East) and Western/PRB (West)
Northern AppalachiaMedium-High CostStable ReservesVery Transportable
Central AppalachiaHigh CostDeclining ReservesTransportable
Illinois BasinMedium CostAbundant ReservesLimited Transport
Northern LigniteLow-Medium CostStable ReservesNot Transportable
Western CoalsMedium CostSomewhat AbundantTransportable (Varies)
Powder River BasinLow CostAbundant ReservesVery Transportable
Southern LigniteMedium CostSomewhat AbundantNot Transportable

9
Fuel Type Illinois Basin Illinois Basin PRB Eastern Eastern Eastern PRB to East Illinois BasinDelivery Type River/Short rail Mine Mouth Rail Midwest Mine Mouth River Rail Rail Rail EastCoal Price ($/ton) 30.00$ 22.00$ 11.00$ 45.00$ 53.00$ 53.00$ 11.00$ 30.00$ Delivery Price ($/ton) 7.00$ -$ 14.00$ -$ 6.00$ 14.00$ 28.00$ 18.00$ Total Del. Fuel Price ($/ton) 37.00$ 22.00$ 25.00$ 45.00$ 59.00$ 67.00$ 39.00$ 48.00$ Heat Content btu/lb 10,500 9,000 8,800 12,000 12,500 12,500 8,800 10,500 Fuel Cost $/mmbtu 1.76$ 1.22$ 1.42$ 1.88$ 2.36$ 2.68$ 2.22$ 2.29$ Fuel Cost Within RTO/Control Area $/MWh 18.50$ 12.83$ 14.91$ 19.69$ 24.78$ 28.14$ 23.27$ 24.00$ Annual Within RTO Savings for 1500 MW 90,063,750$ 62,713,636$ Out of RTO Cost/Losses $/MWh 4.00$ 4.00$ 4.00$ 4.00$ 4.00$ -$ -$ -$ Delivered Cost Out of RTO/Control Area $/MWh 22.50$ 16.83$ 18.91$ 23.69$ 28.78$ 28.14$ 23.27$ 24.00$ Annual Out of RTO Savings for 1500 MW 148,569,600$ 121,219,486$ Extra Wheel Cost/Losses $/MWh 4.00$ 4.00$ 4.00$ 4.00$ 4.00$ -$ Total Delivered Cost for 2 Wheels $/MWh 26.50$ 20.83$ 22.91$ 27.69$ 32.78$ 28.14$ 23.27$ 24.00$ Annual 2 Wheel Savings for 1500 MW 96,009,600$ 68,659,486$
Coal Plant Variable Costs for Eastern US Regions and Transmission CostsPRB to Midwest/East on Rail, Eastern River and
Illinois Basin Mine/Near Mine-Mouth or Lowest Cost
10
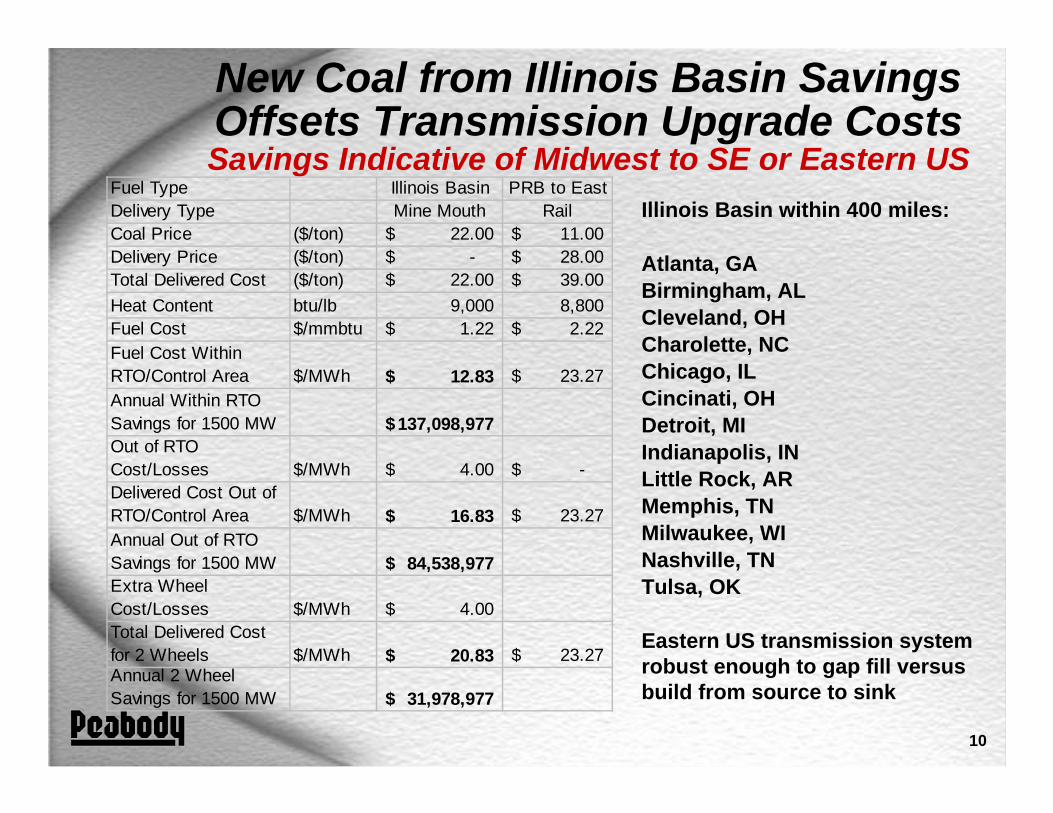
New Coal from Illinois Basin Savings Offsets Transmission Upgrade CostsSavings Indicative of Midwest to SE or Eastern US
Fuel Type Illinois Basin PRB to EastDelivery Type Mine Mouth RailCoal Price ($/ton) 22.00$ 11.00$ Delivery Price ($/ton) -$ 28.00$ Total Delivered Cost ($/ton) 22.00$ 39.00$ Heat Content btu/lb 9,000 8,800 Fuel Cost $/mmbtu 1.22$ 2.22$ Fuel Cost Within RTO/Control Area $/MWh 12.83$ 23.27$ Annual Within RTO Savings for 1500 MW 137,098,977$ Out of RTO Cost/Losses $/MWh 4.00$ -$ Delivered Cost Out of RTO/Control Area $/MWh 16.83$ 23.27$ Annual Out of RTO Savings for 1500 MW 84,538,977$ Extra Wheel Cost/Losses $/MWh 4.00$ Total Delivered Cost for 2 Wheels $/MWh 20.83$ 23.27$ Annual 2 Wheel Savings for 1500 MW 31,978,977$
Illinois Basin within 400 miles:
Atlanta, GABirmingham, ALCleveland, OHCharolette, NCChicago, ILCincinati, OHDetroit, MIIndianapolis, INLittle Rock, ARMemphis, TNMilwaukee, WINashville, TNTulsa, OK
Eastern US transmission system robust enough to gap fill versus build from source to sink
11
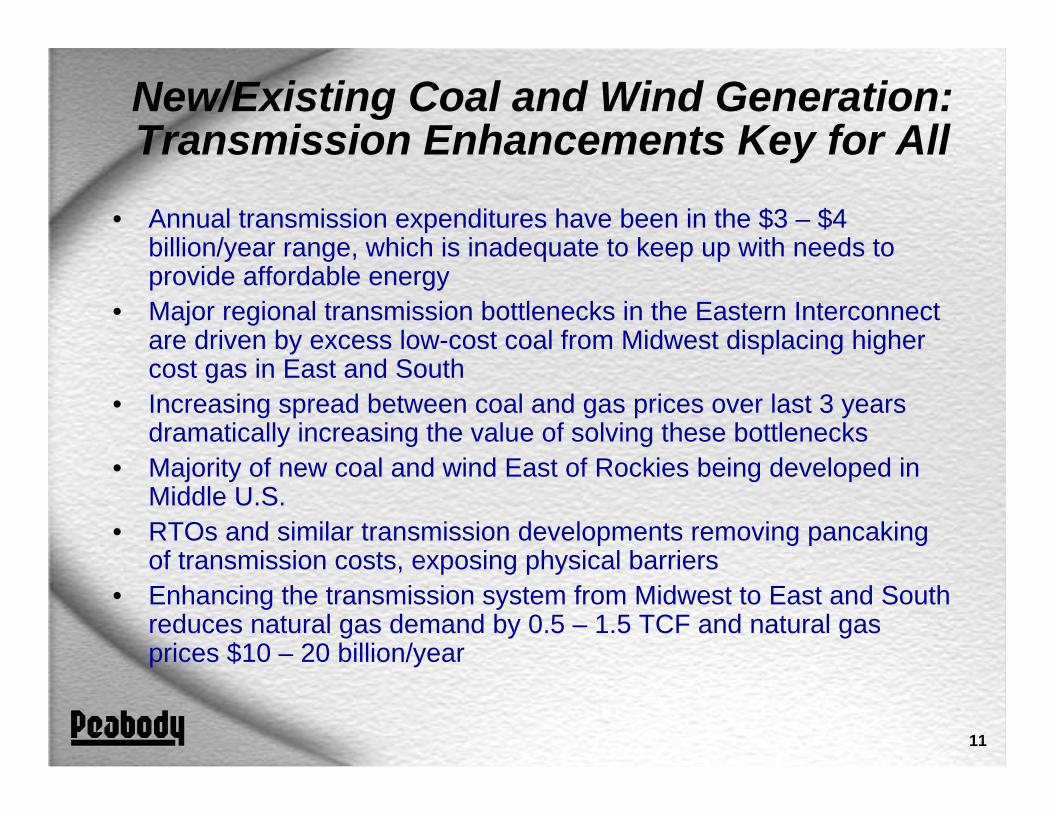
New/Existing Coal and Wind Generation:Transmission Enhancements Key for All
• Annual transmission expenditures have been in the $3 – $4 billion/year range, which is inadequate to keep up with needs toprovide affordable energy
• Major regional transmission bottlenecks in the Eastern Interconnect are driven by excess low-cost coal from Midwest displacing higher cost gas in East and South
• Increasing spread between coal and gas prices over last 3 years dramatically increasing the value of solving these bottlenecks
• Majority of new coal and wind East of Rockies being developed inMiddle U.S.
• RTOs and similar transmission developments removing pancakingof transmission costs, exposing physical barriers
• Enhancing the transmission system from Midwest to East and Southreduces natural gas demand by 0.5 – 1.5 TCF and natural gas prices $10 – 20 billion/year

12
• RTO/Regional transmission planning must be done from the perspective of the customer– Will enhancements reduce customer prices?– Provide regulators/public the information regarding the economic
value of enhancements– If such information available, the who benefits arguments start to
be much more straight forward• Economic enhancements must we studied using
“contingency” fuel prices/fuel price differentials similar to reliability planning that assumes the contingency– If you assume $4.00/mmbtu gas prices you under build the
transmission system and continue to support higher gas prices– No RTO/Regional study has looked at $7.00/mmbtu gas prices
and the enhancements that would be cost effective• Add representative new coal plants in the planning in the
areas that seem logical– Along Ohio River, Illinois Basin and West
Planning Steps Needed to GetEast Transmission Enhanced
13
-100%
-50%
0%
50%
100%
150%
200%
1970 1975 1980 1985 1990 1995 2000 2003E
Perc
ent I
ncre
ase
Sinc
e 19
70
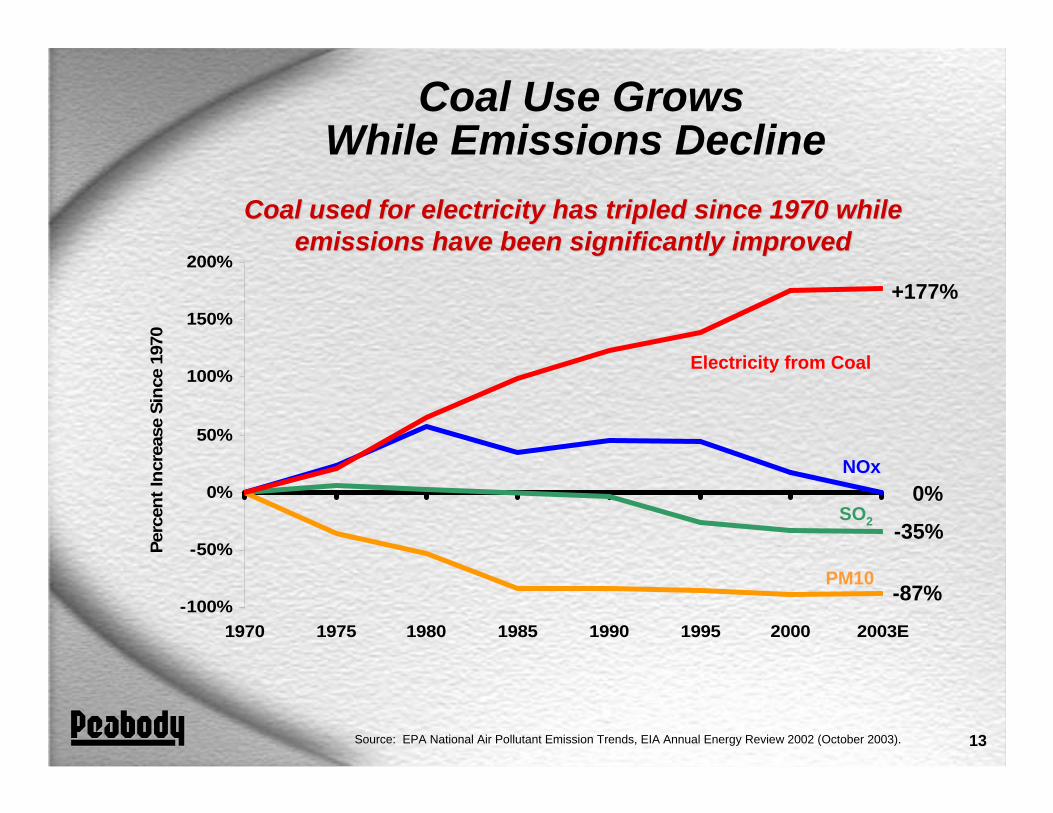
Coal Use Grows While Emissions Decline
+177%
0%-35%
-87%
Electricity from Coal
NOx
SO2
PM10
Source: EPA National Air Pollutant Emission Trends, EIA Annual Energy Review 2002 (October 2003).
Coal used for electricity has tripled since 1970 while Coal used for electricity has tripled since 1970 while emissions have been significantly improvedemissions have been significantly improved

14
Emissions from CoalEmissions from Coal--Fueled Generating PlantsFueled Generating Plants
* EstimateSource: EPA’s Clean Air Markets database; EIA 2004 Annual Energy Outlook; GE Energy; SFA Pacific.
0
0.1
0.2
0.3
0.4
0.5
0.6
0.7
0.8
0.9
1
Poun
ds P
er M
illio
n B
tu
Sulfur DioxideNitrogen Oxide
U.S.Average
2004*
Clean AirInterstate
Rule2010
New Midwest
Mine-mouth
Clean AirInterstate
Rule2015
0.10
0.340.39
0.16
0.26
0.120.182
0.07 0.06
0.94
New PRB Plant
Near-Zero
FutureGenGoals
0.030.06
IGCCProjection
ExistingIGCC
(PermitLevel)
0.17
0.08
The Path Toward Near-Zero Emissionsfrom Coal-Fueled Generating Plants