fenner plc 2016 full year results highlights 16 final.pdf · fenner plc 2016 full year results ......
TRANSCRIPT

1
16 November 2016
Fenner PLC
2016 Full Year Results
Fenner PLC, a world leader in reinforced polymer technology, today announces its results for its financial year ended 31 August 2016.
Highlights
2016 2015
Revenue £572.5m £666.7m
Underlying operating profit 1,5 £37.1m £56.4m
Underlying profit before taxation 2,5 £23.2m £42.5m
Exceptional items £(40.8)m £(34.4)m
Loss before taxation £(30.3)m £(5.3)m
Operating cash flow 4,5 £62.2m £69.2m
Underlying earnings per share 2,3,5 8.4p 15.5p
Dividend per share 3.0p 12.0p
The Group has continued to make solid progress in challenging markets
Improved performance in the second half by both AEP and ECS as management actions have taken effect
Oil & gas businesses increased shares in difficult markets; AEP medical businesses achieved an improved result
ECS North America refocusing/restructuring delivering to plan; further progress in Australia
Operating cash flow of £62.2m, leading to year end net debt of £150.0m (similar to last year, before currency effects)
Further significant cost savings of £42m achieved
Final dividend of 2.0p, making 3.0p for the year
Current year anticipated to be modestly ahead of previous expectations in addition to currency benefit.
Mark Abrahams, Chief Executive Officer, commented:
“The Group’s results were ahead of our expectations at the time of the Annual General Meeting in January 2016, assisted by currency. Management actions have started to outweigh market pressures.
The Group has made important progress in repositioning those businesses which have been most affected by market conditions. We achieved another strong performance in terms of generating cash and controlling costs.
Taken as a whole, the Group has commenced the new financial year with a substantially reduced cost base and with several of the leading indicators for the Group’s businesses showing a more positive trend.
As a consequence, we now anticipate that the outcome for the current year will be modestly ahead of our previous expectations. In addition, the Group is experiencing a tailwind from the translation of overseas earnings into sterling, with the year-on-year impact on underlying operating profit from currency movements estimated to be £4m based on exchange rates prevailing during the early part of the new financial year.”

2
1 Underlying operating profit is before amortisation of intangible assets acquired and exceptional items
2 Underlying profit before taxation and underlying earnings per share are before amortisation of intangible assets acquired, exceptional items and notional
interest
3 Underlying earnings per share is based on the basic weighted average number of shares in issue
4 Operating cash flow is underlying operating profit adjusted for depreciation and amortisation, capital expenditure (net of disposals) and movements in
working capital
5 Underlying and non-GAAP measures have been presented to provide a more meaningful measure of the underlying performance of the business
A live audio webcast of the analyst presentation, hosted by Mark Abrahams, Chief Executive Officer, and John Pratt, Group Finance Director, can be accessed at 9.30 am today on the Group's website www.Fenner.com.
For further information please contact:
Fenner PLC
Mark Abrahams, Chief Executive Officer ) today: 020 7067 0700 ) John Pratt, Group Finance Director ) thereafter: 01482 626501
Weber Shandwick Financial
Nick Oborne 020 7067 0700
Notes to editors:
Fenner PLC is a world leader in reinforced polymer technology, providing local engineered solutions for performance-critical applications. The Group operates through two divisions:
Advanced Engineered Products. The AEP division is a group of nine businesses that use advanced polymeric materials and technical expertise to provide high value-added solutions to customers’ most challenging engineering problems across a variety of markets, generally classified as specialist industrial, medical and oil & gas. AEP’s trading names include Hallite, Fenner Precision, Fenner Drives, Secant Group, Charter Medical, CDI Energy Products and EGC Critical Components.
Engineered Conveyor Solutions. The ECS division, trading under the Fenner Dunlop, Fenner and Dunlop brand names, is an established global leader in the supply of heavyweight conveyor belting and related services to the mining, industrial and bulk materials markets. ECS has leading presences in the Northern Hemisphere (principally North America and Europe) and the Southern Hemisphere (principally Australia).
Forward-looking statements
Certain statements contained in this Report, in particular Outlook, constitute forward-looking statements. Such forward-looking statements involve risks, uncertainties and other factors which may cause the actual results, performance or achievements of Fenner, or industry results, to be materially different from any future results, performance or achievements expressed or implied by such statements. Such risks, uncertainties and other factors include, among others, exchange rates, the commodity markets, general economic conditions and the business environment.

3
Operating review
“Management actions have started to outweigh market pressures” Introduction
The Group’s results were ahead of our expectations at the time of the Annual General Meeting in January 2016, assisted by currency, despite certain of the Group’s principal markets having shown no recovery and, in some cases, having deteriorated further. This outcome reflects our determination to enhance the Group’s business mandates whilst maintaining a tight control on costs and cash. The Group has made important progress in repositioning those businesses which have been most affected by market conditions. Generally across the Group, we have sought to build market share and strengthen market positions with particular emphasis on customer service and product development. As part of this process, a number of changes have been made to the Group’s senior management. This has been an especially important year for our medical businesses. Secant Group, our principal medical business, is in the process of completing its move into new, purpose-built premises. We believe that this, together with its strong pipeline of new products, will provide the basis for further significant growth. In its first full year as part of the Group, Charter Medical produced results ahead of our expectations. As summarised in the table below, the Group’s revenue was £572.5m and underlying operating profit was £37.1m. Revenue and underlying operating profit both fell during the year, primarily reflecting continued difficulties in the US coal mining industry and the slowdown in the oil & gas industry. AEP’s medical businesses once again provided a bright spot, with an improved result compared with the previous year.
Advanced Engineered
Products
Engineered Conveyor Solutions
Unallocated Corporate
Total
At constant currencies 2016 £m
2015 £m
2016 £m
2015 £m
2016 £m
2015 £m
2016 £m
2015 £m
Revenue 250.7 279.1 321.8 409.5 - - 572.5 688.6
Underlying operating profit 29.9 44.3 14.2 23.9 (7.0) (7.9) 37.1 60.3
Underlying operating margin 11.9% 15.9% 4.4% 5.8% 6.5% 8.8%
We achieved another strong performance in terms of generating cash and controlling costs. Free cash flow for the year was £38.8m, resulting in year end net debt of £150.0m, better than our earlier expectations and little changed on the previous year before taking into account foreign exchange movements. Total operating costs excluding materials were reduced by a further £42m, at constant currencies. The restructuring programmes across the Group led to restructuring costs of £15.8m, the largest part of which arose in relation to ECS’s North American business. As the financial year progressed, there were increasing signs that the measures we have taken are leading to improvements in the trading results of many of the Group’s businesses. We expect these improvements to continue in the new financial year and to benefit the Group’s strategic position over the medium term. Advanced Engineered Products
AEP is organised into three product groups: Advanced Sealing Technologies (which generated 42% of AEP’s revenue in 2016); Precision Polymers (37%); and Solesis Medical Technologies (21%). In 2016, AEP generated revenue of £250.7m (2015: £279.1m at constant currencies) and underlying operating profit of £29.9m (2015: £44.3m at constant currencies). Underlying operating margin was 11.9% (2015: 15.9%). AEP’s lower result for the year was primarily due to the continued slowdown in the oil & gas industry, in particular in the USA. The impact was mitigated by a strong performance by AEP’s medical businesses and by continued attention to costs and gains in market shares across the division.

4
Advanced Sealing Technologies Advanced Sealing Technologies, the largest product group within AEP, designs and manufactures performance-critical seals for use in oil & gas, fluid power and specialist industrial applications. In 2016, revenue was £105.1m (2015: £137.1m at constant currencies). CDI (design and manufacture of custom seals for upstream oil & gas) is the Group’s largest oil & gas business, with its principal operation in Texas, USA. During the first half of the year, there was a further sharp fall in industry indicators, in particular the US rig count; these stabilised in the second half of the year before showing a slight improvement before the year end. These indicators have broadly mapped the significant declines which CDI has seen in its US order intake. CDI’s on-going commitment to customer service and product innovation within an increasingly stringent regulatory environment, whilst maintaining its continuous close attention to costs, helped to ensure that it remained profitable, albeit at levels much below those seen in previous years. By the end of the year, there were indications that CDI’s outlook was improving, assisted by gains in market share. CDI’s operations in the Far East, headquartered in Singapore, generated lower revenue and operating profit as oil companies’ capital expenditure on deep-sea projects tailed off. However, a series of internal initiatives led to an improved level of customer enquiries which is expected to result in increased order intake in the new financial year. In Europe, where lower oil prices have led to much reduced levels of activity across the industry, CDI has restructured its operations with some manufacturing having been transferred to other global locations. EGC (wear components, precision components, connectors and seals) produced a much improved performance in the second half of the year as it developed new products and applications for oil & gas and industrial customers. These have partly offset the effects of further weakness in its mid-stream oil & gas markets. AIP (high precision machined polymer components) has also successfully built up revenue streams in medical, aerospace and specialised industrial applications which have mitigated lower activity levels in its oil & gas markets. Hallite (seals for fluid power) pursued initiatives throughout the year to increase overall market share and to target specific market niches. Despite its markets having been generally subdued, Hallite was able to improve its profitability as the year progressed through operating efficiencies and lower costs within its supply chain. Precision Polymers Precision Polymers produces high value-added elastomeric solutions, principally belts and hoses, for niche markets across a range of segments. In 2016, revenue was £92.7m (2015: £99.0m at constant currencies). The business generates the majority of its revenue in the USA; it also has well established operations in Europe and is seeking to expand its presence in Asia and South America. During the year, the US business operations of Fenner Drives and Fenner Precision were combined to form Precision Polymers US, and the UK business operations of Fenner Precision and James Dawson were combined to form Precision Polymers UK. In the USA, Fenner Drives and Fenner Precision have their principal facilities on sites which are adjacent to one another, as do Fenner Precision and James Dawson in the UK. Combining local operations under common management has created larger, more efficient businesses with opportunities for additional revenue and the elimination of duplicated costs. Mandals, based in Norway, continues to be managed separately within Precision Polymers. In 2016, Precision Polymers US generated revenue in its power transmission and motion control businesses that was in line with distribution industry indicators across the sectors in which it operates. These indicators reflected a slight fall in US industrial output and some destocking amongst distributors and end users. Precision Polymers US increased sales of bespoke belts and related products in various niches, including digital imaging equipment, ATMs and card readers, which mitigated lower revenues elsewhere. Precision Polymers UK had a strong performance in its UK elastomeric solutions business, building upon the relationships which it has successfully developed with its OEM customers, with revenue and profit both well ahead of the previous year. Revenue from hoses for high-performance diesel engines was only slightly behind the previous year, despite subdued demand for heavy-duty vehicles and some evidence that customers are becoming more price-sensitive; there was an improved performance by James Dawson’s operation in China. In both its US and UK operations, Precision Polymers will continue to use its expertise in polymer engineering and its OEM relationships to develop new products and applications into niche markets across a range of industries, with particular opportunities being seen in infrastructure, motion control and transportation.

5
Mandals (lay-flat hoses) mainly generated revenue from the sale of agricultural hose in its traditional markets in Europe (especially the Nordic region) and the Americas. Sales of hose into the US unconventional oil & gas industry for use in hydraulic fracturing remained at low levels. Opportunities for Mandals’ high-performance hoses in new applications are being developed. Solesis Medical Technologies The medical products group currently comprises Secant Group and Charter Medical (which was acquired in 2015). Each build upon Fenner’s expertise in polymers and textiles to design and manufacture medical components and devices. Both businesses are located in the USA. As noted below, Xeridiem Medical Devices was sold in September 2016. In 2016, revenue was £52.9m (2015: £43.0m at constant currencies), an increase of 23%. Secant Group (biomedical textile components and biomaterials) is in the latter stages of its relocation to new, purpose-built premises. Construction and fitting-out have been completed and the relocated equipment is progressing through testing and certification. Secant’s new product pipeline has again expanded and currently stands at over 150 projects. Against this background of investment, Secant Group produced a good result for the year with revenue ahead of the previous year. As anticipated, operating profit reflected various additional operating costs which arose as a consequence of the move and, in particular, the need to run the old and new facilities alongside one another for a period of time. Charter Medical (single-use products for blood management, bio-processing and cell therapy) made a much enhanced contribution to the Group’s results which was ahead of our earlier expectations. Demand for Charter Medical products has been strong, and its operational performance has been improved by various senior management changes made during the year. In September 2016, the Group disposed of Xeridiem Medical Devices for a cash consideration, net of disposal costs, of £6.4m. The disposal will allow Solesis Medical Technologies to focus on the significant growth opportunities in Secant Group and Charter Medical whilst Xeridiem Medical Devices is expected to bring more synergies to the purchaser than were available to the Fenner Group. Engineered Conveyor Solutions
During the year, ECS implemented a series of specific initiatives and continuous improvement programmes as it stepped up its response to conditions in the worldwide mining industry which have remained exceptionally challenging. As part of this, ECS refocused its North American business on the industrial segment and strengthened its position in the Australian market. In 2016, ECS generated revenue of £321.8m (2015: £409.5m at constant currencies). Operating cash flow was £34.9m, compared with underlying operating profit of £14.2m, reflecting in particular the continuing strong emphasis on the management of working capital. Despite the unprecedented market conditions, underlying operating margin was 4.4% (2015: 5.8%). As the year progressed, the benefits of the actions taken were reflected in ECS’s results, with profitability in the second half of the year being well ahead of that in the first half. ECS is managed in two regional business groupings, being Northern Hemisphere (including North America and Europe, where ECS predominantly serves industrial customers) and Southern Hemisphere (comprising principally ECS’s businesses in Australia, China and RSA, where the customer base is focused on mining). Northern Hemisphere In 2016, revenue was £171.4m (2015: £244.5m at constant currencies), a decrease of 30%; this represented 53% of ECS’s revenue. Americas During the year, ECS undertook a major refocusing and restructuring of its North American business. Under the refocusing, ECS is placing increased emphasis on its industrial business, which includes bulk materials and non-coal extractive industries; this business is seen as having more attractive medium and longer-term growth prospects.
6
In 2016, the industrial business accounted for over 60% of ECS’s North American sales, compared with some 40% in 2015. Within the industrial business, sales to the bulk materials sector continued to grow, whilst sales to non-coal extractive industries fell, reflecting conditions in global mining markets. The business further strengthened its network of distributors and enhanced its product and service offering which is being well received by distributors and end users. The restructuring has achieved the expected annual cost savings of £10m, with £6m having been realised in 2016. As part of this process, the majority of one of the principal belt manufacturing facilities in North America and a fabricated products facility have both been closed. Further cost savings and efficiency gains are expected from the ongoing continuous improvement programme. For the majority of the year, US coal miners remained under considerable financial pressure and generally sought to minimise operating expenses and cash outlays. Reflecting these conditions, ECS generated significantly lower revenues from sales of its belting products and services to the coal mining industry. Close management of customer credit has remained a key focus for ECS and has resulted in lower sales. However, by the end of the year, there were certain early indications that conditions in the US coal industry may be easing, with some recovery in prices and weekly production volumes returning towards levels seen in 2015. ECS has seen early indications of improvements in order intake, although these still remain well below levels seen in previous years. Weaker conditions in the copper industry in South America resulted in lower revenues being generated in the region. Europe ECS’s principal European operation, based in the Netherlands, serves a customer base that generally comprises industrial customers spread across Europe, North Africa and the Middle East. It successfully maintained its performance of the previous year, achieving a satisfactory return on sales in market conditions which have yet to show a sustained recovery. The UK business, which is almost wholly dependent on export markets, saw an improved return on lower revenues, reflecting the benefits of the restructuring undertaken during the previous year. Southern Hemisphere In 2016, revenue was £150.4m (2015: £165.0m at constant currencies), a decrease of 9%; this represented 47% of ECS’s revenue. Increased business efficiencies and continued close attention to costs across the region resulted in an improved return on sales. Australia ECS’s business in Australia represents the largest proportion of the Southern Hemisphere operations and is focused on the coal and iron ore mining industries. During the year, ECS strengthened its leadership of the Australian market through continued commitments to customer service and product innovation, supported by its strong local manufacturing presence. These measures mitigated the effects of mines reducing excess belt stocks and of lower demand for belt for use in new customer capacity. ECS’s revenue was also reduced by the strategic decision to withdraw from certain low margin service activities. ECS has enhanced its programme of continuous improvement to all aspects of its business including customer service, operational efficiency and the maximisation of value from its own supply chain; these measures have helped to offset the effect of continued pricing pressure amongst customers. BBCS and LECS, in which the Group acquired the outstanding minority interests after the year end, performed well during the year. As the year ended, strengthening prices of iron ore and thermal/metallurgical coal, combined with some prospect of increased demand for commodities from China, supported an improvement in sentiment within the mining industry, with some benefit being seen in ECS’s service business.
7
China ECS achieved a profit in the year despite demand for its belt having stagnated as the coal industry in China undergoes extensive restructuring. This restructuring is expected to lead, in due course, to a more favourable operating environment for ECS. However, in the meantime, there is likely to be a period of uncertainty across the industry as a whole which will impact ECS’s order intake levels. RSA ECS’s business in RSA remained profitable during the year, through a strong focus on costs and despite revenues having been adversely impacted by uncertainty over the future of the coal mining industry and the much reduced output of iron ore. Group financing
The Group remains well invested with a strong asset base. As at 31 August 2016, the Group’s net debt was £150.0m (2015: £138.0m). The debt is mostly US dollar-denominated; through the prudent use of hedging, we were able to mitigate the impact of changing foreign exchange rates after the Brexit vote. Before taking into account the net impact of exchange rate movements, net debt was little changed over the year. Capital expenditure was £16.1m, compared with depreciation of £24.2m. Capital expenditure in AEP was £11.3m, which was concentrated in the medical businesses and principally related to new specialist premises for Secant Group. In ECS, capital expenditure was £4.8m against depreciation of £13.8m. Given the significant investments made in ECS’s facilities in prior years, this general level of capital expenditure will be sufficient for some time to come. Dividends
The Board is recommending a final dividend of 2.0p per share, which gives a total dividend for the year of 3.0p. The total dividend for the year is covered 2.8 times by underlying earnings and 6.7 times by free cash flow. The Board has rebased the dividend to a level which is more appropriate to the Group's current level of earnings and one from which it intends to adopt a progressive dividend policy. Board and governance
The Board is satisfied that, following Nick Hobson ceasing to be a director of the Company, it has an appropriate composition of executive and non-executive members for the time being. The Board has continuing processes for the appointment of a Non-Executive Chairman and a Chief Executive Officer. The Board is aware that the appointment of a new Chief Executive Officer is a crucial and potentially lengthy process and is grateful to Mark Abrahams for his undertaking that he will remain in the role until an appointment has been made which may be beyond his previously indicated retirement date of February 2017. He has also agreed to assist in the transition to a new Chief Executive Officer. Health & Safety
The Group has an overriding commitment to provide a safe and secure working environment for everyone. This extends beyond our employees to include all those who work with us and are affected by our activities such as customers, visitors and our neighbours. The Group continues to show year-on-year improvement in its primary HSE performance measure, Lost Time Incident Frequency Rate (“LTIFR”). The LTIFR reduced by 11% over the year to 0.55, which compares favourably to published industry benchmarks. This means that our employees are safer; it indicates we are more efficient in our operations; and it results in tangible commercial benefits, for example, in terms of lower insurance premiums.
8
Outlook
Whilst the prices of commodities relevant to our ECS business have recently shown a moderate increase, we believe it is appropriate to view these increases with a degree of caution as they are yet to translate into increased demand for conveyor belt. Nevertheless, the price increases do leave our customers better positioned. This, together with the fact that many customers have significantly reduced stocks, is leading to their requiring belt on much shorter lead times. This is a more positive situation which we believe will eventually lead to increased demand. The North American rig count that aligns to the demand for our oil & gas businesses has risen steadily for the last three months and recently we have seen increases in demand, albeit from a very low base. The structural changes that have taken place in the industry will, we believe, act as a short-term constraint to growth but, in the longer term, will enable us to accelerate our market share gains and, over the next few years, return the business to the levels of profitability we enjoyed before the decline of the last 18 months. Our medical businesses have created a technology platform incorporating some important patents which will provide significant new opportunities for growth, albeit the incubation period for such products is likely to be several years. Our industrial businesses are performing steadily against stable but subdued market conditions. Taken as a whole, the Group has commenced the new financial year with a substantially reduced cost base and with several of the leading indicators for the Group’s businesses showing a more positive trend. As a consequence, we now anticipate that the outcome for the current year will be modestly ahead of our previous expectations. In addition, the Group is experiencing a tailwind from the translation of overseas earnings into sterling, with the year-on-year impact on underlying operating profit from currency movements estimated to be £4m based on exchange rates prevailing during the early part of the new financial year.

9
Financial review
Revenue and operating profit
Group revenue decreased by 14% to £572.5m (2015: £666.7m). The favourable translation effect of movements in foreign exchange rates, which includes the partial year effect following the UK’s vote to leave the European Union, was £21.9m. Revenue, measured at constant exchange rates, decreased by 17%. In the AEP division, revenue decreased by 6% to £250.7m (2015: £266.2m) or by 10% at constant exchange rates. A continued slowdown was experienced by our oil & gas businesses whilst softer demand patterns were seen in some industrial markets. Medical performed well, with Charter Medical exceeding expectations in its first full year and Secant Group leveraging growth opportunities as the business transitions to new state-of-the-art premises. In the ECS division, revenue decreased by 20% to £321.8m (2015: £400.5m) or by 21% at constant exchange rates. Difficult trading conditions prevailed throughout the year in most of its principal markets, particularly coal mining. Underlying operating profit decreased by 34% to £37.1m (2015: £56.4m) or by 38% at constant exchange rates. Divisional underlying operating profits were £29.9m (2015: £41.0m) in the AEP division and £14.2m (2015: £23.3m) in the ECS division. On a constant currency basis, AEP profits decreased by 33% and ECS profits decreased by 41%. Corporate costs reduced by 11% to £7.0m (2015: £7.9m). Amortisation of intangible assets acquired decreased to £11.0m (2015: £12.9m). An exceptional charge amounting to £40.8m (2015: £34.4m) was incurred, comprising impairment costs relating to goodwill and intangible assets acquired of £25.0m and restructuring costs of £15.8m. Carrying amounts of goodwill and intangible assets acquired are reviewed at least annually by conducting an impairment review which is based on the net present value of projected cash flows for each cash-generating unit (“CGU”). In the ECS division, the impairment of goodwill and intangible assets acquired was £20.9m and related to ECS Conveyor Services (Americas). The impairment arose from the impact of continuing low energy prices in the US coal mining industry and low coal and copper commodity prices which have reduced customer expenditures. In the AEP division, the impairment of goodwill and intangible assets acquired was £4.1m and related to Mandals. The impairment arose following continuing low oil and gas prices which has had a significant impact on Mandals’ end markets, principally in the USA. These economic conditions have decreased the present value of projected cash flows in the respective CGUs. The restructuring costs of £15.8m predominantly relate to the implementation of cost reduction initiatives and the rebalancing of operational capacity to foreseeable demand patterns. The charge comprises severance costs, asset impairments, onerous contract obligations and other costs related to restructuring initiatives. The most significant element of the restructuring charge within the ECS division related to the rationalisation and refocusing of the conveyor belt operations in the Americas given the continuing difficult US coal market conditions. This included the closure of the majority of the belt manufacturing facility at Port Clinton, Ohio, the closure of the conveyor structures business at Allison, Pennsylvania and the rationalisation of support functions. In the AEP division, the principal restructuring costs related to the closure of our two CDI Energy Products businesses located in the UK, which operated in the European oil & gas sector, with partial relocation of production to other global CDI locations, as well as some restructuring of the Precision Polymers businesses. Of the £15.8m total restructuring costs, £8.1m was spent during the year, £3.2m is held within provisions and will be paid after the year end and £4.5m related to non-cash costs, principally asset impairments. In addition, £2.3m was paid during the year which related to restructuring in the prior year. The resultant Group operating loss was £14.7m (2015: operating profit of £9.1m). Financing
The Group is financed by a mix of equity, retained earnings, US dollar private placement loan notes and committed and uncommitted bank facilities. The principal loan facilities are raised centrally while operating companies supplement this funding with local overdraft and working capital facilities.

10
The Group’s principal committed loan facilities consist of US dollar private placement loan notes and bank facilities. The US dollar private placement loan notes total $290.0m (£221.4m). These mature between 2017 and 2023 and bear fixed interest rates averaging 5.4%. The committed bank facilities, which total £125.0m, are multi-currency revolving credit agreements. They comprise a £100.0m club facility with four major UK-based banks and a further bilateral facility of £25.0m with one of the club facility banks. Both facilities have been in place for the whole of the financial year and both mature in July 2019. The Group’s total committed loan facilities at 31 August 2016 were £346.7m (2015: £313.6m). At 31 August 2016, £111.5m (2015: £87.7m) of these facilities were not drawn down. In addition, the Group has uncommitted facilities of £36.5m (2015: £40.3m). The private placement loan notes are fully drawn down and used to fund or hedge Group operations. The principal financial covenants relating to the committed loan facilities are: the ratio of net debt to EBITDA (net debt must be less than 3.5 times adjusted EBITDA); and interest cover to EBITDA (adjusted EBITDA must be at least 3 times the net interest charge). Throughout the year under review, the Group complied with all of its loan covenants, with significant headroom available. At 31 August 2016, the reported net debt to EBITDA was 2.4 times (2015: 1.7 times). Reported EBITDA interest cover was 4.4 times (2015: 5.7 times). For the purpose of testing the Group’s compliance with its loan covenants, reported EBITDA is adjusted for, inter alia, acquisitions and exceptional and certain non-cash items. In addition, for covenant purposes, net debt may also be translated at average exchange rates for the financial year rather than at year end exchange rates. Translating net debt at average exchange rates reduces the net debt to EBITDA ratio at 31 August 2016 to 2.2 times. In normal circumstances, the Group aims to maintain significant headroom in its net debt to EBITDA ratio. The Board has indicated that it will allow reduced headroom for short periods when organic or acquisitive growth opportunities arise which are expected to enhance shareholder value. The Group remains well placed to fund and support its operations, including further investment, with a diversified range of committed loan facilities with a medium-term maturity profile, cash resources and, where necessary, shorter-term facilities. On 1 June 2017, $90.0m of US dollar private placement loan notes mature. It is expected that these will be repaid from a combination of cash balances and existing committed bank facilities. No new or additional financing will be required although the Group will review its overall funding needs in due course. Cash flow and net debt
The table below summarises the cash flows giving rise to the movement in net debt.
2016 2015 £m £m Underlying operating profit 37.1 56.4 Depreciation and amortisation (excluding intangible assets acquired) 24.2 23.4 Capital expenditure (including finance leases) (16.1) (28.1) Capital disposals 1.9 3.6 Working capital 15.1 13.9 Operating cash flow 62.2 69.2 Taxation (6.2) (8.5) Interest (13.2) (14.2) Other movements (4.0) (3.3) Free cash flow 38.8 43.2 Dividends - Fenner shareholders (23.3) (23.3) Dividends - non-controlling interests (1.3) (2.0) Restructuring (10.4) (9.6) Acquisitions (5.6) (25.6) Movement in net debt before currency (1.8) (17.3) Settlement of derivatives 10.5 - Currency movements (20.7) (3.4) Movement in net debt (12.0) (20.7) Opening net debt (138.0) (117.3) Closing net debt (150.0) (138.0)

11
Despite the 34% reduction in underlying operating profit in the year, free cash inflow only reduced by 10% to £38.8m with the continuing focus on working capital management together with a reduction in capital expenditure contributing to this result. Of the £16.1m capital expenditure, £11.3m was invested in the AEP division, the largest project being the major facilities consolidation at Secant Group. Acquisition payments were £5.6m and related to deferred consideration in respect of acquisitions from previous years. Gains on certain derivative instruments amounting to £10.5m were realised in December 2015 following the Group’s review of its balance sheet hedging strategy and adjustment of its net investment hedges for Australian dollars, euros and US dollars. The adverse currency movements reflect the effect on borrowings of the weakening of sterling against all currencies, principally the US dollar, during the year and particularly in the period since the UK voted to leave the European Union. Net finance costs
Finance costs, net of finance income, increased by £1.2m to £15.6m (2015: £14.4m). 2016
£m 2015
£mFixed rate debt 1 Floating rate debt 2 Loan and commitment fees Less: interest receivable
10.9 2.7 0.8
(0.5)
10.33.40.7
(0.5)Net interest payable Notional interest
13.9 1.7
13.90.5
Net finance costs 15.6 14.4 1 Including the cost of long-term cross-currency swaps. 2 Including the cost or benefit of short-term cross-currency swaps. The majority of the Group’s net interest payable is at fixed interest rates, principally arising from the US dollar private placement loan notes. The remaining borrowings and cash deposits are at floating interest rates. Notional interest comprises the net interest cost of defined benefit post-retirement schemes of £0.8m (2015: £1.0m), the unwinding of the discount on deferred payments on acquiring the remaining non-controlling interest in BBCS/LECS of £0.8m (2015: £1.1m) and a finance charge relating to the redemption liability for BBCS/LECS of £0.1m (2015: credit of £1.6m). Taxation
The total tax credit for the Group is £5.0m (2015: charge of £4.4m) on a loss before taxation of £30.3m (2015: £5.3m). The net tax credit is split into: • a tax credit of £10.9m on exceptional items, amortisation of intangible assets acquired and notional interest
totalling £53.5m; and • an underlying tax charge of £5.9m on underlying profit before taxation of £23.2m. The underlying tax rate for the Group was 25% (2015: 27%). The underlying tax rate is a combination of the varying tax rates applicable in the countries in which the Group operates and, in any year, will depend on the mix of profits made between countries. The reduction in the rate arises principally from a more efficient utilisation of tax losses in the period, particularly in the USA. The net tax credit rate of 16.5% is lower than the underlying tax rate principally as a result of exceptional impairment and restructuring costs on which no tax relief is available or which give rise to tax losses on which deferred tax assets have not been fully recognised based on current forecasts of taxable profit.

12
Dividends
The interim dividend of 1.0p per share (2015: 4.0p) was paid on 7 September 2016. The Board is recommending a final dividend of 2.0p per share (2015: 8.0p) to make a total dividend for the year of 3.0p per share (2015: 12.0p). Dividend cover, defined as the ratio of underlying earnings per share to dividend per share, was 2.8 times (2015: 1.3 times). If approved by shareholders, the final dividend will be paid on 9 March 2017 to shareholders on the register on 27 January 2017. Earnings per share
Underlying basic earnings per share was 8.4p (2015: 15.5p) and basic loss per share was 13.6p (2015: 5.4p). Post balance sheet events
On 1 September 2016, the Group disposed of Xeridiem Medical Devices for a net cash consideration of £6.4m, subject to working capital adjustments. Xeridiem, located in Arizona, USA, manufactures minimally invasive catheter and other single-use medical devices. The disposal will enable greater focus on the growth opportunities in our Secant and Charter medical businesses. Xeridiem’s net assets of £1.2m have been disclosed as held for sale in the Consolidated balance sheet. This disposal does not meet the criteria for disclosure as a discontinued operation. On 1 November 2016, the Group acquired the remaining non-controlling interests in Belle Banne Conveyor Services and Leading Edge Conveyor Services, both based in Australia. Financial risk management
In the normal course of business, the Group is exposed to certain financial risks, principally foreign exchange risk, interest rate risk, liquidity risk and credit risk. These risks are managed by the central treasury function in conjunction with the operating units in accordance with risk management policies that are designed to minimise the potential adverse effects of these risks on financial performance. The policies are reviewed and approved by the Board. The exposures are managed through the use of borrowings, derivatives and credit management procedures. The use of derivatives is undertaken only where the underlying interest or foreign exchange risk arises from the Group’s operations or sources of finance. No speculative trading in derivatives is permitted. Further information on foreign exchange risk management is given below. Foreign exchange translation risk
The Group has operations around the world which report in their respective functional currencies. The Group is exposed to translation risk in respect of its income statement. Principal average exchange rates applied on translation of the income statement for 2016 and 2015 were as follows: 2016 2015US dollars Australian dollars Euros
1.44 1.97 1.29
1.551.941.34
The Group is also exposed to translation risk in respect of its net assets in foreign operations. Where cost effective, the Group hedges a proportion of its exposures through a combination of borrowings, cross-currency swaps and forward foreign currency contracts, principally in respect of net assets denominated in US dollars, Australian dollars, euros, Norwegian krone and Chinese renminbi. The Group previously entered into cross-currency swaps linked to the US dollar private placement cash flows. In 2007, $27.2m was swapped into €20.0m at a fixed rate of 5.05%. In 2011, $44.7m was swapped into AUD$45.0m at a fixed rate of 8.43%. These swaps provided hedges against the Group’s net investments in euros and Australian dollars, at fixed interest rates, and mirrored the private placement cash flows. These swaps were accounted for as hedges in accordance with IAS 39 ‘Financial Instruments: Recognition and Measurement’, with the charge or credit recognised directly in other comprehensive income in equity.

13
During the year, the Group reviewed its balance sheet hedging strategy and adjusted its net investment hedge for Australian dollars, euros and US dollars. As a result, the long-term cross-currency swaps described above were settled. In addition, the Group took out further forward currency contracts which reduced the Group’s exposure to the translation of debt denominated in US dollars and more closely aligned our net debt to EBITDA for all currencies, particularly the US dollar, to the Group ratio. The effect is that exchange rate changes, whilst changing the value of net debt, will not materially affect the Group net debt to EBITDA ratio. Foreign exchange transaction risk
Transaction exposures arise where an operation sells or purchases goods and services in a non-functional currency. These transaction exposures are reduced by many of the Group’s global operations serving local markets. Material transaction exposures are hedged, principally with forward foreign currency contracts, once cash flows can be identified with sufficient certainty. Where derivatives are used to hedge transaction exposures, the Group does not hedge account for such transactions under the requirements of IAS 39, recognising that cash flows through to the maturity of the derivative are unaffected. In compliance with IAS 39, all financial instruments have been measured at their fair value as at the balance sheet date. A charge or credit to the income statement has been recognised for the loss or gain on these instruments. In addition, in accordance with IAS 21 ‘The Effects of Changes in Foreign Exchange Rates’, all foreign currency monetary items have been retranslated at the closing rate, with changes in value charged or credited to the income statement. Return on gross capital employed
The return on gross capital employed has decreased to 7.9% (2015: 11.6%) largely due to the reduction in underlying operating profit in the ECS division and the oil & gas businesses within the AEP division. Post-retirement benefits
The Group operates a number of defined benefit post-retirement schemes for qualifying employees in operations around the world. The UK scheme, which was closed to new entrants in 1997, and the scheme in the Netherlands, which is a career average plan, together represent 96% of both the Group’s total scheme assets and total scheme liabilities. During the year, the fair value of assets of the schemes increased to £219.7m (2015: £183.1m), principally generated from actuarial gains in the UK scheme’s investments and additional Group contributions paid to reduce the deficit. The present value of obligations increased to £268.7m (2015: £209.5m) largely due to a reduction in corporate bond yields used to determine the discount rate. The total defined benefit post-retirement deficit, as calculated by the schemes' actuaries and recorded on the balance sheet at 31 August 2016, increased to £49.0m (2015: £26.4m). Capital reduction
On 6 July 2016, the High Court confirmed the Company’s capital reduction, as previously approved by shareholders at the AGM in January 2016. This created £128.0m of additional distributable reserves from the Company’s share premium account and capitalised merger reserve. Going concern review
After making enquiries, the Board has formed a judgement that there is a reasonable expectation the Group has adequate resources to continue in operational existence for the foreseeable future and for a period of at least 12 months from the date of this report. Accordingly, the Board has assessed that the going concern basis of accounting is appropriate in preparing the financial statements. In forming this view, the Board has reviewed the Group’s budget and cash flow forecasts against availability of financing, including an assessment of sensitivities to changes in market conditions. In particular, the Group has sufficient existing bank facilities and cash balances to repay the private placement loan notes due in June 2017.
14
Long-term viability statement
The Board has also assessed the viability of the Group over a three year period to 31 August 2019, taking account of the Group’s position at 31 August 2016 and the potential impacts of the principal risks over the review period. Based on this assessment, the directors have a reasonable expectation that the Company will be able to continue in operation and meet its liabilities as they fall due during the period to 31 August 2019. In making this statement, the Board has considered the resilience of the Group, taking account of its current position, the principal risks facing the business in severe but reasonable scenarios and the effectiveness of any mitigating actions. This assessment has considered the potential impacts of these risks on the business model, future performance, solvency and liquidity over the period. The Board has determined that the three year period to 31 August 2019 is an appropriate period over which to provide its viability statement since this represents the period over which financial forecasts are prepared in the annual budget process. In making its assessment of long-term viability, the Board has taken account of the Group’s balance sheet strength, the maturity profile of its current debt funding and its ability to raise new finance in most market conditions.
15
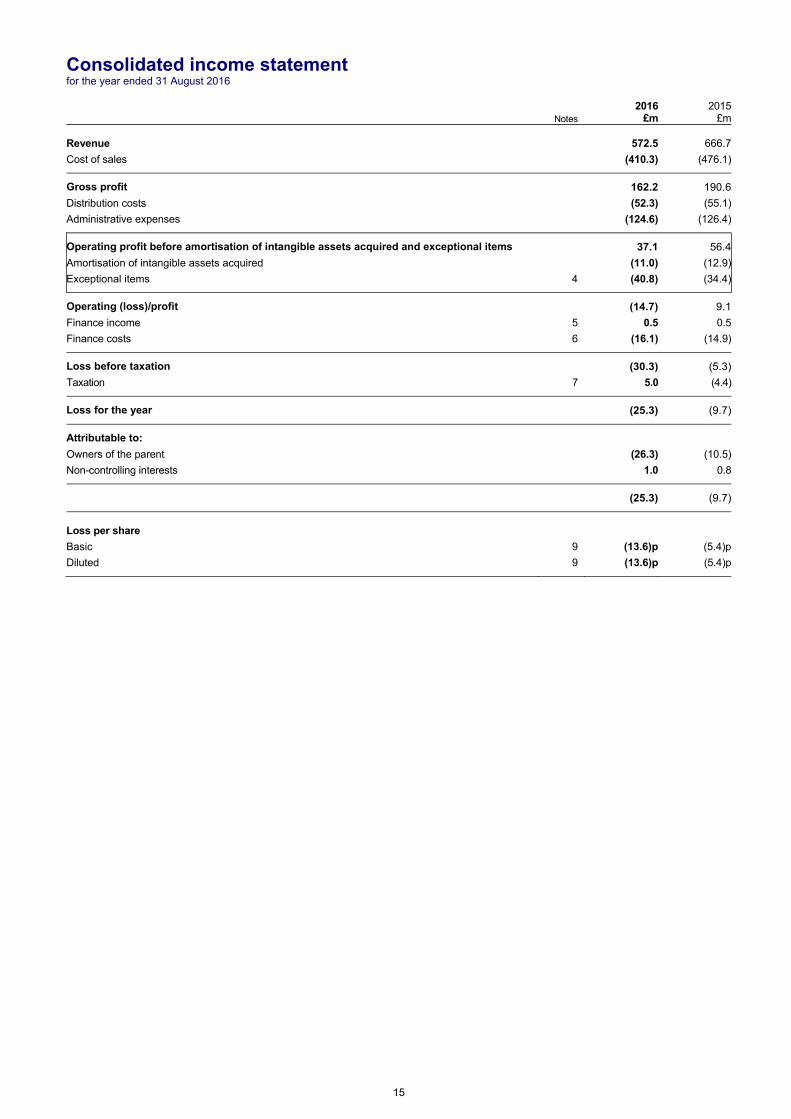
Consolidated income statement for the year ended 31 August 2016
Notes 2016
£m2015
£m
Revenue 572.5 666.7
Cost of sales (410.3) (476.1)
Gross profit 162.2 190.6
Distribution costs (52.3) (55.1)
Administrative expenses (124.6) (126.4)
Operating profit before amortisation of intangible assets acquired and exceptional items 37.1 56.4
Amortisation of intangible assets acquired
Exceptional items 4
(11.0)
(40.8)
(12.9)
(34.4)
Operating (loss)/profit (14.7) 9.1
Finance income 5 0.5 0.5
Finance costs 6 (16.1) (14.9)
Loss before taxation (30.3) (5.3)
Taxation 7 5.0 (4.4)
Loss for the year (25.3) (9.7)
Attributable to:
Owners of the parent (26.3) (10.5)
Non-controlling interests 1.0 0.8
(25.3) (9.7)
Loss per share
Basic 9 (13.6)p (5.4)p
Diluted 9 (13.6)p (5.4)p
16
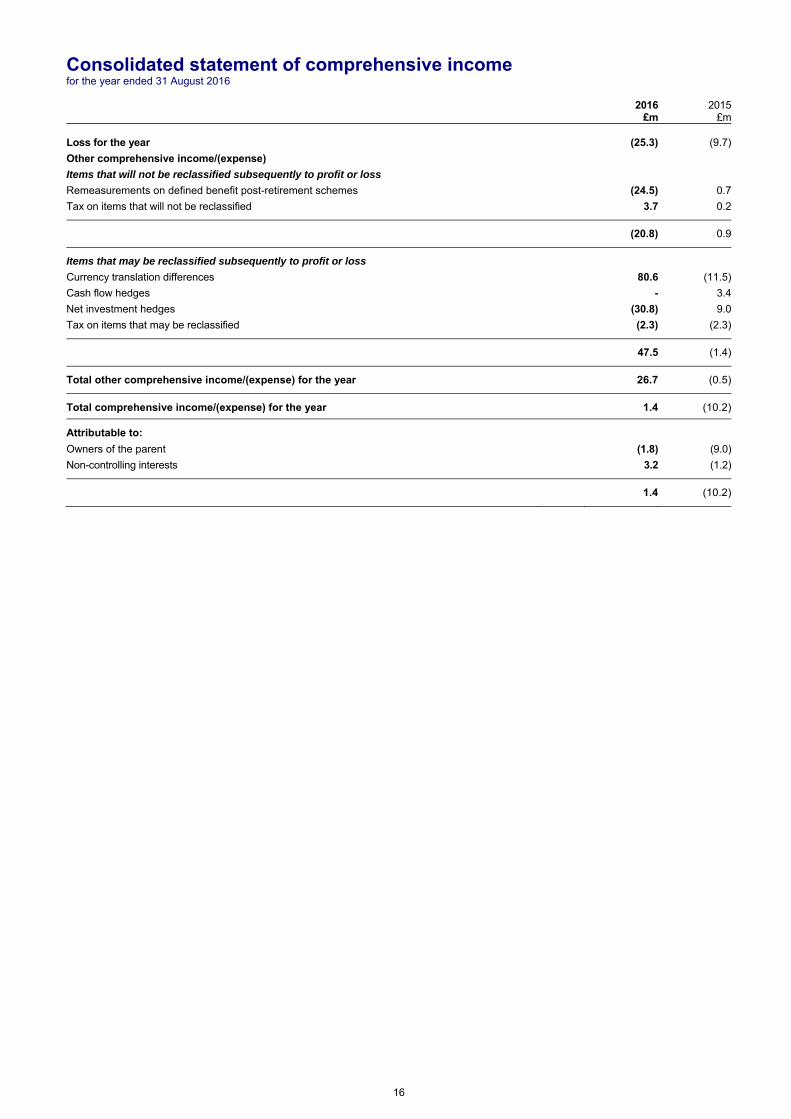
Consolidated statement of comprehensive income for the year ended 31 August 2016
2016
£m2015
£m
Loss for the year (25.3) (9.7)
Other comprehensive income/(expense)
Items that will not be reclassified subsequently to profit or loss
Remeasurements on defined benefit post-retirement schemes (24.5) 0.7
Tax on items that will not be reclassified 3.7 0.2
(20.8) 0.9
Items that may be reclassified subsequently to profit or loss
Currency translation differences 80.6 (11.5)
Cash flow hedges - 3.4
Net investment hedges (30.8) 9.0
Tax on items that may be reclassified (2.3) (2.3)
47.5 (1.4)
Total other comprehensive income/(expense) for the year 26.7 (0.5)
Total comprehensive income/(expense) for the year 1.4 (10.2)
Attributable to:
Owners of the parent (1.8) (9.0)
Non-controlling interests 3.2 (1.2)
1.4 (10.2)
17
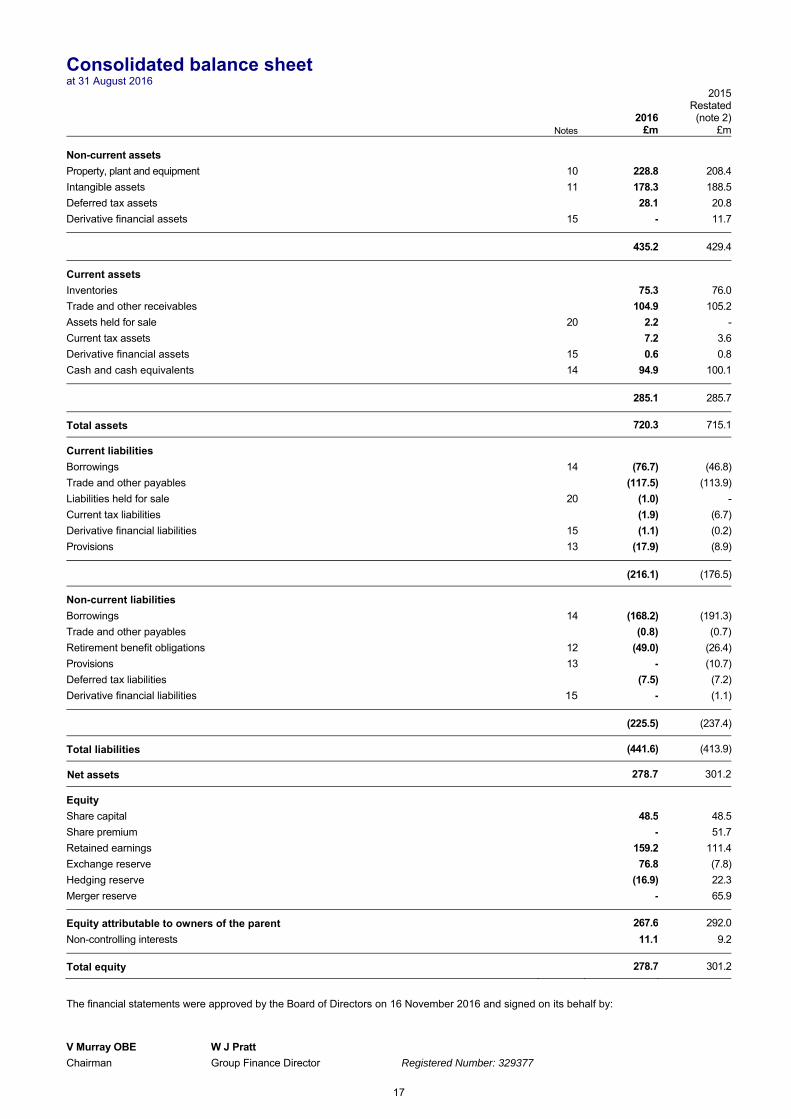
Consolidated balance sheet at 31 August 2016
Notes 2016
£m
2015Restated
(note 2) £m
Non-current assets
Property, plant and equipment 10 228.8 208.4
Intangible assets 11 178.3 188.5
Deferred tax assets 28.1 20.8
Derivative financial assets 15 - 11.7
435.2 429.4
Current assets
Inventories 75.3 76.0
Trade and other receivables 104.9 105.2
Assets held for sale 20 2.2 -
Current tax assets 7.2 3.6
Derivative financial assets 15 0.6 0.8
Cash and cash equivalents 14 94.9 100.1
285.1 285.7
Total assets 720.3 715.1
Current liabilities
Borrowings 14 (76.7) (46.8)
Trade and other payables (117.5) (113.9)
Liabilities held for sale 20 (1.0) -
Current tax liabilities (1.9) (6.7)
Derivative financial liabilities 15 (1.1) (0.2)
Provisions 13 (17.9) (8.9)
(216.1) (176.5)
Non-current liabilities
Borrowings 14 (168.2) (191.3)
Trade and other payables (0.8) (0.7)
Retirement benefit obligations 12 (49.0) (26.4)
Provisions 13 - (10.7)
Deferred tax liabilities (7.5) (7.2)
Derivative financial liabilities 15 - (1.1)
(225.5) (237.4)
Total liabilities (441.6) (413.9)
Net assets 278.7 301.2
Equity
Share capital 48.5 48.5
Share premium - 51.7
Retained earnings 159.2 111.4
Exchange reserve 76.8 (7.8)
Hedging reserve (16.9) 22.3
Merger reserve - 65.9
Equity attributable to owners of the parent 267.6 292.0
Non-controlling interests 11.1 9.2
Total equity 278.7 301.2
The financial statements were approved by the Board of Directors on 16 November 2016 and signed on its behalf by: V Murray OBE W J Pratt
Chairman Group Finance Director Registered Number: 329377

18
Consolidated cash flow statement for the year ended 31 August 2016
Notes 2016
£m
2015Restated
(note 2) £m
Loss before taxation (30.3) (5.3)
Adjustments for:
Depreciation of property, plant and equipment and amortisation of intangible assets 35.2 36.3
Impairment of property, plant and equipment 2.9 1.6
Impairment of intangible assets 25.0 24.5
Other exceptional non-cash movements 4.8 1.4
Cash payments in respect of prior year exceptional items (2.3) (2.7)
Defined benefit post-retirement costs charged to operating profit 0.8 2.1
Cash contributions to defined benefit post-retirement schemes (5.2) (4.9)
Movement in provisions (0.8) (0.8)
Finance income (0.5) (0.5)
Finance costs 16.1 14.9
Other non-cash movements 1.2 0.3
Operating cash flow before movement in working capital 46.9 66.9
Movement in inventories 11.1 15.2
Movement in trade and other receivables 13.6 20.4
Movement in trade and other payables (9.6) (21.7)
Net cash from operations 62.0 80.8
Taxation paid (6.2) (8.5)
Net cash from operating activities 55.8 72.3
Investing activities
Purchase of property, plant and equipment (14.2) (25.2)
Disposal of property, plant and equipment 1.9 3.6
Purchase of intangible assets (1.1) (2.2)
Acquisition of businesses 19 (5.6) (25.6)
Interest received 0.5 0.5
Net cash used in investing activities (18.5) (48.9)
Financing activities
Dividends paid to Company’s shareholders 8 (23.3) (23.3)
Dividends paid to non-controlling interests (1.3) (2.0)
Settlement of derivative financial instruments 15 10.5 -
Interest paid (13.7) (14.7)
Repayment of borrowings (29.7) (3.8)
New borrowings 0.6 12.7
Net cash used in financing activities (56.9) (31.1)
Net decrease in cash and cash equivalents (19.6) (7.7)
Cash and cash equivalents at start of year 93.1 95.8
Exchange movements 16.5 5.0
Cash and cash equivalents at end of year 90.0 93.1
Cash and cash equivalents comprises:
Cash and cash equivalents 94.9 100.1
Bank overdrafts (4.9) (7.0)
90.0 93.1

19
Consolidated statement of changes in equity for the year ended 31 August 2016
Attributable to owners of the parent
Share capital
£m
Share premium
£m
Retained earnings
£m
Exchangereserve
£m
Hedging reserve
£m
Merger reserve
£m Total
£m
Non-controlling
interests £m
Total equity
£m
At 1 September 2014 48.5 51.7 143.5 1.7 12.2 65.9 323.5 12.7 336.2
(Loss)/profit for the year - - (10.5) - - - (10.5) 0.8 (9.7)
Other comprehensive income/(expense)
Currency translation differences - - - (9.5) - - (9.5) (2.0) (11.5)
Cash flow hedges - - - - 3.4 - 3.4 - 3.4
Net investment hedges - - - - 9.0 - 9.0 - 9.0
Remeasurements on defined benefit post-retirement schemes - - 0.7 - -
- 0.7 - 0.7
Tax on other comprehensive income/(expense) - - 0.2 - (2.3) - (2.1) - (2.1)
Total other comprehensive income/(expense) - - 0.9 (9.5) 10.1 - 1.5 (2.0) (0.5)
Total comprehensive income/(expense) for the year - - (9.6) (9.5) 10.1 - (9.0) (1.2) (10.2)
Transactions with owners
Dividends paid in the year - - (23.3) - - - (23.3) (2.0) (25.3)
Share-based payments - - 0.6 - - - 0.6 - 0.6
Transfer of non-controlling interests - - 0.3 - - - 0.3 (0.3) -
Tax on transactions with owners - - (0.1) - - - (0.1) - (0.1)
Total transactions with owners - - (22.5) - - - (22.5) (2.3) (24.8)
At 1 September 2015 48.5 51.7 111.4 (7.8) 22.3 65.9 292.0 9.2 301.2
(Loss)/profit for the year - - (26.3) - - - (26.3) 1.0 (25.3)
Other comprehensive income/(expense)
Currency translation differences - - - 78.4 - - 78.4 2.2 80.6
Net investment hedges - - - 10.5 (41.3) - (30.8) - (30.8)
Remeasurements on defined benefit post-retirement schemes - - (24.5) - -
- (24.5) - (24.5)
Tax on other comprehensive income/(expense) - - 3.6 (4.3) 2.1 - 1.4 - 1.4
Total other comprehensive income/(expense) - - (20.9) 84.6 (39.2) - 24.5 2.2 26.7
Total comprehensive income/(expense) for the year - - (47.2) 84.6 (39.2) - (1.8) 3.2 1.4
Transactions with owners
Dividends paid in the year - - (23.3) - - - (23.3) (1.3) (24.6)
Share-based payments - - 0.7 - - - 0.7 - 0.7
Capital reduction - (51.7) 117.6 - - (65.9) - - -
Total transactions with owners - (51.7) 95.0 - - (65.9) (22.6) (1.3) (23.9)
At 31 August 2016 48.5 - 159.2 76.8 (16.9) - 267.6 11.1 278.7
20
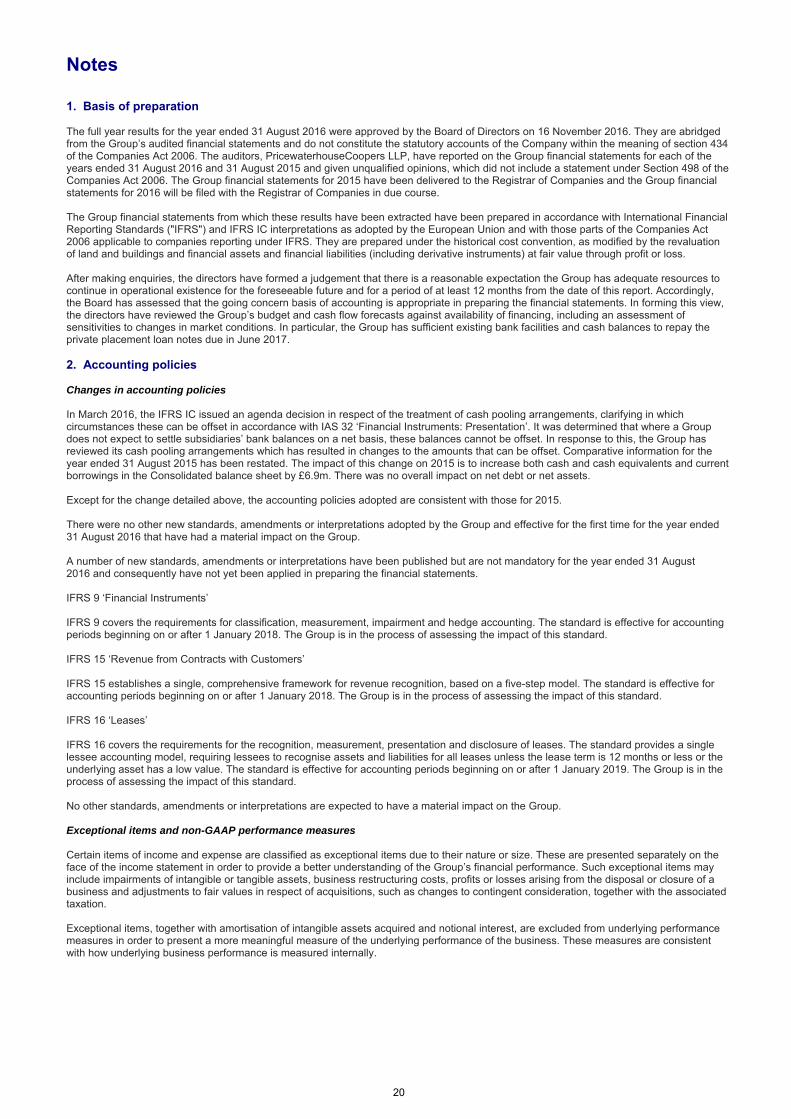
Notes 1. Basis of preparation The full year results for the year ended 31 August 2016 were approved by the Board of Directors on 16 November 2016. They are abridged from the Group’s audited financial statements and do not constitute the statutory accounts of the Company within the meaning of section 434 of the Companies Act 2006. The auditors, PricewaterhouseCoopers LLP, have reported on the Group financial statements for each of the years ended 31 August 2016 and 31 August 2015 and given unqualified opinions, which did not include a statement under Section 498 of the Companies Act 2006. The Group financial statements for 2015 have been delivered to the Registrar of Companies and the Group financial statements for 2016 will be filed with the Registrar of Companies in due course. The Group financial statements from which these results have been extracted have been prepared in accordance with International Financial Reporting Standards ("IFRS") and IFRS IC interpretations as adopted by the European Union and with those parts of the Companies Act 2006 applicable to companies reporting under IFRS. They are prepared under the historical cost convention, as modified by the revaluation of land and buildings and financial assets and financial liabilities (including derivative instruments) at fair value through profit or loss. After making enquiries, the directors have formed a judgement that there is a reasonable expectation the Group has adequate resources to continue in operational existence for the foreseeable future and for a period of at least 12 months from the date of this report. Accordingly, the Board has assessed that the going concern basis of accounting is appropriate in preparing the financial statements. In forming this view, the directors have reviewed the Group’s budget and cash flow forecasts against availability of financing, including an assessment of sensitivities to changes in market conditions. In particular, the Group has sufficient existing bank facilities and cash balances to repay the private placement loan notes due in June 2017. 2. Accounting policies Changes in accounting policies In March 2016, the IFRS IC issued an agenda decision in respect of the treatment of cash pooling arrangements, clarifying in which circumstances these can be offset in accordance with IAS 32 ‘Financial Instruments: Presentation’. It was determined that where a Group does not expect to settle subsidiaries’ bank balances on a net basis, these balances cannot be offset. In response to this, the Group has reviewed its cash pooling arrangements which has resulted in changes to the amounts that can be offset. Comparative information for the year ended 31 August 2015 has been restated. The impact of this change on 2015 is to increase both cash and cash equivalents and current borrowings in the Consolidated balance sheet by £6.9m. There was no overall impact on net debt or net assets. Except for the change detailed above, the accounting policies adopted are consistent with those for 2015. There were no other new standards, amendments or interpretations adopted by the Group and effective for the first time for the year ended 31 August 2016 that have had a material impact on the Group. A number of new standards, amendments or interpretations have been published but are not mandatory for the year ended 31 August 2016 and consequently have not yet been applied in preparing the financial statements. IFRS 9 ‘Financial Instruments’ IFRS 9 covers the requirements for classification, measurement, impairment and hedge accounting. The standard is effective for accounting periods beginning on or after 1 January 2018. The Group is in the process of assessing the impact of this standard. IFRS 15 ‘Revenue from Contracts with Customers’ IFRS 15 establishes a single, comprehensive framework for revenue recognition, based on a five-step model. The standard is effective for accounting periods beginning on or after 1 January 2018. The Group is in the process of assessing the impact of this standard. IFRS 16 ‘Leases’ IFRS 16 covers the requirements for the recognition, measurement, presentation and disclosure of leases. The standard provides a single lessee accounting model, requiring lessees to recognise assets and liabilities for all leases unless the lease term is 12 months or less or the underlying asset has a low value. The standard is effective for accounting periods beginning on or after 1 January 2019. The Group is in the process of assessing the impact of this standard. No other standards, amendments or interpretations are expected to have a material impact on the Group. Exceptional items and non-GAAP performance measures Certain items of income and expense are classified as exceptional items due to their nature or size. These are presented separately on the face of the income statement in order to provide a better understanding of the Group’s financial performance. Such exceptional items may include impairments of intangible or tangible assets, business restructuring costs, profits or losses arising from the disposal or closure of a business and adjustments to fair values in respect of acquisitions, such as changes to contingent consideration, together with the associated taxation. Exceptional items, together with amortisation of intangible assets acquired and notional interest, are excluded from underlying performance measures in order to present a more meaningful measure of the underlying performance of the business. These measures are consistent with how underlying business performance is measured internally.

21
3. Segment information IFRS 8 ‘Operating Segments’ requires segment information to be presented on the same basis as that used for internal management reporting. For the purposes of managing the business, the Group is organised into two reportable segments: Advanced Engineered Products and Engineered Conveyor Solutions.
Advanced Engineered Products
AEP provides high value-added solutions using advanced polymeric materials in three related products areas:
Advanced Sealing Technologies (seals for upstream/midstream oil & gas and petrochemicals; and seals for fluid power);
Precision Polymers (precision belts for power transmission and motion control; elastomeric solutions; and specialist hoses); and
Solesis Medical Technologies (biomedical textile components and biomaterials; and single-use products for blood management, bioprocessing and cell therapy).
Engineered Conveyor Solutions
ECS manufactures rubber ply, solid woven and steel cord heavyweight conveyor belt to the mining, industrial and bulk handling markets. ECS also provides related conveyor services such as maintenance, design and installation.
Operating segments within these reportable segments have been aggregated where they have similar economic characteristics with similar products and services, production processes, methods of distribution and customer types. The Chief Operating Decision Maker (“CODM”) for the purpose of IFRS 8 is the Board of Directors. The financial position of the segments is reported to the CODM on a monthly basis and this information is used to assess the performance of the Group and to allocate resources on an appropriate basis. Segment performance is reviewed down to the operating profit level. Financing costs and taxation are managed on a Group basis so these costs are not allocated to operating segments. Transfer prices on inter-segment revenues are on an arm’s length basis in a manner similar to transactions with third parties.

22
Segment information for the years ended 31 August 2016 and 31 August 2015 is as follows:
Advanced Engineered
Products
Engineered ConveyorSolutions
Unallocated Corporate Total
2016£m
2015£m
2016 £m
2015£m
2016£m
2015£m
2016£m
2015Restated
(note 2) £m
Segment result
Segment revenue 250.7 266.2 321.8 400.5 - - 572.5 666.7
Operating profit before amortisation of intangible assets acquired and exceptional items 29.9 41.0 14.2 23.3 (7.0) (7.9) 37.1 56.4
Amortisation of intangible assets acquired (6.3) (6.4) (4.7) (6.5) - - (11.0) (12.9)
Exceptional items (8.7) (13.6) (30.8) (20.8) (1.3) - (40.8) (34.4)
Operating (loss)/profit 14.9 21.0 (21.3) (4.0) (8.3) (7.9) (14.7) 9.1
Net finance costs (15.6) (14.4)
Taxation 5.0 (4.4)
Loss for the year (25.3) (9.7)
Segment assets
Property, plant and equipment 81.8 72.0 146.0 135.4 1.0 1.0 228.8 208.4
Intangible assets 134.3 126.1 44.0 62.4 - - 178.3 188.5
Inventories 32.2 31.2 43.1 44.8 - - 75.3 76.0
Trade and other receivables 40.3 41.6 61.8 61.9 2.8 1.7 104.9 105.2
Assets held for sale 2.2 - - - - - 2.2 -
Intra-group receivables 0.1 0.1 0.1 0.1 (0.2) (0.2) - -
Total segment assets 290.9 271.0 295.0 304.6 3.6 2.5 589.5 578.1
Unallocated assets 130.8 137.0
Total assets 720.3 715.1
Segment liabilities
Trade and other payables 35.4 37.6 75.1 70.9 7.8 6.1 118.3 114.6
Liabilities held for sale 1.0 - - - - - 1.0 -
Intra-group payables 1.4 1.2 1.5 0.7 (2.9) (1.9) - -
Total segment liabilities 37.8 38.8 76.6 71.6 4.9 4.2 119.3 114.6
Unallocated liabilities 322.3 299.3
Total liabilities 441.6 413.9
Unallocated assets comprise deferred tax assets, derivative financial assets, current tax assets and cash and cash equivalents. Unallocated liabilities comprise borrowings, current tax liabilities, derivative financial liabilities, provisions, retirement benefit obligations and deferred tax liabilities. 4. Exceptional items
2016
£m2015
£m
Charged to operating profit
Impairment of goodwill and intangible assets acquired 25.0 24.5
Restructuring costs 15.8 9.9
40.8 34.4
Credited to taxation
Taxation on exceptional items (7.1) (4.5)
Exceptional items comprise £8.7m in respect of AEP, £30.8m in respect of ECS and £1.3m in respect of corporate activities.

23
Impairment of goodwill and intangible assets acquired Impairment charges in the year are as follows:
Discount rateGoodwill
£m
Intangible assets
acquired £m
Total £m
Advanced Engineered Products Mandals 11.0% 1.6 2.5 4.1
Engineered Conveyor Solutions ECS Conveyor Services (Americas) 13.5% 15.0 5.9 20.9
Total impairment charge 16.6 8.4 25.0
Mandals manufactures lay flat hoses for use in demanding applications including in the exploitation of shale oil & gas reserves. The impairment resulted from the continuing low oil and gas prices which has had a significant impact on Mandals end markets and, as a result, on its actual and forecast cash flows. This has resulted in the recognition of an impairment charge totalling £4.1m. ECS Conveyor Services (Americas) provides a wide range of services principally to the US coal and Chilean copper mining markets. The impact of continuing low energy prices on the US coal mining industry and low commodity prices have reduced customer expenditures. This has led to reductions in actual and projected cash flows from the previous year, resulting in the recognition of impairment charges totalling £20.9m. Neither of the cash-generating units (“CGUs”) impaired in the year have any remaining carrying value of goodwill or intangible assets acquired. No impairment has been identified in relation to any of the other CGUs. The methodology for impairment testing is consistent with that adopted in the year ended 31 August 2015. The recoverable amounts of cash-generating units are based on value in use calculations using cash flow projections discounted to calculate the net present value. Restructuring costs Restructuring costs relate to severance, asset impairments, onerous contracts and other costs in connection with restructuring programmes across the Group, principally: the restructuring programme in ECS Americas following the continuing difficult conditions in the US coal mining sector which included the closure of the majority of the belt manufacturing facility at Port Clinton, Ohio and the fabricated products operation at Allison, Pennsylvania; the closure of the two UK-based CDI Energy Products operations, which operated in the European oil & gas sector, with partial relocation of production to other global CDI locations; certain restructuring within the Precision Polymers businesses; and restructuring within the corporate headquarters. At 31 August 2016, £8.1m had been paid in cash, with £3.2m held in provisions and payable after the year end, £2.9m provided in respect of impairment of property, plant and equipment, £0.4m provided in respect of impairment of inventories, £1.0m provided in respect of impairment of receivables and £0.2m credited to equity. The impairments of property, plant and equipment and inventories are all within ECS and principally relate to the closures at Port Clinton and Allison. In addition, cash payments of £2.3m were made in the year in respect of prior year exceptional items. 5. Finance income
2016
£m2015
£m
Bank interest receivable 0.5 0.5
6. Finance costs
2016
£m2015
£m
Interest payable on bank overdrafts and loans 3.4 4.4
Interest payable on other loans 11.2 10.4
14.6 14.8
Less amounts capitalised on qualifying assets (0.2) (0.4)
Interest payable 14.4 14.4
Net interest on defined benefit post-retirement schemes 0.8 1.0
Interest on the unwinding of discount on provisions 0.8 1.1
Finance charge/(credit) on redemption liability 0.1 (1.6)
Notional interest 1.7 0.5
Total finance costs 16.1 14.9

24
7. Taxation
2016£m
2015£m
Current taxation
UK corporation tax:
- current year 0.8 0.4
- double tax relief (0.4) (0.4)
0.4 -
Overseas tax:
- current year (0.2) 6.2
- adjustments in respect of prior years 0.5 (0.8)
0.3 5.4
0.7 5.4
Deferred taxation
Origination and reversal of temporary differences:
UK:
- current year (0.5) (0.7)
- adjustments in respect of prior years (0.3) 0.2
Overseas:
- current year (4.8) (1.3)
- adjustments in respect of prior years (0.1) 0.8
(5.7) (1.0)
Total taxation (5.0) 4.4
The taxation (credit)/charge includes a credit of £7.1m (2015: £4.5m) in respect of exceptional items, £3.6m (2015: £2.5m) in respect of the amortisation of intangible assets acquired and £0.2m (2015: £0.2m) in respect of notional interest. 8. Dividends
2016
£m2015
£m
Dividends paid or approved in the year
Interim dividend for the year ended 31 August 2015 of 4.0p (2014: 4.0p) per share 7.8 7.8
Final dividend for the year ended 31 August 2015 of 8.0p (2014: 8.0p) per share 15.5 15.5
23.3 23.3
Dividends neither paid nor approved in the year
Interim dividend for the year ended 31 August 2016 of 1.0p (2015: 4.0p) per share 1.9 7.8
Final dividend for the year ended 31 August 2016 of 2.0p (2015: 8.0p) per share 3.9 15.5
5.8 23.3
The interim dividend for the year ended 31 August 2016 was paid on 7 September 2016. The proposed final dividend for the year ended 31 August 2016 is subject to approval by shareholders at the AGM. Consequently, neither has been recognised as liabilities at 31 August 2016. If approved, the final dividend will be paid on 9 March 2017 to shareholders on the register on 27 January 2017.

25
9. Earnings/(loss) per share 2016
£m2015
£m
Earnings/(loss)
Loss for the year attributable to owners of the parent (26.3) (10.5)
Amortisation of intangible assets acquired 11.0 12.9
Exceptional items 40.8 34.4
Notional interest 1.7 0.5
Taxation attributable to amortisation of intangible assets acquired, exceptional items and notional interest and exceptional tax credit (note 7) (10.9) (7.2)
Profit for the year before amortisation of intangible assets acquired, exceptional items and notional interest 16.3 30.1
number number
Average number of shares
Weighted average number of shares in issue 194,002,741 194,002,741
Weighted average number of shares held by the Employee Share Ownership Plan Trust (114,177) (114,177)
Weighted average number of shares in issue - basic and diluted 193,888,564 193,888,564
pence pence
Earnings/(loss) per share
Underlying - Basic (before amortisation of intangible assets acquired, exceptional items and notional interest) 8.4 15.5
Underlying - Diluted (before amortisation of intangible assets acquired, exceptional items and notional interest) 8.4 15.5
Basic (13.6) (5.4)
Diluted (13.6) (5.4)
Underlying earnings/(loss) per share measures have been presented to provide a more meaningful measure of the underlying performance of the Group. 10. Property, plant and equipment The increase in property, plant and equipment in the year of £20.4m comprises additions of £12.8m and exchange movements of £34.7m less depreciation of £22.5m, impairment charges of £2.9m, disposals of £1.5m and transfers to assets held for sale of £0.2m. 11. Intangible assets The decrease in intangible assets in the year of £10.2m comprises amortisation of £12.7m, impairment charges of £25.0m and acquisition of businesses of £0.1m less additions of £1.1m and exchange movements of £26.5m. The impairment charges relate to Mandals (£4.1m) and ECS Conveyor Services (Americas) (£20.9m). Further details can be found in note 4. 12. Post-retirement benefits The Group operates a number of defined benefit post-retirement schemes for qualifying employees in operations around the world. The assets of the schemes are held in separate trustee administered funds. The cost of the schemes is assessed in accordance with the advice of independent qualified actuaries using the projected unit credit method. The principal schemes are the Fenner Pension Scheme, based in the UK, and the Fenner Dunlop BV Scheme, based in the Netherlands. The Fenner Pension Scheme was closed to new entrants in 1997. The most recent triennial actuarial valuation for the Fenner Pension Scheme was on 31 March 2014. The most recent annual actuarial valuation for the Fenner Dunlop BV Scheme was on 30 June 2016. These valuations were updated to 31 August 2016 by independent qualified actuaries. The principal financial assumptions used for the schemes in the UK and the Netherlands are as follows:
31 August 2016 31 August 2015
UK Netherlands UK Netherlands
Discount rate 2.0% 1.2% 3.7% 2.3%Inflation rate - RPI 2.8% n/a 3.0% n/aInflation rate - CPI 2.1% 2.0% 2.3% 2.0%Rate of increase in salaries 3.8% 2.5% 4.0% 2.0%Rate of increase in benefits in payment subject to Limited Price Indexation increases: - capped at 5.0% (based on RPI) 2.7% n/a 2.9% n/a- capped at 2.5% (based on RPI) 1.9% n/a 2.0% n/a- capped at 3.0% (based on CPI) 1.8% n/a 1.9% n/a
26
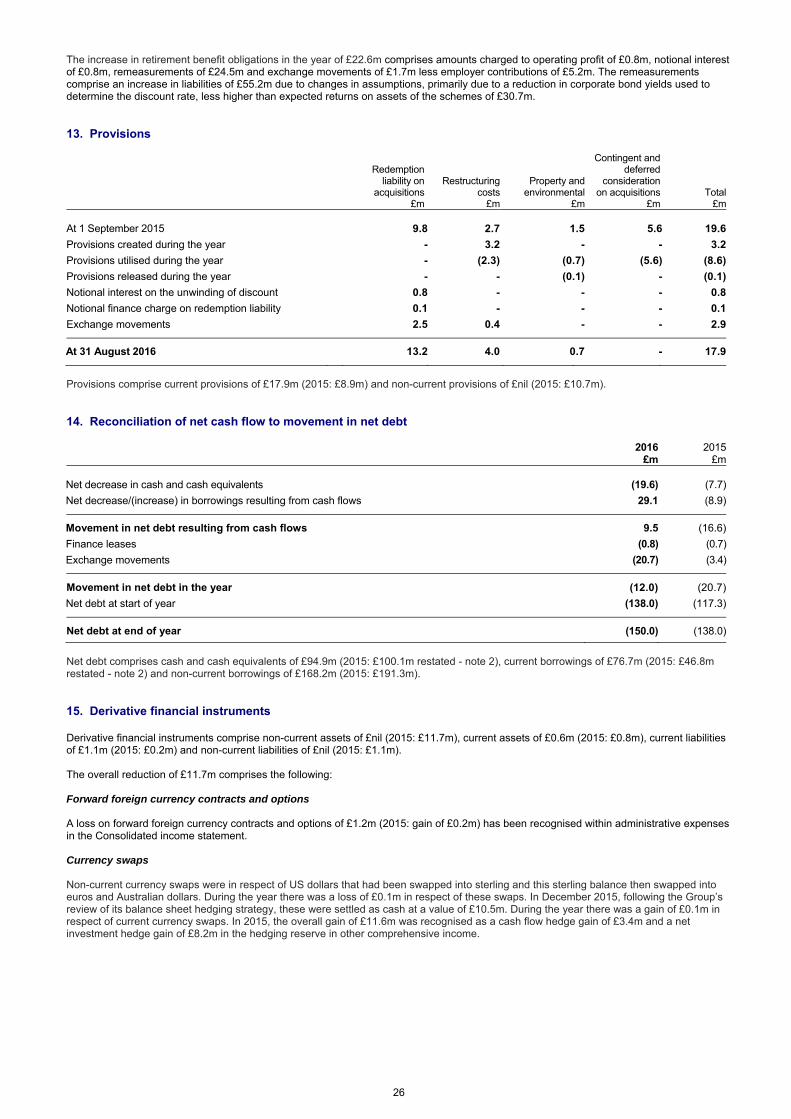
The increase in retirement benefit obligations in the year of £22.6m comprises amounts charged to operating profit of £0.8m, notional interest of £0.8m, remeasurements of £24.5m and exchange movements of £1.7m less employer contributions of £5.2m. The remeasurements comprise an increase in liabilities of £55.2m due to changes in assumptions, primarily due to a reduction in corporate bond yields used to determine the discount rate, less higher than expected returns on assets of the schemes of £30.7m. 13. Provisions
Redemption liability on
acquisitions£m
Restructuring costs
£m
Property and environmental
£m
Contingent and deferred
consideration on acquisitions
£mTotal
£m
At 1 September 2015 9.8 2.7 1.5 5.6 19.6
Provisions created during the year - 3.2 - - 3.2
Provisions utilised during the year - (2.3) (0.7) (5.6) (8.6)
Provisions released during the year - - (0.1) - (0.1)
Notional interest on the unwinding of discount 0.8 - - - 0.8
Notional finance charge on redemption liability 0.1 - - - 0.1
Exchange movements 2.5 0.4 - - 2.9
At 31 August 2016 13.2 4.0 0.7 - 17.9
Provisions comprise current provisions of £17.9m (2015: £8.9m) and non-current provisions of £nil (2015: £10.7m). 14. Reconciliation of net cash flow to movement in net debt
2016
£m2015
£m
Net decrease in cash and cash equivalents (19.6) (7.7)
Net decrease/(increase) in borrowings resulting from cash flows 29.1 (8.9)
Movement in net debt resulting from cash flows 9.5 (16.6)
Finance leases (0.8) (0.7)
Exchange movements (20.7) (3.4)
Movement in net debt in the year (12.0) (20.7)
Net debt at start of year (138.0) (117.3)
Net debt at end of year (150.0) (138.0)
Net debt comprises cash and cash equivalents of £94.9m (2015: £100.1m restated - note 2), current borrowings of £76.7m (2015: £46.8m restated - note 2) and non-current borrowings of £168.2m (2015: £191.3m). 15. Derivative financial instruments Derivative financial instruments comprise non-current assets of £nil (2015: £11.7m), current assets of £0.6m (2015: £0.8m), current liabilities of £1.1m (2015: £0.2m) and non-current liabilities of £nil (2015: £1.1m). The overall reduction of £11.7m comprises the following: Forward foreign currency contracts and options A loss on forward foreign currency contracts and options of £1.2m (2015: gain of £0.2m) has been recognised within administrative expenses in the Consolidated income statement. Currency swaps Non-current currency swaps were in respect of US dollars that had been swapped into sterling and this sterling balance then swapped into euros and Australian dollars. During the year there was a loss of £0.1m in respect of these swaps. In December 2015, following the Group’s review of its balance sheet hedging strategy, these were settled as cash at a value of £10.5m. During the year there was a gain of £0.1m in respect of current currency swaps. In 2015, the overall gain of £11.6m was recognised as a cash flow hedge gain of £3.4m and a net investment hedge gain of £8.2m in the hedging reserve in other comprehensive income.

27
16. Hedging Group financial instruments denominated principally in euros, Australian dollars and US dollars are designated as hedges of the net investment in overseas subsidiaries. The overall loss on translation to sterling at the year end of £30.8m (2015: gain of £9.0m) is recognised in the hedging reserve in other comprehensive income. This comprises a gain of £nil (2015: £8.2m) in respect of derivative financial instruments (note 15) and a loss of £30.8m (2015: gain of £0.8m) in respect of borrowings. There was no cash flow hedge gain or loss during the year. In 2015, the cash flow hedge gain of £3.4m, recognised in the hedging reserve in other comprehensive income, was in respect of derivative financial instruments (note 15). No ineffectiveness in respect of cash flow hedges or net investment hedges has been recognised in the Consolidated income statement. 17. Contingent liabilities In the normal course of business the Group has given guarantees and counter indemnities in respect of commercial transactions. The Group is involved as defendant in a small number of potential and actual litigation cases in connection with its business. The directors believe that the likelihood of a material liability arising from these cases is remote. 18. Related party transactions Other than the remuneration of the Group’s executive and non-executive directors and members of the Executive Committee, there were no related party transactions during the year to disclose.
19. Acquisitions As permitted by IFRS 3 (Revised) ‘Business Combinations’, provisional estimates of the fair values of assets and liabilities acquired can be amended for a period of up to 12 months following acquisition if subsequent information becomes available which changes the estimates of fair values at the date of acquisition. In respect of the acquisition of Charter Medical, Limited on 30 January 2015, the estimated fair value of trade and other payables reduced by £0.3m and the fair value of inventories reduced by £0.2m, resulting in a decrease in goodwill on acquisition of £0.1m. Payments amounting to £5.6m were made in the year in respect of deferred consideration on acquisitions made in previous years. 20. Post-balance sheet events Disposal of Xeridiem Medical Devices On 1 September 2016, the Group disposed of Xeridiem Medical Devices, Inc, a manufacturer of minimally invasive catheter and other single-use medical devices, located in Arizona, USA. Cash proceeds, net of expenses, were £6.4m, subject to working capital adjustments. The results of Xeridiem Medical Devices have not been disclosed as a discontinued operation since it did not represent a separate major line of business or geographical area of operations, did not form part of a single coordinated plan to dispose of such operations and was not acquired exclusively with a view to resale. The following assets and liabilities of Xeridiem Medical Devices are classified as held for sale in the Consolidated balance sheet.
2016
£m2015
£m
Assets held for sale
Property, plant and equipment 0.2 -
Inventories 0.8 -
Trade and other receivables 1.2 -
2.2 -
Liabilities held for sale
Trade and other payables 1.0 -
Acquisition of non-controlling interests On 1 November 2016, the Group acquired the remaining non-controlling interests in Belle Banne Conveyor Services Pty Limited and Leading Edge Conveyor Services Pty Limited, both based in Australia, following the sellers' exercising of their put options granted in November 2010, the date the Group acquired its controlling interest. The consideration has not yet been finalised. The estimated present value of this obligation is provided in the redemption liability on acquisitions at the balance sheet date. 21. Principal risks Fenner’s operations around the world are exposed to a number of risks which could, either on their own, or in combination with others, have an adverse effect on the Group’s results, strategy, business performance and reputation which, in turn, could impact upon shareholder returns. The principal risks are detailed in the Strategic Report in Fenner’s Annual Report. Additional risks and uncertainties not presently known to Fenner, or that Fenner currently consider immaterial, may also have an adverse effect on its business.