female genital mutilation & asylum in the european union - refworld
TRANSCRIPT

FEMALE GENITAL MUTILATION & ASYLUM IN THE EUROPEAN UNIONA Statistical Overview
© U
NH
CR
/ J
. Oat
way
/ 2
009

AcknowledgementsThe UNHCR Bureau for Europe wishes to acknowledge the contribution of three interns with UNHCR in 2012 to the preparation of this statistical overview. Marie Schirrmeister made the idea of this statistical study possible by assembling the first set of data, which Sheun Olaoshebikan then further developed. Special thanks go to Hannah West for the preparation of the final tables and graphs and the initial analysis of the data presented in this publication.
Copyright © 2013 United Nations High Commissioner for RefugeesCover Photo Credits: © UNHCR / J. Oatway / 2009Layout and design: BakOS DESIGN
February 2013
This document is for general distribution. All rights reserved. Reproductions and translations are authorized, except for commercial purposes, but acknowledgement is required.

3TOO MUCH PAIN - Female Genital Mutilation & Asylum in the European Union A Statistical Overview
Introduction
Female genital mutilation (FGM) includes procedures that intentionally alter or cause injury to the female genital organs for non-medical reasons. This harmful traditional practice is most common in the western, eastern, and north-eastern regions of Africa; in some countries in Asia and the Middle East; and among migrant and refugee communities from these areas in Europe, Australia, New Zealand, Canada and the United States of America. FGM is recognized internationally as a violation of the human rights of girls and women. The practice also violates a person’s rights to health, security and physical integrity; the right to be free from torture and cruel, inhuman or degrading treatment; and the right to life when the procedure results in death. The practice of FGM is also considered as a criminal act in all EU Member States.
This statistical overview has been prepared on the occasion of the European Institute for Gender Equality (EIGE) study on FGM in the European Union and Croatia. Little is known about FGM in the European Union in general, and this statement holds true about FGM and asylum more specifically. In light of the recognized need for country- and community-tailored responses, this study provides some of the statistical evidence needed to advance the discussion on the necessary policies and tools to address the specific vulnerabilities of female asylum-seekers with FGM in the asylum system on the one hand, and of refugee girls and women living with FGM and integrating in EU Member States on the other hand. In addition, in the absence of statistical data on asylum claims relating to this harmful traditional practice, this document also provides estimates that draw attention to the specific needs for international protection girls (and their parents) as well as women may raise in relation to FGM.
UNHCR hopes this study will further encourage EU Member States to gather more systematic qualitative and quantitative data on this little-researched aspect of the asylum system, with the support of Eurostat, in order to provide timely, complete and sex-disaggregated statistical data.
It is also hoped that the study will encourage EU Member States and the European Asylum Support Office (EASO) to develop training material in the European Asylum Curriculum (EAC) and enhance the gender-sensitive nature of Country of Origin Information (COI) to strengthen the capacity of the asylum authorities to adjudicate claims relating to FGM. This study also aims to encourage the European Commission in considering the need for interpretative guidelines on FGM and asylum that would support Member States to further harmonize national practices in line with the spirit of the Common European Asylum System (CEAS). At the level of the national asylum authorities, the hope is for this report to help raise the awareness of individual staff members regarding FGM and its relevance to their responsibilities, be it as health practitioners, interviewers, decision-makers, policy-makers or managers.
Last but not least, UNHCR also hopes that this study will encourage policy-makers at EU, state and regional levels and service providers to fully include asylum-seeking as well as refugee girls and women in their comprehensive and multi-disciplinary action plans for the abandonment of FGM in the European Union in line with the recent UN General Assembly Resolution.1
1 UNGeneralAssembly,Resolution“Intensifyingglobaleffortsfortheeliminationoffemalegenitalmutilations”,sixty-seventhsession,16November2012,A/C.3/67/L.21/Rev.1.
Female genital mutilations must be seen as child abuse and mistreatment.
ChristineFlamand,Belgianlawyer,Intact(NGO).
It is a matter of principle that women are free and equal.
AyaanHirsiAli,SomalirefugeeintheNetherlands.

4TOO MUCH PAIN - Female Genital Mutilation & Asylum in the European Union A Statistical Overview
Methodology
For the purpose of this study, FGM-practising countries of origin2 include Benin, Burkina Faso, Cameroon, Central African Republic, Chad, Congo,3 Cote d’Ivoire, Djibouti, Egypt, Eritrea, Ethiopia, Gambia, Ghana, Guinea, Guinea-Bissau, Kenya, Liberia, Mali, Mauritania, Niger, Nigeria, Senegal, Sierra Leone, Somalia, Sudan, Tanzania, Togo, Uganda, and Yemen. Given the recent arrival of these female asylum-seekers in the EU, it was deemed methodologically appropriate to use the FGM prevalence rates from the national survey data on FGM prevalence in the countries of origin for this study.4 Given the lack of comparable data on FGM practices in Iraq, a key country of origin in the asylum systems of the EU, Iraq has not been included in this study.5
The statistics in this document were compiled between October and December 2012 using the data available in Eurostat for the four year period 2008 to 2011. Data on asylum applications for 2012 were unfortunately too incomplete to allow the inclusion of a fifth year in this study.
Methodological decisions also had to be made to address some of the constraints linked to the nature of Eurostat data. The category “New Asylum Applicant”, i.e. excluding repeat applications and double-counting of individuals, has been used as much as possible in the preparation of the data set out in this study. However the category “Asylum Applicant” also had to be resorted to where the lack of disaggregated data between new and repeat applications made it impossible to have a full and comprehensive view of the phenomenon.
Likewise, Eurostat does not record whether the women and girls under statistical study are principal or secondary applicants making it more difficult to analyze the issues at hand.
Of note too, data in Eurostat is not consistently available for the appeal stage; as such this study only looks at first instance applications and decisions.
The estimates in the last section of this study on the number of applications raising FGM issues are calculated on the basis of the data recorded by the Belgian asylum authority and Eurostat statistics.
Content
Focusing on girls and women from FGM-practising countries of origin who seek asylum in the EU, this statistical study seeks to provide answers to the six following questions:
� Where do they seek asylum in the EU? – This first set of data provides an overview of the destination countries for the approximately 20,000 women and girls who seek asylum from practising countries of origin in the EU every year.
� Where do they come from? – This set of data in turn focuses on the countries of origin of these 20,000 girls and women, and looks at the different patterns of applications in the main asylum countries.
� Where do they settle in the EU? – This set examines where girls and women from FGM-practising countries of origin granted international protection settle and integrate in the EU.
� What is the FGM prevalence rate? – This set identifies the estimated FGM prevalence rate among female asylum-seekers in the EU, and constitutes a direct contribution to the EIGE study on FGM in the EU and Croatia.
� Where do these girls settle in the EU? – The following set seeks to estimate the number of refugee girls from practising countries of origin who settle every year in EU Member States following the grant of international protection or other form of national status, and who should be fully incorporated into prevention, prosecution and protection responses to end FGM in the Diasporas of the EU.
� How many asylum claims relate to FGM? – In the absence of disaggregated data collected by the EU asylum authorities on the grounds for international protection in general, and FGM in particular, the last set of data seeks to provide estimates of the number of asylum claims on FGM grounds the top destination asylum countries may handle every year.
2 Thisstudyusestheconceptsof(FGM-)practisingandFGM-risk(inthetables)countriesinterchangeably.3 TheWorldHealthOrganisation(WHO)notesthatthereareonlyanecdotalreportsonFGMintheDemocratic
RepublicofCongo,andthatthefigureof5%mentionedinaWHOpublicationin1997wasaquestionableestimate(availableat:http://goo.gl/uSln2).
4 ThisnationalsurveydataispartoftheDemographicandHealthSurveys(DHS)publishedbyMacro,ortheMultipleClusterIndicatorSurveys(MICS),publishedbyUNICEF;availableat:http://goo.gl/AP93d
5 FGMprevalencedataforIraqbecameavailablein2013,toolatetobetakenintoaccountinthispublication.BasedonMultipleClusterIndicatorSurveys(MICS)in2011,theFGMprevalencerateforIraqisestimatedat8.1%butrisesto42.8%intheKurdistanRegion(Suleimaniya:54.3%;Erbil:57.5%;Kirkuk:19.9%).Source:Iraq-MultipleIndicatorClusterSurvey,2011,FinalReport,CentralStatisticsOrganization,KurdistanRegionalStatisticsOffice,MinistryofHealth,UNICEF,September2012,availableat:http://goo.gl/qKyUJ
5TOO MUCH PAIN - Female Genital Mutilation & Asylum in the European Union A Statistical Overview
2008
2009
2010
2011
1.WheredotheyseekasylumintheEU?
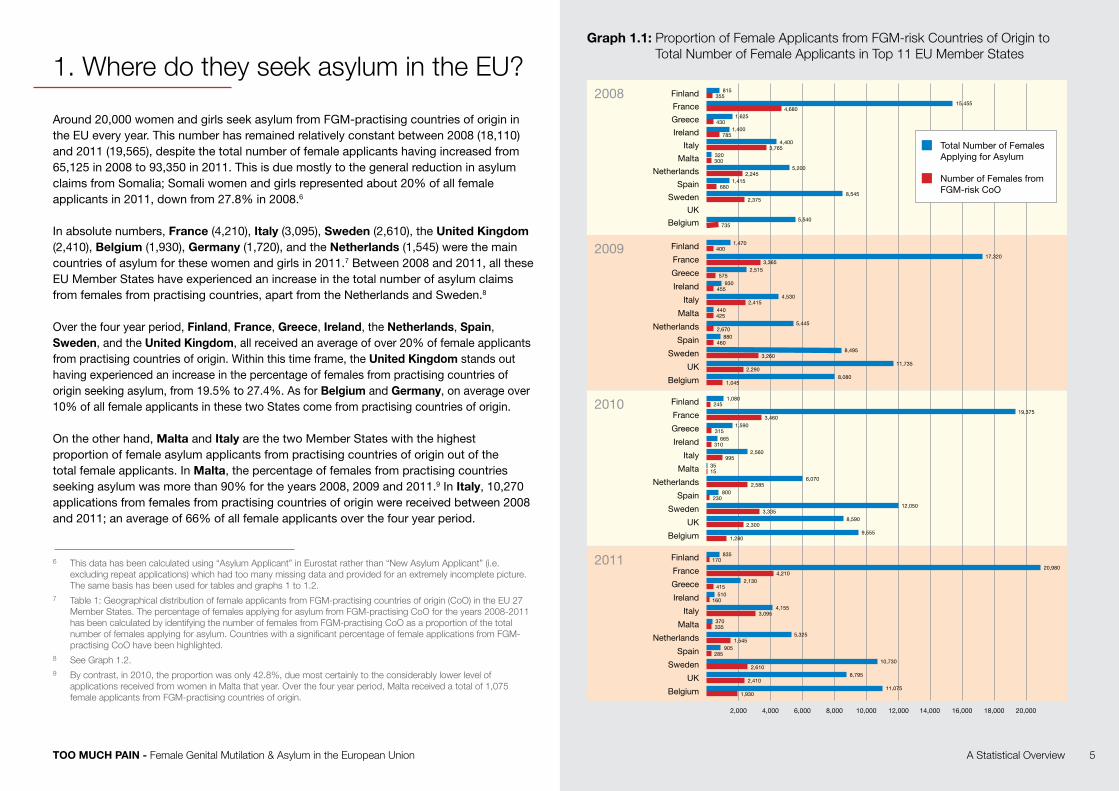
Around 20,000 women and girls seek asylum from FGM-practising countries of origin in the EU every year. This number has remained relatively constant between 2008 (18,110) and 2011 (19,565), despite the total number of female applicants having increased from 65,125 in 2008 to 93,350 in 2011. This is due mostly to the general reduction in asylum claims from Somalia; Somali women and girls represented about 20% of all female applicants in 2011, down from 27.8% in 2008.6
In absolute numbers, France (4,210), Italy (3,095), Sweden (2,610), the United Kingdom (2,410), Belgium (1,930), Germany (1,720), and the Netherlands (1,545) were the main countries of asylum for these women and girls in 2011.7 Between 2008 and 2011, all these EU Member States have experienced an increase in the total number of asylum claims from females from practising countries, apart from the Netherlands and Sweden.8
Over the four year period, Finland, France, Greece, Ireland, the Netherlands, Spain, Sweden, and the United Kingdom, all received an average of over 20% of female applicants from practising countries of origin. Within this time frame, the United Kingdom stands out having experienced an increase in the percentage of females from practising countries of origin seeking asylum, from 19.5% to 27.4%. As for Belgium and Germany, on average over 10% of all female applicants in these two States come from practising countries of origin.
On the other hand, Malta and Italy are the two Member States with the highest proportion of female asylum applicants from practising countries of origin out of the total female applicants. In Malta, the percentage of females from practising countries seeking asylum was more than 90% for the years 2008, 2009 and 2011.9 In Italy, 10,270 applications from females from practising countries of origin were received between 2008 and 2011; an average of 66% of all female applicants over the four year period.
6 Thisdatahasbeencalculatedusing“AsylumApplicant”inEurostatratherthan“NewAsylumApplicant”(i.e.excludingrepeatapplications)whichhadtoomanymissingdataandprovidedforanextremelyincompletepicture.Thesamebasishasbeenusedfortablesandgraphs1to1.2.
7 Table1:GeographicaldistributionoffemaleapplicantsfromFGM-practisingcountriesoforigin(CoO)intheEU27MemberStates.ThepercentageoffemalesapplyingforasylumfromFGM-practisingCoOfortheyears2008-2011hasbeencalculatedbyidentifyingthenumberoffemalesfromFGM-practisingCoOasaproportionofthetotalnumberoffemalesapplyingforasylum.CountrieswithasignificantpercentageoffemaleapplicationsfromFGM-practisingCoOhavebeenhighlighted.
8 SeeGraph1.2.9 Bycontrast,in2010,theproportionwasonly42.8%,duemostcertainlytotheconsiderablylowerlevelof
applicationsreceivedfromwomeninMaltathatyear.Overthefouryearperiod,Maltareceivedatotalof1,075femaleapplicantsfromFGM-practisingcountriesoforigin.
Graph 1.1:ProportionofFemaleApplicantsfromFGM-riskCountriesofOrigintoTotalNumberofFemaleApplicantsinTop11EUMemberStates
2,000 4,000 6,000 8,000 10,000 12,000 14,000 16,000 18,000 20,000
UK
Finland 815355
Greece 1,625430
Malta 320300
Netherlands 5,2002,245
Spain 1,415680
Sweden 8,5452,375
Belgium 5,540735
Italy 4,4003,765
Ireland 1,400785
France 15,4554,680
Finland 1,470400
Greece 2,515575
Malta 440425
Netherlands 5,4452,670
Spain 880460
Sweden 8,4953,260
UK 11,7352,290
Belgium 8,0801,045
Italy 4,5302,415
Ireland 930455
France 17,3203,365
Finland 1,080245
Greece 1,590315
Ireland 665310
France 19,3753,460
Malta 3515
Netherlands 6,0702,585
Spain 800230
Sweden 12,0503,335
UK 8,5902,300
Belgium 9,5551,280
Italy 2,560995
Malta 370335
Netherlands 5,3251,545
Spain 905285
Sweden 10,7302,610
UK 8,7952,410
Belgium 11,0751,930
Italy 4,1553,095
Finland 835170
Greece 2,130415
Ireland 510160
France 20,9804,210
Total Number of Females Applying for Asylum
Number of Females from FGM-risk CoO

Table 1: GeographicalDistributionofFemaleApplicantsfromFGM-riskCountriesofOrigininEU27(2008-2011)
6TOO MUCH PAIN - Female Genital Mutilation & Asylum in the European Union A Statistical Overview
EU Member State Total Number of Females Applying for Asylum Females from FGM-risk Countries of Origin Percentage of Females from FGM-risk Countries of Origin
Year Year Year
2008 2009 2010 2011 2008 2009 2010 2011 2008 2009 2010 2011
Austria 4,255 4,855 3,260 3,765 365 355 215 385 8.58% 7.31% 6.60% 10.23%
Belgium 5,540 8,080 9,555 11,075 735 1,045 1,280 1,930 13.27% 12.93% 13.40% 17.43%
Bulgaria 175 160 165 155 5 5 5 5 2.86% 3.13% 3.03% 3.23%
Cyprus 1,075 1,085 1,045 640 50 40 80 55 4.65% 3.69% 7.66% 8.59%
Czech Republic 485 410 245 200 10 15 20 10 2.06% 3.66% 8.16% 5.00%
Denmark 550 885 1,215 1,120 60 95 85 75 10.91% 10.73% 7.00% 6.70%
Estonia 5 10 5 10 5 50.00%
Finland 815 1,470 1,080 835 355 400 245 170 43.56% 27.21% 22.69% 20.36%
France 15,455 17,320 19,375 20,980 4,680 3,365 3,460 4,210 30.28% 19.43% 17.86% 20.07%
Germany 8,500 10,995 17,770 19,630 1,185 1,345 1,885 1,720 13.94% 12.23% 10.61% 8.76%
Greece 1,625 2,515 1,590 2,130 430 575 315 415 26.46% 22.86% 19.81% 19.48%
Hungary 670 1,110 315 390 40 15 10 15 5.97% 1.35% 3.17%
Ireland 1,400 930 665 510 785 455 310 160 56.07% 48.92% 46.62% 31.37%
Italy 4,400 4,530 2,560 4,155 3,765 2,415 995 3,095 85.57% 53.31% 38.87% 74.49%
Latvia 15 15 10 90 10 11.11%
Lithuania 180 130 140 95 5 5 2.78% 3.85%
Luxembourg 160 140 245 905 10 20 15 6.25% 8.16% 1.66%
Malta 320 440 35 370 300 425 15 335 93.75% 96.59% 42.86% 90.54%
Netherlands 5,200 5,445 6,070 5,325 2,245 2,670 2,585 1,545 43.17% 49.04% 42.59% 29.01%
Poland 4,065 4,675 3,025 3,240 10 10 25 0.25% 0.21% 0.77%
Portugal 50 35 40 95 5 15 10 55 10.00% 42.86% 25.00% 57.89%
Romania 105 105 120 95 15 10 10 5 14.29% 9.52% 8.33% 5.26%
Slovakia 85 95 65 60 5 10 7.69% 16.67%
Slovenia 35 40 50 45 5 10 10.00% 22.22%
Spain 1,415 880 800 905 680 460 230 285 48.06% 52.27% 28.75% 31.49%
Sweden 8,545 8,495 12,050 10,730 2,375 3,260 3,335 2,610 27.79% 38.38% 27.68% 24.32%
United Kingdom : 11,735 8,590 8,795 : 2,290 2,300 2,410 : 19.51% 26.78% 27.40%
EU (total) 65,125(1) 86,585(2) 90,095(2) 96,350(2) 18,110(1) 19,270 17,420 19,565 27.81%(1) 22.60% 19.34% 20.31%
Notes:
FGM-risk countries of origin: Benin, Burkina Faso, Cameroon, Central African Republic, Chad, Congo, Cote d’Ivoire, Djibouti, Egypt, Eritrea, Ethiopia, Gambia, Ghana, Guinea, Guinea-Bissau, Kenya, Liberia, Mali, Mauritania, Niger, Nigeria, Senegal, Sierra Leone, Somalia, Sudan, Tanzania, Togo, Uganda, Yemen
* Only EU MS with significant number of female asylum applicants from FGM-risk CoO are highlighted. Colours represent the percentage of female applicants out of total female applicants from FGM-risk CoO: Red for 50% or more; Orange for 20% or more; and Yellow for 10% or more
(1) These EU totals exclude the UK whose numbers were unavailable in Eurostat. (2) All numbers are rounded by Eurostat. EU totals do not match the sum of individual EU-27 states. (:) represents no data available

Map: FemaleapplicantsfromFGM-practisingcountriesoforigininEU27
7TOO MUCH PAIN - Female Genital Mutilation & Asylum in the European Union A Statistical Overview
10% or more
FISE
DE
GB
IE
FR
BE
NL
ES
IT
GR
MT
20% or more
50% or more

8TOO MUCH PAIN - Female Genital Mutilation & Asylum in the European Union A Statistical Overview
Some preliminary comments
The sheer number of women and girls from FGM-practising countries in the asylum reception systems of the top destination countries in the EU is likely to lead to FGM-specific issues being raised in that context, be it in relation to primary health, reproductive health or psychological problems during the asylum procedure or later when settling and integrating in EU Member States. The section on FGM prevalence among female asylum-seekers in the EU Member States addresses FGM in the context of the asylum reception conditions more in depth, while two other sections focus more specifically on the integration of refugee girls and women and the prevention efforts necessary to ensure that these girls live free of FGM.
Notwithstanding the constraints posed by the lack of disaggregated data in Eurostat between principal and secondary applicants, and based on the sheer number of female applicants from FGM-practising countries of origin in the top countries of asylum, it is reasonable to assume that some of these women and girls may raise gender-specific issues in their applications and statements to the asylum authorities, including FGM-related issues.
The different individual backgrounds and past experiences of women and girls from FGM-practising countries of origin will require specific gender, age and social awareness by staff and consequently tailored training to carry out the credibility assessment and the examination of the substantive issues arising in these applications. These in turn will require adjusted Country of Origin Information (COI) to document the situation in the different countries of origin these women and girls come from, as opposed to the countries of origin of applicants in general. For instance, while the total number of asylum claims from Nigeria is negligible, when considered through the “FGM lens”,
Nigeria becomes the top country of origin for these women and girls. Likewise, asylum adjudicators are also likely to need tailored COI to address the specific facts and country conditions these women and girls may refer to in their claims. To continue with the example of Nigeria, while male applicants tend to raise ethnic and religion-related issues, Nigerian women and girls may raise in addition gender-specific, including FGM-related, issues. Likewise, the issue of ‘safe countries of origin’ also takes a new dimension when considered through the “FGM lens”.
The next section provides disaggregated data on the countries of origin of these women and girls for the top asylum countries in the EU and, as such, provides a tool to further refine this analysis at the level of individual Member States. The study is also a useful evidence basis for the further development of the European Asylum Curriculum, which needs to reflect the specific issues raised by FGM as part of general efforts to enhance training material on gender-related claims. It is also hoped that the statistical data in this report will also encourage EASO to further support Member States through the provision of gender-specific COI, including on FGM.
0
500
1,000
1,500
2,000
2,500
3,000
3,500
4,000
4,500
5,000
2008
Belgium Germany Netherlands United Kingdom
France Italy Sweden
2009 2010 2011
Professionals working with asylum-seekers and refugees face multiple challenges, including: linguistic differences; pressures of finite time; inadequate cultural awareness; and deficient expertise. Co-ordinated inter-agency training is key for all professionals working with affected communities, enabling them to provide effective and culturally sensitive support to those affected and to protect children by being sensitised to warning signs.
Female genital mutilation, asylum seekers and refugees: the need for an integrated European Union agenda,RichardA.Powell,ElsLeye,AmandaJayakody,FaithN.Mwangi-Powell,LindaMorison.
Graph 1.2:NumberofFemaleApplicantsfromFGM-riskCountriesofOrigin(2008-2011)

Table 2a:Top18FGM-RiskCountriesofOriginforFemaleApplicantsin2011
9TOO MUCH PAIN - Female Genital Mutilation & Asylum in the European Union A Statistical Overview
2.Wheredotheycomefrom?
In 2011, woman and girl asylum-seekers from FGM-practising countries of origin came mainly from Nigeria (3,835), Somalia (3,340), Eritrea (2,215), Guinea (1,965), and Cote d’Ivoire (955).10 Nigerian and Somali female applicants represent 21% and 18% of all female applicants respectively.
Tables 2a, Graph 2b and Tables 2.1 to 2.7 show the geographical distribution of female applicants from the top 18 FGM-practising countries in the EU 27 Member States between 2008 and 2011.11 Just under half of all the female claimants from Nigeria applied for asylum in Italy, followed by the United Kingdom and France (Table 2.1). Sweden was the primary destination of asylum for Somali female applicants, followed by the Netherlands (Table 2.2). Sweden was also the asylum country for the majority of female applicants from Eritrea, while Belgium and France recorded the majority of Guinean and Ivorian female claimants.
The number of female applicants from Somalia has dramatically decreased from 5,190 in 2008 to 3,340 in 2011, while the number of Guinean female applicants has increased fivefold from 380 to 1,965, and the number of Ivorian women has almost tripled from 350 to 955.
10 Table2ashowsthetop16FGM-practisingCoOforfemaleapplicantsintheEU27MemberStatesin2011.ForeachFGM-practisingCoOthenumberoffemaleapplicantshasbeencalculatedasapercentageofthetotalnumberoffemaleapplicantstotheEU27MemberStates.
11 ThecountriesreceivingasignificantnumberofapplicationsfromFGM-practisingCoOaremarkedinred,orangeoryellow,basedontheaverageoverthefouryearperiod.
[My Grandma] caught hold of me and gripped my upper body. Two other women held my legs apart. The man, who was probably an itinerant
traditional circumciser from the blacksmith clan, picked up a pair of scissors. […] Then the scissors went down between my legs and the man cut off my inner labia and clitoris. A piercing pain shot up between my legs, indescribable, and I howled. Then came the sewing: the long, blunt needle clumsily pushed into my bleeding outer labia, my loud and anguished protests. [… My sister] Haweya was never the same afterwards. She had nightmares, and during the day began stomping off to be alone. My once cheerful, playful little sister changed. Sometimes she just stared vacantly at nothing for hour.
AyaanHirsiAli,Infidel – My Life,SomalirefugeeinTheNetherlands.
FGM-practising Country of Origin
Total Nbr of Female Applicants from Practising Country
% out of Total Female Applicants from All
FGM-Practising Countries
1 Nigeria 3,835 21.19%
2 Somalia 3,340 18.45%
3 Eritrea 2,215 12.24%
4 Guinea 1,965 10.86%
5 Cote d'Ivoire 955 5.28%
6 Ethiopia 685 3.78%
7 Congo 520 2.87%
8 Mali 515 2.85%
9 Cameroon 495 2.73%
10 Ghana 435 2.40%
11 Sudan 375 2.07%
12 Egypt 350 1.93%
13 Uganda 330 1.82%
14 Gambia 305 1.69%
15 Kenya 300 1.66%
16 Senegal 265 1.46%
17 Sierra Leone 250 1.38%
18 Mauritania 240 1.33%

0
4,000
2,000
1,000
500
1,500
2,500
3,500
3,000
Graph 2b:GeographicalDistributionofFemaleApplicantsfromTop10FGM-riskCountries(2011)
10TOO MUCH PAIN - Female Genital Mutilation & Asylum in the European Union A Statistical Overview
Nigeria Somalia Eritrea Guinea Cote d’Ivoire Ethiopia Congo Mali Cameroon Ghana
United Kingdom
France
Poland
Estonia
Slovenia
Greece
Malta
Denmark
Cyprus
Belgium
Sweden
Spain
Netherlands
Germany
Latvia
Bulgaria
Romania
Ireland
Luxembourg
Czech Republic
Italy

11TOO MUCH PAIN - Female Genital Mutilation & Asylum in the European Union A Statistical Overview
Table 2.2: Top2:FemaleApplicantsfromSomaliainEU27
EU Member State
Year
2008 2009 2010 2011
Belgium 40 45 80 175
Bulgaria : : : 5
Czech Republic 0 0 5 0
Denmark : : 30 30
Germany 65 130 515 335
Estonia 0 0 0 5
Ireland 55 30 15 10
Greece : : : 25
Spain : : 15 20
France : 85 115 170
Italy 790 355 15 215
Cyprus 5 0 0 0
Latvia 0 0 : 0
Lithuania : 0 : 0
Luxembourg : : : 0
Hungary : : : :
Malta 205 295 10 100
Netherlands 1,640 2,020 1,755 625
Austria : : : :
Poland 0 0 0 0
Portugal 0 0 0 :
Romania : : : 0
Slovenia 0 0 5 5
Slovakia : : 5 :
Finland : : : :
Sweden 1,580 2,380 2,190 1,295
United Kingdom 810 575 330 325
EU (total) 5,190 5,915 5,085 3,340
Table 2.3: Top3:FemaleApplicantsfromEritreainEU27
EU Member State
Year
2008 2009 2010 2011
Belgium 5 15 25 30
Bulgaria : : : 0
Czech Republic 0 0 0 5
Denmark : : 10 5
Germany 135 190 250 255
Estonia 0 0 0 0
Ireland 25 25 5 5
Greece : : : 15
Spain : : 0 0
France : 125 185 190
Italy 500 280 45 200
Cyprus 0 0 0 0
Latvia 0 0 : 0
Lithuania : 0 : 0
Luxembourg : : : 5
Hungary : : : :
Malta 20 45 0 85
Netherlands 110 130 175 220
Austria : : : :
Poland 0 0 0 5
Portugal : 10 0 :
Romania : : : 0
Slovenia 0 0 0 0
Slovakia : : 0 :
Finland : : : :
Sweden 455 530 725 825
United Kingdom 695 380 305 370
EU (total) 1,945 1,730 1,725 2,215
Table 2.1: Top1:FemaleApplicantsfromNigeriainEU27
EU Member State
Year
2008 2009 2010 2011
Belgium 20 40 35 60
Bulgaria : : : 0
Czech Republic 10 15 5 5
Denmark : : 10 15
Germany 200 305 260 295
Estonia 0 0 0 0
Ireland 485 245 175 90
Greece : : : 150
Spain : : 125 140
France : 405 400 445
Italy 1,745 1,325 690 1,870
Cyprus 5 5 10 0
Latvia 0 0 : 0
Lithuania : 0 : 0
Luxembourg : : : 0
Hungary : : : :
Malta 50 70 0 75
Netherlands 35 55 45 45
Austria : : : :
Poland 5 5 0 5
Portugal 0 5 0 :
Romania : : : 0
Slovenia 0 0 0 0
Slovakia : : 0 :
Finland : : : :
Sweden 50 60 65 95
United Kingdom 485 385 555 545
EU (total) 3,090 2,920 2,375 3,835

12TOO MUCH PAIN - Female Genital Mutilation & Asylum in the European Union A Statistical Overview
Table 2.5: Top5:FemaleApplicantsfromCoted’IvoireinEU27
EU Member State
Year
2008 2009 2010 2011
Belgium 20 15 45 90
Bulgaria : : : 0
Czech Republic 0 0 0 0
Denmark : : 5 5
Germany 30 15 15 25
Estonia 0 0 0 0
Ireland 10 0 0 0
Greece : : : 10
Spain : : 15 35
France : 180 210 580
Italy 205 75 40 100
Cyprus 0 0 0 0
Latvia 0 0 : 5
Lithuania : 0 : 0
Luxembourg : : : 0
Hungary : : : :
Malta 0 0 0 5
Netherlands 35 25 35 25
Austria : : : :
Poland 0 0 0 0
Portugal 0 0 0 :
Romania : : : 0
Slovenia 0 0 0 0
Slovakia : : 0 :
Finland : : : :
Sweden 10 5 5 10
United Kingdom 40 20 25 65
EU (total) 350 335 395 955
Table 2.6: Top6:FemaleApplicantsfromEthiopiainEU27
EU Member State
Year
2008 2009 2010 2011
Belgium 20 20 15 20
Bulgaria : : : 0
Czech Republic 0 0 0 0
Denmark : : 5 0
Germany 105 125 165 200
Estonia 0 0 0 0
Ireland 5 5 5 0
Greece : : : 55
Spain : : 5 0
France : 50 45 40
Italy 120 20 10 115
Cyprus 10 5 10 5
Latvia 0 0 : 0
Lithuania : 0 : 0
Luxembourg : : : 5
Hungary : : : :
Malta 20 15 0 55
Netherlands 20 25 30 30
Austria : : : :
Poland 0 0 0 0
Portugal 0 0 0 :
Romania : : : 0
Slovenia 0 0 0 0
Slovakia : : 0 :
Finland : : : :
Sweden 60 90 85 95
United Kingdom 85 45 65 65
EU (total) 445 400 440 685
Table 2.4: Top4:FemaleApplicantsfromGuineainEU27
EU Member State
Year
2008 2009 2010 2011
Belgium 215 400 525 835
Bulgaria : : : 0
Czech Republic 0 0 0 0
Denmark : : 0 0
Germany 35 65 60 65
Estonia 0 0 0 0
Ireland 5 10 0 5
Greece : : : 10
Spain : : 10 5
France : 605 685 860
Italy 20 25 15 20
Cyprus 0 0 0 0
Latvia 0 0 : 0
Lithuania : 0 : 0
Luxembourg : : : 0
Hungary : : : :
Malta 0 0 0 0
Netherlands 65 95 110 120
Austria : : : :
Poland 0 0 0 0
Portugal 0 0 5 :
Romania : : : 0
Slovenia 0 0 0 0
Slovakia : : 0 :
Finland : : : :
Sweden 5 10 0 15
United Kingdom 35 50 35 30
EU (total) 380 1,260 1,445 1,965

13TOO MUCH PAIN - Female Genital Mutilation & Asylum in the European Union A Statistical Overview
Some preliminary comments
The above data further refine the preliminary comments in the previous section regarding the top asylum countries for all female applicants from FGM-practising countries by providing a breakdown of these countries of origin. The following data are therefore meant as a tool for Member States to further focus the capacity of their respective COI Units or COI Researchers on the relevant key FGM-practising countries of origin. The data could also be useful to EASO in its support role with regards COI, including when developing the Common COI Portal, organizing COI Workshops, and gathering COI on specific topics, to enhance their gender-sensitivity in general and incorporate FGM more specifically.
As is the case for all asylum claims, each top destination country receives applications from a different set of countries of origin allowing for further specialization of both the COI Units and the adjudicators in the respective asylum authorities. Harmful traditional practices, and FGM in particular, are not a uniform phenomenon across the various FGM-practising countries of origin; the contextual circumstances of each country of origin, including its laws and their application, the social mores and the changes in behaviour vary, notwithstanding the personal background of the applicant herself, including her age, gender, ethnic origin, social status and place of residence. As such the issues raised in their claims by these women and girl applicants are likely to be of a different nature and require the examination of specific issues depending on the conditions in the FGM-practising countries of origin.
EU Member State
FGM-risk Countries of Origin with Smaller Numbers of Applicants (2011)
Ben
in
Bur
kina
Fas
o
CA
R
Cha
d
Djib
outi
Gui
nea-
Bis
sau
Libe
ria
Nig
er
Tanz
ania
Togo
Yem
en
TOTA
L
Austria : : : : : : : : : : : :
Belgium 10 20 30 10 20 30 55 175
Bulgaria
Cyprus
Czech Republic
Denmark
Estonia
Finland : : : : : : : : : : : :
France 5 20 25 60 15 30 10 10 40 5 220
Germany 5 10 25 10 50
Greece 10 10 20
Hungary : : : : : : : : : : : :
Ireland
Italy 5 10 30 15 20 5 10 5 100
Latvia
Lithuania
Luxembourg
Malta
Netherlands 5 5 5 15
Poland 0
Portugal : : : : : : : : : : : :
Romania
Slovakia : : : : : : : : : : : :
Slovenia
Spain 5 5 10
Sweden 5 10 10 40 65
United Kingdom
10 25 5 30 70
EU (total) 25 65 25 90 50 30 60 60 80 145 95 725
Table 2.7:GeographicalDistributionofFemaleApplicantsfromFGM-riskCountriesofOrigininEU27(2011)

14TOO MUCH PAIN - Female Genital Mutilation & Asylum in the European Union A Statistical Overview
3.WheredotheysettleintheEU?
Over the four year period under study (2008-2011), the number of female asylum-seekers from FGM-practising countries of origin granted international protection in the EU 27 increased from 1,380 to 1,950. The majority of these women and girls came from Somalia (1,690), Eritrea (795), and Nigeria (595).12
Recognition rates seem to indicate that 14 EU Member States granted international protection to female refugees from FGM-practising countries during the same period: the United Kingdom, France, Sweden, Germany, the Netherlands, Austria, Belgium, Italy, and to a lesser degree Ireland, Romania, Greece, the Czech Republic, Finland and Cyprus.
The United Kingdom offered protection to the largest number of women and girls from FGM-practising countries of origin (2,525) i.e. to over 600 a year (from 685 in 2008 to 640 in 2011); these came mainly from Somalia, Eritrea and Nigeria.13
France in turn granted international protection to 1,775 women and girls, of whom the majority came from Guinea, Mali and Congo. The number of females receiving international protection in France increased from 345 to 485 between 2008 and 2011.14 Sweden then came third,15 followed by Germany16 and the Netherlands.17
From the top 7 EU Member States that received women and girls seeking asylum from FGM-practising countries of origin, Italy provided international protection to the smallest number of females (75 between 2008 and 2011),18 while Austria granted protection to 145 women and girls,19 more than Belgium20 and Italy. Graph 3 provides an overview of recognition rates for female asylum-seekers from FGM-practising countries of origin in the top seven EU destination countries between 2008 and 2011.
12 SeeTable3.1.13 SeeTable3.2.14 SeeTable3.3.
15 SeeTable3.4.16 SeeTable3.517 SeeTable3.6.
18 SeeTable3.8.19 SeeTable3.9.20 SeeTable3.7.
2008 2009 2010 2011 Total 2008-11
Nigeria 140 85 175 195 595
Somalia 300 415 410 565 1,690
Eritrea 245 220 165 165 795
Guinea 115 155 135 180 585
Cote d'Ivoire 65 45 25 45 180
Ethiopia 75 75 130 135 415
Cameroon 80 40 50 50 220
Congo 70 70 55 35 230
Mali 10 40 145 75 270
Ghana 5 15 10 20 50
Sudan 50 105 50 40 245
Egypt 0 15 25 30 70
Gambia 30 30 105 80 245
Senegal 5 10 30 35 80
Mauritania 25 55 25 50 155
Sierra Leone 30 15 45 45 135
Benin 0 0 0 0 0
Burkina Faso 0 0 5 5 10
Central African Republic 10 5 5 5 25
Chad 15 40 5 10 70
Djibouti 5 0 0 0 5
Guinea-Bissau 0 0 5 5 10
Kenya 25 20 45 50 140
Liberia 10 0 0 5 15
Niger 5 0 5 25 35
Tanzania 5 0 5 5 15
Togo 15 25 15 15 70
Uganda 30 20 55 70 175
Yemen 15 25 15 10 65
EU Total 1,380 1,525 1,740 1,950 6,595
Even if the law exists and that multiple actions to improve prevention [against FGM] are conducted, disarray amongst professionals confronted with this problem remains enormous.
FabienneRichard,midwife-referent,GAMSBelgium,andresearcherattheDepartmentofPublicHealth,InstituteofTropicalMedicineinAntwerp.
Table 3.1:NumberofFemalesGrantedInternationalProtectioninEU27

15TOO MUCH PAIN - Female Genital Mutilation & Asylum in the European Union A Statistical Overview
Some preliminary comments
This section provides detailed data on the EU Member States in which refugee women and girls from FGM practising countries reside, as well as information about their respective countries of origin. The data in this set aim at raising awareness on these refugee women and girls who live in EU Member States with very specific long-lasting physical, sexual and mental health problems resulting from FGM. Social, linguistic, religious and cultural barriers may hinder the access of these refugee women and girls to specialist health and support services. It is thus hoped that this data, with its breakdown by countries of origin, will encourage the tailored and targeted design of initiatives aimed at supporting the integration of refugee women and girls in the key destination EU Member States.
Table 3.3: France
2008 2009 2010 2011
Nigeria 40 10 25 30
Somalia 5 0 5 10
Eritrea 5 5 5 35
Guinea 70 115 105 135
Cote d'Ivoire 30 40 15 30
Ethiopia 5 0 0 10
Cameroon 20 15 15 10
Congo 60 60 40 30
Mali 10 40 145 75
Sudan 15 80 5 20
Egypt 0 5 0 5
Gambia 5 0 5 0
Senegal 5 10 20 20
Mauritania 25 55 25 45
Sierra Leone 5 5 10 5
Burkina Faso 0 0 5 5
Central African Republic
10 5 5 5
Chad 15 35 5 10
Djibouti 5 0 0 0
Guinea-Bissau 0 0 5 5
Kenya 5 0 5 0
Togo 10 15 5 0
TOTAL 345 495 450 485
Table 3.2: UnitedKingdom
2008 2009 2010 2011
Nigeria 45 40 70 105
Somalia 245 180 215 135
Eritrea 140 90 80 70
Guinea 15 10 10 5
Cote d'Ivoire 25 5 10 15
Ethiopia 20 15 30 25
Cameroon 45 15 25 15
Congo 5 5 0 0
Ghana 5 5 10 15
Sudan 35 20 40 15
Egypt 0 5 10 20
Gambia 25 30 100 75
Senegal 0 0 5 10
Sierra Leone 10 5 25 25
Chad 0 5 0 0
Kenya 15 15 30 25
Liberia 10 0 0 5
Tanzania 5 0 5 5
Togo 0 0 0 5
Uganda 25 15 45 60
Yemen 15 20 10 10
TOTAL 685 480 720 640
0
100
200
300
400
500
600
700
800
Belgium
Num
ber
of P
ositi
ve D
ecis
ions
Germany France UK Netherlands Sweden Italy
2008
20102009
2011
Graph 3:RecognitionRateforFemalesfromFGM-riskCountriesinTopEU7MemberStates

16TOO MUCH PAIN - Female Genital Mutilation & Asylum in the European Union A Statistical Overview
Table 3.5:Germany
2008 2009 2010 2011
Nigeria 10 5 15 35
Somalia 15 5 5 20
Eritrea 65 25 45 20
Guinea 10 5 10 5
Cote d'Ivoire 5 0 0 0
Ethiopia 40 50 80 80
Cameroon 5 5 5 15
Sudan 0 0 0 5
Gambia 0 0 0 5
Sierra Leone 5 5 5 10
Kenya 5 0 5 15
Niger 5 0 5 0
Togo 5 5 5 5
Uganda 5 0 5 0
TOTAL 175 105 185 215
Table 3.4: Sweden
2008 2009 2010 2011
Nigeria 5 5 5 0
Somalia 5 190 125 115
Eritrea 30 95 25 20
Cote d'Ivoire 5 0 0 0
Ethiopia 5 5 15 10
Cameroon 0 0 0 5
Congo 0 0 0 5
Ghana 0 0 0 5
Sudan 0 5 5 0
Egypt 0 5 5 5
Kenya 0 5 0 10
Uganda 0 5 0 5
Yemen 0 5 5 0
TOTAL 50 320 185 180
Table 3.9: Austria
2008 2009 2010 2011
Nigeria 5 10 10 20
Somalia 5 10 15 35
Eritrea 0 0 5 0
Ethiopia 0 0 5 5
Congo 0 5 5 0
Ghana 0 5 0 0
Togo 0 5 0 0
TOTAL 10 35 40 60
Table 3.10: Ireland
2008 2009 2010 2011
Nigeria 30 15 10 5
Somalia 5 5 5 0
Eritrea 0 5 0 0
Ethiopia 5 5 0 0
Ghana 0 5 0 0
Uganda 0 0 5 0
TOTAL 40 35 20 5
Table 3.8: Italy
2008 2009 2010 2011
Nigeria 0 0 40 0
Niger 0 0 0 25
Togo 0 0 5 5
TOTAL 0 0 45 30
Table 3.7: Belgium
2008 2009 2010 2011
Somalia 0 5 0 5
Guinea 5 25 5 25
Cameroon 10 5 5 0
Senegal 0 0 5 5
Mauritania 0 0 0 5
TOTAL 15 35 15 40
Table 3.6: Netherlands
2008 2009 2010 2011
Nigeria 5 0 0 0
Somalia 15 15 35 235
Eritrea 5 0 5 20
Guinea 15 0 5 10
Ethiopia 0 0 0 5
Congo 5 0 10 0
Sierra Leone 10 0 5 5
Kenya 0 0 5 0
Uganda 0 0 0 5
TOTAL 55 15 65 280

17TOO MUCH PAIN - Female Genital Mutilation & Asylum in the European Union A Statistical Overview
4.WhatistheFGMprevalencerate?
The study estimates that 8,809 female asylum applicants aged 14-64 may have been affected by FGM in 2011,21 i.e. 61% of the total 14,440 girls and women from the same age group who sought asylum in the EU 27 Member States from FGM-practising countries of origin that year.22 The majority of these were aged 18 to 34. Based on the FGM prevalence rate in the countries of origin, Somali, Eritrean and Guinean girls and women seeking asylum in the EU were likely to be the most affected by FGM.
While female applicants from FGM-practising countries represented 20% of all women and girls seeking asylum in the EU in 2011, as outlined in the first section of this study, the estimated proportion of women and girls aged 14-64 potentially affected by FGM out of the total number of female asylum applicants is 9.1%.23
21 SeeTable4.1.TheestimatenumberwascalculatedbymultiplyingtheFGMprevalencerateineachFGM-practisingCoOwiththetotalnumberoffemalesaged14-64applyingforasylumfromthatCoOineachEUMemberState.TheFGMprevalenceratesforeachFGM-practisingCoOarebasedonthenationalsurveydataonFGMprevalenceintheseCoOaspartoftheDemographicandHealthSurveys(DHS)publishedbyMacro,ortheMultipleClusterIndicatorSurveys(MICS),publishedbyUNICEF;availableat:http://goo.gl/6TlK5.Theseprevalenceratesusetheagecohort15-49.Theprevalenceratemayvaryslightlywithinthelargeragecohortof14-64,howevertheFGMprevalencerateforthisagegroupisnotavailable.Forthepurposeofthisstudy,itisthereforeassumedthattheFGMprevalenceratefortheagegroup15-49iscomparabletothatoftheagegroup14-64.Thesymbol(:)signifiesthatnodataiscurrentlyavailable.
22 Thetotalnumberoffemaleapplicantsaged14to64isdifferentfortables4.1and4.2asAustria,Finland,Portugal,SlovakiaandHungaryhavenotbeenincludedintheanalysisfortable4.1;nodatawasavailableforthesecountriesbasedon“NewAsylumApplicant”inEurostat.
23 Thispercentagehasbeencalculatedusing“AsylumApplicant”ratherthan“NewAsylumApplicant”toincludeHungary,Slovakia,Portugal,AustriaandFinlandintheanalysisforwhichnodataisotherwiseavailableunder“NewAsylumApplicant”.
Table 4.1: EstimatedNumberofFemaleAsylum-SeekersAged14-64PotentiallyAffectedbyFGM
FGM-risk Country of Origin
Age
Tota
l Nbr
of
Fem
ale
App
lican
ts A
ged
14-6
4
FGM
Pre
vale
nce
Rat
e*
Est
imat
ed
Nbr
of F
emal
e A
pplic
ants
Age
d 14
-64
Pot
entia
lly
Affe
cted
by
FGM
14-17 18-34 35-64
Cameroon 15 310 100 425 1.4% 6
Central African Republic 0 15 5 20 25.7% 5
Chad 5 50 15 70 44.9% 31
Congo 35 300 95 430 : :
Dijbouti 0 15 15 30 93.1% 28
Eritrea 165 1,275 385 1,825 88.7% 1,619
Ethiopia 70 450 60 580 74.3% 431
Kenya 15 175 70 260 27.1% 70
Somalia 210 1,765 490 2,465 97.9% 2,413
Uganda 15 190 65 270 0.8% 2
Tanzania 5 45 10 60 14.6% 9
Egypt 15 140 75 230 91.1% 210
Sudan 10 185 45 240 90.0% 216
Benin 0 15 5 20 12.9% 3
Burkina Faso 0 30 5 35 72.5% 25
Cote d'Ivoire 15 560 205 780 36.4% 284
Gambia 15 155 45 215 78.3% 168
Ghana 5 250 85 340 3.8% 13
Guinea 195 1,170 120 1,485 95.6% 1,420
Guinea-Bissau 0 15 5 20 44.5% 9
Liberia 0 40 0 40 58.2% 23
Mali 10 185 40 235 85.2% 200
Mauritania 10 110 35 155 72.2% 112
Niger 0 40 0 40 2.2% 1
Nigeria 65 2,835 300 3,200 29.6% 947
Senegal 5 160 45 210 28.2% 59
Sierra Leone 25 140 10 175 94.0% 165
Togo 5 75 30 110 5.8% 6
Yemen 5 35 25 65 38.2% 25
TOTAL 915 10,730 2,385 14,030 8,500
*TheFGM-prevalenceratesarederivedfromnationalsurveydata(theDemographicandHealthSurveys(DHS)publishedbyMacro,ortheMultipleClusterIndicatorSurveys(MICS),publishedbyUNICEF),availableat:http://www.who.int/reproductivehealth/topics/fgm/prevalence/en/index.html
(:)TheWorldHealthorganization(WHO)notesthatthereareonlyanecdotalreportsonFGMintheDemocraticRepublicofCongo.
The social worker to whom I explained my story said, “Excuse me, but what are you talking about?”. For a moment I was speechless, I could not understand how as a social worker she didn’t know about excision. She is supposed to “help” me and she does not even know what I am talking about; it was useless to continue telling her my story.
TeliwelDiallo,anti-FGMactivistinGuinea,refugeeinBelgium.

18TOO MUCH PAIN - Female Genital Mutilation & Asylum in the European Union A Statistical Overview
In absolute numbers, the top five asylum countries with the highest estimated number of female applicants aged 14-64 likely to be affected by FGM in 2011 were Sweden, France, Italy, the United Kingdom and Belgium.24 Looking at the proportion these girls and women potentially affected by FGM may represent out of the total number of female applicants from FGM-practising countries of origin in each Member State, the Netherlands, Austria and Malta then join this group of top Member States.25
According to this estimate, over 50% of all female applicants from FGM-practising countries of origin in Austria, Malta, Belgium, France, Germany and the United Kingdom were potentially affected by FGM in 2011, and they came mostly from Somalia, Guinea and Eritrea.
In Sweden, 1,716 female applicants between the ages of 14 and 64 are likely to be affected by FGM i.e. 85.4% of the total female applicants from FGM-practising countries of origin in Sweden. The majority of these were Somali women and girls (estimated at 964).
In the Netherlands, it is estimated that 798 female asylum-seekers are likely to be affected by FGM, representing 80.6% of the total female applicants aged 14-64 from FGM-practising countries. The majority of these are from Somalia (an estimated 387 girls and women).
24 Table4.2providesanoverviewoftheestimatednumberoffemaleapplicantsaged14-64affectedbyFGMineachoftheEU27MemberStates.Tables4.3to4.9showthebreakdownbyFGM-practisingCoOandestimatednumberoffemaleapplicantslikelytobeaffectedbyFGMinthetop6MemberStates:Sweden,France,Italy,UK,Belgium,theNetherlandsandGermany.
25 ThecalculationonlytakesintoaccountthoseMemberStatesthatreceiveover200applicationsfromfemalesaged14-64fromFGM-practisingCoO.
Table 4.2: EstimatedNumberofFemaleApplicantsAged14-64PotentiallyAffectedbyFGMinEU27MemberStates(2011)
EU Member State
Total Female Applicants Aged 14 to 64 from FGM-risk Countries
Estimated Nbr of Female Applicants Aged 14 to 64 Potentially Affected by FGM
Estimated % of Female Applicants Aged 14-64 Potentially Affected by FGM out of the Total Female Applicants from FGM-risk Countries
Estimated % of Female Applicants Aged 14-64 Potentially Affected by FGM out of Total Female Applicants
Sweden 2,010 1,716 85.4% 11.88%
France 2,820 1,597 56.6% 11.06%
Italy 2,665 1,092 41.0% 7.56%
UK 1,830 1,085 59.3% 7.51%
Belgium 1,380 945 68.5% 6.54%
Netherlands 990 798 80.6% 5.53%
Germany 1,250 733 58.6% 5.08%
Malta 285 207 72.6% 1.43%
*Austria 235 176 74.9% 1.22%
Greece 395 156 39.5% 1.08%
*Finland 110 81 73.6% 0.56%
Spain 190 65 34.2% 0.45%
Ireland 65 29 44.6% 0.20%
Denmark 55 29 52.7% 0.20%
Cyprus 40 27 67.5% 0.19%
*Portugal 30 19 63.3% 0.13%
*Slovakia 15 15 100.0% 0.10%
*Hungary 15 15 100.0% 0.10%
Czech Republic 10 6 60.0% 0.04%
Slovenia 5 5 100.0% 0.03%
Bulgaria 5 5 100.0% 0.03%
Luxembourg 10 4 40.0% 0.03%
Latvia 10 2 20.0% 0.01%
Poland 15 1 6.7% 0.01%
Romania 5 1 20.0% 0.01%
Estonia 0 0 0.0% 0.00%
Lithuania 0 0 0.0% 0.00%
EU TOTAL 14,440 8,809
*Dataforthesecountriesisbasedon“AsylumApplicant”not“NewAsylumApplicant”asthisinformationwasnotavailableinEurostat
All the women usually try to avoid being examined in that are because they don’t feel comfortable. Especially those who are newcomers because of the language they have to have a third person as an interpreter or the husband.
Women’s Experiences, Perceptions and Attitudes of Female Genital Mutilation-TheBristolPEERStudy,PrincipalResearcherDr.EimanHussein,FoundationforWomen’sHealthResearchandDevelopment(FORWARD).

0
500
250
750
1250
1750
1000
1500
19TOO MUCH PAIN - Female Genital Mutilation & Asylum in the European Union A Statistical Overview
Some preliminary comments
The EU asylum acquis requires that the special needs of vulnerable asylum-seekers be taken into account, including needs arising from torture. Like torture, FGM involves the deliberate infliction of severe pain and suffering, and the pain inflicted by FGM does not stop with the initial procedure, but often continues as on-going torture throughout a woman’s life.26
The data in this study are aimed at further supporting Member States enhance the capacity of their respective reception systems to identify and meet the specific needs of the women and girl asylum-seekers living with FGM and its long-lasting consequences, including chronic pain, chronic pelvic infections, infection of the reproductive system, repetitive trauma at delivery and obstetric complications, as well as several emotional and psychological disturbances, most prominently post-traumatic stress disorder.
This section provides statistical data on the FGM prevalence amongst female asylum-seekers in the 27 EU Member States. It is designed in support of policy makers’ efforts to ensure that the specific needs of this group of women and girls are effectively addressed. Awareness raising and training on FGM amongst health practitioners, in the asylum centres and the areas where asylum-seekers live in the community, are necessary so that the girls and women affected by FGM can be identified and appropriately taken care of and have a safe space where they can discuss FGM-related issues. Likewise, guardians who look after the well-being and best interests of children would also need to be sensitized to these issues. More specifically, training ethnic minority health workers from FGM-practising countries could also contribute to enhancing the response capacity of asylum reception systems in EU Member States in this field. In States where the specialist medical expertise required to address FGM is not available in the health units present in or servicing asylum reception centres, tailored responses could include, for instance, the establishment of referral mechanisms to the national health sector with expertise in FGM.
The European Commission could also play a useful role in facilitating exchanges of information and best practices between health practitioners in Members States where such expertise has been developed over the years on the one hand, and “newcomers” to the issue on the other.
26 UNGeneralAssembly,HumanRightsCouncil,SeventhSession,Item3oftheprovisionalagenda,PromotionandProtectionofAllHumanRights,Civil,Political,Economic,SocialandCulturalRights,IncludingtheRighttoDevelopment,ReportoftheSpecialRapporteurontortureandothercruel,inhumanordegradingtreatmentorpunishment,ManfredNowak,A/HRC/7/3,15January2008,availableat:http://goo.gl/OM5a9,page16.
Sweden France Italy UK Belgium Netherlands Germany
Mauritania 0 105 4 0 0 0 0
Gambia 4 4 4 125 4 4 23
Egypt 27 27 27 50 9 18 23
Sudan 14 50 32 68 9 36 0
Mali 0 179 13 0 4 0 4
Ethiopia 52 19 82 48 11 19 123
Cote d’Ivoire 4 166 33 20 31 7 7
Guinea 5 593 10 24 626 100 48
Eritrea 594 129 137 315 22 173 173
Somalia 964 113 186 245 137 387 215
Nigeria 22 110 509 108 13 10 58
Graph 4:EstimatedNbrofFemaleApplicantsPotentiallyAffectedbyFGMintop7AsylumEUMemberStates(2011)
Num
ber
of A
pplic
ants

20TOO MUCH PAIN - Female Genital Mutilation & Asylum in the European Union A Statistical Overview
The map shows the areas were FGM is practised, and since that can vary markedly in different parts of any country, no national boundaries are shown.
Data at the sub-national level are not available for Zambia. Due to a discrepancy between the regional divisions used by DHS and the one adopted by DevInfo, it was not possible to include data at the sub-national level for Yemen.
Less than 10%
10.1% – 25%
25.1% – 50%
50.1% – 75%
75.1% or more Sources: MICS, DHS and other national surveys, 1997–2006 Map developed by UNICEF, 2007
Missing data or FGM not widely practiced
Map: PrevalenceoffemalegenitalmutilationinAfricaandYemen(womenaged15-49)

21TOO MUCH PAIN - Female Genital Mutilation & Asylum in the European Union A Statistical Overview
This section also provides more insights into the FGM prevalence rates amongst each national group of female asylum-seekers from FGM-practising countries of origin. The purpose here is to provide statistical tools to raise the awareness of asylum practitioners to the potential specific needs of women and girls from the respective FGM-practising countries, starting from the registration and screening phase. The data can also be used to raise the awareness of FGM amongst health practitioners in the asylum reception centres. For instance, if 30% of all Nigerian female applicants in Sweden are potentially already affected by FGM at the time of their arrival in the EU, registration and other staff have at hand a useful indicator to identify specific vulnerabilities and needs, and where relevant apply the necessary safeguards for persons with vulnerabilities.
Refugee girls and women may not come uniformly from a country of origin and may, depending on the political, religious, ethnic, social and other conditions, come from some regions in particular, where the FGM prevalence might be even higher than the national average. For instance, while the national FGM prevalence in Gambia is 78.3%, the highest prevalence rises to 99%.27 Many refugee women and girls from Gambia are Mandinka, Fulas and Serahule, amongst whom FGM is more common. It is thus hoped that this study will encourage health practitioners as well as registration staff and decision-makers in the asylum system to further enhance their understanding of the practice of FGM amongst the various national, ethnic and religious groups who seek asylum in their respective Member States.
The statistical data will also be useful to raise the awareness of interviewers and decision-makers to the specific vulnerabilities of this group of applicants. Although the scientific research addressing the psychological consequences of FGM is limited, documented psychological consequences include feelings of low-esteem, post-traumatic stress disorder, anxiety, depression and memory loss, which would need to be taken into account by decision-makers who examine cases that involve women and girls from FGM-practising countries of origin, in particular when assessing the credibility of the material facts of their claims.
27 RefertoInter-Agency,Eliminating Female Genital Mutilation. An Interagency Statement,February2008,p.5,foramapshowingtheprevalenceofFGMinAfricaandYemen,andhighlightingattimesmarkedlyvarieddifferenceswithinonecountry,availableat:http://www.unhcr.org/refworld/docid/47c6aa6e2.html
Table 4.3: Top1:Sweden
FGM-risk CoOTotal Female
Applicants Aged 14 to 64
FGM Prevalence Rate
Estimated Nbr of Female Applicants Aged 14 to 64
Potentially Affected by FGM
Nigeria 75 29.6% 22
Somalia 985 97.9% 964
Eritrea 670 88.7% 594
Guinea 5 95.6% 5
Cote d'Ivoire 10 36.4% 4
Ethiopia 70 74.3% 52
Cameroon 15 1.4% 0
Congo 15 : :
Mali 0 85.2% 0
Ghana 10 3.8% 0
Sudan 15 90.0% 14
Egypt 30 91.1% 27
Gambia 5 78.3% 4
Senegal 0 28.2% 0
Mauritania 0 72.2% 0
Sierra Leone 10 94.0% 9
Benin 0 12.9% 0
Burkina Faso 0 72.5% 0
Central African Republic 0 25.7% 0
Chad 0 44.9% 0
Djibouti 0 93.1% 0
Guinea-Bissau 0 44.5% 0
Kenya 25 27.1% 7
Liberia 5 58.2% 3
Niger 0 2.2% 0
Tanzania 5 14.6% 1
Togo 0 5.8% 0
Uganda 35 0.8% 0
Yemen 25 38.2% 10
TOTAL 2,010 1,716

22TOO MUCH PAIN - Female Genital Mutilation & Asylum in the European Union A Statistical Overview
Table 4.5: Top3:Italy
FGM-risk CoOTotal Female
Applicants Aged 14 to 64
FGM Prevalence Rate
Estimated Nbr of Female Applicants Aged 14 to 64
Potentially Affected by FGM
Nigeria 1,720 29.6% 509
Somalia 190 97.9% 186
Eritrea 155 88.7% 137
Guinea 10 95.6% 10
Cote d'Ivoire 90 36.4% 33
Ethiopia 110 74.3% 82
Cameroon 25 1.4% 0
Congo 30 : :
Mali 15 85.2% 13
Ghana 115 3.8% 4
Sudan 35 90.0% 32
Egypt 30 91.1% 27
Gambia 5 78.3% 4
Senegal 35 28.2% 10
Mauritania 5 72.2% 4
Sierra Leone 15 94.0% 14
Benin 5 12.9% 1
Burkina Faso 5 72.5% 4
Central African Republic 0 25.7% 0
Chad 25 44.9% 11
Djibouti 0 93.1% 0
Guinea-Bissau 0 44.5% 0
Kenya 10 27.1% 3
Liberia 15 58.2% 9
Niger 10 2.2% 0
Tanzania 0 14.6% 0
Togo 5 5.8% 0
Uganda 5 0.8% 0
Yemen 0 38.2% 0
TOTAL 2,665 1,092
Table 4.4: Top2:France
FGM-risk CoOTotal Female
Applicants Aged 14 to 64
FGM Prevalence Rate
Estimated Nbr of Female Applicants Aged 14 to 64
Potentially Affected by FGM
Nigeria 370 29.6% 110
Somalia 115 97.9% 113
Eritrea 145 88.7% 129
Guinea 620 95.6% 593
Cote d'Ivoire 455 36.4% 166
Ethiopia 25 74.3% 19
Cameroon 80 1.4% 1
Congo 310 : :
Mali 210 85.2% 179
Ghana 0 3.8% 0
Sudan 55 90.0% 50
Egypt 30 91.1% 27
Gambia 5 78.3% 4
Senegal 65 28.2% 18
Mauritania 145 72.2% 105
Sierra Leone 30 94.0% 28
Benin 5 12.9% 1
Burkina Faso 10 72.5% 7
Central African Republic 20 25.7% 5
Chad 45 44.9% 20
Djibouti 10 93.1% 9
Guinea-Bissau 20 44.5% 9
Kenya 5 27.1% 1
Liberia 5 58.2% 3
Niger 5 2.2% 0
Tanzania 0 14.6% 0
Togo 30 5.8% 2
Uganda 5 0.8% 0
Yemen 0 38.2% 0
TOTAL 2,820 1,597

23TOO MUCH PAIN - Female Genital Mutilation & Asylum in the European Union A Statistical Overview
Table 4.7: Top5:Belgium
FGM-risk CoOTotal Female
Applicants Aged 14 to 64
FGM Prevalence Rate
Estimated Nbr of Female Applicants Aged 14 to 64
Potentially Affected by FGM
Nigeria 45 29.6% 13
Somalia 140 97.9% 137
Eritrea 25 88.7% 22
Guinea 655 95.6% 626
Cote d'Ivoire 85 36.4% 31
Ethiopia 15 74.3% 11
Cameroon 145 1.4% 2
Congo 10 : :
Mali 5 85.2% 4
Ghana 5 3.8% 0
Sudan 10 90.0% 9
Egypt 10 91.1% 9
Gambia 5 78.3% 4
Senegal 45 28.2% 13
Mauritania 0 72.2% 0
Sierra Leone 15 94.0% 14
Benin 5 12.9% 1
Burkina Faso 15 72.5% 11
Central African Republic 0 25.7% 0
Chad 0 44.9% 0
Djibouti 20 93.1% 19
Guinea-Bissau 0 44.5% 0
Kenya 25 27.1% 7
Liberia 10 58.2% 6
Niger 15 2.2% 0
Tanzania 25 14.6% 4
Togo 45 5.8% 3
Uganda 5 0.8% 0
Yemen 0 38.2% 0
TOTAL 1,380 945
Table 4.6: Top4:UnitedKingdom
FGM-risk CoOTotal Female
Applicants Aged 14 to 64
FGM Prevalence Rate
Estimated Nbr of Female Applicants Aged 14 to 64
Potentially Affected by FGM
Nigeria 365 29.6% 108
Somalia 250 97.9% 245
Eritrea 355 88.7% 315
Guinea 25 95.6% 24
Cote d'Ivoire 55 36.4% 20
Ethiopia 65 74.3% 48
Cameroon 40 1.4% 1
Congo 5 : :
Mali 0 85.2% 0
Ghana 65 3.8% 2
Sudan 75 90.0% 68
Egypt 55 91.1% 50
Gambia 160 78.3% 125
Senegal 15 28.2% 4
Mauritania 0 72.2% 0
Sierra Leone 40 94.0% 38
Benin 0 12.9% 0
Burkina Faso 0 72.5% 0
Central African Republic 0 25.7% 0
Chad 0 44.9% 0
Djibouti 0 93.1% 0
Guinea-Bissau 0 44.5% 0
Kenya 70 27.1% 19
Liberia 5 58.2% 3
Niger 0 2.2% 0
Tanzania 20 14.6% 3
Togo 0 5.8% 0
Uganda 135 0.8% 1
Yemen 30 38.2% 11
TOTAL 1,830 1,085

24TOO MUCH PAIN - Female Genital Mutilation & Asylum in the European Union A Statistical Overview
Table 4.8: Top6:TheNetherlands
FGM-risk CoOTotal Female
Applicants Aged 14 to 64
FGM Prevalence Rate
Estimated Nbr of Female Applicants Aged 14 to 64
Potentially Affected by FGM
Nigeria 35 29.6% 10
Somalia 395 97.9% 387
Eritrea 195 88.7% 173
Guinea 105 95.6% 100
Cote d'Ivoire 20 36.4% 7
Ethiopia 25 74.3% 19
Cameroon 5 1.4% 0
Congo 40 : :
Mali 0 85.2% 0
Ghana 5 3.8% 0
Sudan 40 90.0% 36
Egypt 20 91.1% 18
Gambia 5 78.3% 4
Senegal 0 28.2% 0
Mauritania 0 72.2% 0
Sierra Leone 45 94.0% 42
Benin 0 12.9% 0
Burkina Faso 0 72.5% 0
Central African Republic 0 25.7% 0
Chad 0 44.9% 0
Djibouti 0 93.1% 0
Guinea-Bissau 0 44.5% 0
Kenya 0 27.1% 0
Liberia 0 58.2% 0
Niger 0 2.2% 0
Tanzania 0 14.6% 0
Togo 5 5.8% 0
Uganda 50 0.8% 0
Yemen 0 38.2% 0
TOTAL 990 798
Table 4.9: Top7:Germany
FGM-risk CoOTotal Female
Applicants Aged 14 to 64
FGM Prevalence Rate
Estimated Nbr of Female Applicants Aged 14 to 64
Potentially Affected by FGM
Nigeria 195 29.6% 58
Somalia 220 97.9% 215
Eritrea 195 88.7% 173
Guinea 50 95.6% 48
Cote d'Ivoire 20 36.4% 7
Ethiopia 165 74.3% 123
Cameroon 60 1.4% 1
Congo 5 : :
Mali 5 85.2% 4
Ghana 85 3.8% 3
Sudan 0 90.0% 0
Egypt 25 91.1% 23
Gambia 30 78.3% 23
Senegal 10 28.2% 3
Mauritania 0 72.2% 0
Sierra Leone 15 94.0% 14
Benin 5 12.9% 1
Burkina Faso 5 72.5% 4
Central African Republic 0 25.7% 0
Chad 0 44.9% 0
Djibouti 0 93.1% 0
Guinea-Bissau 0 44.5% 0
Kenya 105 27.1% 28
Liberia 0 58.2% 0
Niger 0 2.2% 0
Tanzania 0 14.6% 0
Togo 20 5.8% 1
Uganda 25 0.8% 0
Yemen 10 38.2% 4
TOTAL 1,250 733

25TOO MUCH PAIN - Female Genital Mutilation & Asylum in the European Union A Statistical Overview
5.WheredothesegirlssettleintheEU?
The age at which FGM is performed varies. In some areas it is carried out during infancy (as early as a couple of days after birth), in others during childhood, at the time of marriage, during a woman’s first pregnancy or after the birth of her first child. The most typical age is between infancy and age 15. Data in this section therefore focuses on the girls under 14 of age who seek asylum in the EU.
Over 3,000 (3,665) girls aged under 14 sought asylum in the EU in 2011, out of a total of 20,000 women and girls from FGM-practising countries.
Over the four year period under study, the number of girls under 14 seeking asylum in the EU28 almost doubled (from 1,905 in 2008 to 3,665 in 2011) due in particular to significant increases in girl claimants from Guinea (tenfold jump to 455), Mali and to a lesser extent from Nigeria and Eritrea. Within this timeframe, France received the most applications followed by the Netherlands and Sweden.29
28 InlinewiththeassumptionsmadefortheEIGEstudy,itwasassumedthatdespitethevaryingpracticesregardingtheagesatwhichFGMispractisedinthecountriesoforigin,girlsundertheageof14maystillbeintactatthetimeoftheirarrivalinEurope.
29 Table5.1showsthenumberofgirlsundertheageof14fromFGM-practisingCoOthatsoughtasylumintheEU27MemberStatesfortheyears2008-2011.Thecountriesreceivingthemostsignificantnumbersofapplicationsfromgirlsunder14arehighlightedbasedonanaverageoverthefouryearperiod:redforover1,000;orangeover500;andyellowover200.
Table 5.1: TotalGirlsUnder14SeekingAsylumfromFGM-riskCountriesofOrigin
EU Member State 2008 2009 2010 2011
Austria : : : :
Belgium 70 150 180 300
Bulgaria : : : 0
Cyprus 5 0 5 10
Czech Republic 0 0 0 0
Denmark : : 5 15
Estonia 0 0 0 0
Finland : : : :
France : 725 890 1,115
Germany 245 275 345 390
Greece : : : 0
Hungary : : : :
Ireland 230 155 120 70
Italy 10 35 60 415
Latvia 0 0 0 0
Lithuania 0 0 0 0
Luxembourg : : : 0
Malta 40 25 0 40
Netherlands 485 650 920 315
Poland 0 0 0 5
Portugal 5 5 0 0
Romania : : : 0
Slovakia : : 0 :
Slovenia 0 0 0 0
Spain : : 20 40
Sweden 420 520 590 515
United Kingdom 395 435 460 435
TOTAL 1,905 2,975 3,595 3,665
Researchers estimate that there are 3,000-4,000 new FGM cases in the UK every year.
RichardAPowell,AmandaLawrence,FaithNMwangi-PowellandLindaMorison,Female genital mutilation, asylum-seekers and refugees: the need for an integrated UK policy agenda,ForcedMigrationReview,14,2004.

26TOO MUCH PAIN - Female Genital Mutilation & Asylum in the European Union A Statistical Overview
Year 2008 2009 2010 2011
EU Member State Total Girls Under 14 Seeking
Asylum from FGM-risk
CoO
Recognition Rate of Under 14 Girls from FGM-CoO
Number of Girls with
International Protection
Total Girls Under 14 Seeking
Asylum from FGM-risk
CoO
Recognition Rate of Under 14 Girls from FGM-CoO
Number of Girls with
International Protection
Total Girls Under 14 Seeking
Asylum from FGM-risk
CoO
Recognition Rate of Under 14 Girls from FGM-CoO
Number of Girls with
International Protection
Total Girls Under 14 Seeking
Asylum from FGM-risk
CoO
Recognition Rate of Under 14 Girls from FGM-CoO
Number of Girls with
International ProtectionTotal
DecisionsPositive
DecisionsRec Rate
(%)Total
DecisionsPositive
DecisionsRec Rate
(%)Total
DecisionsPositive
DecisionsRec Rate
(%)Total
DecisionsPositive
DecisionsRec Rate
(%)
Austria : 15 0 0 : 30 10 33.33 10 : 35 15 42.86 15 : 40 25 62.5 25
Belgium 70 65 0 0 150 30 5 16.67 5 180 65 0 0 300 40 5 12.5 5
Bulgaria : 0 0 0 : 0 0 0 : 0 0 0 0 0 0
Cyprus 5 0 0 0 5 0 0 5 5 5 100 5 10 0 0 0
Czech Republic 0 0 0 0 0 0 0 0 0 0 0 0
Denmark : 0 0 0 : 0 0 0 5 0 0 0 15 0 0 0
Estonia 0 0 0 0 0 0 0 0 0 0 0 0
Finland : 0 0 0 : 0 0 0 : 0 0 0 : 0 0 0
France : 0 0 0 725 0 0 0 890 130 75 57.7 75 1,115 130 70 53.85 70
Germany 245 45 20 44.44 20 275 20 10 50 10 345 20 15 75 15 390 85 30 35.29 30
Greece : 0 0 0 : 0 0 0 : 0 0 0 5 5 100 5
Hungary : 0 0 0 : 0 0 0 : 0 0 0 : 0 0 0
Ireland 230 180 10 5.56 10 155 185 5 2.7 5 120 205 5 2.44 5 70 90 0 0
Italy 10 0 0 0 35 0 0 0 60 0 0 0 415 0 0 0
Latvia 0 0 0 0 0 0 0 0 0 0 0 0
Lithuania 0 0 0 0 0 0 0 0 0 0 0 0
Luxembourg : 0 0 0 : 0 0 0 : 0 0 0 0 0 0
Malta 40 0 0 0 25 0 0 0 0 0 0 40 5 0 0
Netherlands 485 0 0 0 650 10 5 50 5 920 15 5 33.33 5 315 35 25 71.43 25
Poland 0 0 0 0 0 0 0 0 0 0 5 0 0 0
Portugal 5 0 0 0 5 0 0 0 0 0 0 0 0 0
Romania : 0 0 0 : 0 0 0 : 0 0 0 0 0 0
Slovakia : 0 0 0 : 0 0 0 0 0 0 : 0 0 0
Slovenia 0 0 0 0 0 0 0 0 0 0 0 0
Spain : 0 0 0 : 5 0 0 20 5 0 0 40 0 0 0
Sweden 420 50 5 10 5 520 70 25 35.71 25 590 80 20 25 20 515 90 20 22.22 20
United Kingdom 395 285 135 47.37 135 435 235 70 29.79 70 460 400 150 37.5 150 435 345 145 42.03 145
TOTAL 1,905 170 2,975 130 3,595 290 3,665 325
Table 5.2:NumberofGirlBeneficiariesofInternationalProtectionfromFGM-riskCountriesofOriginineachEUMemberState

27TOO MUCH PAIN - Female Genital Mutilation & Asylum in the European Union A Statistical Overview
Year 2008 2009 2010 2011
FGM-Risk COO Total Girls under 14 Seeking Asylum in
EU 27 MS
Recognition Rate for Under-14 Girls (%)
Girls under 14 with International
Protection
Total Girls under 14 Seeking Asylum in
EU 27 MS
Recognition Rate for Under-14 Girls (%)
Girls under 14 with International
Protection
Total Girls under 14 Seeking Asylum in
EU 27 MS
Recognition Rate for Under-14 Girls (%)
Girls under 14 with International
Protection
Total Girls under 14 Seeking Asylum in
EU 27 MS
Recognition Rate for Under-14 Girls (%)
Girls under 14 with International
ProtectionTotal Decisions/Positive Decisons
Total Decisions/Positive Decisons
Total Decisions/Positive Decisons
Total Decisions/Positive Decisons
Nigeria 355 11% 25 355 8% 20 445 11% 35 620 20% 60
Somalia 885 65% 55 1,110 47% 40 1,360 44% 40 740 64% 75
Eritrea 150 43% 15 220 43% 15 295 38% 15 360 50% 15
Guinea 45 0% 240 50% 5 315 33% 15 455 40% 20
Côte d'Ivoire 30 33% 10 55 0% 105 0% 170 50% 10
Ethiopia 40 33% 5 55 0% 55 50% 10 90 29% 10
Cameroon 30 33% 15 55 0% 45 20% 5 70 0%
Congo 20 100% 5 50 0% 60 0% 80 0%
Mali 0% 245 0% 255 63% 50 285 62% 40
Ghana 60 0% 60 0% 60 13% 5 100 20% 5
Sudan 30 25% 5 55 40% 10 75 43% 15 120 50% 10
Egypt 20 0% 35 0% 60 50% 10 105 33% 10
Gambia 55 75% 15 100 50% 15 125 47% 45 90 60% 30
Senegal 0% 50 0% 70 50% 10 60 40% 10
Mauritania 0% 50 0% 50 0% 70 0%
Benin 10 0% 15 0% 5 0% 0%
Burkina Faso 0% 5 0% 0% 15 0%
CAR 0% 5 0% 5 0% 5 0%
Chad 5 0% 20 0% 25 0% 20 0%
Djibouti 0% 5 0% 10 0% 10 0%
Guinea-Bissau 5 0% 10 0% 10 0% 5 0%
Kenya 35 0% 25 50% 10 35 50% 5 20 17% 5
Liberia 5 0% 10 0% 5 0% 5 0%
Niger 5 33% 5 5 0% 100% 5 15 0%
Sierra Leone 20 20% 5 45 0% 40 33% 5 50 67% 10
Tanzania 10 0% 5 0% 0% 15 0%
Togo 30 0% 25 50% 5 25 0% 30 50% 5
Uganda 25 50% 5 25 0% 35 22% 10 25 50% 10
Yemen 35 20% 5 40 50% 10 25 50% 10 35 0%
TOTAL 1,905 170 2,975 130 3,595 290 3,665 325
Notes: *Recognitionratebasedonfinaldecisionsnotfirstdecisions;1.For2008and2009,figuresexcludeAustria,Bulgaria,Denmark,Finland,France,Greece,Hungary,Luxembourg,Romania,SlovakiaandSpain2.For2010,figuresexcludeAustria,Bulgaria,Finland,France,Greece,Hungary,Luxembourg,andRomania;3.For2011,figuresexcludeAustria,Finland,HungaryandSlovakia
ThesecountriesareexcludedasnodatawasavailableinEurostatbasedon“NewAsylumApplicant”.Redrespresentsapplicationsover1000;Orangeover500;Yellowover250.GreenrepresentsFGM-riskcountriesoforiginwithover40girlsgrantedinternationalprotectioninEU-27
Table 5.3:NumberofGirlBeneficiariesofInternationalProtectionfromFGM-riskCountriesofOriginintheEU
0
150
200
250
300
350
400
450
500
50
100
28TOO MUCH PAIN - Female Genital Mutilation & Asylum in the European Union A Statistical Overview
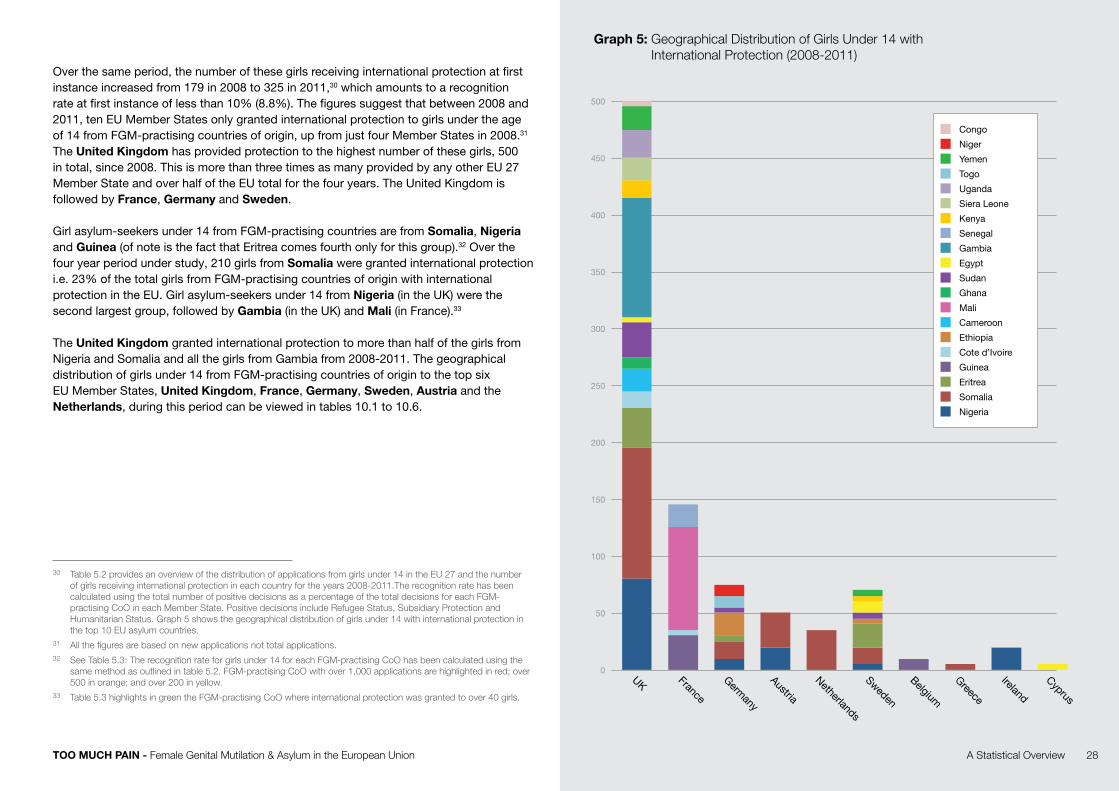
Over the same period, the number of these girls receiving international protection at first instance increased from 179 in 2008 to 325 in 2011,30 which amounts to a recognition rate at first instance of less than 10% (8.8%). The figures suggest that between 2008 and 2011, ten EU Member States only granted international protection to girls under the age of 14 from FGM-practising countries of origin, up from just four Member States in 2008.31 The United Kingdom has provided protection to the highest number of these girls, 500 in total, since 2008. This is more than three times as many provided by any other EU 27 Member State and over half of the EU total for the four years. The United Kingdom is followed by France, Germany and Sweden.
Girl asylum-seekers under 14 from FGM-practising countries are from Somalia, Nigeria and Guinea (of note is the fact that Eritrea comes fourth only for this group).32 Over the four year period under study, 210 girls from Somalia were granted international protection i.e. 23% of the total girls from FGM-practising countries of origin with international protection in the EU. Girl asylum-seekers under 14 from Nigeria (in the UK) were the second largest group, followed by Gambia (in the UK) and Mali (in France).33
The United Kingdom granted international protection to more than half of the girls from Nigeria and Somalia and all the girls from Gambia from 2008-2011. The geographical distribution of girls under 14 from FGM-practising countries of origin to the top six EU Member States, United Kingdom, France, Germany, Sweden, Austria and the Netherlands, during this period can be viewed in tables 10.1 to 10.6.
30 Table5.2providesanoverviewofthedistributionofapplicationsfromgirlsunder14intheEU27andthenumberofgirlsreceivinginternationalprotectionineachcountryfortheyears2008-2011.TherecognitionratehasbeencalculatedusingthetotalnumberofpositivedecisionsasapercentageofthetotaldecisionsforeachFGM-practisingCoOineachMemberState.PositivedecisionsincludeRefugeeStatus,SubsidiaryProtectionandHumanitarianStatus.Graph5showsthegeographicaldistributionofgirlsunder14withinternationalprotectioninthetop10EUasylumcountries.
31 Allthefiguresarebasedonnewapplicationsnottotalapplications.32 SeeTable5.3:Therecognitionrateforgirlsunder14foreachFGM-practisingCoOhasbeencalculatedusingthe
samemethodasoutlinedintable5.2.FGM-practisingCoOwithover1,000applicationsarehighlightedinred;over500inorange;andover200inyellow.
33 Table5.3highlightsingreentheFGM-practisingCoOwhereinternationalprotectionwasgrantedtoover40girls.
Belgium
Greece
Germany
Austria
France
UK Netherlands
Sweden
Ireland
Cyprus
Congo
Ghana
Uganda
Cote d’Ivoire
Yemen
Cameroon
Kenya
Eritrea
Egypt
Niger
Mali
Siera Leone
Guinea
Gambia
Nigeria
Togo
Ethiopia
Senegal
Somalia
Sudan
Graph 5:GeographicalDistributionofGirlsUnder14withInternationalProtection(2008-2011)

29TOO MUCH PAIN - Female Genital Mutilation & Asylum in the European Union A Statistical Overview
Some preliminary comments
The lack of disaggregated data in Eurostat between principle and secondary applicants unfortunately limits any in-depth analysis in this section. The questions as to whether child-sensitive asylum procedures gave these girls the opportunity to claim international protection on their own separate grounds, or whether FGM featured as a consideration when a Best Interest Assessment and/or Determination was carried out,34 or whether the determining authorities used a child-sensitive interpretation of the refugee definition and of serious harm will remain unanswered. This study though provides a platform for further discussions and exchanges on these important aspects of child asylum claims.
Female genital mutilation is a deeply entrenched tradition within communities and their social, economic and political structures. The pressure to subject girls to FGM comes from families and communities both in the countries of origin and in Europe. The practice itself is cross-border in nature, being performed in a variety of countries. In light of the current discussions within the EU regarding the need for comprehensive and integrated approaches for the abandonment of FGM, it was felt necessary for this statistical study to also look at the number of potentially intact refugee girls from FGM-practising countries who settle every year in communities throughout the EU.
Knowledge is currently not available on the (potential) changes of behaviour by members of the Diasporas from FGM-practising countries in the EU. Research is needed to better understand how FGM practices are affected by migration and exile, including forced displacement, and by contact with communities where FGM is not practised and considered a criminal act punishable by law.
As such, the set of data provided in this study does not purport to reach any conclusions. Its aim is merely to draw the attention of policy-makers to the number of refugee girls from FGM-practising countries living in communities in the EU whose rights, including the right to live intact from FGM, need to be factored in the policies and actions devised by the European Union and its Member States to prevent FGM. The tables in this section are also intended to support community-tailored and appropriate prevention and protection responses by providing more details regarding these refugee girls.
34 UNHCR,Field Handbook for the Implementation of UNHCR BID Guidelines,November2011,availableat:http://www.unhcr.org/refworld/docid/4e4a57d02.html:”Individualcaseworkwithchildrenatrisk,includingunaccompaniedandseparatedchildren,mustbebasedonanassessmentofprotectionneedswithrecommendationsforinterventionsandreferrals.UNHCR’sassessmenttoolforprotectionofindividualchildrenisreferredtoasaBestInterestsAssessment(BIA).ABIAisessentialbeforeanyactionaffectinganindividualchildofconcerntoUNHCRistaken,unlessaBIDisrequired.[…]Bestinterestsdetermination(BID)describestheformalprocesswithstrictproceduralsafeguardsdesignedtodeterminethechild’sbestinterestsforparticularlyimportantdecisionsthataffecthimorher”,pages7-8.
Table 5.4: UnitedKingdom
FGM-risk CoO 2008 2009 2010 2011
Nigeria 15 10 20 35
Somalia 45 20 25 25
Eritrea 10 5 10 10
Côte d'Ivoire 10 5
Cameroon 15 5
Congo 5
Ghana 5 5
Sudan 5 5 15 5
Egypt 5
Gambia 15 15 45 30
Kenya 5 5 5
Sierra Leone 5 5 10
Uganda 5 10 10
Yemen 5 10 5
TOTAL 135 70 150 145
Table 5.5: France
FGM-risk CoO 2008 2009 2010 2011
Guinea 15 15
Côte d'Ivoire 5
Mali 50 40
Senegal 10 10
TOTAL 0 0 75 70
Table 5.6: Germany
FGM-risk CoO 2008 2009 2010 2011
Nigeria 10
Somalia 10 5
Eritrea 5
Ethiopia 5 5 10
Sudan 5
Niger 5 5
Togo 5 5
TOTAL 20 10 15 30
Table 5.7:Sweden
FGM-risk CoO 2008 2009 2010 2011
Nigeria 5
Somalia 5 10
Eritrea 5 10 5
Ethiopia 5
Sudan 5
Egypt 5 5
Kenya 5
Yemen 5
TOTAL 5 25 20 20
Table 5.8: Austria
FGM-risk CoO 2008 2009 2010 2011
Nigeria 5 5 10
Somalia 5 10 15
TOTAL 10 15 25
Table 5.9: Netherlands
FGM-risk CoO 2008 2009 2010 2011
Somalia 5 5 25
TOTAL 5 5 25
GeographicalDistributionofRefugeeGirlsunder14intheTopSixEUMemberStates

30TOO MUCH PAIN - Female Genital Mutilation & Asylum in the European Union A Statistical Overview
6.HowmanyasylumclaimsrelatetoFGM?
In the absence of disaggregated data collected by the EU asylum authorities on the grounds for international protection in general, and FGM in particular, this section seeks to provide estimates of the number of asylum claims on FGM grounds the top destination asylum countries may handle every year.
Belgium has been gathering data on gender-based claims, including FGM, since 2008. Table 6.1 shows the number of FGM-based decisions. The study has therefore used this
unique data to try and approximate what the number of FGM-related claims could be in other EU Member States where that data is not collected.
Based on the number of FGM-related claims over the four year period under study, the study has averaged the four annual percentages of FGM-related decisions out of the total applications by female applicants from FGM-practising Countries of Origin.35 Using a process of extrapolation these percentages have been applied to the top 6 destination EU Member States for female applicants from FGM-practising countries to estimate the number of FGM-related claims that could have been handled by these Member States in 2011. These findings can be viewed in tables 6.2-6.7.36
Table 6.1: NumberofFGM-BasedDecisionsforFemalesinBelgium(2008-2011)
Year 2008 2009 2010 2011 4 Year Average (2008-2011)FGM-Risk CoO Nbr of Female
ApplicantsNbr of FGM-
based Decisions% of FGM-based decisions from
female applicants
Nbr of Female Applicants
Nbr of FGM-based Decisions
% of FGM-based decisions from
female applicants
Nbr of Female Applicants
Nbr of FGM-based Decisions
% of FGM-based decisions from
female applicants
Nbr of Female Applicants
Nbr of FGM-based Decisions
% of FGM-based decisions from
female applicants
Nigeria 20 1 5% 40 6 15% 35 5 14% 60 12 20% 14%
Somalia 40 5 13% 45 7 16% 80 6 8% 175 11 6% 10%
Guinea 215 103 48% 400 82 21% 525 104 20% 835 254 30% 30%
Cote d'Ivoire 20 5 25% 15 5 33% 45 5 11% 90 9 10% 20%
Cameroon 130 4 3% 120 6 5% 95 6 6% 150 6 4% 5%
Sudan 10 2 20% 15 6 40% 5 1 20% 20 6 30% 28%
Gambia 5 1 20% 5 1 20% 5 2 40% 5 4 80% 40%
Senegal 10 2 20% 20 4 20% 50 2 4% 50 10 20% 16%
Mauritania 10 6 60% 10 7 70% 25 2 8% 5 4 80% 55%
Burkina Faso 5 1 20% 10 2 20% 15 4 27% 20 3 15% 20%
Djibouti 10 1 10% 20 2 10% 25 3 12% 30 7 23% 14%
Kenya 25 4 16% 20 10 50% 30 10 33% 25 12 48% 37%
Niger 15 3 20% 20 4 20% 20 3 15% 20 2 10% 16%
Togo 35 2 6% 40 1 3% 45 7 16% 55 2 4% 7%
Sierra Leone 10 8 80% 15 6 40% 10 10 100% 20 5 25% 61%
Liberia 5 0 0% 10 3 30% 10 5 50% 10 7 70% 38%
Tanzania 15 1 7% 25 : : 15 3 20% 30 6 20% *16%
Uganda 5 1 20% 10 2 20% 10 1 10% 5 : : *17%
TOTAL 585 150 840 154 1,045 179 1,605 360 21%
*ForUgandaandTanzaniatheaverage%iscalculatedfor3yearsofdata
35 SeeTable6.1.Thesepercentages(markedinredinTable6.1)havebeencalculatedbyapplyingthenumberofFGM-baseddecisionsmadebyBelgiumtothetotalnumberoffemaleapplicantsreceivedfromeachFGM-practisingcountry.
36 Theestimateshavebeencalculatedbyapplyingthefour-yearaveragepercentagesofFGM-baseddecisionsinBelgium(markedinyellowontable6.1)tothenumberoffemaleapplicationsforeachFGM-practisingCoOinthesetop6EUMemberStates.Theestimatesarelimitedto18oftheFGM-practisingCoOduetotheconstraintofanaverageoverafouryearperiod.Wheredatawasonlyavailableforthreeyears(TanzaniaandUganda)thishasbeenmarkedinthetable.ThecoloursinTables6.2to6.7representtheFGM-practisingCoOwiththe3highestestimatesofFGM-baseddecisions.

31TOO MUCH PAIN - Female Genital Mutilation & Asylum in the European Union A Statistical Overview
The results based on this methodology seem to indicate that in 2011 France may potentially have handled an estimated 670 FGM-related claims, mostly by female applicants from Guinea, the largest number of such claims in the EU.37 Italy would come second with an estimated 375 FGM-related claims, the majority of these by females from Nigeria.38
Graph 6.8 provides an overview of the estimated number of FGM-related claims made as a proportion of the total number of female applications received from 18 FGM-practising countries of origin in the top 7 destination countries for this group of applicants in 2011. Using this methodology, Belgium would have the second highest percentage of FGM-related claims (after France) i.e. 22.4% of all decisions on applications from females from FGM-practising countries of origin, the majority of these being from Guinea. Third would be the United Kingdom with an estimated 364 decisions, mostly by female asylum-seekers from Gambia.
I dream of blood. It’s an abuse. I just want [my daughter] Aisha to be able to grow up stronger than I am. We have no choice about it in our country. I did not understand that I had rights until I came to the UK.
BinteJobe,Gambianasylum-seekerintheUK,whosuffersrecurrentinfections,sexualproblemsandpainasaresultofFGM,TheGuardian,6November2012.
37 Seetable6.2.38 SeeTable6.3.
Table 6.2: EstimatedNumberofFGM-BasedDecisionsinFrance
FGM-risk CoOTotal Nbr of Female
Applicants from FGM-risk Countries of Origin
% of FGM-based Decisions in Belgium
Estimated Nbr of FGM-based Decisions
Nigeria 445 14% 62
Somalia 170 10% 17
Guinea 860 30% 258
Côte d'Ivoire 580 20% 116
Cameroon 95 5% 5
Sudan 80 28% 22
Gambia 15 40% 6
Senegal 115 16% 18
Mauritania 220 55% 121
Burkina Faso 20 20% 4
Djibouti 15 14% 2
Kenya 10 37% 4
Liberia 10 38% 4
Niger 10 16% 2
Tanzania 0 16% 0
Togo 40 7% 3
Sierra Leone 40 61% 24
Uganda 10 17% 2
TOTAL 2,735 20% 670

32TOO MUCH PAIN - Female Genital Mutilation & Asylum in the European Union A Statistical Overview
Some preliminary comments
The EU asylum acquis requires States to take into account the gender dimension of claims when examining applications for asylum, in particular the individual background of the applicant which includes his or her gender when assessing the facts and circumstances of the application,39 as well as the gender-specific nature of acts of persecution,40 and the gender-related aspects of the reasons for persecution.41 As such, the identification of potential gender-specific elements in an asylum claim is an important and necessary step in the examination of applications.
The estimates of FGM-related claims in this section are unlikely to represent the actual numbers of such applications those six Member States actually handled in 2011. The estimates are calculated from a small sample of cases with the potential risk of distortion. Likewise, a variety of factors may also be relevant in this regard which cannot be taken into consideration in this statistical study, such as the differences between the profiles of cases received by different Member States. In addition, and unlike in Belgium, the FGM-related aspects of the claims may not have been investigated and considered in full and/or may have been discarded as irrelevant early in the examination of the case, and the claim finally decided on other grounds. As such, these estimates are intended as working tools rather than set figures. UNHCR hopes that these estimates will encourage Member States to collect data on FGM-related claims and/or decisions to provide the necessary evidence needed to better understand these complex and potentially large numbers of claims.
Table 6.3: EstimatedNumberofFGM-BasedDecisionsinItaly
FGM-risk CoOTotal Nbr of Female
Applicants from FGM-risk Countries of Origin
% of FGM-based Decisions in Belgium
Estimated Nbr of FGM-based Decisions
Nigeria 1,870 14% 262
Somalia 215 10% 22
Guinea 20 30% 6
Côte d'Ivoire 100 20% 20
Cameroon 35 5% 2
Sudan 60 28% 17
Gambia 5 40% 2
Senegal 35 16% 6
Mauritania 10 55% 6
Burkina Faso 10 20% 2
Djibouti 0 14% 0
Kenya 15 37% 6
Liberia 15 38% 6
Niger 20 16% 3
Tanzania 5 16% 1
Togo 10 7% 1
Sierra Leone 25 61% 15
Uganda 5 17% 1
TOTAL 2,455 375
39 EuropeanUnion:CounciloftheEuropeanUnion,Directive 2011/95/EU of the European Parliament and of the Council of 13 December 2011on standards for the qualification of third-country nationals or stateless persons as beneficiaries of international protection, for a uniform status for refugees or for persons eligible for subsidiary protection, and for the content of the protection granted (recast),hereinafterEUQualificationDirective(Recast),20December2011,OJL337;December2011,Art.4(2)and4(3),availableat:http://www.unhcr.org/refworld/docid/4f197df02.html
40 EUQualificationDirective(Recast),Art.9(2)(f).41 EUQualificationDirective(Recast),Art.10(1)(d).
I come from a village in Mali where excisions are always practised. My sister had a daughter and when the baby was not even 2 years old, she was mutilated. When I was four months’ pregnant and my doctor told me it was a little girl, I was scared for her and ran away to France. I didn’t want my daughter to undergo what they did to me when I was young.
Aissata,ayoungwomanfromMaliwhohasa2-year-olddaughter.

33TOO MUCH PAIN - Female Genital Mutilation & Asylum in the European Union A Statistical Overview
Asylum claims on FGM grounds are particularly complex and involve a growing variety of profiles at risk. In addition to the women and men activists persecuted for their opinions and commitment to end FGM in their countries of origin (political opinion) and/or their perceived threat to religious beliefs (religion), EU Member States have also been receiving claims from:
• girls and women who seek protection from FGM whether they come directly from FGM-practising countries or have lived most of their lives in the EU and face return at the time the claim is lodged;
• girls and women who have already been subjected to FGM and seek protection from re-excision for instance or infibulation, defibulation or reinfibulation, upon marriage or at child birth;
• girls and women who may suffer from a continuous form of harm and/or for whom there may be compelling reasons to seek protection arising from that past persecution;
• parents claiming international protection to protect their (baby) daughters from FGM;
• women who are under pressure from their families and communities but refuse to become excisers in light of the growing awareness generated by anti-FGM campaigns in countries of origin;
• women who had been subjected to FGM, have accessed reconstructive surgery (often while in the EU) and who fear being cut again upon return for instance at the time of marriage.
These claims often give rise to additional considerations involving fear linked to early and forced marriage and domestic violence. The UNHCR Guidance Note on Refugee Claims relating to Female Genital Mutilation provides guidance on the adjudication of these claims.42
42 UNHCR,GuidanceNoteonRefugeeClaimsrelatingtoFemaleGenitalMutilation,May2009,availableat:http://www.unhcr.org/refworld/docid/4a0c28492.html
Table 6.4: EstimatedNumberofFGM-BasedDecisionsintheUnitedKingdom
FGM-risk CoOTotal Nbr of Female
Applicants from FGM-risk Countries of Origin
% of FGM-based Decisions in Belgium
Estimated Nbr of FGM-based Decisions
Nigeria 545 14% 76
Somalia 325 10% 33
Guinea 30 30% 9
Côte d'Ivoire 65 20% 13
Cameroon 45 5% 2
Sudan 110 28% 31
Gambia 235 40% 94
Senegal 15 16% 2
Mauritania 0 55% 0
Burkina Faso 0 20% 0
Djibouti 0 14% 0
Kenya 75 37% 28
Liberia 10 38% 4
Niger 0 16% 0
Tanzania 25 16% 4
Togo 5 7% 0
Sierra Leone 65 61% 40
Uganda 165 17% 28
TOTAL 1,715 364

34TOO MUCH PAIN - Female Genital Mutilation & Asylum in the European Union A Statistical Overview
In the light of the not-so-negligible number of women and girls applicants from FGM-practising countries of origin and the potential hundreds of asylum claims on grounds of FGM every year in the EU, these estimates tend to indicate the need for guidelines to harmonize and support the practice of decision-makers in the asylum authorities of Member States when FGM-related issues are raised by applicants, and enhanced provision of information to applicants from FGM-practising countries or origin.
These estimates combined with the complexities, shame and stigma arising from FGM claims also point to the need for specific training to enhance the quality of the adjudication of gender-based claims in general and claims related to FGM in particular, and to capacitate interviewers with the skills necessary to create an environment conducive to disclosure.
These estimates would also tend to indicate the need for gender-sensitive and gender-specific Country of Origin Information (COI) to document the situation in the countries of origin of these women and girls generally speaking and more specifically the practice of FGM. Workshops of COI researchers could also help address the need for expertise and exchange of information on gender-sensitive COI.
On all the above three accounts, EASO, in its support to Member States, could play an important role to fill these gaps.
When international protection is granted to protect girls from FGM, the monitoring of the continued physical integrity of these girls through regular medical check-ups has sparked a debate on the need for protection- and child-sensitive operational approaches as well as greater legal clarity on the basis for such mandatory check-ups and what would happen should the girl be subjected to FGM. UNHCR hopes that this study will encourage the EU institutions, EU Member States and EASO to engage into much-needed information exchange, debate and policy clarification on this issue.
For asylum claims based on FGM, there is still much to be done to take into account the girls or women who flee their countries.
TeliwelDiallo,anti-FGMactivistinGuinea,refugeeinBelgium.
Table 6.5: EstimatedNumberofFGM-BasedDecisionsinSweden
FGM-risk CoOTotal Nbr of Female
Applicants from FGM-risk Countries of Origin
% of FGM-based Decisions in Belgium
Estimated Nbr of FGM-based Decisions
Nigeria 95 14% 13
Somalia 1,295 10% 130
Guinea 15 30% 5
Côte d'Ivoire 10 20% 2
Cameroon 15 5% 1
Sudan 30 28% 8
Gambia 10 40% 4
Senegal 0 16% 0
Mauritania 0 55% 0
Burkina Faso 0 20% 0
Djibouti 5 14% 1
Kenya 30 37% 11
Liberia 10 38% 4
Niger 0 16% 0
Tanzania 10 16% 2
Togo 0 7% 0
Sierra Leone 15 61% 9
Uganda 40 17% 7
TOTAL 1,580 196
35TOO MUCH PAIN - Female Genital Mutilation & Asylum in the European Union A Statistical Overview
Table 6.6: EstimatedNumberofFGM-BasedDecisionsinGermany
FGM-risk CoOTotal Nbr of Female
Applicants from FGM-risk Countries of Origin
% of FGM-based Decisions in Belgium
Estimated Nbr of FGM-based Decisions
Nigeria 295 14% 41
Somalia 335 10% 34
Guinea 65 30% 20
Côte d'Ivoire 25 20% 5
Cameroon 75 5% 4
Sudan 5 28% 1
Gambia 30 40% 12
Senegal 10 16% 2
Mauritania 0 55% 0
Burkina Faso 10 20% 2
Djibouti 0 14% 0
Kenya 120 37% 44
Liberia 0 38% 0
Niger 0 16% 0
Tanzania 0 16% 0
Togo 25 7% 2
Sierra Leone 20 61% 12
Uganda 30 17% 5
TOTAL 1,045 184
Table 6.7: EstimatedNumberofFGM-BasedDecisionsintheNetherlands
FGM-risk CoOTotal Nbr of Female
Applicants from FGM-risk Countries of Origin
% of FGM-based Decisions in Belgium
Estimated Nbr of FGM-based Decisions
Nigeria 45 14% 6
Somalia 625 10% 63
Guinea 120 30% 36
Côte d'Ivoire 25 20% 5
Cameroon 5 5% 0
Sudan 55 28% 15
Gambia 5 40% 2
Senegal 0 16% 0
Mauritania 0 55% 0
Burkina Faso 0 20% 0
Djibouti 0 14% 0
Kenya 0 37% 0
Liberia 5 38% 2
Niger 0 16% 0
Tanzania 5 16% 1
Togo 5 7% 0
Sierra Leone 55 61% 34
Uganda 55 17% 9
TOTAL 1,005 173

0
750
1,500
2,250
Graph 6.8:EstimatedProportionofFGM-relatedClaimstoTotalNumberofFemaleApplicantsfrom18FGM-riskCountriesinTop7AsylumEUMemberStates(2011)
250
1,000
1,750
2,500
500
1,250
2,000
2,750
3,000
36TOO MUCH PAIN - Female Genital Mutilation & Asylum in the European Union A Statistical Overview
Total Nbr of Female Applicants from FGM-risk Countries*
Estimated Nbr of FGM-related Claims
*Onlythetotalnumberoffemaleapplicationsfrom18FGM-riskCountriesiscalculatedasthesearethecountriesforwhichBelgiumhasmadedecisionsbasedonFGMfor3or4consecutiveyearsbetween2008-2011
*FGM-riskCountriesinclude:Nigeria,Somalia,Guniea,CôteD’Ivoire,Cameroon,Sudan,Gambia,Senegal,Mauritania,BurkinaFaso,Djibouti,Kenya,Liberia,Niger,Tanzania,Togo,SierraLeoneandUganda