feeding ecology of sharp-shinned hawks nesting in ... · the condor 96:4ss-467 0 the cooper...
TRANSCRIPT
The Condor 96:4SS-467 0 The Cooper Ornithological Society 1994
FEEDING ECOLOGY OF SHARP-SHINNED HAWKS NESTING IN DECIDUOUS AND CONIFEROUS FORESTS IN COLORADO’
!!kJZANNE M. Joy2 Department of Fishery and Wildlife Biology, Colorado State University, Fort Collins, CO 80523
RICHARD T. REYNOLDS Rocky Mountain Forest and Range Experiment Station, 240 West Prospect Road,
Fort Collins, CO 80526
RICHARD L. KNIGHT Department of Fishery and Wildbye Biology, Colorado State University, Fort Collins, CO 80523
RICHARD W. HOFFMAN Colorado Division of Wildlife, 317 West Prospect Road, Fort Collins, CO 80526
Abstract. Feeding ecology of 11 Sharp-skinned Hawk (Accipiter striates) pairs nesting in aspen (Populus tremuloides), conifer (Abies, Picea spp.), and mixed aspen-conifer habitats in southwest Colorado was investigated during 1988-1989. Small birds (x= 20.9 g, SE = 0.8 g) and mammals (X = 41.1 g, SE = 3.3 g) comprised 91 and 9% of 5 13 prey identified at nests that fledged at least one young, respectively. Sixty percent of the birds eaten during the hawks’ nestling and fledgling stages were nestlings or fledglings. Accordingly, median mass of birds eaten decreased from 17.4 g during incubation to 12.1 g during the nestling stage. Although more birds were consumed than mammals during all nesting stages (birds = 91 .I%; mammals = 8.9%), the proportion of birds relative to mammals in diets pro- gressively decreased from incubation through fledging. Taxa of birds in the diet were con- sumed in proportion to their occurrence in the most abundant of three different habitats surrounding nests, whereas some mammalian taxa were consumed in greater proportion than their relative “availability” in these habitats. This suggested that Sharp-shinned Hawks foraged opportunistically for birds, but may have selectively foraged for mammals. Differ- ences in the habits of mammals (e.g., fossorial vs. terrestrial behavior), and hence their relative availability, may explain the apparent selection for certain species of mammals by Sharp-shinned Hawks.
Key Words: Accipiter striatus; Sharp-shinned Hawk; diet; food habits; feeding ecology; aspen forest; comfer forest; Colorado.
INTRODUCTION
Sharp-shinned Hawks (Accipiter striatus) are small, forest-dwelling raptors that feed primarily on small birds (1 O-30 g) associated with forest canopies (Craighead and Craighead 1956, Storer 1966, Reynolds and Meslow 1984). In Colorado, Sharp-shinned Hawks breed in quaking aspen (Populus tremuloides) and conifer (Abies, Picea, Pseudotsuga) forests. Forests in which hunting Sharp-shinned Hawks have been observed in- clude mature aspen, conifer, and mixed aspen- conifer. Within mature aspen forests, however,
I Received 24 March 1993. Accepted 21 January 1994.
* Present address: Rocky Mountain Forest and Range Experiment Station, 240 West Prospect Road, Fort Collins, CO 80526
these hawks nest only in patches of conifers (S. M. Joy and R. T. Reynolds, pers. observ.).
Smith and MacMahon (198 1) demonstrated that avian species diversity and community composition differed among aspen, spruce, and fir forests in Utah and Idaho. If bird and mam- mal numbers differ among these forests in Col- orado and if Sharp-shinned Hawks forage op- portunistically, then diets of the hawks might reflect the relative abundance or availability of prey in forest types surrounding nests. Foraging opportunism would allow Sharp-shinned Hawks to use a variety of forest types in spite of different fauna1 communities, provided that sufficient food and nest sites were available.
We examined the diets of nesting Sharp- shinned Hawks in mature forests of aspen, co- nifer, and mixed aspen-conifer in Colorado dur- ing 1988-1989. We tested for differences in prey
[4551

456 SUZANNE M. JOY ET AL.
sizes and prey numbers among nesting pairs, among nesting stages, and between avian and mammalian prey. To evaluate the hypothesis that Sharp-shinned Hawks are opportunistic foragers, taxonomic composition and the size-frequency distribution of birds and mammals in Sharp- shinned Hawk diets were compared with esti- mates of relative abundances of birds and mam- mals in each of the three forest types.
STUDY AREA
The study was conducted on 28,750 ha of the Gunnison and Grand Mesa National Forests in west-central Colorado and included portions of Gunnison, Delta, and Mesa counties. Elevations ranged from 2,750-3,200 m. In western Colo- rado, aspen forests comprise as much as 25% of forested lands (Green and Van Hooser 1983). Within our study area, aspen existed as both seral and stable (contained no conifers) communities in small (< 10 ha) patches and extensive (> 500 ha) forests. In the study area, seral aspen patches and forests (often with emergent conifers in the aspen canopies) are successional to Englemann spruce (P. engelmannii) and subalpine fir (A. la- siocarpa), and at lower elevations blue spruce (P. pungens) (Langenheim 1962, Morgan 1969). Sit- uated within these aspen forests were small to large areas of pure, or nearly pure, conifer forests. As a result, forests on the study area were com- posed of a mosaic of large (> 500 ha), medium (200-500 ha), and small (~200 ha) patches of aspen, conifer, and mixed aspen-conifer forests. Throughout the study area, the majority (> 70%) of aspen forests were in mature (70-120 year) and old-growth (120 + year) age classes (Shep- perd 1990).
Vegetative composition of the understory in these forests varied with elevation, slope, aspect, and type of forest. Aspen and, to a lesser extent, mixed aspen-conifer had tall (> 1 m), well-de- veloped, herbaceous understories with a minor shrub component. Dominant forbs included but- terweed groundsel (Senecio serra), white gera- nium (Geranium richardsoniz), Barbey larkspur (Delphinium barbeyi), white-flowered peavine (Lathyrus leucanthus), and monkshood (Aconi- turn columbianum). Prominent low-growing plants included elk sedge (Carex geyeri), wild strawberry (Fraguria ovalis), yellow prairie violet (Viola nuttallii), and fringed brome (Bromus cil- iatus). The shrub component consisted of snow- berry (Symphoricarpos spp.), chokecherry (Pru-
nus virginiana), and mountain-mahogany (Cercocarpus montanus).
Conifer understories were sparsely vegetated and dominated by low-growing (< 1 m) herbs and shrubs including heart-leafed amica (Arnicu cordifolia), field horsetail (Equisetum arvense), elk sedge, myrtle blueberry (Vaccinium myrtil- lus) and kinnikinnik (Arctostuphylos uvu-ursi). Plant names follow Weber (1976). Sheep and cattle foraged freely in the study area during July and August.
METHODS
DIET DETERMINATION
Areas intensively searched for nests within the study area were identified from aerial photo- graphs (1:24,000) and topographic maps (7.5- min series) following Joy (1990) and included patches, as well as extensive areas, of aspen, co- nifer, and mixed aspen-conifer. Nest searches be- gan in May in both 1988 and 1989 and were conducted throughout the nesting season. Prey remains (feathers, bills, feet, fur, skull fragments, and regurgitated pellets) were collected from nest sites as least once every seven days, and as often as every two days. Four days prior to changes in nesting stage (incubation to nestling, nestling to fledgling), prey remains were collected every two days. Activities of pairs (food exchanges between males and females, prey handling, feeding at nests, and roosting behavior) were recorded from blinds near all nests. Areas of approximately 5 ha, cen- tered on nest trees, that contained prey-handling sites were thoroughly searched for prey remains during each visit to nests. Searches for prey re- mains often required l-3 hr/visit. Prey remains were collected from nest sites until fledged young dispersed or nests failed.
Prey remains were sorted by nest and collec- tion date. Avian remains (remiges, contour feathers, rectrices, feet, bills, and bones) were reconstructed and compared with National Mu- seum of Natural History (Washington, D.C.) specimens for identification and a minimum count of individuals was determined as described by Reynolds and Meslow (1984). Single feathers of a species were excluded. Mammalian remains (fur, feet, tails, skull fragments, and teeth) were identified in a similar manner at the U.S. Fish and Wildlife Service museum in Fort Collins, Colorado.
Diet determinations based on the collection of prey remains may not include all prey consumed

FEEDING ECOLOGY OF SHARP-SHINNED HAWKS 457
by Sharp-shinned Hawks. Potential biases are the omission of prey plucked away from nest sites, an over-representation of more colorful and conspicuous avian prey remains, under-repre- sentation of less conspicuous mammalian prey remains, and the underestimation (because of limited remains) of taxa such as reptiles, am- phibians, and arthropods (Reynolds and Meslow 1984, Bielefeldt et al. 1992). Although the extent of these biases in our study is unknown, we min- imized them by conducting exhaustive searches for prey remains and examining pellets for herp- tofauna. Furthermore, mammals and reptiles typically contribute less than 10% and 5% (by number) to Sharp-shinned Hawk diets, respec- tively (Craighead and Craighead 1956, Storer 1966, Snyder and Wiley 1976, Clarke 1984, Reynolds and Meslow 1984).
Adult body mass for each species was obtained from Hall (1946) Armstrong (1972) Dunning (1984), and museum specimens. Mass of prey identifiable only to genus was estimated as the mean mass of all local species in the genus. Mass of “unknown” birds was estimated as the mean mass of birds consumed in the study area.
Avian prey were classified as “adult” and “young” (nestlings and fledglings) by plumage and amount of epitrichium sheathing on flight and tail feathers. We assigned fledglings three- quarters of their adult mass and nestlings one- half adult mass. These estimates may have over- estimated the mass of altricial nestlings and fledglings and underestimated the masses of young precocial birds (Reynolds and Meslow 1984). We assumed that our estimates approx- imated the mean mass of young birds. We were unable to distinguish the age classes of mam- malian prey and thus assigned adult masses (Armstrong 1972, 1975) to all mammalian prey. The effect ofthis potential bias on total-diet anal- yses of prey mass should be small because mam- mals comprise less than 10% of Sharp-shinned Hawk diets (Craighead and Craighead 1956, Sto- rer 1966, Clarke 1984, Reynolds and Meslow 1984).
DIET COMPOSITION
Frequency of total prey (birds and mammals combined) in diets was compared among nesting pairs, among nesting stages, and between avian and mammalian classes using a maximum like- lihood log-linear model (MLLM) (CATMOD, SAS Inst. Inc. 1987). The same analysis (MLLM)
was used to compare, for avian prey only, diets among nesting pairs, among nesting stages, and between adult and young age classes. Differences in mean mass of total-prey (birds and mammals) among hawk pairs, among nesting stages, and between avian and mammalian prey were de- termined with general linear models (GLM) (GLM, SAS Inst. Inc. 1987). The same analysis (GLM) was used to examine differences in mean mass, for avian prey only, among pairs, among nesting stages, and between adult and young age- classes. Diets of pairs whose nests failed to pro- duce fledglings (n = 5) were excluded from the log-linear and general linear analyses to elimi- nate unbalanced cells from the tests. We tested the null hypotheses of no difference in (1) fre- quency of prey and (2) mass of prey among in- dependent effects (pairs, nesting stages, prey classes, and ages of birds in diets).
Differences in the frequency distribution of prey masses for (1) avian and (2) mammalian prey at all nests (n = 11) were tested among nesting stages using multi-response permutation procedure (MRPP; Mielke and Berry 1982, Biondini et al. 1988). When differences among frequency dis- tributions occurred, nonparametric pairwise test for equal variances (Moses’ rank-like procedure) (Hollander and Wolfe 1973) and tests of equal means and medians (Wilcoxon rank-sum test) (NPARlWAY, SAS Inst. Inc. 1987) were used to identify the source of the differences. All anal- yses (MLLM, GLM, MRPP) were evaluated at the (Y = 0.05 significance level and pairwise com- parisons at the cy = 0.05/3 = 0.017 (Bonferroni inequality) level.
PREY ABUNDANCE, FOREST TYPE, AND DIETS
Estimates of relative abundances of birds and small mammals during the period that we sam- pled Sharp-shinned Hawk diets (1988 and 1989) were available from 1987-1989 censuses on 15 plots (nine in aspen, three in conifer, three in mixed aspen-conifer forests) (R. T. Reynolds and D. M. Finch, unpubl. data). All of these census plots were within the Sharp-shinned Hawk study area: one Sharp-shinned Hawk nest occurred in- side a census plot, nine occurred within 620 m of plots, and one occurred within 3.1 km of a plot.
For our purposes we used estimates of the rel- ative abundances of bird species in the three for- est types that derived from raw counts of indi-

458 SUZANNE M. JOY ET AL.
viduals in 8-min circular variable plot censuses (Reynolds et al. 1980) at 15 stations (100-m spac- ing) in each plot. Stations in each of the 15 census plots were censused five times during June of each year (1988-l 989). All censuses occurred be- tween 05:30-12:30 MDT (D. M. Finch and R. T. Reynolds, pers. comm.).
Relative abundances of small mammals in each forest type were estimated by totaling the num- ber of individuals per species captured once (ex- cluding recaptures) during late-July to mid-Sep- tember, 1988-1989, in the 15 plots (R. T. Reynolds and D. M. Finch, pers. comm.). Mam- mal trapping grids (10 x 10 at 15-m spacing) were nested within the larger bird census grids and had one Sherman trap (7.6 cm x 8.9 cm x 23.0 cm) at each of loo-grid points per plot (100 Sherman traps/plot) and one circular pit-fall trap (160 cm depth, 130 cm dia.) at every-other grid point (25 pitfall traps/plot). Small mammal plots were live-trapped for one session of six consec- utive nights per year (750 trap nights/plot-’ year’ x 2 year = 22,500 total trap nights) (R. T. Reyn- olds and D. M. Finch, unpubl. data). We as- sumed that these abundance estimates approxi- mated the relative “availability” of birds and mammals to Sharp-shinned Hawks in the three forest types within our study area.
Forests within 2-km radii of each Sharp- shinned Hawk nest were classified as aspen (290% aspen trees in overstory), conifer (2 90% conifer trees in overstory), or mixed aspen-co- nifer (mixed stands with < 90% aspen and ~90% conifer trees in overstory) from aerial photo- graphs (1:24,000) taken in October 1978 when the color contrast between aspen and conifers was at a maximum. The 2-km radius was se- lected because 2 km is about half the nearest- neighbor distance between nests of this hawk (Reynolds and Wight 1978, Clarke 1984) and circles with this radius encompass all estimates of home-range size in this species (see review in Reynolds 1983). Around each nest, the three for- est types were assigned to one of three habitat- dominance categories (dominant, secondary, or limited) based on the proportion of the 2-km radius circle each forest type occupied. Forest types comprising 2 50% of the area around nests were considered “dominant”. “Secondary” hab- itats were defined as forest types occupying > 5% and ~50% of the area. Forest types comprising ~5% of the area were termed “limited”.
Program PREFER (Johnson 1980) was used
to examine whether birds or mammals in diets (n = 11 nests) reflected the relative abundance- by taxa (bird and mammal families) and size- class categories (after Storer 1966)-in the (1) dominant, (2) secondary, and (3) limited habitat- dominance categories surrounding nests. Null- hypotheses tested were that: 1) avian and 2) mammalian taxa were eaten in proportion to their abundance in each of the three habitat- dominance categories (dominant, secondary, and limited); and that 3) avian and 4) mammalian size-classes were eaten in proportion to their abundance in each of the three habitat-domi- nance categories. PREFER requires that the number of “preference components” (i.e., taxa and size-class categories) not exceed the number of “individuals” (i.e., nests) in tests (Johnson 1980). Thus, taxonomic categories of prey con- taining fewer than 2 individuals at all nests com- bined (families Scolopacidae, Trochilidae, Mim- idae, and Mustelidae) were omitted from analyses. Mammalian prey in size-class categories nine (166-216 g), eight (125-166 g), six (64-91.1 g), and two (8-l 5.6 g) (Storer 1966) were also omit- ted because they were not tallied in prey remains or during census counts. Diet and relative-abun- dance data were paired by year to eliminate dif- ferences in prey abundance between years. Wal- ler and Duncan’s (1969) multiple comparison procedure was used in PREFER to assess relative “preferences”.
Finally, we examined the overall pattern of food-resource use of nesting Sharp-shinned Hawks by comparing the hawks’ diets to the entire range of bird and mammal sizes that occurred in the study area.
RESULTS
Diets of 11 Sharp-shinned Hawk nesting pairs were determined, four nests during 1988 and sev- en nests during 1989. Ten (91%) nests were in small (1-14 ha), insular conifer patches sur- rounded primarily by aspen (n = 8) or mixed aspen-conifer (n = 2) forests, and one nest was within a large, contiguous conifer forest. Prey were collected from all nest sites during all nest- ing stages in 1988. In 1989, five of seven nests failed prior to fledging. Prey remains were col- lected from all seven nest sites during incubation, from four nest sites during the nestling stage, and two nest sites during the fledgling stage. A total of 686 prey items was identified (Appendix l), including 53 species (39 genera, 14 families) of

FEEDING ECOLOGY OF SHARP-SHINNED HAWKS 459
224
I I I I 1 2 3 4
NEST
56
-I-
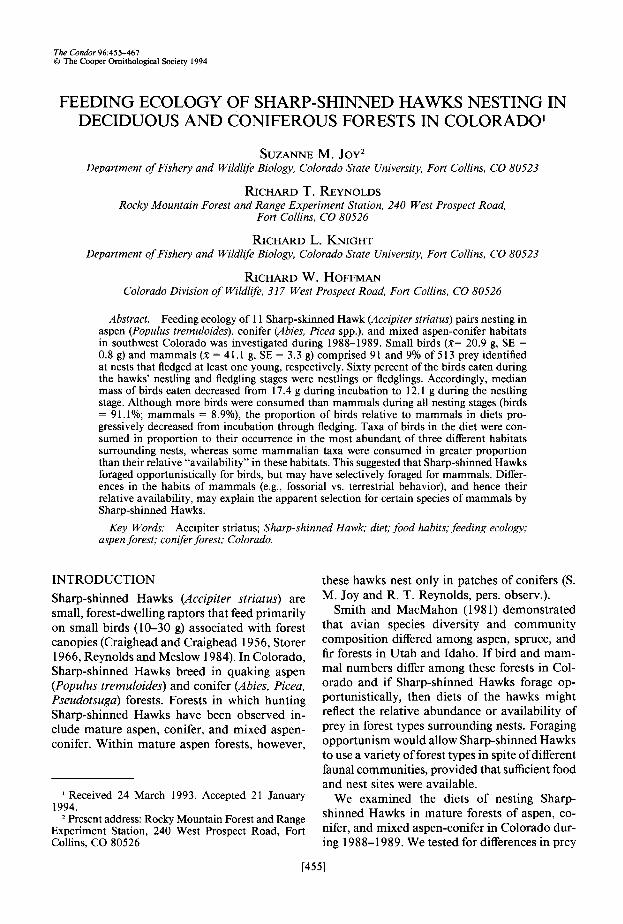
6
FIGURE 1. Proportion of total prey consumed during incubation, nestling and fledgling stages at six successful nests of Sharp-shinned Hawks in Colorado, 1988-1989. Numbers above columns are prey counted/nest.
birds and 10 species (nine genera, six families) of mammals.
DIET COMPOSITION
Prey Frequency. Mammals were consumed at 10 of 11 nests and birds were consumed at all nests. Of 686 total prey items, 513 were from the six successful nests. Birds comprised the largest (9 1.1%) portion of prey consumed at successful nests. The proportion of mammals consumed (overall = 8.9%) ranged from 1.8 to 11.8% for the five successful nests surrounded by aspen for- ests to 28.3% for the one successful nest sur- rounded by conifers. Although neither of the two nests surrounded by mixed aspen-conifer fledged young, the proportions of mammals consumed prior to nest failure were 4.3 and 6.7%. Yellow- rumped Warblers (Dendroica coronata) ap-
peared most often in the avian diet, followed by American Robins (Turdus migratorius), White- crowned Sparrows (Zonotrichia leucophrys), and Dark-eyed Juncos (Bunco hyemalis) (12.5, 8.3, 7.0, and 6.5% of 626 items consumed, respec- tively). Voles (Clethrionomys, Microtus, Phen- acomys) comprised over 60% (37 of 60) of the mammals eaten.
Numbers of total prey (birds and mammals) varied by nesting x and nesting stage interac- tively (Table 1); that is, more prey were collected during the nestling period at four of six nests (67%) than during other nesting stages (Fig. 1). Prey numbers also varied by prey class (birds vs. mammals) x nesting stage interactively (Table 1) that is, the proportion of mammals in the diet increased from 7.7 to 16.5% from incubation to fledging (Table 1, Fig. 2).

460 SUZANNE M. JOY ET AL.
TABLE 1. Maximum likelihood log-linear model for numbers of total prey (birds and mammals) and birds alone in diets of six pairs of nesting Sharp-shinned Hawks in Colorado, 1988-1989.
Source of variation df X' P
Total prey Pair 5 Nesting stagea 2 Pair x Nesting stage 10 Class (birds, mammals) 1 Pair x Class 5 Nesting stage x Class 2 Goodness of fit 10
Avian prey Pair 5 Nesting stage 2 Pair x Nesting stage 10 Age (adult, youngb) 1 Pair x Age 5 Nesting stage x Age 2 Goodness of fit 10
14.07 <O.OOl 4.50 0.105
37.01 <O.OOl 89.83 <O.OOl 25.02 <O.OOl 7.39 0.025 8.41 0.589
183.14 49.59 23.93 32.81 0.31
54.96 8.41
<O.OOl <O.OOl
0.008 <O.OOl
0.379 <O.OOl
0.838
a Incubation, nestling, and fledgling stages VledgIings and nestlmgs.
For avian prey alone, numbers of prey also varied interactively by nesting pair x nesting stage (as for total prey), and by nesting stage x age class (Table 1). That is, adult birds comprised a larger proportion (6 1%) of the avian diet than nestlings and fledglings (39%), but the number of adults collected declined seasonally, whereas that of nestlings and fledglings increased (Fig. 2).
Prey Mass. Mean mass of mammals consumed by the hawks was almost twice the mean mass of birds (mammals: it = 47, K ? SE = 41.1 k 3.3 g vs. birds: n = 466, K + SE = 20.9 f 0.8 g) (Table 2); in part due to assigning less than adult masses to young birds, but not to mam- mals. Over 54% of the total mammal biomass consumed was contributed by voles. Fifty per- cent of the total avian biomass consumed was comprised of Yellow-rumped Warblers, Amer- ican Robins, White-crowned Sparrows, and Dark- eyed Juncos. At individual nests, mean masses of birds and mammals eaten differed with nesting stage (Table 2, Fig. 3). This interaction demon- strated that, although the mean mass of mam- mals consumed was greater than birds, the dif- ference varied with hawk nesting stage (mammals were not consumed in all nesting stages) and in- dividual pairs (some pairs ate larger birds and/ or mammals). No difference was detected in mean avian-prey mass among hawk pairs, nesting stages, avian age-classes, or among interactions (nest X nesting stage, nest x age, nesting stage x age, or nest x nesting stage x age) (Table 2).
Prey-mass Distribution. The null hypothesis that the distribution of avian prey masses by nesting stage did not vary was rejected (P = 0.05 1). Pairwise tests revealed significant (P = 0.011) variation in the distribution of avian prey-sizes between incubation and nestling stages. There were no differences in measures of dispersion (distributional variance), or mean mass between
TABLE 2. General linear model analysis of variance for total prey (avian and mammalian) mass and avian mass alone in diets of six pairs of nesting Sharp-shinned Hawks in Colorado, 1988-1989.
Source of variation
Pair Nesting stage” Pair x Nesting stage Class (birds, mammals) Pair x Class Nesting stage x Class Pair x Class x Nesting stage
Pair Nesting stage Pair x Nesting stage Age (adult, youngb) Pair x Age Nesting stage x Age Pair x Nesting stage x Age
a Incubation, nestling, and fledgling stages. b Fledglings and nesthngs.
df ss
Total prey 5 1,342.OO 2 1,169.25
10 4,199.25 1 4,343.62 5 1,328.34 ; 1,054.51
3,993.V
Avian prey 5 3,033.24 2 151.46
10 4,828.30 1 171.18 5 1,022.71 2 341.03 8 4,356.OO
F P
0.87 0.500 1.90 0.151 1.36 0.195
14.09 <O.OOl 0.86 0.506 1.71 0.182 2.59 0.025
2.12 0.062 0.26 0.768 1.69 0.082 0.60 0.440 0.71 0.613 0.60 0.552 1.90 0.158


462 SUZANNE M. JOY ET AL.
II INCUBATION NESTLING 1 FLEDGLING
4 5 6
MAMMALS
NESTING PAIR
FIGURE 3. Mean body mass (vertical bar) and SE (vertical line) of birds and mammals consumed during incubation, nestling, and fledgling stages by six pairs of Sharp-shinned Hawks in Colorado, 1988-1989.
rex, n = 692; Tamias, n = 327; Thomomys, n = 29; Zapus, n = 37) tallied during the counts.
Birds were eaten in proportion to their relative size-frequency in dominant (P I 0.25) and sec- ondary (P = 0.172) habitat types, but proportions eaten differed (P = 0.037) from relative abun- dance in limited habitats. Bird taxa were con- sumed in proportion to their abundance in all habitats (0.15 5 P 5 0.25).
Sharp-shinned Hawks demonstrated “prefer- ence” among available prey-size classes and taxa of mammals (P 5 0.0 1 for all habitat categories). Dipodidae and Geomyidae were eaten more of- ten relative to their abundance, and Sciuridae and Soricidae were eaten less often in all habitat categories. Muridae occurred in diets in about the same proportion as its abundance in all hab- itat categories. Mammals in size-classes 4 (27.0- 42.9 g) and 7 (91.1-125 g) were consumed in greater proportion than their relative abundance; whereas mammals in size-class 1 (3.6-8.0 g) con- tributed a smaller proportion to the hawks’ diet than their relative abundance (Table 3).
Overall Sharp-shinned Hawks captured prey from only the smaller size classes (l-7) that were “available” in the forests of the study area (Fig.
5). Within the prey-size classes utilized, the hawks consumed prey-especially avian species-in approximate proportion to their overall relative abundance.
DISCUSSION
Patterns in prey-size use by Sharp-shinned Hawks in Colorado are similar to those reported for the species elsewhere; although a few mammals were captured, the hawks primarily consumed small birds (Craighead and Craighead 1956, Storer 1966, Clarke 1984, Reynolds and Meslow 1984). More prey were found at nests during the nestling period than during the incubation or fledgling stages. Changes in the number of prey consumed by nesting stage may reflect changing energetic demands of developing young or seasonal changes in abundance or availability of different prey spe- cies. Although birds were consumed more often than mammals during all nesting stages, the pro- portion of mammals in diets increased between incubation and fledgling stages. A reduction in the numbers of birds eaten during the fledgling stage, rather than an increase in the number of mammals eaten, was responsible for the in- creased proportion of mammals in the diet.

FEEDING ECOLOGY OF SHARP-SHINNED HAWKS
Although Sharp-shinned Hawks fed primarily on adult birds through the breeding season, the proportion of adult, fledgling, and nestling birds consumed changed with nesting stage. During incubation, diets consisted almost entirely of adult birds. During the hawks’ nestling stage, the pro- portion of nestling and fledgling birds in the diet increased fivefold, and remained high through the hawks’ fledgling period. This shift resulted in a decrease ofmedian prey size from incubation (17.4 g) to the nestling (12.1 g) stage. Further- more, the shift to small (young) prey was coun- tered by the increased number of prey captured during the nestling stage. The congruence of maximum energy requirements during the hawks’ nestling stage and the early summer flush of young nestling and fledgling birds has been noted else- where for Sharp-shinned Hawks and other ac- cipiters (Newton 1979, Geer 1982, Newton and Marquiss 1982, Clarke 1984).
Sharp-shinned Hawks appeared to forage op- portunistically for sizes and taxa of birds in dom- inant and secondary habitats. In limited (mostly conifer) habitats, diets differed from “availabil- ity” of bird sizes but not bird taxa, suggesting that the hawks foraged selectively for bird sizes in this habitat category or that bird “availability” among size classes differed between limited (conifer) and other habitats.
In each of the three habitat-dominance classes, some taxa and size classes of mammals were “preferentially” eaten. However, differences in capture probabilities among species of mammals during the census period may have biased the results of our preference analysis (e.g., Thorno- mys spp. were probably undersampled by the
463
DOMINANT SECONDARY LlMl! tu
HABITAT-DOMINANCE CATEGORIES
FIGURE 4. Number of nests and composition of for- est types surrounding 11 Sham-shinned Hawk nests in the dominant, secondary, and limited habitat-domi- nance categories in Colorado, 1988-1989. Dominant habitat types comprise 2 50%, secondary habitat types >5% and <50%, and limited habitat types ~5% of 2.0-km radius circles centered on nests (see text).
type of traps used). Differences between the use by Sharp-shinned Hawks and relative abundance of mammals (Fig. 5) suggested that the hawks either foraged for a limited range of mammalian sizes (hence species) or that there were differences in “availability” of mammals (e.g., the contrast-
TABLE 3. Ranking of size categories of mammalian prey consumed by Sharp-shinned Hawks in dominant, secondary, and limited habitats surrounding nests in Colorado, 1988-1989. Sizes and average difference between ranks (MRD) of use and relative abundance are listed from most to least used. Dominant forest types comprised 2 50% of foraging areas; secondary forest types comprised > 5% to < 50% of foraging areas; and limited forest types comprised 55% of foraging areas (see text). Size-class usage differed (P 5 0.01) from relative abundance in all habitats.
Dominant Secondary Limited
Mass (9) (size class’)
Mass (9) Mass (g) MRDb (size class) MRD (size class) MRD
91.1-125.0 (7) -1.05 27.0-42.9 (4) - 1.00 91.1-125.0 (7) -1.00 27.0-42.9 (4) -0.85 91.1-125.0 (7) -0.90 27.0-42.9 (4) -0.90 42.9-64.0 (5) -0.65 42.9-64.0 (5) -0.65 42.9-64.0 (5) -0.65 15.6-27.0 (3) 0.70 15.6-27.0 (3) 1.00 15.6-27.0 (3) 1.00 3.4-8.0 (1) 1.85 3.4-8.0 (1) 1.55 3.4-8.0 (1) 1.55
a Following Storer (1966). Sizes classes not counted during surveys were excluded. b Mean rank difference. Negative values indicate proportional use was greater than abundance; positive values indicate proportional use was less
than abundance.

464 SUZANNE M. JOY ET AL.
AVIAN PREY
0.5 0.9 1.3 1.7 2.1 2.5 2.9 3.3 3.7
25 -
MAMMALIAN PREY
0
0.5 0.9 1.3 1.7 2.1 2.5 2.9 3.3 3.7 4.1 4.5 4.9 5.3 5.7
LOG PREY WEIGHT (9)
FIGURE 5. Relative abundance of birds and mammals by size class and their relative frequency in diets of Sharp-shinned Hawks in aspen and conifer forests in Colorado, 1988-1989.
ing fossorial vs. terrestrial behavior of Geomyi- dae and Muridae).
Although aspen and mixed aspen-conifer hab- itats comprised the majority of dominant and secondary habitats surrounding nests, all Sharp- shinned Hawks nested in conifer trees. The sin- gular use of conifers, which have long and dense crowns, for nesting is probably related to a need for this small hawk to hide its nest from predators (Reynolds 1989).
ACKNOWLEDGMENTS
We are grateful to S. T. Bedard, S. C. Frye, M. L. Kralovek, B. L. Rusk, and S. E. Severs for their effort and company in the field. C. E. Braun, R. H. Hamre, R. M. King, D. G. Leslie, T. E. Remington, R. N. Rosenfield, B. Van Horne, G. C. White, and 2 anon- ymous reviewers provided helpful comments on the manuscript. B. S. Cade and G. C. White provided sta- tistical advice. For use of museum collections, we thank M. A. Bogan and C. A. Ramotnik of the U.S. Fish and Wildlife Service (USFWS) in Fort Collins, CO, and R.

FEEDING ECOLOGY OF SHARP-SHINNED HAWKS 465
C. Banks of the USFWS in Washington, DC. C. J. Dove, R. Layboume, and R. J. G’Hara kindly helped identify prey. This study was SuDDOtted bv the Colo- rado Division of Wildhfe (Colorado Federal Aid to Wildlife Restoration Project W-152-R and the Non- game Check-off Fund), Rocky Mountain Forest and Range Experiment Station, Laramie, WY, Hawk Mountain Sanctuary Association, and Colorado State University.
LITERATURE CITED
ARMSTRONG, D. M. 1972. Distribution of mammals in Colorado. Univ. of Kansas Printing Serv., Law- rence, KS.
ARMSTRONG, D. M. 1975. Rocky Mountain mam- mals. Rocky Mountain Nature Assoc., Inc., Estes Park, CO.
BIELEFELDT, J., R. N. ROSENRELD, AND J. M. PAPP. 1992. Unfounded assumptions about the diet of the Cooner’s Hawk. Condor 941427436.
BIONDINI M: E., P. W. MIELKE, AND E. F. REDENTE. 1988. Permutation techniques based on euclidean analysis spaces: a new and powerful statistical method for ecological research. Coenoses 3: 155- 174.
CLARKE, R. G. 1984. The Sharp-shinned Hawk (AC- cipiter striatus vieillot) in interior Alaska. M.Sc. thesis, Univ. of Alaska, Fairbanks, AK.
CRAIGHEAD. J. J.. AND F. C. CRAIGHEAD. JR. 1956. Hawks,‘owls, and wildlife. Stackpole Co. and Wildl. Manage. Inst., Harrisburg, PA and Washington, DC.
DUNNING, J. B., JR. 1984. Body masses of686 species of North American birds. Western Bird Banding Assoc. Monogr. 1, Cave Creek, AZ.
GEER, T. A. 1982. The selection of tits Paras SOP. by Sparrowhawks Accipiter nisus. Ibis 124: 159-l 67.
GREEN. A. W.. AND D. D. VAN HOOSER. 1983. Forest
LANGENHEIM, J. H. 1962. Vegetation and environ- mental patterns in the Crested Butte area, Gun- nison County, Colorado. Ecol. Manager. 32:249- 285.
MIELKE, P. W., AND K. J. BERRY. 1982. An extended class of permutation techniques for matched pairs. Commun. Statist. 11:1197-1207.
MORGAN, M. D. 1969. Ecology of aspen in Gunnison County, Colorado. Am. Midl. Nat. 82:204-228.
NEWTON, I. 1979. Population ecology of raptors. Bu- teo Books, Vermillion, SD.
NEWTON, I., AND M. MARQUISS. 1982. Food, pre- dation, and breeding season in Sparrowhawks (Ac- cipiter nisus). J. Zool., Lond. 197:22 l-240.
REYNOLDS, R. T. 1983. Management of western co- niferous forest habitat for nesting accipiter hawks. U.S. Dep. Agric., For. Serv. Gen. Tech. Rep. RM- 107. 7 pp.
REYNOLDS, R. T. 1989. The status of accipiter pop- ulations in the western United States, p. 92-101. In B. Pendleton, K. Steenhof, and M. N. Kockert [eds.], Proc. West. Raptor Manage. Symp. work-
c
shop. Natl. Wildl. Fed., Washington, DC. REYNOLDS, R. T., AND E. C. MESLOW. 1984. Parti-
tioning of food and niche characteristics of coex- isting Accipiter during breeding. Auk 101:761-779.
REYNOLDS, R. T., AND H. M. WIGHT. 1978. Distri- bution, density, and productivity of accipiter hawks breeding in Oregon. Wilson Bull. 90: 182-l 96.
REYNOLDS, R. T., J. M. Scorr, AND R. A. NUSSBAUM. 1980. A variable circular-plot method for esti- mating bird numbers. Condor 82:309-3 13.
SAS INSTITUTE, INC. 1987. SASSTAT guide for per- sonal computers, version 6 Ed. SAS Institute, Cary, NC.
SHEPPERD, W. D. 1990. A classification of quaking aspen in the central Rocky Mountains based on growth and stand characteristics. West. J. Appl. For. 5169-75.
resources’ofthe Rocky Mountain states. U.S. Dep. Agric., For. Serv. Resour. Bull. INT-33.
HALL, E. R. 1946. Mammals of Nevada. Univ. of California Press, Los Angeles.
HOLLANDER, M., AND D. A. WOLFE. 1973. Nonpara- metric statistical methods. John Wiley & Sons, New York.
JOHNSON, D. H. 1980. The comparison of usage and availability measurements for evaluating resource preference. Ecology 6:65-7 1.
JOY, S. M. 1990. Feeding ecology of Sharp-shinned Hawks and nest-site characteristics of accipiters in Colorado. M.Sc. thesis, Colorado State Univ., Fort Collins, CO.
SMITH, K. G., AND J. A. MACMAHON. 1981. Bird communities along a montane sere: community structure and energetics. Auk 98:8-28.
, SNYDER, N.F.R., AND J. W. WILEY. 1976. Sexual size dimorphism in hawks and owls of North America.
STORER, R. W. 1966. Sexual dimorphism and food
(
Omithol. Monogr. 20.
habits of three North American accipiters. Auk 83:4231136.
WALLER, R. A., AND D. B. DUNCAN. 1969. A Bayes rule for the symmetric multiple comparisons prob- lem. J. Am. Statist. Assoc. 64: 1484-1503.
WEBER, W. A. 1976. Rocky mountain flora. Colorado Assoc. Univ. Press, Boulder, CO.

466 SUZANNE M. JOY ET AL.
APPENDIX 1. Prey species at 11 Sharp-shinned Hawk nests in Colorado during 1988-1989.
Prey Adult ma@ Adult
(9) (n) Nestlingd
eo
Birds
Actitis ma&aria Selasphorus platycercus Sphyrapicus nuchalis Picoides pubescens P. villosus Picoides spp. Contopus sordid&s Empidonax hammondii E. oberholseri E. d@cilis Empidonax spp. Progne subis Tachycineta bicolor T. thalassina Parus atricapillus P. gambeli Parus spp. Sitta canadensis Certhia americana Salpinctes obsoletus Troglodytes aedon Regulus satrapa R. calendula Regulus spp. Siala mexicana S. curroides Myadestes townsendii Catharus ustulatus C. guttatus Catharus spp. Turdus migratorius Dumatella carolinensis Vireo solitarius V. gilvus V. olivaceus Vireo spp. Vermivora celata Dendroica petechia
D. coronata Dendroica spp. Oporornis tolmiei Wilsonia pusilla Piranga ludoviciana Pipilo chlorurus Aimophila spp. Spizella arborea S. passerina Pooecetes gramineus Passerculus sandwichensis Melospiza melodia M. lincolnii Zonotrichia leucophrys Junco hyemalis Unknown juvenile sparrow Agelaius phoeniceus
40.4 3.6
50.3 21.0 66.3 46.1 12.8 10.1 10.4 10.9 10.3e 49.4 20.1 14.2 10.8 10.8 10.8 9.8 8.4
16.5 10.9
6.2 6.1 6.4
28.1 29.6 34.0 30.8 31.0 30.9 71.3 36.9 16.6 12.0 16.1 15.1 9.0 9.8 bb 9.2 PP
12.1 10.8 10.4 6.9
28.1 29.4 19.1 20.1 12.3 25.7 20.1 20.8 11.4 25.5 19.6 21.1 41.5
2
: 6 2 1
13 10 6 4 2 1
16 8 5 9 2 1 3 1
23 3
11 2 2 1 1 1
10 5
21 1 6
14
1 2
: 39
1
: 6 5 1
1
6 5
26 35 25
3
2 1
(:,i 9 (3)
18 (2) 1
5
6 (1) 1
: (8) 2
15 (9)
14 (3)
:UI
4
3: (1)
5 1
(1)
: (1)
i(3) 12 (4)
t:,

FEEDING ECOLOGY OF SHARP-SHINNED HAWKS 467
APPENDIX. Continued.
Prey
Molothrus ater
Pinicola enucleator Carpodacus cassinii C. mexicanus Carduelis pinus Coccothraustes vespertinus Unknown juvenile bird
Mammals Sorex monticolus Tamias minimus Tamiasciurus hudsonicus Thomomys talpoides Peromyscus maniculatus Clethrionomys gapperi Phenacomys intermedius
6.89 2 3 46.1
225.3 94.Q 24.6 26.8 36.8
2 7 1
17 3
Mtcrotus montanus 45.3 2 M. longicaudus 46.8 5 Microtus spp. 46.1 10 Zapus princeps 23.8 7 Unknown mouse 24.2 1
Adult rna~s~.~ (9)
49.0 66 38.8 PP 56.4 26.5 21.4 14.6 59.4 22.1
Adult (n)
1 8 1 2 2
10 1
Prey age Fledgling‘
(n)
: (2) 1
10
2
Nestling’ (n)
a Bird masses are from Dunning (1984) and mammal masses are from Armstrong (1972) unless specified. b Fledglings with unsheathed remiges and partly sheathed rectrices were assigned an adult mass; fledglings with partly sheathed remiges and rectrices
were assigned 3/4 (adult mass); nestlings received l/2 (adult mass). E Birds with partially sheathed feathers. d Birds with fully sheathed rectrices and remiges. ( Mass = (E. hammondii mass + E. oberholseri mass)/2. ‘Numbers in parentheses are fledglings with unsheathed remiges (adult mass). g Hall (1946). h U.S. Fish and Wildlife Service museum specimen labels, Fort Collins, CO.