feeding dairy cows manual
TRANSCRIPT

7/22/2019 Feeding Dairy Cows Manual
http://slidepdf.com/reader/full/feeding-dairy-cows-manual 1/264
FeedingDairy Cows
A manual for use in the
Target 10 Nutrition Program
Edited by Joe Jacobs with Ann Hargreaves
Third Edition
Dairy Research and
DevelopmentCorporation
Department of
Natural Resourcesand Environment
United
Dairyfarmers ofVictoria

7/22/2019 Feeding Dairy Cows Manual
http://slidepdf.com/reader/full/feeding-dairy-cows-manual 2/264
FEEDING DAIRY COWS
prepared by the Target 10 Project
First published 1997
Second edition 1999
Third edition 2002
Published by the Department of Natural Resources and Environment
Victorian State Government, Melbourne, Victoria, Australia
ISBN 1 74106 240 3
Address all inquiries to:
Joe Jacobs
Department of Natural Resources and Environment
78 Henna Street
Warrnambool, Victoria, Australia 3280
Phone: 61 3 5561 9923
Fax: 61 3 5561 9988
email: [email protected]
Target 10 website: http://www.target10.com
© The State of Victoria, Department of Natural Resources and
Environment, 2002
All rights reserved. No part of this publication may be reproduced, stored
in a retrieval system, or transmitted in any form by any means whatsoever,
without the prior permission of the copyright owner. Apply in writing to
the publishers.
GENERAL DISCLAIMER
This publication may be of assistance to you, but the State of Victoria and
its employees do not guarantee that the publication is without flaw of any
kind or is wholly appropriate for your particular purposes and therefore
disclaims all liability for any error, loss or other consequence which may
arise from you relying on any information in this publication.
The Department of Natural Resources and Environment acknowledges
contributions made by private enterprise. Acceptance of these contributions
however, does not endorse or imply endorsement by the Department of
any product or service offered by the contributors.
ii
7/22/2019 Feeding Dairy Cows Manual
http://slidepdf.com/reader/full/feeding-dairy-cows-manual 3/264
Acknowledgments
This manual, Feeding Dairy Cows, is a resource manual foruse when Target 10 delivers its program on dairy cownutrition. The manual makes use of information frompreviously produced nutrition manuals:
Feeding Dairy Cows (1997), Target 10 Nutrition Program;editor G. Thomas
Dairy Cow Nutrition Manual (1997), third edition,Target 10; editors J. Leeman and P. Groves
Feeding Tasmanian Dairy Cows (1997), editorB. Fitzgerald.
Particular thanks go to Geoff Thomas, John Morton and John Moran for their additional contributions to thismanual; to Jo Crosby and the Target 10 Nutrition ProgramTeam; and to staff of the Institute of Land and FoodResources at the University of Melbourne.

7/22/2019 Feeding Dairy Cows Manual
http://slidepdf.com/reader/full/feeding-dairy-cows-manual 4/264
iv

7/22/2019 Feeding Dairy Cows Manual
http://slidepdf.com/reader/full/feeding-dairy-cows-manual 5/264
Foreword
Foreword
The Target 10 Project’soriginal objective was tofocus effort on achievingimproved farmprofitability throughincreased pastureconsumption. However,during extension in thisarea, it became apparentthat other issues of major
concern to farmers shouldbe addressed as well.
Julian Benson
Dairy cow nutrition, identified as one of these concerns, isnow a major component of the Target 10 three-year plan;and the Nutrition Program is being offered across theState.
The Target 10 Nutrition Program began in 1997. Itcomprises theory as well as practical on-farm problemsolving and, when necessary, one-to-one consultation.
The season since the program began has been verychallenging. People who completed the course would havebenefited greatly from the knowledge gained aboutbalancing diets, and basing purchase of feeds and forageson the nutritional value of the feeds, as well as beingreminded that pasture is still our cheapest and mostvaluable feed source.
Feeding dairy cows profitably is an issue of paramountimportance to all dairy farmers. The Target 10 NutritionProgram encourages farmers to maximise their pastureconsumption, and then to address feed gaps as efficientlyand effectively as possible by using supplements.
This revised manual documents the direction and thecontent of the Target 10 Nutrition Program. It aims toprovide a worthwhile source of information for farmers touse during their participation in the program. And when
the program is over, the manual will serve as a permanentsource of reference material.

7/22/2019 Feeding Dairy Cows Manual
http://slidepdf.com/reader/full/feeding-dairy-cows-manual 6/264
Foreword
The manual has been compiled by many people – stafffrom the Department of Natural Resources andEnvironment, the University of Melbourne, dairy and feedcompanies, and private veterinary practitioners. Theseindividuals from across industry sectors, in partnership,
will continue to deliver extension activities on this topic.
Pivotal to the development of the program has been theinput from the farmers who provided advice and guidanceon both the program and manual. I would like to thankthem all for their help.
To every one who attends the program, I hope that youwill find it is Information that works.
Julian BensonChairSouth West Target 10 Nutrition Working Group

7/22/2019 Feeding Dairy Cows Manual
http://slidepdf.com/reader/full/feeding-dairy-cows-manual 7/264
Getting Started in Cow Nutrition
This chapter. . . Introduces some basic concepts in the nutrition of dairycows and the terminology that you will encounterthroughout the manual.
The main points in this chapter. . .
• Cows are ruminants
• The stomach of the cow has four chambers, the largest
of which is the rumen
• Cows are well adapted to a herbage diet
• Cows need water, energy, protein, fibre, vitamins andminerals in their diet.

7/22/2019 Feeding Dairy Cows Manual
http://slidepdf.com/reader/full/feeding-dairy-cows-manual 8/264
What’s in Feeds?
This chapter explains. . . The important constituents of feed for dairy cows, how theconstituents are measured and their sources in the diet.
The main points in this chapter. . .
• Dry matter (DM %) is the feed remaining after all thewater has been removed. All other components of feedare expressed as a proportion of dry matter
• Digestibility (%) is the proportion of a feed which is notexcreted as manure. It is one indicator of feed quality
• Metabolisable energy (ME) is the energy available fromfeed and used by the cow for maintenance, activity,milk production, pregnancy and weight gain
• Crude protein (CP %) includes both true protein (madeup of amino acids) and non-protein nitrogen (NPN)which rumen microbes convert into protein.
• Neutral detergent fibre (% NDF) is a measure of dietaryfibre. It includes indigestible and digestible fibre.

7/22/2019 Feeding Dairy Cows Manual
http://slidepdf.com/reader/full/feeding-dairy-cows-manual 9/264
How the Rumen Works
The main points in this chapter. . .
• Cows rely on rumen microbes to convert feedcomponents into useable sources of energy and protein
• Fibre maintains gut movement and stimulatesrumination (chewing the cud)
• Speed of digestion depends on the size of feed particles,digestibility of feed and level of intake
• A healthy microbial population is essential for properrumen function and feed utilisation
• Growth and multiplication of microbes depends onrumen pH and the supply of energy and protein
• Rumen microbes ferment carbohydrates to makevolatile fatty acids (VFA) and gases
• VFAs are the major source of energy for the cow
• The amount of each VFA produced depends on the diet
• Milkfat test is affected by the relative amounts of thedifferent VFAs
• Rumen degradable protein (RDP) and non-proteinnitrogen (NPN) are broken down in the rumen to aminoacids and ammonia
• Rumen microbes use amino acids and ammonia to buildmore microbes
• Microbes are flushed out of the rumen and digested andabsorbed in the small intestine. This ‘microbial protein’supplies most of the cow’s protein
• Dietary protein not broken down in the rumen is alsodigested and absorbed in the small intestine
• Most fats are digested in the small intestine.

7/22/2019 Feeding Dairy Cows Manual
http://slidepdf.com/reader/full/feeding-dairy-cows-manual 10/264
Nutrient Requirements of Dairy Cows
This chapter explains. . . The specific nutritional needs of your cows and how tocalculate a cow’s energy requirements for its majormetabolic activities – maintenance, activity, milkproduction, pregnancy and gain in body condition.
The main points in this chapter. . .
• Energy requirements change according to cow size,activity, stage of pregnancy and level of milkproduction
• Protein requirements vary with stage of lactation andwhether milking or dry
• Microbial protein can sustain production of up to 12 Lper day. Up to this level of production, all protein in thediet can be rumen degradable protein (RDP). Beyondthis, undegradable protein (UDP) requirements rise as
production increases
• Good quality pasture contains both RDP and UDP.Cows grazing ryegrass/clover pasture and producingup to 30 L per day are unlikely to need supplementaryUDP
• The absolute minimum amount of fibre in the diet is 30per cent neutral detergent fibre (NDF). The minimumcrude fibre content is 17 per cent.
Later in the program you will need to refer to much of theinformation presented in this section. For ease of reference,this information has been tabulated in Appendix C.

7/22/2019 Feeding Dairy Cows Manual
http://slidepdf.com/reader/full/feeding-dairy-cows-manual 11/264
How Feed Requirements Change During Lactation
This chapter explains. . . The changes in energy requirements and intake capacity inearly lactation, as well as how to calculate a cow’s energyrequirements and decide what percentage of protein andfibre should be in the diet, when given details of her size,activity, stage of pregnancy and lactation, and change inliveweight.
The main point in this chapter. . .
• The partitioning of energy to milk production and bodycondition changes with the stage of lactation.

7/22/2019 Feeding Dairy Cows Manual
http://slidepdf.com/reader/full/feeding-dairy-cows-manual 12/264
Pasture Intake
This chapter explains. . . The factors that affect how much pasture a cow will eat,what is meant by pasture quality and how it changes withseason, species composition and maturity of the sward.
The main points in this chapter. . .
• Nutrient intake from pasture is affected by: the cow’sgrazing behaviour, the allocation of pasture, the qualityand palatability of pasture and the cow’s ability to graze
selectively
• When cows are offered more pasture, their intakeincreases but they utilise less of the available pasture.Each additional kilogram of dry matter intake requiresmore and more pasture to be offered
• Higher quality pastures allow greater intakes to beachieved as well as providing more nutrient perkilogram. Quality has a ‘multiplying’ effect on the cow’sconsumption of nutrients
• By grazing selectively, cows eat pasture with 3–4 percent more protein and 0.5–1.0 MJ/kg moremetabolisable energy than the average diet availablefrom a pasture. As pasture allocation increases, cowsbecome more selective.

7/22/2019 Feeding Dairy Cows Manual
http://slidepdf.com/reader/full/feeding-dairy-cows-manual 13/264
Best Use of Pastures
This chapter explains . . . How to allocate pasture and how to calculate the amountof feed provided by the allocated area.
The main points in this chapter. . .
• To optimise the quality, availability and regrowth ofpasture it is important to maintain a ‘pasture wedge’across the farm, where all pasture is in the range 1300–2200 kg DM/ha
• Pasture should be grazed at 2200 kg DM/ha (10–15 cmhigh)
• After grazing, 1300 kg DM/ha (3–4 cm high) shouldremain
• Length of the grazing rotation depends on the pastureallocation
• The area allocated depends on the growth rate ofpasture and must be adjusted when growth ratechanges
• This method of allocating pasture will maintain the‘pasture wedge’
• Constant monitoring of pasture growth is important foroptimising pasture growth and quality.

7/22/2019 Feeding Dairy Cows Manual
http://slidepdf.com/reader/full/feeding-dairy-cows-manual 14/264
Supplements
This chapter explains. . .Nutritional and practical issues to consider when choosinga supplement and details of the nutrient composition offeeds.
Whether to feed supplements, and which ones, are decidedon a seasonal basis (as part of annual feed planning) aswell as day-to-day (balancing feed demand against currentpasture growth and cover).
The main points in this chapter. . .
• Factors to consider when deciding on whichsupplements to use- What is the limiting nutrient in the diet?- Which supplements are available and what is their
nutrient composition?- What are the relative costs of supplements?- What are the practical considerations?- How will a supplement affect the balance of the
diet?
• Feeds can be classified as energy supplements, proteinsupplements, roughages (such as hay and silage) andfodder crops
• Tables of feed composition show the wide variation inenergy and protein content in feeds
• Estimates of nutrient supply in the diet are only as goodas the information available about theingredients of the diet.
• Practical considerations to take into account whenfeeding concentrates, turnips, hay and silage
• High supplement use may involve increased capitalinvestment, more exposure to fluctuations in the costof purchased feed and increased labour requirements.

7/22/2019 Feeding Dairy Cows Manual
http://slidepdf.com/reader/full/feeding-dairy-cows-manual 15/264
Effects of Supplements on Pasture Intake
This chapter explains . . .How to weigh up the benefits and costs of supplementaryfeeding.
The main points in this chapter. . .
• Pasture substitution is the decrease in pasture intakewhen cows are fed supplements.
- Substitution is greatest when cows have plenty ofhigh quality pasture and are also fed concentrates.
- There is less substitution when pasture intake islower
• Pasture monitoring can detect whether substitution iscausing a decline in pasture utilisation and thereforewhether supplements are being used effectively
• Supplements can affect milk production, cow conditionor pasture availability. The effect on milk production
may not be immediate
• Milk responses to supplementary feeding depend onstage of lactation, the amount and quality of pasture,amount and quality of supplement, cow condition, andlevel of production
• Supplement use is most profitable when it increases theutilisation of pasture
• Using supplements strategically when pasture supply islimited, may improve pasture utilisation by sustaining
herds that are large enough to make the most of periodsof pasture surplus
• Supplements can also be used to sustain longerlactations, increase cow production and improvepasture utilisation
• The profitability of supplementary feeding depends onthe cost of supplements and the benefits ofsupplementary feeding.- Feed planning is important, especially at higher
stocking rates.

7/22/2019 Feeding Dairy Cows Manual
http://slidepdf.com/reader/full/feeding-dairy-cows-manual 16/264
Formulating a Diet
This chapter explains . . .How to formulate a basic balanced diet that takes accountof production goals.
The main points in this chapter. . .
• Diet formulation involves matching the feed suppliedwith the specific requirements of the herd in the mostcost-effective way
• Diet formulation should be viewed in conjunction withpasture feed planning
• In order to provide the nutrients calculated as beingrequired, it is important to know how much feed a cowis capable of eating
• Intake capacity depends primarily on size and weight ofthe cow, digestibility of feed on offer and stage oflactation
• Supplements should be compared by comparing thecost of the nutrients they contain
• Unbalanced diets may lead to metabolic disorders.

7/22/2019 Feeding Dairy Cows Manual
http://slidepdf.com/reader/full/feeding-dairy-cows-manual 17/264
Diet and its Effect on Milk Production and Body Condition
This chapter explains: How level of feeding and composition of the diet affectvolume and composition of milk.
The main points in this chapter. . .
• Cows should be in at least condition score 5 when theycalve
• Because of their limited rumen capacity, cows in earlylactation require feed to be top quality
• High levels of feeding in early lactation will not makeup for poor condition at calving. It is import to feedcows well in early lactation approaching peak lactationand peak intake
• Cows put on condition more efficiently in late lactationwhen they are still milking, rather than when theyare dry
• Cows close to calving and in early lactation need highquality diets with adequate supplies of energy, proteinand fibre. It is important to avoid abrupt changes tothe diet
• Diet has considerable influence on the fat and proteincontent of milk, but relatively little effect on its lactosecontent
• Milkfat test falls when the diet is low in fibre
• High energy, starch-based diets increase lactoseproduction, milk volume and milk proteinproduction simultaneously.

7/22/2019 Feeding Dairy Cows Manual
http://slidepdf.com/reader/full/feeding-dairy-cows-manual 18/264
Nutrition and Fertility
This chapter explains . . .The impact of nutrition on the reproductive performanceof the dairy herd.
The main points in this chapter. . .
• How to calculate submission rate and conception rateand use them to describe a herd’s reproductiveperformance
• Nutrition is only one of many factors that affectreproduction
• The impact of the calving pattern on subsequentreproductive performance
• Low energy intakes in early lactation can delay the firstdetected heat and depress the rates of submission andconception
• Cows will inevitably be in negative energy balance inearly lactation, but good reproductive performancedepends on cows:- Calving in good condition (score 5 to 6)- Not suffering too severe a drop in appetite
after calving- Not losing too much condition in early lactation.

7/22/2019 Feeding Dairy Cows Manual
http://slidepdf.com/reader/full/feeding-dairy-cows-manual 19/264
Nutrition and Dairy Replacements
This chapter explains. . .The nutritional needs of heifers in the three phases of theirdevelopment – the milk-fed calf, the weaned calf and theyearling.
The main points in this chapter. . .
• A system of heifer rearing should produce healthyanimals that are able to grow to target liveweightwith minimum input costs
• It is essential that calves consume at least 4 litres of highquality colostrum in their first six hours of life. Calvesmust be hand-fed colostrum if they cannot suckle
• Calves should be fed to promote rumen development
• Calves can be weaned at six weeks if they are eating atleast 0.75 kg concentrates per day
• Calves cannot eat enough pasture to sustain goodgrowth rates. Pasture is not a suitable feed for milk-fedcalves and pasture-only diets should be avoided untilcalves reach 200 kg liveweight
• Good heifer growth rates are important for milkproduction and fertility and to minimise calvingdifficulties. Growth rate in Friesians after weaningshould average 0.7 kg/day
• Growth should be monitored regularly (preferably byweighing) to ensure that targets are being met
• Pasture should be top quality (at least 11 MJ/kg DM)if it is used as the sole food for heifers less than 12months of age
• Pasture should be supplemented with concentrateswhen heifer growth rate falls below 0.5 kg/day
• Heifers eating pasture-based diets are unlikely to beat risk of fatty udder syndrome.

7/22/2019 Feeding Dairy Cows Manual
http://slidepdf.com/reader/full/feeding-dairy-cows-manual 20/264
Contents
Contents
Acknowledgments..................................................................iii
Foreword ....................................................................................v
1. Introduction .......................................................................11.1 Aims of the Target 10 Nutrition Program..................... ... 2
1.2 Objectives of the Target 10 Nutrition Program...............2
1.3 Program outline...................................................................3
2. Getting Started in Cow Nutrition..................................52.1 Cows are ruminants ............................................................ 5
2.2 Nutrients dairy cows need ................................................. 52.2.1 Water............................................................................6
2.2.2 Energy..........................................................................6
2.2.3 Protein........... ............................................................... 6
2.2.4 Fibre................................................. ............................. 7
2.2.5 Vitamins and minerals............................................... 7
3. What’s in Feeds?................................................................93.1 Dry matter ................................................................. ........... 9
3.2 Energy .............................................................. ................... 11
3.2.1 How energy is measured ........................................ 12
Digestibility..........................................................12Metabolisable energy..........................................12
3.2.2 Types of energy ........................................................ 13
Carbohydrates ..................................................... 13
Soluble carbohydrates................................13
Storage carbohydrates ...............................13
Structural carbohydrates ........................... 13
Fats and oils ......................................................... 14
Protein................................................. .................. 14
3.2.3 Energy and milk production .................................. 15
3.3 Protein.................................................................................16
3.3.1 Types of protein.................................. ...................... 16
Crude protein ...................................................... 16
Non-protein nitrogen.......................................... 17
Rumen degradable protein................................17
Undegradable dietary protein...........................17
3.3.2 Measuring rumen degradable protein andundegradable protein............................................18
3.4 Fibre................ ................................................................ ..... 18
3.4.1 Types of fibre ............................................................ 19
Neutral detergent fibre.......................................19
Acid detergent fibre............................................19
Crude fibre ........................................................... 19
3.4.2 Measuring fibre ........................................................ 19
vii
7/22/2019 Feeding Dairy Cows Manual
http://slidepdf.com/reader/full/feeding-dairy-cows-manual 21/264
Contents
3.5 Vitamins and minerals......... ............................................. 20
3.5.1 Vitamins......................................... ............................ 20
3.5.2 Minerals.....................................................................20
3.6 Essential nutrients and sources summary .....................21
4. How the Rumen Works .................................................234.1 The digestive system......................................................... 23
4.1.1 The rumen and the reticulum.................................24
Saliva ........................................................... ......... 24
Chewing and rumination...................................24
Passage of food through the rumen .................25
4.1.2 Microbes of the rumen and reticulum...................25
4.1.3 Rate of digestion.......................................................26
4.1.4 Omasum .............................................................. ...... 27
4.1.5 Abomasum................................................................27
4.1.6 Small intestine...........................................................27
4.1.7 Large intestine .......................................................... 284.2 Carbohydrate digestion in the rumen ............................ 28
4.2.1 Structural carbohydrates.........................................29
4.2.2 Storage carbohydrates ............................................. 30
4.2.3 Soluble sugars...........................................................30
4.2.4 The products of carbohydrate digestion...............30
Volatile fatty acids ..............................................30
Acetate.................................... ...................... 31
Propionate ...................................................31
Butyrate........................................................32
Gas ....................................................... .................. 32
4.3 Digestion of protein .......................................................... 32
4.3.1 Microbial protein......................................................33
4.3.2 Dietary protein..........................................................34
4.4 Digestion of fats ................................................................. 34
5. Nutrient Requirements of Dairy Cows ......................375.1 Water...................................................................................37
5.2 Energy .............................................................. ................... 37
5.2.1 Maintenance..............................................................37
5.2.2 Energy needed for activity......................................37
5.2.3 Energy needed for pregnancy ................................ 38
5.2.4 Energy needed for milk production ...................... 38
5.2.5 Energy needed for body condition ........................ 40
5.2.6 Effect of climatic stress on energyrequirements...........................................................42
5.3 Protein.................................................................................43
5.3.1 How milk production affects requirementsfor rumen degradable protein andundegradable dietary protein .............................. 44
5.4 Fibre................. ............................................................... ..... 44
5.5 Vitamins and minerals.......... ............................................ 45
5.5.1 Vitamins......................................... ............................ 45
Vitamin A.............................................................45Vitamin D.............................................................46
viii

7/22/2019 Feeding Dairy Cows Manual
http://slidepdf.com/reader/full/feeding-dairy-cows-manual 22/264
Contents
Vitamin E.......................................... .................... 46
5.5.2 Minerals.....................................................................46
Essential macrominerals ....................................46
Essential microminerals ..................................... 46
6. How feed requirements change during lactation.............................................................................496.1 From calving to peak lactation ........................................ 49
6.2 Peak lactation to peak intake ........................................... 51
6.3 Mid-lactation to late lactation.......................................... 52
6.4 Dry period ................................................................. ........ 52
7. Pasture intake ..................................................................577.1 Factors affecting pasture quality ..................................... 57
7.1.1 Pasture species..........................................................58
7.1.2 Time of year and stage of maturity........................58
7.1.3 Pasture selection.......................................................62
7.2 Limitations of pasture....................................................... 63
7.2.1 Seasonal effects.........................................................63
7.2.2 Calving pattern.........................................................65
7.3 Factors affecting pasture intake................................ ....... 67
7.3.1 The ability to harvest pasture.................................68
7.3.2 Grazing time ............................................................. 68
7.3.3 Rate of biting.............................................................69
7.3.4 Intake per bite ........................................................... 69
Allowance............................................................. 69
Availability........................................ ................... 70
7.3.5 The effect of pasture quality ................................... 70Palatability ........................................................... 70
Seasonal effects....................................................71
7.4 Getting the best from pasture ..........................................71
7.4.1 Characteristics of a good pasture...........................71
7.4.2 Dealing with dung patches.....................................72
7.4.3 Height of grazing ..................................................... 72
8. Best use of pastures ........................................................738.1 Principles behind pasture utilisation.............................. 73
8.1.1 Allow the pasture to grow well.............................. 73
‘Pasture wedge’ ................................................... 73Allocating pasture...............................................74
8.2 Essential tools for pasture allocation .............................. 74
8.2.1 Pasture growth rates................................................74
8.2.2 Available pasture ..................................................... 74
8.3 Calculating the correct allocation.................................... 75
8.4 How well does allocated pasture meet cowrequirements?................................................. .................... 76
8.5 Practical implications........................................................ 77
8.5.1 When pasture does not meet cowrequirements...........................................................77
Too little pasture ................................................. 77Too much pasture ............................................... 77
ix

7/22/2019 Feeding Dairy Cows Manual
http://slidepdf.com/reader/full/feeding-dairy-cows-manual 23/264

7/22/2019 Feeding Dairy Cows Manual
http://slidepdf.com/reader/full/feeding-dairy-cows-manual 24/264
Contents
11.4 Costs of supplements ...................................................... 119
11.4.1 Things to remember when buying orproducing a feed .................................................. 120
11.4.2 Other considerations when costingsupplements.................................... ...................... 122
11.5 Consequences of unbalanced diets ............................... 12211.5.1 Rumination........................................... ................. 122
11.5.2 Loose manure................................................... ..... 123
11.5.3 Low fat test..................................................... ....... 123
11.5.4 Low protein test....................................................123
11.6 Metabolic disorders and unbalanced diets .................. 124
11.6.1 Milk fever ...................................................... ........ 124
DCAB – dietary cation-anion balance ............ 125
How can dietary cation-anion balance bemanaged?................................................ 125
11.6.2 Grass tetany...........................................................126
11.6.3 Ketosis, or acetonaemia.......................................12711.6.4 Lactic acidosis ....................................................... 127
11.7 Buffers ..................................................... .......................... 128
11.8 Other feed additives.................................... .................... 129
12. Diet and its effect on milk production and bodycondition.........................................................................13112.1 Products of digestion ...................................................... 131
12.2 Fate of the products of digestion................................... 131
12.3 Milk production in the udder ........................................ 132
12.3.1 What is milk? ........................................................ 132
12.3.2 Lactose production in the udder........................13312.3.3 Milkfat production in the udder ........................ 133
12.3.4 Protein production in the udder ........................ 134
12.4 Milk production and body condition ........................... 135
12.4.1 Body condition in early lactation....................... 137
12.4.2 Body condition in late lactation and inthe dry period.......................................................138
12.4.3 Summary of milk production and bodycondition ............................................................... 138
13. Nutrition and fertility ..................................................14313.1 Describing reproductive performance .........................143
13.1.1 Submission and conception rates........... ............ 144
Submission rate ................................................. 144
Conception rate ................................................. 145
Which inseminations resulted inpregnancy?........................................ ...... 146
13.2 Non-nutritional factors that can affect reproductiveperformance ..................................................................... 146
13.3 Herd calving pattern....................................................... 147
13.4 Effects of nutrition on the reproductive performanceof dairy cows....................................................................149
13.4.1 Energy....................................................................149
Effects of energy intake on submission rate.. 149
Effects of energy intake on conception rates.152
xi

7/22/2019 Feeding Dairy Cows Manual
http://slidepdf.com/reader/full/feeding-dairy-cows-manual 25/264
Contents
Other effects of energy intake onconception rates .....................................153
Some implications for management...............153
Management in late lactation..................153
Dry cow management..............................153
Management during the transitionperiod..............................................153
Minimise condition loss after calving....154
Monitoring changes in condition score .154
13.4.2 Protein............ ........................................................ 154
Excess protein .................................................... 154
Current views on excess protein ............155
Protein deficiency..............................................156
13.4.3 Minerals, trace elements and vitamins..............157
Calcium................................................ ............... 157
Magnesium ........................................................157
Phosphorus ........................................................ 157Selenium.............................................................158
Detecting deficiencies.......................................158
14. Nutrition and dairy replacements .............................15914.1 Rearing the milk-fed calf ................................................ 159
14.1.1 Colostrum feeding................................................160
14.1.2 Early rumen development .................................. 161
14.2 A successful early weaning recipe for calfrearing ............................................................... ................ 161
14.2.1 Criteria for successful calf-rearing
systems ........................................................... ....... 16314.3 Management of weaned replacement heifers.............. 164
14.3.1 Fertility................................. .................................. 165
14.3.2 Milk production.................................................... 165
14.3.3 Heifer wastage......................................................166
14.4 Critical period for udder development ........................ 166
14.5 Targets for replacement heifers ..................................... 167
14.5.1 Live weight............................... ............................. 167
14.5.2 Wither height ........................................................ 168
14.6 Energy and protein requirements for heifers .............. 168
14.7 Feeding heifers to achieve target liveweights .............169
14.7.1 Grazed pasture feeding ....................................... 16914.7.2 Feeding supplementary grain ............................ 170
14.8 Introducing replacement heifers to the herd ............... 170
14.9 Agisting heifers off farm ................................................ 171
14.10 Economic benefits from well-grown heifers................ 172
15. Case Study......................................................................175
Glossary and abbreviations................................................177
References and suggested further reading......................187
AppendicesA Answers to the Exercises .............................................191
xii

7/22/2019 Feeding Dairy Cows Manual
http://slidepdf.com/reader/full/feeding-dairy-cows-manual 26/264
Contents
B Vitamins and Minerals Required by DairyCows ............................................................................... 205
C Data Tables.....................................................................209
D Feed Values ....................................................................215
E Dry Matter Content of Hay and Silage Bales ..........219
F Copies of Worksheets used in the Manual..............221
Figures
2.1: The major components of feed................................................... 6
3.1: Dry matter and moisture content of some typical feeds ........ 9
3.2: The flow and partitioning of dietary energy throughthe cow .................................................................... .................... 11
3.3: The components of crude protein................................... ......... 17
3.4: Forage analysis showing the difference in definitions ofcrude fibre, ADF and NDF ....................................................... 20
4.1: Digestive system of the dairy cow........................................... 23
4.2: Relationship between digestibility and rate of digestion..... 29
4.3: Digestion of carbohydrates, and production andabsorption of volatile fatty acids in the dairy cow................ 31
4.4: Breakdown and partitioning of dietary and microbialprotein sources in the dairy cow.............................................. 33
6.1: Dry matter intake, milk yield and liveweight changesin a cow during the lactation cycle..........................................50
7.1: Seasonal variation in the energy and crude proteincontent of ryegrass and white clover in Gippsland .............. 59
7.2: Seasonal variation in the energy and crude proteincontent of ryegrass and white clover in northern Victoria ..60
7.3: Seasonal variation in the energy and crude proteincontent of ryegrass and white clover in western Victoria....61
7.4: Growth rate of ryegrass/white clover pasture inGippsland and feed requirements at different stockingrates throughout the year ......................................................... 64
7.5: Growth rate of ryegrass/white clover pasture in northernVictoria and feed requirements at different stocking ratesthroughout the year............................................................. ...... 64
7.6: Growth rate of ryegrass/white clover pasture in western
Victoria and feed requirements at different stocking ratesthroughout the year............................................................. ...... 65
7.7: Growth of ryegrass/white clover pasture in Gippslandand feed requirements of herds calving in spring orautumn .............................................................. .......................... 66
7.8: Growth of ryegrass/white clover pasture in northernVictoria and feed requirements of herds calving in springor autumn................................................................ .................... 66
7.9: Growth of ryegrass/white clover pasture in westernVictoria and feed requirements of herds calving in springor autumn................................................................ .................... 67
9.1: Typical changes in nutritive value of silage as pasturematures........................................................... ............................. 94
xiii

7/22/2019 Feeding Dairy Cows Manual
http://slidepdf.com/reader/full/feeding-dairy-cows-manual 27/264
Contents
10.1: Some of the factors which influence the responses ofdairy cows to supplementary feeding .................................... 99
12.1: Nutrient flow from diet, through the rumen, to blood, andto the udder or to body condition..........................................132
12.2: Changes in partitioning of nutrients over a lactation
period.............................................................. ........................... 13613.1: Changes in energy balance in early and mid-
lactation.....................................................................................151
Tables
3.1: The approximate dry matter and moisture content ofsome typical feeds....................... ............................................... 10
3.2: Cows fed diets of different energy density and producingat two levels of milk production: amounts of dry matterrequired daily.............................................................................15
3.3: Categories used to assess ability of feeds to supplyundegradable dietary protein (UDP)......................................18
3.4: Sources and units of measurement of nutrients essentialin the diet of dairy cows............................................................ 21
5.1: Energy requirements for maintenance.................................... 38
5.2: Average daily energy requirements in the last fourmonths of pregnancy......... ........................................................ 38
5.3: Energy needed per litre of milk of varying composition ..... 39
5.4: The weight of one condition score on cows of differentsizes..............................................................................................40
5.5: The energy a kilogram of body weight or condition needsor releases.................... ................................................................ 41
5.6: Crude protein needs of a cow at different production
levels ............................................................... ............................. 435.7: The absolute minimum percentage of fibre needed in a
cow’s diet for healthy rumen function (using threedifferent measures of fibre) ...................................................... 44
6.1: Dry matter intake needed by cows producing at twolevels of milk production and fed diets of differentenergy density............................................................................51
6.2: Effect of feeding levels after calving on milk production,live weight gain and fertility in the first 20 weeks oflactation.......................................................................................51
7.1: The energy and protein contents of pastures of differingquality..........................................................................................57
7.2: Nutritive value of individual pasture species ....................... 58
7.3: Energy and protein levels typical of paspalum-dominantpasture.......................................................... ............................... 62
9.1: Categories used to assess feeds in terms of their abilityto supply UDP...................................................................... ...... 82
9.2: Nutritive value of some common energy-richsupplements............................................... ................................. 83
9.3: Nutritive value of some common protein-richsupplements............................................... ................................. 87
9.4: Nutritive value of some conserved forages ........................... 92
9.5: Quality of conserved pasture hay and silage fromwestern Victoria ......................................................................... 93
9.6: Nutritive value of some commonly grown fodder crops..... 95
xiv

7/22/2019 Feeding Dairy Cows Manual
http://slidepdf.com/reader/full/feeding-dairy-cows-manual 28/264
Contents
10.1: The effect of stocking rate and supplement feedingon pasture intakes and milk yield in early lactation...........101
11.1: Estimates of feed analyses ...................................................... 112
11.2: Maximum daily intake of cows as affected by the NDFper cent of the diet ................................................................... 118
11.3: Buffers and additives used in high grain diets...... .............. 12913.1 Effect of late calving on subsequent conception rates
to first service ........................................................ ................... 148
13.2: Effect of condition score at calving and post calvingfeeding on days from calving to first detected heat............149
13.3: Effect of pre-mating heats on first service conceptionrates............. ........................................................... .................... 152
14.1: Costs of dry matter and energy in calf feeds ....................... 164
14.2: Traditional and revised target weights for Jersey andFriesian heifers at different ages............................................167
14.3: Energy and protein requirements for growing heifers....... 169
Exercises3.1 How much dry matter is in a feed? ......................................... 10
3.2 Energy intake from various feeds............................................ 14
3.3: Energy content of feeds and milk production ....................... 16
5.1: Calculate the daily energy requirements of these cows ....... 42
6.1: Calculate the minimum requirements of these cows............ 53
8.1: Use the pasture allocation formula to calculate the dailygrazing allocation for your farm throughout the year ......... 75
8.2 Develop a simple feed plan ...................................................... 79
9.1: Use your knowledge of the nutritive value of feeds and
minimum cow requirements to rank these feeds andidentify which would meet the minimum requirementsof the specified cow ................................................................... 97
11.1: Calculate the requirements of cows in this herd ................. 109
11.2: Determine the nutritive value of the usual diet................... 111
11.3: Revise the diet to account for pasture maturity .................. 114
11.4: Do the diets meet cows’ requirements? ................................ 116
11.5: Can cows physically eat that much feed?............................. 118
11.6: Calculate cost of the nutrients in these feeds ....................... 120
12.1: How do milk production and body condition changewhen diet changes?................................ .................................. 139
12.2: What is the value of a certain type of milk? ......................... 14014.1: Calculating the costs of your own calf feeds........................ 164
xv

7/22/2019 Feeding Dairy Cows Manual
http://slidepdf.com/reader/full/feeding-dairy-cows-manual 29/264
Contents
xvi
7/22/2019 Feeding Dairy Cows Manual
http://slidepdf.com/reader/full/feeding-dairy-cows-manual 30/264

7/22/2019 Feeding Dairy Cows Manual
http://slidepdf.com/reader/full/feeding-dairy-cows-manual 31/264
Chapter 1. Introduction
Pasture generally makes up 70 per cent or more of cows’diet, so the challenge is to understand and manage thisvariation in pasture and to be able to balance the cows’ dietwith other suitable feeds.
1.1 Aims of the Target 10 Nutrition Program
At the end of this program, you will be able to calculateand provide your dairy herds with cost-effective feeds thatmatch your farming system and plans.
Formulation of diets will be based on using pastures first,then supplements.
Extension will reinforce understanding of dairy cownutritive requirements, the benefits and drawbacks ofvarious feed components as well as the calculation ofoptimal diet balance.
These goals were negotiated with Target 10 farmercommittees working on the development of the NutritionProgram.
1.2 Objectives of the Target 10 Nutrition Program
By the end of this program, you will:
• Understand the nutritional requirements of cows and beable to express them in terms of energy, protein andfibre
• Be able to compare feeds on the basis of their nutritivevalue
• Understand more about the impact of nutrition on milk
production, health and reproduction
• Be able to check whether a diet is balanced in terms ofenergy, protein and fibre
• Have an understanding of how pasture and feedsupplements interact, including the factors that affectresponses to supplements and how they determine theprofitability of supplementary feeding.
This program involves both theory and practical on-farm
problem solving.
2

7/22/2019 Feeding Dairy Cows Manual
http://slidepdf.com/reader/full/feeding-dairy-cows-manual 32/264
Chapter 1. Introduction
One-to-one advice is also available to participants in theTarget 10 Nutrition Program.
1.3 Program Outline
The program will cover:
• Key points in cow nutrition
• What is in feeds
• Rumen function
• Feed requirements of the cow
• Nutrient intake from grazed pastures
• The effect of supplement use on pasture intake
• Formulating a diet
• The effect of diet on production and body condition
• Nutrition and reproduction
• Nutrition and dairy replacements
• Case studies.
3

7/22/2019 Feeding Dairy Cows Manual
http://slidepdf.com/reader/full/feeding-dairy-cows-manual 33/264
Chapter 1. Introduction
4
7/22/2019 Feeding Dairy Cows Manual
http://slidepdf.com/reader/full/feeding-dairy-cows-manual 34/264
Chapter 2. Getting Started in Cow Nutrition
2. Getting Started in Cow Nutrition
2.1 Cows are ruminants
Cows are herbivores and have a digestive system that iswell adapted to a herbage-based diet. Cows belong to agroup of mammals known as ruminants. Ruminants havea complex digestive system which is characterised by afour-chambered stomach. The largest of these chambers isthe rumen.
The gastro-intestinal system of ruminants enables them todigest plant material in a way that non-ruminantmammals with single stomachs, such as pigs, dogs orhumans, cannot.
The rumen contains large numbers and many types ofmicro-organisms (often referred to as microbes). Thesemicrobes feed on plant material eaten by the cow andproduce end products that are made use of by the cow,and also by the microbes for their own multiplication and
cell growth.
The microbes themselves are digested further along thedigestive tract.
The nature of the cow’s digestive system largelydetermines which components of her diet are important.
The purpose of dairy cows is milk production, so their dietmust allow them to fulfil the functions of lactating, and ofreproducing annually.
2.2 Nutrients dairy cows need
The nutrients required by dairy cows are water, energy,protein, fibre, vitamins and minerals. These requirementslargely determine how we think about the composition oftheir feed.
Feed contains both water and dry matter. The dry matter
component of the diet is the part which contains the
5

7/22/2019 Feeding Dairy Cows Manual
http://slidepdf.com/reader/full/feeding-dairy-cows-manual 35/264
Chapter 2. Getting Started in Cow Nutrition
necessary energy, protein, fibre, minerals and vitamins.The components of the feed are outlined in Figure 2.1.
Feed
Ó Ô
Water Dry matter
Ó Ð Ð Ð Ô
Energy Protein Fibre Vitamins Minerals
Figure 2.1: The major components of feed.
2.2.1 Water
The body of a dairy cow is composed of 70–75 per centwater. Milk is about 87 per cent water. Water is alsoessential to regulate body temperature. As well, water isinvolved in digestion, nutrient transfer, metabolism andwaste removal.
Water has structural and functional roles in all cells and allbody fluids. An abundant, continuous, and clean source ofdrinking water is vital for dairy cows.
2.2.2 Energy
A dairy cow uses energy to function (walk, graze, breathe,lactate, and maintain a pregnancy). Energy is the keyrequirement of dairy cows for milk production. Itdetermines milk yield, milk composition (fat and proteincontent) and body weight.
2.2.3 Protein
Protein is the material that builds and repairs the body’senzymes, hormones, and all the tissues (e.g. muscle, skin,organs, foetus) except fat and bone.
Protein is needed for the body's basic metabolic processes,growth and pregnancy. Protein is also vital for milkproduction.
Proteins are made up of various amino acid molecules.Amino acids are the building blocks for the production ofprotein for milk, tissue growth and the development of thefoetus during pregnancy.
6

7/22/2019 Feeding Dairy Cows Manual
http://slidepdf.com/reader/full/feeding-dairy-cows-manual 36/264
Chapter 2. Getting Started in Cow Nutrition
Cows require 25 different amino acids for normal metabolicfunctioning. Fifteen of these can be produced by the cow’sown metabolism. The remaining ten are termed essentialamino acids because they must either be supplied in thediet (as dietary protein) or as a product of the digestion of
the microbes in the rumen (microbial protein).
Protein is usually measured as crude protein. Terms likerumen degradable protein (RDP) and undegradabledietary protein (UDP) or bypass protein are also cominginto use. The terms are explained more fully in Chapter 3.
2.2.4 Fibre
Cows need a certain amount of fibre for efficient rumenfunction. The fibre is required to ensure that the cowchews its cud (ruminates) enough and therefore salivates.The saliva helps to buffer the rumen pH and prevent thedegree of acidity varying too much.
The length and the structure of the fibre are bothimportant. They determine how much chewing a feedrequires. Feeds which need extra chewing increase theflow of saliva.
Fibre in the cow’s diet also slows down the flow of
material through the rumen and thus gives the microbesmore chance to digest feed.
Products of fibre digestion are important for theproduction of milk fat.
2.2.5 Vitamins and minerals
Vitamins are organic compounds that all animals requirein very small amounts.
At least fifteen vitamins are essential for animals. Vitaminsare needed for many metabolic processes in the body; e.g.for production of enzymes, bone formation, milkproduction, reproduction and disease resistance.
Minerals are inorganic elements. They are needed for(among other things) teeth and bone formation; enzyme,nerve, cartilage and muscle function or formation; milkproduction; blood coagulation; energy transfer;carbohydrate metabolism; and protein production.
7

7/22/2019 Feeding Dairy Cows Manual
http://slidepdf.com/reader/full/feeding-dairy-cows-manual 37/264
Chapter 2. Getting Started in Cow Nutrition
8

7/22/2019 Feeding Dairy Cows Manual
http://slidepdf.com/reader/full/feeding-dairy-cows-manual 38/264

7/22/2019 Feeding Dairy Cows Manual
http://slidepdf.com/reader/full/feeding-dairy-cows-manual 39/264
Chapter 3. What’s in Feeds?
Table 3.1: The approximate dry matter and moisturecontent of some typical feeds.
Dry Matter (%) Moisture (%) Feed
0 100 ←Water
10 90 ←Short, leafy pasture
20 80
30 70 ←Pit silage
40 60 ←Long, stemmy pasture
50 50 ←Baled silage
60 40
70 30
80 20 ←Hay
90 10 ←Wheat grain
100 0
It is important to be able to work out the amount of drymatter (in kg) that cows consume from the total amount offeed 'as fed' (which includes dry matter and water).
EXERCISE 3.1 How much dry matter is in a feed?
Calculate and fill in the last two columns of the following
table.(Answers to all the exercises are in Appendix A.)
A B C D
Type offeed
Feedas-fed(kg)
Moisture(%)
Dry matter(%)
100 - B
Dry matter(kg)
A x C ÷ 100
Pasture 88 83 17 15
Silage 50 60
Hay 20 20
Wheat 16.7 10
CALCULATION EXAMPLE: To calculate the dry matter percentage (per cent DM; column C), subtract the moisture per cent (column B) from 100 per cent. For example, for pasture:
100 - 83 = 17.
10

7/22/2019 Feeding Dairy Cows Manual
http://slidepdf.com/reader/full/feeding-dairy-cows-manual 40/264
Chapter 3. What’s in Feeds?
To calculate weight of DM in kg (column D), multiply thenumber of kg as-fed (column A) by the dry matter per cent(column C). To continue the pasture example:
88 x (17 ÷ 100) = 15 kg DM
3.2 Energy
The energy in feed is a measure of that feed’s ability tohelp the cow function and be productive. All feeds have agross energy value (see Figure 3.2).
Some of the gross energy is lost in the faeces. The energythat is absorbed by the cow is termed digestible energy.
From the digestible energy, further energy losses occur inthe production of urine, as well as digestive heat and gas.
All the remaining energy is known as metabolisable energy(ME).
Figure 3.2: The flow and partitioning of dietary energythrough the cow.
Megajoules are used to measure energy content. The mainthing you need to remember is the higher the value inmegajoules, the better the quality of the feed.
The ME is the energy available for use by the cow: it is theenergy used for maintenance of body systems, activity,milk production, pregnancy and weight gain.
Energy intake
Gross energy
Digestible energy
Metabolisable energy
Condition ActivityMilkMaintenance Pregnancy Growth
Faecal energy
Gas, heat and urine energy
11

7/22/2019 Feeding Dairy Cows Manual
http://slidepdf.com/reader/full/feeding-dairy-cows-manual 41/264
Chapter 3. What’s in Feeds?
3.2.1 How energy is measured
Two measures of energy are digestibility andmetabolisable energy.
Digestibility
Digestibility relates to the portion of food which is notexcreted in the faeces and so is available for use by thecow.
Digestibility is not a direct measure of energy, but it doesindicate overall feed quality. Because she is able to digestand use more of it, the greater the digestibility, the greaterthe benefit of that food to the animal.
The higher the digestibility, the higher the metabolisableenergy.
Digestibility is commonly measured as a percentage. Apasture with a digestibility of 50 per cent, for example,means that only half of the feed eaten will actually be ofuse to the animal. The other half will be immediatelyexcreted in the faeces.
Metabolisable energy
Some of the energy released by digestion is not used by thecow. It is belched out as methane and carbon dioxide, orpassed out in the urine or lost as heat created duringrumen fermentation (see Figure 3.2).
The energy in a feed that a cow can actually use for itsmetabolic activities (i.e. maintenance, activity, pregnancy,milk production, and gain in body condition) is calledmetabolisable energy.
As already outlined, the energy content of a feed iscalculated from its digestibility.
The energy content of a feed (also called its energy density)is measured as megajoules of metabolisable energy per kgof dry matter (MJ ME/kg DM).
Throughout this manual, references to cows' energyrequirements and the energy density of feeds will be givenin megajoules of metabolisable energy (MJ ME).
The higher the energy content of a feed, the more energythere is available to the animal.
12
7/22/2019 Feeding Dairy Cows Manual
http://slidepdf.com/reader/full/feeding-dairy-cows-manual 42/264
Chapter 3. What’s in Feeds?
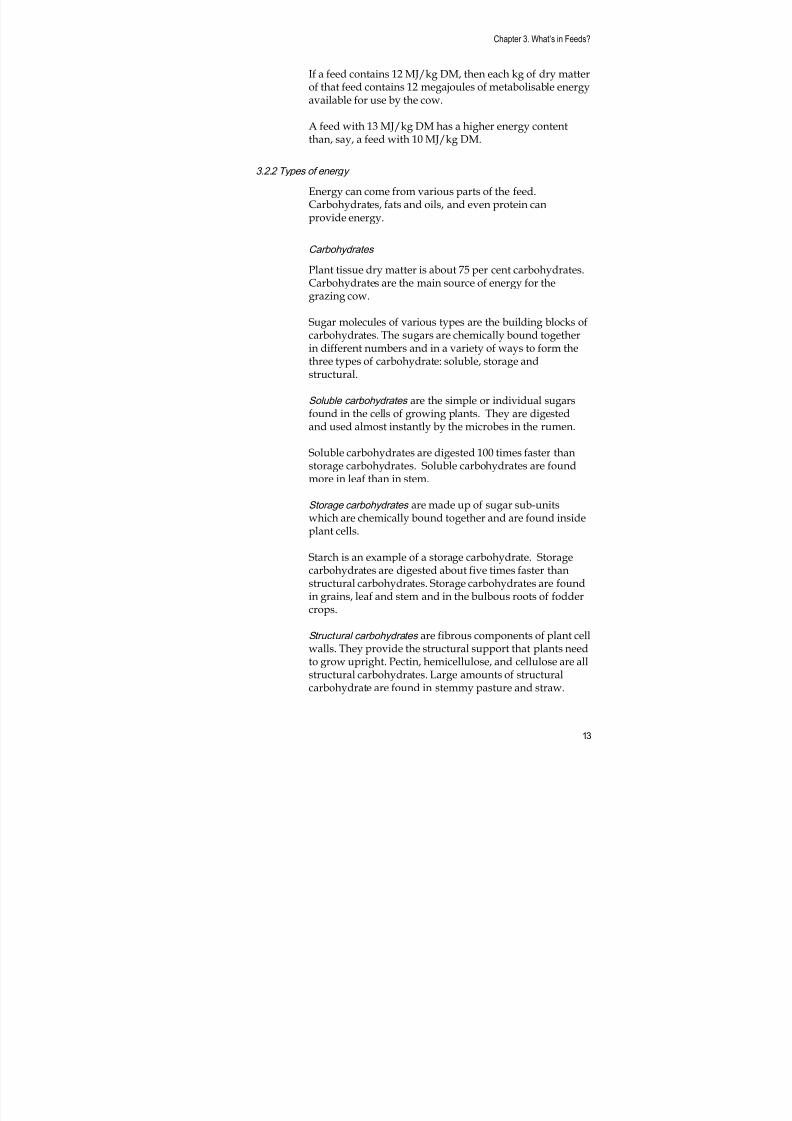
If a feed contains 12 MJ/kg DM, then each kg of dry matterof that feed contains 12 megajoules of metabolisable energyavailable for use by the cow.
A feed with 13 MJ/kg DM has a higher energy content
than, say, a feed with 10 MJ/kg DM.
3.2.2 Types of energy
Energy can come from various parts of the feed.Carbohydrates, fats and oils, and even protein canprovide energy.
Carbohydrates
Plant tissue dry matter is about 75 per cent carbohydrates.Carbohydrates are the main source of energy for thegrazing cow.
Sugar molecules of various types are the building blocks ofcarbohydrates. The sugars are chemically bound togetherin different numbers and in a variety of ways to form thethree types of carbohydrate: soluble, storage andstructural.
Soluble carbohydrates are the simple or individual sugars
found in the cells of growing plants. They are digestedand used almost instantly by the microbes in the rumen.
Soluble carbohydrates are digested 100 times faster thanstorage carbohydrates. Soluble carbohydrates are foundmore in leaf than in stem.
Storage carbohydrates are made up of sugar sub-unitswhich are chemically bound together and are found insideplant cells.
Starch is an example of a storage carbohydrate. Storagecarbohydrates are digested about five times faster thanstructural carbohydrates. Storage carbohydrates are foundin grains, leaf and stem and in the bulbous roots of foddercrops.
Structural carbohydrates are fibrous components of plant cellwalls. They provide the structural support that plants needto grow upright. Pectin, hemicellulose, and cellulose are allstructural carbohydrates. Large amounts of structural
carbohydrate are found in stemmy pasture and straw.
13

7/22/2019 Feeding Dairy Cows Manual
http://slidepdf.com/reader/full/feeding-dairy-cows-manual 43/264
Chapter 3. What’s in Feeds?
Lignin and silica are often associated with structuralcarbohydrates in plants. They give structural supportto plants but are indigestible and are not actuallycarbohydrates. They can bind to the structuralcarbohydrates and make them less digestible.
Fats and oils
Only 2–3 per cent of pasture dry matter is fat or oil. Fatsand oils include vegetable oils, tallow (animal fat), andprocessed fats. No more than 5 per cent of a cow’s totalintake of dietary dry matter should be fats. Fats candecrease the palatability of the diet and can coat the fibre,interfering with its digestion by rumen microbes.
Protein
A surplus of protein in the rumen can be used by therumen microbes for energy. This is, however, an inefficientuse of protein.
EXERCISE 3.2 Energy intake from various feeds.
In the following table, which cow is eating the most energy?(Answers to all the exercises are in Appendix A.)
A B C
Energy intake(MJ)A x B Cow
Type offeed
Intake(kg DM)
Energy content(MJ/kg DM)
Amy Pasture 15 11 165
Bossy Silage 15 10
Chloe Hay 10 8.5
Deidre Wheat 8 13
CALCULATION EXAMPLE: Amy eats 15 kg DM of pasture. Each kg contains 11 MJ of energy. Her total energyintake is:
15 kg DM x 11 MJ/kg DM = 165 MJ
14

7/22/2019 Feeding Dairy Cows Manual
http://slidepdf.com/reader/full/feeding-dairy-cows-manual 44/264
Chapter 3. What’s in Feeds?
3.2.3 Energy and milk production
Table 3.2 shows two cows, one producing 20 litres and theother 30 litres. The second column shows the amount ofenergy each cow needs to eat each day to produce that
amount of milk.
Table 3.2: Cows fed diets of different energy densityand producing at two levels of milkproduction: amounts of dry matter requireddaily.
Required intake (kg DM/d)
Milk yield(L/day)
Energyrequirement(MJ/kg DM)
10 MJ/kg DM 12 MJ/kg DM
20 168 16.8 14.0
30 220 22.0 18.3
(Source: Stockdale, 1991)
The dairy farmer has two feeds available to give to thecows:
• silage, with an energy density of 10 MJ/kg DM, and
• green, leafy pasture, with an energy density of12 MJ/kg DM.
To produce more milk, a cow must eat more dry matter. Iflower quality (i.e. lower energy density) feed is provided,the cow must eat a greater amount of it.
To produce 30 litres of milk on the 10 MJ/kg DM diet acow must eat 22 kilograms of dry matter daily – a verylarge amount.
Some dairy farmers say you cannot ‘milk from silage’, nomatter how much you give them. Others say you can.
Both are right: it depends mainly on the energy content ofthe silage. It is difficult for a cow to get enough energy tomilk well from silage with an energy density of only8 MJ/kg DM. However, it is possible to make silagemeasuring 11 MJ/kg DM, from which cows could milk.
15

7/22/2019 Feeding Dairy Cows Manual
http://slidepdf.com/reader/full/feeding-dairy-cows-manual 45/264
7/22/2019 Feeding Dairy Cows Manual
http://slidepdf.com/reader/full/feeding-dairy-cows-manual 46/264
Chapter 3. What’s in Feeds?
Crude protein
Ð Ð
True dietary
protein
Non-protein
nitrogen (NPN)
Ð Ô
Rumendegradable
protein (RDP)
Undegradabledietary protein
(UDP)
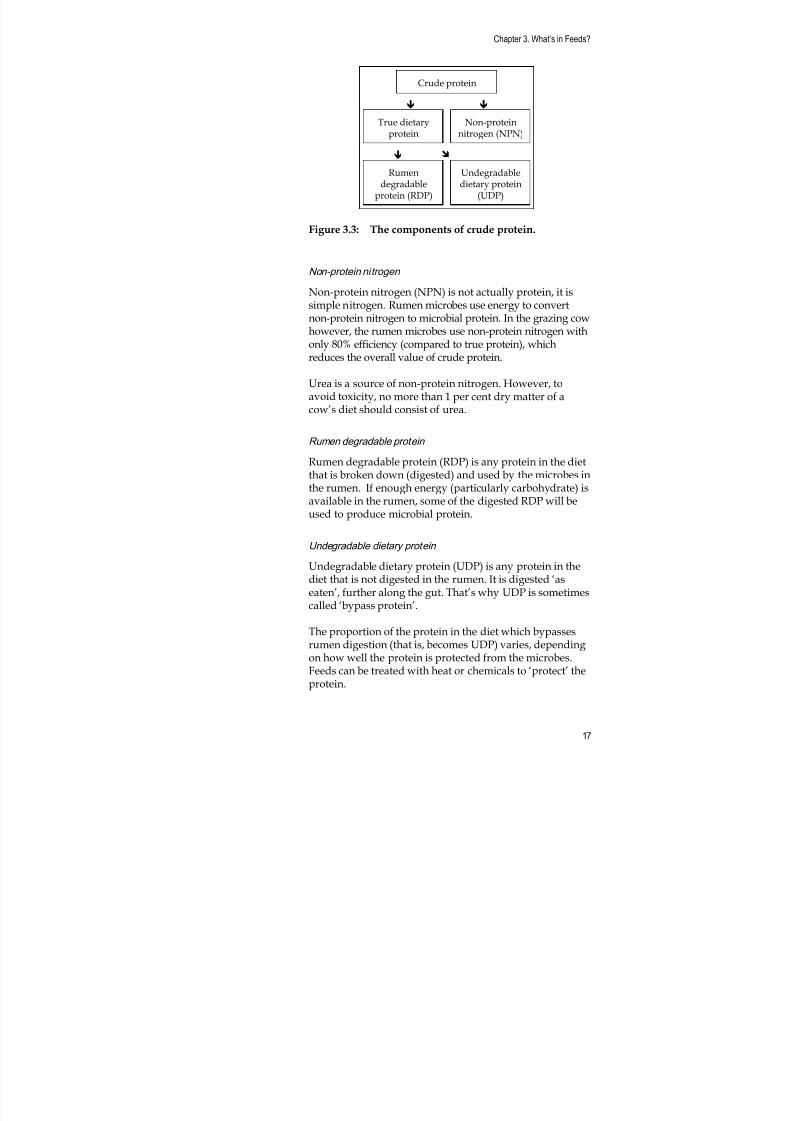
Figure 3.3: The components of crude protein.
Non-protein nitrogen
Non-protein nitrogen (NPN) is not actually protein, it issimple nitrogen. Rumen microbes use energy to convertnon-protein nitrogen to microbial protein. In the grazing cowhowever, the rumen microbes use non-protein nitrogen withonly 80% efficiency (compared to true protein), whichreduces the overall value of crude protein.
Urea is a source of non-protein nitrogen. However, toavoid toxicity, no more than 1 per cent dry matter of a
cow’s diet should consist of urea.
Rumen degradable protein
Rumen degradable protein (RDP) is any protein in the dietthat is broken down (digested) and used by the microbes inthe rumen. If enough energy (particularly carbohydrate) isavailable in the rumen, some of the digested RDP will beused to produce microbial protein.
Undegradable dietary protein
Undegradable dietary protein (UDP) is any protein in thediet that is not digested in the rumen. It is digested ‘aseaten’, further along the gut. That’s why UDP is sometimescalled ‘bypass protein’.
The proportion of the protein in the diet which bypassesrumen digestion (that is, becomes UDP) varies, dependingon how well the protein is protected from the microbes.Feeds can be treated with heat or chemicals to ‘protect’ theprotein.
17

7/22/2019 Feeding Dairy Cows Manual
http://slidepdf.com/reader/full/feeding-dairy-cows-manual 47/264
Chapter 3. What’s in Feeds?
However, it is possible to ‘over-protect’ protein. It thenmoves through the entire gut and out the other endwithout being digested.
The UDP of feeds also depends on how much is eaten in
total, and how quickly the feed flows through the rumen.Greater intake and faster flow-through mean more proteinbecomes UDP because it simply ‘escapes’ through therumen before microbial breakdown occurs.
3.3.2 Measuring rumen degradable protein and undegradable protein
You may want to know how much of the crude protein inthe feed is RDP and how much is UDP. This analysis iscalled protein degradability.
The degradability of protein in the diet depends onmany factors including dry matter intake, how long feedstays in the rumen, the degree of processing, the totalprotein intake and the supply of dietary energy to therumen microbes. Therefore, the proportions measured ina laboratory test for RDP and UDP may not necessarilybe the same as when the feed is eaten by a cow.
Nevertheless, a system describing the degradability ofprotein has been developed to help farmers assess the UDP
supply in feeds. This classification is shown in Table 3.3.
Table 3.3: Categories used to assess ability of feeds tosupply undegradable dietary protein (UDP).
Undegradable DietaryProtein
Rumen DegradableProtein
Category
High more than 69% less than 31%
Good 69–50% 31–50%
Moderate 49–30% 51–70%
Poor 29–10% 71–90%
3.4 Fibre
Fibre is the cell wall, or structural material, in a plant andis made of hemicellulose, cellulose, and lignin. Some ofthe fibre is digestible, some is not.
18

7/22/2019 Feeding Dairy Cows Manual
http://slidepdf.com/reader/full/feeding-dairy-cows-manual 48/264
Chapter 3. What’s in Feeds?
3.4.1 Types of fibre
There are three methods of describing the fibre in a cow'sdiet.
Neutral detergent fibre
Neutral detergent fibre (NDF) is a measure of all the fibre(the digestible and indigestible parts) and indicates howbulky the feed is. Some of it is digested, and some isexcreted. A high NDF might mean lower intake because ofthe bulk. Conversely, lower NDF values lead to higherintakes.
Acid detergent fibre
Acid detergent fibre (ADF) is the poorly-digested andindigestible parts of the fibre, i.e. the cellulose and lignin. Ifthe ADF is low, the feed must be very digestible (i.e. highquality).
Crude fibre
Crude fibre (CF), although sometimes used to indicatefibre content, is now considered an unacceptable measure.It does not include all of the constituents that make up thefibre component of a feed.
3.4.2 Measuring fibre
Figure 3.4 shows the different approaches to measuringfibre.
Sometimes the fibre in the diet is expressed as kilograms ofdry matter; but more often, fibre is expressed as apercentage of the dry matter. For example, if a feed has aneutral detergent fibre measurement of 25 per cent NDF,
one-quarter of the dry matter weight is fibre.
19
7/22/2019 Feeding Dairy Cows Manual
http://slidepdf.com/reader/full/feeding-dairy-cows-manual 49/264
Chapter 3. What’s in Feeds?
Proteins, Lipids, Minerals
Sugars, Starches, Pectins
Hemicellulose
Alkali-soluble
Alkali-insoluble
Cellulose
Cell contents
Crude
Fibre
NDFADF
Lignin
(all cell wall)
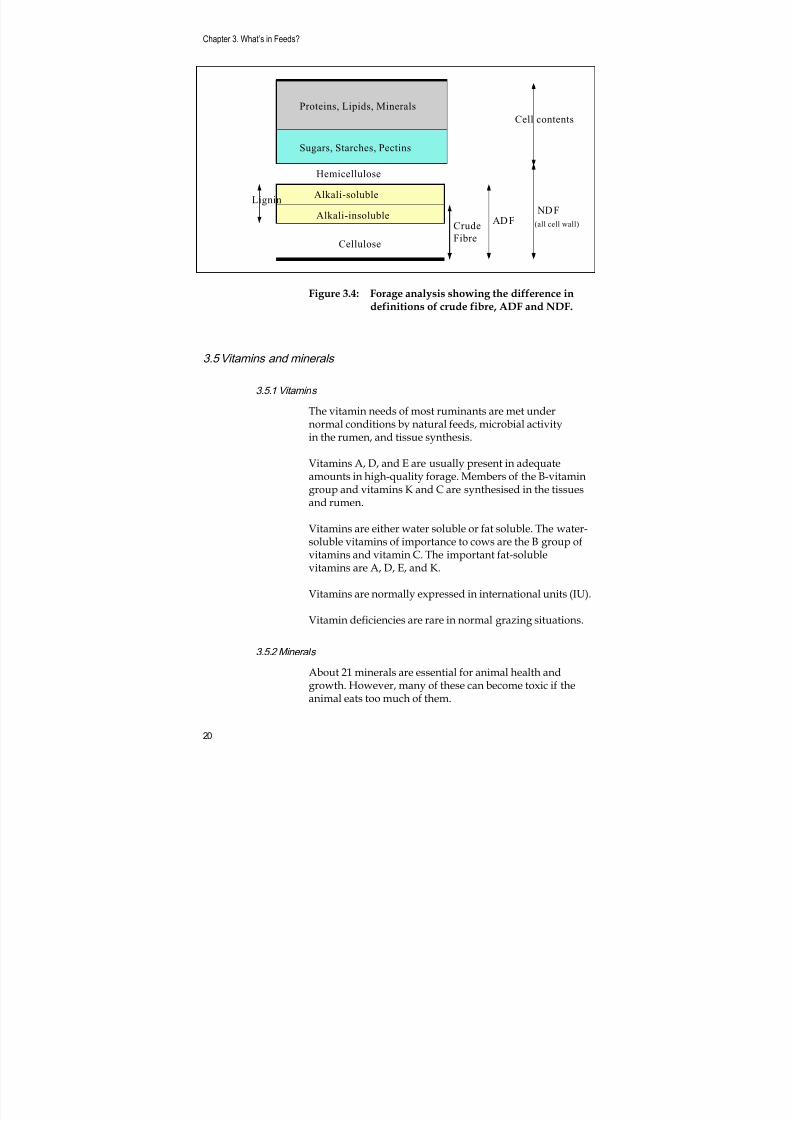
Figure 3.4: Forage analysis showing the difference indefinitions of crude fibre, ADF and NDF.
3.5 Vitamins and minerals
3.5.1 Vitamins
The vitamin needs of most ruminants are met undernormal conditions by natural feeds, microbial activityin the rumen, and tissue synthesis.
Vitamins A, D, and E are usually present in adequateamounts in high-quality forage. Members of the B-vitamingroup and vitamins K and C are synthesised in the tissuesand rumen.
Vitamins are either water soluble or fat soluble. The water-soluble vitamins of importance to cows are the B group of
vitamins and vitamin C. The important fat-solublevitamins are A, D, E, and K.
Vitamins are normally expressed in international units (IU).
Vitamin deficiencies are rare in normal grazing situations.
3.5.2 Minerals
About 21 minerals are essential for animal health andgrowth. However, many of these can become toxic if theanimal eats too much of them.
20
7/22/2019 Feeding Dairy Cows Manual
http://slidepdf.com/reader/full/feeding-dairy-cows-manual 50/264
Chapter 3. What’s in Feeds?
Mineral deficiencies are less likely if pasture is the majorpart of the diet.
High-producing herds fed diets high in cereal grain ormaize silage may require added minerals.
The mineral content of feed is expressed in units of weight:grams (g) or milligrams (mg).
3.6 Essential nutrients and sources summary
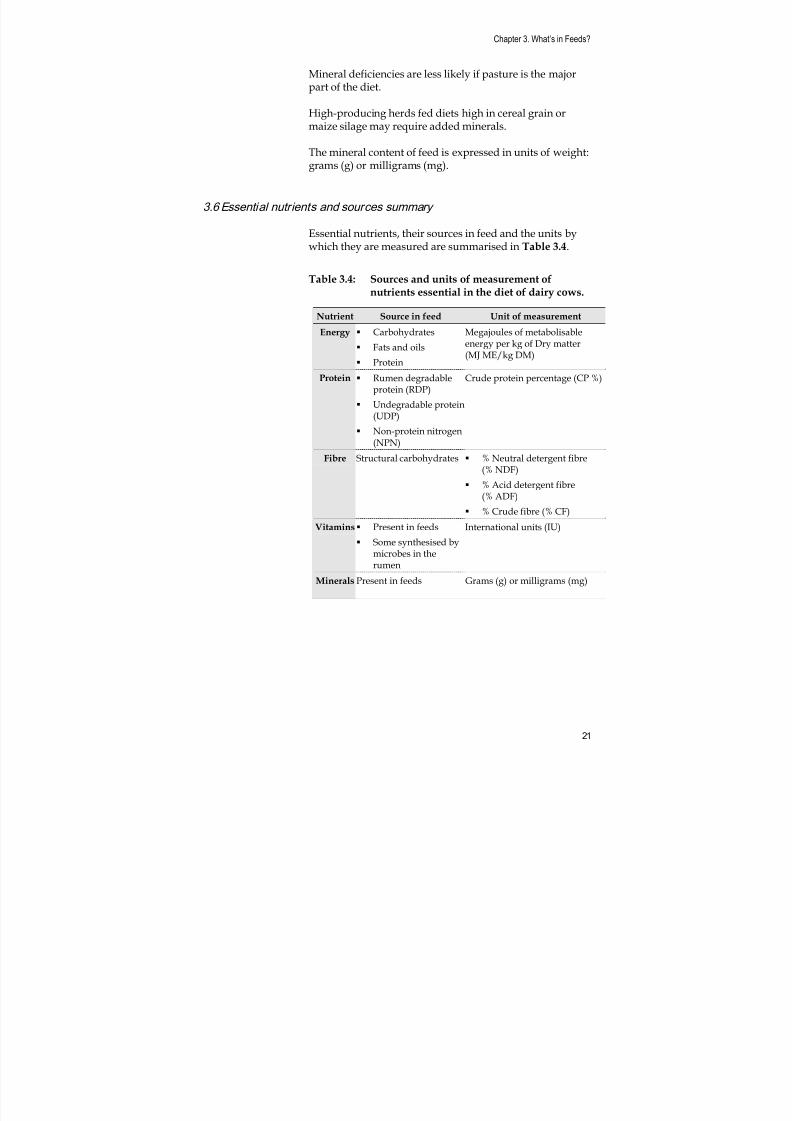
Essential nutrients, their sources in feed and the units bywhich they are measured are summarised in Table 3.4.
Table 3.4: Sources and units of measurement ofnutrients essential in the diet of dairy cows.
Nutrient Source in feed Unit of measurement
Energy Carbohydrates
Fats and oils
Protein
Megajoules of metabolisableenergy per kg of Dry matter(MJ ME/kg DM)
Protein Rumen degradableprotein (RDP)
Undegradable protein
(UDP) Non-protein nitrogen
(NPN)
Crude protein percentage (CP %)
Fibre Structural carbohydrates % Neutral detergent fibre(% NDF)
% Acid detergent fibre(% ADF)
% Crude fibre (% CF)
Vitamins Present in feeds International units (IU)
Some synthesised by
microbes in therumen
Minerals Present in feeds Grams (g) or milligrams (mg)
21

7/22/2019 Feeding Dairy Cows Manual
http://slidepdf.com/reader/full/feeding-dairy-cows-manual 51/264
Chapter 3. What’s in Feeds?
22

7/22/2019 Feeding Dairy Cows Manual
http://slidepdf.com/reader/full/feeding-dairy-cows-manual 52/264
Chapter 4. How the Rumen Works
4. How the Rumen Works
4.1 The digestive system
Three steps are involved in cows obtaining nutrients fromtheir diet:
Ingestion: taking food into the body;
Digestion: food is mechanically and chemically brokendown; and
Absorption: nutrients pass from the digestive system intothe cow's blood stream.
The digestive system of dairy cows is well adapted to adiet of plant material. As ruminants, cows have one truestomach (the abomasum) and three other compartments(the rumen, the reticulum and the omasum) which eachhave specific roles in the breakdown of the feed consumed.These are shown in Figure 4.1.
Large intestine
Rectum
Small intestine
Caecum
Omasum
Abomasum
Rumen
Reticulum
Oesophagus
Figure 4.1: Digestive system of the dairy cow.
23

7/22/2019 Feeding Dairy Cows Manual
http://slidepdf.com/reader/full/feeding-dairy-cows-manual 53/264
Chapter 4. How the Rumen Works
4.1.1 The rumen and the reticulum
Once food has been ingested, it is briefly chewed andmixed with saliva, swallowed and passed down theoesophagus into the rumen. The rumen is adapted for
the digestion of fibre. It is the largest compartment of theadult ruminant stomach.
The rumen is sometimes described as a 'fermentation vat'.Its internal surface is covered with tiny projections calledpapillae; these increase the surface area of the rumen andallow better absorption of digested nutrients.
The reticulum is separated from the rumen by a ridge oftissue. Its lining has a raised honeycomb-like pattern, alsocovered with small papillae.
The rumen and reticulum together have a capacity of 50–120 litres of food and fluid. The temperature inside therumen remains stable at around 39oC (38–42oC) which issuitable for the growth of a range of micro-organisms(microbes).
The microbes break down feed through the process offermentation. Under normal conditions, the pH of thecontents of the rumen and reticulum is maintained in therange of 6–7. (It may be lower in grain–fed cows.)
The stable pH range is maintained by continual removal,via the rumen wall, of acidic end products of microbialfermentation, and by the addition of bicarbonate from thesaliva.
Saliva
Saliva has several roles: it makes chewing and swallowingeasier, but primarily it contains sodium (Na) and
potassium (K) salts that act as buffering agents againstacidity.
A cow can produce 150 L or more of saliva daily. Thevolume of saliva secreted depends on the time spent eatingand ruminating.
Chewing and rumination
Before food reaches the rumen its breakdown has alreadybegun by the mechanical action of chewing.
24

7/22/2019 Feeding Dairy Cows Manual
http://slidepdf.com/reader/full/feeding-dairy-cows-manual 54/264
Chapter 4. How the Rumen Works
Chemical breakdown is initiated by enzymes produced bythe microbes in the rumen.
The walls of the rumen and reticulum move continuously,churning and mixing the ingested feed with the rumen
fluid (or 'digestive chemicals') and microbes. Thecontractions of the rumen and reticulum help the flow offiner food particles into the next chamber, the omasum.
Rumination, or chewing the cud, is the process wherebynewly eaten feed is returned to the mouth for furtherchewing. This extra chewing breaks the feed down intosmaller pieces, thereby increasing its surface area. Thesmaller surface area in turn makes the feed more accessibleto the chemicals which break it down. As a result, the rateof microbial digestion in the rumen is increased.
The time spent ruminating (chewing the cud) depends onthe fibre content of the feed. The more fibre in the feed, thelonger the ruminating time, therefore the less feed that canbe eaten overall, and the less milk produced.
Some nutrients are absorbed across the rumen wall.Absorption involves the movement of individual feedcomponents through the wall of the digestive tract into theblood stream by which they are transported to the liver.
There is a constant flow of digesta through the digestivetract. Because food larger than 1 mm cannot leave therumen until its length is reduced, the rumen is probablythe major regulator of feed intake.
Passage of food through the rumen
The passing of material through the rumen affects theextent of digestion. General rate of passage depends ondensity, particle size, ease of digestion and level of feeding.Some foods pass through the digestive system fairlyquickly, but very indigestible food may be excreted over along period.
4.1.2 Microbes of the rumen and reticulum
The micro-organisms or microbes in the rumen includebacteria, protozoa and fungi. These microbes feed onforages ingested by the cow, and, by fermentation,produce end products that are utilised by the cow as well
as by the microbes themselves for their own reproductionand cell growth.
25

7/22/2019 Feeding Dairy Cows Manual
http://slidepdf.com/reader/full/feeding-dairy-cows-manual 55/264
Chapter 4. How the Rumen Works
Bacteria and protozoa are the most important microbes.Billions of bacteria and protozoa are found in the rumen.They digest about 70–80 per cent of the digestible drymatter in the rumen.
Different species of bacteria and protozoa performdifferent functions. Some digest starch and sugar whileothers digest cellulose. The numbers and proportions ofeach type of microbe depend on the individual animal’sdiet.
Maintaining a healthy mixture of different microbes isessential for keeping the rumen functioning efficiently.
The major end products of microbial fermentation are:
Volatile fatty acids (VFAs), mainly acetate, propionate andbutyrate. These are products of fermentation and are thecow's main energy source.
Ammonia, which can be used to manufacture microbialprotein. Bacteria are 60 per cent protein, making themthe major source of protein for the cow as they leave therumen and are digested in the abomasum and smallintestine.
Gases, mainly methane and carbon dioxide, are a source ofwasted energy as they are belched out regularly.
Dietary upsets, such as feeding too much grain tooquickly, can cause a rapid change in the microbialpopulation. This changes fermentation patterns andinterferes with fibre digestion. Adjusting the level of grainfed should therefore be done gradually so that thepopulations of rumen microbes can adjust accordingly.
4.1.3 Rate of digestion
The speed of digestion of feeds depends on the quality andcomposition of the feed. It is affected by the number andtype of microbes, the pH in the rumen, the nutrientslimiting the growth of the microbes and the removal ofmicrobes from the rumen.
Energy and protein are the major nutrients which limitmicrobial growth and therefore rumen fermentation.
The microbial population needs energy and protein forgrowth and multiplication. If either of these nutrients is in
26

7/22/2019 Feeding Dairy Cows Manual
http://slidepdf.com/reader/full/feeding-dairy-cows-manual 56/264

7/22/2019 Feeding Dairy Cows Manual
http://slidepdf.com/reader/full/feeding-dairy-cows-manual 57/264
Chapter 4. How the Rumen Works
4.1.7 Large intestine
The large intestine, mainly the caecum and colon, is thesite of secondary fermentation, particularly of fibre. Tento 15 per cent of the energy used by the cow is absorbed
from the large intestine. Absorption of water, mineralsand ammonia also occurs here.
The components of feed not digested in the large intestineare passed through the rectum and anus and expelled asfaeces.
4.2 Carbohydrate digestion in the rumen
When food is eaten by the cow, the nutrients are initially in
the form of carbohydrates, proteins and fats (or lipids).These are digested to products which can be used directlyby the cow or by the microbes in the rumen.
Plant tissue dry matter is about 75 per cent carbohydrate.Microbial fermentation breaks carbohydrates down intosimple sugars. The microbes use these sugars as an energysource for their own growth and make end products whichare used by the cow.
The end products of microbial fermentation ofcarbohydrates include:
• volatile fatty acids (mainly acetate, propionate andbutyrate)
• gases (carbon dioxide and methane).
All carbohydrates are fermented by rumen microbes, butthe soluble and storage forms are fermented more quicklythan the structural forms. Sugars and starches are brokendown easily and quickly. By comparison, cell-wall materialis digested slowly.
As plants mature their cell walls become lignified. Thelignin reduces the availability and utilisation of structuralcarbohydrates. In other words, as plants mature theirdigestibility declines because the components of their cellwalls become less accessible and harder to digest.
Soluble carbohydrates are digested 100 times faster by themicrobes in the rumen than are storage carbohydrates, and
storage carbohydrates are digested about five times fasterthan the structural carbohydrates.
28

7/22/2019 Feeding Dairy Cows Manual
http://slidepdf.com/reader/full/feeding-dairy-cows-manual 58/264
Chapter 4. How the Rumen Works
Figure 4.2 shows the relationship between digestibilityand speed of digestion for some common feeds.
0
10
20
30
40
50
60
70
80
90
100
M o l a s s e s
T u r n i p s
C e r e a l s
C l o v e r
G r a s s
H a y
S t r a w
D i g e s t i b i l i t y ( % )
0
5
10
15
20
25
30
35
40
45
50
R a t e o f d i g e s t i o n ( h o u r s )
(Source: Ørskov 1987)
Figure 4.2: Relationship between digestibility ( ) andrate of digestion (υ).
4.2.1 Structural carbohydrates
Bacteria which digest structural carbohydrates (celluloseand hemicellulose) produce a large proportion of aceticacid, which is important in the production of milkfat.These bacteria are sensitive to fats and acidity in therumen.
If feeds contain too much fat or if the rumen becomes too
acidic through feeding rapidly digestible carbohydrates,these bacteria can be completely eliminated or theirgrowth rate slowed down. Reduction or elimination ofthese bacteria not only reduces the digestibility of the feed,it may also reduce the cow’s intake of feed.
Once structural carbohydrates have passed through therumen, there is little likelihood that they will be brokendown further.
29

7/22/2019 Feeding Dairy Cows Manual
http://slidepdf.com/reader/full/feeding-dairy-cows-manual 59/264
Chapter 4. How the Rumen Works
4.2.2 Storage carbohydrates
The bacteria that digest starchy feeds (e.g. cereal grains orpotatoes) are quite different from the cellulose-digestingbacteria. They are insensitive to acidity and produce
mainly propionic acid. Starches are rapidly fermented, andthe lactic and propionic acid they produce causes acidity toincrease.
The acidity caused by excess starch-digesting bacteria cansuppress the bacteria which digest cellulose and so reducethe milkfat test.
4.2.3 Soluble sugars
The bacteria that ferment feeds high in soluble sugars (e.g.
molasses, beets, turnips and good quality grass) are similarto those that ferment starch.
Sugary feeds generally cause fewer problems withincreased acidity in the rumen than starchy feeds (seebelow). However, care still needs to be taken whenintroducing sugary feeds to the cow’s diet.
4.2.4 The products of carbohydrate digestion
Volatile fatty acids
The most important end products of carbohydratebreakdown in the rumen are volatile fatty acids (VFAs).These acids are important because:
• They are the major source of energy for the ruminant(about 70 per cent of the total)
• The proportions in which they are produced determinefat and protein content of milk.
The three major volatile fatty acids produced are acetate(or acetic acid), propionate (or propionic acid) andbutyrate (or butyric acid). The ratio of the various VFAsproduced depends on the type of feed being digested.
Volatile fatty acids are absorbed through the walls of therumen then transported in the bloodstream to the liver. Inthe liver they are converted to other sources of energy.From the liver, the energy produced is used to performvarious functions (i.e. milk production, maintenance of
body systems, pregnancy and growth). This is shown inFigure 4.3.
30

7/22/2019 Feeding Dairy Cows Manual
http://slidepdf.com/reader/full/feeding-dairy-cows-manual 60/264
Chapter 4. How the Rumen Works
Non-fibrous Carbohydrates
(cell contents)
Fibrous Carbohydrates
(cell wall)
DIET
RUMEN
Soluble Storage
Sugars Starch
Butyrate Propionate Acetate
Structural
Pectin Hemi-cellulose Cellulose
Absorbed across the rumen wall and carried by the blood stream to the liver.
Used as an energy source for:
Maintenance Activity Milk production Body condition Pregnancy Growth
Figure 4.3: Digestion of carbohydrates, and productionand absorption of volatile fatty acids in thedairy cow.
Acetate
Acetate is an end product from the fermentation of fibre.Highly fibrous, low energy feeds such as pasture hay leadto microbial populations which produce high ratios ofacetate to propionate.
Acetate is necessary for the production of milk fat. If acetateproduction is low, which occurs in diets high in grain (orlow in fibre), milk fat production may be depressed.
Propionate
Propionate is an end-product of fermentation of starch andsugars.
Most of the energy needed for liveweight gain and for themammary system to produce lactose, is obtained from
propionate.
Feeds high in rapidly fermentable carbohydrates such ascereal grains lead to populations of bacteria which producerelatively more propionate and butyrate than acetate.
31

7/22/2019 Feeding Dairy Cows Manual
http://slidepdf.com/reader/full/feeding-dairy-cows-manual 61/264
Chapter 4. How the Rumen Works
Propionate is considered a more efficient energy sourcebecause fermentations which favour the production ofpropionate produce less methane and carbon dioxide.
If too little propionate is produced, which can occur during
the feeding of high-fibre diets, the synthesis of milk lactoseand overall milk yield is reduced.
To compensate for the energy deficit caused byinsufficient propionate, body fat is mobilised and thecow loses body condition.
Butyrate
Butyrate is metabolised in the liver into ketone bodies.Ketone bodies are used as a source of energy for fatty acidsynthesis, skeletal muscles and other body tissues.
Ketone bodies are also produced from the mobilisation ofbody fat.
If a cow is underfed in early lactation and loses bodycondition to compensate for a lack of dietary energy, theketone bodies are utilised as an alternative energy source.
Gas
Carbon dioxide and methane are produced during thefermentation of carbohydrates. They are either removedthrough the rumen wall or lost by eructation (belching).
Some carbon dioxide is used by the intestinal microbes andby the cow to maintain bicarbonate levels in saliva.
Methane cannot be used by the cow’s body systems as asource of energy.
4.3 Digestion of protein
Protein, when digested, is broken down into peptideswhich are short chains of amino acids. Further digestion ofpeptides yields individual amino acids and eventuallyammonia.
The protein used by the cow may be from the feed she eatsor from the microbes washed from the rumen. The amount
of each depends on the extent to which dietary protein isdegraded in the rumen and on the growth and outflow of
32

7/22/2019 Feeding Dairy Cows Manual
http://slidepdf.com/reader/full/feeding-dairy-cows-manual 62/264
Chapter 4. How the Rumen Works
microbes from the rumen. This is shown diagrammaticallyin Figure 4.4.
FEEDProtein Non Protein Nitrogen
(NPN)
RUMEN
Protein NPN
Peptides
Amino acidsMicrobial
Protein
Ammonia
ABOMASUM + INTESTINE
FAECES
URINE
LIVER
Ammonia
Urea
Saliva
ANIMAL
PRODUCT
Protein Amino Acids
Undigested
Protein
Amino Acids
Figure 4.4: Breakdown and partitioning of dietary andmicrobial protein sources in the dairy cow.
4.3.1 Microbial protein
Rumen microbes are 60 per cent protein. They are themajor source of protein in the cow’s diet.
Microbes of the rumen break down rumen degradableprotein (RDP) to amino acids then ammonia. Ammonia isa major source of nitrogen for microbial growth. Themicrobes also convert non-protein nitrogen to ammonia.
Microbes are continually 'flushed' from the rumen,through the omasum to the next chamber, the abomasum,where they die and are digested by the cow.
The amino acids produced when microbial protein is
digested are then absorbed through the small intestine.
33

7/22/2019 Feeding Dairy Cows Manual
http://slidepdf.com/reader/full/feeding-dairy-cows-manual 63/264
Chapter 4. How the Rumen Works
The amount of microbial protein flowing to the intestinesdepends on the availability of energy and ammonia in thecow’s diet.
If energy is limited, microbes become less efficient at using
ammonia. Instead of being converted to microbial protein,the ammonia is absorbed across the rumen wall and intothe bloodstream.
In the liver, ammonia is then converted to urea. Most ofthis urea is excreted in the urine and some is recycled backinto the rumen as non-protein nitrogen in saliva.
When energy is in excess relative to protein, the rate ofmicrobial protein synthesis declines. Total protein supplyto the cow is reduced and milk yield and milk proteinyield decreases.
Excess energy is converted to body condition rather thanmilk. Generally, though, pasture-based diets are relativelyhigh in protein.
4.3.2 Dietary protein
The dietary protein that is directly available to the cow isundegradable protein (UDP) and any rumen degradable
protein (RDP) which has escaped microbial digestion. Thisprotein is digested in the abomasum and small intestine.
UDP and 'escape RDP' provide a greater diversity of aminoacids than does protein broken down in the rumen, whichis restricted to those proteins, and their component aminoacids, found in microbes.
4.4 Digestion of fats
Fats are a source of energy for the cow. Fats are eitherpartially degraded in the rumen or assume a bypass orprotected form. When microbial fermentation of fatsoccurs in the rumen, some vitamins required by the coware also produced.
Fats are present in most of the more common dairy feedsin relatively small amounts (2–3 per cent of pasture drymatter can be fat).
34

7/22/2019 Feeding Dairy Cows Manual
http://slidepdf.com/reader/full/feeding-dairy-cows-manual 64/264
Chapter 4. How the Rumen Works
No more than 5 per cent of total diet dry matter (or about500 g/day) should consist of fats.
Beyond this, level fat will coat the dietary fibre in thedigestive tract. This interferes with fibre digestion and
decreases the palatability of the diet.
Protected fats, which escape microbial digestion in therumen, can be used to overcome the digestive upsetscaused by high levels of rumen-degradable fat. Theprotected fats are readily digested and absorbed across thewall of the small intestine.
Interest in feeding fats (e.g. Prime, Megalac etc.) tolactating dairy cows is growing. However, they are only
relevant to higher producing herds (30 litres or more).
Fats such as those from oilseeds (e.g. whole cottonseed) areuseful to such herds because they increase the energydensity of the diet, particularly in early lactation, thushelping to reduce live weight loss.
35

7/22/2019 Feeding Dairy Cows Manual
http://slidepdf.com/reader/full/feeding-dairy-cows-manual 65/264
Chapter 4. How the Rumen Works
36

7/22/2019 Feeding Dairy Cows Manual
http://slidepdf.com/reader/full/feeding-dairy-cows-manual 66/264
Chapter 5. Nutrient Requirements of Dairy Cows
5. Nutrient Requirements of Dairy Cows
5.1 Water
In temperatures of 15–20°C, a lactating dairy cow needs30–40 litres of water each day for maintenance, plus anextra 4–5 litres for each litre of milk produced.
Water requirements increase as air temperatures increase.Lactating cows will drink 150 to 200 litres of water per dayin the summer months.
Other factors influencing water intake include dietcomposition (dry matter intake), humidity, wind speed,water quality (sodium and sulphate levels), temperatureand pH.
5.2 Energy
Cows need energy for maintenance, activity, pregnancy,
milk production and for gaining body condition.
5.2.1 Maintenance
Energy is used for maintaining the cow's metabolism. Thisincludes breathing and maintaining body temperature.Physical activity such as walking and eating adds to themaintenance requirement, as does environmentaltemperature and physiological state (i.e. pregnancy andlactation).
Table 5.1 shows the energy needed for maintenance atvarious liveweights. These values include a 5 per centsafety margin.
5.2.2 Energy needed for activity
An allowance for grazing activity has been factored intothe maintenance requirements in Table 5.1. In flatterrain, 1 MJ ME per kilometre should be added toprovide the energy needed to walk to and from the
dairy. In undulating terrain, 5 MJ ME are required perkilometre.
37

7/22/2019 Feeding Dairy Cows Manual
http://slidepdf.com/reader/full/feeding-dairy-cows-manual 67/264
Chapter 5. Nutrient Requirements of Dairy Cows
Table 5.1: Energy requirements for maintenance.
Liveweight(kg)
Energy requirement(MJ/day)
100 17
150 22
200 27
250 31
300 36
350 40
400 Typical Jersey cow range 45
450 49
500 54
550 Typical Friesian cow range 59
600 63
700 72
(Source: MAFF, 1984.)
5.2.3 Energy needed for pregnancy
A pregnant cow needs extra energy for the maintenanceand development of the calf inside her. From conceptionthrough the first five months of pregnancy, the additional
energy required is approximately 1 MJ/day for eachmonth of pregnancy.
Energy requirements for pregnancy only become significantin the last four months. Table 5.2 shows the average dailyenergy requirements during these last months.
Table 5.2: Average daily energy requirements in thelast four months of pregnancy.
Month of pregnancy Additional energy required (MJ/d)Sixth 8
Seventh 10
Eighth 15
Ninth 20
(Source: MAFF, 1984.)
5.2.4 Energy needed for milk production
Energy is usually the most important feed component
needed to produce milk. The energy needed depends onthe composition of the milk (i.e., fat and protein content).
38

7/22/2019 Feeding Dairy Cows Manual
http://slidepdf.com/reader/full/feeding-dairy-cows-manual 68/264

7/22/2019 Feeding Dairy Cows Manual
http://slidepdf.com/reader/full/feeding-dairy-cows-manual 69/264

7/22/2019 Feeding Dairy Cows Manual
http://slidepdf.com/reader/full/feeding-dairy-cows-manual 70/264
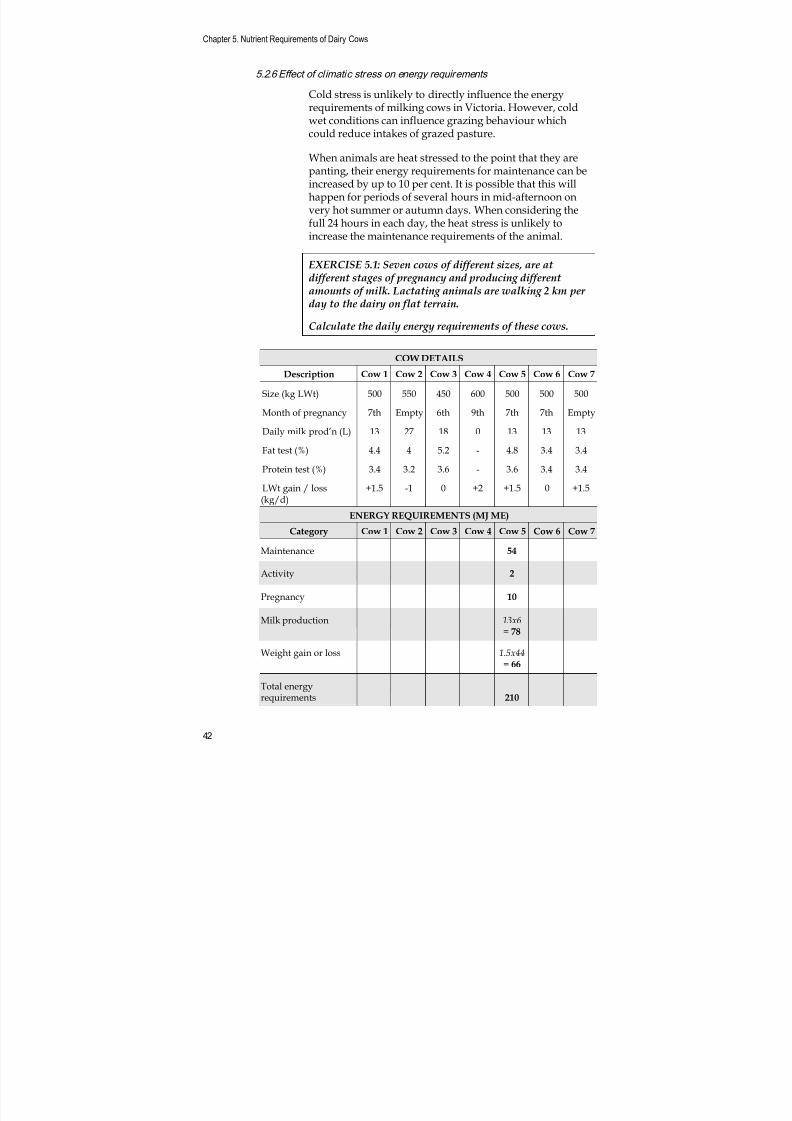
7/22/2019 Feeding Dairy Cows Manual
http://slidepdf.com/reader/full/feeding-dairy-cows-manual 71/264

7/22/2019 Feeding Dairy Cows Manual
http://slidepdf.com/reader/full/feeding-dairy-cows-manual 72/264
Chapter 5. Nutrient Requirements of Dairy Cows
5.3 Protein
The amount of protein a cow needs depends on her size,growth, milk production, and stage of pregnancy.However, milk production is the major influence on
protein needs. Table 5.6 shows crude protein needs atdifferent levels of milk production.
As discussed earlier, protein is measured as crude protein,rumen degradable protein (RDP) or undegradable protein(UDP).
Table 5.6: Crude protein needs of a cow at differentproduction levels.
Milk production Crude proteinrequirements
Early lactation 16 - 18%
Mid-lactation 14 - 16%
Late lactation 12 - 14%
Dry 10 - 12%
When calculating the protein requirements of the herd,crude protein, RDP or UDP figures can be used. Remember
though that requirements for RDP and UDP are only‘guesstimates’.
To work out how much RDP and UDP is required, theprotein requirements of the rumen microbes and of thecow need to be considered. The microbial protein madeavailable (after it is flushed from the rumen) also needs tobe calculated. Any shortfall in protein can then be made upby other protein sources (i.e. UDP). However, not allmicrobial protein or UDP eaten becomes available to the
cow.
Factors such as digestibility of amino acids reaching thesmall intestine as well as feed intake will influence the typeand amount of protein used by the cow. As a result, RDPand UDP requirements can only be calculated estimates.
43

7/22/2019 Feeding Dairy Cows Manual
http://slidepdf.com/reader/full/feeding-dairy-cows-manual 73/264
Chapter 5. Nutrient Requirements of Dairy Cows
5.3.1 How milk production affects requirements for rumen degradable
protein and undegradable dietary protein
Above a certain level of milk production, some protein inthe diet must be UDP. There is a limit to the rumen’scapacity to use RDP to produce microbial protein whichcan then be flushed on to the small intestine for digestion.
Microbial protein coming out of the rumen can sustainmilk production to 12 litres. In other words, when milkproduction is 12 litres or less, all the protein in the diet canbe RDP (i.e. protein that the microbes can use).
However, for milk production over 12 litres, at least someprotein in the diet must be UDP. The need for UDP
increases as milk production rises. Results from pasturesanalysed in Victoria reveal that from 20 to 30 per cent ofthe total protein content is UDP or bypass protein.
It is unlikely that cows grazing good quality pasture andproducing less than 30 litres per day will need to besupplemented with additional UDP.
5.4 Fibre
Cows need a certain amount of fibre in their diet to ensurethat the rumen functions properly and to maintain the fattest.
Table 5.7 shows the levels of fibre cows need in their diet.It should be stressed that the fibre requirements listed arethe absolute minimum values. Acceptable levels of neutraldetergent fibre (NDF) in the diet are in the range 30–35 percent of dry matter (DM).
Table 5.7: The absolute minimum percentage of fibreneeded in a cow’s diet for healthy rumenfunction (using three different measures offibre).
Fibre measurement Minimum amount of fibre in thediet
(per cent of total dry matter)
Neutral detergent fibre 30%
Acid detergent fibre 19%
Crude fibre 17%
44

7/22/2019 Feeding Dairy Cows Manual
http://slidepdf.com/reader/full/feeding-dairy-cows-manual 74/264
Chapter 5. Nutrient Requirements of Dairy Cows
Low-fibre, high-starch diets cause the rumen to becomeacid. Grain poisoning (acidosis) may occur. Adding bufferssuch as sodium bicarbonate to the diet reduces acidity andhence reduces this effect.
Buffers are usually recommended when grain feedingexceeds 4–5 kg of grain/cow/day.
Buffers are not a substitute for fibre. Long-term feeding oflow-fibre diets should be avoided.
5.5 Vitamins and minerals
Some farmers spend a great deal of money on vitamin and
mineral supplements for their cows. Production benefitsonly occur when the supplements correct a deficiency. Sobefore purchasing the vitamin and mineral supplements,find out whether a deficiency actually exists. In someinstances, supplementing animals that don’t have adeficiency may lead to poisoning and even death.
5.5.1 Vitamins
To the best of current knowledge, an oversupply of water-soluble vitamins will not harm cows. Any excess is simply
excreted in the urine.
However, fat-soluble vitamins (the important ones beingvitamins A, D, E and K) are stored in the cow’s body, andan oversupply of vitamin A or D can cause poisoning ordeath.
Vitamin A
Vitamin A is also called retinol. It is formed frombetacarotene in the diet. It is required by the retina forgood eyesight and is needed for tissue and bone formation,growth, milk production and reproduction. Vitamin Amaintains healthy epithelium (e.g. the lining of the teatcanal), so deficiencies may increase the incidence ofmastitis infections.
100,000 IU of vitamin A are needed per day per cow.
Any surplus is stored in the liver for up to four months.
Vitamin A deficiency is uncommon in grazing cattle butmay occur on diets high in cereal grains or cereal straw or
45

7/22/2019 Feeding Dairy Cows Manual
http://slidepdf.com/reader/full/feeding-dairy-cows-manual 75/264
Chapter 5. Nutrient Requirements of Dairy Cows
if cattle are grazed on dry pasture for more than sixmonths.
Vitamin D
Vitamin D is formed in the skin when stimulated bysunlight. Vitamin D is required for calcium andphosphorus metabolism in the body. It stimulates calciumabsorption in the small intestine. It also mobilises calciumstores from the bones. It can therefore be used to alleviatemilk fever. Cows need 50,000 IU of vitamin D per day.
Vitamin D deficiencies are very rare in grazing stock.Vitamin D toxicity (perhaps due to excessive treatment formilk fever) causes calcification of soft tissues, especially theaorta.
Vitamin E
Vitamin E, selenium and vitamin A all help the cow'simmune system to function properly. The immune systemfights infections and helps cows clean up after calving.Cows need 1,000 IU of vitamin E per day. Higher amountsmay be required around calving time.
Vitamin E deficiencies can lead to poor reproductive
performance. Retained membranes, metritis, cystic ovaries,and low conception rates have all been linked to vitamin Edeficiency.
Vitamin E deficiency also causes muscle degeneration,stiffness, and unco-ordinated movement, and may causeearly embryonic loss.
5.5.2 Minerals
Essential macrominerals Macrominerals are those required in quantities of gramsper kilogram of dry matter (g/kg DM) or per cent DM.They include calcium, phosphorus, magnesium,potassium, sodium, sulphur and chlorine.
Essential microminerals
Microminerals are those required in quantities ofmilligrams per kilogram of dry matter (mg/kg DM), or
parts per million (ppm). They include cobalt, copper, iron,iodine, manganese, zinc, selenium and molybdenum.
46

7/22/2019 Feeding Dairy Cows Manual
http://slidepdf.com/reader/full/feeding-dairy-cows-manual 76/264
Chapter 5. Nutrient Requirements of Dairy Cows
It is very difficult to estimate the mineral requirements ofcows because the requirement varies according to theabsorption efficiency of the mineral, the production stageand age of the animal, the environment, and theinteraction with other minerals.
Mineral deficiencies are less likely if pasture is the majorpart of the diet. High-producing herds fed diets high incereal grain or maize silage may need added minerals.
Additional information on minerals can be found in Appendix B.
47

7/22/2019 Feeding Dairy Cows Manual
http://slidepdf.com/reader/full/feeding-dairy-cows-manual 77/264
7/22/2019 Feeding Dairy Cows Manual
http://slidepdf.com/reader/full/feeding-dairy-cows-manual 78/264
Chapter 6. How Feed Requirements Change During Lactation
6 How Feed Requirements Change
During Lactation
A number of changes occur in a cow at the different stagesof lactation. As well as changes in milk production, thereare changes in feed intake and body condition, and alsopregnancy.
A cow’s lactation may start at 15 litres of milk, rise to apeak of 25 litres at about seven weeks, and then graduallyfall to 10 litres at the end of her lactation.
She will need more energy and protein as milk productionincreases, and less energy and protein when productiondeclines. At all stages, she will need about the sameamount of energy and protein each day for maintenance.
Obviously if a cow has no calf inside her, she does notneed any energy or protein for pregnancy. Once shebecomes pregnant she will need some extra energy andprotein. However, the calf does not increase its size rapidlyuntil the sixth month, at which time the nutrient
requirement becomes significant.
The calf doubles its size in the ninth month, so at that stagea considerable amount of feed is needed to sustain itsgrowth.
A cow usually takes off body condition for about twelveweeks after calving. The energy released is used toproduce milk. It allows the cow to produce more milk andto achieve higher peak production than would be possible
from her diet alone.
Of course, to do this she must have the body conditionavailable to lose, and therefore must have put it on late inthe previous lactation or during the dry period.
6.1 From calving to peak lactation
Milk yield at the peak of lactation sets up the potentialmilk production for the year; one extra litre per day at the
peak may mean an extra 200 litres per cow for the fulllactation. However, there are a number of obstacles to
49

7/22/2019 Feeding Dairy Cows Manual
http://slidepdf.com/reader/full/feeding-dairy-cows-manual 79/264
Chapter 6. How Feed Requirements Change During Lactation
feeding the herd well in early lactation to maximise thepeak. The foremost of these is voluntary food intake.
At calving, appetite is about 75 per cent of maximum. Thisis because during the dry period the growing calf takes up
space and the volume of the rumen is reduced. Aftercalving, it takes time for the rumen to ‘stretch’. It is notuntil weeks 10–12 that appetite reaches its full potential.
In addition, spring pasture is very moist. It has a low drymatter content and so the rumen cannot hold enoughpasture to meet the dry matter needs of the cow at thistime. Peak milk production occurs around weeks 6–8 oflactation. So, when a cow should be gorging herself withenergy, she is physically restricted in the amount she caneat. This is shown in Figure 6.1.
Figure 6.1: Dry matter intake, milk yield and liveweightchanges in a cow during the lactation cycle
(cited by Lawson, 1994).
Level of intake is primarily determined by stage oflactation, but it can be manipulated.
Table 6.1 shows that cows with restricted rumen capacityare more likely to be able to eat enough to meet theirenergy needs if they are fed an energy-dense diet. Byproviding a high quality diet – one that is energy denseand highly digestible – feed intake can be increased.
Dry matter intake – peak at weeks 10 to 12
Milk yield – peak at weeks 6 to 8
Liveweight change
Lactation length
50

7/22/2019 Feeding Dairy Cows Manual
http://slidepdf.com/reader/full/feeding-dairy-cows-manual 80/264
Chapter 6. How Feed Requirements Change During Lactation
Table 6.1: Dry matter intake needed by cowsproducing at two levels of milk productionand fed diets of different energy density.
Feed intake (kg DM/day)
Milk Yield(litres/day)
ME requirement(MJ/kg DM)
10 MJ/kg DM 12 MJ/kg DM
20 168 16.8 14.0
30 220 22.0 18.3
(Source: Stockdale, 1991)
A 30-litre cow would be struggling to eat 22 kg DM of feedat 10 MJ/kg DM at any time during lactation, let aloneearly in lactation when intake is restricted.
Cows in early lactation have a reduced capacity to eat.They will therefore produce a greater amount of milkfrom more energy dense feed because they have to eat lessdry matter to receive an equivalent intake of energy.
If cows are underfed in early lactation, they partition lessenergy to milk and more to body condition over the wholelactation. The underfeeding affects milk production for thewhole lactation and also affects fertility. This is set out inTable 6.2.
Table 6.2: Effect of feeding levels after calving on milkproduction, liveweight gain and fertility inthe first 20 weeks of lactation.
Level ofFeeding
Weeks0 - 5
Weeks5 - 10
Milk(litres)
Fat(kg)
LiveweightGain (weeks
10 to 20)(kg/day)
Days toFirstHeat
Days toConception
High High 2998 133 0.36 38 82
Low High 2818 123 0.55 52 82
High Low 2668 113 0.45 38 95
Low Low 2138 90 0.62 52 95
(Source: Grainger et al., 1982)
6.2 Peak lactation to peak intake
After peak lactation, the cow’s appetite gradually increasesuntil she can consume all the nutrients required for
51

7/22/2019 Feeding Dairy Cows Manual
http://slidepdf.com/reader/full/feeding-dairy-cows-manual 81/264
Chapter 6. How Feed Requirements Change During Lactation
production from high quality feed (ie. there is no physicalrestriction on intake). During this time the cow tends tomaintain weight.
6.3 Mid-lactation to late lactation
Although energy required for milk production is lessdemanding during this period because milk production isdeclining, energy is still important because of pregnancyand the need to build up body condition as an energyreserve for the next lactation.
Nutritional requirements generally exceed voluntary foodintake until week 12, so body fat reserves are drawn upon
to make up the nutrient deficit.
It is generally more profitable to improve the condition ofthe herd in late lactation rather than in the dry period.While lactating, cows use energy more efficiently forweight gain (75 per cent efficient compared to 59 per cent ifdry). As well, the extra milk produced in response to theextra feed, gains higher autumn prices.
6.4 Dry period
Maintaining (or increasing) body condition during the dryperiod is the key to ensuring the cow has adequate bodyreserves for early lactation.
Ideally, cows should calve in a condition score of at least 5,and preferably 5 to 6. If cows calve with adequate bodyreserves on their back, one condition score can be lost inthe first two months of lactation.
Each condition score lost (between score 3–6) in earlylactation is equivalent to 220 litres of milk, 10 kg of fat and6.5 kg of protein over the lactation.
Each additional condition score at calving reduces thetime between calving and first heat by 5–6 days. Thesooner the cow begins to cycle, the sooner she is likely toget into calf and the more compact the calving period nextseason.
52

7/22/2019 Feeding Dairy Cows Manual
http://slidepdf.com/reader/full/feeding-dairy-cows-manual 82/264
Chapter 6. How Feed Requirements Change During Lactation
53
If cows calve in poor condition, milk production suffers inearly lactation because body reserves are not available tocontribute energy.
As a result, more dietary energy is channelled towards
weight gain. For this reason, high feeding levels in earlylactation cannot make up for poor body condition atcalving.
EXERCISE 6.1:
Information required for this exercise has been presented inChapter 5 and Tables 5.1–5.7. The information is also
grouped together in Appendix C.
On Worksheet 1 calculate the minimum requirements of
the following cows:
a) A 500 kg cow in early lactation is producing 25 L/day of 4.2 per cent fat and 3.4 per cent protein milk.
The dairy is 1 km away, the terrain is steep. At this stageof lactation she is losing 1 kg/day in bodyweight.
b) A 500 kg cow in mid-lactation is producing 15 L/day of milk with 4.4 per cent fat and 3.4 per cent protein. Thedairy is 0.5 km away and the terrain is flat. Bodyweight is
constant.
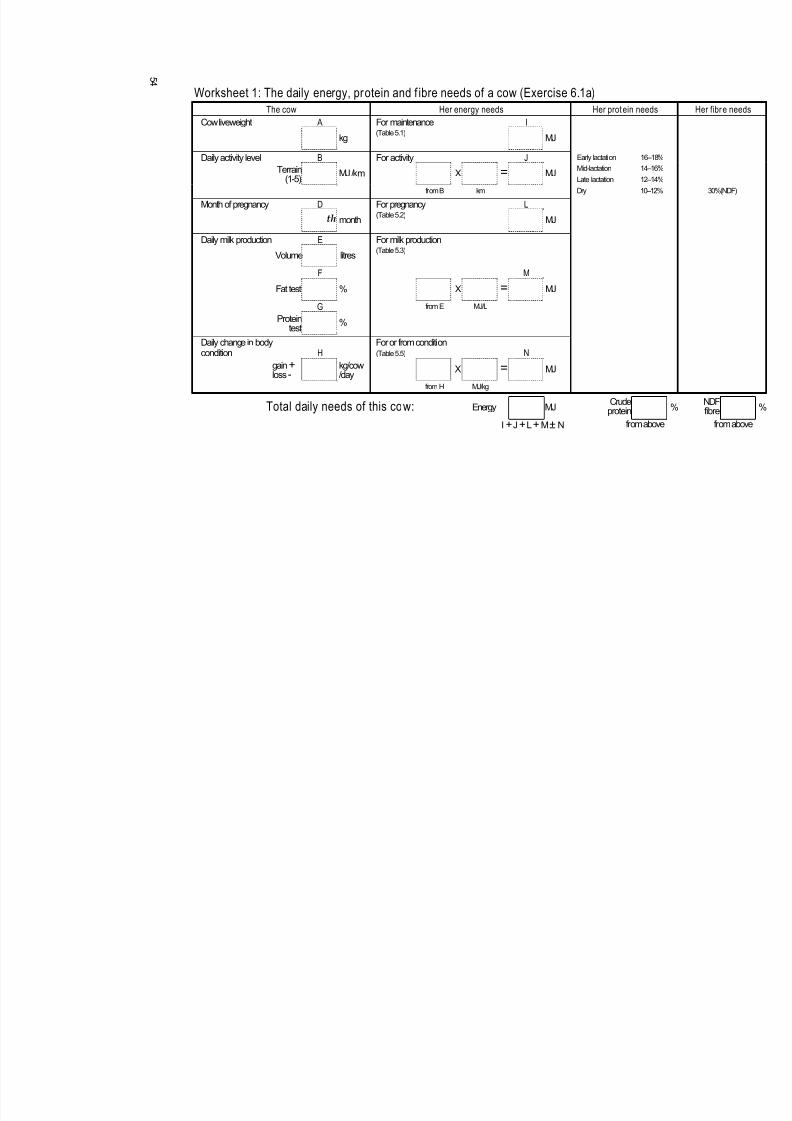
7/22/2019 Feeding Dairy Cows Manual
http://slidepdf.com/reader/full/feeding-dairy-cows-manual 83/264
5 4
Worksheet 1: The daily energy, protein and f ibre needs of a cow (Exercise 6.1a)
The cow Her energy needs Her protein needs
Cow liveweight A For maintenance I
kg(Table 5.1)
MJ
Daily activity level B For activity J Early lactation 16–18%
Terrain(1-5)
MJ /km X = MJMid-lactation
Late lactation
14–16%
12–14%
from B km Dry 10–12%
Month of pregnancy D For pregnancy L
th month(Table 5.2)
MJ
Daily milk production E For milk production
Volume litres(Table 5.3)
F MFat test % X = MJ
G from E MJ/L
Proteintest
%
Daily change in body For or from conditioncondition H (Table 5.5) N
gain+ loss-
kg/cow/day
X = MJ
from H MJ/kg
Total daily needs of this cow: Energy MJCrude
protein%
I +J+L+M± N from above

7/22/2019 Feeding Dairy Cows Manual
http://slidepdf.com/reader/full/feeding-dairy-cows-manual 84/264

7/22/2019 Feeding Dairy Cows Manual
http://slidepdf.com/reader/full/feeding-dairy-cows-manual 85/264
Chapter 6. How Feed Requirements Change During Lactation
56

7/22/2019 Feeding Dairy Cows Manual
http://slidepdf.com/reader/full/feeding-dairy-cows-manual 86/264
Chapter 7. Pasture Intake
7. Pasture Intake
Dairy farmers in Victoria are fortunate to be able toprovide most of their herds’ feed from grazed pasturerather than from costly supplements.
An understanding of the nutritional value of pasture istherefore paramount to good management of dairy cownutrition. The nutritive value of pasture depends on howmuch pasture is eaten, its height and mass, its stage ofmaturity, the time of year and the dominant species in thesward. To get the best from pastures we should become
skilled grazing managers.
The cow is the ‘harvester’ of our pastures, so we need toappreciate the cow’s grazing behaviour. In this chapter welook at the factors that affect how much pasture a cow willeat.
7.1 Factors affecting pasture quality
Quality of pasture can be roughly defined in physicalterms.
Table 7.1 outlines the energy and protein contents ofpastures referred to throughout this manual.
Table 7.1: The energy and protein contents of pasturesof differing quality.
Description ofquality
Metabolisable Energy(MJ/kg DM) Crude Protein (%)
High more than 11 more than 20
Medium 9 to 11 14 to 20
Low less than 9 less than 14
(Source: Stockdale, pers. comm.)
High quality pasture is leafy and contains little stemmymaterial. In other words, it has the characteristics thatallow the rumen microbes to easily break it down.
57

7/22/2019 Feeding Dairy Cows Manual
http://slidepdf.com/reader/full/feeding-dairy-cows-manual 87/264

7/22/2019 Feeding Dairy Cows Manual
http://slidepdf.com/reader/full/feeding-dairy-cows-manual 88/264
Chapter 7. Pasture Intake
Figures 7.1, 7.2, 7.3 show the typical variation in ‘wellmanaged’ ryegrass/white clover pastures throughout theyear in different dairying regions.
8
8.5
9
9.5
10
10.5
11
11.5
12
Spring Summer Autumn Winter
M E ( M J / k g D M )
Rye WC
0
5
10
15
20
25
30
35
Spring Summer Autumn Winter
C P ( % )
Rye WC
Figure 7.1: Seasonal variation in the energy and crudeprotein content of ryegrass (Rye) and whiteclover (WC) in Gippsland.
59

7/22/2019 Feeding Dairy Cows Manual
http://slidepdf.com/reader/full/feeding-dairy-cows-manual 89/264
Chapter 7. Pasture Intake
8
8.5
9
9.5
10
10.5
11
11.5
12
Spring Summer Autumn Winter
M E ( M J / k g D M )
Rye WC
0
5
10
15
20
25
30
35
Spring Summer Autumn Winter
C P ( %
)
Rye W.C
Figure 7.2: Seasonal variation in the energy and crudeprotein content of ryegrass (Rye) and whiteclover (WC) in northern Victoria.
60
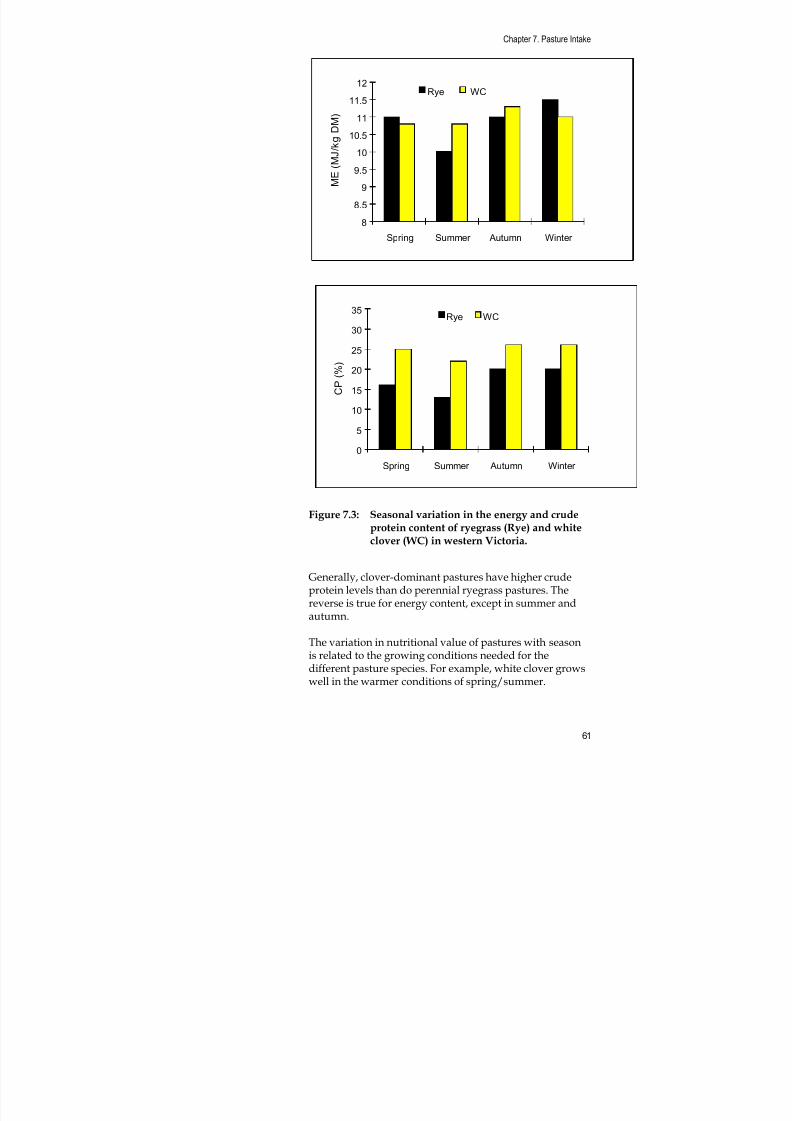
7/22/2019 Feeding Dairy Cows Manual
http://slidepdf.com/reader/full/feeding-dairy-cows-manual 90/264
Chapter 7. Pasture Intake
8
8.5
9
9.5
1010.5
11
11.5
12
Spring Summer Autumn Winter
M E ( M J / k g
D M )
Rye WC
0
5
10
15
20
25
30
35
Spring Summer Autumn Winter
C P ( % )
Rye WC
Figure 7.3: Seasonal variation in the energy and crudeprotein content of ryegrass (Rye) and whiteclover (WC) in western Victoria.
Generally, clover-dominant pastures have higher crudeprotein levels than do perennial ryegrass pastures. Thereverse is true for energy content, except in summer andautumn.
The variation in nutritional value of pastures with seasonis related to the growing conditions needed for thedifferent pasture species. For example, white clover growswell in the warmer conditions of spring/summer.
61

7/22/2019 Feeding Dairy Cows Manual
http://slidepdf.com/reader/full/feeding-dairy-cows-manual 91/264

7/22/2019 Feeding Dairy Cows Manual
http://slidepdf.com/reader/full/feeding-dairy-cows-manual 92/264
Chapter 7. Pasture Intake
10.7–11.2 MJ/kg DM, 17.9–18.1 per cent crude protein and 36–38 per cent NDF.
The degree of selection and how it changes the feed valuedepends on grazing pressure (stocking rate) and
availability of pasture. Cows can’t be so selective whenstocking rates are high or pasture availability is low.
By using a ‘selection allowance’ developed from reliableresearch data, farmers can estimate what nutrients theircows are really getting from pasture.
7.2 Limitations of pasture
7.2.1 Seasonal effects
Pasture growth varies throughout the year and isinfluenced by the growth pattern of the dominant pasturespecies and by grazing management.
Most perennial ryegrass/white clover pastures have peakgrowth in spring. Irrigation allows for extended periods ofhigh pasture growth into the summer.
Management affects the quantity of pasture available at
any particular time. Stocking rate is a major influence. Atcertain times of the year, pasture alone is unable to meetthe nutritional requirements of the herd.
Figures 7.4, 7.5, 7.6 show examples of typical growthpatterns for ryegrass/white clover pastures in Gippsland,northern Victoria and western Victoria. The feedrequirements for typical stocking rates and calvingpatterns are also shown.
63

7/22/2019 Feeding Dairy Cows Manual
http://slidepdf.com/reader/full/feeding-dairy-cows-manual 93/264
Chapter 7. Pasture Intake
0
10
20
30
40
50
60
70
80
90
100
J u l
A u g
S e p
O c t
N o v
D e c
J a n
F e b
M a r
A p r
M a y
J u n
Month
K g D M / h a
/ d a y
Growth Rate 1.5 cows/ha
2 cows/ha 2.5 cows/ha
Figure 7.4: Growth rate of ryegrass/white clover pasturein Gippsland and feed requirements atdifferent stocking rates throughout the year.
0
10
20
30
40
50
60
70
80
90
100
J u l
A u g
S e p
O c t
N o v
D e c
J a n
F e b
M a r
A p r
M a y
Month
k g D M / h a / d a y
Growth
Rate
3 cows/ha
4 cows/ha 5 cows/ha
J u n
Figure 7.5: Growth rate of ryegrass/white clover pasturein northern Victoria and feed requirementsat different stocking rates throughout theyear.
64

7/22/2019 Feeding Dairy Cows Manual
http://slidepdf.com/reader/full/feeding-dairy-cows-manual 94/264
Chapter 7. Pasture Intake
0
10
20
30
40
50
60
70
80
90
100
J u l
A u g
S e p
O c t
N o v
D e c
J a n
F e b
M a r
A p r
M a
J u n
Month
k g D M / h a / d a y
GrowthRate
1.5 cows/ha
2 cows/ha 2.5 cows/ha
Figure 7.6: Growth rate of ryegrass/white clover pasturein western Victoria and feed requirements atdifferent stocking rates throughout the year.
Shortfalls in pasture occur when feed requirements exceedpasture supply. Naturally, the higher the stocking rates the
more severe is the shortfall in pasture supply and thegreater the need for supplements.
7.2.2 Calving pattern
Calving pattern affects pasture supply and demand. This isdemonstrated in Figures 7.7, 7.8 and 7.9 where feedrequirements for typical autumn- and spring-calving herdsare superimposed on the average pasture growth rates forVictoria’s dairying regions.
65

7/22/2019 Feeding Dairy Cows Manual
http://slidepdf.com/reader/full/feeding-dairy-cows-manual 95/264
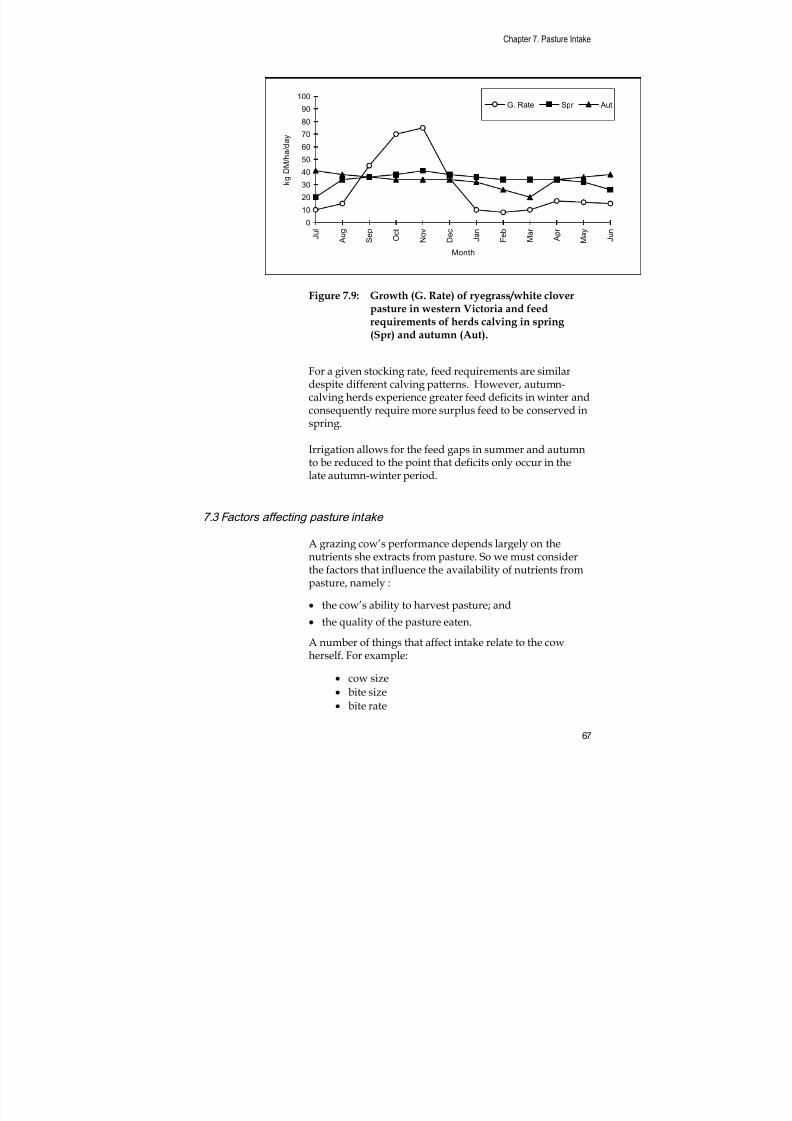
7/22/2019 Feeding Dairy Cows Manual
http://slidepdf.com/reader/full/feeding-dairy-cows-manual 96/264
Chapter 7. Pasture Intake
0
10
20
30
40
50
6070
80
90
100
J u l
A u g
S e p
O c t
N o v
D e c
J a n
F e b
M a r
A p r
M a y
J u n
Month
k g D M / h a / d a y
G. Rate Spr Aut
Figure 7.9: Growth (G. Rate) of ryegrass/white cloverpasture in western Victoria and feedrequirements of herds calving in spring (Spr) and autumn (Aut).
For a given stocking rate, feed requirements are similardespite different calving patterns. However, autumn-calving herds experience greater feed deficits in winter and
consequently require more surplus feed to be conserved inspring.
Irrigation allows for the feed gaps in summer and autumnto be reduced to the point that deficits only occur in thelate autumn-winter period.
7.3 Factors affecting pasture intake
A grazing cow’s performance depends largely on the
nutrients she extracts from pasture. So we must considerthe factors that influence the availability of nutrients frompasture, namely :
• the cow’s ability to harvest pasture; and
• the quality of the pasture eaten.
A number of things that affect intake relate to the cowherself. For example:
• cow size
• bite size• bite rate
67

7/22/2019 Feeding Dairy Cows Manual
http://slidepdf.com/reader/full/feeding-dairy-cows-manual 97/264
Chapter 7. Pasture Intake
• appetite
• stage of lactation; and
• pregnancy.
Feed itself can affect intake. For example:• length of the pasture (long or short)
• amount of leaf, stem and dead material
• quality of the feed
• palatability of the feed
• species in the pasture (clover, grass, weeds; etc.);and
• contamination of the feed (mud, dung, urine).
7.3.1 The abil ity to harvest pasture
The intake of pasture is determined by:
• number of bites that the cow takes in a given time (rateof biting)
• amount of pasture harvested each bite (intake per bite)
• total time spent grazing (grazing time).
Pasture intake can be expressed as:
Pastureintake
(kg DM/day)
=Grazing
time
(mins/day)x
Rate ofbiting
(bites/min)
xIntake
per bite
(kg/bite)
As grazing managers, you can exert some control overthese factors.
7.3.2 Grazing time
The grazing day can be divided into three activities:grazing, ruminating and resting. Most grazing occursduring daylight. Short periods of night grazing are not
uncommon and are most likely to be the main period ofgrazing on very hot days (above 30°C).
The pattern of grazing is undoubtedly affected by regularactivities, such as milking or movement of stock on todifferent pasture types. Grazing time generally variesbetween 6 and 12 hours per day. It is unlikely that grazingtime will extend beyond 12 hours. Average time spentgrazing is about 8.5 hours, with 7–8 hours spentruminating. As a rough ‘rule of thumb’:
68

7/22/2019 Feeding Dairy Cows Manual
http://slidepdf.com/reader/full/feeding-dairy-cows-manual 98/264

7/22/2019 Feeding Dairy Cows Manual
http://slidepdf.com/reader/full/feeding-dairy-cows-manual 99/264
Chapter 7. Pasture Intake
Remember, too, that a lot of the pasture on offer is close toground level where it is difficult to harvest.
Availability
Availability is determined by the pasture cover (kgDM/ha). The intake per bite will be greater from a 10 cm-tall pasture spread over one hectare than from a 1 cm-tallpasture spread over 10 hectares. The total quantity ofpasture on offer might be the same, but the longer pastureis more available. It is easier to get a mouthful of longpasture than of short pasture.
7.3.5 The effect of pasture quality
One of the main effects of pasture quality is on the rate at
which it is broken down by the rumen microbes. Highquality pasture is quickly broken down and passed furtheralong the digestive system where nutrients are absorbed.Poor quality pasture is more fibrous and therefore takeslonger to break down and pass out of the rumen.
The more quickly pasture is processed and moved out ofthe rumen, whether to be absorbed or passed out as faeces,the sooner more pasture can be eaten to fill the rumenagain.
Better quality pasture will result in higher intakes, butthere is a second benefit of providing good pasture. Higherquality pastures are more digestible and so can offer morenutrients per kg of dry matter than poorer qualitypastures.
Palatability
Cows eat more of what they like and less of what theydon’t like. They don’t like soiled pasture (such as youmight find in night and sacrifice paddocks), mature
pastures (stemmy and dead plants) or weeds, and they dolike clover and young succulent grass.
In practice it is important to find ways to offer your cowspastures that are :
• leafy (highly digestible);
• of moderate to tall height (easy to harvest);
• very palatable (uncontaminated young succulentplants).
If you do, your cows will have high intakes, digest more ofthe nutrients and produce more.
70

7/22/2019 Feeding Dairy Cows Manual
http://slidepdf.com/reader/full/feeding-dairy-cows-manual 100/264
Chapter 7. Pasture Intake
Seasonal effects
Pasture changes; in any given season, pasture quality andhence pasture intake can be influenced by management. Itis the management of pastures within the season rather
than the season itself that affects intake of pastures.
7.4 Getting the best from pasture
This section presents practical ideas for getting the bestintake of pasture by grazing cows. We identify why cowsgraze the way they do.
7.4.1 Characterist ics of a good pasture
Pasture should be:
• Easily grazed: Harvesting short pasture is hard work, somake sure there is reasonable length (10–15 cm)
• Leafy: Leaf is the most easily digested part of the plantand has the most nutrients (energy and protein)
• Free of stem: Stem is harder for a cow to graze; it istougher than leaf and harder to bite off. It contains lessdigestible nutrients than leaf and is broken down
slowly. The cow will not ‘fill up’ as often on stemmyfeed
• Free of decaying material: Cows don’t like compost. Theyeat less if the pasture contains decaying leaves and stem
• Full of clover and ryegrass: These are the most nutritiouspasture species we can easily grow. Cows find themvery palatable.
To get a ‘good pasture’ like this, you need to graze it to
approximately 4 cm height and allow it to grow back to the‘3-leaf stage’ (three ryegrass leaves per tiller – refer to theTarget 10 Pasture Management Course).
If a lot of pasture remains after grazing, there will be old,decaying leaves by next grazing. You don’t want this.
If pasture gets tall, it will contain old, decaying leavesand, in spring and summer, lots of stem. In addition,clover and young ryegrass tillers will be shaded out,resulting in less of what you are after in pastures at future
grazings: quality leaf material.
71

7/22/2019 Feeding Dairy Cows Manual
http://slidepdf.com/reader/full/feeding-dairy-cows-manual 101/264

7/22/2019 Feeding Dairy Cows Manual
http://slidepdf.com/reader/full/feeding-dairy-cows-manual 102/264
Chapter 8. Best Use of Pastures
8. Best Use of Pastures
Pasture is by far the cheapest feed source on the dairyfarm, so it should be made full use of before costlysupplements are brought in.
However, pasture growth rate changes considerablyaccording to the season. There are periods of the yearwhen pastures will not fully meet cow requirements.
In this chapter, we discuss maximising pastureperformance regardless of the season, or the stocking rate
and calving pattern. The material in this chapterdemonstrates how to roughly quantify amounts of pastureavailable and consumed.
8.1 Principles behind pasture utilisation
The secret to maximising pasture yield and quality is to:
• allow pasture species to develop to optimal growthpotential between grazing; and
• harvest mainly leafy material.
8.1.1 Allow the pasture to grow well
If pastures are allowed sufficient time after grazing togrow back to a suitable grazing condition, then you can beconfident that the pastures are growing as well as they can(see also Target 10: Pasture Management for DairyFarmers).
‘Pasture wedge’
In an ideal world we should offer 10–15 cm high pasturesto our cows every day. Yesterday’s pastures should be 3–4cm high after grazing.
When pastures are grazed in rotation there will begradation in pasture heights between these two heights.This profile of pasture heights on the farm is known as the‘pasture wedge’.
The challenge is to maintain the ‘pasture wedge’ for asmuch of the year as possible. This will guarantee the
73

7/22/2019 Feeding Dairy Cows Manual
http://slidepdf.com/reader/full/feeding-dairy-cows-manual 103/264
Chapter 8. Best Use of Pastures
quality of pasture as a feed because it will be mainly leaf.Once developed, ‘the wedge’ can only be maintained bychoosing the correct allocation of pasture each day.
Allocating pasture
The correct allocation of pasture depends primarily on thepasture growth rates. You also need to know the totalgrazed area and the paddock sizes.
When pasture growth is slow, the allocated area of pasturemay fall short of the needs of the livestock. However,when pastures grow well the cows’ daily pasture needsmay be exceeded.
Total grazed area can then be reduced by closures forsilage or hay making while still allocating a sufficient areaof pasture to meet requirements.
Pasture is correctly allocated when the area of pastureoffered each day provides the same amount of pasture thathas grown on the whole grazed area that day.
8.2 Essential tools for pasture allocation
8.2.1 Pasture growth rates
Current growth rates are the major determinant of the areaprovided for grazing. It is difficult to have a goodappreciation of actual growth rates but average figures foryour region can be a good starting point.
8.2.2 Available pasture
Until you develop the skills to assess pastures well, some
approximate ‘rules of thumb’ may help.
For example we may assume that:
• 10–15 cm high pasture (pasture ready for grazing) =2200 kg DM/ha
• 3–4 cm high pasture (residual pasture after grazing) =1300 kg DM/ha
A grazed hectare of 10–15 cm high pasture should provideapproximately 900 kg DM (2200 kg DM - 1300 kg DM).
74

7/22/2019 Feeding Dairy Cows Manual
http://slidepdf.com/reader/full/feeding-dairy-cows-manual 104/264
Chapter 8. Best Use of Pastures
8.3 Calculating the correct allocation
The correct daily allocation of pasture should not alter the‘pasture wedge’ because it is equivalent to the totalamount grown on the total grazed area each day.
In other words:
kg DM from the areaallocated for grazing
= kg DM grown on totalgrazed area
The ‘correct ‘ area of pasture to offer stock each day can becalculated using the following formula:
Area toallocate
for grazing
(ha/day)
=Pasture growth
rate(kg DM/ha/day)
÷900
kg DM/ha XTotal
grazedarea
(ha)
EXAMPLE 8.1
Suppose typical daily pasture growth in autumn is 20 kg DM/haand the total grazed area is 60 ha.
The appropriate area to offer grazing stock each day would be:20 kg DM/ha/day ÷ 900 kg DM/ha x 60 ha = 1.3 ha/day
So, figures for average pasture growth rates in your areawill allow you to develop a plan to maximise pastureperformance and help to minimise reliance onsupplements (see Exercise 8.1).
EXERCISE 8.1: Use the pasture allocation formula tocalculate the daily grazing allocation for your farmthroughout the year. (Your presenters will provide pasture
growth rates typical for your area.) The growth rates used
are examples only for your area and are used as a guide. Actual figures may be very different.
75

7/22/2019 Feeding Dairy Cows Manual
http://slidepdf.com/reader/full/feeding-dairy-cows-manual 105/264
Chapter 8. Best Use of Pastures
Total grazed area:.......……..ha
MonthAverage daily pasture
growth(kg DM per ha)
Area that this represents onyour farm (ha)
JanuaryFebruary
March
April
May
June
July
August
September
October
November
December
Remember that this is a very simple example. On a realfarm the milkers are likely to share the total area availablefor grazing with other stock.
8.4 How well does allocated pasture meet cow requirements?
Now you are able to estimate the pasture eaten by eachcow.
For example, take the situation of 80 milkers on 60 ha, inautumn. The average pasture growth rate is 20 kg DM perha.
As you worked out above, in order to maintain a ‘pasturewedge’ on the farm, no more than 1.3 ha should be offered
each day.
Therefore:
Daily pasture consumption for the herd is:
900 kg DM/ha x 1.3 ha = 1,170 kg DM
and each cow is eating:
1,170 kg DM ÷ 80 milkers = 14.6 kg DM per cow
76

7/22/2019 Feeding Dairy Cows Manual
http://slidepdf.com/reader/full/feeding-dairy-cows-manual 106/264
Chapter 8. Best Use of Pastures
If the energy density of the pasture is 10–11 MJ/kg DM,multiply the energy density by the dry matter intake frompasture.
The result is that each cow in the example has anapproximate daily intake of 146 to 160 MJ ME.
8.5 Practical implications
8.5.1 When pasture does not meet cow requirements
Too little pasture
The shortfall in feed requirements is the differencebetween pasture growth and feed requirements. It ispossible to make up for this shortfall by careful use ofmore costly supplements.
Too much pasture
The amount of excess pasture can indicate the proportionof the farm that could theoretically be set aside for silage orhay.
For example, if your cows require 160 MJ/day and thearea allocated daily would provide 200 MJ/ day, you areproviding 25 per cent more pasture than necessary.
In other words, you could reduce your total grazed area by25 per cent. A quarter of the farm could be set aside forfodder conservation.
8.5.2 Simple monitoring of the farm
Once you recognise the quantity and quality of pasturethat is appropriate for your cows, it can be quite simple towork out how much pasture to allocate to grazing.
If there does not seem to be any pasture that will be a leafy10 to 15 cm by the time it is needed, then too much pastureis being offered each day. In other words stock is beingmoved too quickly about the farm.
On the other hand, you might have a lot of paddocks thatwill be more than 10–15 cm high by the time they are
required. In this case you may be moving too slowlythrough the rotation and offering too little pasture each
77

7/22/2019 Feeding Dairy Cows Manual
http://slidepdf.com/reader/full/feeding-dairy-cows-manual 107/264

7/22/2019 Feeding Dairy Cows Manual
http://slidepdf.com/reader/full/feeding-dairy-cows-manual 108/264
Chapter 8. Best Use of Pastures
The pasture wedge is the balance that you want tomaintain.
EXERCISE 8.2: Develop a simple feed plan.
To do this, use:
• Answers from Exercise 8.1
• Details of your own farm
• Methods to calculate cow requirements set out inChapters 5, 6.
A B C D = (C - B)
Month
Areaallocated
each day (ha)(Exerc. 8.1)
Energysupplied
each dayfrom pasture(MJ ME)
Daily energy
requirement(MJ ME)
Energy needed
fromsupplements(MJ ME)
DEPOSITS WITHDRAWALS DEFICIT
Jan
Feb
Mar
Apr
May
Jun
Jul
Aug
Sept
Oct
Nov
Dec
Column A: Use the allocations you calculated in Exercise8.1.Column B: Column A x 900 x energy density of the pasture.Column C: Use details of your farm and herd, withWorksheet 1, to calculate the energy requirements of yourcows throughout the year. Column D = Column C – B (energy deficit to be made upwith supplements).
79

7/22/2019 Feeding Dairy Cows Manual
http://slidepdf.com/reader/full/feeding-dairy-cows-manual 109/264
Chapter 8. Best Use of Pastures
Estimating your requirement for supplemented energy inadvance allows you to anticipate how much extra feedyour cows will need and to plan how to provide it.
Your presenters will provide estimates of the energy
density of pastures in your area throughout the year.
80
7/22/2019 Feeding Dairy Cows Manual
http://slidepdf.com/reader/full/feeding-dairy-cows-manual 110/264

7/22/2019 Feeding Dairy Cows Manual
http://slidepdf.com/reader/full/feeding-dairy-cows-manual 111/264
Chapter 9. Supplements
Most tables of feed composition report only the averageenergy and protein contents. Yet, there can be largevariations within any type. For example, plant-derivedfeeds may vary with season of growth, soil type, and cropmanagement.
When developing diets, it is important to know thequalities of the individual feeds that make up the diet.
9.1.2 Calculating the nutritive value of supplements
To categorise feeds based on their composition, we haveused values derived from the FEEDTEST service andothers collected from Australia-wide surveys.
The values are presented in Tables 9.2, 9.3, 9.4, and 9.6 laterin this chapter. The tables list the average values andranges for dry matter (DM%), energy (MJ/kg DM), crudeprotein (CP%) and neutral detergent fibre (NDF%).
Appendix D also provides a list of feed values for variousfeeds.
Tables 9.2, 9.3, 9.4, and 9.6 also estimate undegradabledietary protein (UDP) supply according to the categorieslisted in Table 9.1. Australian data is at presentinsufficient, so the categories are based on worldwide
results.
Table 9.1: Categories used to assess feeds in terms oftheir ability to supply UDP.
Category UDP RDP
High (H) more than 69% less than 31%
Good (G) 69–50% 31–50%
Moderate (M) 49–30% 51–70%
Poor (P) 29–10% 71–90%
When discussing the requirements of cows andcomposition of feeds, this manual concentrates on energy,protein and fibre. The following sections cover energy, fatand protein supplements, conserved forage and foddercrops and the nutritive value of each type of feed.
82

7/22/2019 Feeding Dairy Cows Manual
http://slidepdf.com/reader/full/feeding-dairy-cows-manual 112/264
Chapter 9. Supplements
9.2 Energy supplements
9.2.1 Types of energy supplements
Feeds with large quantities of starches and sugars (e.g.,
cereal grains and some by-product feeds) are used asenergy supplements. Barley, triticale, wheat and oats arethe most commonly fed cereal grains. Energy can also besupplied by commercial concentrate pellets, speciallyformulated concentrate mixes, or by-products. Analyses ofsome energy-rich supplements are presented in Table 9.2.
Table 9.2: Nutritive value of some common energy-richsupplements.
Feed
Dry
matter
(%)
Energy
(MJ/kg DM)
Average (Range)
Crude protein
(% of DM)
Average (Range)
UDPsupply NDF(% of
DM)
Cereal grains
Barley 90 12 (12–14) 12 (8–18) P 20
Wheat 90 13 (12–14) 12 (9–17) P 14
Oats 90 11 (9–13) 10 (6–13) P 32
Triticale 90 13 (12–13) 12 (8–16) P 14
Maize 90 14 (12–16) 10 (7–14) M 9
Sorghum 90 11 (7–13) 11 (6–15) M 18
Commercial pellets 90 12 (11–13) 14 (12–16) M 15
By-product feeds
Whole cottonseed 90 15 (13–16) 24 (20–26) M 44
Wet brewers grain 25 10 (9–12) 23 (21–27) M 42
Carrots 12 13 (12–14) 9 (8–15) – 12
Potato mash 24 14 – 7 – 12
Citrus pulp 18 12 (10–13) 7 (6–8) P 23
Whey 7 14 – 11 – P -
Commercial pellets often contain more UDP than do theiringredients. The high temperatures used to manufacture
commercial feed pellets alter the protein and protect itfrom breakdown in the rumen.
Apart from oats and sorghum, the energy content of cerealgrains is fairly consistent, although protein levels may varywidely. Cereal grains, except maize and sorghum, aregenerally a poor source of UDP.
Most cereal grains are low in calcium, which may beimportant if feeding high grain levels during earlylactation when milk fever is a potential problem.
83

7/22/2019 Feeding Dairy Cows Manual
http://slidepdf.com/reader/full/feeding-dairy-cows-manual 113/264
Chapter 9. Supplements
Many of us take for granted that we know how much graincows are actually eating.
If you have in-shed feeders it is recommended that youcheck them at least once per year. It is not uncommon for
individual feeders to be out by as much as a kilogramwhen dispensing 4–5 kg of grain.
Acidosis is caused by a build-up of lactic acid in the rumenas a result of feeding high levels of cereal grains orsuddenly increasing the amount of grain in the diet.Increased acidity reduces the activity of the microbes thatbreak down fibre, which results in slower digestion andreduced appetite.
If acidosis occurs and only a few cows are affected, checkthe feeders before you do anything else.
9.2.2 Milk responses to energy supplements
Milk responses to supplementary feeding vary widely. Theresponses depend on stage of lactation, quality ofsupplement, pasture quality, pasture substitution andstocking rate.
Stage of lactation
With energy supplements, responses can be up to 1.6 Lmilk/kg DM of supplement fed in early lactation. Late inthe lactation cycle, response can be up to 0.7 L milk/kgDM of supplement fed.
This is the theoretical expectation, but probably onlyapplies when feed ingredients are similar at both stagesof lactation.
Trials at Kyabram Dairy Centre have shown that thequality of the pasture may affect the milk response tosupplements.
The best milk responses are seen in summer and autumn,when pastures provide little energy because they aredominated by paspalum and other poor quality species.
Quality of supplement
A recent summary of grazing and pen-feeding trials
conducted at Kyabram showed that milk responses to awide range of supplements were closely related to their
84

7/22/2019 Feeding Dairy Cows Manual
http://slidepdf.com/reader/full/feeding-dairy-cows-manual 114/264

7/22/2019 Feeding Dairy Cows Manual
http://slidepdf.com/reader/full/feeding-dairy-cows-manual 115/264
Chapter 9. Supplements
cow’s appetite for pasture can vary widely depending ongrazing pressure, pasture quality and substitution of thesupplement for pasture.
Feeding low levels of cereal grains or commercial pellets
leads to equivalent responses in milk production, but thesituation may be different with high levels of supplementfeeding.
Cows are able to eat more pellets than grain because of theinclusion of rumen buffers to prevent acidosis.Furthermore, pellets constitute a better balanced feedwhile combinations of pasture and cereal grain may lead tonutrient deficiencies, especially if the composition of thecereal grain is not known.
9.3 Fat supplements
Fats are concentrated forms of energy, containing up to 35MJ/kg DM. Some farmers incorporate cooking fats ortallow into cereal grain-based concentrates. Milk responsesto fat supplements can be in the order of 3 litres of milkand 0.3 per cent rise in fat test for each kilogram of fatconsumed.
Since December 1996, feeding ruminants feeds sourcedfrom ruminants has been banned.
Fats that are present in the rumen may coat fibre in thediet, and can reduce fibre digestion if dietary levels are toohigh. The upper limit for dietary fat concentration is about5 per cent of total dry matter.
Bypass fats which are digested in the small intestine can befed at higher levels without these side effects. Howeverthey are very expensive, up to $950/tonne. They shouldonly be fed during early lactation to high yielding cows(greater than 30 L/day). Such cows may otherwise loseweight so quickly that their fertility and metabolism maybe upset.
There is an upper limit to the use of bypass fat due to theanimal’s limited ability to digest the fat in the lowerdigestive tract. When using bypass fat, total fat in the dietshould not exceed 7 per cent, with the fat coming from:
• 1/3 plant source• 1/3 vegetable oil• 1/3 bypass fat.
86

7/22/2019 Feeding Dairy Cows Manual
http://slidepdf.com/reader/full/feeding-dairy-cows-manual 116/264
Chapter 9. Supplements
9.4 Protein supplements
9.4.1 Types of protein supplements
Table 9.3: Nutritive value of some common protein-rich supplements.
Feed
Dry
matter
(%)
Energy
(MJ/kg DM)
Average (Range)
Crude protein
(% of DM)
Average (Range)
UDP
supply NDF
(% of
DM)
Urea 100 0 – 250* – Nil 0
Grain legumes
Lupins 90 13 (12–13) 33 (28–40) P 27
Peas 90 13 (12–13) 24 (20–27) P 13
Animal proteinmeals
Fish 85 12 (10–13) 67 (65–70) H 7
Vegetable protein
meals
Soybean 85 13 (12–14) 52 (46–59) M 15
Safflower 85 11 (9–12) 43 (22–54) M 58
Cottonseed 85 12 (11–13) 42 (37–45) M 30
Canola 85 12 (11–13) 39 (33–43) P 28
Sunflower 85 10 (6–12) 35 (26–50) M 40
Linseed 85 12 – 34 (30–40) M –
*Urea is very high in nitrogen. When the crude protein factor of 6.25is applied to the percentage of nitrogen in urea, the result is a CP % of
over 100.
The nutritive values of some protein-rich supplements arepresented in Table 9.3. These include urea, grain legumes,and animal and vegetable protein meals.
Urea is a common source of nitrogen, but it is not aprotein. It has no energy value and is potentially 100 per
cent rumen degradable. It is mainly used as a substitute fortrue protein sources in feed mixtures and pellets.
Urea is effective only when fed in combination with anenergy source such as cereal grains or maize silage. It isrecommended that urea only be fed to animals that have afully functioning rumen and at a maximum rate of 1 percent of total dry matter intake.
87

7/22/2019 Feeding Dairy Cows Manual
http://slidepdf.com/reader/full/feeding-dairy-cows-manual 117/264
Chapter 9. Supplements
Grain legumes are multi-purpose; they are good sources ofboth protein and energy. However, their protein is verydegradable in the rumen.
Fish meal has the highest supply of UDP and a goodbalance of amino acids for milk production. However, it isvery expensive, costing upwards of $900/tonne.
Protein meals from plants generally have only moderatelevels of UDP. The amino acids supplied in the protein ofoil seed meals do not match the requirements of lactatingcows as well as the amino acids supplied from animalsources.
Energy levels of all the protein meals are comparable to
those of cereal grains.
9.4.2 Milk responses to protein supplements
Good milk responses to protein supplements can only beobtained if they are used to overcome an actual proteindeficiency. Otherwise, they are broken down and usedinefficiently as an expensive energy supplement.
Good responses to protein supplements have, however,been recorded in high-yielding herds (greater than 30
litres/day at peak) where large amounts of additionalenergy were also fed in early lactation.
Research from Ellinbank (Dalley et al., 1997) andQueensland (Moss et al., 1995) has concluded that whensufficient energy is supplied to support milk production inexcess of 30 L/day, then the form of the protein is notimportant, provided that the total protein requirements ofthe animal are met.
If protein is provided in excess of requirements, orinsufficient energy is available to utilise the dietaryprotein, then milk production can suffer.
Energy is required to remove the excess protein from thebody. In high producing cows grazing pasture duringearly lactation, production penalties of up to 0.7 L milkhave been measured for each percentage unit of protein inthe concentrate above 18.5 per cent (Dalley et al., 1996). Inthis instance the protein was supplied by cottonseed mealin a pelleted barley concentrate.
88

7/22/2019 Feeding Dairy Cows Manual
http://slidepdf.com/reader/full/feeding-dairy-cows-manual 118/264
Chapter 9. Supplements
Extra protein is often fed together with energysupplements during the summer and autumn whenprotein levels are low in both the pasture and many of thecereal grains and turnip supplements fed at these times ofthe year.
Milk production responses have been recorded to bothRDP and UDP supplementation, but only with RDPsupplements does the increased milk production exceedthe cost of supplementation (Moate et al., 1997).
Lupins, cottonseed meal and canola meal are the mostpopular protein grains fed in Victoria. They are relativelycheap, readily available, palatable, and a good source ofRDP.
Price and availability of the different protein meals varywidely during the year. If there is a need to feed a high-protein feed, the choice should be based on the cost perunit of crude protein and possibly also the supply of UDP,although the latter depends on the pasture supply andquality and the stage of lactation.
9.5 Processing energy and protein supplements
9.5.1 Processing grains
Feeding whole, unprocessed cereal grains generally leadsto lower utilisation of the supplement and lower milkresponses. This is because the grains do not spendsufficient time in the rumen for microbes to break throughtheir seed coat.
Oats are an exception to this rule. Trials have found littledifference in milk responses to whole or processed oats.
The optimum amount of processing gives acceptable andmaximum digestibility. Further processing only causesadditional interference with digestion.
The most common forms of on-farm processing currentlyused in Australia are rolling and hammer milling. Otherforms of processing are carried out on a larger scale byfeed manufacturers and include chemical processing,pelleting, and heating.
89

7/22/2019 Feeding Dairy Cows Manual
http://slidepdf.com/reader/full/feeding-dairy-cows-manual 119/264
Chapter 9. Supplements
Rolling and hammer milling
Generally, sorghum and maize require fine grinding(hammer milling) to maximise digestion, while rolling andcracking are preferable for wheat, barley and triticale.
(Ideally, the grains are broken into three or four pieces.)
Increasing the degree of rolling or hammer milling makesthe grain starch more readily available in the rumen. Thisimproves utilisation. But it may result in digestiveproblems if high levels of grain (above 4 kg/cow/day) arefed. It may also depress the milk fat test.
Fine grinding of grain can also reduce its palatability tocattle.
Chemical processing
Treating grains with an alkali such as sodium hydroxidehas also been investigated. This weakens the fibrous seedcoat, allowing rumen bacteria to enter, and results inincreased digestibility. Alkali-treated grain is digestedmore slowly than mechanically processed grain, so there isless chance of acidosis occurring.
However, using an alkali such as sodium hydroxide maylead to problems in handling the grain. Treated grain maysolidify.
Other methods, like using ammonia to treat grain, canreduce these handling problems while providing the samebenefits as the alkali treatment.
Pelleting and heat treatment
The heat treatment used in the production of pellets mayincrease the protection of protein from rumen degradation
and stimulate greater pasture intake.
At high levels of supplementary feeding, pellets can havean advantage over grains because they contain rumenbuffers to prevent acidosis and they may be betterbalanced for energy and protein. Feeding trials haveindicated little difference in terms of milk productionwhen pellets and cereal grains have been compared(J. Moran, pers. comm.).
90

7/22/2019 Feeding Dairy Cows Manual
http://slidepdf.com/reader/full/feeding-dairy-cows-manual 120/264
Chapter 9. Supplements
9.5.2 Processing protein feeds
As with cereal grains, processing feeds high in protein canlead to their more efficient use. Mechanical treatment oflegumes or oil-type grains increases their digestibility. For
example, rolled or hammer-milled lupin grain can increaseproduction and give an 18 per cent improvement indigestibility.
Heat or chemical treatment (e.g. formaldehyde) of feedshigh in protein can reduce their degradability in the rumen(ie. increase the bypass effect).
However, excessive heat or formaldehyde may also reducethe digestibility of the UDP in the small intestine.
Screw pressing of oil-type grains yields a greaterproportion of UDP in the meal. This occurs because theheat produced by pressing increases the protection ofprotein from rumen degradation.
9.6 Conserved forage supplements
9.6.1 Types of conserved forages
Conserved forages are generally high in fibre. They canalso be valuable energy and protein supplements(Table 9.4).
The higher values in the energy and crude protein valuestend to be found in early-cut hay and silage. Lower valuesindicate energy and protein values for late-cut hay andsilage.
Table 9.4 also lists typical dry matter (DM) andundegradable dietary protein (UDP) contents of conserved
forages. Appendix E provides some information on hayand silage bale weights, drymatter content of bales and dry matter per bale.
91

7/22/2019 Feeding Dairy Cows Manual
http://slidepdf.com/reader/full/feeding-dairy-cows-manual 121/264
Chapter 9. Supplements
Table 9.4: Nutritive value of some conserved forages.
Feed
Dry
matter
(%)
Energy
(MJ/kg DM)
Average (Range)
Crude protein
(% of DM)
Average (Range)
UDP
supply NDF
(% of
DM)
Lucerne hay/silage 20-80* 8 (7–9) 16 (14–20) M/P 40–60
Grass-based hay/silage 20-80* 9 (5–12) 12 (3–30) M/P 45–60
Legume -based hay/silage 20-80* 9 (5–12) 17 (5–26) M/P 35–55
Oaten hay 85 8 (6–10) 9 (9–17) P 50–60
Maize silage 35 10 (9–11) 6 (5–8) P 40–55
Sorghum silage 35 8 (7–9) 6 (5–8) P 50–60
Oaten straw 85 6 (5–7) 3 (2–4) – –
Barley straw 85 6 (5–8) 3 (2–5) – –
Rice straw 85 6 (5–7) 4 (3–5) – –
* Hay – 80–85%, round bale silage – 40–80%, pit silage 20–40%
The traditional supplement for dairy cows was pasturehay, conserved from excess pasture growth of thepreceding spring. Its low and variable quality generallygave poor milk production responses. Consequently,farmers now feed milkers a combination of silage andhigh-energy or -protein supplements. Hay or silage is oftenseen as a suitable supplement only for dry cows or youngstock. However, if high-quality pasture hay or silage can
be made or purchased consistently, it can be used toovercome feed shortages in summer and autumn pastures.The two roughages can have similar nutritive values.
High-quality conserved forages such as pasture silage canalso provide the necessary fibre and protein to balance thediet. Silage requires a shorter time for sun curing than hay,so it can be made with less risk earlier in the season whenpasture quality is higher.
Table 9.5 shows some typical ranges of feed qualities for
hays and silages from grass and legume pastures inwestern Victoria.
Pasture silage is generally higher in nutritive value thanhay. Therefore, milk responses to pasture silage should bebetter than to hay.
92
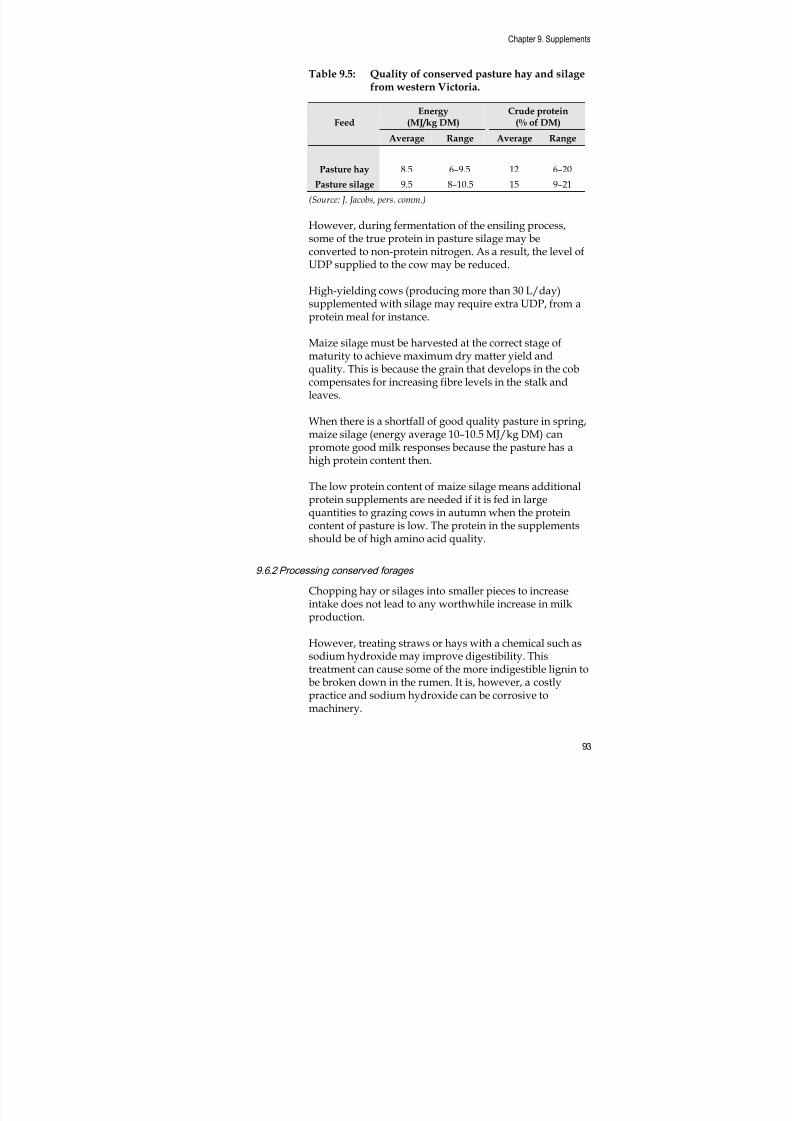
7/22/2019 Feeding Dairy Cows Manual
http://slidepdf.com/reader/full/feeding-dairy-cows-manual 122/264
Chapter 9. Supplements
Table 9.5: Quality of conserved pasture hay and silagefrom western Victoria.
FeedEnergy
(MJ/kg DM)Crude protein
(% of DM)
Average Range Average Range
Pasture hay 8.5 6–9.5 12 6–20
Pasture silage 9.5 8–10.5 15 9–21
(Source: J. Jacobs, pers. comm.)
However, during fermentation of the ensiling process,some of the true protein in pasture silage may beconverted to non-protein nitrogen. As a result, the level ofUDP supplied to the cow may be reduced.
High-yielding cows (producing more than 30 L/day)supplemented with silage may require extra UDP, from aprotein meal for instance.
Maize silage must be harvested at the correct stage ofmaturity to achieve maximum dry matter yield andquality. This is because the grain that develops in the cobcompensates for increasing fibre levels in the stalk andleaves.
When there is a shortfall of good quality pasture in spring,maize silage (energy average 10–10.5 MJ/kg DM) canpromote good milk responses because the pasture has ahigh protein content then.
The low protein content of maize silage means additionalprotein supplements are needed if it is fed in largequantities to grazing cows in autumn when the proteincontent of pasture is low. The protein in the supplementsshould be of high amino acid quality.
9.6.2 Processing conserved forages
Chopping hay or silages into smaller pieces to increaseintake does not lead to any worthwhile increase in milkproduction.
However, treating straws or hays with a chemical such assodium hydroxide may improve digestibility. Thistreatment can cause some of the more indigestible lignin tobe broken down in the rumen. It is, however, a costly
practice and sodium hydroxide can be corrosive tomachinery.
93

7/22/2019 Feeding Dairy Cows Manual
http://slidepdf.com/reader/full/feeding-dairy-cows-manual 123/264
Chapter 9. Supplements
9.6.3 Stage of maturity and nutritive value of conserved forages
The stage of maturity of conserved pasture has aconsiderable effect on its energy value. In a studyconducted in western Victoria, silage cut on 5 October
contained 11.3 MJ/kg DM (Figure 9.1). Perennial pasturewas still in its vegetative, pre-flowering stage of growth atthis time. The energy density remained above 11 MJ/kgDM until the last week of October.
9
9.5
10
10.5
11
11.5
5 O c t
1 2 O c t
1 9 O c t
2 6 O c t
2 N o v
9 N o v
1 6 N o v
Date of cutt ing
M E
( M J / k g )
(Source: Jacobs et al.,1998)
Figure 9.1: Typical changes in nutritive value of silageas pasture matures.
At this point ear emergence occurred in the ryegrassfraction of the sward and energy values declinedthereafter. Clearly, any pasture conserved too late in the
season would be of little benefit to milkers because of itslower energy density.
9.7 Fodder crop supplements
In Victoria, fodder crops have become an importantsupplement to pastures over summer and autumn. Somedairy farmers have also sown fodder crops in autumn totry to fill the winter feed gap. Table 9.6 lists the most
common fodder crops grown in Victoria and their feedvalues, where available.
94

7/22/2019 Feeding Dairy Cows Manual
http://slidepdf.com/reader/full/feeding-dairy-cows-manual 124/264
Chapter 9. Supplements
Table 9.6: Nutritive value of some commonly grownfodder crops.
Feed
Dry
matter
(%)
Energy
(MJ/kg DM)
Average (Range)
Crude protein
(% of DM)
Average (Range)
UDP
supply NDF
(% of
DM)
Turnips, whole 10 13 (11–13) 11 (6–18) – 22
Turnips, leaf 9 12 (4.5–11) 14 (8–20) – 24
Turnips, root 11 13 (13–14) 9 (6–15) – 21
Rape 14 12 – 20 – – 30
Pasja 14 13 – 20 – – 30
Millet 18 9 – 11 – P 40–60
Sorghum 18 9 (7–11) 12 (7–18) P 40–60
Oats, flowering 23 9 – 8 – – 60
Oats, immature 16 10 (9–12) 21 (20–24) – 46Maize, tassel stage 19 10 – 11 – – 50
Typical annual ryegrass 16 11 (9.5–11) 22 (18–24) – 30–45
The most common fodder crops grown in southernVictoria are turnips and, to a lesser extent, maize and rape.
Turnips in particular are high in energy and can be usedlike a concentrate when fed to cows. They are relativelycheap to grow and can yield 7–9 tonnes DM/ha when
sown in mid to late October. The fibre content of turnipsmay be low, and if fed with a cereal grain there could beinsufficient fibre and protein levels in the total diet.
Trials at Ellinbank Dairy Research Institute indicate thatthe protein content of turnips may be borderline (P. Moate,pers. comm.). Feeding cottonseed meal (a high-proteinfeed) with grazed turnips, gave a better milk yieldresponse than grazed turnips alone.
Maize can be eaten as a green crop or made into silage. A
problem with making maize silage in southern Victoria isthe time required before the crop can be harvested (lateApril). It means pasture resowing is delayed. Maize alsohas a low protein content. This should be considered whenbalancing diets.
In northern Victoria, fodder crops such as sorghum andmillet are grown. They make reasonable feeds whilegrazed, but if left to grow for silage, they are low in energyand protein.
95

7/22/2019 Feeding Dairy Cows Manual
http://slidepdf.com/reader/full/feeding-dairy-cows-manual 125/264
Chapter 9. Supplements
Some forage crops can be toxic at certain stages ofdevelopment. Therefore their grazing management shouldbe discussed with local dairy officers and consultants.
In the past, oats were the only fodder crop normally grown
as a winter feed, even though they are not well adapted tograzing. Now it is common practice to oversow paddockswith annual ryegrasses or to sow ryegrasses as a foddercrop because they are better adapted to grazing by cattle.
9.8 Energy and protein variation among feeds
The tables in this chapter highlight the wide variation inenergy and protein levels among and within feeds. When
formulating diets for dairy cows, estimates of the nutritivevalue of the diet are only as good as the informationavailable on the ingredients. It is important to use reliableenergy and protein values when formulating diets.
96

7/22/2019 Feeding Dairy Cows Manual
http://slidepdf.com/reader/full/feeding-dairy-cows-manual 126/264
Chapter 9. Supplements
97
EXERCISE 9.1:
Use your knowledge of the nutritive value of feeds and minimum cow requirements to solve the following
problems:
a) For each nutrient category, rank the feeds in boxes A–H from highest to lowest.
Write the identifying letter in the appropriate cell of thetable.
b) Which feeds, on their own, would meet the minimumrequirements of a 500 kg cow in early lactation, that is
producing 25 L of milk with 4.2 per cent fat and 3.4 per cent protein?
Use Worksheet 1 to help you calculate the requirements of the cow.
A
Latehay
B
Earlysilage
C
Turnips
D
Dairypellets
E
Wetbrewers
grain
F
Goodautumnpasture
G
Poorautumnpasture
H
Barley/lupin mix
(20% lupin)
DM(%)
Energy(MJ/kg DM)
Protein(% CP)
Fibre(% NDF)
Highest
Lowest

7/22/2019 Feeding Dairy Cows Manual
http://slidepdf.com/reader/full/feeding-dairy-cows-manual 127/264
9 8
Worksheet 1: The daily energy, protein and fibre needs of a cow (Exercise 9.1b)
The cow Her energy needs Her protein needs
Cow liveweight A For maintenance I
kg(Table 5.1)
MJ
Daily activity level B For activity J Early lactation 16–18%
Terrain(1-5)
MJ /km X = MJMid-lactation
Late lactation
14–16%
12–14%
from B km Dry 10–12%
Month of pregnancy D For pregnancy L
th month(Table 5.2)
MJ
Daily milk production E For milk production
Volume litres(Table 5.3)
F M
Fat test % X = MJG from E MJ/L
Proteintest
%
Daily change in body For or from conditioncondition H (Table 5.5) N
gain+ loss-
kg/cow/day
X = MJ
from H MJ/kg
Total daily needs of this cow: Energy MJCrudeprotein %
I +J+L+M± N from above

7/22/2019 Feeding Dairy Cows Manual
http://slidepdf.com/reader/full/feeding-dairy-cows-manual 128/264
Chapter 10. Effects of Supplements on Pasture Intake
10. Effects of Supplements on Pasture
Intake
Supplements are usually intended to improve or maintainmilk production, cow condition or pasture availability.
The impact of supplementary feeding can be difficult toassess because the results may not appear immediatelyin the vat.
In the short term, the response to a supplement may be
small. But if the supplement is used to ‘carry the herdover’ to a period when availability of pasture improvesor a lower-priced supplement (such as a crop) becomesavailable, then it may be important and ultimatelyprofitable.
The factors affecting responses to supplementary feedingare numerous (Figure 10.1) and their interaction iscomplex. The results of supplementary feeding can vary.
MILK RESPONSE
Stage of lactation
Level of production
Cowcondition
Amount of concentrate
Amount of pasture
Quality of pasture
Quality of concentrate
Method of feeding
Figure 10.1: Some of the factors which influence theresponses of dairy cows to supplementaryfeeding.
The economic impact of supplements can only be assessedin relation to the overall farm feeding system.Nevertheless, it is the short-term or immediate responsewhich impacts on cash flow.
99

7/22/2019 Feeding Dairy Cows Manual
http://slidepdf.com/reader/full/feeding-dairy-cows-manual 129/264
Chapter 10. Effects of Supplements on Pasture Intake
10.1 Substitution
Grazing dairy cows may eat less pasture whensupplements are fed. The term ‘substitution’ describesthe extent to which a supplement replaces pasture which
would otherwise have been eaten had the supplementnot been offered.
If supplements are fed when pasture has not been wellutilised, it is likely that there will be no increase in milkproduction and pasture will be wasted.
Substitution rate is the reduction in pasture dry matterintake per kilogram of supplement offered. The majorfactor influencing substitution rate is the level of pastureintake achieved if no supplements had been fed.
A substitution rate of 0.25 means that for every kg DM ofsupplement eaten, pasture intake will fall by 0.25 kg DM.
Table 10.1 presents results from a series of short-termgrazing trials conducted at the Ellinbank Dairy ResearchInstitute in Gippsland.
Six herds in early lactation were rotationally grazed onspring pastures.
Three stocking rates were used: low, medium, and high. Ateach stocking rate, the diet of one herd was supplementedwith 3.2 kg DM/cow/day of commercial pellets. The otherherd was not fed supplements.
At the low stocking rate, the unsupplemented cowsutilised less than 50 per cent of the available pasture.
The total dry matter intake of the supplemented cows onthe low stocking rate increased by only 1.0 kg/day andmilk yield by 0.9 litres/day. They consumed 0.69 kg lesspasture for every kg of supplement fed. The milk responsewas less than 0.28 litres per kilogram of supplement fed.
At the medium and high stocking rates, milk responsesrose to 0.69 L and 0.97 L, respectively. Substitution ratedeclined as stocking rate increased.
100

7/22/2019 Feeding Dairy Cows Manual
http://slidepdf.com/reader/full/feeding-dairy-cows-manual 130/264
Chapter 10. Effects of Supplements on Pasture Intake
Table 10.1: The effect of stocking rate and supplementfeeding on pasture intakes and milk yield inearly lactation.
Stocking rate (cows/ha)
Low Medium High
Supplements (kg/cow/day) 0 3.2 0 3.2 0 3.2
Pasture Allocation(kg DM/cow/day)
33 33 17 17 8 8
Pasture Intake (kg DM/cow/day) 15.9 13.7 11.8 11.0 6.0 6.3
Total Intake (kg DM/cow/day) 15.9 16.9 11.8 14.2 6.0 9.5
Substitution Rate(kg of pasture not eaten foreach kg of supplement fed)
- 0.69 - 0.25 - 0
Milk Yield (litres/cow/day) 23.1 24.0 20.9 23.1 15.4 18.5
Milk Response to Supplement(litres milk/kg supplement fed)
- 0.28 - 0.69 - 0.97
(Source: Grainger and Matthews, 1989)
As stocking rate increases, substitution rate falls.As stocking rate increases, milk response to supplementaryfeeding improves.
For cows to have high pasture DM intakes, they must beoffered a lot more pasture than they can eat. Unfortunately,the utilisation of that pasture gets worse as farmers offermore pasture to their cows. This extra uneaten pasture willbe wasted unless it is eaten at the next grazing, but by thensome of it will have died and decayed while the remainder
will be more mature and less palatable.
The extent to which substitution occurs depends on severalfactors:
Amount of pasture allocated daily.
Intake limit of the cow. The closer the cow is to the limit ofher feed intake when a supplement is offered, the greaterthe substitution.
101

7/22/2019 Feeding Dairy Cows Manual
http://slidepdf.com/reader/full/feeding-dairy-cows-manual 131/264
Chapter 10. Effects of Supplements on Pasture Intake
Quality of pasture. If the pasture is the same or poorerquality than the supplement, then the supplement willbe eaten first.
Cows grazing abundant, high-quality pasture and fed
high-quality supplements, will eat the supplement ratherthan the pasture. Almost complete substitution occurs (ie.cows eat 1 kg less pasture for each 1 kg of supplementeaten).
Type of supplement. Substitution is generally greater whenroughage (hay, silage) supplements are fed than whenconcentrates are fed. This reflects the volume thesupplements occupy in the rumen and how quickly theyare digested to make room for more feed (i.e. roughagesare bulky and are digested slowly).
Balance of the diet as a result of feeding supplements. If thesupplement corrects a dietary imbalance, less substitutionoccurs and intake may increase. However, if an imbalanceis made worse, total intake may be reduced.
Where there is an ample supply of pasture, cows willusually reduce their intake of pasture by 0.3–0.9 kg DM foreach kg DM of grain or pellets eaten. If the substitutionrate is less than 1.0, it means that total DM intake increases
when concentrates are fed.
Substitution is greatest (closest to 1.0, or 100 per cent)when plenty of highly digestible pasture is available andlarge amounts of concentrates are fed. Substitution islowest (closest to 0) when little pasture is available andsmall amounts of concentrates are fed.
As the intake of energy increases, the amount of extra milkproduced from each extra unit of energy decreases. Inother words, the marginal, or additional, milk responsedecreases as the level of supplement intake increases.
The main reason for the decreasing marginal milk responseis that, with successive increments of feed energy, the cowincreasingly partitions nutrients from milk production tobody tissue production as milk production approaches thecow’s genetic potential.
On farm, it is difficult to determine the precise amount ofsubstitution that occurs. If pasture is of good quality and
cows are leaving too much behind, you can be confidentthe substitution rate is at the higher end of the scale.
102

7/22/2019 Feeding Dairy Cows Manual
http://slidepdf.com/reader/full/feeding-dairy-cows-manual 132/264
Chapter 10. Effects of Supplements on Pasture Intake
Remember, pasture left behind will be of low quality andpalatability by next grazing, causing a lower amount ofpasture to be eaten at this and future grazings.
10.2 How cows respond to supplements
Responses to supplementary feeding have both immediateand delayed components. Some of the supplement goesimmediately to milk production and some goes to body fat,which contributes to milk production at a later stage whencondition is ‘mobilised’.
To manage the feeding of supplements effectively, itis important to know how cows respond to them. The
response is variable. It depends on the circumstancesin which the supplement is fed.
The response in milk yield is generally due to the extraenergy in the supplement. Unless the supplementimproves the use of nutrients already in the diet, you willnot get any more milk than the energy the supplementcontains. As most supplements contain around 11 MJ/kgDM, there is only enough energy for a response ofapproximately 2 L of milk per kg DM of supplement.
In practice, pasture substitution almost always occurs,resulting in the response being less than that predictedfrom the amount of energy in the supplement. Theresponse will reduce by the equivalent of the energy in thepasture no longer eaten. Also, some of the energy in thesupplement goes to condition score rather than straightinto milk. So the immediate milk response will be smalleragain.
Most experiments have only measured the immediateresponse to supplements. In a review by Kellaway andPorter (1993), only two experiments reported results onimmediate milk response and delayed milk responsefrom condition score (ie. the total response).
One experiment found a total response of 1.1 L of milk perkg DM of supplement fed. The other reported a totalresponse of 2.5 L of milk per kg DM of supplement fed.
We know more about the immediate response tosupplements.
103

7/22/2019 Feeding Dairy Cows Manual
http://slidepdf.com/reader/full/feeding-dairy-cows-manual 133/264
Chapter 10. Effects of Supplements on Pasture Intake
In early lactation, the average immediate response toconcentrate feeding is 0.6 L of milk per kg of supplement(range: 0.2 to 1.0 L).
In mid-lactation to late lactation, the average immediate
response is 0.5 L of milk per kg of supplement (range: 0.3to 0.8 L).
More recent research from Ellinbank and Kyabram hasmeasured immediate responses ranging between 0.1and 1.6 L per kg of supplement.
A rule of thumb sometimes used is that ‘you get half theresponse now and half later when the condition scoreenergy is converted to milk’. Given the scant experimentalevidence, it is not possible to say whether this is true ornot.
At this point, you may wonder what to make of the milkresponse to supplementary feeding.
When trying to estimate the response to a supplement, askyourself, ‘Does the supplement meet a need of the cow?’Her needs are for quantity and quality of feed.
10.2.1 Quantity of pasture
If the cow already has enough to eat, feeding more isunlikely to result in a big increase in milk production.However, a hungry cow should give a good response.
There seems to be a good relationship between the amountof pasture on offer and the size of the milk response tosupplement. When the quantity of pasture offered is low,the response to feeding supplement is relatively large.High pasture allowance results in little or no response tosupplement feeding. The difficulty is determining the
availability of a particular pasture to the cow. For example,30 kg of dry matter per cow is more available if it isprovided as 12 cm high pasture rather than as a larger areaof 3 cm high pasture.
The type of pasture left after grazing is a good guide tohow hungry a cow is (and so is her preparedness to eatmore). If the cow is prepared to eat pasture of lowpalatability, her preparedness to eat more is likely to behigh. If she is being fussy about what pasture she eats and
leaves good quality pasture uneaten, the cow is indicatingshe has enough to eat and is able to be choosy.
104

7/22/2019 Feeding Dairy Cows Manual
http://slidepdf.com/reader/full/feeding-dairy-cows-manual 134/264
Chapter 10. Effects of Supplements on Pasture Intake
10.2.2 Quality of pasture
If the pasture quality is as good as the quality of thesupplement that replaces it, you would expect little or noresponse (if quantity of pasture was not limiting intake).
If the pasture quality is low compared with thesupplement quality, you would expect a relatively goodresponse. This is due to the supplement containing morenutrients than the pasture it replaces and because feed ofhigher quality has a positive effect on intake.
10.3 When is supplementary feeding profitable?
The profitability of supplements is easiest to determine
when feed intake is well below cow requirements. It willnot only be a matter of profitability, but of survival. Theanimal needs to be fed to survive.
The next level is when cows are moderately well fed. Atypical total milk response is about 0.5 L now and perhaps0.5 L later for each kilogram DM of supplement. A simplelook at profit and cost would suggest break-even is whenthe cost of the supplement is equal to the value of the totalmilk response.
EXAMPLE 10.1:
22c/L(price now)
x 0.5 L/kg DM of sup. fed(immediate response)
= 11c
18c/L(price next lactation)
x
0.5 L/kg DM of sup. fed(delayed response)
= 9c
Total benefit = 20c
In this case, it is profitable to feed the supplement if it costsless than 20c/kg DM.
A third situation is when cows are well fed at pasture butsupplements are fed to increase milk yield. The totalresponse from each kg DM of supplement fed will becloser to 0.25 L now and perhaps 0.25 L in the nextlactation coming from condition.
The break-even point to make a profit from this can beestimated as before.
105

7/22/2019 Feeding Dairy Cows Manual
http://slidepdf.com/reader/full/feeding-dairy-cows-manual 135/264
Chapter 10. Effects of Supplements on Pasture Intake
EXAMPLE 10.2:
22c/L(price now)
x 0.25 L/kg DM of sup. fed(immediate response)
= 5.5c
18c/L(price next lactation)
x
0.25 L/kg DM of sup. fed(delayed response)
= 4.5c
Total benefit = 10c
The supplement would need to cost less than 10c/kg DMfor supplementary feeding to be profitable.
However, there is more than just the effect on milk
production to consider. For example:
• Without supplementary feeding the cows may lose toomuch body condition, which would affect their abilityto get in calf.
• The cows may be grazing to below 3–4 cm. This slowspasture growth. A short period of supplementaryfeeding would benefit pasture growth and help feed thecows better pasture at the next grazing.
• Feeding supplements may enable a higher stocking rate,which could allow pasture to be better and moreprofitably utilised, even though at certain times of theyear the supplements might not give an immediateprofit.
10.3.1 Excessive use of supplements
Overuse of supplements reduces pasture quality andutilisation and depresses milk production at subsequentgrazings.
You need to be the judge of how large or profitable theresponse will be based on the evidence.
A crude test to determine the size of the response is to puta kilogram of supplement into the diet, or take a kilogramout, and then watch what effect that has in the vat and onhow much pasture remains after grazing.
106

7/22/2019 Feeding Dairy Cows Manual
http://slidepdf.com/reader/full/feeding-dairy-cows-manual 136/264
Chapter 11. Formulating a Diet
11. Formulating a Diet
Formulating a diet is an important part of an everydayfeeding strategy. It is a means of meeting production andfinancial goals by feeding to the specific requirements ofthe cow in the most economical way.
To formulate a diet, we have to know the quantity ofnutrients the cow or herd needs to meet production andanimal health goals, and the nutrient content of the feeds.
A balanced diet is one in which:
cow nutrient requirements = nutrients available in the diet.
Another consideration in balancing diets is whether thecow is physically able to eat the amount of feed we intendto provide.
The final consideration is economics. The economicresponse from feeding specific nutrients must be morethan their cost. This aspect is often forgotten.
Diet formulation is largely a set of mathematicalprocedures. However, close observation of cows is alsoimportant. Herd production, fertility, body condition andhealth are good indicators of nutritional imbalances.
11.1 Information needed to formulate a diet
11.1.1 Cow requirements
Cow requirements should be calculated on realistic
production goals. Factors to consider are milk productionand composition, animal activity, weight, stage ofpregnancy and changes in body condition.
Minerals and vitamins are necessary to fine tune thesystem. Often trace element deficiencies are regional andseasonal. Their variability may depend on pasturemanagement. When the basal diet is predominantlypasture, most of these problems can be reduced bymanaging pastures well.
107

7/22/2019 Feeding Dairy Cows Manual
http://slidepdf.com/reader/full/feeding-dairy-cows-manual 137/264
Chapter 11. Formulating a Diet
Minerals and vitamins have not been included in theexercises in this chapter, although it is important to knowwhether deficiencies are present on your farm.
11.1.2 Nutrients in feeds
Feeding of dairy cows in Victoria is predominantlypasture-based. Pasture is the cheapest feed available whenit is fully utilised. The main aim of supplementary feedingis to use the pasture to its maximum, as well as filling feedgaps that occur due to seasonal and managementvariations.
In pasture-based systems, the most limiting nutrient formilk production is energy.
11.1.3 How to formulate a diet
The group of exercises in this chapter will introduce you toone way of calculating whether the diet of your cows isappropriate if they are to reach their expected lactation andliveweight performance.
As you fill in the worksheets, you will need to refer toprevious chapters or to Appendix C, where all of thenecessary tables are collated. You will need to use a
calculator to complete this section. Answers to theexercises are given in Appendix A.
108

7/22/2019 Feeding Dairy Cows Manual
http://slidepdf.com/reader/full/feeding-dairy-cows-manual 138/264
Chapter 11. Formulating a Diet
109
Exercise 11.1: Calculate the requirements of cows in thisherd.
The farm is:• on flat land, and
• the cows walk an average of 5 km per day to be milked.
The herd comprises:• 160 Friesian dairy cows in early lactation with an
average liveweight of 550 kg
The herd produces:• 4000 litres per day
• Fat and protein tests are 4.6 per cent and 3.2 per cent respectively
• The cows are losing roughly 1.5 kg liveweight per day,or just over one condition score a month.
From this information, determine the nutritiverequirements of the cows, using Worksheet 1.
Hints:
Cows are in early lactation. Therefore, there is no need to
account for pregnancy.
Cows are losing condition. Fat is being mobilised to provideenergy for milk production and other needs.

7/22/2019 Feeding Dairy Cows Manual
http://slidepdf.com/reader/full/feeding-dairy-cows-manual 139/264
Worksheet 1: The daily energy, protein and f ibre needs of a cow (Exercise 11.1)
The cow Her energy needs Her protein needs
Cow liveweight A For maintenance I
kg(Table 5.1)
MJ
Daily activity level B For activity J Early lactation 16–18%
Terrain(1-5)
MJ /km X = MJMid-lactation
Late lactation
14–16%
12–14%
from B km Dry 10–12%
Month of pregnancy D For pregnancy L
th month(Table 5.2)
MJ
Daily milk production E For milk production
Volume litres(Table 5.3)
F MFat test % X = MJ
G from E MJ/L
Proteintest
%
Daily change in body For or from conditioncondition H (Table 5.5) N
gain+ loss-
kg/cow/day
X = MJ
from H MJ/kg
Total daily needs of this cow: Energy MJCrude
protein%
I +J+L+M± N from above
108
1 1 0

7/22/2019 Feeding Dairy Cows Manual
http://slidepdf.com/reader/full/feeding-dairy-cows-manual 140/264
Chapter 11. Formulating a Diet
Exercise 11.2: Determine the nutritive value of the usualdiet.
For most purposes, feed is talked about and measured inkilograms of dry matter (kg DM). However, we must oftendeal with ‘wet,’ or as-fed, weights.
This farm is pasture-based, with supplements of wheat and silage. Pasture is kept short and leafy most of the year and is of relatively good quality. The farmer has had analyses made of the feed used on the farm, and the resultsare given in Table 11.1.
Rotational grazing allows 1600 kg DM pasture to be
consumed by the herd each day:
1600 kg DM ÷ 160 cows = 10 kg DM/cow(Sample 1; Table 11.1)
Plenty of silage left from last year is also offered at 7 kg (as-fed)/cow/day (Sample 2; Table 11.1)
Wheat is readily available and offered at 5.6 kg (as- fed)/day (Sample 3; Table 11.1)
From this information, use Worksheet 2 to determine acow’s total intake of energy, protein and fibre from thisdiet.
111
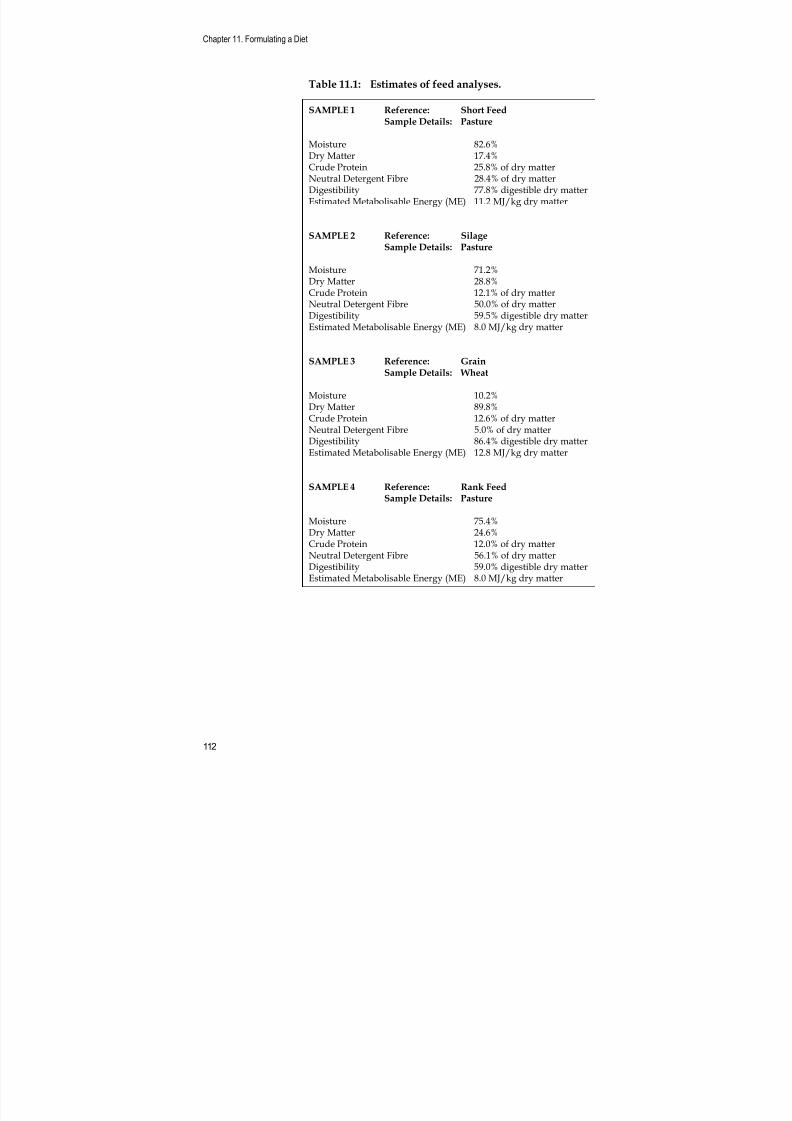
7/22/2019 Feeding Dairy Cows Manual
http://slidepdf.com/reader/full/feeding-dairy-cows-manual 141/264

7/22/2019 Feeding Dairy Cows Manual
http://slidepdf.com/reader/full/feeding-dairy-cows-manual 142/264
Worksheet 2: The energy, protein and fibre content of a diet (Exercise 11.2)
Dry matter Energy Protein
Pasture A F J
X = X÷
100 =kg DM
/cow/day
from A MJ/kg DM
from feed test
MJ/cow/day from A protein %
from feed test
kg/cow/day from
Supplement 1: B G K
X ÷ 100 = X = X ÷ 100 =kg/cow/day dry matter % from
feed test
kg DM
/cow/day
from B MJ/kg DM
from feed test
MJ/cow/day from B protein %
from feed test
kg/cow/day from
Supplement 2: C H L
X ÷ 100 = X = X ÷ 100 =kg/cow/day dry matter % from
feed test
kg DM
/cow/day
from C MJ/kg DM
from feed test
MJ/cow/day from C protein %
from feed test
kg/cow/day from
Supplement 3: D I M
X ÷ 100 = X = X ÷ 100 =kg/cow/day dry matter % from
feed test
kg DM
/cow/day
from D MJ/kg DM
from feed test
MJ/cow/day from D protein %
from feed test
kg/cow/day from
E N
Total Total daily dry matter intake Total daily energy intake Total daily protein intake
A+B+C+D
kg DM/cow
F+G+H+I
MJ /cow
J+K+L+M
kg/cow
Total daily DM intake limit
Use T and Table 11.2 or the formula
Protein % of ration
(120÷ T)÷ 100x liveweight kg/cow N÷Ex100
Cow requirements (from Worksheet 1)
Total daily energyrequirement Crude protein requirement
MJ % 1 1 3

7/22/2019 Feeding Dairy Cows Manual
http://slidepdf.com/reader/full/feeding-dairy-cows-manual 143/264
Chapter 11. Formulating a Diet
114
Exercise 11.3: Revise the diet to account for pasture
maturity. As ryegrass and clover pastures mature, their qualitydeteriorates. What would happen if, instead of good quality pasture, the farmer was feeding longer, ranker
pasture?
The same amounts of wheat and silage are offered as in Exercise 11.2.
Instead of good-quality pasture, the farmer now feeds poorer-quality pasture at 10 kg DM/cow/day.
(Sample 4; Table 11.1)
From this information, use Worksheet 2 to determine thetotal intake of energy, protein and fibre from this diet.

7/22/2019 Feeding Dairy Cows Manual
http://slidepdf.com/reader/full/feeding-dairy-cows-manual 144/264
Worksheet 2: The energy, protein and fibre content of a diet (Exercise 11.3)
Dry matter Energy Protein
Pasture A F J
10 10X =
10X
÷100 =kg DM
/cow/day
from A MJ/kg DM
from feed test
MJ/cow/day from A protein %
from feed test
kg/cow/day from
Supplement 1: Silage B G K
7 X 28.8 ÷ 100 = 2 2 X 8 = 16 2 X 12.1 ÷ 100 = 0.2 2
kg/cow/day dry matter % from
feed test
kg DM
/cow/day
from B MJ/kg DM
from feed test
MJ/cow/day from B protein %
from feed test
kg/cow/day from
Supplement 2: Wheat C H L
5.6 X 89.8 ÷ 100 = 5 5 X 12.8 = 64 5 X 12.6 ÷ 100 = 0.6 5
kg/cow/day dry matter % from
feed test
kg DM
/cow/day
from C MJ/kg DM
from feed test
MJ/cow/day from C protein %
from feed test
kg/cow/day from
Supplement 3: D I M
X ÷ 100 = X = X ÷ 100 =kg/cow/day dry matter % from
feed test
kg DM
/cow/day
from D MJ/kg DM
from feed test
MJ/cow/day from D protein %
from feed test
kg/cow/day from
E N
Total Total daily dry matter intake Total daily energy intake Total daily protein intake
A+B+C+D
kg DM/cow
F+G+H+I
MJ /cow
J+K+L+M
kg/cow
Total daily DM intake limit
Use T and Table 11.2 or the formula
Protein % of ration
(120÷ T)÷ 100x liveweight kg/cow N÷Ex100
Cow requirements (from Worksheet 1)
Total daily energyrequirement Crude protein requirement
MJ % 1 1 5

7/22/2019 Feeding Dairy Cows Manual
http://slidepdf.com/reader/full/feeding-dairy-cows-manual 145/264
Chapter 11. Formulating a Diet
After completing the previous three exercises, consider thefollowing question in Exercise 11.4.
Exercise 11.4: Do the diets meet cows’ requirements?
Compare Worksheet 1 with the two versions of Worksheet 2 to determine whether the diets meet the cows’ energy, protein, and fibre requirements.Summarise the information in the table:
Situation Energy Protein Fibre
Cows’ requirements(Exercise 11.1)
Usual diet(Exercise 11.2)
Poorer-pasture diet(Exercise 11.3)
11.2 Estimating the limits of feed intake
As well as knowing what the cow needs and whatnutrients the feeds can provide her, we also need to be surethat the cow can eat the amount of food which can providethose nutrients. This section contains two rules of thumbfor estimating how much cows will eat. These tests can be
used when deciding how much to offer your cows or forfeed planning.
How much could a cow eat, given a particular feedingsituation?
We would be pretty clever if we could accurately predictintake limits. However, we need to start somewhere.
It is difficult to measure intake of grazing animals
accurately. However, as pasture managers, we needthis information to get the best from pastures.
11.2.1 Cow size and feed quali ty
Cow size and feed quality are two major influences onfeed intake. It comes as no surprise that rules of thumbfor estimating cow intake limits are based on these twofactors.
Other things also affect intake, so remember that there will
be exceptions to these rules.
116

7/22/2019 Feeding Dairy Cows Manual
http://slidepdf.com/reader/full/feeding-dairy-cows-manual 146/264
Chapter 11. Formulating a Diet
One rule of thumb is that a cow can generally eat 3 percent to 4 per cent of her bodyweight.
Example 11.1: Estimating the intake limits of cows of various weights, using 3 per cent of their bodyweight.
475 kg X (3 ÷ 100) = 14.3 kg DM/day intake limit.
500 kg X (3 ÷ 100) = 15 kg DM/day intake limit.
550 kg X (3 ÷ 100) = 16.5 kg DM/day intake limit.
Example 11.2: Estimating the intake limits of cows of various weights, using 4 per cent of their bodyweight.
475 kg X (4 ÷ 100) = 19 kg DM/day intake limit.
500 kg X (4 ÷ 100) = 20 kg DM/day intake limit.
550 kg X (4 ÷ 100) = 22 kg DM/day intake limit.
Cow size on its own may not be a good indicator of intakelimits for individual cows. Cows of the same weight candiffer in appetite, in rumen capacity or in grazing habits.
Feed of the same quality may be eaten in differentamounts, depending on how long it is, or how palatablethe cow thinks it is.
Some American and European advisers on dairy nutritionuse another rule of thumb:
As the percentage of neutral detergent fibre (NDF)increases in forages, cows eat less according to thefollowing formula:
(120 ÷ NDF %) ÷ 100 X liveweight = kg DM/dmaximum intake
Example 11.3: Estimating the intake limits of cows of various weights eating a feed of 35 per cent NDF.
(120 ÷ 35) ÷ 100 X 475 kg = 16.3 kg DM/day intake limit.
(120 ÷ 35) ÷ 100 X 500 kg = 17.1 kg DM/day intake limit.
(120 ÷ 35) ÷ 100 X 550 kg = 18.9 kg DM/day intake limit.
117

7/22/2019 Feeding Dairy Cows Manual
http://slidepdf.com/reader/full/feeding-dairy-cows-manual 147/264
Chapter 11. Formulating a Diet
Table 11.2 lists the maximum daily intake of cows usingvarious NDF percentages.
Table 11.2: Maximum daily intake of cows as affected
by the NDF per cent of the diet.Live- Maximum daily intake (kg DM)
weight NDF %
(kg) 25 30 35 40 45 50 55 60 65 70 75 80
100 4.8 4.0 3.4 3.0 2.7 2.4 2.2 2.0 1.8 1.7 1.6 1.5
150 7.2 6.0 5.1 4.5 4.0 3.6 3.3 3.0 2.8 2.6 2.4 2.3
200 9.6 8.0 6.9 6.0 5.3 4.8 4.4 4.0 3.7 3.4 3.2 3.0
250 12.0 10.0 8.6 7.5 6.7 6.0 5.5 5.0 4.6 4.3 4.0 3.8
300 14.4 12.0 10.3 9.0 8.0 7.2 6.5 6.0 5.5 5.1 4.8 4.5
350 16.8 14.0 12.0 10.5 9.3 8.4 7.6 7.0 6.5 6.0 5.6 5.3
400 19.2 16.0 13.7 12.0 10.7 9.6 8.7 8.0 7.4 6.9 6.4 6.0
450 21.6 18.0 15.4 13.5 12.0 10.8 9.8 9.0 8.3 7.7 7.2 6.8
500 24.0 20.0 17.1 15.0 13.3 12.0 10.9 10.0 9.2 8.6 8.0 7.5
550 26.4 22.0 18.9 16.5 14.7 13.2 12.0 11.0 10.2 9.4 8.8 8.3
600 28.8 24.0 20.6 18.0 16.0 14.4 13.1 12.0 11.1 10.3 9.6 9.0
650 31.2 26.0 22.3 19.5 17.3 15.6 14.2 13.0 12.0 11.1 10.4 9.8
(Source: Linn and Martin, 1989.)
If cows can select within their diets, allowance shouldprobably be made for less fibre in the diet. For example, ifthe diet on offer tests at 40 per cent NDF, then the actualselected diet may be 5 per cent to 10 per cent lower (ie.38 per cent to 36 per cent NDF).
This rule applies to empty cows. The capacity of pregnantcows is less because the rumen size is reduced by theincreased size of the womb.
Exercise 11.5: Can cows physically eat that much feed?
Calculate the cows’ intake limit, using the NDF percentages from Exercises 11.1, 11.2, 11.3 and either Table11.2 or the formula relating intake to NDF. Use the table
below to compare these limits with the intakes calculated earlier.
Diet Total daily DM intake Daily DM intake limit(kg DM) (kg DM)
Usual(Exercise 11.2)
Poorer pasture(Exercise 11.3)
118

7/22/2019 Feeding Dairy Cows Manual
http://slidepdf.com/reader/full/feeding-dairy-cows-manual 148/264
Chapter 11. Formulating a Diet
COMMENTS ON EXERCISES 11.1— 11.5
• Good quality pasture with supplements meets therequirements of the cow. The fibre is lower than 30 percent NDF and therefore may be too low; however,
intake in early lactation may be limited by gut fill.Lower fibre diets fed during this time may ensuregreater intakes of energy, but this value will need to beadjusted as animal intake increases through lactation.
• Poor quality pasture may lead to deficiencies andproduction losses. The poor quality diet is deficient inenergy and protein. It requires more energy andprotein. More poor quality pasture must be fed to equalthe energy intake from good quality pastures. However,the fibre content of the pasture is high and may limit
intake.
11.3 To balance a diet
To balance a diet, you need to know what the nutrientdeficiencies are. For example, in Exercise 11.3, energy andprotein were lacking. This diet can be balanced by offeringmore pasture or by including more supplements toincrease energy and protein levels in the diet. This is verymuch trial and error.
Available pasture from a specific rotation determines thelevel of pasture in the diet, and supplements add to thisbase. There are generally a number of diet formulationsthat can meet the requirements of the cow.
11.4 Costs of supplements
Choosing the most economical supplement depends on
the deficiency being corrected: whether energy, protein orfibre.
For example, if energy is deficient, then choose the feedthat provides the most energy at the cheapest price permegajoule.
Price per tonne of DM can be deceptive. Look at thecomposition of the dry matter. Prices for wet or as-fed feedare even more deceptive: who wants to pay for water?
119

7/22/2019 Feeding Dairy Cows Manual
http://slidepdf.com/reader/full/feeding-dairy-cows-manual 149/264

7/22/2019 Feeding Dairy Cows Manual
http://slidepdf.com/reader/full/feeding-dairy-cows-manual 150/264
Chapter 11. Formulating a Diet
Worksheet 3: The cost of nutrients in feeds
(Exercise 11.6) Feed 1:
ACost per kg DM
÷ 100 = X
kg bought (i) DM % kg DM
bought
B
÷ = † X 100
Cost of (i) ($) kg DM
bought (from
A)
c/kg DM
CCost per MJ ME
÷ =
c/kg DM
(from B)
MJ ME
/kg DM
c/MJ ME
DCost per kilogram crude protein (or NDF)
÷ x 100 =
c/kg DM
(from B)
CP %
(or NDF %)
c/kg CP
(or c/kg NDF)
Feed 2:
ACost per kg DM
÷ 100 =X
kg bought (i) DM % kg DM
bought
B
÷ =† X 100
Cost of (i) ($) kg DM
bought
(from A)
c/kg DM
CCost per MJ ME
÷ =
c/kg DM
(from B)
MJ ME
/kg DM
c/MJ ME
DCost per kilogram crude protein (or NDF)
÷ = X 100
From B
(c/kg DM)
CP %
(or NDF %)
c/kg CP
(or c/kg NDF)
†To convert dollars per kilogram to cents per kilogram.
121

7/22/2019 Feeding Dairy Cows Manual
http://slidepdf.com/reader/full/feeding-dairy-cows-manual 151/264
Chapter 11. Formulating a Diet
In this exercise, the price you pay for energy is essentiallythe same for wheat and silage. However, silage is cheaperif you require protein to balance the diet. Pricecomparisons will vary greatly with quality and pricemovements. Unfortunately, foodstuffs like silage are rarely
bought on the basis of price for quality. As silage qualityvaries so much, so too will the price per megajoule.
11.4.2 Other considerations when costing supplements
Decisions on what supplements to feed depend on morethan just the cost of the feed itself. Increased capitalrequirements, extra labour and other costs need to beconsidered when deciding on the supplement to bestbalance a diet.
For example, feeding brewers grain requires storagefacilities, a front-end loader and maybe a feed-out cart, anda feed trough or feed pad. Farmers often select commercialpellets as their initial supplement because they aregenerally more consistent in quality than cereal grains anddo not require any processing. Lupins are becomingpopular as sources of protein during summer and autumn,but their protein is very degradable and their hard seedcoat places extra wear on grain mills.
Bail-feeding limits the choice supplement to cereal grainsand commercial pellets. Once farmers have invested inequipment to handle by-products, the range ofsupplements that can be fed increases. The best and mosteconomical feed will vary from farm to farm given thefarmer’s situation and equipment.
11.5 Consequences of unbalanced diets
Some indicators of unbalanced diets can be used toidentify dietary problems.
11.5.1 Rumination
After an initial grazing period animals normally start toruminate or chew their cud.
If this is not occurring in a large percentage of the herd,then there may be a lack of fibre in the diet. This may beconfirmed by looking for changes in milk composition (see
Section 11.5.3).
122

7/22/2019 Feeding Dairy Cows Manual
http://slidepdf.com/reader/full/feeding-dairy-cows-manual 152/264
Chapter 11. Formulating a Diet
11.5.2 Loose manure
If faecal material is very loose and watery it may indicate alack of fibre in the diet.
This can also be checked by assessing any changes in milkcomposition.
11.5.3 Low fat test
A drop in fat test tends to occur when the herd is placed ona low fibre diet (e.g. a diet high in cereal grain and lushpasture).
When fibre is fermented by the rumen microbes, theresulting end product, acetate, is used to produce milk fat.
If the level of fibre in the diet is low, milk fat productiondecreases.
The easiest way to increase the fibre content of the diet isto feed hay. Take care though when feeding out poorquality hay. A drop in dietary energy intake could causemilk and protein yield to fall.
11.5.4 Low protein test
Low milk protein content is common in early lactationwhen the cow is in negative energy balance. In otherwords, her energy needs are greater than her intake andshe is losing body condition.
A shortage of energy reduces protein utilisation by rumenmicrobes. As a result, the supply of microbial protein, thecow’s major protein source, is reduced.
Under most circumstances, providing a higher energy dietwill lift protein test.
A cow will only respond to protein supplementation witha lift in protein test if she is truly deficient in dietaryprotein. This is because she is unable to utilise energyproperly when there is a protein shortfall.
When protein is lacking, microbial growth is depressed. Asa result, microbial fermentation is reduced and less energybecomes available to the cow. She loses weight tocompensate for the lack of dietary energy.
When fat is mobilised, milk fat test tends to go up.
123

7/22/2019 Feeding Dairy Cows Manual
http://slidepdf.com/reader/full/feeding-dairy-cows-manual 153/264
Chapter 11. Formulating a Diet
11.6 Metabolic disorders and unbalanced diets
Metabolic disorders can be clinical, when there are obvioussymptoms, or sub-clinical, when there are not. Even at thesub-clinical level, they can depress feed intake and cause
production losses.
Metabolic disorders such as ketosis and acidosis areusually linked to low intakes around calving or to abruptchanges in diet.
Managing nutrition well during the dry period and inearly lactation is the key to preventing or minimising theoccurrence of metabolic disorders.
The aim is to:
• Maximise nutrient intake around calving and in earlylactation by providing enough high quality feed
• Avoid decreases in intake caused by sudden changes indiet when cows calve and join the milking herd.
Nutritional management at this time also plays a majorrole in minimising milk fever and grass tetany.
11.6.1 Milk fever
Milk fever is caused by a sudden and severe decrease inblood calcium levels at the onset of lactation, due to largeincreases in demand for calcium for milk production.
The incidence of milk fever increases with age and thenumber of previous calves.
The cow has mechanisms for adapting to these increaseddemands for calcium.
The mechanisms are:
• increasing the absorption of calcium from the intestine
• mobilising calcium reserves held in bones.
These mechanisms are activated in response to lowconcentrations of blood calcium. But they take some timeto start working after the cow calves.
When this process does not happen quickly enough,
calcium replenishment into the bloodstream cannot keeppace with the output of calcium in milk.
124

7/22/2019 Feeding Dairy Cows Manual
http://slidepdf.com/reader/full/feeding-dairy-cows-manual 154/264
Chapter 11. Formulating a Diet
Once calcium levels fall, muscular tremors and paralysisoccur, followed by cow collapse and eventually death.
The key to reducing the incidence of milk fever is tostimulate the cow’s mechanisms for mobilising calcium
from the skeleton and increasing absorption from theintestine prior to calving, so that she is ‘primed’ to meetthe increased calcium demands after she calves.
Management strategies which can be implemented are:
Feeding diets low in calcium during the dry period. In practice, this means restricting fresh pasture andproviding grass-based hay instead.
Altering the cow’s dietary cation-anion balance (DCAB).Cations are positively charged ions such as potassium andsodium. Anions are negatively charged ions such aschloride and sulfate.
DCAB – dietary cation-anion balance
DCAB refers to the balance between positive ions (sodiumand potassium) and negative ions (chloride and sulphate).Ideally, negatives should outweigh positives, but this isdifficult to achieve in a pasture-based system.
Feeding higher levels of negatively charged ions producesa condition called metabolic acidosis. It appears that cowscan remove calcium from bone more rapidly when theyare affected by metabolic acidosis. The calcium-mobilisation process is encouraged, thus preparing thecow for the increased requirements around calving.
To do this, the diet must be higher in anions than cations.
This means feeding lower levels of potassium and sodium.
How can dietary cation-anion balance be managed?
Choose forages carefully. They can affect the acid-basebalance. Some forages are high in potassium (often dueto potassium fertilisers).
Hays grown on soils with poor fertiliser histories generallycontain less potassium.
Feed anionic salts (also called acid salts). These salts includemagnesium sulphate (Epsom salts), ammonium sulphate
125

7/22/2019 Feeding Dairy Cows Manual
http://slidepdf.com/reader/full/feeding-dairy-cows-manual 155/264
Chapter 11. Formulating a Diet
and ammonium chloride. Some of these salts areunpalatable. There are various methods of feeding them,including commercially prepared pelleted supplements.Note that mixing these salts into molasses to improvepalatability is not a good idea, as molasses contains
potassium, which, being positively charged, tends tocancel out the effect of feeding the extra negativelycharged ions.
Anionic salt mixtures should be discontinuedafter calving.
11.6.2 Grass tetany
Grass tetany or grass staggers often occurs in lactatingcows within the first few months after calving. It appearsas muscular spasms and convulsions and can eventuallycause death.
Grass tetany is associated with low magnesium levels inthe blood. Since magnesium is not stored in the body, thecow relies on a daily intake of magnesium to meet herneeds.
Conditions which reduce magnesium intake or bloodmagnesium levels include:
• Grass-dominant pastures which may not supply themagnesium necessary to meet the needs of a cow inearly lactation
• Topdressing with potash (potassium) or nitrogenousfertilisers. These reduce the availability of magnesiumto the animal (potassium and ammonia restrict theabsorption of magnesium)
• Short periods of fasting which can occur duringyarding, transport or exposure to cold, wet, windyweather.
Grass tetany can be prevented by including a magnesiumsupplement in the diet to provide each cow with 10–15 g ofmagnesium per day. Supplementation should begin oneweek prior to calving and end when clover content inpastures begins to improve. Common sources ofmagnesium are:
• Insoluble magnesium oxide (e.g. Causmag) dusted on tohay or added to bail feed at a rate of 50 g/cow/day ordusted on to pasture at a rate of 50–75 g/cow/day
126

7/22/2019 Feeding Dairy Cows Manual
http://slidepdf.com/reader/full/feeding-dairy-cows-manual 156/264
Chapter 11. Formulating a Diet
• Magnesium incorporated into licks
• Soluble magnesium sulphate (Epsom salts) at a rate of5 g/L/cow/day in drinking water or at a rate of60 g/cow/day in a drench
• Soluble magnesium chloride at a rate of 5 g/litre/cow/dayin drinking water or at a rate of 100 g/cow/day in adrench.
NOTE: High levels (over 30 g per cow per day) ofgranulated causmag (magnesium oxide) have beenidentified as a common factor in herds which are affectedby severe outbreaks of Salmonella. This needs to beweighed up against the risk of grass tetany. Someveterinarians suggest lowering granulated causmag levelsif a Salmonella case occurs.
11.6.3 Ketosis, or acetonaemia
Ketosis, or acetonaemia, occurs when the cow reliesheavily on fat reserves for energy during early lactation. Itis most common in cows fed low energy diets during earlylactation.
When there is insufficient energy in the diet, the cowdraws on body condition to make up the deficit.
Fat reserves contain ketones, a source of energy. Ketonesare often used by the cow to supplement dietary energy,particularly during early lactation – hence the expression‘milking off her back’. To prevent ketosis, feed a wellbalanced diet with enough energy to minimise the relianceon body fat reserves in early lactation. Supplying starchyfeeds rich in rapidly fermentable carbohydrates (cerealgrains) or feeding molasses can reduce the incidence ofketosis.
Ketosis highlights the need to avoid abrupt changes in thediet which may decrease intake in early lactation, and alsounderlines the importance of maximising nutrient intakewith high quality feed during this period.
11.6.4 Lactic acidosis
Under extreme conditions, such as grain overload, largeamounts of lactic acid are formed in the rumen. Acid maybe produced faster than it can be absorbed or buffered.When lactic acid continues to build up, the rumen pH
decreases (becomes more acidic) and microbial activityslows down. When the microbes stop working, fibre
127

7/22/2019 Feeding Dairy Cows Manual
http://slidepdf.com/reader/full/feeding-dairy-cows-manual 157/264
Chapter 11. Formulating a Diet
digestion is reduced and voluntary food intake isdepressed.
To avoid acidosis, grain should be introduced gradually (ie. 0.5kg grain or pellets/cow/day) so that the population of
rumen microbes can adjust according to the type offermentation that is required (more starch fermentingmicrobes may be needed). Remember, though, thatdifferent cows respond differently to grain feeding. Somecows can handle 6 kg of grain per day while others will getsick on 3 kg per day – and there is always a cow that willeat more than her share. The key to success is to make it agradual daily increase and to WATCH your cows andcheck for symptoms of acidosis or grain poisoning.
Buffers can be in the diet to stabilise rumen pH so that therumen environment allows a healthy population of rumenmicrobes.
11.7 Buffers
Buffers stabilise rumen pH and help prevent reductions inpH caused by acids produced in the rumen.
Saliva contains sodium bicarbonate and sodium
biphosphate, which are both naturally occurring buffers.They neutralise rumen pH, keeping it stable at around 6 to7.
When a cow chews her cud (especially in response tofibrous pasture plants) she produces large quantities ofsaliva (100–150 litres of saliva/cow/day).
If there is enough fibre in the diet, saliva production alonecan generally maintain rumen pH. When cows are fed highlevels of cereal grains, starch is fermented quickly in therumen to produce volatile fatty acids (VFAs). Theproduction of VFAs, especially lactic acid, may be greaterthan the rate at which they are absorbed or buffered. Theresulting decrease in the pH of the rumen (increasedacidity) stops other bacteria from digesting fibre. This inturn slows digestion and causes a loss of appetite.
The condition is commonly known as lactic acidosis. Oatsare the safest grain to feed to avoid acidosis. Oats usuallyhave a fibrous husk which causes the cow to salivate more
during eating. In addition to this, more of the starch in oatsis digested in the small intestine than the rumen so the
128
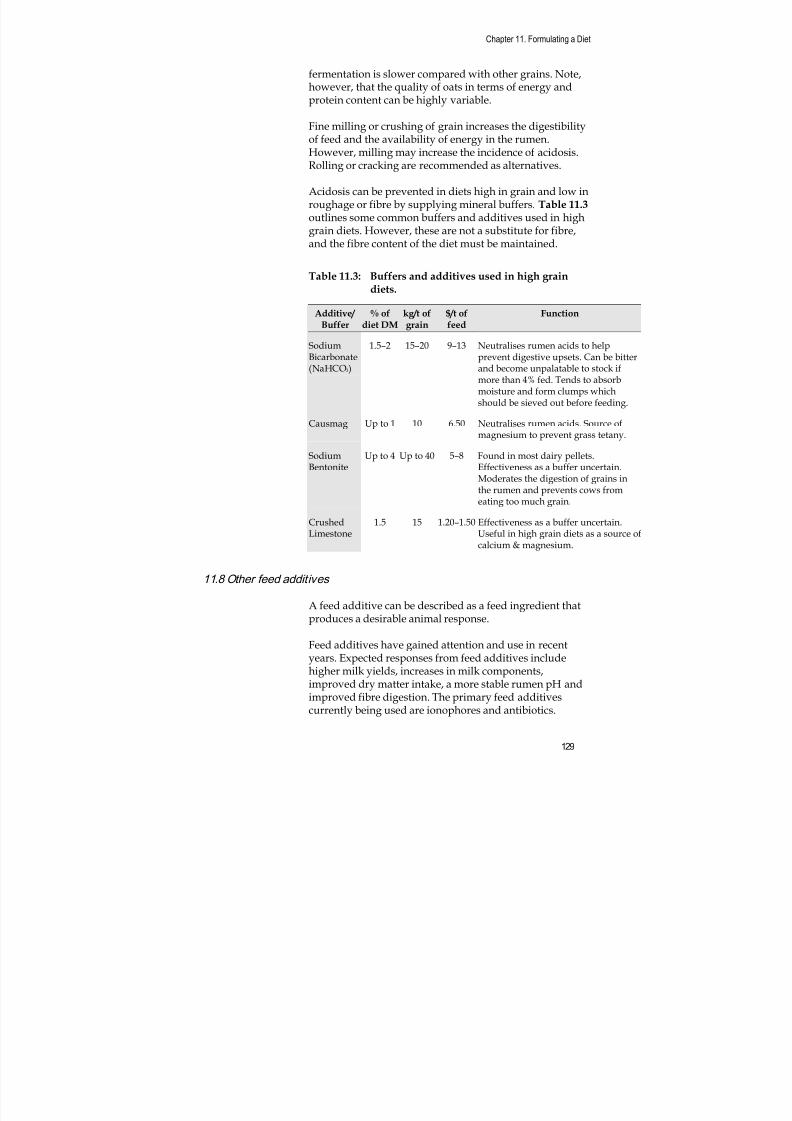
7/22/2019 Feeding Dairy Cows Manual
http://slidepdf.com/reader/full/feeding-dairy-cows-manual 158/264

7/22/2019 Feeding Dairy Cows Manual
http://slidepdf.com/reader/full/feeding-dairy-cows-manual 159/264
Chapter 11. Formulating a Diet
Rumensin® and Eskalin® are two commonly usedadditives which produce their effects by modifying therumen environment. They alter the microbial populationof the rumen, which in turn changes the mix of endproducts from microbial fermentation.
Rumensin® reduces the population of microbes thatproduce methane gas (which cannot be used by the cow asan energy source). The proportion of microbes that fermentfeed to other more useful sources of energy is increased,resulting in improved milk yields. Responses to thisadditive depend on the diet and the stage of lactation.
Eskalin® inhibits the microbes that produce lactic acid andcan therefore play a role in preventing lactic acidosis.
130

7/22/2019 Feeding Dairy Cows Manual
http://slidepdf.com/reader/full/feeding-dairy-cows-manual 160/264
Chapter 12. Diet and its Effect on Milk Production and Body Condition
12. Diet and its Effect on Milk Production
and Body Condition
A cow’s ability to produce milk depends largely on:
• Feed eaten; her intake of protein, energy and fibre.The feed must first be digested (broken down to itsconstituent parts) and the products of digestionabsorbed into the blood from the digestive tract.
• How she uses (or partitions) the products of digestionfor maintenance, activity, pregnancy, milk productionor body condition.
This chapter deals mainly with how a cow partitionsbetween milk, body condition and maintenance.
A cow’s intake (quantity and type of feed and the resultantproducts of digestion) and her use or partitioning of theseproducts to metabolic activities all have an effect on thequantity (litres) and type (test) of milk she produces.
12.1 Products of digestion
There are a range of products from the digestion of feedsconsumed by the dairy cow.
These include ammonia, carbon dioxide, methane, volatilefatty acids, fats, undigested fibre, rumen microbes andundegradable protein.
Some products of digestion are wasted (carbon dioxide,
methane, undigested fibre), and some are used by the cow(see chapter 4).
12.2 Fate of the products of digestion
Fats (from acetate and fats in the diet), glucose (frompropionate), and amino acids (from microbes andundegradable dietary protein), circulate in the cow's bloodstream ready for their role in metabolic processes (Figure
12.1).

7/22/2019 Feeding Dairy Cows Manual
http://slidepdf.com/reader/full/feeding-dairy-cows-manual 161/264
Chapter 12. Diet and its Effect on Milk Production and Body Condition
Figure 12.1: Nutrient flow from diet, through the rumen,to blood, and to the udder or to bodycondition. UDDER BLOOD
Acetate
Propionate
Milk fat
Milkprotein
BODY
Bodycondition
and growth
Glucose
Acetate
Microbes
Aminoacids
Amino
acids
Fat
Ammonia
Lactose
RUMEN
Fat
NPN
RDP
UDP
Sugar Starch
Cellulose
DIET
Figure 12.1: Nutrient flow from diet, through the rumen, toblood, and to the udder or to body condition
12.3 Milk production in the udder
12.3.1 What is milk?
Milk is produced by udder tissue. About 500 litres of blood
pass through the udder to produce one litre of milk. Blooddelivers water, glucose, fats and amino acids to the udder.Cells in the udder tissue use these substances to form andsecrete milk:
Water in the milk comes from water in the blood.
Lactose (milk sugar) is produced from the glucose (frompropionate) in the blood.
Milkfat comes from the fats (from acetate, fats in the diet,
and released body fat) in the blood.

7/22/2019 Feeding Dairy Cows Manual
http://slidepdf.com/reader/full/feeding-dairy-cows-manual 162/264
Chapter 12. Diet and its Effect on Milk Production and Body Condition
Milk protein (mostly casein) is built from the amino acids(from microbes and undegradable rumen protein (UDP))in the blood (using glucose as an energy source to do thebuilding).
The level of fat and protein in milk varies, depending onthe breed of cow, stage of lactation, and the diet. It follows,then, that the dollar value of milk varies too.
12.3.2 Lactose production in the udder
The udder makes lactose from glucose arriving in theblood. The lactose secreted into the udder attracts waterwith it, at roughly constant proportions. Therefore, thelactose content of milk does not change much. It usuallystays at about 4.8 per cent.
Thus the quantity of glucose arriving at the udderdetermines how much lactose is produced and whatvolume of milk is produced.
More bloodglucose
ÎMorelactose (kg)
ÎMoremilk (L)
ÎConstantlactose test
12.3.3 Milkfat production in the udder
The udder makes milkfat from fats carried in the blood.
The blood fats come from acetate (mainly from fibre in thediet), from the fat from body condition, or from fats in thediet (usually not a significant source).
Fat test (percentage) varies greatly, depending on:
• The type of energy in the diet. Fat test is higher whenthe diet is high in fibre. This is because the blood willcarry more acetate, which is used for milkfat.
However, fat test will be lower if the diet is high instarch. This is because the blood will contain moreglucose (from the propionate), which is used for lactoseproduction.
On a high starch diet, not only is less milkfat produced,but the extra lactose produced increases the milkvolume, diluting the fat even more
• The stage of lactation. Fat test is likely to be lower inearly lactation when milk volume is at its highest

7/22/2019 Feeding Dairy Cows Manual
http://slidepdf.com/reader/full/feeding-dairy-cows-manual 163/264
Chapter 12. Diet and its Effect on Milk Production and Body Condition
• Body condition of the cow. Fat test will be higher if thecow is losing body condition and using it for milkfatproduction. Body condition loss in early lactation (if thecow has condition to take off) may help maintainmilkfat concentration as yield increases
• Energy intake. Fat test tends to be lower if the cow iswell fed. When her energy intake is high, the rumenfermentation rate is also high, the rumen is more acidic(lower pH), and the starch-digesting microbes whichproduce propionate will work better than the fibre-digesting microbes which produce acetate
With more propionate (which is converted to glucose),there will be more lactose produced and, therefore, agreater volume of milk. With less acetate, there will beless fat.
12.3.4 Protein production in the udder
The udder makes milk protein from the amino acids andglucose carried in the blood. Amino acids are the buildingblocks, and the glucose provides the energy to do thebuilding.
Sometimes, although the supply of amino acids to the
udder is plentiful, there is not enough glucose energyavailable to build them into milk protein.
In this case, some of the amino acids are converted toglucose, and used to provide energy. This is not anefficient use of feed because it wastes the protein-producing potential of the amino acids.
Conversely, if glucose is plentiful but amino acids are inshort supply, the building of milk protein will be limited.
The surplus glucose may produce some lactose, but mostwill be stored; that is, the cow will put on body conditionrather than produce milk. This also is not an efficient useof feed.
Milk protein and lactose production (and therefore milkvolume) are related because:
• Glucose in the blood is needed to produce both lactoseand milk protein

7/22/2019 Feeding Dairy Cows Manual
http://slidepdf.com/reader/full/feeding-dairy-cows-manual 164/264

7/22/2019 Feeding Dairy Cows Manual
http://slidepdf.com/reader/full/feeding-dairy-cows-manual 165/264

7/22/2019 Feeding Dairy Cows Manual
http://slidepdf.com/reader/full/feeding-dairy-cows-manual 166/264

7/22/2019 Feeding Dairy Cows Manual
http://slidepdf.com/reader/full/feeding-dairy-cows-manual 167/264
Chapter 12. Diet and its Effect on Milk Production and Body Condition
12.4.2 Body condition in late lactation and in the dry period
Milk production falls in late lactation because:
• The cow is using (partitioning) more of her intake tobuild body condition rather than to produce milk.
• Her intake ability has decreased.
• Often, she is being offered less feed or lower qualityfeed.
Cows with high genetic production potential tend tocontinue partitioning nutrients to milk rather than tobody condition during late lactation. They must be fedvery well at this time to put on body condition ready fortheir next calving.
The dry period may be the only opportunity for cows toput on condition. Bear in mind though that cows use feedenergy more efficiently to put on body condition while stillmilking (75 per cent efficient) compared to when dry (59per cent efficient).
12.4.3 Summary of milk production and body condition
Cows must calve between condition scores 5 and 6 toensure they have enough body fat to use in early lactationwhile feed intake lags behind milk production.
Adequate body reserves enables a high production peak tobe achieved, which contributes to high milk production forthe whole lactation.
Cows need to be well fed throughout the lactation to getbody condition back on. They are more efficient at puttingon body condition while still milking.
Exercises 12.1 and 12.2 assess your understanding of the
production trends for given changes to a cow’s diet.

7/22/2019 Feeding Dairy Cows Manual
http://slidepdf.com/reader/full/feeding-dairy-cows-manual 168/264
Chapter 12. Diet and its Effect on Milk Production and Body Condition
EXERCISE 12.1: How do milk production and bodycondition change when diet changes?
In all scenarios, the cows have access to plenty of good-quality pasture (24 per cent protein, 30 per cent NDF). Inthe following table, some changes that could be made totheir diet are shown. Describe how a cow’s milk
production (litres, fat test, protein test) and bodycondition might change, if her diet is changed. (Answer Up,
Down or Steady )
Up, Down or Steady?Diet change Milk
(L)
Fat
(kg)
Fat test
(%)
Protein
(kg)
Protein
test (%)
Body
condition
Wheat fed graduallyincreases from 1 kg to 4 kg
per cow.
Wheat fed suddenlyincreases from 1 kg to 6 kg
per cow.
Hay is fed.
Turnips are fed.

7/22/2019 Feeding Dairy Cows Manual
http://slidepdf.com/reader/full/feeding-dairy-cows-manual 169/264
Chapter 12. Diet and its Effect on Milk Production and Body Condition
EXERCISE 12.2: What is the value of a certain type of milk? Milk prices are calculated by different methods. Thetable below lists different daily milk production, withdiffering tests for fat and protein and with one type of
compositional pricing structure.
Calculate the value of each component in the milk todetermine which cow's milk has the highest value.
(Round your answers to the number of decimal placesshown for Cow 1; ie. two decimal places for columns Dand J, and three decimal places for columns E, F, G, H, and
I.)
FAT PRICE
($/KG)
= $2.20
PROTEIN PRICE
($/KG)
= $5.00
LITRE CHARGE
($/LITRE)
= $0.028
A B C D E F G H I J
Protein tofat ratio
Fat yield(kg)
Proteinyield (kg)
Fat($)
Protein($)
Litrecharge ($)
Totalreturn ($)
Cow LFat(%)
Prot.(%)
C ÷ B A x B ÷ 100
A x C ÷ 100
E x fatprice
F xprotein
price
A x litrecharge G + H - I
1 15 5.30 4.30 0.81 0.795 0.645 $1.749 $3.225 $0.420 $4.55
2 15 4.50 3.60
3 18 4.17 3.25
4 18 4.50 3.60
5 20 3.90 3.10
6 20 4.60 3.90
7 22 3.60 2.80
8 22 4.10 3.30
9 25 3.70 3.00
10 25 4.00 3.30
11 30 3.70 3.00
12 30 3.60 2.90
Highest value = Cow ______.

7/22/2019 Feeding Dairy Cows Manual
http://slidepdf.com/reader/full/feeding-dairy-cows-manual 170/264
Chapter 12. Diet and its Effect on Milk Production and Body Condition
The value of a cow’s daily milk depends on the totalvolume (litres) produced, the composition of the milk, andthe pricing structure for milk. When comparing the valueof milk from different breeds, from different cows, or fromthe same cow at different stages on different diets, this
calculation needs to be made.

7/22/2019 Feeding Dairy Cows Manual
http://slidepdf.com/reader/full/feeding-dairy-cows-manual 171/264
Chapter 12. Diet and its Effect on Milk Production and Body Condition

7/22/2019 Feeding Dairy Cows Manual
http://slidepdf.com/reader/full/feeding-dairy-cows-manual 172/264
Chapter 13. Nutrition and Fertility
13 Nutrition and Fertility
Feeding strategies for dairy cows have focused primarilyon achieving optimum milk production. However, as weachieve higher production per cow through bettermanagement, better genetics and better nutrition, it isclear that consideration must also be given to otheraspects of cow performance. One of the most important ofthese is fertility.
This chapter discusses some of the ways that nutrition canaffect fertility. Before discussing the effects of nutrition on
reproductive performance, let’s look at how successfulreproductive performance is judged.
13.1 Describing reproductive performance
Terminology
Mating start date The date when mating commences in aseasonally calving herd.
Planned start-of-calvingdate
282 days after the mating start date. Thisis the date that a cow that conceived onthe mating start date would calve if shehad a pregnancy of normal length.
Embryo The embryo is formed at fertilisation(which occurs soon after the end of heat).
Foetus After six weeks, the embryo isconsidered to have become a foetus.
In a seasonal calving herd, mating begins on the mating
start date. This date is 282 days (ie. normal length ofpregnancy) before we want the herd to start calving (theplanned start-of-calving date). Except for cows with shortpregnancies and abortions, the herd begins calving on theplanned start-of-calving date.
After the mating start date, we expect to see a steadyincrease in the percentage of the herd that is pregnant.Once cows are pregnant, we want as many embryos aspossible to survive, develop into foetuses and give rise
to live calves.

7/22/2019 Feeding Dairy Cows Manual
http://slidepdf.com/reader/full/feeding-dairy-cows-manual 173/264
Chapter 13. Nutrition and Fertility
EXAMPLE 13.1 In a 200-cow herd, the percentage of cowsthat are pregnant might change as described in the
following table.
DateDays since
mating startdate
Number ofcows pregnant
Percentage ofherd pregnant
26 Oct 0 0 0%
5 Nov 10 76 38%
15 Nov 20 90 45%
18 Nov 23 100 50%
25 Nov 30 135 68%
5 Dec 40 157 79%
15 Dec 50 171 86%
25 Dec 60 180 90%........... .......... .......... ..........
4 Mar 120 192 96%
To describe the reproductive performance for the cows in this200-cow herd, we can look at the percentage of the herd that is
pregnant at particular times after the start of mating:
45 per cent of the herd was pregnant by day 20 after matingstart date
90 per cent were pregnant by day 60, and 96 per cent were pregnant by day 120, when mating finished The remaining 4 per cent were not pregnant and have to be
culled or carried over.
Alternatively, we might report how long it took to reach a particular pregnancy percentage. In the Example 13.1,50 per cent of the cows were pregnant by 23 days after matingstart date.
13.1.1 Submission and conception rates
For cows to become pregnant, they must first beinseminated or served (‘submitted’ to service). Then theymust conceive. So the reproductive performance of a herdis affected by both submission rates and conception rates.
Submission rate
Submission rates tell us how quickly the cows in the herdwere first served.
Submission rate is the percentage of the herd which
received at least one insemination in the first 10, 21, 24 or30 days of mating.

7/22/2019 Feeding Dairy Cows Manual
http://slidepdf.com/reader/full/feeding-dairy-cows-manual 174/264
Chapter 13. Nutrition and Fertility
Care needs to be taken when assessing submission ratesbecause:
• Submission rates can be calculated for any period. Weneed to know what period applies when quoting
submission rates
• For this calculation, we count the number of cows inseminated, not the number of inseminations.
EXAMPLE 13.2: Suppose there are 185 inseminations inthe first 21 days of mating our 200-cow herd.
Twenty-five cows had two inseminations in this period.
185–25 = 160 cows received at least one insemination.
Therefore, the 21-day submission rate is 160 ÷ 200 or 80 per cent.
(It is not 185 ÷ 200 or 92.5 per cent.)
These calculations should include all cows that we want toget pregnant, even late-calving cows.
Suppose that five cows in our example herd above had not
calved by the mating start date. They should be includedin the 200 cows. Only cows that we don’t intend toinseminate should be excluded.
Conception rate
Conception rates tell us how many inseminations orservices result in pregnancy.
Conception rate is the number of services resulting inpregnancy divided by the total number of services.
Again, care needs to be taken:
• There is confusion over how conception rates arecalculated
• For this calculation we count inseminations or services,not cows.

7/22/2019 Feeding Dairy Cows Manual
http://slidepdf.com/reader/full/feeding-dairy-cows-manual 175/264
Chapter 13. Nutrition and Fertility
EXAMPLE 13.3 Suppose that in our example we used 250straws and 150 resulted in pregnancy.
The conception rate would be 150 ÷ 250 or 60 per cent.
Conception rates can be calculated for the whole herd orfor many groups within the herd. We might calculate themonly for first services, only for inseminations of particulargroups of cows (e.g. old cows, induced cows)or only for inseminations by particular sires.
Which inseminations resulted in pregnancy?
In order to calculate conception rates we need to knowwhether a service results in pregnancy. We become
hopeful that a cow is pregnant if she does not return toservice. The longer it is since she returned to service, themore confident we become that conception occurred.
However, some non-pregnant cows are not seen to returnto service. In most herds, a number of cows thought to bepregnant to their first service actually become pregnant tolater services. This applies to many cows in some herds.
To determine which inseminations resulted in pregnancy,veterinary pregnancy testing when cows are between 6and 12 weeks of pregnancy is much more accurate thannon-return to service.
Waiting until next calving is another way to find outwhether the cow conceived. But this way has problems.First, cows can abort or be induced or sold before theycalve. Second, the length of pregnancy can vary, so wemake errors when deciding which insemination resulted inpregnancy. Third, the information is not available untilmonths after the mating period.
13.2 Non-nutrit ional factors that can affect reproductive performance
Producers know that reproductive performance is affectedby many factors. Nutrition is only one possible cause ofpoor reproductive performance. In some herds, nutrition isnot the most important cause of poor performance. Someof the other causes can be divided into those that affectsubmission rate and those that affect conception rate.

7/22/2019 Feeding Dairy Cows Manual
http://slidepdf.com/reader/full/feeding-dairy-cows-manual 176/264
Chapter 13. Nutrition and Fertility
Factors that can adversely affect submission rates include:
• Late calving cows and heifers
• Undetected heats
• Lameness
• Large numbers of young or old cows in the herd
• Poorly grown heifers
• Poor bull performance
• Insufficient number of bulls
• Inclement weather (extremes of heat or cold)
• Withholding cows from service
• Reproductive tract infections
• Cystic ovaries
• Numerous diseases
• Various other stressors (fear of operators, poor shed oryard design etc.).
Factors that may adversely affect conception rates include:
• Inseminating cows soon after calving
• Inseminating cows when not on heat
• Inseminating cows too late after heat commences
• Incorrect semen storage or handling
• Incorrect insemination technique
• Inclement weather (extremes of heat or cold)
• Poor bull or sire fertility
• Large numbers of young or old cows in the herd
• Splitting straws
• Reproductive tract infections (including vibriosis,pestivirus, IBR-IPV, leptospirosis)
• Induced calving.
Then, once the cow has conceived, there are many causesof abortion.
13.3 Herd calving pattern
Herd calving pattern is the single most important factoraffecting herd reproductive performance. For highsubmission and conception rates, it is crucial that the herdhas a tight calving pattern. Late calving heifers and cows
are at very high risk of conceiving late or not at all.

7/22/2019 Feeding Dairy Cows Manual
http://slidepdf.com/reader/full/feeding-dairy-cows-manual 177/264
Chapter 13. Nutrition and Fertility
When compared to earlier calving herd mates, heifers andcows that calve close to the mating start date are muchmore likely not to be pregnant 30 days after mating begins.Some will still not be pregnant at the end of mating due toreduced submission and conception rates.
This effect on submission and conception rates is shown inTable 13.1. Early calvers (cows calved at least 80 daysbefore mating start date) are listed on the left. Columns tothe right show figures for cows that calved progressivelylater. The less time between calving and the mating startdate, the lower the submission and conception rates.
Table 13.1 Effect of late calving on subsequentconception rates to first service (Macalister
Irrigation Area 1984–85).
Days calved at mating start date
80 ormore
79–60 59–40 39–20 19–0Calved aftermating start
date
30 daysubmission
rate
94% 90% 85% 72% 65% 13%
Conceptionrate to first
service
61% 58% 51% 41% 29% 31%
Herds with a spread calving pattern are really startingbehind the eight ball. What can we do in herds with toomany late calvers?
• Ensure that the heifers have a tight calving patternbeginning as soon as the cows begin calving. With goodmanagement, it is possible to have 75 per centof the heifers calved in the first 30 days of calving,
without beginning calving earlier than the cows• Ensure that the herd has a reasonable replacement rate,
so that with heifers calving early we can cull more cowswhich are due to calve late. In some herds, a shift to ayounger herd may also improve herd reproductiveperformance and could be a profitable option
• Ensure that heifers are well grown and have good sizedframes, so that they compete well with cows, do not losetoo much condition, are less likely to become lame, andare back in calf again quickly

7/22/2019 Feeding Dairy Cows Manual
http://slidepdf.com/reader/full/feeding-dairy-cows-manual 178/264
Chapter 13. Nutrition and Fertility
• If any calvings are to be induced, use early pregnancytesting to plan the inductions and induce as early asfeasible
• Manage the cows to maximise herd fertility and achieve
as many conceptions in later calving cows as possible.
13.4 Effects of nutrit ion on the reproductive performance of dairy cows
13.4.1 Energy
Energy intake affects milk production, body condition andliveweight.
Numerous studies have investigated effects of milkproduction, body condition score and liveweight onfertility. Results have varied widely. To date, the effects ofenergy intake on fertility have not been fully clarified.
Nevertheless, some effects are clear. The effects of energyintake can be separated into effects on submission ratesand effects on conception rates.
Effects of energy intake on submission rate
Research in Victoria in the 1980s (see Table 13.2)demonstrated the effect of extreme undernutrition on theonset of cycling. Cows of various breeds were calved incondition scores ranging from 3 to 6 (where 1 = emaciatedand 8 = extremely fat) and were then fed 7, 11 or 15 kgDM/day of pasture for the first five weeks of lactation.After that, all groups were allocated the same amount ofpasture.
Table 13.2: Effect of condition score at calving and post
calving feeding on days from calving to firstdetected heat.
Days from calving to first detected heat
Body condition score at calving Pasture fed aftercalving
(kg DM /day) 3 4 5 6
7 55 49 43 38
11 50 44 39 33
15 46 40 34 28
(Source: Grainger et al., 1982)

7/22/2019 Feeding Dairy Cows Manual
http://slidepdf.com/reader/full/feeding-dairy-cows-manual 179/264
Chapter 13. Nutrition and Fertility
The first detected heat was markedly delayed among cowsin poor condition at calving and cows fed very limitedpasture after calving. Because of this delay, submissionrates were dramatically reduced in the thin and underfedgroups.
The study in Table 13.2 assesses the effects of nutrition atthe low end of the scale. Large, high-producing Holstein-Friesian cows can eat 24 kg DM daily or even more ifmanaged appropriately. It is likely that the cows in thisstudy would have eaten well over 15 kg DM if they hadbeen allowed. So underfeeding was occurring, even in thebest fed groups in the study.
At the other extreme, cows can be too fat at calving. Cowscalving in condition scores above 6 are at greater risk offatty liver syndrome, with associated reduction in appetite,excessive weight loss and increased likelihood of retainedfoetal membranes and/or non-cycling. Except for somecows being carried over, cows in south-eastern Australianare rarely seen in condition scores greaterthan 6.
If low-producing cows are fed better both before and aftercalving, we achieve improved submission and conceptionrates and higher milk yields. Extensive work is now
focusing on the effects of nutrition in high-producingcows.
Probably the best current explanation of the causes ofdelayed cycling among high-producing cows comes fromNorth America. Under the systems of management there,it appears that condition loss after calving is more likely tocause delayed cycling than is the level of milk productionin early lactation.
The problem, as we saw in Chapter 6, is that milk
production peaks before maximum feed intake, evenwhere cows are fed ad lib.
This means that in early lactation, cows’ energyrequirements exceed their intake. They are in ‘negativeenergy balance’ and so they lose body condition andweight. This is seen in Figure 13.1 as the trough that occurssoon after calving. In this study, cows lost condition for thefirst 7 weeks of lactation.
The negative energy balance is worst in the first few weeksafter calving, before slow improvement. Intake capacity

7/22/2019 Feeding Dairy Cows Manual
http://slidepdf.com/reader/full/feeding-dairy-cows-manual 180/264

7/22/2019 Feeding Dairy Cows Manual
http://slidepdf.com/reader/full/feeding-dairy-cows-manual 181/264
Chapter 13. Nutrition and Fertility
However, the cows with the worst troughs may not be thehighest producers within a herd. Cow appetite can alsohave large effects. Cows producing a little less but eating alot less will clearly be at more risk. This effect may beparticularly important in pasture-based production
systems where cows must forage and compete for limitedfeed.
Effects of energy intake on conception rates
Energy intake and condition score affect onset of cyclingafter calving. Early onset of cycling clearly increasessubmission rates. Furthermore, early onset of cycling alsoincreases conception rates.
New Zealand research suggests that conception rates areimproved in cows which have had at least one heat beforemating (Table 13.3). This is regardless of the length of timebetween calving and the start of mating.
Table 13.3: Effect of pre-mating heats on first serviceconception rates
First service conception rate
Days from calving to first service
Number of pre-mating heats
40 or more 30–39 Less than 30
59 42 320
65 49 391
67 51 402
(Source: Macmillan et al., 1980)
Hormonal changes may explain the positive effect of a heatbefore mating on conception. It appears that conceptionrates are improved by high levels of the hormoneprogesterone in the twelve days before insemination.
Progesterone is produced by the ovary after a cow hasovulated. Cows inseminated on their second ovulation willusually have had much higher progesterone levels for theprevious twelve days.
There may also be other explanations for the improvementin conception rates among cows having a heat beforemating.

7/22/2019 Feeding Dairy Cows Manual
http://slidepdf.com/reader/full/feeding-dairy-cows-manual 182/264
Chapter 13. Nutrition and Fertility
Other effects of energy intake on conception rates
Energy balance may also affect conception rates in otherways. One suggestion is that negative energy balance longbefore insemination may reduce conception rates.
In the ovary, egg development begins around 60–100 daysbefore the heat where the egg is released. It may be thatadverse conditions around that time can result in adefective egg being produced and released.
If true, this might mean that severe weight loss in earlylactation could result in poor quality eggs when cows areinseminated.
For late-calving cows which are mated soon after calving,
weight loss in the dry period could have similar effects.
Some implications for management
Management in late lactation
In many herds, cows dry off in the condition in which theycalve. How cows are fed in late lactation and when theyare dried off will have huge effects on condition score atdrying off and at calving.
Dry cow management
Dry cows must not lose weight. In some herds in WesternVictoria there are large weight losses among some groupsof dry cows (J. Morton, pers. comm.). This is likely to beoccurring in other areas of the state as well.
Even if liveweight does not seem to be declining, cowsmay be losing condition The increasing weight of thefoetus and udder during pregnancy may mask losses of
the cow’s own bodyweight.
Management during the transition period
Decrease in appetite around calving has to be minimised.In the past in south-eastern Australia, we have often madedramatic changes in diet as cows move from the calvingpaddock to the milking herd. The cow’s rumen needs timeto adjust to the new diet. Digestion and intake can bereduced while the rumen is adjusting.
This adjustment can start before calving. In herds wheremilkers are fed moderate to large quantities of grains, lead

7/22/2019 Feeding Dairy Cows Manual
http://slidepdf.com/reader/full/feeding-dairy-cows-manual 183/264
Chapter 13. Nutrition and Fertility
feeding (gradual introduction of grain in the diet beforecalving) helps reduce the impact of dramatic change indiet. Lead feeding may also help retain condition in thelast few weeks before calving.
Anionic (‘acid’) salts may enable some pasture to be fed tospringers without increasing the risk of milk fever. Feedingsome pasture may help reduce the impact of the dietarychanges after calving.
Minimise condition loss after calving
It is crucial that we achieve high energy intakes quicklyafter calving. The many considerations in feeding cows inearly lactation are discussed in other sections of thismanual.
Monitoring changes in condition score
A system for picking up small changes in condition scorequickly is badly needed. We would get concerned about adrop of 2 L in daily milk production per cow in earlylactation. This contains the same amount of energy as adaily fall in liveweight of 0.4 kg, or about 1 per cent of acondition score.
We should be just as concerned about the drop incondition score. Unfortunately, we cannot see the tinychanges in body condition that occur day to day. It wouldtake over 50 days for that rate of condition loss to becomevisible!
One approach would be to have an independent personregularly score the same 20 or 30 monitor cows within theherd. These cows should be a range of ages and productionlevels. Scores could then be compared with previousscores.
13.4.2 Protein
Excess protein
A characteristic of our pasture-based production systems isthat at certain times of the year the protein content ofpasture exceeds cows’ requirements.
The excess is increased by the tendency of cows to select a
diet even higher in protein than the average of the pasturesward. While there is currently much interest in the effect

7/22/2019 Feeding Dairy Cows Manual
http://slidepdf.com/reader/full/feeding-dairy-cows-manual 184/264
Chapter 13. Nutrition and Fertility
of this excess protein, we should remember that pasture-fed herds have been performing satisfactorily for manyyears.
Even if excess protein is shown to have detrimental effects
on reproductive performance, this may not outweigh thebenefits of our pasture-based grazing systems.
Most of the protein in pasture is rumen degradable (RDP).Overseas research work suggests that diets high in RDPdepress conception rates. Imbalance between the amountsof fermentable carbohydrate and protein in the diet may bethe key concern.
Very little of this work has been completed using pasture-fed cows. A recent New Zealand study suggests that theeffects of high protein pasture diets are less serious thanthose reported from the Northern Hemisphere. Severaltrials are currently under way in Australia to investigatethis issue.
Diets with excess protein have effects other than onconception rates. It costs the cow energy to break down theexcess protein, energy which could otherwise have beenused for milk production and body condition. So, adverseeffects of high protein diets on fertility may be due to an
energy deficit.
Unless the cost of this imbalance is shown to be extremelyhigh, it is unlikely that we will move away from ryegrass/white clover pastures in south-eastern Australia. However,we may ultimately be able to use some simple strategies toensure that rumen carbohydrate, protein and fibre levelsare better balanced. Current nutrient intake research workin Victoria and other states is aimed at helping sort outthese very complex issues.
Current views on excess protein
When lactating cows are eating considerable quantities ofhigh quality pasture, feeding supplements high in proteinseems inappropriate and possibly harmful.
In early lactation, pasture-fed cows have very high rates offlow through the rumen. This may prevent breakdown ofsome of the pasture protein in the rumen so that anyeffects of excess protein intake from pasture are reduced
by high flow rates.

7/22/2019 Feeding Dairy Cows Manual
http://slidepdf.com/reader/full/feeding-dairy-cows-manual 185/264

7/22/2019 Feeding Dairy Cows Manual
http://slidepdf.com/reader/full/feeding-dairy-cows-manual 186/264

7/22/2019 Feeding Dairy Cows Manual
http://slidepdf.com/reader/full/feeding-dairy-cows-manual 187/264
Chapter 13. Nutrition and Fertility
This may be sufficient to prevent reproductiveperformance being affected.
Selenium
Although many Victorian cows have low blood test resultsfor this element, reproductive performance does notappear to be increased by supplementation. There arenumerous reports of retained foetal membranes due toselenium deficiency. Unfortunately, most of these studiesused cattle managed under Northern Hemisphereconditions. The incidence of retained foetal membranesdoes not appear to be increased in Victorian herds despitewidespread ‘low’ selenium levels. Growth responses inheifers to selenium supplementation may occur in someconditions.
Detecting deficiencies
Laboratory tests are available for many minerals and traceelements. While some tests are useful, the results of othertests are not highly correlated with responses to treatment.
In other words, even if testing indicates a deficiency,supplementation does not always produce animprovement in animal performance.
Feed analyses might help to estimate an animal’s currentintake of certain elements, but there are some drawbacks:
• Results will vary between feed batches and evenbetween paddocks on the same farm
• Cows graze selectively, so sampling has to mimic this inorder to estimate what is actually being eaten
• Feed intake has to be estimated
• Minerals interact with each other. Requirements formost minerals and trace elements depend on how muchof other minerals and trace elements are present.
Meaningful interpretation of feed analyses for mineralsand trace elements is not simple.

7/22/2019 Feeding Dairy Cows Manual
http://slidepdf.com/reader/full/feeding-dairy-cows-manual 188/264
Chapter 14. Nutrition and Dairy Replacements
14. Nutrition and Dairy Replacements
Well-grown dairy heifers are a good investment in themilking herd. To ensure they grow to become high-yielding and efficient dairy cows, their management iscarefully planned and begins the day they are born.
A well-managed heifer rearing system aims for:
• Good animal performance with minimal disease andmortality
• Optimum growth rates to achieve target liveweights
• Minimum costs of inputs, such as feed (milk,concentrates and forages), animal health needs(veterinary fees and drugs) and other operating costs(milk-feeding equipment) to achieve well-reared heifers
• Minimum labour requirements
• Maximum utilisation of existing facilities such as shedsfor rearing and pastures for grazing.
There is no single best way to milk-rear calves. All sorts ofcombinations of feeding, housing and husbandry can be
successful in the right hands and on the right farm.Successful calf rearing is a specialist job requiring suitablefacilities. It also requires a genuine concern for the welfareof young calves and quick responses to early symptoms ofdisease. If dairy farmers are unable to commit the time andresources to rearing their own replacement heifers, theyshould seriously consider paying someone who is betterplaced to do a good job.
The first three months are the most expensive period in thelife of any dairy cow. During that time, mortality rates are
high – up to 10 per cent in many cases – although 2–4 percent is considered acceptable. Calves need protection fromthe extremes of sun, wind and rain no matter what therearing system. Disease prevention and treatment can becostly during early life.
14.1 Rearing the milk-fed calf
With their undeveloped digestive tract, calves require the
highest quality and the most easily digestible source of
159

7/22/2019 Feeding Dairy Cows Manual
http://slidepdf.com/reader/full/feeding-dairy-cows-manual 189/264
Chapter 14. Nutrition and Dairy Replacements
nutrients, namely, whole milk or milk replacers.Unfortunately, these are also the most expensive feeds.
As a source of feed energy, milk is two to three times moreexpensive than concentrates and 20 times more expensive
than grazed pasture. The most effective way of minimisingthe high feed costs of calf rearing is through early weaningand reduced milk feeding.
The essence of good calf rearing depends on two majornutritional factors. First, an adequate intake of highquality colostrum within the first day of life and,second, feeding management to encourage earlyrumen development.
14.1.1 Colostrum feeding
Newborn calves are very susceptible to disease. Beforethey can develop their own immunity they are entirelydependent on the antibodies contained in their mother’smilk. It is therefore vital that they receive adequatequantities of antibody-rich colostrum from their mothersor from other freshly calved cows.
Calves should have access to at least four litres ofcolostrum within the first six hours of life. They will not
need any additional milk for the next 12–24 hours. Any calfthat is suspected of not having suckled in the first 3–6hours should be hand-fed colostrum. With sick or weakcalves, colostrum may have to be administered by stomachtube. It is not difficult to stomach-tube young calves whenusing commercially available fluid feeders specificallydesigned for the purpose.
Frozen colostrum (which can be stored for 18 months) canbe thawed out and used, or colostrum from a mature cowwithin the herd can be fed. Fresh colostrum can be stored
for 7–10 days. Colostrum should be tested for antibodyconcentration to ensure it is of sufficient quality to store.
The level of immunity passed on by the cow increases withher age, since older animals have been exposed to a greaterrange of infectious organisms to which they havedeveloped antibodies. Replacement heifers born to firstcalving cows may require additional stored colostrumfrom older cows to ensure they develop good diseaseimmunity. The immune properties of colostrum can be
enhanced by vaccinating cows prior to calving for E. coli,Clostridia and Salmonella.
160

7/22/2019 Feeding Dairy Cows Manual
http://slidepdf.com/reader/full/feeding-dairy-cows-manual 190/264
Chapter 14. Nutrition and Dairy Replacements
The longer calves spend with their dams, the greater theirchances of contracting disease. The practice of ‘snatchcalving’ (removing the calf from the cow immediately afterbirth) increases the labour requirements during the busycalving period and may not be adopted by farmers with
seasonal-calving herds unless there are obvious benefitsthrough reduced health problems (such as Johne’s disease)and mortality.
14.1.2 Early rumen development
The rumen is non-functional in newborn calves; hence, alldigestion must take place in the abomasum (or truestomach) and the small intestine. The weaned calf needs afully functional rumen in order to be well adapted to aherbage diet. Before weaning, it is important to promoterumen development, so as to avoid growth checks whencalves are weaned.
Rumen development occurs through the digestion orfermentation of feeds (roughages and concentrates) by therumen microbes (the end products being volatile fattyacids). Calves should be encouraged to eat solid feeds at anearly age, mainly through limiting their access to milk to 4L/day. From the first week, roughage such as clean strawshould be offered in combination with high-quality
concentrates or calf-rearing pellets.
Grazed pasture is not an ideal source of roughage for milk-fed calves. Pasture contains too little fibre, and its veryhigh water content prevents high intakes of feed energy ineach mouthful. This limits the feed energy available forrapidly growing animals.
Until their rumen capacity is larger, young calves justcannot eat enough pasture to sustain high growth rates.
14.2 A successful early weaning recipe for calf rearing
Dairy farmers generally want to feed their calves on thebest quality feeds to give the calves a good start to life. Onthe whole though, most dairy farmers feed too much milkfor too long.
By continuing to feed milk longer than is necessary,farmers often feed 400–500 litres of milk to each calf. They
should only feed 200 litres of milk or less. Furthermore,
161

7/22/2019 Feeding Dairy Cows Manual
http://slidepdf.com/reader/full/feeding-dairy-cows-manual 191/264
Chapter 14. Nutrition and Dairy Replacements
much of this milk can be colostrum from calving cows,making the milk costs very low.
If calves are strong, healthy and kept warm and dry, theycan be successfully reared on once-daily feeding with four
litres of whole milk, or its equivalent in milk replacer. Suchcalves should be offered palatable calf pellets or speciallyformulated meal from one week of age.
Calves should have limited access to fresh pasture (andpreferably no access at all). The key to this rearing systemis giving the calves continuous access to clean straw as asource of roughage. Note this is clean straw, not goodquality pasture hay or lucerne hay.
All calves must be given the opportunity to nibble on thestraw even though they will eat very little of it. Straw willencourage rumen development rather than providenutrients.
If better quality hay is fed in place of straw, calves will eatmore roughage but at the expense of concentrateconsumption. If good quality hay is fed, it should belimited to 100–200 g/calf/day. Clean drinking water mustbe available at all times.
Feeding milk only once each day helps the calves todevelop an appetite for the pellets. It is the pellets ratherthan the milk that provide the bulk of nutrients to keep thecalf growing. Calves can be weaned off milk once they areconsuming 0.75 kg/day of pellets for two or threeconsecutive days. This usually occurs by about six weeksof age.
Provided calves are eating 0.75 kg/day of pellets, milkfeeding does not have to be reduced gradually. Calvesshould continue to be housed indoors during weaning.
They can go out to pasture a few days after weaning.
This system rears the rumen rather than the calf. Systemsthat involve feeding more milk do not encourage earlyrumen development and hence calves must be older beforethey can continue to grow without milk.
It is important that each calf drinks its allocation of milk.Lower milk intakes will limit calf performance because ofthe inability of the young animal to compensate by eating
more pellets. As well as reducing growth rates, underfed
162

7/22/2019 Feeding Dairy Cows Manual
http://slidepdf.com/reader/full/feeding-dairy-cows-manual 192/264
Chapter 14. Nutrition and Dairy Replacements
calves may be more susceptible to diseases and otherstresses during life.
Higher milk intakes will discourage pellet consumption. Ifcalves are weaned in large groups based on the average
pellet intake of the group (together with an assessment ofliveweight), the calves consuming large volumes of milkand little pellets can have underdeveloped rumens.
Ideally, calves should be housed individually or in smallgroups. They should also be individually bucket-fed. Thereis no advantage in milk feeding using teats rather thanbuckets; it only creates extra work in keeping them clean.
14.2.1 Criteria for successful calf-rearing systems
As already mentioned there are many ways to successfullyrear calves.
A calf-rearing system should produce fully weaned calves,weighing 100 kg, at 12 weeks of age. This weight criterionis equivalent to a growth rate of 0.7 kg/day.
Weight tapes or wither height sticks can be used as a guideto calf liveweights, but tend to overestimate weight.
Unless the rumen is well developed at weaning, calves willnot be able to utilise dry feed once milk feeding has ceased.They will suffer a post-weaning growth check. High levelsof milk feeding with no calf pellets fed at all can producecalves weighing 100 kg at 12 weeks but not fully preparedfor weaning.
It is also more costly to rear calves this way. Table 14.1 shows the cost of dry matter and energy in some of thefeeds commonly used for calves. Costs fluctuate and feedcomposition varies, so the table is only a guide.
163

7/22/2019 Feeding Dairy Cows Manual
http://slidepdf.com/reader/full/feeding-dairy-cows-manual 193/264
Chapter 14. Nutrition and Dairy Replacements
Table 14.1: Costs of dry matter and energy in calf feeds.
Feed Drymatter
(%)
Energy(MJ /kg
DM)
Crudeprotein
(%)
Costperunit
DMcost
(c/kg)
Energycost
(c/MJ)
Liquid feeds
Whole milk *
- cheap 13 22.3 23 20c/L 154 6.9
- expensive 13 22.3 23 30c/L 230 10.3
Milk replacer **
- cheap 96 20.2 26 $45/bag 234 12.0
- expensive 96 20.2 26 $55/bag 286 14.6
Concentrates
Pellets 90 13 8 $350/t 38 2.9
Farm mix 90 13 18 $260/t 29 2.2
(Source: Moran, 1996) * Assumes 4% fat and 3% protein
** Assumes 20% fat and 25% protein
EXERCISE 14.1: Calculating the costs of your owncalf feeds.
Using the worksheet at the end of this chapter, calculatethe costs of the nutrients in the calf feeds you use on your own farm.
14.3 Management of weaned replacement heifers
All too often, dairy farmers rear their heifer calvescarefully until weaning but neglect them thereafter. Thereis little truth in the idea that ‘small weaned calves arecheap to produce and all that is needed to make them intogood heifers is a drench and a good feed’. Calves that arepoorly managed from birth are disadvantaged for their
entire life. Even if they are well fed after mating, theirultimate mature size is restricted and if they do put onextra weight, it tends to be fat. Most of the growth inskeletal size occurs before, not after puberty.
Weaned heifers do, however, require less attention thanmilk-fed calves and milking cows. From weaning until
joining and sometimes even after that, daily contact is notnecessary. Because their nutrient requirements are lowerthan those of lactating cows, heifers are often located away
from the prime grazing areas on the farm, such as on‘runoff’ blocks or on agistment. However, dairy heifers
164

7/22/2019 Feeding Dairy Cows Manual
http://slidepdf.com/reader/full/feeding-dairy-cows-manual 194/264
Chapter 14. Nutrition and Dairy Replacements
need to be well fed between weaning and first calving. Ifgrowth rates are not maintained, heifers will not reachtheir target liveweights for mating and first calving. In thecase of replacement heifers, ‘out of sight’ should not mean‘out of mind’.
Undersized heifers have more calving difficulties, produceless milk and have greater difficulty getting back into calfduring their first lactation. When lactating, they competepoorly with older, bigger cows for feed. Because they arestill growing, they use feed for growth rather than formilk. Therefore they are more likely to be culled for poormilk yield and/or infertility. Many studies havedemonstrated the benefits of well grown heifers in terms offertility and milk production.
14.3.1 Ferti li ty
The onset of puberty, and commencement of cycling, isrelated to liveweight more than to age. A delay in pubertymeans later conception, which disrupts future calvingpatterns. All heifers should achieve their target weightbefore joining, because lighter heifers have lowerconception rates. Target liveweights at mating and firstcalving are discussed below. Calving problems dependmore on heifer liveweights at mating, than on liveweights
or body condition at calving. Frame size is determinedearly, so there is doubtful merit in the practice of feedingolder heifers to make up for poor growth earlier in life(‘catch-up feeding’).
In an Irish study, heifers mated below 260 kg had 34 percent conception to first insemination compared to 58 percent for heifers of 300 kg or more. Of the smaller heifers, 24per cent had difficult calvings. This declined to 8 per centin heifers mated at 260–280 kg and was lowest in 340–360kg heifers. Heifers under-weight at mating required
considerable assistance if in difficulty during calving.
14.3.2 Milk production
Tasmanian researchers found that by increasing calvingliveweights from 360 kg to 460 kg, milk production duringthe first lactation rose by 400 litres (Freeman, 1993). Thisproduction benefit extended into both the second lactation,with an extra 830 litres of milk/100 kg, and the thirdlactation, with an extra 840 litres of milk/100 kg live
weight. Recent studies in northern Victoria and centralNSW with heavier heifers, showed that when heifers calve
165

7/22/2019 Feeding Dairy Cows Manual
http://slidepdf.com/reader/full/feeding-dairy-cows-manual 195/264
Chapter 14. Nutrition and Dairy Replacements
100 kg heavier than the ones with which they were beingcompared, their peak production was 5 L/day higherduring the first lactation. This corresponds to an extra 1000L of milk in their first lactation, if full lactation yields areestimated by multiplying peak daily yields by 200. In other
words, if heifers calving down at 425 kg peak at 20litres/day, and produce 4000 litres in their first lactation,they would peak at 25 litres/day and have first lactationyields of 5000 litres, if they calved down at 525 kg.
14.3.3 Heifer wastage
Poorly grown heifers do not last long in the milking herd.Recent studies in Gippsland indicate that at least one thirdof all heifers reared are lost before their second lactation.Heavier heifers are less likely to be culled for poor milkyield or poor fertility during their first lactation.
Total herd costs can be greatly increased by this high rateof wastage. Producers should aim to lose no more than 20per cent of their replacement heifers between weaning andtheir second lactation.
14.4 Critical period for udder development
A critical period for the developing udder comes whenexcessive growth rates may increase the deposition of fattytissue in the udder and reduce lifetime productivity.Exactly when this critical period occurs and exactly whatconstitutes excessive growth rates has yet to be clearlydefined, although there are some general guidelines. Someadvisers consider that liveweight gains should not exceed0.5 kg/day between six to 12 months, while othersrecommend gains of less than 0.7 kg/day between three toeight months of age. This still needs clarification. But itseems that excessive feeding should be avoided during theheifers’ second six months of life.
Nevertheless, the risk of fatty udder syndrome does not justify underfeeding.
Excessive growth rates are unlikely to be a problem inheifers fed a pasture-based diet, particularly for spring-calving herds, as the critical period coincides with autumnand winter, a time of seasonal pasture shortages.
At high growth rates, excess energy relative to the amountof protein in the diet may predispose heifers to fatty udder
166

7/22/2019 Feeding Dairy Cows Manual
http://slidepdf.com/reader/full/feeding-dairy-cows-manual 196/264
Chapter 14. Nutrition and Dairy Replacements
syndrome. Balancing dietary nutrients, such as supplyingbypass protein to match the energy supply in the diet, maybe one way of maintaining high growth rates in heiferswithout causing fatty udders.
14.5 Targets for replacement heifers
14.5.1 Live weight
There is now evidence suggesting that traditional targetweights are too low to ensure first lactation heifers achievetheir productivity potential, particularly on farms wheremilking cows are well fed. Table 14.2 summarises revisedand traditional target weights for Jersey and Friesian
heifers at various ages. The revised target weights forFriesians more closely match the US guidelines. This seemslogical because Australian Friesians have becomegenetically closer to the US Holsteins.
Table 14.2: Traditional and revised target weights for Jersey and Friesian heifers at different ages.
Target weight (kg)
Jersey Friesian
Age (months) Traditional Revised Traditional Revised2-3 (weaning) 45–65 65–85 65–85 90–110
12 160–180 200–230 210–230 270–300
15 (mating) 200–220 245–275 260–280 330–360
24 (pre-calving) 320–350 380–410 410–430 520–550
Puberty occurs in dairy heifers at 35–45 per cent of matureweight, while conception can occur at 45–50 per cent ofmature weight. A dairy cow will attain her matureliveweight in about the fourth lactation and the objective ofrearing heifers is to produce an animal 80–85 per cent ofmature liveweight by first calving. Current guidelines fordairy heifer liveweights should be easily achievable onwell managed dairy farms. Unfortunately, they aresometimes used as the average rather than the minimum,meaning that many heifers are still too light.
Because of the importance of attaining growth targets,farmers should consider how they can acquire scales forweighing cattle. Cattle scales with digital readouts can be
purchased for $1000 or hired from some herdimprovement organisations.
167

7/22/2019 Feeding Dairy Cows Manual
http://slidepdf.com/reader/full/feeding-dairy-cows-manual 197/264
Chapter 14. Nutrition and Dairy Replacements
The scales can have many other uses on a dairy farm. Aswell as monitoring the weights of replacement heifers, theycan be used to calculate drenching rates for stock, checkchanges in liveweight of the milking herd during differentstages of lactation or even to weigh bales of hay or silage.
Wither height sticks or chest girth tapes are an alternativeto scales but they are not as accurate and tend tooverestimate liveweights.
14.5.2 Wither height
Wither height is a good measure of bone growth and framesize in heifers. Frame size can influence ease of calving andappetite of milking cows.
Producers should aim for wither heights of 125 cm atmating and 135 cm at calving. For Jerseys, thecorresponding target wither heights are 115 cm at matingand 125 cm at calving.
14.6 Energy and protein requirements for heifers
Table 14.3 shows the energy requirements (formaintenance and growth) of heifers growing at different
rates at various liveweights. The growth rates for 500 kgheifers assume a contribution of 0.4 kg/d from thegrowing foetus.
Growing heifers require a constant source of protein foroptimum bone and muscle growth. Table 14.3 also listscrude protein requirements at different liveweights.
168

7/22/2019 Feeding Dairy Cows Manual
http://slidepdf.com/reader/full/feeding-dairy-cows-manual 198/264

7/22/2019 Feeding Dairy Cows Manual
http://slidepdf.com/reader/full/feeding-dairy-cows-manual 199/264
Chapter 14. Nutrition and Dairy Replacements
the spring flush of pasture growth following feedshortages the preceding winter. However, heifers shouldnot be allowed to lose weight or to grow very slowly forlong periods of time (ie. no more than two weeks).
14.7.2 Feeding supplementary grain
Achieving 100 kg extra liveweight at two years of agerequires the equivalent of 800 kg of cereal grain. Forexample, Friesian heifers might be grown to 525 kg insteadof 425. If dairy farmers can produce fully weaned calvesweighing 100 kg by twelve weeks of age, each heifer thenneeds to gain 425 kg over the next 21 months or an averageof 0.67 kg/day. As was described above, lifetime benefitsfrom 100 kg heavier heifers can be 3000–4000 litres of extramilk worth up to $1000 per animal.
Producers can afford to feed an extra 1.0 to 1.5 kg/daysupplementary grain per heifer to attain this growth.Assuming pasture quality is sufficient for three months ofthe year to promote growth of at least 0.7 kg/day withoutsupplements, then 2–3 kg/day grain is available to fill inany feed gaps during the remaining 15 months.
Many types of concentrates can be fed to supplementgrazing heifers. Provided pasture quality is adequate (at
least 10.5 MJ/kg), the cheapest and easiest grain to feed iswhole oats as it need not be rolled before feeding. A rule ofthumb used by irrigated beef producers was to feed wholeoats at 1 per cent of live weight when steer growth ratesfell below 1 kg/day. A similar rule of thumb for dairyfarmers might be, whole oats fed at one per cent liveweightwhen heifer growth rate falls below0.5 kg/day.
14.8 Introducing replacement heifers to the herd
Before calving, heifers were non-lactating animalscontinuously at pasture; once they calve they becomelactating animals with regular human contact twice eachday.
Grazing heifers with the main herd of dry cows during theheifers’ last months of pregnancy can accustom them to thecompetitive conditions with which they will have to copeduring lactation. Hand feeding heifers for a few weeks
before calving will provide extra feed to build up bodycondition as well as get them used to being handled. They
170

7/22/2019 Feeding Dairy Cows Manual
http://slidepdf.com/reader/full/feeding-dairy-cows-manual 200/264
Chapter 14. Nutrition and Dairy Replacements
could also be run quietly through the milking shed a fewtimes before calving to settle them into the milking routine.
Heifers receive immunity through routine vaccination.Heifers that graze with older cows are exposed to a greater
range of infectious agents and hence develop immunity tothe diseases carried by these cows as well. This immunitycan then be transferred to newborn calves by antibodies inthe heifers’ colostrum. If the milking herd has a history of
Johne’s disease or if there is a high chance that Johne’scarrier cows have been introduced to the herd, thengrazing options for young heifers are reduced.
Heifers reared in complete isolation from cows are likely topick up infections as they calve and come in contact withthe milking herd for the first time. This coincides with thetime when they should be in peak health to produce milk,get back in calf early and also overcome any stressesassociated with their radical change in management.
14.9 Agisting heifers off farm
Agisting young stock off the farm allows dairy farmers touse all available resources (feed, land and labour) toproduce milk while still having control over the disease
status of the heifers and the genetic progress in the herd.
Farmers must be well aware however, of the supply andquality of pasture for their agisted stock, the responsibilityfor stock health while away from the farm and the securityof the agistment area against theft and straying heifers aswell as neighbouring bulls.
When a site appears to meet these requirements, then themajor factors that need to be taken into account are the costof agistment and its proximity to the home farm.Agistment works well provided that it is cost-effective andheifer growth is monitored to ensure target weights areachieved.
Another option for off-farm rearing is for farmers tocontract specialist cattle producers to rear their heifers andreturn them prior to calving.
171

7/22/2019 Feeding Dairy Cows Manual
http://slidepdf.com/reader/full/feeding-dairy-cows-manual 201/264
Chapter 14. Nutrition and Dairy Replacements
14.10 Economic benefits from well-grown heifers
Replacement heifers are expensive to rear to first calving.After considering the cost of producing the calf ($100), itsrearing to weaning ($100–150), feed costs to first calving
($250–300) plus mating and health care ($100–150), mostproducers will pay $600–700 before each heifer starts‘paying her way’.
The economic benefits from higher milk production, betterfertility and lower culling rates justify the additional costsof better rearing systems. For Friesians, an extra $100 spentin rearing each heifer to calve at 520–550 kg could returnthree- to four-fold over that cow’s productive life.
172

7/22/2019 Feeding Dairy Cows Manual
http://slidepdf.com/reader/full/feeding-dairy-cows-manual 202/264
Chapter 14. Nutrition and Dairy Replacements
For a blank Worksheet see Appendix F.
Worksheet 3: The cost of nutrients in feeds
(Exercise 14.1)
Feed 1: Cost per kg DM A
X ÷ 100 =
kg bought (i) DM % kg DM
bought
B
÷ X 100† =
Cost of (i) ($) kg DM
bought (from
A)
c/kg DM
Cost per MJ ME C
÷ =
c/kg DM
(from B)
MJ ME
/kg DM
c/MJ ME
Cost per kilogram crude protein (or NDF) D
÷ x 100 =
c/kg DM
(from B)
CP %
(or NDF %)
c/kg CP
(or c/kg NDF)
Feed 2:
Cost per kg DM A
X ÷ 100 =
kg bought (i) DM % kg DM
bought
B
÷ X 100† =
Cost of (i) ($) kg DM
bought
(from A)
c/kg DM
Cost per MJ ME C
÷ =
c/kg DM
(from B)
MJ ME
/kg DM
c/MJ ME
Cost per kilogram crude protein (or NDF) D
÷ X 100 =
From B
(c/kg DM)
CP %
(or NDF %)
c/kg CP
(or c/kg NDF)
†To convert dollars per kilogram to cents per kilogram.
173

7/22/2019 Feeding Dairy Cows Manual
http://slidepdf.com/reader/full/feeding-dairy-cows-manual 203/264
Chapter 14. Nutrition and Dairy Replacements
174

7/22/2019 Feeding Dairy Cows Manual
http://slidepdf.com/reader/full/feeding-dairy-cows-manual 204/264
Chapter 15. Case Study
15. Case Study
Replace this page with the Case Study pages.

7/22/2019 Feeding Dairy Cows Manual
http://slidepdf.com/reader/full/feeding-dairy-cows-manual 205/264

7/22/2019 Feeding Dairy Cows Manual
http://slidepdf.com/reader/full/feeding-dairy-cows-manual 206/264
Appendix A: Answers to the Exercises
Appendix A: Answers to Exercises
Exercise 3.1: How much dry matter is in a feed?
Calculate and fill in the last two columns in the tablebelow.
A B C D
Type offeed
Feedas-fed(kg)
Moisture(%)
Dry matter(%)
100–B
Dry matter(kg)
A x C ÷ 100
Pasture 88 83 17 15
Silage 50 60 40 20
Hay 20 20 80 16
Wheat 16.7 10 90 15
Exercise 3.2: The energy intake from various feeds.
Which cow is eating the most energy?
...Deidre... (cow’s name)
A B C
CowType of
feedIntake
(kg DM)Energy content
(MJ/kg DM)
Energy intake(MJ)A x B
Amy Pasture 15 11 165
Bossy Silage 15 10 150
Chloe Hay 10 8.5 85
Deidre Wheat 8 13 104
191
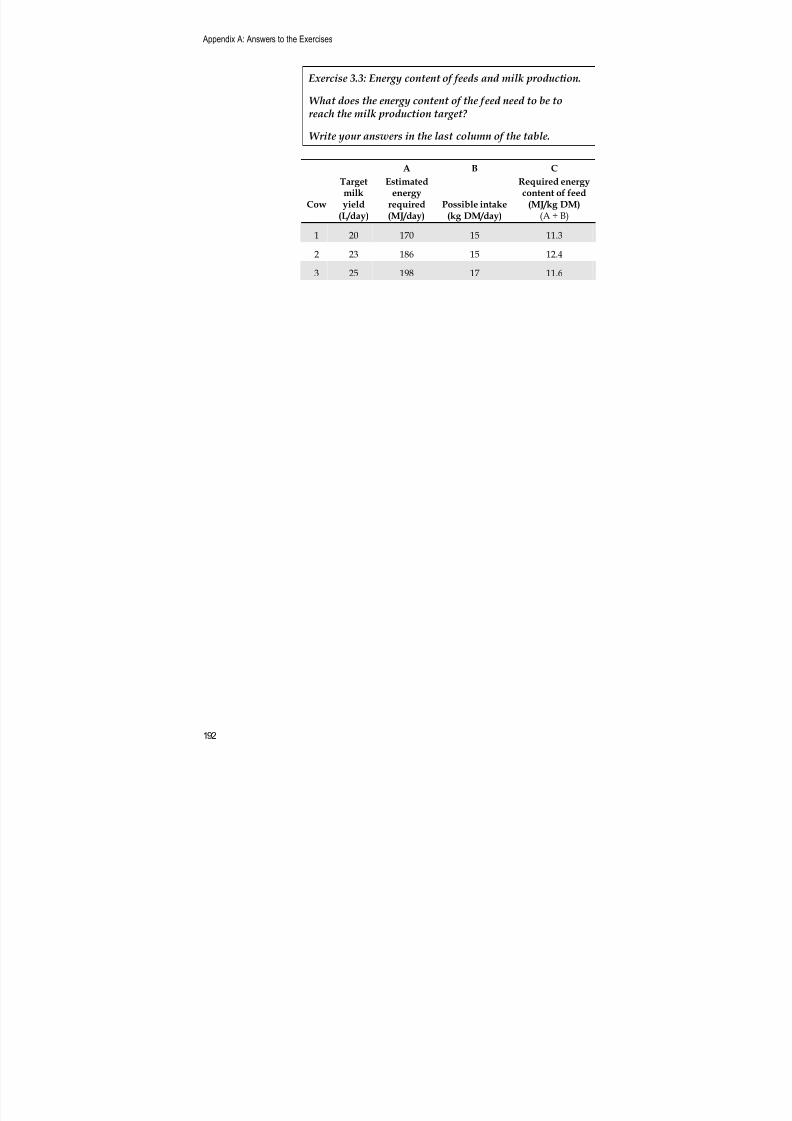
7/22/2019 Feeding Dairy Cows Manual
http://slidepdf.com/reader/full/feeding-dairy-cows-manual 207/264
Appendix A: Answers to the Exercises
Exercise 3.3: Energy content of feeds and milk production.
What does the energy content of the feed need to be toreach the milk production target?
Write your answers in the last column of the table.
A B C
Cow
Targetmilkyield
(L/day)
Estimatedenergy
required(MJ/day)
Possible intake(kg DM/day)
Required energycontent of feed
(MJ/kg DM)(A ÷ B)
1 20 170 15 11.3
2 23 186 15 12.4
3 25 198 17 11.6
192

7/22/2019 Feeding Dairy Cows Manual
http://slidepdf.com/reader/full/feeding-dairy-cows-manual 208/264
Appendix A: Answers to the Exercises
193
Exercise 5.1: What are the daily energy requirements of these cows?
Lactating animals are walking 2 km per day to the dairyon flat terrain.
COW DETAILS
Description Cow 1 Cow 2 Cow 3 Cow 4 Cow 5 Cow 6 Cow 7
Size (kg LWt) 500 550 450 600 500 500 500
Month of pregnancy 7th Empty 6th 9th 7th 7th Empty
Daily milk prod'n (L) 13 27 18 0 13 13 13
Fat test (%) 4.4 4 5.2 - 4.8 3.4 3.4
Protein test (%) 3.4 3.2 3.6 - 3.6 3.4 3.4
LWt gain / loss(kg/d)
+1.5 -1 0 +2 +1.5 0 +1.5
ENERGY REQUIREMENTS (MJ ME)
Category Cow 1 Cow 2 Cow 3 Cow 4 Cow 5 Cow 6 Cow 7
Maintenance 54 59 49 63 54 54 54
Activity 2 2 2 2 2 2 2
Pregnancy 10 0 8 20 10 10 0
Milk production 74 143 113 0 13x6 = 78
65 65
Weight gain or loss 66 -28 0 110 1.5x44= 66
0 66
Total energyrequirements
206 176 172 195 210 131 187

7/22/2019 Feeding Dairy Cows Manual
http://slidepdf.com/reader/full/feeding-dairy-cows-manual 209/264

7/22/2019 Feeding Dairy Cows Manual
http://slidepdf.com/reader/full/feeding-dairy-cows-manual 210/264
1 9 4
Worksheet 1: The daily energy, protein and f ibre needs of a cow (Exercise 6.1a)
The cow Her energy needs Her protein needs
Cow liveweight A For maintenance I
500 kg(Table 5.1)
54 MJ
Daily activity level B For activity J Early lactation 16–18%
Terrain(1-5)
5 MJ /km 5 X 4 = 20 MJMid-lactation
Late lactation
14–16%
12–14%
from B km Dry 10–12%
Month of pregnancy D For pregnancy L
- th month(Table 5.2) 0 MJ
Daily milk production E For milk production
Volume 25 litres(Table 5.3)
F MFat test 4.2 % 25 X 5.5 = 138 MJ
G from E MJ/L
Proteintest
3.4 %
Daily change in body For or from conditioncondition H (Table 5.5) N
gain+ loss-
-1 kg/cow/day
-1 X 28 = -28 MJ
from H MJ/kg
Total daily needs of this cow: Energy 184 MJCrude
protein
16-18 %
I +J+L+M± N from above
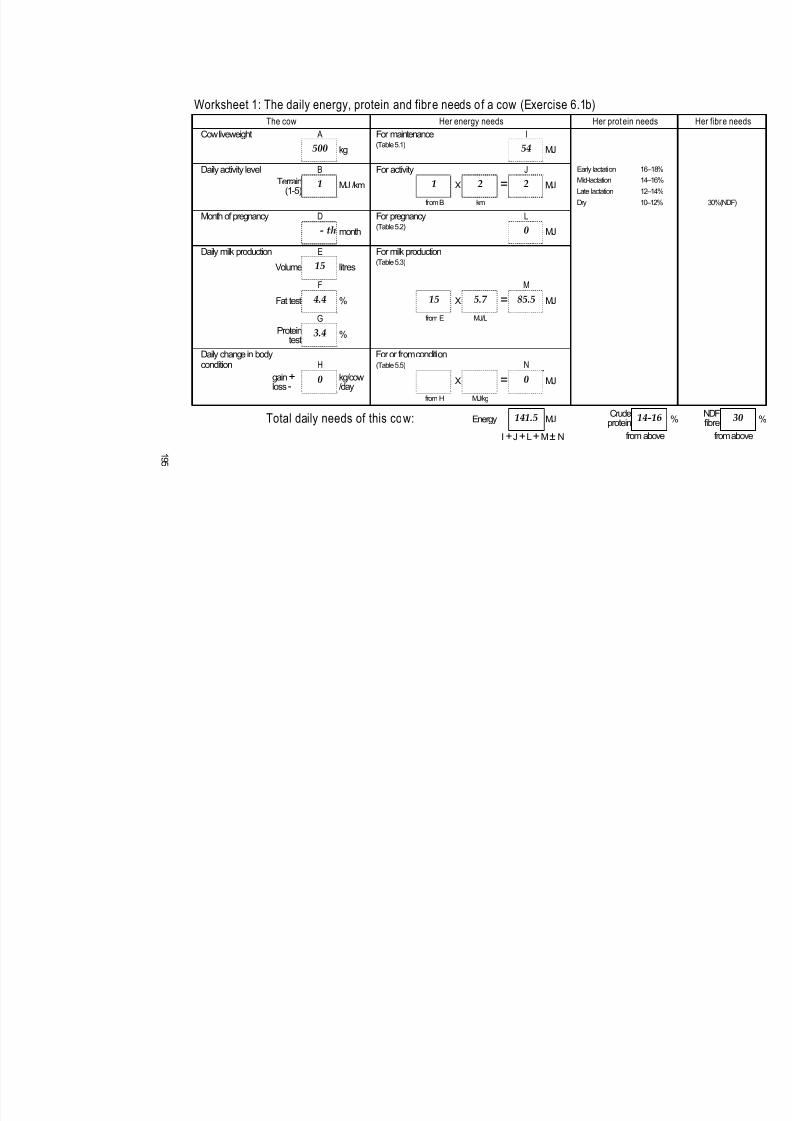
7/22/2019 Feeding Dairy Cows Manual
http://slidepdf.com/reader/full/feeding-dairy-cows-manual 211/264
Worksheet 1: The daily energy, protein and fibre needs of a cow (Exercise 6.1b)
The cow Her energy needs Her protein needs
Cow liveweight A For maintenance I500 kg
(Table 5.1) 54 MJ
Daily activity level B For activity J Early lactation 16–18%
Terrain(1-5)
1 MJ /km 1 X 2 = 2 MJMid-lactation
Late lactation
14–16%
12–14%
from B km Dry 10–12%
Month of pregnancy D For pregnancy L
- th month(Table 5.2) 0 MJ
Daily milk production E For milk production
Volume 15 litres(Table 5.3)
F M
Fat test 4.4 % 15 X 5.7 = 85.5 MJ
G from E MJ/L
Proteintest
3.4 %
Daily change in body For or from conditioncondition H (Table 5.5) N
gain+ loss-
0 kg/cow/day
X = 0 MJ
from H MJ/kg
Total daily needs of this cow: Energy 141.5 MJ Crudeprotein 14-16 %
I +J+L+M± N from above
1 9 5

7/22/2019 Feeding Dairy Cows Manual
http://slidepdf.com/reader/full/feeding-dairy-cows-manual 212/264

7/22/2019 Feeding Dairy Cows Manual
http://slidepdf.com/reader/full/feeding-dairy-cows-manual 213/264
Appendix A: Answers to the Exercises
196
Exercise 9.1: Use your knowledge of the nutritive value of feeds and minimum cow requirements to solve the following problems:
a) For each nutrient category, rank the feeds in boxes A–H from highest to lowest. Write the corresponding letter in the appropriate cell of the table.
b) Which feeds, on their own, would meet the minimumrequirements of a 500 kg cow in early lactation
producing 25 L of milk with 4.2 per cent fat and 3.4 per cent protein? Use Worksheet 1 to help you calculate thecow’s requirements.
Minimum requirements would be 191.5 MJ ME per day,with 16 per cent CP and 30 per cent NDF.
FEEDTEST
Results
A
Late
hay
B
Early
silage
C
Turnips
D
Dairy
pellets
E
Wet
brewersgrain
F
Good
autumnpasture
G
Poor
autumnpasture
H
Barley/
lupin mix(20%
lupin)
Moisture % 9.8 58.1 90.2 9.7 76.7 82 77.5 9.2
DM % 90.2 41.9 9.8 90.3 23.3 18 22.5 90.8
CP % 6.3 18.2 19.5 14.0 18.5 22 18 13.5
NDF % 60 35 20 15 40 30 35 22
Digestibility % 54.9 70.3 91.5 79.7 71.6 75 70 83.5
MJ / kg DM 7.3 10 13.6 11.4 10.2 10.8 9.9 12.2
DM(%)
Energy(MJ/kg DM)
Protein(% CP)
Fibre(% NDF)
Highest H (90.8) C (13.6) F (22) A (60)
D (90.3) H (12.2) C (19.5) E (40)
A (90.2) D (11.4) E (18.5) B (35)
B (41.9) F (10.8) B (18.2) G (35)
E (23.3) E (10.2) G (18) F (30)
G (22.5) B (10) D (14) H (22)
F (18) G (9.9) H (13.5) C (20)Lowest C (9.8) A (7.3) A (6.3) D (15)
Feeds that would potentially meet these requirements areearly silage, wet brewers grain, and both good or poorautumn pasture. Of these, it is most possible from the goodautumn pasture because it has the highest energy density(ie., less needs to be eaten to achieve adequate energyintake). The cow would have to eat around 18 kg DM/d ofgood autumn pasture versus 19.5 kg DM/d of poor
autumn pasture.

7/22/2019 Feeding Dairy Cows Manual
http://slidepdf.com/reader/full/feeding-dairy-cows-manual 214/264
Worksheet 1: The daily energy, protein and f ibre needs of a cow (Exercise 11.1)
The cow Her energy needs Her protein needs
A ICow liveweight For maintenance(Table 5.1)550 59kg MJ
B JDaily activity level For activity Early lactation 16–18%
Terrain(1-5)
1 MJ /km 1 X 5 = 5 MJMid-lactation
Late lactation
14–16%
12–14%
from B km Dry 10–12%
Month of pregnancy D For pregnancy L
- th month(Table 5.2) 0 MJ
Daily milk production E For milk production
Volume 25 litres(Table 5.3)
F M
Fat test 4.6 % 25 X 5.7 = 143 MJG from E MJ/L
Proteintest
3.2 %
Daily change in body For or from conditioncondition H (Table 5.5) N
gain+ loss-
-1.5 kg/cow/day
-1.5 X 28 = -42 MJ
from H MJ/kg
Total daily needs of this cow: Energy 165 MJCrudeprotein
16-18 %
I +J+L+M± N from above
1 9 7

7/22/2019 Feeding Dairy Cows Manual
http://slidepdf.com/reader/full/feeding-dairy-cows-manual 215/264
Worksheet 2: The energy, protein and fibre content of a diet (Exercise 11.2)
Dry matter Energy Protein
Pasture A F J
10 10 X 11.2 = 112 10 X 25.8 ÷ 100 = 2.6 1
kg DM
/cow/day
from A MJ/kg DM
from feed test
MJ/cow/day from A protein %
from feed test
kg/cow/day from
Supplement 1: Silage B G K
7 X 28.8 ÷ 100 = 2 2 X 8 = 16 2 X 12.1 ÷ 100 = 0.2 2
kg/cow/day dry matter % from
feed test
kg DM
/cow/day
from B MJ/kg DM
from feed test
MJ/cow/day from B protein %
from feed test
kg/cow/day from
Supplement 2: Wheat C H L
5.6 X 89.8 ÷ 100 = 5 5 X 12.8 = 64 5 X 12.6 ÷ 100 = 0.6 5
kg/cow/day dry matter % from
feed test
kg DM
/cow/day
from C MJ/kg DM
from feed test
MJ/cow/day from C protein %
from feed test
kg/cow/day from
Supplement 3: D I M
X ÷ 100 = X = X ÷ 100 =kg/cow/day dry matter % from
feed test
kg DM
/cow/day
from D MJ/kg DM
from feed test
MJ/cow/day from D protein %
from feed test
kg/cow/day from
E N
Total Total daily dry matter intake 17 Total daily energy intake 192 Total daily protein intake 3.4
A+B+C+D
kg DM/cow
F+G+H+I
MJ /cow
J+K+L+M
kg/cow
Total daily DM intake limitUse T and Table 11.2 or the formula
Protein % of ration 20.0
(120÷ T)÷ 100x liveweight kg/cow N÷Ex100
Cow requirements (from Worksheet 1)
Total daily energyrequirement
165 Crude protein requirement 16-18
MJ %
1 9 8
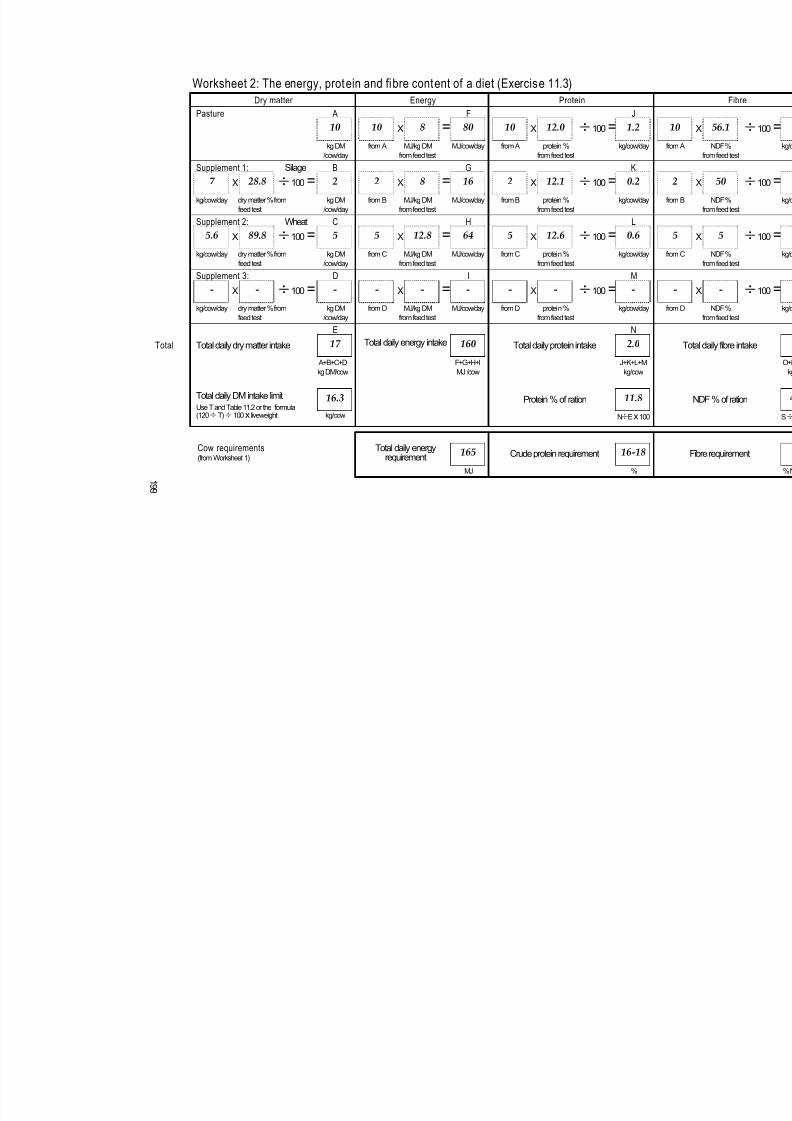
7/22/2019 Feeding Dairy Cows Manual
http://slidepdf.com/reader/full/feeding-dairy-cows-manual 216/264
Worksheet 2: The energy, protein and fibre content of a diet (Exercise 11.3)
Dry matter Energy Protein
Pasture A F J
10 10 X 8 = 80 10 X 12.0 ÷ 100 = 1.2 1
kg DM
/cow/day
from A MJ/kg DM
from feed test
MJ/cow/day from A protein %
from feed test
kg/cow/day from
Supplement 1: Silage B G K
7 X 28.8 ÷ 100 = 2 2 X 8 = 16 2 X 12.1 ÷ 100 = 0.2 2
kg/cow/day dry matter % from
feed test
kg DM
/cow/day
from B MJ/kg DM
from feed test
MJ/cow/day from B protein %
from feed test
kg/cow/day from
Supplement 2: Wheat C H L
5.6 X 89.8 ÷ 100 = 5 5 X 12.8 = 64 5 X 12.6 ÷ 100 = 0.6 5
kg/cow/day dry matter % from
feed test
kg DM
/cow/day
from C MJ/kg DM
from feed test
MJ/cow/day from C protein %
from feed test
kg/cow/day from
Supplement 3: D I M - X - ÷ 100 = - - X - = - - X - ÷ 100 = - -
kg/cow/day dry matter % from
feed test
kg DM
/cow/day
from D MJ/kg DM
from feed test
MJ/cow/day from D protein %
from feed test
kg/cow/day from
E N
Total Total daily dry matter intake 17 Total daily energy intake 160 Total daily protein intake 2.0
A+B+C+D
kg DM/cow
F+G+H+I
MJ /cow
J+K+L+M
kg/cow
Total daily DM intake limitUse T and Table 11.2 or the formula
16.3 Protein % of ration 11.8
(120÷ T)÷ 100x liveweight kg/cow N÷Ex100
Cow requirements (from Worksheet 1)
Total daily energyrequirement
165 Crude protein requirement 16-18
MJ % 1 9 9

7/22/2019 Feeding Dairy Cows Manual
http://slidepdf.com/reader/full/feeding-dairy-cows-manual 217/264
Appendix A: Answers to the Exercises
Exercise 11.4: Do the diets meet the cows' requirements?
Compare Worksheet 1 with the two versions of Worksheet 2 to determine whether the diets meet the cows' energy, protein, and fibre requirements. Summarise theinformation in the table:
Situation Energy Protein Fibre
181 16 – 18 30Cows’ requirements(Exercise 11.1)
192 20 24.1Usual diet(Exercise 11.2)
160 11.8 40.6Poorer-pasture diet(Exercise 11.3)
Exercise 11.5: Can cows physically eat that much feed?
Calculate the cows' intake limit, using the NDF percentages from Exercises 11.1, 11.2 and 11.3 and either Table 11.2 or the formula relating intake to NDF. Use the
following table to compare these limits with the intakescalculated earlier.
Total daily DM intake Daily DM intake limitDiet (kg DM) (kg DM)
17 27.4Usual(Exercise 11.2)
17 16.3Poorer pasture(Exercise 11.3)
200

7/22/2019 Feeding Dairy Cows Manual
http://slidepdf.com/reader/full/feeding-dairy-cows-manual 218/264
Appendix A: Answers to the Exercises
Worksheet 3: The cost of nutrients in feeds
(Exercise 11.6) Feed 1: Silage
ACost per kg DM
÷ 100 = 460 28.8 132.5X
kg bought (i) DM % kg DM
bought
B
÷ = †41 132.5 30.9X 100
Cost of (i) ($) kg DM
bought (from
A)
c/kg DM
CCost per MJ ME
÷ = 30.9 8 3.9
c/kg DM
(from B)
MJ ME
/kg DM
c/MJ ME
DCost per kilogram crude protein (or NDF)
÷ 30.9 12.1 255.4x 100 =
c/kg DM
(from B)
CP %
(or NDF %)
c/kg CP
(or c/kg NDF)
Feed 2: Wheat
ACost per kg DM
÷ 100 =1,000 89.8 898X
kg bought (i) DM % kg DM
bought
B
÷ =†250 898 27.8X 100
Cost of (i) ($) kg DM
bought
(from A)
c/kg DM
CCost per MJ ME
÷ = 27.8 12.8 2.2
c/kg DM
(from B)
MJ ME
/kg DM
c/MJ ME
DCost per kilogram crude protein (or NDF)
÷ = 27.8 12.6 220.6X 100
From B
(c/kg DM)
CP %
(or NDF %)
c/kg CP
(or c/kg NDF)
† To convert dollars per kilogram to cents per kilogram.
201

7/22/2019 Feeding Dairy Cows Manual
http://slidepdf.com/reader/full/feeding-dairy-cows-manual 219/264
Appendix A: Answers to the Exercises
Exercise 12.1: How do milk production and body conditionchange when diet changes?
In all scenarios, the cows have access to plenty of good-quality pasture (24 per cent protein, 30 per cent NDF).
Below are some changes that could be made to their diet. Describe how a cow’s milk production (litres, fat test, protein test) and body condition might change, if her diet is changed. (Answer Up, Down or Steady )
Up, Down or Steady?
Diet change Milk Fat test ProteinFat
(kg)
Protein
(kg)
Body
condition(L) (%) test (%)
Wheat fed gradually increasesfrom 1 kg to 4 kg per cow.
Up Up Down Up Steady *
Wheat fed suddenly increasesfrom 1 kg to 6 kg per cow.
Down Down Down Down *Steady
or DownHay is fed. Down Down Up Down *Steady
or Down
Turnips are fed. Up Up Down Up Steady *
*Depends on stage of lactation.
202

7/22/2019 Feeding Dairy Cows Manual
http://slidepdf.com/reader/full/feeding-dairy-cows-manual 220/264
Appendix A: Answers to the Exercises
203
Exercise 12.2: What is the value of a certain type of milk?
Milk prices are calculated by different methods. The tablebelow lists different daily milk production, with differing tests for fat and protein and with one type of
compositional pricing structure.
Calculate the value of each component in the milk todetermine which cow's milk has the highest value.
Round your answers to the number of decimal placesshown for Cow 1; i.e. two decimal places for columns Dand J, and three decimal places for columns E, F, G, H, and
I.
FAT PRICE($/KG)
= $2.20
PROTEINPRICE ($/KG)
= $5.00
LITRE CHARGE($/LITRE)
= $0.028
A B C D E F G H I J
Protein tofat ratio
Fat yield(kg)
Proteinyield (kg) Fat
($)Protein
($)
Litrecharge ($)
Totalreturn
($)
Cow LFat(%)
Prot.(%) C ÷ B
A x B ÷
100
A x C ÷ 100
E x fat
price
F x protein
price
A x litre
charge G + H - I
1 15 5.30 4.30 0.81 0.795 0.645 $1.749 $3.225 $0.420 $4.55
2 15 4.50 3.60 0.80 0.675 0.540 $1.485 $2.700 $0.420 $3.77
3 18 4.17 3.25 0.78 0.751 0.585 $1.652 $2.925 $0.504 $4.07
4 18 4.50 3.60 0.80 0.810 0.648 $1.782 $3.240 $0.504 $4.52
5 20 3.90 3.10 0.79 0.780 0.620 $1.716 $3.100 $0.560 $4.26
6 20 4.60 3.90 0.85 0.920 0.780 $2.024 $3.900 $0.560 $5.36
7 22 3.60 2.80 0.78 0.792 0.616 $1.742 $3.080 $0.616 $4.21
8 22 4.10 3.30 0.80 0.902 0.726 $1.984 $3.630 $0.616 $5.00
9 25 3.70 3.00 0.81 0.925 0.750 $2.035 $3.750 $0.700 $5.09
10 25 4.00 3.30 0.83 1.000 0.825 $2.200 $4.125 $0.700 $5.63
11 30 3.70 3.00 0.81 1.110 0.900 $2.442 $4.500 $0.840 $6.10
12 30 3.60 2.90 0.81 1.080 0.870 $2.376 $4.350 $0.840 $5.89
Highest value = Cow ___11___.

7/22/2019 Feeding Dairy Cows Manual
http://slidepdf.com/reader/full/feeding-dairy-cows-manual 221/264
Appendix A: Answers to the Exercises
Exercise 14.1 Use Worksheet 3 to calculate the cost of nutrients in the calf feeds you use.
Answers depend on the feeds you use on your farm, and how much they cost.
204

7/22/2019 Feeding Dairy Cows Manual
http://slidepdf.com/reader/full/feeding-dairy-cows-manual 222/264
Appendix B: Vitamins and Minerals Required by Dairy Cows
Appendix B: Vitamins and Minerals
Required by Dairy Cows
Vitamins required by dairy cows
Vitamin A
Vitamin A (retinol) is a component of the visual pigmentsin the eye. It is also involved in the formation of tissue andbone and is required for growth, milk production and
reproduction. Excess vitamin A is stored in the liver for upto 3–4 months.
Vitamin A is formed from dietary carotene in the intestinalwall. Most of the vitamin A requirement is met by theconsumption of grasses. Deficiencies of vitamin A areuncommon in grazing cattle but can occur in cattle feddiets high in cereals or cereal straws or in calves fed low fatmilk replacers low in vitamin A.
Vitamin D
Vitamin D is closely involved with calcium (Ca) andphosphorus (P) metabolism as it is required for Ca and Pabsorption and deposition within bone. It also stimulatesthe absorption of calcium from the small intestine. If Caand P levels are adequate in the diet, the need for vitaminD is small.
Vitamin D is also required for the growth and maintenanceof teeth and bone.
Vitamin D is used in the prevention of milk fever.However, the effectiveness of vitamin D in treating milkfever is reduced when dietary calcium is too low or toohigh. The best results are achieved when calcium intakesare in the order of 50–70g calcium/day.
Vitamin D is formed in the skin following exposure tosunlight and is stored in the liver. Deficiencies are rare,however vitamin D toxicity has been observed in cowsgiven excessive doses of vitamin D during the treatment of
milk fever. Vitamin D toxicity results in the calcification ofthe body's soft tissues (especially the aorta in the heart).
205
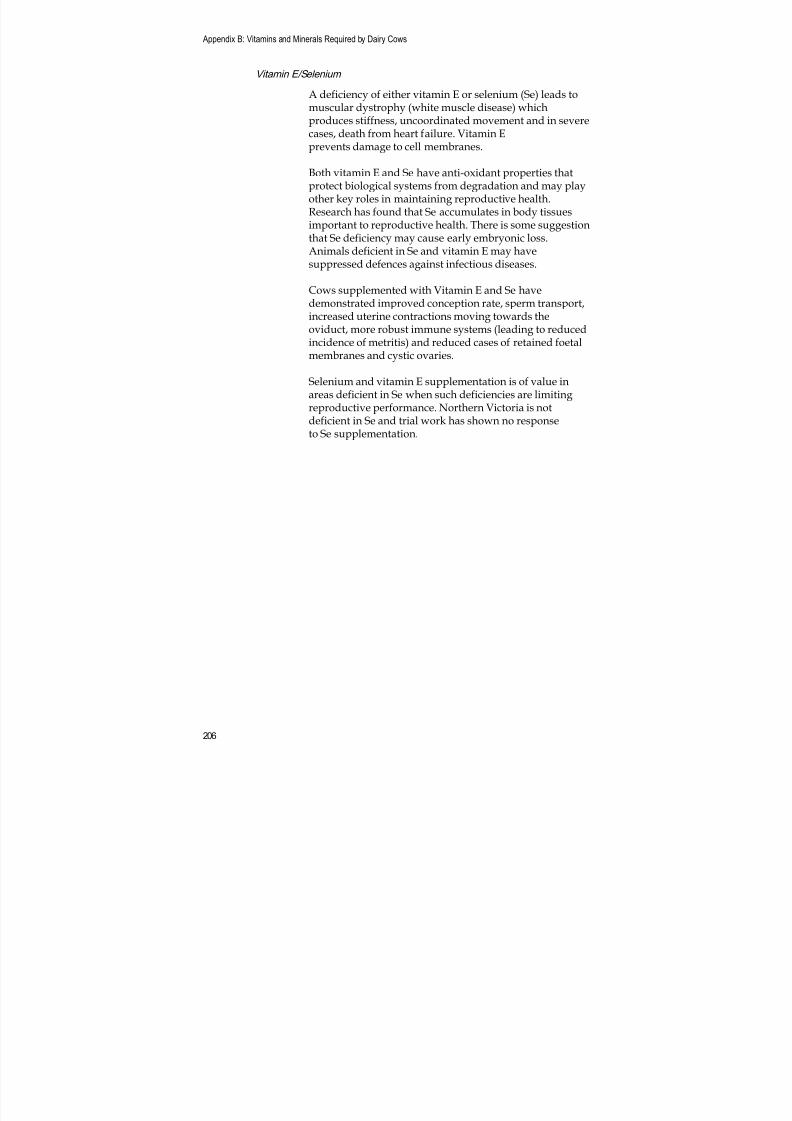
7/22/2019 Feeding Dairy Cows Manual
http://slidepdf.com/reader/full/feeding-dairy-cows-manual 223/264
Appendix B: Vitamins and Minerals Required by Dairy Cows
206
Vitamin E/Selenium
A deficiency of either vitamin E or selenium (Se) leads tomuscular dystrophy (white muscle disease) whichproduces stiffness, uncoordinated movement and in severe
cases, death from heart failure. Vitamin Eprevents damage to cell membranes.
Both vitamin E and Se have anti-oxidant properties thatprotect biological systems from degradation and may playother key roles in maintaining reproductive health.Research has found that Se accumulates in body tissuesimportant to reproductive health. There is some suggestionthat Se deficiency may cause early embryonic loss.Animals deficient in Se and vitamin E may havesuppressed defences against infectious diseases.
Cows supplemented with Vitamin E and Se havedemonstrated improved conception rate, sperm transport,increased uterine contractions moving towards theoviduct, more robust immune systems (leading to reducedincidence of metritis) and reduced cases of retained foetalmembranes and cystic ovaries.
Selenium and vitamin E supplementation is of value inareas deficient in Se when such deficiencies are limitingreproductive performance. Northern Victoria is notdeficient in Se and trial work has shown no responseto Se supplementation.

7/22/2019 Feeding Dairy Cows Manual
http://slidepdf.com/reader/full/feeding-dairy-cows-manual 224/264
Minerals required by dairy cows
Macrominerals
Mineral Interfering
factors
Function Major sources
Calcium
(Ca)
Phosphorus,
vitamin D
Component of bone and teeth, involved in heart,
muscle and nerve function and blood coagulation.
Essential for milk production
Bone reserves mobilised
during mild dietary
deficiencies, legumes,
grasses.
Absorbed fro
equivalent to
Concentratio
main variabl
Magnesium
(Mg)
Potassium,
high levels of
rumen
ammonia
Nerve and muscle function, carbohydrate and
lipid metabolism, involved in the secretion of some
hormones. Plays a role in regulating calcium in
blood and bone.
Legumes, grasses, causmag,
Epsom salts or magnesium
chloride.
Absorbed in
inadequate t
excreted in th
causes diarrh
calcium and
Phosphorus
(P)
Calcium,
vitamin D,
phytic acid
Needed for sound bone and teeth. Vital
component in protein, buffer in saliva.
Legumes, grasses, boneflour,
DAP, monosodium
phosphate.
Absorbed fro
Excess P recy
which mobil
with absorpt
Potassium
(K)
Essential for enzyme, muscle and nerve function.
Major role in carbohydrate metabolism and in
nerves and muscles.
Grasses, potassium chloride. Absorbed in
K reduces ab
especially w
Sodium (Na)
Chlorine (Cl)
Na necessary for absorption of sugar and amino
acids from the digestive tract. Cl plays a role in
gastric digestion in the abomasum. Na and Cl
involved with potassium in osmotic regulation
and in acid-base balance.
Pasture generally contains
plenty of Na.
Salt licks
Na and Cl ab
secreted in u
excretion in u
short supply
2 0 7

7/22/2019 Feeding Dairy Cows Manual
http://slidepdf.com/reader/full/feeding-dairy-cows-manual 225/264

7/22/2019 Feeding Dairy Cows Manual
http://slidepdf.com/reader/full/feeding-dairy-cows-manual 226/264
Appendix C: Data Tables
Appendix C: Data Tables
This appendix contains all the data tables that you willneed to refer to as you work the exercises and the casestudy.
Energy needed for maintenance
Table 5.1: Energy requirements for maintenance.
Liveweight(kg)
Energy requirement(MJ/day)
100 17
150 22
200 27
250 31
300 36
350 40
400 Typical Jersey cow range 45
450 49
500 54
550 Typical Friesian cow range 59
600 63
700 72
(Source: MAFF, 1984.)
Energy needed for activity
On flat terrain, 1 MJ per kilometre should be added to
provide the energy needed to walk to and from the dairy.On very steep terrain, 5 MJ are required per kilometre.Between these two extremes, include an allowance foractivity which reflects the degree of undulation of theterrain.
Energy needed for pregnancy
From conception through the first five months of
pregnancy, the additional energy required isapproximately 1 MJ ME/day for each month of pregnancy.
209

7/22/2019 Feeding Dairy Cows Manual
http://slidepdf.com/reader/full/feeding-dairy-cows-manual 227/264
Appendix C: Data Tables
Table 5.2 shows the average daily energy requirementsduring the last four months.
Table 5.2: Average daily energy requirements in the
last four months of pregnancy.
Month of pregnancy Additional energy required(MJ/d)
Sixth 8
Seventh 10
Eighth 15
Ninth 20
(Source: MAFF, 1984.)
210

7/22/2019 Feeding Dairy Cows Manual
http://slidepdf.com/reader/full/feeding-dairy-cows-manual 228/264
Appendix C: Data Tables
Energy needed for milk production
Table 5.3: Energy needed per litre of milk of varying
composition.
Protein (%)
2.6 2.8 3.0 3.2 3.4 3.6 3.8 4.0 4.2 4.4
Fat (%) MJ/litre of milk
3.0 4.5 4.5 4.6 4.7 4.8 4.8 4.9 5.0 5.0 5.1
3.2 4.6 4.7 4.7 4.8 4.9 5.0 5.0 5.1 5.2 5.2
3.4 4.7 4.8 4.9 4.9 5.0 5.1 5.2 5.2 5.3 5.4
3.6 4.9 4.9 5.0 5.1 5.1 5.2 5.3 5.4 5.4 5.5
3.85.0 5.1 5.1 5.2 5.3 5.3 5.4 5.5 5.6 5.6
4.0 5.1 5.2 5.3 5.3 5.4 5.5 5.5 5.6 5.7 5.8
4.2 5.3 5.3 5.4 5.5 5.5 5.6 5.7 5.7 5.8 5.9
4.4 5.4 5.5 5.5 5.6 5.7 5.7 5.8 5.9 6.0 6.0
4.6 5.5 5.6 5.7 5.7 5.8 5.9 5.9 6.0 6.1 6.2
4.8 5.6 5.7 5.8 5.9 5.9 6.0 6.1 6.1 6.2 6.3
5.0 5.8 5.8 5.9 6.0 6.1 6.1 6.2 6.3 6.3 6.4
5.2 5.9 6.0 6.0 6.1 6.2 6.3 6.3 6.4 6.5 6.5
5.4 6.0 6.1 6.2 6.3 6.3 6.4 6.5 6.5 6.6 6.7
5.6 6.2 6.2 6.3 6.4 6.5 6.5 6.6 6.7 6.7 6.8
5.8 6.3 6.4 6.4 6.5 6.6 6.7 6.7 6.8 6.9 6.9
6.0 6.4 6.5 6.6 6.6 6.7 6.8 6.9 6.9 7.0 7.1
(Source: MAFF, 1984.)
Energy needed for body condition
Table 5.4 shows how much different condition scoresweigh. Generally, the amount of weight gain required toincrease the cow’s condition by one condition score is
about 8 per cent of the cow’s current liveweight.
Table 5.4: The weight of one condition score on cowsof different sizes.
cow’s approximateliveweight (kg)
Additional weight to increaseby one condition score (kg)
550 (Friesian) 44
475 (Friesian X Jersey) 38
400 (Jersey) 32
211

7/22/2019 Feeding Dairy Cows Manual
http://slidepdf.com/reader/full/feeding-dairy-cows-manual 229/264
Appendix C: Data Tables
Table 5.5: The energy a kilogram of body weight orcondition needs or releases.
Change in bodycondition
MJ needed togain 1 kg of
weight
MJ available from1 kg of weight loss
Late lactation gain 44 -
Dry period gain 55 -
Weight loss - 28
Protein requirements
Table 5.6: Crude protein needs of a cow at differentproduction levels.
Milk production Crude proteinrequirements
Early lactation 16–18%
Mid lactation 14–16%
Late lactation 12–14%
Dry 10–12%
Fibre requirements
Table 5.7: The absolute minimum percentage of fibreneeded in a cow’s diet for healthy rumenfunction (using three different measures offibre).
Fibre measurement Minimum amount of fibre in thediet (percent of total dry matter)
Neutral detergent fibre 30%
Acid detergent fibre 19%
Crude fibre 17%
212

7/22/2019 Feeding Dairy Cows Manual
http://slidepdf.com/reader/full/feeding-dairy-cows-manual 230/264
Appendix C: Data Tables
Calculating the cow’s daily intake limit
Table 11.2: Maximum daily intake of cows as affected
by the NDF % of the diet.
Live- Maximum daily intake (kg DM)
weight NDF %
(kg) 25 30 35 40 45 50 55 60 65 70 75 80
100 4.8 4.0 3.4 3.0 2.7 2.4 2.2 2.0 1.8 1.7 1.6 1.5
150 7.2 6.0 5.1 4.5 4.0 3.6 3.3 3.0 2.8 2.6 2.4 2.3
200 9.6 8.0 6.9 6.0 5.3 4.8 4.4 4.0 3.7 3.4 3.2 3.0
250 12.0 10.0 8.6 7.5 6.7 6.0 5.5 5.0 4.6 4.3 4.0 3.8
300 14.4 12.0 10.3 9.0 8.0 7.2 6.5 6.0 5.5 5.1 4.8 4.5
350 16.8 14.0 12.0 10.5 9.3 8.4 7.6 7.0 6.5 6.0 5.6 5.3
400 19.2 16.0 13.7 12.0 10.7 9.6 8.7 8.0 7.4 6.9 6.4 6.0
450 21.6 18.0 15.4 13.5 12.0 10.8 9.8 9.0 8.3 7.7 7.2 6.8
500 24.0 20.0 17.1 15.0 13.3 12.0 10.9 10.0 9.2 8.6 8.0 7.5
550 26.4 22.0 18.9 16.5 14.7 13.2 12.0 11.0 10.2 9.4 8.8 8.3
600 28.8 24.0 20.6 18.0 16.0 14.4 13.1 12.0 11.1 10.3 9.6 9.0
650 31.2 26.0 22.3 19.5 17.3 15.6 14.2 13.0 12.0 11.1 10.4 9.8
Source: Linn and Martin, 1989
Alternatively, you can use the formula:
(120 ÷ NDF%)÷ 100 x liveweight = kg DM/d maximumintake.
For example, if a feed has 37.5% NDF, the maximum intakefor a 600-kg cow is:
(120 ÷ 37.5) ÷ 100 x 600 = 19.2 kg DM/d maximum intake.
213

7/22/2019 Feeding Dairy Cows Manual
http://slidepdf.com/reader/full/feeding-dairy-cows-manual 231/264
Appendix C: Data Tables
214

7/22/2019 Feeding Dairy Cows Manual
http://slidepdf.com/reader/full/feeding-dairy-cows-manual 232/264
Appendix D: Feed Values
Appendix D: Feed Values
Note: If ranges are not presented the average value is froma single sample, therefore value should be usedwith caution.
Feed DM (%) ME (MJ/kg DM) CP (%) NDF (%)
Average Range Average Range
Almond hulls 90 8.6 7.2–10.6 5.6 3.6–9.8
Apple pomace(dried)
89 10.0 5.0
Barley 90 12.0 12.0–14.0 12.0 8.0–18.0 20.0
Barleyscreenings
89 10.7 12.5
Barley straw 85 6.0 5.0–8.0 3.0 2.0–5.0
Bean kibble 92 8.7 15.0
Brewers grain 25 10.0 9.0–12.0 23.0 21.0–27.0 42.0
Buckwheat 88 11.0 12.0
Canola meal 85 12.0 11.0–13.0 39.0 33.0–43.0 28.0
Carrot pulp 14 9.0 6.0
Carrots 13 12.0 10.0
Chocolate (28%fat)
98 18.2 6.5
Citrus pulp 19 12.0 10.0–13.0 7.0 6.0–8.0 23.0
Cornflakes 95 13.2 11.4
Cottonseed(whole)
90 15.0 13.0–16.0 24.0 20.0–26.0 44.0
Cottonseedmeal
85 12.0 11.0–13.0 42.0 37.0–45.0 30.0
Faba bean
pollard
90 9.4 16.1
Fishmeal 85 12.0 10.0–13.0 67.0 65.0–70.0 7.0
Grape marc 90 4.9 4.0–6.1 12.2 11.1–14.0
Linseed meal 85 12.0 34.0 30.0–34.0
Lucernehay/silage
28–80 8.0 7.0–9.0 16.0 14.0–20.0 40.0–60.0
Lupins 90 13.0 12.0–13.0 33.0 28.0–40.0 27.0
Maize (grain) 90 14.0 12.0–16.0 10.0 7.0–14.0 9.0
Maize (tassel) 19 10.0 11.0 50.0
Maize silage 35 10.0 9.0–11.0 6.0 5.0–8.0 40.0–55.0
Malt combings 11.0 9.8–12.2 21.4 10.5–30.6
215

7/22/2019 Feeding Dairy Cows Manual
http://slidepdf.com/reader/full/feeding-dairy-cows-manual 233/264
Appendix D: Feed Values
Feed DM (%) ME (MJ/kg DM) CP (%) NDF (%)
Average Range Average Range
Millet 18 9.0 11.0 40.0–60.0Molasses 77 11.0 5.0
Oat hulls 93 5.0 4.0
Oaten hay 85 8.0 6.0–10.0 9.0 9.0–17.0 50.0–60.0
Oaten straw 85 6.0 5.0–7.0 3.0 2.0–4.0
Oats 90 11.0 9.0–13.0 10.0 6.0–13.0 32.0
Oats(flowering)
23 9.0 8.0 60.0
Oats(immature)
16 10.0 9.0–12.0 21.0 20.0–24.0 46.0
Pasja 14 13.0 20.0 30.0Pasturehay/silage
20–80 9.0 5.0–12.0 12.0 3.0–30.0 45.0–60.0
Pea hay 88 9.0 14.0
Pea pollard 91 8.7 6.5–10.5 17.4 11.8–20.8
Peanut hulls 90 4.0 6.0
Peanut meal 92 12.0 48.0
Peas 90 13.0 12.0–13.0 24.0 20.0–27.0 13.0
Pistachio nuts 90 7.1 8.0
Potato mash 24 14.0 10.8–15.7 10.0 7.9–13.2 12.0
Rape 14 12.0 20.0 30.0
Rice straw 85 6.0 5.0–7.0 4.0 3.0–5.0
Rye bran 91 9.0 17.0
Ryegrass(annual)
16 11.0 9.5–11.0 22.0 18.0–24.0 30.0–45.0
Safflower meal 85 11.0 9.0–12.0 43.0 22.0–54.0 58.0
Sorghum(grain)
90 11.0 7.0–13.0 11.0 6.0–15.0 18.0
Sorghum
(greenchop)
18 9.0 7.0–11.0 12.0 7.0–18.0 40.0–60.0
Sorghum silage 35 8.0 7.0–9.0 6.0 5.0–8.0 50.0–60.0
Soybean meal 85 13.0 12.0–14.0 52.0 46.0–59.0 15.0
Sunflower hulls 90.0 5.1 4.0
Sunflower meal 85 10.0 6.0–12.0 35.0 26.0–50.0 40.0
Sunflowerseeds
90 12.0 47.0
Tomato pulp 28 6.3 4.1–8.1 20.4 17.7–22.4
Triticale 90 13.0 12.0–13.0 12.0 8.0–16.0 14.0
Turnips, bulb 11 13.0 13.0–14.0 9.0 6.0–15.0 21.0
Turnips, leaf 9 12.0 4.5–11.0 14.0 8.0–20.0 24.0
216

7/22/2019 Feeding Dairy Cows Manual
http://slidepdf.com/reader/full/feeding-dairy-cows-manual 234/264
Appendix D: Feed Values
Feed DM (%) ME (MJ/kg DM) CP (%) NDF (%)
Average Range Average Range
Turnips, whole 10 13.0 11.0–13.0 11.0 6.0–18.0 22.0Wheat 90 13.0 12.0–14.0 12.0 9.0–17.0 14.0
Wheat bran 89 10.0 18.0
Wheat straw 91 7.0 3.0
Whey 7 14.0 11.0
217

7/22/2019 Feeding Dairy Cows Manual
http://slidepdf.com/reader/full/feeding-dairy-cows-manual 235/264
Appendix D: Feed Values
218

7/22/2019 Feeding Dairy Cows Manual
http://slidepdf.com/reader/full/feeding-dairy-cows-manual 236/264
Appendix E: Dry Matter Content of Hay and Silage Bales
Appendix E: Dry Matter Content of Hay
and Silage Bales
Bale type Wet weight (kg) Dry matter (%) Dry weight (kg)
Hay
4x4 round 250 85 215
5x4 round 350 85 300
5x6 round 500 85 425
8x3x3 square 300 85 255
8x4x3 square 600 85 510
8x4x4 square 750 85 640
Silage
4x4 round 700 35 245
1 cubic metre
(wilted)
580 30 175
1 cubic metre
(direct cut)
830 18 115
1 cubic metre
maize silage
500 35 175
219

7/22/2019 Feeding Dairy Cows Manual
http://slidepdf.com/reader/full/feeding-dairy-cows-manual 237/264
Appendix E: Dry Matter Content of Hay and Silage Bales
220
7/22/2019 Feeding Dairy Cows Manual
http://slidepdf.com/reader/full/feeding-dairy-cows-manual 238/264
Appendix F: Copies of Worksheets Used in the Manual
Appendix F: Copies of Worksheets Used
in the Manual
Appendix F contains blank worksheets for your use.
221

7/22/2019 Feeding Dairy Cows Manual
http://slidepdf.com/reader/full/feeding-dairy-cows-manual 239/264

7/22/2019 Feeding Dairy Cows Manual
http://slidepdf.com/reader/full/feeding-dairy-cows-manual 240/264
Worksheet 1: The daily energy, protein and fibre needs of a cow
The cow Her energy needs Her protein needs
Cow liveweight A For maintenance I
kg(Table 5.1)
MJ
Daily activity level B For activity J Early lactation 16–18%
Terrain(1-5)
MJ /km X = MJMid-lactation
Late lactation
14–16%
12–14%
from B km Dry 10–12%
Month of pregnancy D For pregnancy L
th month(Table 5.2)
MJ
Daily milk production E For milk production
Volume litres(Table 5.3)
F M
Fat test % X = MJ
G from E MJ/L
Proteintest
%
Daily change in body For or from conditioncondition H (Table 5.5) N
gain+ loss-
kg/cow/day
X = MJ
from H MJ/kg
Total daily needs of this cow: Energy MJ Crudeprotein %
I +J+L+M± N from above
2 2 3

7/22/2019 Feeding Dairy Cows Manual
http://slidepdf.com/reader/full/feeding-dairy-cows-manual 241/264

7/22/2019 Feeding Dairy Cows Manual
http://slidepdf.com/reader/full/feeding-dairy-cows-manual 242/264
Worksheet 1: The daily energy, protein and fibre needs of a cow
The cow Her energy needs Her protein needs
A ICow liveweight For maintenance(Table 5.1)kg MJ
B JDaily activity level For activity Early lactation 16–18%
= Terrain(1-5)
Mid-lactation 14–16%MJ /km X MJ
Late lactation 12–14%
from B km Dry 10–12%
D LMonth of pregnancy For pregnancy(Table 5.2)
th month MJ
EDaily milk production For milk production(Table 5.3)
Volume litres
F M
= Fat test % X MJ
G from E MJ/L
Proteintest
%
Daily change in body For or from conditionH Ncondition (Table 5.5)
gain+ loss-
= kg/cow/day
X MJ
from H MJ/kg
Crude Total daily needs of this cow: Energy MJ %protein
I +J+L+M± N from above
2 2 5

7/22/2019 Feeding Dairy Cows Manual
http://slidepdf.com/reader/full/feeding-dairy-cows-manual 243/264
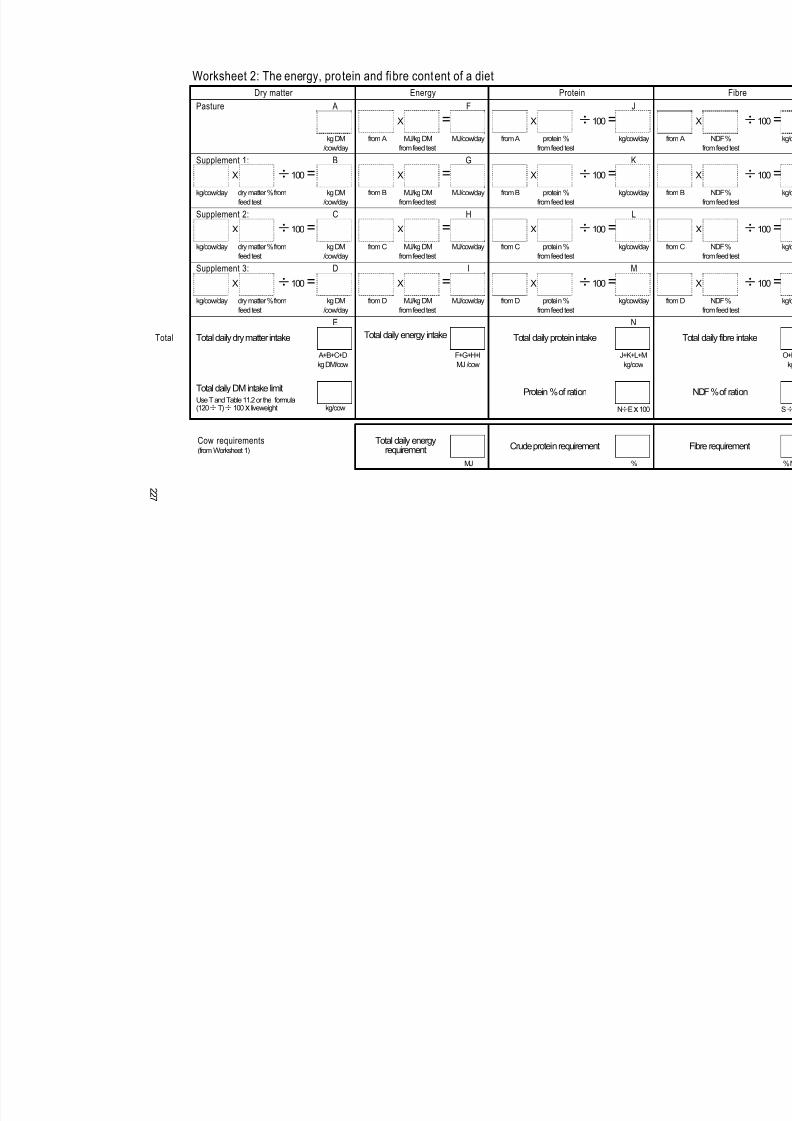
7/22/2019 Feeding Dairy Cows Manual
http://slidepdf.com/reader/full/feeding-dairy-cows-manual 244/264
Worksheet 2: The energy, protein and fibre content of a diet
Dry matter Energy Protein
Pasture A F J
X = X ÷ 100 =
kg DM/cow/day
from A MJ/kg DMfrom feed test
MJ/cow/day from A protein %from feed test
kg/cow/day from
Supplement 1: B G K
X ÷ 100 = X = X ÷ 100 =kg/cow/day dry matter % from
feed test
kg DM
/cow/day
from B MJ/kg DM
from feed test
MJ/cow/day from B protein %
from feed test
kg/cow/day from
Supplement 2: C H L
X ÷ 100 = X = X ÷ 100 =kg/cow/day dry matter % from
feed test
kg DM
/cow/day
from C MJ/kg DM
from feed test
MJ/cow/day from C protein %
from feed test
kg/cow/day from
Supplement 3: D I M
X ÷ 100 = X = X ÷ 100 =kg/cow/day dry matter % from
feed test
kg DM
/cow/day
from D MJ/kg DM
from feed test
MJ/cow/day from D protein %
from feed test
kg/cow/day from
E N
Total Total daily dry matter intake Total daily energy intake Total daily protein intake
A+B+C+D
kg DM/cow
F+G+H+I
MJ /cow
J+K+L+M
kg/cow
Total daily DM intake limitUse T and Table 11.2 or the formula
Protein % of ration
(120÷ T)÷ 100x liveweight kg/cow N÷Ex100
Cow requirements (from Worksheet 1)
Total daily energyrequirement Crude protein requirement
MJ %
2 2 7

7/22/2019 Feeding Dairy Cows Manual
http://slidepdf.com/reader/full/feeding-dairy-cows-manual 245/264

7/22/2019 Feeding Dairy Cows Manual
http://slidepdf.com/reader/full/feeding-dairy-cows-manual 246/264
Worksheet 2: The energy, protein and fibre content of a diet
Dry matter Energy Protein
Pasture A F J
X = X ÷ 100 =
kg DM/cow/day
from A MJ/kg DMfrom feed test
MJ/cow/day from A protein %from feed test
kg/cow/day from
Supplement 1: B G K
X ÷ 100 = X = X ÷ 100 =kg/cow/day dry matter % from
feed test
kg DM
/cow/day
from B MJ/kg DM
from feed test
MJ/cow/day from B protein %
from feed test
kg/cow/day from
Supplement 2: C H L
X ÷ 100 = X = X ÷ 100 =kg/cow/day dry matter % from
feed test
kg DM
/cow/day
from C MJ/kg DM
from feed test
MJ/cow/day from C protein %
from feed test
kg/cow/day from
Supplement 3: D I M
X ÷ 100 = X = X ÷ 100 =kg/cow/day dry matter % from
feed test
kg DM
/cow/day
from D MJ/kg DM
from feed test
MJ/cow/day from D protein %
from feed test
kg/cow/day from
E N
Total Total daily dry matter intake Total daily energy intake Total daily protein intake
A+B+C+D
kg DM/cow
F+G+H+I
MJ /cow
J+K+L+M
kg/cow
Total daily DM intake limitUse T and Table 11.2 or the formula
Protein % of ration
(120÷ T)÷ 100x liveweight kg/cow N÷Ex100
Cow requirements (from Worksheet 1)
Total daily energyrequirement Crude protein requirement
MJ %
2 2 9

7/22/2019 Feeding Dairy Cows Manual
http://slidepdf.com/reader/full/feeding-dairy-cows-manual 247/264

7/22/2019 Feeding Dairy Cows Manual
http://slidepdf.com/reader/full/feeding-dairy-cows-manual 248/264
Worksheet 3: The cost of nutrients in feeds Feed 1:
ACost per kg DM
÷ 100 = X
kg bought (i) DM % kg DM
bought
B
÷ = † X 100
Cost of (i) ($) kg DM
bought (from
A)
c/kg DM
CCost per MJ ME
÷ =
c/kg DM
(from B)
MJ ME
/kg DM
c/MJ ME
DCost per kilogram crude protein (or NDF)
÷ x 100 =
c/kg DM
(from B)
CP %
(or NDF %)
c/kg CP
(or c/kg NDF)
Feed 2:
ACost per kg DM
÷ 100 =X
kg bought (i) DM % kg DM
bought
B
÷ =† X 100
Cost of (i) ($) kg DM
bought
(from A)
c/kg DM
CCost per MJ ME
÷ =
c/kg DM(from B) MJ ME/kg DM c/MJ ME
DCost per kilogram crude protein (or NDF)
÷ = X 100
From B
(c/kg DM)
CP %
(or NDF %)
c/kg CP
(or c/kg NDF)
†To convert dollars per kilogram to cents per kilogram.
231

7/22/2019 Feeding Dairy Cows Manual
http://slidepdf.com/reader/full/feeding-dairy-cows-manual 249/264

7/22/2019 Feeding Dairy Cows Manual
http://slidepdf.com/reader/full/feeding-dairy-cows-manual 250/264
Worksheet 3: The cost of nutrients in feeds Feed 1:
ACost per kg DM
÷ 100 = X
kg bought (i) DM % kg DM
bought
B
÷ = † X 100
Cost of (i) ($) kg DM
bought (from
A)
c/kg DM
CCost per MJ ME
÷ =
c/kg DM
(from B)
MJ ME
/kg DM
c/MJ ME
DCost per kilogram crude protein (or NDF)
÷ x 100 =
c/kg DM
(from B)
CP %
(or NDF %)
c/kg CP
(or c/kg NDF)
Feed 2:
ACost per kg DM
÷ 100 =X
kg bought (i) DM % kg DM
bought
B
÷ =† X 100
Cost of (i) ($) kg DM
bought
(from A)
c/kg DM
CCost per MJ ME
÷ =
c/kg DM(from B) MJ ME/kg DM c/MJ ME
DCost per kilogram crude protein (or NDF)
÷ = X 100
From B
(c/kg DM)
CP %
(or NDF %)
c/kg CP
(or c/kg NDF)
†To convert dollars per kilogram to cents per kilogram.
233

7/22/2019 Feeding Dairy Cows Manual
http://slidepdf.com/reader/full/feeding-dairy-cows-manual 251/264
Glossary and Abbreviations
Glossary and Abbreviations
Terms in this glossary are defined in the context of theiruse in this manual.
% CP the proportion of the dry matter ina feed that is crude protein.
% digestibility the proportion of the dry matter ina feed that will provide digestibleenergy. Also PER CENT digestible
DM.
% DM the proportion of dry matter in afeed.
% moisture the proportion of water in a feed.
% NDF the proportion of the dry matter ina feed that is neutral detergentfibre.
% RDP the proportion of a feed’s crudeprotein that is rumen degradablerather than undegradable.
/ per.
oC degrees Celsius.
A
acetate a product of rumen digestion,produced in the main by cellulose-digesting bacteria; important in theproduction of milk fat. Also aceticacid.
acetic acid See acetate.
acid detergent fibre the less digestible or indigestibleparts of the fibre; ie., the celluloseand lignin only.
acidosis an excessive increase in rumenacid caused by feeding too muchgrain or other starchy feeds or byintroducing them into the diet tooquickly.
ADF acid detergent fibre.
amino acid the building block of proteins; acow requires 25 different amino

7/22/2019 Feeding Dairy Cows Manual
http://slidepdf.com/reader/full/feeding-dairy-cows-manual 252/264
Glossary and Abbreviations
acids for normal metabolicfunctioning.
as-fed feed with its moisture still in it. See also dry matter.
B
bites/min bites per minute.
body condition energy stored by cows as fat.
buffer body fluid (e.g., saliva) or feedadditive that reduces the acidity inthe rumen.
butyrate a product of rumen digestion oflesser importance in milkproduction than acetate and
propionate.butyric acid See butyrate.
bypass protein See undegradable dietary protein.
C
c cent(s).
c/g CP cent(s) per gram of crude protein.
c/g NDF cent(s) per gram of neutraldetergent fibre.
c/kg DM cent(s) per kilogram of dry matter.
c/MJ ME cent(s) per megajoule ofmetabolisable energy.
Ca calcium.
carbohydrates the main source of energy in acow’s diet.
carnivore meat eater.
casein milk protein.
cellulose-digesting bacteria type of rumen microbe that can beeliminated or severely slowed ingrowth rate by high-fat diets orhigh acidity in the rumen.
Cl chloride.
cm centimetre.
Co cobalt.
conception rate the proportion of the total numberof services or inseminations that
result in pregnancy.

7/22/2019 Feeding Dairy Cows Manual
http://slidepdf.com/reader/full/feeding-dairy-cows-manual 253/264
Glossary and Abbreviations
condition See body condition or conditionscore.
condition score objective visual assessment of acow’s body condition on a scale of1 (emaciated) to 8 (obese).
CP crude protein.
crude fibre a measure of fibre in the diet nowconsidered unacceptable as it doesnot always take into account all ofthe constituents that make up thefibre component of a feed; itmeasures only the alkali-solublelignin and the cellulose.
crude protein a rough measure of all the proteinin the diet (NPN + RDP + UDP); it
assumes (incorrectly) that all thenitrogen in a feed comes fromprotein.
Cu copper.
D
d day.
DDM digestible dry matter.
DE digestible energy.
digestibility the proportion of the dry matter ina feed that gets digested; it is thedifference between what is eatenand what comes out as manure.
digestible energy energy that is actually absorbed bythe cow. See also metabolisableenergy.
DM dry matter.
DM/ha dry matter per hectare.
DM/ha/d dry matter per hectare per day.DNRE Department of Natural Resources
and Environment.
dry matter the proportion of any feedremaining after all the water hasbeen taken out.
E
energy the part of a feed that is used as‘fuel’ in carrying out the cow’s
bodily functions.

7/22/2019 Feeding Dairy Cows Manual
http://slidepdf.com/reader/full/feeding-dairy-cows-manual 254/264
Glossary and Abbreviations
energy-dense having a large amount ofmetabolisable energy per kilogramof dry matter.
enzyme a substance produced by the cowthat helps digestion.
eructation the belching of gases produced inthe rumen during carbohydratefermentation.
essential amino acid any of the 10 amino acids that thecow cannot make herself andtherefore must be supplied fromthe diet or from the products ofdigestion.
F
Fe iron.
fibre the cell wall, or structural material,in a plant made up of (amongother things) cellulose,hemicellulose, and lignin.
G
g gram(s).
g/d gram(s) per day.
g/kg gram(s) per kilogram.
g/kg DM gram(s) per kilogram of drymatter.
g/kg LWG/d gram(s) per kilogram of liveweightgain per day.
g/kg LWt gram(s) per kilogram ofliveweight.
g/L gram(s) per litre.
H ha hectare(s).
ha/d hectare(s) per day.
hemicellulose the most digestible part of fibre;included in NDF analyses but notin ADF or CF analyses.
herbivore plant eater.
hormone a chemical produced by the cowthat regulates body functions.

7/22/2019 Feeding Dairy Cows Manual
http://slidepdf.com/reader/full/feeding-dairy-cows-manual 255/264
Glossary and Abbreviations
I
I iodine.
international units the unit of measure used for
vitamins.IU international unit(s).
J
joule a unit of energy; one calorie equalsa bit more than 4,000 joules.
K
K potassium.
kg kilogram(s).kg/bite kilogram(s) per bite.
kg DM kilogram(s) of dry matter.
kg DM/ha kilogram(s) of dry matter perhectare.
kg DM/ha/d kilogram(s) of dry matter perhectare per day.
km kilometre(s).
L
L litre(s).
L/d litre(s) per day.
lignin an indigestible part of plant fibre.
liveweight weight of live cow, measured inkilograms.
LWG liveweight gain.
LWt liveweight.
M
maintenance requirement the energy needed for essentialbody functions, such as bloodcirculation, breathing, keepingwarm or cool, digestion, and tissuerepair.
mastication chewing.
MD See MJ ME/kg DM.
ME metabolisable energy.megajoule millions of joules.

7/22/2019 Feeding Dairy Cows Manual
http://slidepdf.com/reader/full/feeding-dairy-cows-manual 256/264
Glossary and Abbreviations
metabolic activities for an adult cow, maintenance,milk production, activity,pregnancy, and weight gain; for animmature cow, also growth.
metabolisable energy the amount of energy provided by
a feed after deducting energy lostto faeces, urine, heat, and gasproduction; it is the energyavailable to be used by the cow forher metabolic activities. See also digestible energy.
metabolism a general term for all chemicalactivities of living organisms; itincludes respiration, fermentation,and repair of body tissues. See also metabolic activities.
Mg magnesium.
mg milligram(s).
mg/kg milligram(s) per kilogram.
mg/kg DM milligram(s) per kilogram of drymatter.
mins/day minutes per day.
MJ megajoule(s).
MJ ME/kg DM megajoules of metabolisable
energy per kilogram of dry matter.
mm millimetre.
Mn manganese.
Mo molybdenum.
N
N nitrogen.
Na sodium.
NDF neutral detergent fibre.
neutral detergent fibre a measure of all the fibre(hemicellulose, lignin, andcellulose) in a feed; it indicateshow bulky the feed is.
NH3 ammonia.
non-protein nitrogen not actually protein but simplenitrogen; however, microbes canmake protein from simple nitrogenif enough energy (carbohydrates)
is available in the rumen at thesame time.

7/22/2019 Feeding Dairy Cows Manual
http://slidepdf.com/reader/full/feeding-dairy-cows-manual 257/264
Glossary and Abbreviations
NPN non-protein nitrogen.
O
oxalate a chemical found in plants of theOxalis genus (e.g., soursob or
wood sorrel).
P
P phosphorus.
partitioning the metabolic division of energyintake (above the maintenancerequirement) between liveweightgain and milk production.
per in each or for each.
per cent in or for each one hundred; forexample, 5 per cent means 5 in (orfor) each 100: if the interest rate ona loan is 5 per cent a year, you pay$5 a year for each $100 not yetrepaid, or if the dry matter perkilogram is 5 per cent, then 50grams in each kilogram (1,000grams) is dry matter.
percentage the rate or proportion per hundred.
pH a measure of acidity or alkalinity
on a scale from 1 (extremely acid)to 14 (extremely alkaline).
ppm parts per million; equivalent tomilligrams per kilogram.
propionate a product of rumen digestion,produced in the main by starch-digesting and glucose-digestingbacteria; important in milk volumeand milk protein production. Also propionic acid.
propionic acid See propionate.
protein the material that makes up most ofthe cows body (muscles, skin,organs, blood); it also is part ofmilk.
Q
quality in relationship to feeds, anindication of the level of energyand digestibility.

7/22/2019 Feeding Dairy Cows Manual
http://slidepdf.com/reader/full/feeding-dairy-cows-manual 258/264
Glossary and Abbreviations
R
RDP rumen degradable protein.
rumen degradable protein the portion of protein in the dietthat is digested and used by the
microbes in the rumen to buildthemselves, if enough energy(carbohydrates) is available at thesame time.
rumen modifier a product that changes the rumenconditions and/or microbes andthereby changes the fermentationprocess and the products offermentation.
rumen undegradable protein See undegradable dietary protein.
rumination regurgitation and chewing of thecud.
S
S sulphur.
Se selenium.
soluble carbohydrates include the sugars and simplecarbohydrates, which are quicklydissolved and digested in therumen, produce mainly
propionate, are non-fibrous, andare found within the plant cell.
storage carbohydrates include starch, are quicklydissolved and digested in therumen, produce mainly acetate, arenon-fibrous, and are found withinthe plant cell.
structural carbohydrates include lignin, hemicellulose, andcellulose; are dissolved anddigested slowly (if at all) in therumen; are fibrous; and are found
in the cell wall.
submission rate the proportion of the herdinseminated at least once in agiven period of time (e.g. the first10, 21, 24 or 30 days of mating).
substitution the extent to which a supplementreplaces pasture in the diet.
supplement a feed or product added to thecow’s diet to increase or decreasesome dietary component, such as
energy, protein, fibre, vitamins, orminerals.
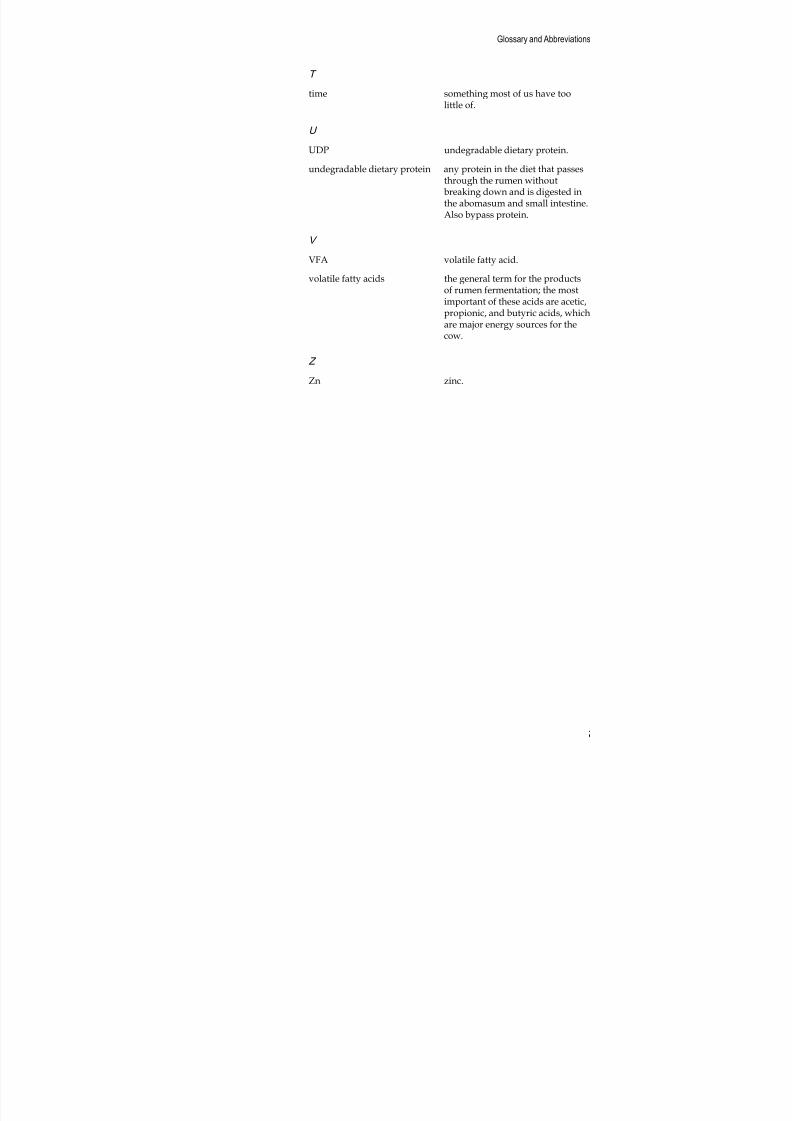
7/22/2019 Feeding Dairy Cows Manual
http://slidepdf.com/reader/full/feeding-dairy-cows-manual 259/264
Glossary and Abbreviations
T
time something most of us have toolittle of.
U
UDP undegradable dietary protein.
undegradable dietary protein any protein in the diet that passesthrough the rumen withoutbreaking down and is digested inthe abomasum and small intestine.Also bypass protein.
V
VFA volatile fatty acid.
volatile fatty acids the general term for the productsof rumen fermentation; the mostimportant of these acids are acetic,propionic, and butyric acids, whichare major energy sources for thecow.
Z
Zn zinc.

7/22/2019 Feeding Dairy Cows Manual
http://slidepdf.com/reader/full/feeding-dairy-cows-manual 260/264
Glossary and Abbreviations

7/22/2019 Feeding Dairy Cows Manual
http://slidepdf.com/reader/full/feeding-dairy-cows-manual 261/264
References and Suggested Further Reading
References and Suggested Further Reading
Agricultural Research Council 1984. The nutrientrequirements of ruminant livestock. SupplementNo 1. Commonwealth Agricultural Bureaux.
Bath, D.L., Dickinson, F.N., Tucker, H.A. and Appleman,R.D. 1978. Dairy cattle: Principles, Practices, Problems,Profits. Lea and Febiger, Philadelphia.
Broster, W.H. and Swan, H. 1979. Feeding Strategy for theHigh Yielding Dairy Cow. Granada Publishing,
Sydney.
Dalley, D.E., Roche, J.R., Moate, P.J. and Grainger, C. 1997.Effect of energy and protein supplementation on milk
production and pasture intake of high producing dairycows offered high levels of supplement in early lactation. DRDC Milestone Report 4, February 1997.
Dalley, D.E., Roche, J.R., Moate, P.J. Grainger, C. andDurling, P. 1996. Effect of protein supplementation onmilk production and pasture intake of dairy cows offeredhigh levels of supplement in early lactation. DRDCMilestone Report 2, June 1996.
Drysdale, G. 1990. Digestibility of the diet. In Dairyconference proceedings. Series No. 35. Department ofAgriculture, Victoria.
Ferguson, J.D. 1991. Nutrition and reproduction in dairycows. Vet Clinics of North America: Food AnimalPractice. 7: 483–507
Freeman, M. 1993. Your Heifers in the Balance. DPIF,Tasmania.
Grainger, C., and McGowan, A. A. 1982. The significanceof pre-calving nutrition on the dairy cow. In: DairyProduction from Pasture. New Zealand Society ofAnimal Production.
Grainger, C. And Mathews, G.L. 1989. Positive relationbetween substitution rate and pasture allowance for
cows receiving concentrates. Aust. J. Exp. Agric. Anim.Husb. 29: 355–360.
187

7/22/2019 Feeding Dairy Cows Manual
http://slidepdf.com/reader/full/feeding-dairy-cows-manual 262/264
References and Suggested Further Reading
Grainger, C., Wilhelms, G.D. and McGowan, A.A. 1982.Effect of body condition at calving and level offeeding in early lactation on milk production of dairycows. Aust. J. Exp. Agric. Anim. Husb. 22: 9–17.
Hodgson, J. 1990. Grazing Management: Science into Practice. Longman Scientific and Technical.
Holmes, C.W., and Wilson, G.F. 1984. Milk Production fromPasture. Butterworths, New Zealand.
Kellaway, R., and Porter, S. 1993. Feeding concentrates:supplements for dairy cows. Dairy Research andDevelopment Corporation.
Jacobs, J.L., Rigby, S., McKenzie, F.R ., Ward, G.N. andKearney, G. 1998. Effect of lock up dates on dairypasture dry matter yield and quality for silage insouth western Victoria. Australian Journal of Experimental Agriculture. (in press).
Lean, I. 1987. Nutrition of Dairy Cattle. University ofSydney.
Linn, J.G. and Martin, N.P. 1989. Forage quality tests and
interpretation. University of Minnesota, USA.
MAFF. 1984. Energy allowances and feeding systems for ruminants. Ministry of Agriculture, Fisheries andFood, HMSO, London, England.
McMillan, K.L. and Clayton, D.G. 1980. Factors influencingthe interval to post-partum oestrus, conception dateand empty rate in an intensively managed dairyherd. Proc. NZ Soc. Anim. Prod. 40: 236–239.
Mason, W. 1993. White clover: a key to increasing milk yields.Dairy Research and Development Corporation.
Moran, J. B. 1993. Calf rearing: A Guide to Rearing Calves in Australia. Agmedia, Melbourne.
Moran, J. B. 1994. Forage Conservation: A Guide to Hay andSilage Production in Victoria. Agmedia, Melbourne.
Moran, J.B. 1996. Milk rearing calves using early weaning
systems. Agnote #Ag0508, Agriculture Victoria.
188
7/22/2019 Feeding Dairy Cows Manual
http://slidepdf.com/reader/full/feeding-dairy-cows-manual 263/264
References and Suggested Further Reading
Moate, P.J., Dalley, D.E., Roche, J.R. and Grainger, C. 1997.Fodder turnips and supplements for dairy cows grazingdryland summer pasture. Final Report to the DRDCDav 344, September 1997.
National Research Council. 1989. Nutrient requirements of dairy cattle. 6th edn. National Academic Press,Washington, DC, USA.
Ørskov, E. R. 1987. The Feeding of Ruminants: Principles andPractice. Chalcombe Publications, Marlow,Buckinghamshire, UK.
Standing Committee on Agriculture. 1990. FeedingStandards for Australian Livestock. CommonwealthScientific and Industrial Research Organization,Melbourne.
Staples, C.R., Thatcher, W.W., Garcia-Bojalil, C.M. andLucy, M.C. 1992. Nutritional influences onreproductive function. In Large dairy herd management.Eds. H. H. van Horn and C. J. Wilcox. AmericanDairy Science Association.
Stockdale, C.R. 1991. Feeding supplements for dairy cows.In Dairying and Feed Supplements: How do they Fit
Together? Ed. Glen Donahue. Department ofAgriculture, Victoria.
Stockdale, C. R. 1993. Assessing the role of legume pasturesand maize silage on irrigated dairy farms. Final report toDairy Research and Development Corporation.
189

7/22/2019 Feeding Dairy Cows Manual
http://slidepdf.com/reader/full/feeding-dairy-cows-manual 264/264
References and Suggested Further Reading