federated states of micronesia social …. actuarial certification ... savannah, mo 64485 (816)...
TRANSCRIPT

PREPARED BY:
Nichols Actuarial Consulting, LLC
406 Court St.
Savannah, MO 64485
(816) 324-0199
FEDERATED STATES OF MICRONESIA
SOCIAL SECURITY ADMINISTRATION
ACTUARIAL VALUATION
AS OF JANUARY 1, 2014

Table of Contents
Page
I. Foreword .............................................................................................................................1
II. Actuarial Valuation Results
A. Introduction .................................................................................................................2
B. Actuarial Certification ................................................................................................3
C. Summary of Valuation Results ...................................................................................4
D. Unfunded Accrued Liability, Funded Ratio, and Deficiency .....................................5
E. Discussion of the Unfunded Accrued Liability ..........................................................7
F. Comments and Suggestions to Manage the Unfunded Accrued Liability ..................8
III. Trust Assets
A. Statement of Net Assets ............................................................................................10
B. Statement of Changes in Net Assets .........................................................................11
C. Trust Asset History ...................................................................................................12
D. Trust Investment Experience History .......................................................................12
IV. Actuarial Assumptions and Summary of Key Features
A. Actuarial Assumptions .............................................................................................13
B. Summary of Key Features .......................................................................................16
V. Age, Service, Benefit and Compensation Data
A. Summary of Characteristics of Workers and Beneficiaries ......................................19
B. Age and Service Summary ........................................................................................20
C. Accrued Benefit Detail .............................................................................................23
VI. Explanation of the Unfunded Accrued Liability ...........................................................24
VII. Projection of Funded Status ............................................................................................26

Actuarial Valuation
January 2014
1
Section I
Foreword
This report contains the results of the 13th actuarial valuation of the Federated States of Micronesia
Security Administration. The valuation was conducted as of January 1, 2014.
Section 707 of Title 53 stipulates that the Board shall employ an actuary to make actuarial valuations
of the Social Security System not less frequently than every three years.
The purpose of this actuarial valuation is to:
Compare the accrued liability to the market value of Trust assets in order to determine the
current funded status.
Provide a basis for determining the effect of any future proposed changes to the system.
Project assets and liabilities to judge the System’s sustainability.
In March 2009, Public Law 15-73 and in September 2009, Public Law 16-10 amended Title 53 of the
FSM Code. The changes created by these laws are included in the following valuation results.
Actuarial Valuation
January 2014
2
Section II
Actuarial Valuation Results
A. Introduction
This section contains the detailed results of the actuarial valuation. These results are classified
in subsections B through F as noted below:
B. Actuarial Certification
C. Summary of Valuation Results
D. Unfunded Accrued Liability, Funded Ratio, and Deficiency
E. Discussion of the Unfunded Accrued Liability
F. Comments and Suggestions to Manage the Unfunded Accrued Liability

Actuarial Valuation
January 2014
3
B. Actuarial Certification
This report presents the results of an actuarial valuation of the Federated States of Micronesia
Social Security Administration which was conducted as of January 1, 2014 and was performed
using worker data and asset information supplied by the Federated States of Micronesia Social
Security Administration. This data was not audited, but was checked for reasonableness and
consistency with prior the year’s data when possible. The valuation results presented are
dependent on the accuracy of the worker and asset information.
This valuation has been completed in accordance with generally accepted actuarial principles
and practices. The valuation has been prepared under the supervision of Joseph A. Nichols, an
Associate of the Society of Actuaries, an Enrolled Actuary under ERISA, a Member of the
American Society of Pension Professionals and Actuaries and a Member of the American
Academy of Actuaries.
Certified by:
___________________________________
Joseph A. Nichols, ASA, EA, MAAA, MSPA
Consulting Actuary
Nichols Actuarial Consulting, LLC
406 Court St.
Savannah, MO 64485
(816) 324-0199

Actuarial Valuation
January 2014
4
C. Summary of Valuation Results
The principal results of this valuation are the calculation of the accrued liability, the funded
ratio, and the deficiency.
The accrued liability represents the current value of benefits already earned, as of the valuation
date including benefits currently in pay status.
The funded ratio is an indication of how well-funded the Administration is at any point in time
with respect to benefits already earned. A funded ratio of 100% would indicate that the
Administration’s liability for benefits already earned was fully funded by current Trust assets.
A funded ratio of 25% would indicate that current Trust assets were only great enough to cover
25% of the benefits already earned. The greater the funded ratio, the better funded the
Administration is with respect to benefits already earned.
The deficiency is calculated as the accrued liability less the market value of Trust assets and
further reduced by the estimated value of future employee contributions in excess of those
needed to fund future benefits and system expenses.
As of January 1, 2014, the total accrued liability stood at $307,613,000 and the market value of
Trust assets was $49,134,000, resulting in an unfunded accrued liability of $258,479,000.
In addition, as of January 1, 2014, the estimated value of future employee contributions in
excess of those needed to fund future benefits and system expenses was $68,422,000. When
this is subtracted from the unfunded accrued liability, the deficiency is $190,057,000. The
deficiency represents the value of benefits already earned that are not covered by existing assets
and are not anticipated to be covered by expected future contributions.
The unfunded accrued liability is greatly affected by the level of Trust assets which, in return
is affected by the investment performance of the Trust. The Trust has realized just over 6% for
the past 20 years, but has realized asset gains the last few years at 9% and 17%. This creates a
5-year average of just over 9%.
When discussing the funded status of a retirement system, a common benchmark is the funded
ratio of the system which, as mentioned above, is calculated as the market value of Trust assets
divided by accrued liability. The funded ratio as of January 1, 2014 is 16%.

Actuarial Valuation
January 2014
5
D. Unfunded Accrued Liability, Funded Ratio, and Deficiency
The accrued liability represents the value of benefits already earned and which are in pay status
as well as benefits earned as of the valuation date by those who are still working and are
expected to earn future benefits. One can think of this as the amount needed today to pay for
all benefits earned as of today that are either already being paid or may be paid in the future.
This determination of the accrued liability does not include former workers who are no longer
making contributions, are not fully insured, and therefore are not entitled to a future benefit.
Should these workers re-enter the workforce in the future, their benefits will then be included
in the category of workers currently earning benefits.
Accrued Liability and Market Value of
Assets as of January 1,
Accrued Liability For: 2011 2014
Workers Earning Benefits $ 138,786,000 $ 128,270,000
Retirees, Spouses, Children, and
Disabled Workers Receiving Benefits 110,384,000
129,208,000
Fully Insured Inactive Workers
Entitled to a Future Benefit
38,601,000
50,135,000
Total Accrued Liability $ 287,771,000 $ 307,613,000
Market Value of Assets (42,361,000) (49,134,000)
Unfunded Accrued Liability $ 245,410,000 $ 258,479,000
Funded Ratio 15% 16%
The unfunded accrued liability is the excess of the accrued liability over the market value of
assets. The funded ratio indicates what percentage of the accrued liability is covered by the
market value of assets.
The accrued liability increased slower than expected from 2011 to 2013 due to two main
factors – a decrease in number of workers, lowering the active worker liability and the new
law that lowers the benefits for workers who retire before age 60. The liability for the inactive
workers increased at a level expected by the actuarial assumptions.

Actuarial Valuation
January 2014
6
The unfunded accrued liability can also be further reduced by considering the current value of
future employee and employer contributions that are in excess of that needed to pay for future
benefits earned and future expenses.
Currently we estimate that a combined employee and employer contribution rate of
approximately 8.2% would pay for future benefits earned by new workers who would enter the
Administration in the future and would cover future expenses. Since the current combined tax
rate is 15% of covered earnings, this excess can be used to reduce the unfunded accrued liability
as shown below. It is important to note that because the current contribution rate is sufficient
to cover future benefits, that the unfunded accrued liability and total deficiency shown below
do not exist because of current system provisions, but rather are the result of prior benefits
already earned.
Determination of the Total
Deficiency as of January 1,
2011 2014
Total Accrued Liability $ 287,771,000 $ 307,613,000
Market Value of Assets (42,361,000) (49,134,000)
Current Value of Excess Employee
Contributions from Active Workers
(58,083,000)
(68,422,000)
Total Deficiency* $ 187,327,000 $ 190,057,000 *The current value of excess employee contributions from active workers includes an allowance for future
system expenses.

Actuarial Valuation
January 2014
7
E. Discussion of the Unfunded Accrued Liability
The unfunded accrued liability is the excess of the accrued liability over the market value of
assets. The funded ratio indicates what percentage of the accrued liability is covered by the
market value of assets. The accrued liability is expected to increase from year to year as workers
earn additional benefits and get closer to retirement age and in fact the accrued liability shown
in this valuation is greater than that in the prior valuation.
When the market value of assets equals or exceeds the accrued liability, there is no unfunded
accrued liability and the retirement system is said to be fully funded. Although it is not critical
that the Administration be fully funded, it is important that there is a positive trend in increasing
the funded ratio from year-to-year. It is important to note that the funded ratio can decrease due
to poor performance by the Trust assets and also due to increasing benefits payable to both
current and future beneficiaries.
Past valuations have gone into great detail describing the danger of an ever increasing unfunded
accrued liability and this report agrees that this is a continuing and serious issue. If the
Administration were to cease operations with an unfunded accrued liability, there would not be
enough money in the Trust at that time to fully provide benefits already in pay status or promised
in the future. Therefore it is important that benefits are not increased until a long-term trend of
increasing the funded ratio and decreasing the unfunded accrued liability has been realized.

Actuarial Valuation
January 2014
8
F. Comments and Suggestions to Manage the Unfunded Accrued Liability
Benefit payments and administrative expenses exceeded the amount of contributions collected
during each fiscal year from 2005 and on. Since a larger portion of the contributions are for
past due collections, the difference between the current year collections and disbursement are
even greater. The trend of deficits shows no end. This puts the Administration in the position
of having to dip into the Trust in order to meet its financial commitments. As the amount of
benefit payments grows in the future, without further changes, it is quite possible that the Trust
will run out of money. In fact, based on current provisions and worker demographics, the Trust
will continue to diminish over the next 25 years. This projection is based on no growth in the
active workforce. The deficit will come even sooner should the workforce continue to decrease.
With a modest increase of 1% in active numbers, and a 3% average salary growth, the
projections show steady improvement.
The accrued liability is expected to increase from year to year and in fact the accrued liability
has increased since the prior valuation. Because the unfunded accrued liability is simply the
difference between the accrued liability and Trust assets, the size of the unfunded accrued
liability can be limited in three ways; increase the return on invested assets, increase revenue
through additional funding, and limit the growth of future benefit payments. We will only deal
with the last two of these issues here because the topic of investment return is much better
addressed with the Administration’s investment advisors. We will first discuss ways that the
Administration may increase revenue though additional funding and will then address ways to
limit future benefit growth.
Increasing Revenue
The most immediate source of additional revenue could come through an increase in the tax
rate levied on workers, self-employed workers, and employers. In the most recent change,
projected revenue was increased two ways: first by increasing the percentages, then by
increasing the maximum taxable wage base. Increasing the percentages again, this soon, may
be difficult. If the maximum taxable wage base is increased, then the benefit payable will
increase as well. To limit the benefit increase, an additional break point should be introduced
so that any cumulative taxable wages above $500,000 have smaller accrual percentage. In fact,
one option is to eliminate the taxable wage base maximum for contributions, but keep the
gradual increase in the taxable wage base for benefits as is. This would increase current annual
revenues by approximately $1,000,000. This by itself would not fix the current deficit, but on
an annual basis, would strengthen the System. Since most of the liability is based on benefits
in pay status, continually increasing current worker and employer contributions is quite
difficult.
Another source of additional funding is directly from the FSM Federal Government. Keeping
in mind that the more money there is in the Trust the larger the potential dollar amount of
investment return; the Federal Government currently makes investments in Social Security by
allocating $1 million each year. An increase to $2 million would speed up the funded
percentage and get the System to about 23% by the year 2033.

Actuarial Valuation
January 2014
9
Following are some other suggestions regarding the increase in revenues:
1. Include all the sole proprietor revenue in the calculation of taxes and benefits.
2. Include all employees working in the FSM on foreign fishing vessels.
3. Change the current law such that anyone working in the FSM, even if covered by another
social security system, pays into the FSM SSA.
The additional revenue created by the above suggestions will be valued once all the necessary
data is collected.
Limiting Benefit Growth
Since a significant amount of the existing liability is due to benefits already in pay status, any
proposals looking at lowering potential future liabilities must include more than just the current
workers. As mentioned on the previous page, one option to limit benefit growth is to apply a
smaller percentage to accumulated taxable wages above a certain level like $500,000. This is
important because it allows the System to receive higher revenue without being completely
offset with higher benefits.
Recent changes to the System have certainly increased the sustainability, but more changes need
to be implemented to slow the level of benefits payable.

Actuarial Valuation
January 2014
10
Section III
Trust Assets
A. Statement of Net Assets
Assets and Liabilities as of: 12/31/2013 12/3/2012 12/31/2011
ASSETS
Cash and cash equivalents $ 2,229,804 $ 2,440,547 $ 1,280,202
Investments at fair value:
Fixed Income 13,657,716 13,033,746 13,384,226
Stocks 30,078,635 24,172,986 21,836,645
Total Investments 43,736,351 37,206,732 35,220,871
Receivables:
Contributions 2,679,938 2,842,350 3,051,613
Due from FSM National Government 500,000 500,000 900,000
Accrued Interest 92,317 63,599 91,721
Other receivables 18,081 14,525 11,668
Total Receivables 3,290,336 3,420,474 4,055,002
Furniture, fixtures and equipment, net of
accumulated depreciation
107,152
102,841
109,787
Prepayments 3,600 3,600 4,780
Total Assets 49,367,243 43,174,194 40,670,642
LIABILITIES
Accounts payable and accrued expenses 233,703 334,658 261,273
Net assets – held in trust for pension benefits $ 49,133,540 42,839,536 40,409,369

Actuarial Valuation
January 2014
11
B. Statement of Changes in Plan Net Assets
C. Trust Asset History
Additions and Deductions for Fiscal Years Ended: 12/31/2013 12/31/2012 12/31/2011
Additions:
Contributions $ 17,244,974 $ 16,371,874 $ 16,593,155
Investment income:
Net appreciation (depreciation) in fair value
of investments
6,922,493
3,102,803
(2,181,438)
Interest and dividends 833,310 736,904 969,271
Investment Expenses (252,786) (169,274) (208,649)
Total net investment income 7,503,017 3,670,433 1,420,816
Other income
Contributions from FSM National Gov 1,000,000 1,000,000 1,200,000
Other 432,411 487,874 351,234
Total other income 1,432,411 1,487,874 1,551,234
Total additions 26,180,402 21,530,181 16,723,573
Deductions:
Benefit and refund payments:
Retirement 11,544,359 11,133,092 10,973,220
Survivors 5,325,547 5,210,145 5,033,492
Disability 1,523,375 1,456,825 1,395,552
Lump sum 261,724 182,031 217.981
Total benefits 18,655,005 17,982,093 17,620,245
Administrative expenses 1,201,371 1,083,370 1,067,434
Refunds 30,022 34,551 30,630
Total deductions 19,886,398 19,100,014 18,718,309
Net increase (decrease) 6,294,004 2,430,167 (1,994,736)
Plan assets held in trust for pension benefits
Beginning of year 42,839,536 40,409,369 42,404,105
End of year $ 49,133,540 $ 42,839,536 $ 40,409,369

Actuarial Valuation
January 2014
12
Fiscal
Year End
Beginning of
Year Market
Value of Assets
Prior Year
Adjustment Contributions
Trust Gain
or (Loss)
Other
Income
Benefit
Payments
Administrative
Expenses
3/31/1996 19,708,993 7,679,774 3,672,982 4,600 (6,140,340) (738,817)
3/31/1997 24,187,192 8,220,669 2,706,638 7,917 (6,562,802) (654,383)
3/31/1998 27,905,231 8,953,398 7,876,250 5,057 (7,736,924) (721,912)
3/31/1999 36,281,100 8,041,629 4,189,816 4,894 (8,222,560) (803,865)
3/31/2000 39,491,014 8,357,388 4,084,332 9,951 (8,996,669) (1,018,511)
12/31/2000 41,927,505 6,914,430 (1,527,557) 5,441 (6,893,415) (666,969)
12/31/2001 39,759,435 (16,237) 10,486,084 (4,305,329) 4,422 (9,582,168) (823,461)
12/31/2002 35,522,746 90,251 11,715,449 (3,001,899) 4,937 (9,990,634) (809,256)
12/31/2003 33,531,594 11,398,884 4,120,949 65,454 (10,865,848) (904,131)
12/31/2004 37,346,902 12,275,901 2,351,940 52,002 (11,321,238) (923,670)
12/31/2005 39,781,837 12,129,796 3,648,998 65,924 (12,029,049) (940,444)
12/31/2006 42,657,062 12,130,506 4,142,225 (12,586,560) (968,012)
12/31/2007 45,375,221 12,855,762 3,723,433 (13,663,880) (968,986)
12/31/2008 47,321,550 12,901,363 (8,274,474) (14,241,374) (989,810)
12/31/2009 36,717,255 14,145,653 6,149,139 (15,304,704) (961,778)
12/31/2010 40,745,566 16,069,490 2,981,702 (16,488,738) (946,950)
12/31/2011 42,631,070 (226,965) 16,593,155 (1,420,816) 1,551,234 (17,650,875) (1,067,434)
12/31/2012 40,409,369 16,371,874 3,670,433 1,487,874 (18,016,644) (1,083,370)
12/31/2013 42,839,536 17,244,974 7,503,017 1,432,411 (18,685,027) (1,201,371)
12/31/2014 49,133,540
Historical asset information up to and including fiscal year ended 12/31/01 was taken from prior actuarial valuations prepared by the prior
actuary.
D. Trust Investment Experience History
Fiscal Year End Return Fiscal Year End Return
3/31/1996 18.26% 12/31/2005 9.44% 3/31/1997 10.96% 12/31/2006 9.88% 3/31/1998 27.97% 12/31/2007 8.37% 3/31/1999 11.71% 12/31/2008 -17.90% 3/31/2000 10.56% 12/31/2009 17.20% 12/31/2000 -3.67% Return for 9 months 12/31/2010 7.40% 12/31/2001 -10.82% 12/31/2011 -3.36% 12/31/2002 -8.32% 12/31/2012 9.22% 12/31/2003 12.55% 12/31/2013 17.76% 12/31/2004 6.43%
Historical trust investment experience information up to and including the fiscal year that ended 12/31/01 was taken from prior actuarial valuations prepared by the prior actuary.
Average Annual Return
5 Year Average 9.36%
19 ¾ Year Average 6.19%

Actuarial Valuation
January 2014
13
Section IV
Actuarial Assumptions and Summary of Key Features
A. Actuarial Assumptions
Actuarial Cost
Method: Individual Entry Age Method, Level Percent of Pay
Investment Income: 7.5% per year
Expenses: 0.75% of Covered Wages
Salary Increase: Salaries are assumed to increase 4.5% per year into the future
Mortality: 1984 Unisex Pension Mortality Table. For participants not yet in receipt
of a benefit, males are considered to be four years older and females one
year older than actual age. For beneficiaries in receipt of benefits, males
are considered to be four years older than they actually are and females
are considered to be one year older than they actually are.
Disabled
Mortality: Healthy mortality plus five years.
Retirement Age: Age 65 if eligible, otherwise when eligible but not later than age 70.
Active workers who are older than 60 are assumed to retire at the end of
the next fiscal year if they earned 4 quarters of coverage during the fiscal
year that just ended based on the following schedule:
Age Percent Retiring
60 20%
61 10
62 10
63 10
64 10
Pre-retirement
Spouse Benefit: 80% of the workers are assumed to be married, and males are assumed
to be 3 years older than their spouses.
Surviving male spouses are assumed to remarry 2 years after death of the
worker and surviving female spouses are assumed to remarry 6 years
after death of the worker.

Actuarial Valuation
January 2014
14
Representative percentages of those who receive a pre-retirement spouse
benefit who remarry are shown in the following table.
Age
Male Spouse Remarry within 2 years
Female Spouse Remarry within 6 years
Remarry
Does not
Remarry Remarry
Does not
Remarry
20 39.22% 60.78% 76.71% 23.29%
30 32.35% 67.65% 48.92% 51.08%
40 20.70% 79.30% 26.80% 73.20%
50 14.44% 85.56% 9.75% 90.25%
60 7.40% 92.60% 2.52% 97.48%
Surviving spouse benefits continue if the spouse is employed, but the
benefits are subject to the earnings test.
Pre-retirement
Children’s Benefit: Married workers are assumed to have 3 children, and each child is
assumed to be age 13 at the time of death of the worker.
Post Retirement
Survivor’s Benefit: 80% of active workers are assumed to be married when they retire.
Males are assumed to be 3 years older than their spouses. It is assumed
that 60% of female spouses and 5% of male spouses will receive a
survivor’s benefit. In addition, 40% of female spouses and 90% of male
spouses will also be entitled to a retirement benefit based on their own
earnings record, but the survivor’s benefit will be 15% greater than this
benefit.
Disability: Rates are from the 2003 US Social Security Trustees Report
Intermediate Assumptions.
Turnover: None for citizens of the Federated States of Micronesia.
5% of citizens of countries other than the Federated States of Micronesia
are assumed to leave each year, except that 80% are assumed to leave in
their third year of employment. It is assumed that 80% of workers who
are not citizens of the Federated States of Micronesia leave when they
become disabled or retire. It is also assumed that 80% of the surviving
spouses and children of deceased foreign citizens leave after the worker
dies. These surviving spouses and children are also assumed to not be
citizens of the Federated States of Micronesia.

Actuarial Valuation
January 2014
15
Earnings Applied
To the Earnings Test: Retirees: 80% of what the retiree was earning prior to retirement.
Surviving Spouses of Active Workers: 75% of what the worker was
earning prior to death.
Surviving Spouses of Inactive Workers: Quarterly earnings of twice the
quarterly benefit plus $300.
Children: None
Disabled: None
Workers included
In the Valuation: Workers who have covered quarters in at least one of the last two years,
are not currently indicated in the data files supplied by the
Administration as deceased, disabled, retired, having received a lump
sum or closed with no future benefits payable, and who are age 21 or
older are assumed to continue working and earn 4 quarters of coverage
until they become disabled, die, or retire. Workers who have not earned
any quarters of coverage during the last two years are assumed to stay
out of the work force. Salary used as a basis to project future salaries is
the greatest of the salaries earned during the last two years. If this salary
is based on less than four quarters of coverage, it is converted to an
annual salary.

Actuarial Valuation
January 2014
16
B. Summary of Key Features
Applicable Laws:
Public Law 2-74, as amended by Public Laws 5-120, 6-111, 7-118, 7-119,7-120, 9-56, 12-51,
12-76, 14-37, 15-73 and 16-10.
Workers and Employer’s Contributions:
Workers, self-employed workers and employers each pay 6% of Maximum Covered Earnings
per quarter. Effective October 1, 2009, contributions increase to 7% each and effective January
1, 2013, the rate increases to 7.5%.
Self-employed with employees - remuneration shall be deemed to be twice the amount paid to
the highest paid employee reported by the self-employed person in the quarter, up to maximum
covered earnings.
Self-employed with no employees - Remuneration is deemed to be 5% of the gross revenue of
the business for the previous calendar year subject to maximum covered earnings.
Coverage:
All employees employed by an employer incorporated or doing business in the Federated States
of Micronesia are covered unless both the employer and employee are currently subject to
another recognized social security system.
Eligibility for and Computation of Benefits is based on the following definitions:
Quarters of Coverage: A calendar quarter in which contributions were made for at least
$300 of earnings.
Currently Insured: Credited with at least 20 quarters of coverage during the most recent
previous 25 calendar quarters.
Fully Insured: Credited with at least one quarter of coverage for each year since the
later of attainment of age 21 or June 30, 1968, and having not less than 12 quarters of
coverage. If age 60 on or before December 31, 2006, no more than 38 quarters are
required. No more than 50 quarters for everyone else.
Maximum Covered Earnings: Effective January 1, 2008, the $5,000 quarterly limit
increases to $6,000; $7,000 on January 1, 2013; $8,000 on January 1, 2018; $9,000 on
January 1, 2023 and $10,000 on October 1, 2028.
Minimum Benefit: $75 per month. $100 per month effective January 1, 2012.

Actuarial Valuation
January 2014
17
Basic Benefit
A worker’s Basic Benefit is calculated as 1/12 of:
1. 16.5% of the first $10,000 of Cumulative Maximum Covered Earnings for which
contributions have been made, plus
2. 3.0% of the next $30,000 of Cumulative Maximum Covered Earnings for which
contributions have been made, plus
3. 2.0% of the next $262,500 of Cumulative Maximum Covered Earnings for which
contributions have been made, plus
4. 1.0% of Cumulative Maximum Covered Earnings in excess of $302,500 for which
contributions have been made.
Old Age Insurance Benefit
Eligibility: Age 60 and Fully Insured
Amount: Greater of the Basic Benefit or the Minimum Benefit, subject to the earnings
test. Active workers who turn 60 after January 1, 2011 will receive 50% of the
Basic Benefit from ages 60 to 64. The reduced benefit will not be subject to the
earnings test.
Disability Insurance Benefit
Eligibility: Disabled for three months and Currently and Fully Insured at time of disability
Amount: Unreduced Basic Benefit earned at time of disability. Sum of disability benefit
and workers compensation benefit may not exceed 80% of the highest covered
compensation earned in the year of disability and the prior five years. The
benefit ceases should the worker recover from the disability.
Surviving Spouse Benefit
Eligibility: Worker must have been Fully Insured at time of death.
Amount: 60% of the Basic Benefit earned at the time of death, subject to the earnings test.
Paid until the earlier of the date the spouse remarries or dies. This benefit is
reduced by any Old Age Insurance Benefit that the spouse may be entitled to
based on his or her own earnings history.
Surviving Child Benefit
Eligibility: Worker must have been Fully at time of death.

Actuarial Valuation
January 2014
18
Amount: 15% of the Basic Benefit for each dependent child under the age of 18 or 22 if a
student. The benefit ceases if the child marries or is adopted by a close relative.
The sum of all survivors’ benefits cannot exceed 100% of the Basic Benefit earned at the time
of death.
Payment to Foreign Citizens residing outside the FSM
Payments to citizens and nationals of the Republic of Palau, the Republic of the Marshall Islands
and the United States shall be made as if they were citizens or nationals of the Federated States
of Micronesia as long as those nations give citizens and nationals of the Federated States of
Micronesia reciprocal treatment. For citizens and nationals of other countries who are fully
insured, a lump sum payment equal to total worker paid contributions as of the date the worker
turned age 60, became disabled, or died. The lump sum payment is reduced by any payments
already made to the employee, surviving spouse or child before the lump sum is paid.
Lump Sum Death Benefit
Eligibility: After the death of any covered worker and rights to all survivors benefits have
ceased.
Amount: Four percent of total Maximum Covered Earnings for which contributions have
been paid, less the value of any benefits already paid.
Lump Sum Benefit (other than death)
Eligibility: Age 60 and not Fully Insured, native born citizen of the Federated States of
Micronesia or resident for at least 10 years and must have lived in the Federated
States of Micronesia for at least one year immediately preceding death.
Amount: Four percent of total Maximum Covered Earnings for which contributions have
been paid.
Earnings Test
Benefits are reduced by $1 for every $2 of earnings in excess of $300 received each quarter.

Actuarial Valuation
January 2014
19
Section V
Age, Service, Benefit and Compensation Data
A. Summary of Characteristics of Workers and Beneficiaries Included in the January 1, 2014
Valuation
Active Workers – Average Age, Average Completed Years of Service, and Average Valuation
Compensation
Worker
Number of
Workers Average Age
Average
Completed Years
of Service
Average Valuation
Compensation
Men 10,664 40.2 10.0 $ 7,053
Women 6,607 37.4 9.2 $ 6,215
Total 17,271 39.1 9.7 $ 6,733
The average annual accrued basic benefit is as of January 1, 2014 and is based on total
remuneration for which contributions have been made through December 31, 2013.
Status Number Average Age
Average Annual
Accrued Basic
Benefit
Active 17,271 39.1 $ 2,549
Inactive and Fully Insured 2,328 55.2 $ 3,502
Retired 2,812 68.9 $ 3,892
Disabled 392 56.7 $ 3,667
Spouse 1,936 66.7 $ 2,080
Child 1,070 14.2 $ 587
Active Status- Not in pay status and currently earning additional benefits
Inactive and Fully Insured Status - Not in pay status, not currently earning additional benefits, and entitled to a benefit in the future. The
number of inactive and fully insured has decreased due to the change in fully insured definition. The participants in this group needs to be further determined.

20
B. Age and Service Summary
Distribution by Attained Age and Covered Services – Males
Nearest
Age Under 5 5-9 10-14 15-19 20-24 25-29 30 & More Total
108 5 0 0 0 0 0 113
$996.84 $5,535.81 $0.00 $0.00 $0.00 $0.00 $0.00 $1,197.68
781 12 1 0 0 0 0 794
$1,899.85 $4,385.58 $3,941.90 $0.00 $0.00 $0.00 $0.00 $1,939.99
1,148 217 12 1 0 0 0 1,378
$3,448.75 $6,848.43 $9,135.64 $4,957.75 $0.00 $0.00 $0.00 $4,034.73
801 499 171 10 0 0 0 1,481
$3,474.85 $6,368.63 $8,158.24 $10,105.17 $0.00 $0.00 $0.00 $5,035.39
551 415 349 162 18 0 0 1,495
$3,840.27 $6,016.53 $8,606.26 $9,534.72 $11,251.92 $0.00 $0.00 $6,263.27
381 309 301 282 177 12 1 1,463
$4,825.48 $6,093.76 $7,461.18 $11,105.93 $13,637.93 $13,969.66 $13,103.68 $7,993.04
273 244 203 242 285 111 4 1,362
$5,231.21 $6,157.96 $7,616.51 $9,048.79 $11,740.80 $12,462.78 $11,421.84 $8,400.74
167 138 165 186 222 261 76 1,215
$5,673.00 $5,872.19 $5,855.86 $9,172.03 $9,814.37 $15,100.69 $15,120.17 $9,628.95
90 90 100 125 134 242 258 1,039
$7,764.54 $7,965.51 $5,872.96 $8,837.55 $10,518.08 $12,046.15 $15,143.72 $10,913.73
32 26 36 22 18 23 57 214
$13,584.36 $6,921.69 $8,857.58 $5,926.03 $11,910.11 $12,431.13 $18,045.02 $12,115.76
9 11 4 8 6 9 31 78
$11,793.80 $40,185.35 $2,900.17 $11,071.63 $18,837.02 $29,526.01 $27,936.90 $24,271.24
3 6 2 3 6 4 8 32
$3,891.73 $1,951.64 $7,428.75 $3,649.65 $30,564.68 $20,418.19 $23,497.10 $15,694.66
4,344 1,972 1,344 1,041 866 662 435 10,664
$3,663.74 $6,484.64 $7,591.54 $9,618.54 $11,618.45 $13,656.76 $16,546.19 $7,053.53
40-44
Under 20
20-24
25-29
30-34
35-39
Total
45-49
50-54
55-59
60-64
65-69
70 & Older
21
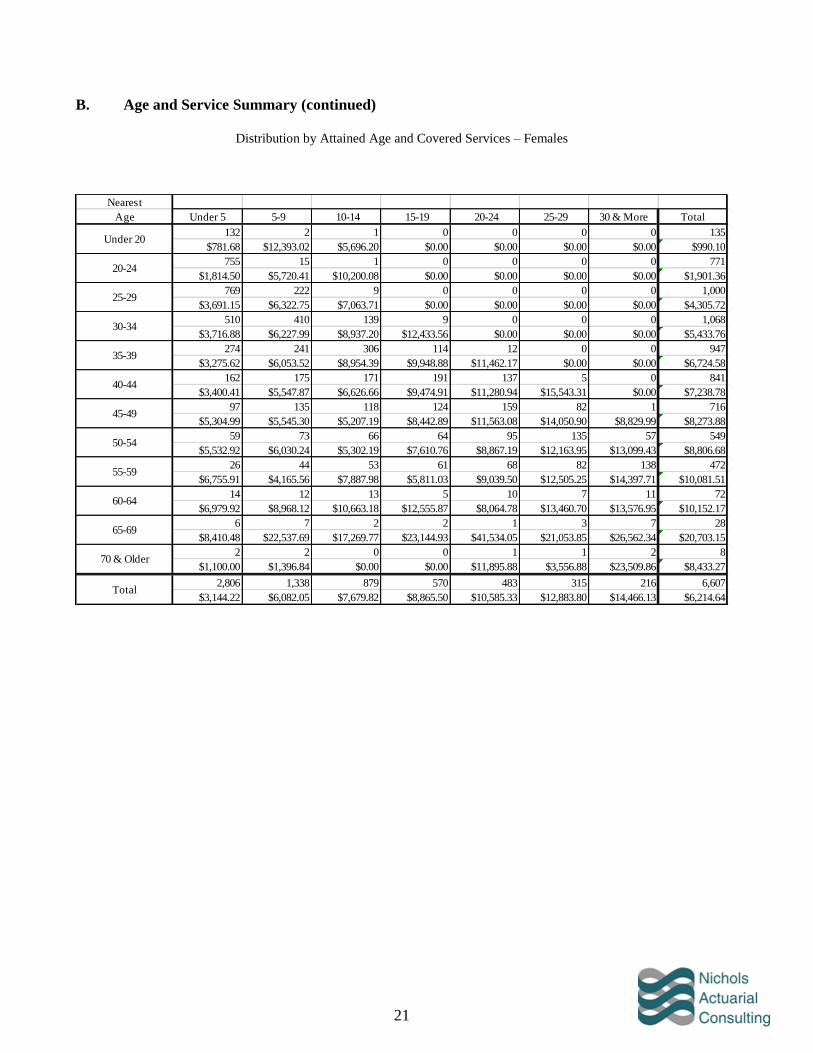
B. Age and Service Summary (continued)
Distribution by Attained Age and Covered Services – Females
Nearest
Age Under 5 5-9 10-14 15-19 20-24 25-29 30 & More Total
132 2 1 0 0 0 0 135
$781.68 $12,393.02 $5,696.20 $0.00 $0.00 $0.00 $0.00 $990.10
755 15 1 0 0 0 0 771
$1,814.50 $5,720.41 $10,200.08 $0.00 $0.00 $0.00 $0.00 $1,901.36
769 222 9 0 0 0 0 1,000
$3,691.15 $6,322.75 $7,063.71 $0.00 $0.00 $0.00 $0.00 $4,305.72
510 410 139 9 0 0 0 1,068
$3,716.88 $6,227.99 $8,937.20 $12,433.56 $0.00 $0.00 $0.00 $5,433.76
274 241 306 114 12 0 0 947
$3,275.62 $6,053.52 $8,954.39 $9,948.88 $11,462.17 $0.00 $0.00 $6,724.58
162 175 171 191 137 5 0 841
$3,400.41 $5,547.87 $6,626.66 $9,474.91 $11,280.94 $15,543.31 $0.00 $7,238.78
97 135 118 124 159 82 1 716
$5,304.99 $5,545.30 $5,207.19 $8,442.89 $11,563.08 $14,050.90 $8,829.99 $8,273.88
59 73 66 64 95 135 57 549
$5,532.92 $6,030.24 $5,302.19 $7,610.76 $8,867.19 $12,163.95 $13,099.43 $8,806.68
26 44 53 61 68 82 138 472
$6,755.91 $4,165.56 $7,887.98 $5,811.03 $9,039.50 $12,505.25 $14,397.71 $10,081.51
14 12 13 5 10 7 11 72
$6,979.92 $8,968.12 $10,663.18 $12,555.87 $8,064.78 $13,460.70 $13,576.95 $10,152.17
6 7 2 2 1 3 7 28
$8,410.48 $22,537.69 $17,269.77 $23,144.93 $41,534.05 $21,053.85 $26,562.34 $20,703.15
2 2 0 0 1 1 2 8
$1,100.00 $1,396.84 $0.00 $0.00 $11,895.88 $3,556.88 $23,509.86 $8,433.27
2,806 1,338 879 570 483 315 216 6,607
$3,144.22 $6,082.05 $7,679.82 $8,865.50 $10,585.33 $12,883.80 $14,466.13 $6,214.64
40-44
Under 20
20-24
25-29
30-34
35-39
Total
45-49
50-54
55-59
60-64
65-69
70 & Older

22
B. Age and Service Summary (continued)
Distribution by Attained Age and Covered Services – Everyone
Nearest
Age Under 5 5-9 10-14 15-19 20-24 25-29 30 & More Total
240 7 1 0 0 0 0 248
$878.50 $7,495.02 $5,696.20 $0.00 $0.00 $0.00 $0.00 $1,084.69
1,536 27 2 0 0 0 0 1,565
$1,857.90 $5,127.15 $7,070.99 $0.00 $0.00 $0.00 $0.00 $1,920.96
1,917 439 21 1 0 0 0 2,378
$3,545.99 $6,582.60 $8,247.67 $4,957.75 $0.00 $0.00 $0.00 $4,148.69
1,311 909 310 19 0 0 0 2,549
$3,569.00 $6,305.20 $8,507.52 $11,208.09 $0.00 $0.00 $0.00 $5,202.30
825 656 655 276 30 0 0 2,442
$3,652.74 $6,030.12 $8,768.90 $9,705.79 $11,336.02 $0.00 $0.00 $6,442.17
543 484 472 473 314 17 1 2,304
$4,400.32 $5,896.38 $7,158.85 $10,447.32 $12,609.56 $14,432.50 $13,103.68 $7,717.73
370 379 321 366 444 193 5 2,078
$5,250.55 $5,939.73 $6,730.84 $8,843.51 $11,677.16 $13,137.53 $10,903.47 $8,357.03
226 211 231 250 317 396 133 1,764
$5,636.43 $5,926.87 $5,697.67 $8,772.35 $9,530.51 $14,099.53 $14,254.14 $9,373.04
116 134 153 186 202 324 396 1,511
$7,538.47 $6,717.77 $6,570.97 $7,844.98 $10,020.34 $12,162.34 $14,883.75 $10,653.77
46 38 49 27 28 30 68 286
$11,574.31 $7,567.93 $9,336.61 $7,153.78 $10,536.77 $12,671.36 $17,322.24 $11,621.43
15 18 6 10 7 12 38 106
$10,440.47 $33,322.37 $7,690.04 $13,486.29 $22,079.46 $27,407.97 $27,683.69 $23,328.73
5 8 2 3 7 5 10 40
$2,775.04 $1,812.94 $7,428.75 $3,649.65 $27,897.70 $17,045.93 $23,499.65 $14,242.38
7,150 3,310 2,223 1,611 1,349 977 651 17,271
$3,459.86 $6,321.90 $7,626.44 $9,352.10 $11,248.55 $13,407.55 $15,856.03 $6,732.62
40-44
Under 20
20-24
25-29
30-34
35-39
Total
45-49
50-54
55-59
60-64
65-69
70 & Older

23
C. Accrued Benefit Detail
Average Accrued Benefit Distribution by Nearest Age, Sex and Status
ACTIVE EMPLOYEES
Nearest Men Women
Age Number Avg Acc Ben Number Avg Acc Ben
Under 20 113 $244.67 135 $198
20-24 794 $577.12 771 $543
25-29 1,378 $1,255.37 1,000 $1,385
30-34 1,481 $1,782.13 1,068 $1,926
35-39 1,495 $2,293.21 947 $2,525
40-44 1,463 $2,921.26 841 $3,027
45-49 1,362 $3,361.32 716 $3,539
50-54 1,215 $3,991.95 549 $4,103
55-59 1,039 $4,523.80 472 $4,516
60-64 214 $3,810.56 72 $3,800
65-69 78 $4,123.69 28 $3,662
70 & Older 32 $2,506.13 8 $1,359
Total 10,664 $2,616.57 6,607 $2,441

24
Section VI
Explanation of the Unfunded Accrued Liability
Although the accrued liability is often discussed, not very many people other than actuaries, really
understand the ins and outs of what it is. The accrued liability can be a fairly complicated concept
to explain.
However, one can think of the accrued liability as the current value of benefits already earned
including benefits that are already in pay status. The unfunded accrued liability is simply the
accrued liability less the market value of assets. Both of these numbers change depending on when
they are measured and the accrued liability changes depending on the actuarial assumptions and
method used to calculate it.
An active worker will earn the right to a future retirement benefit along with other future benefits
such as disability and survivor benefits. The dollar amount of each of these benefits depends on the
total amount of his earnings on which social security tax has been paid. When the valuation is
performed, the worker’s current pay is projected into the future (up to the wage base) until his
retirement age and then the dollar amount of the various benefits that he may become entitled to in
the future is calculated. As part of the valuation process a theoretical annual payment on behalf of
this worker is calculated, known as the “normal cost”. The normal cost is the theoretical annual
payment that, if made each year during the worker’s years of employment, would be sufficient to
fund all of his future potential benefits. It is important to note that the normal cost is calculated
separately for each worker and that it is not necessarily equal to the amount contributed each year
by the employee and his employer.
The accrued liability for someone who is still working is calculated as the current value of all
benefits that he might receive in the future, less the current value of his future normal costs (not the
employee and employer contributions actually collected). But more simply the accrued liability for
an active worker can be approximated as the current accumulated value of all of his past normal
costs (again, not employee and employer contributions actually collected).
For someone who is no longer working but is entitled to future benefits, the accrued liability is just
the current value of all benefits that he might receive in the future. For someone who is currently
receiving a benefit, the accrued liability is the current value of the benefits that are currently being
paid and will continue into the future.
Having said all of this, perhaps a very simple example will illustrate the concept of the accrued
liability for an active worker would be helpful.
Suppose you borrow $12,000 from a good friend who is not going to charge you any interest and
you promise to pay back all $12,000 at once in 5 years. You plan to put a little bit aside each month
and will keep the money in a box, not a bank and your savings will not earn any interest. (This
example has been simplified by not assuming any interest to be paid or earned but it works with
interest too.) Five years is 60 months, so if you put exactly $200 into the box each and every month
you will have accumulated exactly $12,000 in 5 years. Think of this $200 payment as the normal
cost as described above.

25
Now let’s say that you don’t put $200 in the box a few times. After 3 years you should have made
36 payments of $200 and there should be $7,200 in the box. This $7,200 represents the “accrued
liability” associated with your efforts to save money after 3 years. But when you count the money
in the box you find that there is only $6,800. The amount that is actually in the box represents the
“market value of assets” at that point in time. When we subtract the market value of assets from
the accrued liability, we arrive at the “unfunded accrued liability”, which in this example is $400
($7,200 - $6,800). In other words, you have $400 less than you would have if you had made each
$200 payment as was scheduled.
To follow the first definition of the accrued liability described above, we can calculate the current
value of the future benefits as the value today of what you must pay in the future. This is still
$12,000, what you must pay in two more years. The current value today of what you should deposit
in the future is 24 more payments of $200 each, or $4,800. We can now calculate the accrued
liability as the value of what you need to pay in the future, less the value today of the remaining 24
month payments of $200 each, which is $7,200 ($12,000 - $4,800). In this very simple example,
the accrued liability is the same either way it is calculated.
Now the $400 shortfall may not be a bad thing. Maybe you missed two payments because you had
other more pressing expenses and the next month you plan to put $600 in the box. If you do, your
accrued liability will be $7,400 (one more month will have gone by so it has increased by $200) but
the market value of assets will be $7,400 and the unfunded accrued liability has gone away.
Some would think it best if you made all of your payments exactly on time so that at any time there
was no unfunded accrued liability. However the most important thing to you is that at the end of 5
years there is exactly $12,000 in the box. A problem comes up if for some reason, there is not
enough money in the box to pay off the debt when it comes due. This is the danger of an unfunded
accrued liability that does not decrease over time, or even worse, one that increases over time. To
expand on our example, you could borrow more money each year (increasing the accrued liability
with each loan) until you have borrowed so much that you simply don’t earn enough money to put
sufficient funds in the box to ever pay it off. This would be like increasing and increasing benefits
in a retirement system without a clear-cut plan on how to pay for the increases.

26
Section VII
Projection of Funded Status
An actuarial valuation collects data, and using certain assumptions, determines a liability by
projecting life expectancy and salary information into the future. Using the same assumptions as
those used in the valuation, and with a few additional assumptions, a cash flow projection can show
the sustainability of the System.
Below is a projection of the Systems assets using the same assumptions as those in Section IV. The
following assumptions have also been utilized:
1) Annual increase in number of active workers: 0%
2) Annual increase in new worker’s average salary: 2%
3) Additional annual contribution from FSM: $2,000,000
Total Workers Accrued Funded
Year Number Payroll Liability Assets Status
2011 19,611 112,135,698 287,771,000 42,361,000 15%
2014 17,168 119,476,036 307,613,000 49,134,000 16%
2015 17,168 123,543,154 321,876,356 53,511,835 17%
2016 17,168 127,572,904 337,416,947 58,827,467 17%
2017 17,168 131,402,139 354,046,792 64,862,220 18%
2018 17,168 135,494,973 371,856,652 71,672,129 19%
2019 17,168 139,228,466 390,875,364 79,282,379 20%
2020 17,168 142,731,055 411,131,894 87,668,983 21%
2021 17,168 145,765,695 432,338,114 96,484,418 22%
2022 17,168 148,593,888 454,165,750 105,315,894 23%
2023 17,168 151,162,581 476,616,205 114,107,673 24%
2024 17,168 153,818,162 499,620,842 122,722,102 25%
2025 17,168 156,235,454 523,214,404 131,152,548 25%
2026 17,168 158,769,152 547,294,850 139,219,671 25%
2027 17,168 161,171,221 572,071,041 147,091,412 26%
2028 17,168 163,538,737 597,537,214 154,688,000 26%
2029 17,168 165,875,526 623,941,863 162,196,258 26%
2030 17,168 167,916,642 651,385,250 169,644,227 26%
2031 17,168 169,747,625 679,849,999 176,908,012 26%
2032 17,168 171,493,686 709,353,814 183,899,201 26%
2033 17,168 173,062,918 739,940,226 190,559,265 26%
With the additional contribution, the funded status continues to increase and will indefinitely.
Without the additional contribution, the projected funded status in 2033 is 15%.