federal national mortgage association fannie mae...september 6, 2008. as conservator, fhfa succeeded...
TRANSCRIPT
UNITED STATES SECURITIES AND EXCHANGE COMMISSIONWashington, D.C. 20549
Form 10-Q ☑ QUARTERLY REPORT PURSUANT TO SECTION 13 OR 15(d) OF THE SECURITIES
EXCHANGE ACT OF 1934For the quarterly period ended June 30, 2019
OR☐ TRANSITION REPORT PURSUANT TO SECTION 13 OR 15(d) OF THE SECURITIES
EXCHANGE ACT OF 1934For the transition period from to
Commission file number: 0-50231
Federal National Mortgage Association (Exact name of registrant as specified in its charter)
Fannie MaeFederally chartered corporation 52-0883107 1100 15th Street, NW 800 232-6643
Washington, DC 20005(State or other jurisdiction ofincorporation or organization)
(I.R.S. EmployerIdentification No.)
(Address of principal executiveoffices, including zip code)
(Registrant’s telephone number,including area code)
Securities registered pursuant to Section 12(b) of the Act:
Title of each class Trading Symbol(s) Name of each exchange on which registeredNone N/A N/A
Indicate by check mark whether the registrant (1) has filed all reports required to be filed by Section 13 or 15(d) of theSecurities Exchange Act of 1934 during the preceding 12 months (or for such shorter period that the registrant was requiredto file such reports), and (2) has been subject to such filing requirements for the past 90 days. Yes ☑ No ☐
Indicate by check mark whether the registrant has submitted electronically every Interactive Data File required to besubmitted pursuant to Rule 405 of Regulation S-T (§ 232.405 of this chapter) during the preceding 12 months (or for suchshorter period that the registrant was required to submit such files). Yes ☑ No ☐
Indicate by check mark whether the registrant is a large accelerated filer, an accelerated filer, a non-accelerated filer, asmaller reporting company, or an emerging growth company. See the definitions of “large accelerated filer,” “accelerated filer,”“smaller reporting company,” and “emerging growth company” in Rule 12b-2 of the Exchange Act.
Large accelerated filer ☑ Accelerated filer ☐Non-accelerated filer ☐ Smaller reporting company ☐
Emerging growth company ☐
If an emerging growth company, indicate by check mark if the registrant has elected not to use the extended transition periodfor complying with any new or revised financial accounting standards provided pursuant to Section 13(a) of the ExchangeAct. ☐
Indicate by check mark whether the registrant is a shell company (as defined in Rule 12b-2 of the Exchange Act). Yes☐ No ☑
As of June 30, 2019, there were 1,158,087,567 shares of common stock of the registrant outstanding.
TABLE OF CONTENTSPage
PART I—Financial Information 1Item 1. Financial Statements
Condensed Consolidated Balance Sheets 53Condensed Consolidated Statements of Operations and Comprehensive Income 54Condensed Consolidated Statements of Cash Flows 55Condensed Consolidated Statements of Changes in Equity 56
Note 1—Summary of Significant Accounting Policies 58Note 2—Consolidations and Transfers of Financial Assets 63Note 3—Mortgage Loans 65Note 4—Allowance for Loan Losses 72Note 5—Investments in Securities 74Note 6—Financial Guarantees 77Note 7—Short-Term and Long-Term Debt 78Note 8—Derivative Instruments 79Note 9—Segment Reporting 81Note 10—Concentrations of Credit Risk 84Note 11—Netting Arrangements 88Note 12—Fair Value 90Note 13—Commitments and Contingencies 103
Item 2. Management’s Discussion and Analysis of Financial Condition and Results of Operations 1Introduction 1Executive Summary 2Legislation and Regulation 5Single Security Initiative & Common Securitization Platform 7Key Market Economic Indicators 9Consolidated Results of Operations 12Consolidated Balance Sheet Analysis 18Retained Mortgage Portfolio 19Guaranty Book of Business 21Business Segments 22Single-Family Business 23Multifamily Business 38Liquidity and Capital Management 44Off-Balance Sheet Arrangements 47Risk Management 48Critical Accounting Policies and Estimates 50Impact of Future Adoption of New Accounting Guidance 50Forward-Looking Statements 50
Item 3. Quantitative and Qualitative Disclosures about Market Risk 105Item 4. Controls and Procedures 105PART II—Other Information 108Item 1. Legal Proceedings 108Item 1A. Risk Factors 109Item 2. Unregistered Sales of Equity Securities and Use of Proceeds 113Item 3. Defaults Upon Senior Securities 114Item 4. Mine Safety Disclosures 114Item 5. Other Information 114Item 6. Exhibits 115
Fannie Mae Second Quarter 2019 Form 10-Q ii
PART I—FINANCIAL INFORMATION
MD&A | Introduction
Fannie Mae Second Quarter 2019 Form 10-Q 1
Item 2. Management’s Discussion and Analysis of FinancialCondition and Results of Operations
We have been under conservatorship, with the Federal Housing Finance Agency (“FHFA”) acting as conservator, sinceSeptember 6, 2008. As conservator, FHFA succeeded to all rights, titles, powers and privileges of the company, and ofany shareholder, officer or director of the company with respect to the company and its assets. The conservator has sinceprovided for the exercise of certain authorities by our Board of Directors. Our directors do not have any fiduciary duties toany person or entity except to the conservator and, accordingly, are not obligated to consider the interests of thecompany, the holders of our equity or debt securities, or the holders of Fannie Mae MBS unless specifically directed to doso by the conservator.We do not know when or how the conservatorship will terminate, what further changes to our business will be madeduring or following conservatorship, what form we will have and what ownership interest, if any, our current common andpreferred stockholders will hold in us after the conservatorship is terminated or whether we will continue to exist followingconservatorship. Congress and the Administration continue to consider options for reform of the housing finance system,including Fannie Mae. We are not permitted to retain more than $3.0 billion in capital reserves or to pay dividends or otherdistributions to stockholders other than the U.S. Department of the Treasury (“Treasury”). Our agreements with Treasuryinclude covenants that significantly restrict our business activities. For additional information on the conservatorship, theuncertainty of our future, our agreements with Treasury, and recent developments relating to housing finance reform, see“Business—Conservatorship, Treasury Agreements and Housing Finance Reform,” “Business—Charter Act andRegulation” and “Risk Factors” in our Form 10-K for the year ended December 31, 2018 (“2018 Form 10-K”), and“Legislation and Regulation” and “Risk Factors” in this report.
You should read this Management’s Discussion and Analysis of Financial Condition and Results of Operations (“MD&A”) inconjunction with our unaudited condensed consolidated financial statements and related notes in this report and the moredetailed information in our 2018 Form 10-K. You can find a “Glossary of Terms Used in This Report” in the MD&A of our 2018Form 10-K.
Forward-looking statements in this report are based on management’s current expectations and are subject to significantuncertainties and changes in circumstances, as we describe in “Forward-Looking Statements.” Future events and our futureresults may differ materially from those reflected in our forward-looking statements due to a variety of factors, including thosediscussed in “Risk Factors” and elsewhere in this report and in our 2018 Form 10-K.
Introduction
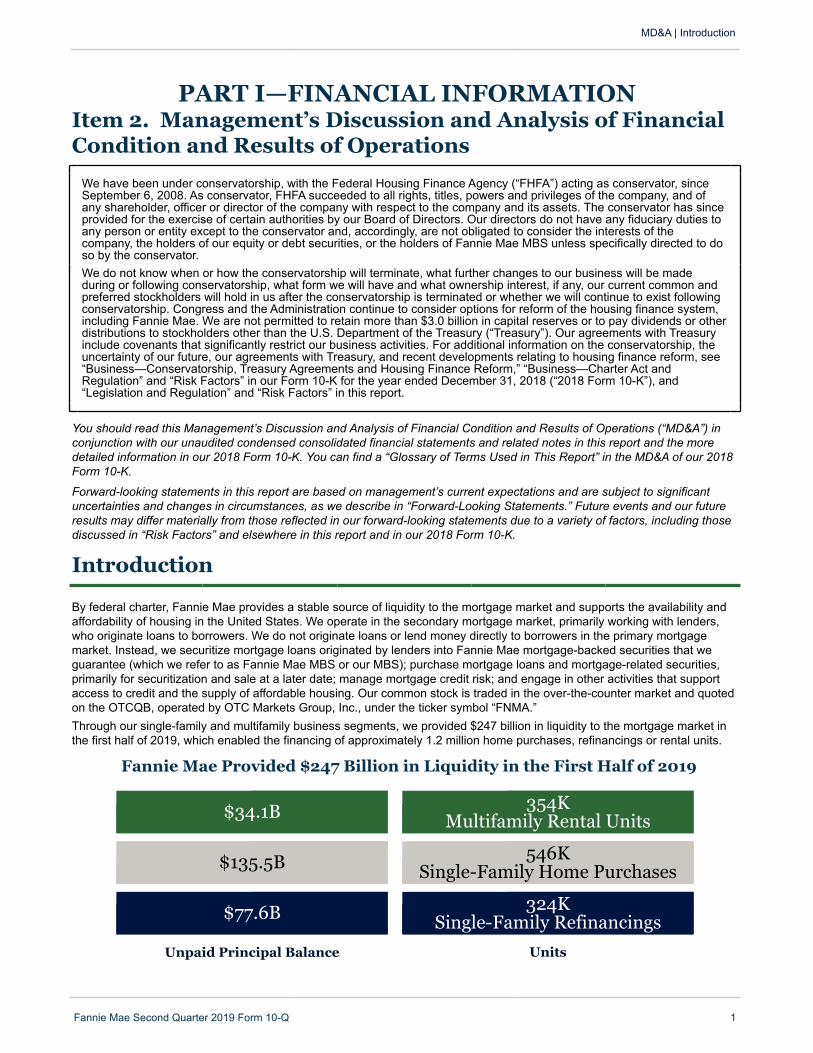
By federal charter, Fannie Mae provides a stable source of liquidity to the mortgage market and supports the availability andaffordability of housing in the United States. We operate in the secondary mortgage market, primarily working with lenders,who originate loans to borrowers. We do not originate loans or lend money directly to borrowers in the primary mortgagemarket. Instead, we securitize mortgage loans originated by lenders into Fannie Mae mortgage-backed securities that weguarantee (which we refer to as Fannie Mae MBS or our MBS); purchase mortgage loans and mortgage-related securities,primarily for securitization and sale at a later date; manage mortgage credit risk; and engage in other activities that supportaccess to credit and the supply of affordable housing. Our common stock is traded in the over-the-counter market and quotedon the OTCQB, operated by OTC Markets Group, Inc., under the ticker symbol “FNMA.”Through our single-family and multifamily business segments, we provided $247 billion in liquidity to the mortgage market inthe first half of 2019, which enabled the financing of approximately 1.2 million home purchases, refinancings or rental units.
Fannie Mae Provided $247 Billion in Liquidity in the First Half of 2019
$34.1B 354KMultifamily Rental Units
$135.5B 546KSingle-Family Home Purchases
$77.6B 324KSingle-Family Refinancings
Unpaid Principal Balance Units
Executive Summary
MD&A | Executive Summary
Fannie Mae Second Quarter 2019 Form 10-Q 2
Summary of Our Financial Performance
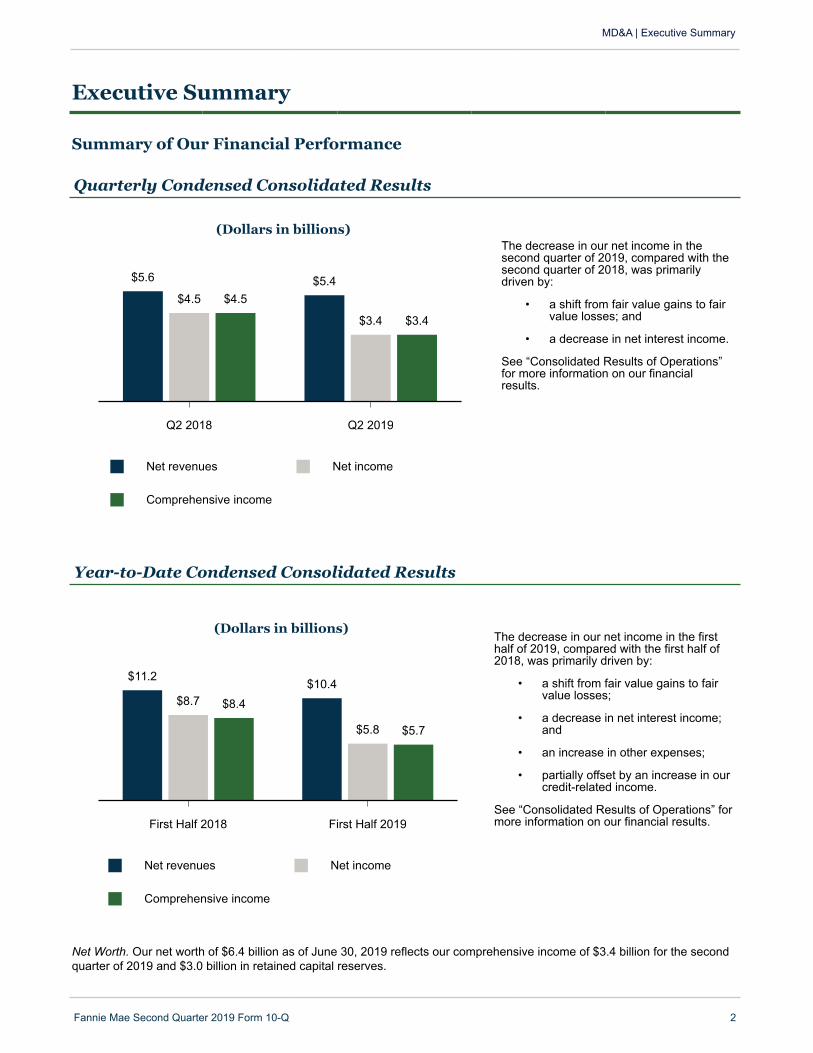
Quarterly Condensed Consolidated Results
Net revenues Net income
Comprehensive income
(Dollars in billions)
Q2 2018 Q2 2019
$5.6 $5.4$4.5
$3.4
$4.5
$3.4
The decrease in our net income in thesecond quarter of 2019, compared with thesecond quarter of 2018, was primarilydriven by:
• a shift from fair value gains to fairvalue losses; and
• a decrease in net interest income.
See “Consolidated Results of Operations”for more information on our financialresults.
Year-to-Date Condensed Consolidated Results
Net revenues Net income
Comprehensive income
(Dollars in billions)
First Half 2018 First Half 2019
$11.2 $10.4$8.7
$5.8
$8.4
$5.7
The decrease in our net income in the firsthalf of 2019, compared with the first half of2018, was primarily driven by:
• a shift from fair value gains to fairvalue losses;
• a decrease in net interest income;and
• an increase in other expenses;
• partially offset by an increase in ourcredit-related income.
See “Consolidated Results of Operations” formore information on our financial results.
Net Worth. Our net worth of $6.4 billion as of June 30, 2019 reflects our comprehensive income of $3.4 billion for the secondquarter of 2019 and $3.0 billion in retained capital reserves.
Financial Performance OutlookOur long-term financial performance will depend on many factors, including:
• the size of and our share of the U.S. mortgage market, which in turn will depend upon such factors as populationgrowth, household formation and home price appreciation; and
• actions by FHFA, the Administration and Congress relating to our business and housing finance reform, including thecapital requirements that will be applicable to us, our ongoing financial obligations to Treasury and our competitiveenvironment.
While we expect to remain profitable on an annual basis for the foreseeable future, certain factors could result in significantvolatility in our financial results from quarter to quarter or year to year. We expect quarterly volatility in our financial results dueto a number of factors, particularly changes in market conditions that result in fluctuations in the estimated fair value of ourderivatives and other financial instruments that we mark to market through our earnings. Other factors that may result involatility in our quarterly financial results include factors that affect our loss reserves, such as redesignations of loans from heldfor investment (“HFI”) to held for sale (“HFS”), changes in interest rates, home prices or accounting standards, or events suchas natural disasters, and other factors, as we discuss in “Risk Factors” and “Consolidated Results of Operations” in our 2018Form 10-K and in this report. Further, our implementation on January 1, 2020 of Accounting Standards Update 2016-13,Financial Instruments—Credit Losses (Topic 326), Measurement of Credit Losses on Financial Instruments (the “CECLstandard”) will likely introduce additional volatility in our results as credit-related income or expense will include expectedlifetime losses on our loans and other financial instruments subject to the standard and thus become more sensitive tofluctuations in these factors.
The potential for significant volatility in our financial results could result in a net loss in a future quarter. We are permitted toretain up to $3.0 billion in capital reserves as a buffer in the event of a net loss in a future quarter. However, any net loss weexperience in the future could be greater than the amount of our capital reserves, which would result in a net worth deficit forthat quarter. For example, we currently estimate that our adoption of the CECL standard will result in a reduction in ourretained earnings in the first quarter of 2020 of up to $4 billion on an after-tax basis, which could result in a net worth deficit forthat quarter. As described further in “Note 1, Summary of Significant Accounting Policies—New Accounting Guidance,” thisestimate is based on a number of assumptions and we are still assessing the impact of various implementation issues relatingto the CECL standard, as well as recently proposed accounting guidance relating to the standard. The resolution of theseitems may reduce CECL’s impact on our retained earnings upon adoption. Whether our CECL standard implementation willresult in a net worth deficit will depend on a number of factors, including the composition of our book of business, ourexpectations of future economic conditions, our results of operations for the second half of 2019 and the first quarter of 2020,and the resolution of the issues described above. If we experience a net worth deficit in a future quarter, we will be required todraw funds from Treasury under our senior preferred stock purchase agreement with Treasury to avoid being placed intoreceivership. See “Risk Factors” in our 2018 Form 10-K for a discussion of the risks associated with the limitations on ourability to rebuild our capital reserves, including factors that could result in a net loss or net worth deficit in a future quarter.
MD&A | Executive Summary
Fannie Mae Second Quarter 2019 Form 10-Q 3
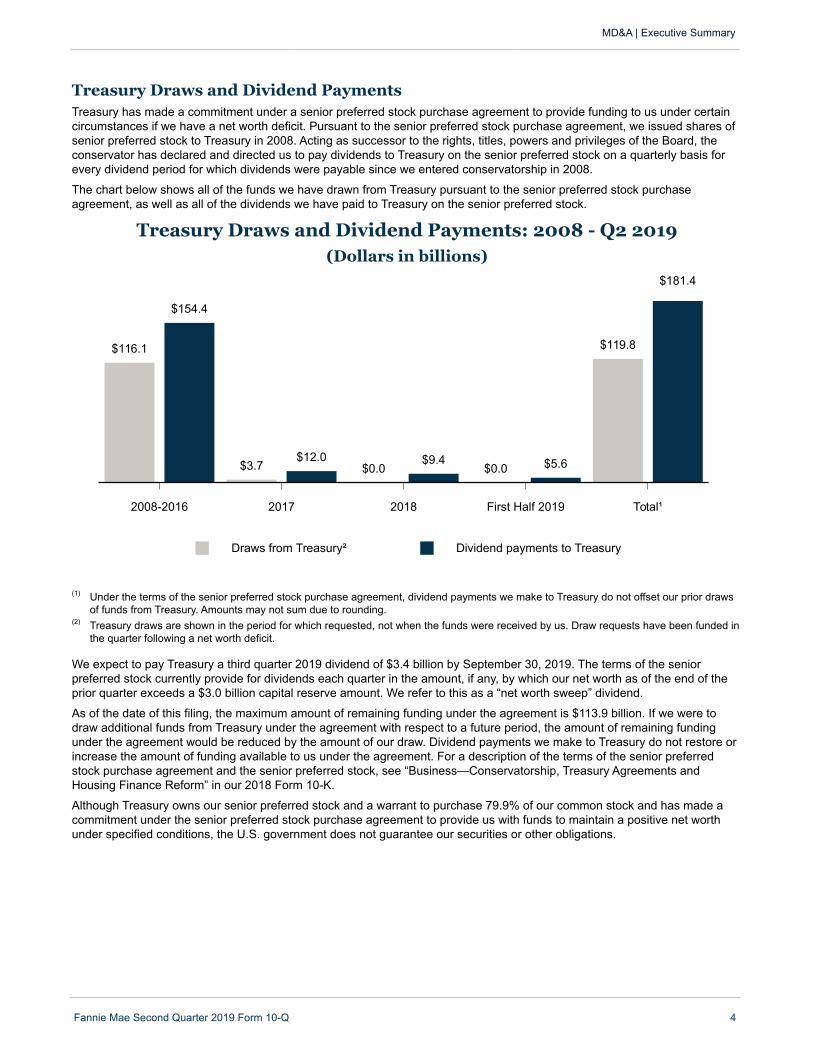
Treasury Draws and Dividend Payments Treasury has made a commitment under a senior preferred stock purchase agreement to provide funding to us under certaincircumstances if we have a net worth deficit. Pursuant to the senior preferred stock purchase agreement, we issued shares ofsenior preferred stock to Treasury in 2008. Acting as successor to the rights, titles, powers and privileges of the Board, theconservator has declared and directed us to pay dividends to Treasury on the senior preferred stock on a quarterly basis forevery dividend period for which dividends were payable since we entered conservatorship in 2008.
The chart below shows all of the funds we have drawn from Treasury pursuant to the senior preferred stock purchaseagreement, as well as all of the dividends we have paid to Treasury on the senior preferred stock.
Treasury Draws and Dividend Payments: 2008 - Q2 2019(Dollars in billions)
Draws from Treasury² Dividend payments to Treasury
2008-2016 2017 2018 First Half 2019 Total¹
$116.1
$3.7 $0.0 $0.0
$119.8
$154.4
$12.0 $9.4 $5.6
$181.4
(1) Under the terms of the senior preferred stock purchase agreement, dividend payments we make to Treasury do not offset our prior drawsof funds from Treasury. Amounts may not sum due to rounding.
(2) Treasury draws are shown in the period for which requested, not when the funds were received by us. Draw requests have been funded inthe quarter following a net worth deficit.
We expect to pay Treasury a third quarter 2019 dividend of $3.4 billion by September 30, 2019. The terms of the seniorpreferred stock currently provide for dividends each quarter in the amount, if any, by which our net worth as of the end of theprior quarter exceeds a $3.0 billion capital reserve amount. We refer to this as a “net worth sweep” dividend.
As of the date of this filing, the maximum amount of remaining funding under the agreement is $113.9 billion. If we were todraw additional funds from Treasury under the agreement with respect to a future period, the amount of remaining fundingunder the agreement would be reduced by the amount of our draw. Dividend payments we make to Treasury do not restore orincrease the amount of funding available to us under the agreement. For a description of the terms of the senior preferredstock purchase agreement and the senior preferred stock, see “Business—Conservatorship, Treasury Agreements andHousing Finance Reform” in our 2018 Form 10-K.
Although Treasury owns our senior preferred stock and a warrant to purchase 79.9% of our common stock and has made acommitment under the senior preferred stock purchase agreement to provide us with funds to maintain a positive net worthunder specified conditions, the U.S. government does not guarantee our securities or other obligations.
MD&A | Executive Summary
Fannie Mae Second Quarter 2019 Form 10-Q 4
Legislation and Regulation
The information in this section updates and supplements information regarding legislative and regulatory developmentsaffecting our business set forth in “Business—Conservatorship, Treasury Agreements and Housing Finance Reform” and“Business—Charter Act and Regulation” in our 2018 Form 10-K, as well as in “MD&A—Legislation and Regulation” in ourForm 10-Q for the quarter ended March 31, 2019 (“First Quarter 2019 Form 10-Q”). Also see “Risk Factors” in this report andin our 2018 Form 10-K for discussions of risks relating to legislative and regulatory matters.
Housing Finance ReformAdministration Developments. In March 2019, President Trump issued a memorandum directing the Secretary of the Treasuryto develop a plan (the “Treasury Housing Reform Plan”) for administrative and legislative reforms for Fannie Mae and FreddieMac (collectively referred to as the “government-sponsored enterprises” or the “GSEs”) to achieve the following goals:
• ending the conservatorships of the GSEs upon the completion of specified reforms;
• facilitating competition in the housing finance market;
• establishing regulation of the GSEs that safeguards their safety and soundness and minimizes the risks they pose tothe financial stability of the United States; and
• providing that the federal government is properly compensated for any explicit or implicit support it provides to theGSEs or the secondary housing finance market.
The memorandum states that the Treasury Housing Reform Plan shall include reform proposals to achieve the followingspecific objectives and, for those reforms that can be implemented administratively, include a timeline for implementation:
• preserving access for qualified homebuyers to 30-year fixed-rate mortgages and other mortgage options that bestserve the financial needs of potential homebuyers;
• maintaining equal access to the federal housing finance system for lenders of all sizes, charter types, and geographiclocations, including the maintenance of a cash window for loan sales;
• establishing appropriate capital and liquidity requirements for the GSEs;
• increasing competition and participation of the private sector in the mortgage market, including by authorizing FHFAto approve guarantors of conventional mortgage loans in the secondary market;
• mitigating the risks undertaken by the GSEs, including by altering, if necessary, our respective policies on loan limits,program and product offerings, credit underwriting parameters, and the use of private capital to transfer credit risk;
• recommending appropriate size and risk profiles for the GSEs’ retained mortgage and investment portfolios;
• defining the role of the GSEs in multifamily mortgage finance;
• defining the mission of the Federal Home Loan Bank system and its role in supporting federal housing finance;
• evaluating, in consultation with the Secretary of the U.S. Department of Housing and Urban Development (“HUD”)and the Director of the Bureau of Consumer Financial Protection, the “QM patch.” The QM patch refers to a specialclass of conventional mortgage loans that will be considered “qualified mortgages” under the Truth in Lending Act ifthey (1) meet certain qualified mortgage requirements generally and (2) are eligible for sale to Fannie Mae or FreddieMac;
• defining the GSEs’ role in promoting affordable housing without duplicating support provided by the Federal HousingAdministration (“FHA”) or other federal programs; and
• setting the conditions necessary for the termination of the conservatorships of the GSEs, which shall include thefollowing conditions being satisfied:
◦ the federal government is fully compensated for the explicit and implicit guarantees provided by it to theGSEs or any successor entities in the form of an ongoing payment to the United States;
◦ the GSEs’ activities are restricted to their core statutory mission and the size of investment and retainedmortgage portfolios is appropriately limited; and
◦ the GSEs are subjected to heightened prudential requirements and safety and soundness standards,including increased capital requirements, designed to prevent a future taxpayer bailout and minimize risks tofinancial stability.
The memorandum also directs the Secretary of HUD to develop a plan for reforming FHA and Ginnie Mae. All plans are to besubmitted to the President for approval as soon as practicable. As of the time of this filing, the Treasury Housing Reform Planhas not been published.
MD&A | Legislation and Regulation
Fannie Mae Second Quarter 2019 Form 10-Q 5
Congressional Developments. In June 2019, the Senate Committee on Banking, Housing, and Urban Affairs held a hearing onwhether Fannie Mae and Freddie Mac should be designated as systemically important financial institutions by the FinancialStability Oversight Council. If we were to become designated as a systemically important financial institution, we wouldbecome subject to additional regulation and oversight by the Federal Reserve Board.
We expect the Administration, FHFA and Congress to continue to consider housing finance reform, which could result insignificant changes in our structure and role in the future, as well as other changes to our business and competitiveenvironment. As a result, there continues to be significant uncertainty regarding the future of our company. See “Risk Factors”in this report and in our 2018 Form 10-K for more information on our uncertain future, including the risks to our business andprofitability arising from our conservatorship status and potential housing finance reform.
Qualified Mortgage Advance Notice of Proposed RulemakingOn July 25, 2019, the Consumer Financial Protection Bureau (“CFPB”) issued an advance notice of proposed rulemakingseeking information relating to the expiration of the “QM patch” described above, which is scheduled to expire on the earlier ofJanuary 10, 2021 or when Fannie Mae and Freddie Mac cease to be in conservatorship or receivership. The CFPB’s noticestates that it currently plans to allow the QM patch to expire in January 2021 or after a short extension, if necessary, tofacilitate a smooth and orderly transition away from the QM patch. The CFPB’s notice requests comments on possibleamendments to the ability to repay/qualified mortgage rule, including whether to revise Regulation Z’s definition of a qualifiedmortgage in light of the QM patch’s scheduled expiration. Although the ability to repay/qualified mortgage rule does not applyto us, as we do not originate loans in the primary mortgage market, these rules apply to the lenders from which we acquiresingle-family mortgage loans. Changes in this rule may affect, perhaps materially, the quality and quantity of loans available fordelivery to us, and the competition we face for the acquisition and guaranty of mortgage assets. See “Business—Charter Actand Regulation—GSE Act and Other Regulation” in our 2018 Form 10-K for more information on the ability to repay/qualifiedmortgage rule.
The Future of LIBOR and Alternative Reference RatesIn 2017, the United Kingdom’s Financial Conduct Authority, which regulates LIBOR, announced its intention to stop persuadingor compelling the group of major banks that sustains LIBOR to submit rate quotations after 2021. As a result, it is uncertainwhether LIBOR will continue to be quoted after 2021. We have exposure to LIBOR, including in financial instruments thatmature after 2021. Our exposure arises from our acquisitions of loans and securities, our sales of securities, and our entry intoderivative transactions that reference LIBOR. We are actively taking steps to facilitate an orderly transition from LIBOR. Wehave created an enterprise program office focused on:
• identifying and monitoring our exposure to LIBOR now and after 2021;
• updating our infrastructure (including models and systems) to prepare for the transition;
• developing key milestones and timelines for the adoption of alternative reference rates for new acquisitions of loansand securities, and for new securities issuances;
• monitoring the market adoption of alternative reference rates and industry-standard contractual fallback provisions;and
• participating in industry working groups.
These efforts are overseen by our LIBOR Enterprise Steering Council, which includes members of senior management. Wealso coordinate with FHFA on our LIBOR transition efforts. As part of these efforts, we have sought to identify the risks inherentin this transition and engaged external business and legal consultants focused on LIBOR and alternative indices. We continueto analyze potential risks associated with the LIBOR transition, including financial, operational, legal, reputational andcompliance risks.
In addition to the work we are doing on an enterprise level to facilitate an orderly transition from LIBOR, we also are a votingmember of the Alternative Reference Rates Committee (the “ARRC”) and participate in its working groups. The ARRC is agroup of private-market participants convened by the Federal Reserve Board and the Federal Reserve Bank of New York toidentify a set of alternative U.S. dollar reference interest rates and an adoption plan for those alternative rates. Banking andfinancial regulators, including FHFA, also participate in the ARRC as ex-officio members. In 2017, the ARRC recommended analternative reference rate, referred to as the Secured Overnight Financing Rate (“SOFR”). The Federal Reserve Bank of NewYork began publishing SOFR in 2018. In support of the ARRC’s efforts to develop SOFR as a key market index, we issued themarket’s first SOFR securities in 2018 and to date we have issued a total of $17.5 billion in SOFR-indexed floating-ratecorporate debt. We also have entered into SOFR-indexed interest rate swaps and futures transactions to further support thedevelopment of this emerging index.
As part of its continued effort to develop plans to transition to SOFR as the new market benchmark, in July 2019, the ARRCpublished a white paper that provides a framework for the use of SOFR for newly originated consumer residential adjustable-rate mortgage products. We support the framework and intend to create a SOFR-indexed adjustable-rate mortgage product fornew originations after systems and processes have been put in place to accommodate the new index.
MD&A | Legislation and Regulation
Fannie Mae Second Quarter 2019 Form 10-Q 6

At this time, we are unable to predict whether or when LIBOR will cease to be available or if SOFR will become the benchmarkto replace LIBOR. Because we routinely engage in transactions involving financial instruments that reference LIBOR, thesedevelopments could have a material impact on us, borrowers, investors, and our customers and counterparties. See “RiskFactors” in this report for a discussion of the risks to our results of operations, financial condition, liquidity and net worth posedby the potential discontinuance of LIBOR.
MD&A | Legislation and Regulation
Fannie Mae Second Quarter 2019 Form 10-Q 7
Single Security Initiative & Common Securitization Platform
OverviewOn June 3, 2019, we and Freddie Mac began issuing single-family uniform mortgage-backed securities, or “UMBSTM.” We alsobegan using the common securitization platform operated by Common Securitization Solutions, LLC (“CSS”) to perform certainaspects of the securitization process for our single-family Fannie Mae MBS issuances beginning in May 2019. This representsthe final implementation of the Single Security Initiative that we, Freddie Mac and FHFA have been working on since 2014.The objective of the Single Security Initiative is to enhance the overall liquidity of Fannie Mae and Freddie Mac mortgage-backed securities eligible for trading in the to-be-announced (“TBA”) market by supporting their fungibility without regard towhich company is the issuer. The Single Security Initiative and the common securitization platform represent significantchanges for the mortgage market and for our securitization operations and business.
Single Security Initiative and UMBSEach of Fannie Mae and Freddie Mac issues and guarantees UMBS and structured securities backed by UMBS and othersecurities, as described below.
• UMBS. Each of Fannie Mae and Freddie Mac issues and guarantees UMBS that are directly backed by the mortgageloans it has acquired, referred to as “first-level securities.” UMBS issued by Fannie Mae are backed only by mortgageloans that Fannie Mae has acquired, and similarly UMBS issued by Freddie Mac are backed only by mortgage loans thatFreddie Mac has acquired. There is no commingling of Fannie Mae- and Freddie Mac-acquired loans within UMBS.
Mortgage loans backing UMBS are limited to fixed-rate mortgage loans eligible for financing through the TBA market. Wecontinue to issue some types of Fannie Mae MBS that are not TBA-eligible and therefore are not issued as UMBS, suchas single-family Fannie Mae MBS backed by adjustable-rate mortgages and all multifamily Fannie Mae MBS.
• Structured Securities. Each of Fannie Mae and Freddie Mac also issues and guarantees structured mortgage-backedsecurities, referred to as “second-level securities,” that are resecuritizations of UMBS or previously-issued structuredsecurities. In contrast to UMBS, second-level securities can be commingled—that is, they can include both Fannie Maesecurities and Freddie Mac securities as the underlying collateral for the security. This ability to commingle resecuritizedUMBS is intended to further promote the fungibility and liquidity of TBA-eligible securities. These structured securitiesinclude SupersTM, which are single-class resecuritizations, and real estate mortgage investment conduit securities(“REMICs”), which are multi-class resecuritizations. While Supers are backed only by TBA-eligible securities, REMICs canbe backed by TBA-eligible or non-TBA-eligible securities.
The key features of UMBS are the same as those of legacy single-family Fannie Mae MBS. Accordingly, all single-familyFannie Mae MBS that are directly backed by fixed-rate loans and generally eligible for trading in the TBA market are UMBS,whether issued before or after the June 3, 2019 Single Security Initiative implementation date. In this report, we use the term“Fannie Mae-issued UMBS” to refer to single-family Fannie Mae MBS that are directly backed by fixed-rate mortgage loansand generally eligible for trading in the TBA market. We use the term “Fannie Mae MBS” or “our MBS” to refer to any type ofmortgage-backed security that we issue, including UMBS, Supers, REMICs and other types of single-family or multifamilymortgage-backed securities. References to our single-family guaranty book of business in this report exclude Freddie Mac-acquired mortgage loans underlying Freddie Mac mortgage-related securities that we have resecuritized.
When we issue a structured security backed in whole or part by Freddie Mac securities, we provide a new and separateguaranty of principal and interest on the newly-formed structured security. If Freddie Mac were to fail to make a payment dueon its securities underlying a Fannie Mae-issued structured security, we would be obligated under our guaranty to fund anyshortfall. In June 2019, we entered into an indemnification agreement with Freddie Mac relating to the commingled structuredsecurities that we and Freddie Mac issue. Under the indemnification agreement, Fannie Mae and Freddie Mac each haveagreed to indemnify the other party for losses caused by: its failure to meet its payment or other specified obligations under thetrust agreements pursuant to which the underlying resecuritized securities were issued; its failure to meet its obligations underthe customer services agreement described below; its violations of laws; or with respect to material misstatements oromissions in offering documents, ongoing disclosures and related materials relating to the underlying resecuritized securities.
Common Securitization Solutions, LLC and the Common Securitization Platform The common securitization platform operated by CSS has replaced certain elements of Fannie Mae’s and Freddie Mac’sproprietary systems for securitizing single-family mortgages and performing associated back-office and administrativefunctions. The design of the common securitization platform also allows for the potential integration of additional marketparticipants in the future. We no longer use our individual proprietary securitization function for our single-family MBSissuances. In addition to using the common securitization platform for our newly issued UMBS issuances, we are also nowusing the common securitization platform for certain ongoing administrative functions for our previously issued and outstandingsingle-family Fannie Mae MBS. We do not use the common securitization platform operated by CSS for securitizing orperforming associated administrative functions for our multifamily Fannie Mae MBS.
CSS is jointly owned by us and Freddie Mac. CSS operates as a separate company from us and Freddie Mac, with fundingand limited administrative support services and other resources provided to it by us and Freddie Mac. We are parties to thefollowing agreements relating to the governance and operation of CSS and the common securitization platform.
• Limited Liability Company Agreement. Fannie Mae, Freddie Mac and CSS are parties to a limited liability companyagreement that sets forth the overall framework for the joint venture, including Fannie Mae’s and Freddie Mac’s rights andresponsibilities as members of CSS, the governance process for CSS and the intellectual property rights of Fannie Mae,Freddie Mac and CSS in the common securitization platform. Fannie Mae and Freddie Mac each has a 50% ownershipinterest in CSS, and each company makes capital contributions of equal value to CSS. CSS is governed by a four-member Board of Managers, with two members appointed by Fannie Mae and two members appointed by Freddie Mac.Board actions require the affirmative vote of at least one Fannie Mae manager and one Freddie Mac manager. Theagreement provides that FHFA has a prominent role in CSS’s governance while Fannie Mae and Freddie Mac are inconservatorship or receivership, including: the right to approve specified significant matters such as budgets, businessplans, capital contributions, and appointments, compensation and removal of CSS officers; the right to attend meetings ofthe CSS Board of Managers; and the authority to resolve any deadlocks. CSS owns the common securitization platformand has granted a non-exclusive perpetual, paid-up license to each of Fannie Mae and Freddie Mac to use the materialsand intellectual property owned and licensed by CSS while each is a member of CSS.
• Customer Services Agreement. Fannie Mae, Freddie Mac and CSS are parties to a customer services agreement thatsets forth the terms under which CSS provides mortgage securitization services to us and Freddie Mac, including theoperation of the common securitization platform. CSS uses the common securitization platform to perform data validation,issuance, at-issuance and ongoing disclosures, tax reporting and bond administration for Fannie Mae’s single-familymortgage-backed securities. Fannie Mae and Freddie Mac do not pay service fees under the customer servicesagreement; CSS operations are funded solely through capital contributions from Fannie Mae and Freddie Mac pursuant tothe limited liability company agreement described above.
• Administrative Services Agreement. Each of Fannie Mae and Freddie Mac is party to a separate administrativeservices agreement with CSS that sets forth the support services each company provides to CSS. We provideprocurement services to CSS. Freddie Mac provides tax-related services to CSS.
See “Risk Factors” in this report and in our 2018 Form 10-K and “Risk Management—Institutional Counterparty Credit RiskManagement—Counterparty Credit Risk Exposure arising from the Single Security Initiative” in this report for a discussion ofthe risks to our business associated with the Single Security Initiative and the common securitization platform.
MD&A | Single Security Initiative & Common Securitization Platform
Fannie Mae Second Quarter 2019 Form 10-Q 8
Key Market Economic Indicators
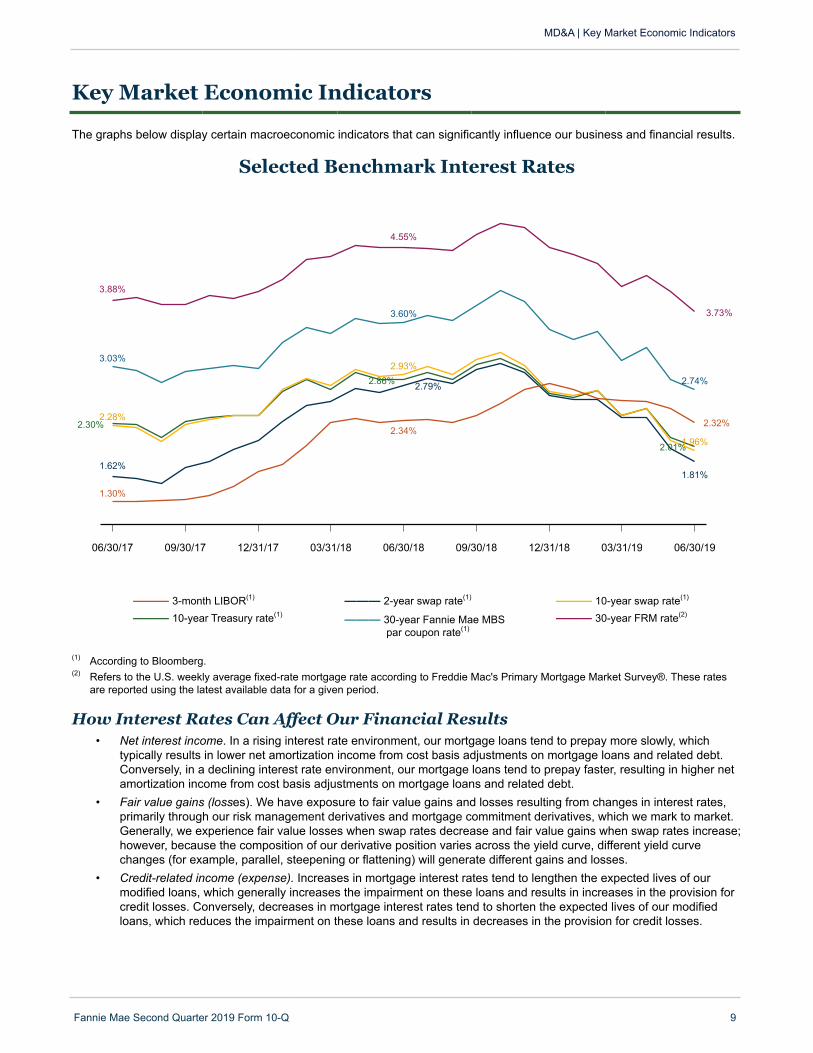
The graphs below display certain macroeconomic indicators that can significantly influence our business and financial results.
Selected Benchmark Interest Rates
06/30/17 09/30/17 12/31/17 03/31/18 06/30/18 09/30/18 12/31/18 03/31/19 06/30/19
1.30%
2.34%2.32%
1.62%
2.79%
1.81%
2.28%
2.93%
1.96%
2.30%
2.86%
2.01%
3.03%
3.60%
2.74%
3.88%
4.55%
3.73%
——— 3-month LIBOR(1) ——— 2-year swap rate(1) ——— 10-year swap rate(1)
——— 10-year Treasury rate(1) ——— 30-year Fannie Mae MBSpar coupon rate(1)
——— 30-year FRM rate(2)
(1) According to Bloomberg. (2) Refers to the U.S. weekly average fixed-rate mortgage rate according to Freddie Mac's Primary Mortgage Market Survey®. These rates
are reported using the latest available data for a given period.
How Interest Rates Can Affect Our Financial Results• Net interest income. In a rising interest rate environment, our mortgage loans tend to prepay more slowly, which
typically results in lower net amortization income from cost basis adjustments on mortgage loans and related debt.Conversely, in a declining interest rate environment, our mortgage loans tend to prepay faster, resulting in higher netamortization income from cost basis adjustments on mortgage loans and related debt.
• Fair value gains (losses). We have exposure to fair value gains and losses resulting from changes in interest rates,primarily through our risk management derivatives and mortgage commitment derivatives, which we mark to market.Generally, we experience fair value losses when swap rates decrease and fair value gains when swap rates increase;however, because the composition of our derivative position varies across the yield curve, different yield curvechanges (for example, parallel, steepening or flattening) will generate different gains and losses.
• Credit-related income (expense). Increases in mortgage interest rates tend to lengthen the expected lives of ourmodified loans, which generally increases the impairment on these loans and results in increases in the provision forcredit losses. Conversely, decreases in mortgage interest rates tend to shorten the expected lives of our modifiedloans, which reduces the impairment on these loans and results in decreases in the provision for credit losses.
MD&A | Key Market Economic Indicators
Fannie Mae Second Quarter 2019 Form 10-Q 9
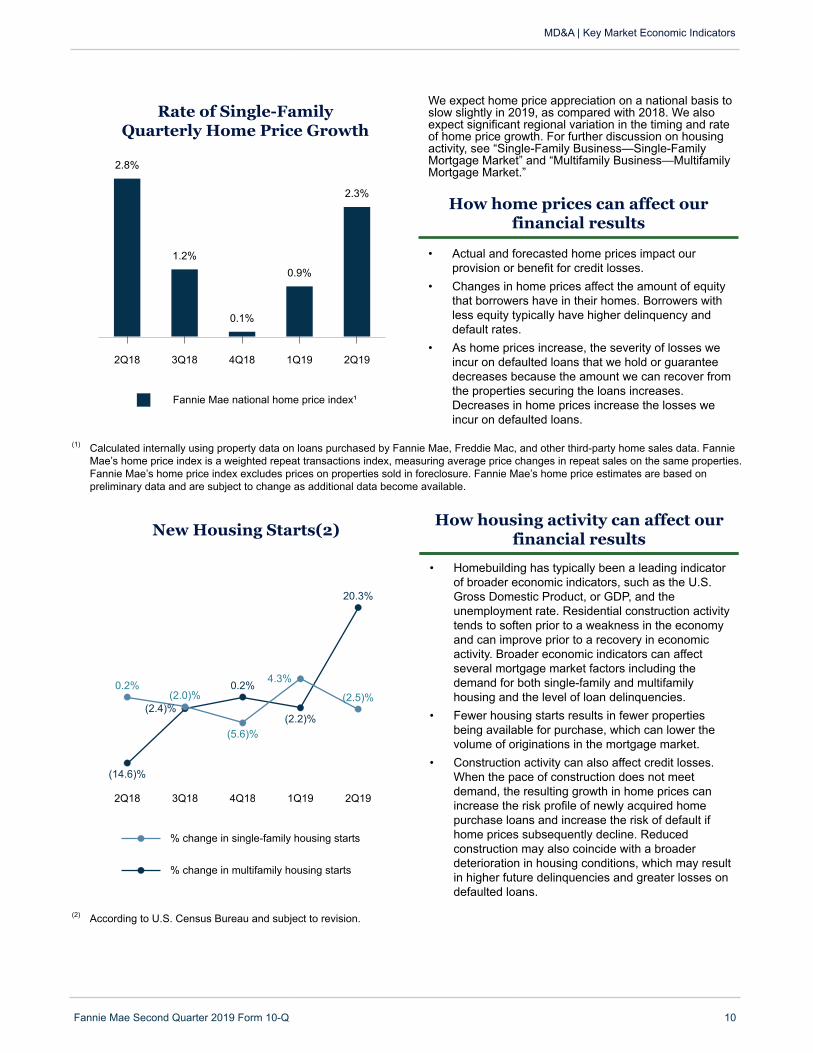
Fannie Mae national home price index¹
Rate of Single-FamilyQuarterly Home Price Growth
2Q18 3Q18 4Q18 1Q19 2Q19
2.8%
1.2%
0.1%
0.9%
2.3%
We expect home price appreciation on a national basis toslow slightly in 2019, as compared with 2018. We alsoexpect significant regional variation in the timing and rateof home price growth. For further discussion on housingactivity, see “Single-Family Business—Single-FamilyMortgage Market” and “Multifamily Business—MultifamilyMortgage Market.”
How home prices can affect ourfinancial results
• Actual and forecasted home prices impact ourprovision or benefit for credit losses.
• Changes in home prices affect the amount of equitythat borrowers have in their homes. Borrowers withless equity typically have higher delinquency anddefault rates.
• As home prices increase, the severity of losses weincur on defaulted loans that we hold or guaranteedecreases because the amount we can recover fromthe properties securing the loans increases.Decreases in home prices increase the losses weincur on defaulted loans.
(1) Calculated internally using property data on loans purchased by Fannie Mae, Freddie Mac, and other third-party home sales data. FannieMae’s home price index is a weighted repeat transactions index, measuring average price changes in repeat sales on the same properties.Fannie Mae’s home price index excludes prices on properties sold in foreclosure. Fannie Mae’s home price estimates are based onpreliminary data and are subject to change as additional data become available.
% change in single-family housing starts
% change in multifamily housing starts
New Housing Starts(2)
2Q18 3Q18 4Q18 1Q19 2Q19
0.2%(2.0)%
(5.6)%
4.3%
(2.5)%
(14.6)%
(2.4)%
0.2%
(2.2)%
20.3%
How housing activity can affect ourfinancial results
• Homebuilding has typically been a leading indicatorof broader economic indicators, such as the U.S.Gross Domestic Product, or GDP, and theunemployment rate. Residential construction activitytends to soften prior to a weakness in the economyand can improve prior to a recovery in economicactivity. Broader economic indicators can affectseveral mortgage market factors including thedemand for both single-family and multifamilyhousing and the level of loan delinquencies.
• Fewer housing starts results in fewer propertiesbeing available for purchase, which can lower thevolume of originations in the mortgage market.
• Construction activity can also affect credit losses.When the pace of construction does not meetdemand, the resulting growth in home prices canincrease the risk profile of newly acquired homepurchase loans and increase the risk of default ifhome prices subsequently decline. Reducedconstruction may also coincide with a broaderdeterioration in housing conditions, which may resultin higher future delinquencies and greater losses ondefaulted loans.
(2) According to U.S. Census Bureau and subject to revision.
MD&A | Key Market Economic Indicators
Fannie Mae Second Quarter 2019 Form 10-Q 10
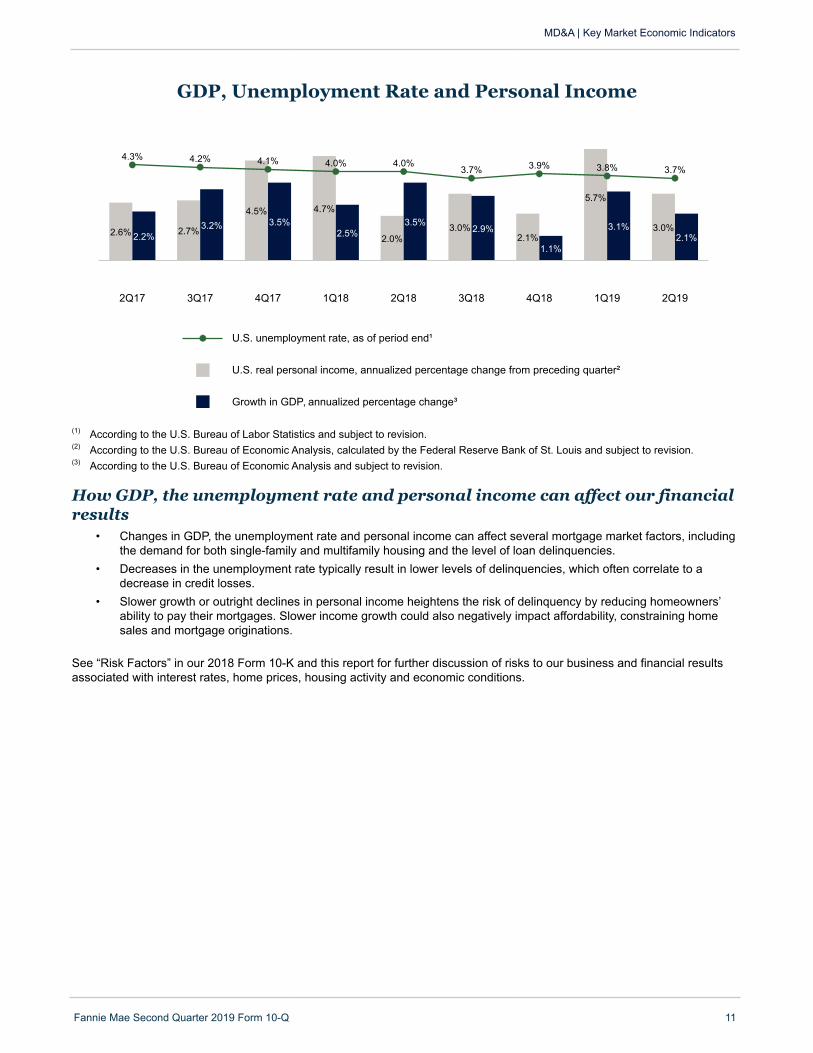
GDP, Unemployment Rate and Personal Income
U.S. unemployment rate, as of period end¹
U.S. real personal income, annualized percentage change from preceding quarter²
Growth in GDP, annualized percentage change³
2Q17 3Q17 4Q17 1Q18 2Q18 3Q18 4Q18 1Q19 2Q19
4.3% 4.2% 4.1% 4.0% 4.0%3.7% 3.9% 3.8% 3.7%
2.6% 2.7%
4.5% 4.7%
2.0%3.0%
2.1%
5.7%
3.0%2.2%
3.2% 3.5%2.5%
3.5%2.9%
1.1%
3.1%2.1%
(1) According to the U.S. Bureau of Labor Statistics and subject to revision.(2) According to the U.S. Bureau of Economic Analysis, calculated by the Federal Reserve Bank of St. Louis and subject to revision.(3) According to the U.S. Bureau of Economic Analysis and subject to revision.
How GDP, the unemployment rate and personal income can affect our financialresults
• Changes in GDP, the unemployment rate and personal income can affect several mortgage market factors, includingthe demand for both single-family and multifamily housing and the level of loan delinquencies.
• Decreases in the unemployment rate typically result in lower levels of delinquencies, which often correlate to adecrease in credit losses.
• Slower growth or outright declines in personal income heightens the risk of delinquency by reducing homeowners’ability to pay their mortgages. Slower income growth could also negatively impact affordability, constraining homesales and mortgage originations.
See “Risk Factors” in our 2018 Form 10-K and this report for further discussion of risks to our business and financial resultsassociated with interest rates, home prices, housing activity and economic conditions.
MD&A | Key Market Economic Indicators
Fannie Mae Second Quarter 2019 Form 10-Q 11

Consolidated Results of Operations
This section provides a discussion of our condensed consolidated results of operations and should be read together with ourcondensed consolidated financial statements, including the accompanying notes.
MD&A | Consolidated Results of Operations
Fannie Mae Second Quarter 2019 Form 10-Q 12
Summary of Condensed Consolidated Results of OperationsFor the Three Months
Ended June 30,For the Six Months
Ended June 30,2019 2018 Variance 2019 2018 Variance
(Dollars in millions)Net interest income $ 5,150 $ 5,377 $ (227) $ 9,883 $ 10,609 $ (726)Fee and other income 246 239 7 473 559 (86)Net revenues 5,396 5,616 (220) 10,356 11,168 (812)Investment gains, net 461 277 184 594 527 67Fair value gains (losses), net (754) 229 (983) (1,585) 1,274 (2,859)Administrative expenses (744) (755) 11 (1,488) (1,505) 17Credit-related income:
Benefit for credit losses 1,225 1,296 (71) 1,875 1,513 362Foreclosed property expense (128) (139) 11 (268) (301) 33
Total credit-related income 1,097 1,157 (60) 1,607 1,212 395Temporary Payroll Tax Cut Continuation
Act of 2011 (“TCCA”) fees (600) (565) (35) (1,193) (1,122) (71)Other expenses, net (535) (366) (169) (943) (569) (374)Income before federal income taxes 4,321 5,593 (1,272) 7,348 10,985 (3,637)Provision for federal income taxes (889) (1,136) 247 (1,516) (2,267) 751Net income $ 3,432 $ 4,457 $ (1,025) $ 5,832 $ 8,718 $ (2,886)
Total comprehensive income $ 3,365 $ 4,459 $ (1,094) $ 5,726 $ 8,397 $ (2,671)
Net Interest Income We have two primary sources of net interest income:
• guaranty fees we receive for managing the credit risk on loans underlying Fannie Mae MBS held by third parties; and
• the difference between interest income earned on the assets in our retained mortgage portfolio and our otherinvestments portfolio (collectively, our “portfolios”) and the interest expense associated with the debt that funds thoseassets. See “Retained Mortgage Portfolio” and “Liquidity and Capital Management—Liquidity Management—OtherInvestments Portfolio” for more information about our portfolios.
Guaranty fees consist of two primary components:
• base guaranty fees that we receive over the life of the loan; and
• upfront fees that we receive at the time of loan acquisition primarily related to single-family loan-level pricingadjustments and other fees we receive from lenders, which are amortized into net interest income as cost basisadjustments over the contractual life of the loan. We refer to this as amortization income.
We recognize almost all of our guaranty fee revenue in net interest income because we consolidate the substantial majority ofour loans underlying our Fannie Mae MBS in consolidated trusts on our consolidated balance sheets. Those guaranty fees arethe primary component of the difference between the interest income on loans in consolidated trusts and the interest expenseon the debt of consolidated trusts.

The table below displays the components of our net interest income from our guaranty book of business and from ourportfolios.
Components of Net Interest IncomeFor the Three Months
Ended June 30,For the Six Months
Ended June 30,2019 2018 Variance 2019 2018 Variance
(Dollars in millions)
Net interest income from guaranty book of business:
Base guaranty fee income, net of TCCA $ 2,312 $ 2,110 $ 202 $ 4,571 $ 4,199 $ 372Base guaranty fee income related to TCCA(1) 600 565 35 1,193 1,122 71Net amortization income 1,371 1,487 (116) 2,353 2,995 (642)
Total net interest income from guaranty book ofbusiness 4,283 4,162 121 8,117 8,316 (199)
Net interest income from portfolios(2) 867 1,215 (348) 1,766 2,293 (527)Total net interest income $ 5,150 $ 5,377 $ (227) $ 9,883 $ 10,609 $ (726)
(1) Revenues generated by the 10 basis point guaranty fee increase we implemented pursuant to the TCCA, the incremental revenue fromwhich is remitted to Treasury and not retained by us.
(2) Includes interest income from assets held in our retained mortgage portfolio and our other investments portfolio, as well as other assetsused to generate lender liquidity. Also includes interest expense on our outstanding Connecticut Avenue Securities® of $376 million and$339 million for the three months ended June 30, 2019 and 2018, respectively, and $758 million and $641 million for the first half of 2019and 2018, respectively.
Net interest income declined in the second quarter and first half of 2019 compared with the second quarter and first half of2018, driven by lower net interest income from portfolios and lower net amortization income, partially offset by higher baseguaranty fee income.
• Net interest income from portfolios decreased in the second quarter and first half of 2019 compared with the secondquarter and first half of 2018 primarily due to sales of reperforming loans in our loss mitigation portfolio, whichreduced the average balance of our retained mortgage portfolio, partially offset by increased interest income on ourother investments portfolio due to higher short-term interest rates. See “Retained Mortgage Portfolio” for moreinformation.
• Net amortization income decreased in the first half of 2019 compared with the first half of 2018 primarily due to adecline in prepayment volumes in the first quarter of 2019, which resulted in lower amortization of cost basisadjustments on mortgage loans of consolidated trusts and the related debt.
• Net interest income from base guaranty fees increased in the second quarter and first half of 2019 compared with thesecond quarter and first half of 2018 due to an increase in the size of our guaranty book of business and loans withhigher base guaranty fees comprising a larger part of our guaranty book of business.
Analysis of Deferred Amortization IncomeWe initially recognize mortgage loans and debt of consolidated trusts in our condensed consolidated balance sheet at fairvalue. The difference between the initial fair value and the carrying value of these instruments is recorded as cost basisadjustments, either as premiums or discounts. These cost basis adjustments are amortized as yield adjustments over thecontractual lives of the loans or debt. On a net basis, for mortgage loans and debt of consolidated trusts, we are in a premiumposition with respect to debt of consolidated trusts, which represents deferred income we will recognize in our condensedconsolidated statements of operations and comprehensive income as amortization income in future periods.
MD&A | Consolidated Results of Operations
Fannie Mae Second Quarter 2019 Form 10-Q 13
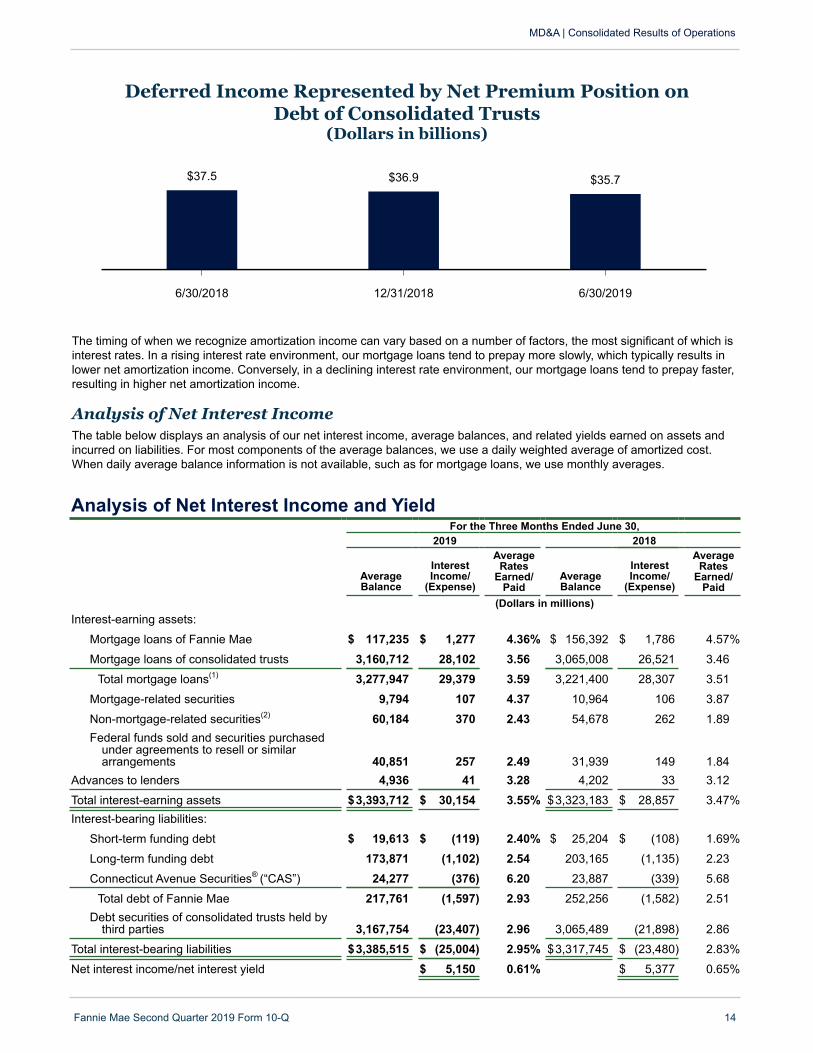
Deferred Income Represented by Net Premium Position onDebt of Consolidated Trusts
(Dollars in billions)
6/30/2018 12/31/2018 6/30/2019
$37.5 $36.9 $35.7
The timing of when we recognize amortization income can vary based on a number of factors, the most significant of which isinterest rates. In a rising interest rate environment, our mortgage loans tend to prepay more slowly, which typically results inlower net amortization income. Conversely, in a declining interest rate environment, our mortgage loans tend to prepay faster,resulting in higher net amortization income.
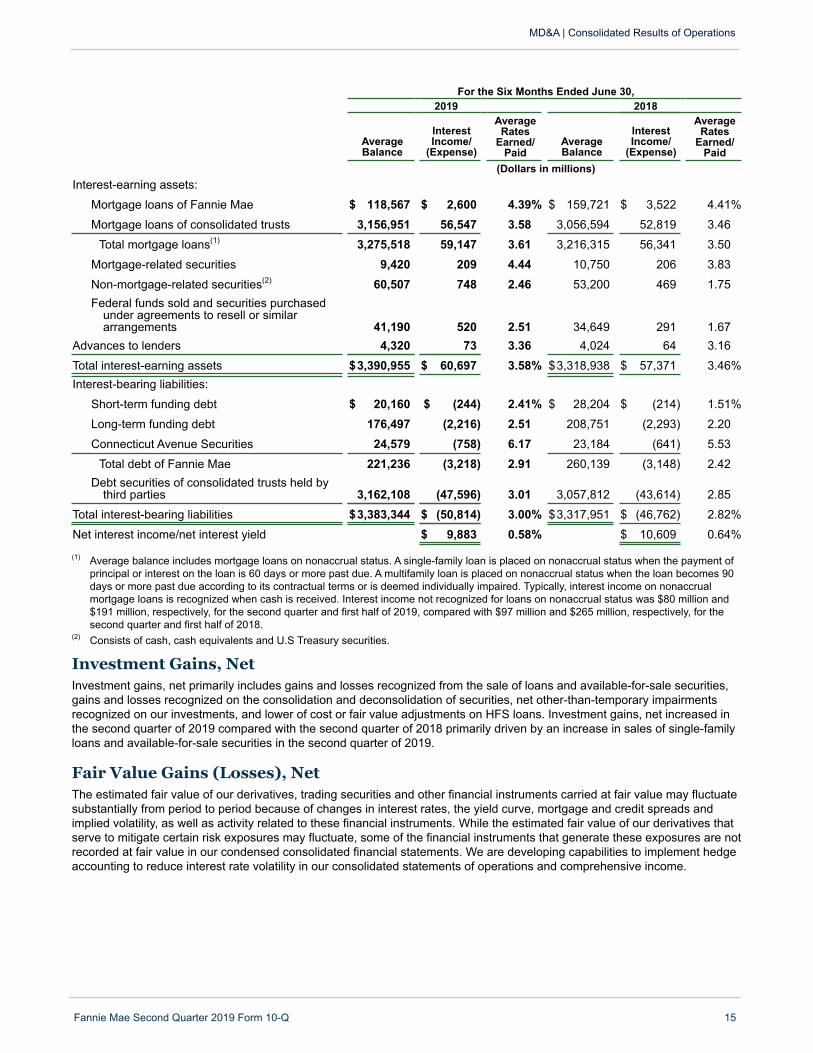
Analysis of Net Interest IncomeThe table below displays an analysis of our net interest income, average balances, and related yields earned on assets andincurred on liabilities. For most components of the average balances, we use a daily weighted average of amortized cost.When daily average balance information is not available, such as for mortgage loans, we use monthly averages.
Analysis of Net Interest Income and YieldFor the Three Months Ended June 30,
2019 2018
AverageBalance
InterestIncome/
(Expense)
AverageRates
Earned/Paid
AverageBalance
InterestIncome/
(Expense)
AverageRates
Earned/Paid
(Dollars in millions)Interest-earning assets:
Mortgage loans of Fannie Mae $ 117,235 $ 1,277 4.36% $ 156,392 $ 1,786 4.57%
Mortgage loans of consolidated trusts 3,160,712 28,102 3.56 3,065,008 26,521 3.46
Total mortgage loans(1) 3,277,947 29,379 3.59 3,221,400 28,307 3.51
Mortgage-related securities 9,794 107 4.37 10,964 106 3.87
Non-mortgage-related securities(2) 60,184 370 2.43 54,678 262 1.89Federal funds sold and securities purchased
under agreements to resell or similararrangements 40,851 257 2.49 31,939 149 1.84
Advances to lenders 4,936 41 3.28 4,202 33 3.12
Total interest-earning assets $3,393,712 $ 30,154 3.55% $3,323,183 $ 28,857 3.47%Interest-bearing liabilities:
Short-term funding debt $ 19,613 $ (119) 2.40% $ 25,204 $ (108) 1.69%
Long-term funding debt 173,871 (1,102) 2.54 203,165 (1,135) 2.23
Connecticut Avenue Securities® (“CAS”) 24,277 (376) 6.20 23,887 (339) 5.68
Total debt of Fannie Mae 217,761 (1,597) 2.93 252,256 (1,582) 2.51Debt securities of consolidated trusts held by
third parties 3,167,754 (23,407) 2.96 3,065,489 (21,898) 2.86
Total interest-bearing liabilities $3,385,515 $ (25,004) 2.95% $3,317,745 $ (23,480) 2.83%
Net interest income/net interest yield $ 5,150 0.61% $ 5,377 0.65%
MD&A | Consolidated Results of Operations
Fannie Mae Second Quarter 2019 Form 10-Q 14
For the Six Months Ended June 30,2019 2018
AverageBalance
InterestIncome/
(Expense)
AverageRates
Earned/Paid
AverageBalance
InterestIncome/
(Expense)
AverageRates
Earned/Paid
(Dollars in millions)Interest-earning assets:
Mortgage loans of Fannie Mae $ 118,567 $ 2,600 4.39% $ 159,721 $ 3,522 4.41%
Mortgage loans of consolidated trusts 3,156,951 56,547 3.58 3,056,594 52,819 3.46
Total mortgage loans(1) 3,275,518 59,147 3.61 3,216,315 56,341 3.50
Mortgage-related securities 9,420 209 4.44 10,750 206 3.83
Non-mortgage-related securities(2) 60,507 748 2.46 53,200 469 1.75Federal funds sold and securities purchased
under agreements to resell or similararrangements 41,190 520 2.51 34,649 291 1.67
Advances to lenders 4,320 73 3.36 4,024 64 3.16
Total interest-earning assets $3,390,955 $ 60,697 3.58% $3,318,938 $ 57,371 3.46%Interest-bearing liabilities:
Short-term funding debt $ 20,160 $ (244) 2.41% $ 28,204 $ (214) 1.51%
Long-term funding debt 176,497 (2,216) 2.51 208,751 (2,293) 2.20
Connecticut Avenue Securities 24,579 (758) 6.17 23,184 (641) 5.53
Total debt of Fannie Mae 221,236 (3,218) 2.91 260,139 (3,148) 2.42Debt securities of consolidated trusts held by
third parties 3,162,108 (47,596) 3.01 3,057,812 (43,614) 2.85
Total interest-bearing liabilities $3,383,344 $ (50,814) 3.00% $3,317,951 $ (46,762) 2.82%
Net interest income/net interest yield $ 9,883 0.58% $ 10,609 0.64%
(1) Average balance includes mortgage loans on nonaccrual status. A single-family loan is placed on nonaccrual status when the payment ofprincipal or interest on the loan is 60 days or more past due. A multifamily loan is placed on nonaccrual status when the loan becomes 90days or more past due according to its contractual terms or is deemed individually impaired. Typically, interest income on nonaccrualmortgage loans is recognized when cash is received. Interest income not recognized for loans on nonaccrual status was $80 million and$191 million, respectively, for the second quarter and first half of 2019, compared with $97 million and $265 million, respectively, for thesecond quarter and first half of 2018.
(2) Consists of cash, cash equivalents and U.S Treasury securities.
MD&A | Consolidated Results of Operations
Fannie Mae Second Quarter 2019 Form 10-Q 15
Investment Gains, NetInvestment gains, net primarily includes gains and losses recognized from the sale of loans and available-for-sale securities,gains and losses recognized on the consolidation and deconsolidation of securities, net other-than-temporary impairmentsrecognized on our investments, and lower of cost or fair value adjustments on HFS loans. Investment gains, net increased inthe second quarter of 2019 compared with the second quarter of 2018 primarily driven by an increase in sales of single-familyloans and available-for-sale securities in the second quarter of 2019.
Fair Value Gains (Losses), Net The estimated fair value of our derivatives, trading securities and other financial instruments carried at fair value may fluctuatesubstantially from period to period because of changes in interest rates, the yield curve, mortgage and credit spreads andimplied volatility, as well as activity related to these financial instruments. While the estimated fair value of our derivatives thatserve to mitigate certain risk exposures may fluctuate, some of the financial instruments that generate these exposures are notrecorded at fair value in our condensed consolidated financial statements. We are developing capabilities to implement hedgeaccounting to reduce interest rate volatility in our consolidated statements of operations and comprehensive income.
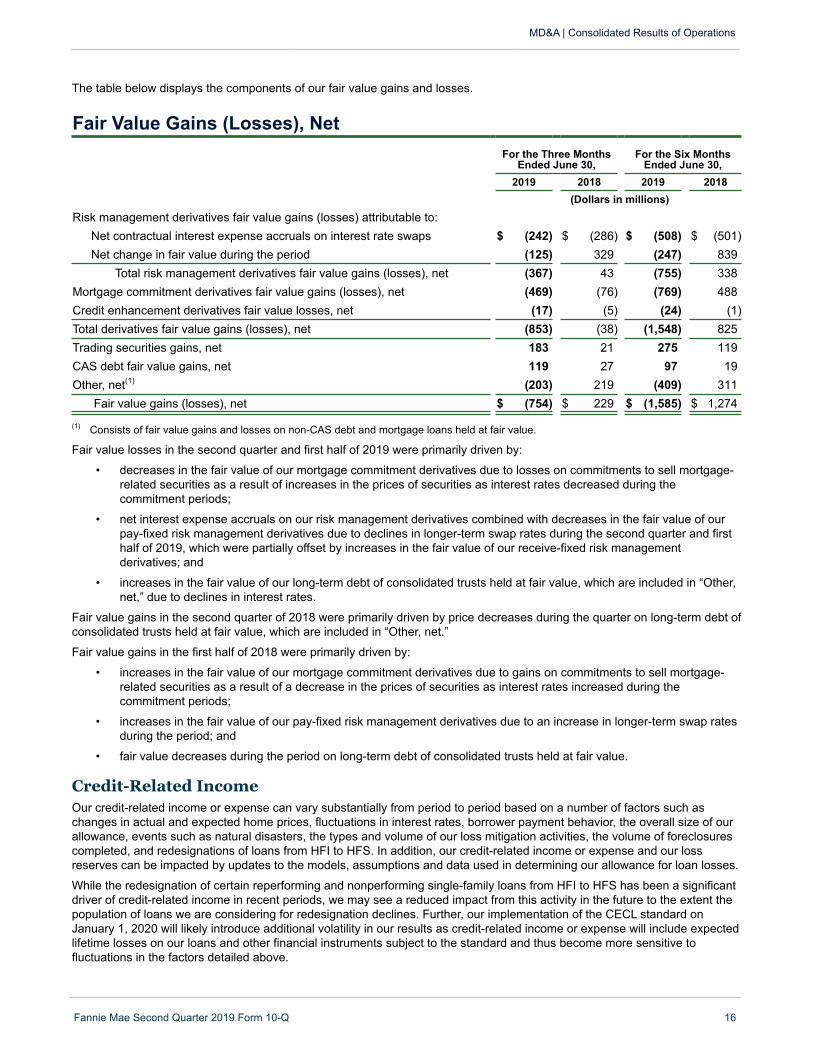
The table below displays the components of our fair value gains and losses.
Fair Value Gains (Losses), NetFor the Three Months
Ended June 30,For the Six Months
Ended June 30,2019 2018 2019 2018
(Dollars in millions)Risk management derivatives fair value gains (losses) attributable to:
Net contractual interest expense accruals on interest rate swaps $ (242) $ (286) $ (508) $ (501)Net change in fair value during the period (125) 329 (247) 839
Total risk management derivatives fair value gains (losses), net (367) 43 (755) 338Mortgage commitment derivatives fair value gains (losses), net (469) (76) (769) 488Credit enhancement derivatives fair value losses, net (17) (5) (24) (1)Total derivatives fair value gains (losses), net (853) (38) (1,548) 825Trading securities gains, net 183 21 275 119CAS debt fair value gains, net 119 27 97 19Other, net(1) (203) 219 (409) 311
Fair value gains (losses), net $ (754) $ 229 $ (1,585) $ 1,274
(1) Consists of fair value gains and losses on non-CAS debt and mortgage loans held at fair value.
Fair value losses in the second quarter and first half of 2019 were primarily driven by:
• decreases in the fair value of our mortgage commitment derivatives due to losses on commitments to sell mortgage-related securities as a result of increases in the prices of securities as interest rates decreased during thecommitment periods;
• net interest expense accruals on our risk management derivatives combined with decreases in the fair value of ourpay-fixed risk management derivatives due to declines in longer-term swap rates during the second quarter and firsthalf of 2019, which were partially offset by increases in the fair value of our receive-fixed risk managementderivatives; and
• increases in the fair value of our long-term debt of consolidated trusts held at fair value, which are included in “Other,net,” due to declines in interest rates.
Fair value gains in the second quarter of 2018 were primarily driven by price decreases during the quarter on long-term debt ofconsolidated trusts held at fair value, which are included in “Other, net.”
Fair value gains in the first half of 2018 were primarily driven by:
• increases in the fair value of our mortgage commitment derivatives due to gains on commitments to sell mortgage-related securities as a result of a decrease in the prices of securities as interest rates increased during thecommitment periods;
• increases in the fair value of our pay-fixed risk management derivatives due to an increase in longer-term swap ratesduring the period; and
• fair value decreases during the period on long-term debt of consolidated trusts held at fair value.
MD&A | Consolidated Results of Operations
Fannie Mae Second Quarter 2019 Form 10-Q 16
Credit-Related IncomeOur credit-related income or expense can vary substantially from period to period based on a number of factors such aschanges in actual and expected home prices, fluctuations in interest rates, borrower payment behavior, the overall size of ourallowance, events such as natural disasters, the types and volume of our loss mitigation activities, the volume of foreclosurescompleted, and redesignations of loans from HFI to HFS. In addition, our credit-related income or expense and our lossreserves can be impacted by updates to the models, assumptions and data used in determining our allowance for loan losses.
While the redesignation of certain reperforming and nonperforming single-family loans from HFI to HFS has been a significantdriver of credit-related income in recent periods, we may see a reduced impact from this activity in the future to the extent thepopulation of loans we are considering for redesignation declines. Further, our implementation of the CECL standard onJanuary 1, 2020 will likely introduce additional volatility in our results as credit-related income or expense will include expectedlifetime losses on our loans and other financial instruments subject to the standard and thus become more sensitive tofluctuations in the factors detailed above.
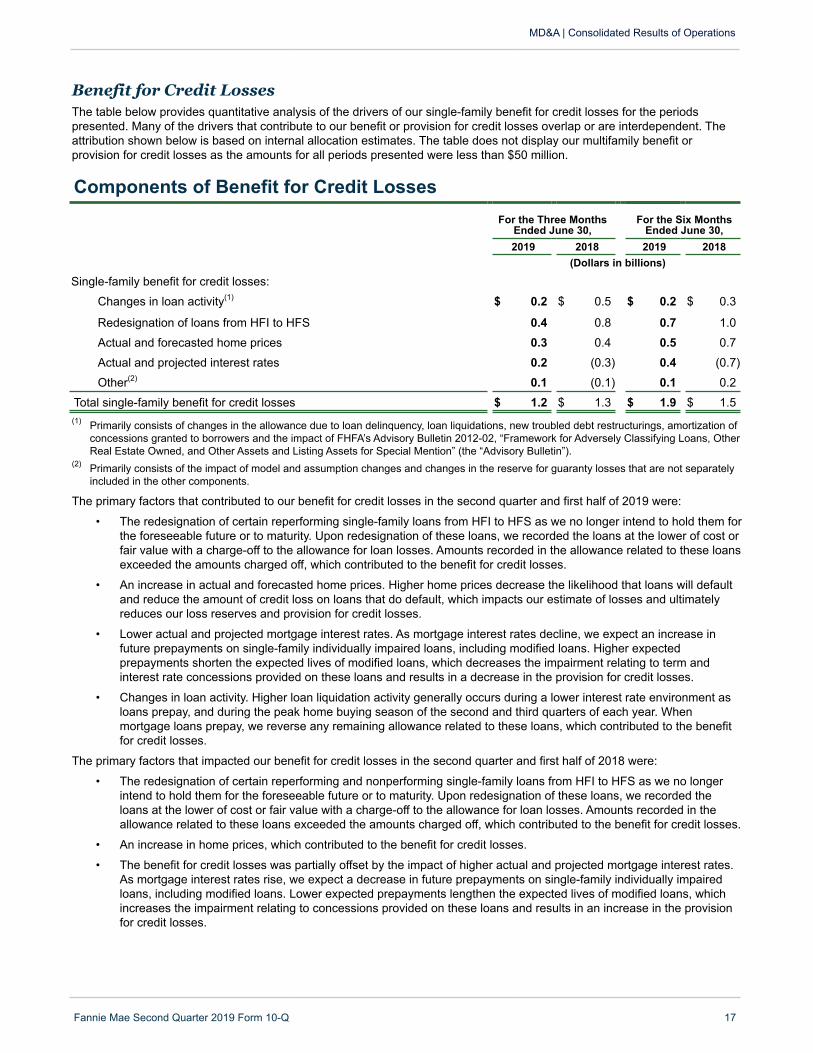
Benefit for Credit LossesThe table below provides quantitative analysis of the drivers of our single-family benefit for credit losses for the periodspresented. Many of the drivers that contribute to our benefit or provision for credit losses overlap or are interdependent. Theattribution shown below is based on internal allocation estimates. The table does not display our multifamily benefit orprovision for credit losses as the amounts for all periods presented were less than $50 million.
Components of Benefit for Credit LossesFor the Three Months
Ended June 30,For the Six Months
Ended June 30,2019 2018 2019 2018
(Dollars in billions)
Single-family benefit for credit losses:
Changes in loan activity(1) $ 0.2 $ 0.5 $ 0.2 $ 0.3
Redesignation of loans from HFI to HFS 0.4 0.8 0.7 1.0
Actual and forecasted home prices 0.3 0.4 0.5 0.7
Actual and projected interest rates 0.2 (0.3) 0.4 (0.7)
Other(2) 0.1 (0.1) 0.1 0.2
Total single-family benefit for credit losses $ 1.2 $ 1.3 $ 1.9 $ 1.5(1) Primarily consists of changes in the allowance due to loan delinquency, loan liquidations, new troubled debt restructurings, amortization of
concessions granted to borrowers and the impact of FHFA’s Advisory Bulletin 2012-02, “Framework for Adversely Classifying Loans, OtherReal Estate Owned, and Other Assets and Listing Assets for Special Mention” (the “Advisory Bulletin”).
(2) Primarily consists of the impact of model and assumption changes and changes in the reserve for guaranty losses that are not separatelyincluded in the other components.
The primary factors that contributed to our benefit for credit losses in the second quarter and first half of 2019 were:
• The redesignation of certain reperforming single-family loans from HFI to HFS as we no longer intend to hold them forthe foreseeable future or to maturity. Upon redesignation of these loans, we recorded the loans at the lower of cost orfair value with a charge-off to the allowance for loan losses. Amounts recorded in the allowance related to these loansexceeded the amounts charged off, which contributed to the benefit for credit losses.
• An increase in actual and forecasted home prices. Higher home prices decrease the likelihood that loans will defaultand reduce the amount of credit loss on loans that do default, which impacts our estimate of losses and ultimatelyreduces our loss reserves and provision for credit losses.
• Lower actual and projected mortgage interest rates. As mortgage interest rates decline, we expect an increase infuture prepayments on single-family individually impaired loans, including modified loans. Higher expectedprepayments shorten the expected lives of modified loans, which decreases the impairment relating to term andinterest rate concessions provided on these loans and results in a decrease in the provision for credit losses.
• Changes in loan activity. Higher loan liquidation activity generally occurs during a lower interest rate environment asloans prepay, and during the peak home buying season of the second and third quarters of each year. Whenmortgage loans prepay, we reverse any remaining allowance related to these loans, which contributed to the benefitfor credit losses.
The primary factors that impacted our benefit for credit losses in the second quarter and first half of 2018 were:
• The redesignation of certain reperforming and nonperforming single-family loans from HFI to HFS as we no longerintend to hold them for the foreseeable future or to maturity. Upon redesignation of these loans, we recorded theloans at the lower of cost or fair value with a charge-off to the allowance for loan losses. Amounts recorded in theallowance related to these loans exceeded the amounts charged off, which contributed to the benefit for credit losses.
• An increase in home prices, which contributed to the benefit for credit losses.
• The benefit for credit losses was partially offset by the impact of higher actual and projected mortgage interest rates.As mortgage interest rates rise, we expect a decrease in future prepayments on single-family individually impairedloans, including modified loans. Lower expected prepayments lengthen the expected lives of modified loans, whichincreases the impairment relating to concessions provided on these loans and results in an increase in the provisionfor credit losses.
MD&A | Consolidated Results of Operations
Fannie Mae Second Quarter 2019 Form 10-Q 17
TCCA Fees Pursuant to the TCCA, in 2012 FHFA directed us to increase our single-family guaranty fees by 10 basis points and remit thisincrease to Treasury. This TCCA-related revenue is included in “Net interest income” and the expense is recognized as “TCCAfees” in our condensed consolidated financial statements. TCCA fees increased in the first half of 2019 compared with the firsthalf of 2018 as our book of business subject to the TCCA continued to grow. We expect the guaranty fees collected andexpenses incurred under the TCCA to continue to increase.
Other Expenses, Net Other expenses, net primarily consist of credit enhancement and mortgage insurance expenses, debt extinguishment gainsand losses, housing trust fund expenses, loan subservicing costs and multifamily fees. Other expenses, net increased in thesecond quarter and first half of 2019 compared with the second quarter and first half of 2018 primarily due to an increase incredit enhancement costs resulting from higher volumes of credit risk transfer transactions. We expect our credit enhancementexpenses to continue to rise as the percentage of our guaranty book of business on which we have transferred a portion ofcredit risk continues to increase. We discuss transfer of mortgage credit risk in “MD&A—Single-Family Business—Single-Family Mortgage Credit Risk Management—Single-Family Credit Enhancement and Transfer of Mortgage Credit Risk” and“MD&A—Multifamily Business—Multifamily Mortgage Credit Risk Management—Transfer of Multifamily Mortgage Credit Risk.”
MD&A | Consolidated Results of Operations
Fannie Mae Second Quarter 2019 Form 10-Q 18
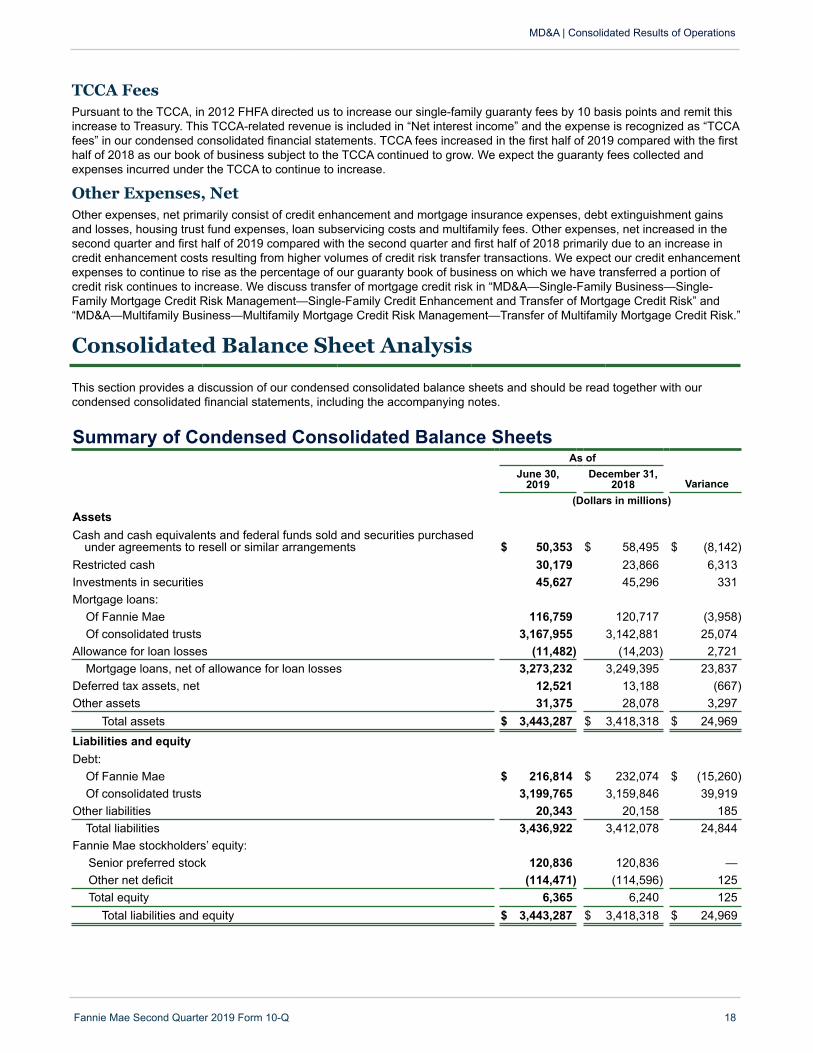
Consolidated Balance Sheet Analysis
This section provides a discussion of our condensed consolidated balance sheets and should be read together with ourcondensed consolidated financial statements, including the accompanying notes.
Summary of Condensed Consolidated Balance SheetsAs of
June 30,2019
December 31,2018 Variance
(Dollars in millions)Assets
Cash and cash equivalents and federal funds sold and securities purchasedunder agreements to resell or similar arrangements $ 50,353 $ 58,495 $ (8,142)
Restricted cash 30,179 23,866 6,313Investments in securities 45,627 45,296 331Mortgage loans:
Of Fannie Mae 116,759 120,717 (3,958)Of consolidated trusts 3,167,955 3,142,881 25,074
Allowance for loan losses (11,482) (14,203) 2,721Mortgage loans, net of allowance for loan losses 3,273,232 3,249,395 23,837
Deferred tax assets, net 12,521 13,188 (667)Other assets 31,375 28,078 3,297
Total assets $ 3,443,287 $ 3,418,318 $ 24,969
Liabilities and equityDebt:
Of Fannie Mae $ 216,814 $ 232,074 $ (15,260)Of consolidated trusts 3,199,765 3,159,846 39,919
Other liabilities 20,343 20,158 185Total liabilities 3,436,922 3,412,078 24,844
Fannie Mae stockholders’ equity:Senior preferred stock 120,836 120,836 —Other net deficit (114,471) (114,596) 125Total equity 6,365 6,240 125
Total liabilities and equity $ 3,443,287 $ 3,418,318 $ 24,969
Mortgage Loans, Net of Allowance for Loan Losses The mortgage loans reported in our condensed consolidated balance sheet are classified as either HFS or HFI and includeloans owned by Fannie Mae and loans held in consolidated trusts.
Mortgage loans, net of allowance for loan losses increased as of June 30, 2019 compared with December 31, 2018 primarilydriven by:
• an increase in mortgage loans due to acquisitions outpacing liquidations and sales; and
• a decrease in our allowance for loan losses primarily driven by the redesignation of certain nonperforming andreperforming single-family loans from HFI to HFS.
For additional information on our mortgage loans, see “Note 3, Mortgage Loans,” and for additional information on changes inour allowance for loan losses, see “Note 4, Allowance for Loan Losses.”
Other Assets The increase in other assets from December 31, 2018 to June 30, 2019 was primarily driven by an increase in advances tolenders. As interest rates declined in the second quarter of 2019, mortgage origination activity increased, resulting in higherfunding needs by lenders. For information on our accounting policy for advances to lenders, refer to “Note 1, Summary ofSignificant Accounting Policies” in our 2018 Form 10-K.
Debt The decrease in debt of Fannie Mae from December 31, 2018 to June 30, 2019 was primarily driven by lower funding needs,as our retained mortgage portfolio continued to decline. We did not replace all of our debt of Fannie Mae that paid off duringthe first half of 2019 with new debt issuances. The increase in debt of consolidated trusts from December 31, 2018 to June 30,2019 was primarily driven by sales of Fannie Mae MBS, which are accounted for as issuances of debt of consolidated trusts inour condensed consolidated balance sheets, since the MBS certificate ownership is transferred from us to a third party. See“MD&A—Liquidity and Capital Management—Liquidity Management—Debt Funding” for a summary of the activity of the debtof Fannie Mae and a comparison of the mix between our outstanding short-term and long-term debt. Also see “Note 7, Short-Term and Long-Term Debt” for additional information on our outstanding debt.
Stockholders’ EquityOur net equity increased as of June 30, 2019 compared with December 31, 2018 due to our comprehensive incomerecognized during the first half of 2019, partially offset by our payments of senior preferred stock dividends to Treasury duringthe first half of 2019.
MD&A | Consolidated Balance Sheet Analysis
Fannie Mae Second Quarter 2019 Form 10-Q 19
Retained Mortgage Portfolio
Our retained mortgage portfolio consists of mortgage loans and mortgage-related securities that we own, including FannieMae MBS and non-Fannie Mae mortgage-related securities. Assets held by consolidated MBS trusts that back mortgage-related securities owned by third parties are not included in our retained mortgage portfolio.
We use our retained mortgage portfolio primarily to provide liquidity to the mortgage market and support our loss mitigationactivities. Previously, we also used our retained mortgage portfolio for investment purposes.
The chart below separates the instruments within our retained mortgage portfolio, measured by unpaid principal balance, intothree categories based on each instrument’s use:
• Lender liquidity, which includes balances related to our whole loan conduit activity, supports our efforts to provideliquidity to the single-family and multifamily mortgage markets.
• Loss mitigation supports our loss mitigation efforts through the purchase of delinquent loans from our MBS trusts.
• Other represents assets that were previously purchased for investment purposes. More than half of the balance of“Other” as of June 30, 2019 consisted of Fannie Mae reverse mortgage securities and reverse mortgage loans. Weexpect the amount of assets in “Other” will continue to decline over time as they liquidate, mature or are sold.
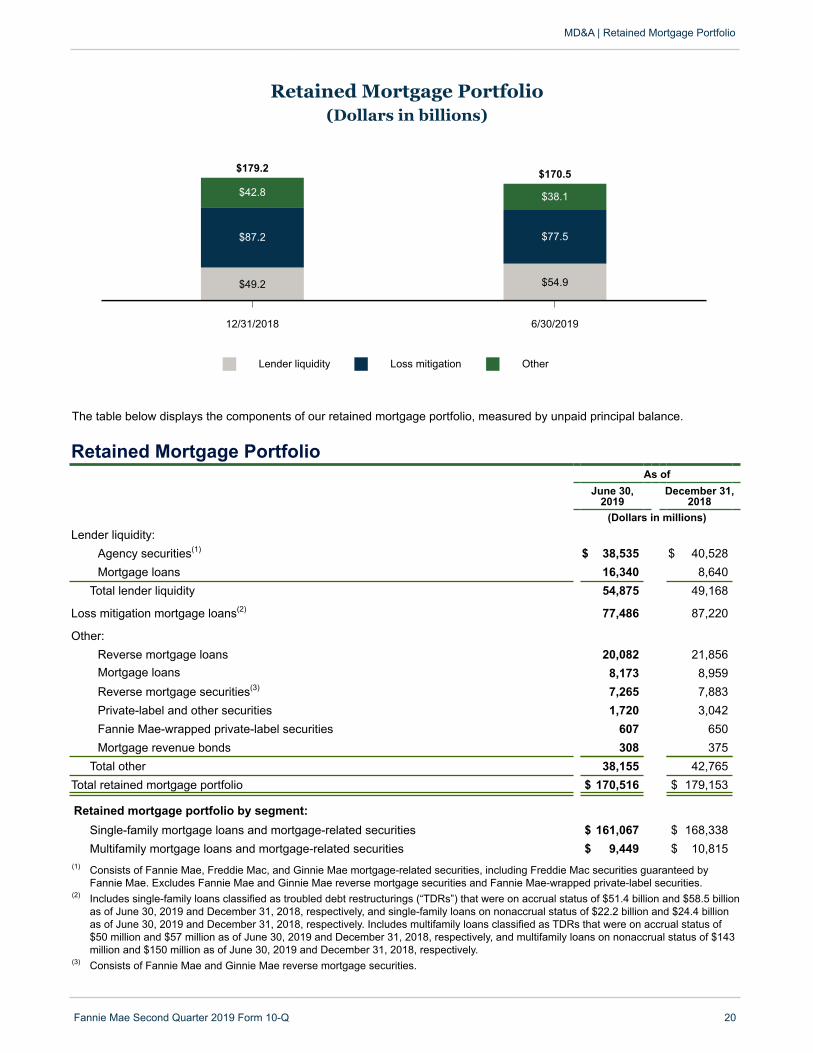
Retained Mortgage Portfolio(Dollars in billions)
Lender liquidity Loss mitigation Other
12/31/2018 6/30/2019
$49.2 $54.9
$87.2 $77.5
$42.8
$179.2
$38.1
$170.5
The table below displays the components of our retained mortgage portfolio, measured by unpaid principal balance.
Retained Mortgage PortfolioAs of
June 30,2019
December 31,2018
(Dollars in millions)Lender liquidity:
Agency securities(1) $ 38,535 $ 40,528Mortgage loans 16,340 8,640
Total lender liquidity 54,875 49,168
Loss mitigation mortgage loans(2) 77,486 87,220
Other:Reverse mortgage loans 20,082 21,856Mortgage loans 8,173 8,959Reverse mortgage securities(3) 7,265 7,883Private-label and other securities 1,720 3,042Fannie Mae-wrapped private-label securities 607 650Mortgage revenue bonds 308 375
Total other 38,155 42,765Total retained mortgage portfolio $ 170,516 $ 179,153
Retained mortgage portfolio by segment:Single-family mortgage loans and mortgage-related securities $ 161,067 $ 168,338Multifamily mortgage loans and mortgage-related securities $ 9,449 $ 10,815
(1) Consists of Fannie Mae, Freddie Mac, and Ginnie Mae mortgage-related securities, including Freddie Mac securities guaranteed byFannie Mae. Excludes Fannie Mae and Ginnie Mae reverse mortgage securities and Fannie Mae-wrapped private-label securities.
(2) Includes single-family loans classified as troubled debt restructurings (“TDRs”) that were on accrual status of $51.4 billion and $58.5 billionas of June 30, 2019 and December 31, 2018, respectively, and single-family loans on nonaccrual status of $22.2 billion and $24.4 billionas of June 30, 2019 and December 31, 2018, respectively. Includes multifamily loans classified as TDRs that were on accrual status of$50 million and $57 million as of June 30, 2019 and December 31, 2018, respectively, and multifamily loans on nonaccrual status of $143million and $150 million as of June 30, 2019 and December 31, 2018, respectively.
(3) Consists of Fannie Mae and Ginnie Mae reverse mortgage securities.
MD&A | Retained Mortgage Portfolio
Fannie Mae Second Quarter 2019 Form 10-Q 20
The amount of mortgage assets that we may own is capped at $250 billion by our senior preferred stock purchase agreementwith Treasury, and FHFA has directed that we further cap our mortgage assets at $225 billion, as described in “Business—Conservatorship, Treasury Agreements and Housing Finance Reform—Treasury Agreements” in our 2018 Form 10-K. Weexpect our retained mortgage portfolio to remain below the $225 billion cap directed by FHFA.
MD&A | Retained Mortgage Portfolio
Fannie Mae Second Quarter 2019 Form 10-Q 21
In support of our loss mitigation strategy, we purchased $5.3 billion of loans from our single-family MBS trusts in the first half of2019, the substantial majority of which were delinquent. See “MD&A—Retained Mortgage Portfolio—Purchases of Loans fromOur MBS Trusts” in our 2018 Form 10-K for more information relating to our purchases of loans from MBS trusts. As noted in“Single Security Initiative & Common Securitization Platform,” we began issuing UMBS and structured securities backed byUMBS in June 2019. Accordingly, going forward, we expect that our resecuritization trusts will include Freddie Mac-issuedUMBS. Because the underlying mortgage loans that back Freddie Mac-issued UMBS are not in Fannie Mae MBS trusts, wedo not have the right to purchase those mortgage loans upon their becoming delinquent.
Guaranty Book of Business
Our “guaranty book of business” consists of:
• Fannie Mae MBS outstanding, excluding the portions of any structured securities we issue that are backed byFreddie Mac securities;
• mortgage loans of Fannie Mae held in our retained mortgage portfolio; and
• other credit enhancements that we provide on mortgage assets.
“Total Fannie Mae guarantees” consists of:
• our guaranty book of business; and
• the portions of any structured securities we issue that are backed by Freddie Mac securities.
When we resecuritize Freddie Mac securities into Fannie Mae-issued structured securities, our guaranty of principal andinterest extends to the underlying Freddie Mac securities. However, Freddie Mac continues to guaranty the payment ofprincipal and interest on the underlying Freddie Mac securities that we have resecuritized. We do not charge an incrementalguaranty fee to include Freddie Mac securities in the structured securities that we issue.
The table below displays the composition of our guaranty book of business based on unpaid principal balance. Our single-family guaranty book of business accounted for 90% of our guaranty book of business as of June 30, 2019 and 91% of ourguaranty book of business as of December 31, 2018.
Composition of Fannie Mae Guaranty Book of Business(1)
As ofJune 30, 2019 December 31, 2018
Single-Family Multifamily Total
Single-Family Multifamily Total
(Dollars in millions)
Conventional guaranty book of business(2) $ 2,941,955 $ 324,944 $ 3,266,899 $ 2,925,246 $ 308,543 $ 3,233,789
Government guaranty book of business(3) 31,372 1,160 32,532 34,158 1,205 35,363
Guaranty book of business 2,973,327 326,104 3,299,431 2,959,404 309,748 3,269,152
Freddie Mac securities guaranteed by FannieMae(4) 7,718 — 7,718 — — —
Total Fannie Mae guarantees $ 2,981,045 $ 326,104 $ 3,307,149 $ 2,959,404 $ 309,748 $ 3,269,152
(1) Includes other single-family Fannie Mae guaranty arrangements of $1.4 billion and $1.6 billion as of June 30, 2019 and December 31,2018, respectively, and other multifamily Fannie Mae guaranty arrangements of $12.0 billion and $12.3 billion as of June 30, 2019 andDecember 31, 2018, respectively. The unpaid principal balance of resecuritized Fannie Mae MBS is included only once in the reportedamount.
(2) Refers to mortgage loans and mortgage-related securities that are not guaranteed or insured, in whole or in part, by the U.S. government.(3) Refers to mortgage loans and mortgage-related securities guaranteed or insured, in whole or in part, by the U.S. government. (4) Consists of (1) $5.7 billion in unpaid principal balance of Freddie Mac-issued UMBS backing Fannie Mae-issued Supers; and (2) $2.0
billion in unpaid principal balance of Freddie Mac securities backing Fannie Mae-issued REMICs; however, a portion of these Freddie Macsecurities may be backed in whole or in part by Fannie Mae MBS. Therefore, our total exposure to Freddie Mac securities included inFannie Mae REMIC collateral may be lower.

The Federal Housing Enterprises Financial Safety and Soundness Act of 1992, as amended, including by the Federal HousingFinance Regulatory Reform Act of 2008 (together, the “GSE Act”) requires us to set aside each year an amount equal to 4.2basis points of the unpaid principal balance of our total new business purchases and to pay this amount to specified HUD andTreasury funds. In April 2019, we paid $215 million to the funds based on our new business purchases in 2018. For the firsthalf of 2019, we recognized an expense of $104 million related to this obligation based on our $247.4 billion in new businesspurchases during the period. We expect to pay this amount to the funds in 2020, plus additional amounts to be accrued basedon our new business purchases in the second half of 2019. See “MD&A—Legislation and Regulation—Affordable HousingAllocations” in our First Quarter 2019 Form 10-Q for more information regarding this obligation.
MD&A | Guaranty Book of Business
Fannie Mae Second Quarter 2019 Form 10-Q 22
Business Segments
We have two reportable business segments: Single-Family and Multifamily. The Single-Family business operates in thesecondary mortgage market relating to single-family mortgage loans, which are secured by properties containing four or fewerresidential dwelling units. The Multifamily business operates in the secondary mortgage market relating primarily to multifamilymortgage loans, which are secured by properties containing five or more residential units.
The chart below displays the net revenues and net income for each of our business segments for the first half of 2018compared with the first half of 2019. Net revenues consist of net interest income and fee and other income.
Business Segment Net Revenues and Net Income(Dollars in billions)
Single-Family net revenues Multifamily net revenues
Single-Family net income Multifamily net income
First Half 2018 First Half 2019
$9.5 $8.7
$1.7
$11.2
$1.7
$10.4
$7.6
$4.7
$1.1$8.7
$1.1$5.8
Segment Allocation MethodologyThe majority of our revenues and expenses are directly associated with either our single-family or our multifamily businesssegment and are included in determining that segment’s operating results. Other revenues and expenses, includingadministrative expenses, that are not directly attributable to a particular business segment are allocated based on the size ofeach segment’s guaranty book of business. The substantial majority of the gains and losses associated with our riskmanagement derivatives are allocated to our single-family business segment.
In the following sections, we describe each segment’s business metrics and financial results. We also describe how eachsegment manages mortgage credit risk and its credit metrics.
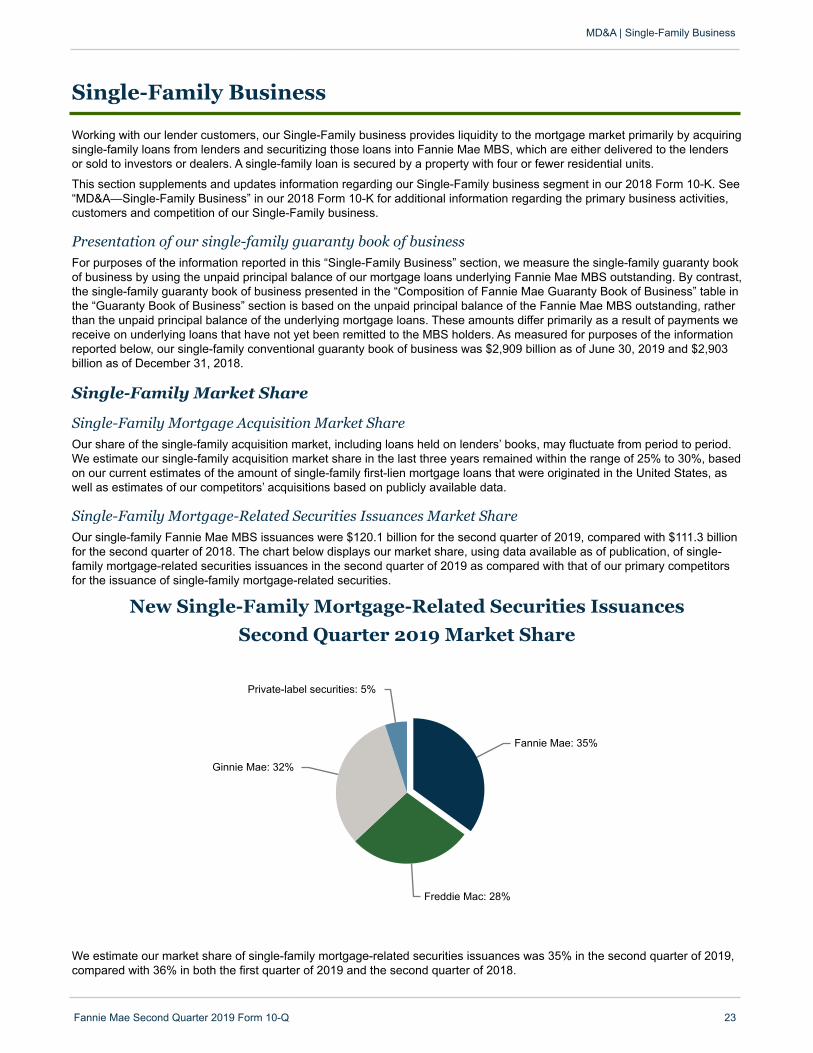
Single-Family Business
Working with our lender customers, our Single-Family business provides liquidity to the mortgage market primarily by acquiringsingle-family loans from lenders and securitizing those loans into Fannie Mae MBS, which are either delivered to the lendersor sold to investors or dealers. A single-family loan is secured by a property with four or fewer residential units.
This section supplements and updates information regarding our Single-Family business segment in our 2018 Form 10-K. See“MD&A—Single-Family Business” in our 2018 Form 10-K for additional information regarding the primary business activities,customers and competition of our Single-Family business.
Presentation of our single-family guaranty book of businessFor purposes of the information reported in this “Single-Family Business” section, we measure the single-family guaranty bookof business by using the unpaid principal balance of our mortgage loans underlying Fannie Mae MBS outstanding. By contrast,the single-family guaranty book of business presented in the “Composition of Fannie Mae Guaranty Book of Business” table inthe “Guaranty Book of Business” section is based on the unpaid principal balance of the Fannie Mae MBS outstanding, ratherthan the unpaid principal balance of the underlying mortgage loans. These amounts differ primarily as a result of payments wereceive on underlying loans that have not yet been remitted to the MBS holders. As measured for purposes of the informationreported below, our single-family conventional guaranty book of business was $2,909 billion as of June 30, 2019 and $2,903billion as of December 31, 2018.
MD&A | Single-Family Business
Fannie Mae Second Quarter 2019 Form 10-Q 23
Single-Family Market Share
Single-Family Mortgage Acquisition Market ShareOur share of the single-family acquisition market, including loans held on lenders’ books, may fluctuate from period to period.We estimate our single-family acquisition market share in the last three years remained within the range of 25% to 30%, basedon our current estimates of the amount of single-family first-lien mortgage loans that were originated in the United States, aswell as estimates of our competitors’ acquisitions based on publicly available data.
Single-Family Mortgage-Related Securities Issuances Market ShareOur single-family Fannie Mae MBS issuances were $120.1 billion for the second quarter of 2019, compared with $111.3 billionfor the second quarter of 2018. The chart below displays our market share, using data available as of publication, of single-family mortgage-related securities issuances in the second quarter of 2019 as compared with that of our primary competitorsfor the issuance of single-family mortgage-related securities.
New Single-Family Mortgage-Related Securities Issuances
Second Quarter 2019 Market Share
Fannie Mae: 35%
Freddie Mac: 28%
Ginnie Mae: 32%
Private-label securities: 5%
We estimate our market share of single-family mortgage-related securities issuances was 35% in the second quarter of 2019,compared with 36% in both the first quarter of 2019 and the second quarter of 2018.
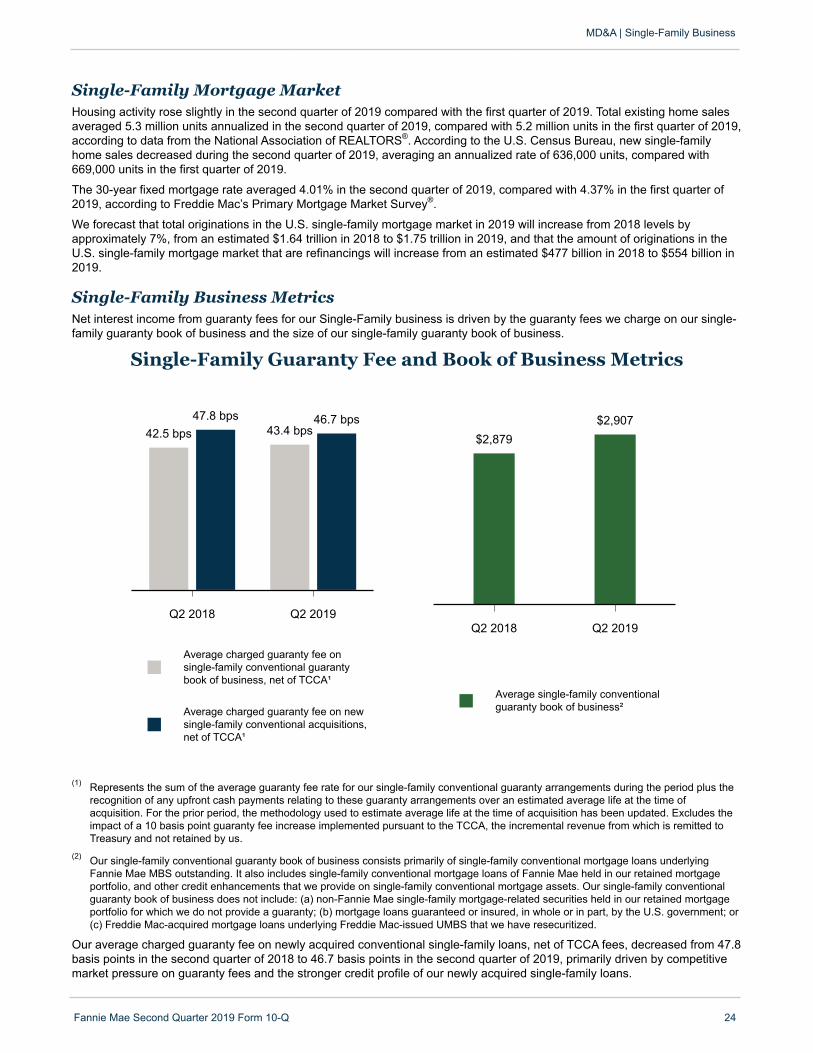
Single-Family Mortgage MarketHousing activity rose slightly in the second quarter of 2019 compared with the first quarter of 2019. Total existing home salesaveraged 5.3 million units annualized in the second quarter of 2019, compared with 5.2 million units in the first quarter of 2019,according to data from the National Association of REALTORS®. According to the U.S. Census Bureau, new single-familyhome sales decreased during the second quarter of 2019, averaging an annualized rate of 636,000 units, compared with669,000 units in the first quarter of 2019.
The 30-year fixed mortgage rate averaged 4.01% in the second quarter of 2019, compared with 4.37% in the first quarter of2019, according to Freddie Mac’s Primary Mortgage Market Survey®.
We forecast that total originations in the U.S. single-family mortgage market in 2019 will increase from 2018 levels byapproximately 7%, from an estimated $1.64 trillion in 2018 to $1.75 trillion in 2019, and that the amount of originations in theU.S. single-family mortgage market that are refinancings will increase from an estimated $477 billion in 2018 to $554 billion in2019.
MD&A | Single-Family Business
Fannie Mae Second Quarter 2019 Form 10-Q 24
Single-Family Business Metrics Net interest income from guaranty fees for our Single-Family business is driven by the guaranty fees we charge on our single-family guaranty book of business and the size of our single-family guaranty book of business.
Single-Family Guaranty Fee and Book of Business Metrics
Average charged guaranty fee onsingle-family conventional guarantybook of business, net of TCCA¹
Average charged guaranty fee on newsingle-family conventional acquisitions,net of TCCA¹
Q2 2018 Q2 2019
42.5 bps 43.4 bps47.8 bps 46.7 bps
Average single-family conventionalguaranty book of business²
Q2 2018 Q2 2019
$2,879$2,907
(1) Represents the sum of the average guaranty fee rate for our single-family conventional guaranty arrangements during the period plus therecognition of any upfront cash payments relating to these guaranty arrangements over an estimated average life at the time ofacquisition. For the prior period, the methodology used to estimate average life at the time of acquisition has been updated. Excludes theimpact of a 10 basis point guaranty fee increase implemented pursuant to the TCCA, the incremental revenue from which is remitted toTreasury and not retained by us.
(2) Our single-family conventional guaranty book of business consists primarily of single-family conventional mortgage loans underlyingFannie Mae MBS outstanding. It also includes single-family conventional mortgage loans of Fannie Mae held in our retained mortgageportfolio, and other credit enhancements that we provide on single-family conventional mortgage assets. Our single-family conventionalguaranty book of business does not include: (a) non-Fannie Mae single-family mortgage-related securities held in our retained mortgageportfolio for which we do not provide a guaranty; (b) mortgage loans guaranteed or insured, in whole or in part, by the U.S. government; or(c) Freddie Mac-acquired mortgage loans underlying Freddie Mac-issued UMBS that we have resecuritized.
Our average charged guaranty fee on newly acquired conventional single-family loans, net of TCCA fees, decreased from 47.8basis points in the second quarter of 2018 to 46.7 basis points in the second quarter of 2019, primarily driven by competitivemarket pressure on guaranty fees and the stronger credit profile of our newly acquired single-family loans.
Single-Family Business Financial Results
For the Three MonthsEnded June 30,
For the Six MonthsEnded June 30,
2019 2018 Variance 2019 2018 Variance(Dollars in millions)
Net interest income(1) $ 4,419 $ 4,723 $ (304) $ 8,458 $ 9,284 $ (826)
Fee and other income 88 69 19 194 227 (33)
Net revenues 4,507 4,792 (285) 8,652 9,511 (859)
Investment gains, net 417 252 165 511 494 17
Fair value gains (losses), net (758) 278 (1,036) (1,645) 1,312 (2,957)
Administrative expenses (634) (649) 15 (1,265) (1,292) 27
Credit-related income(2) 1,126 1,159 (33) 1,644 1,193 451
TCCA fees(1) (600) (565) (35) (1,193) (1,122) (71)
Other expenses, net (418) (270) (148) (755) (402) (353)
Income before federal income taxes 3,640 4,997 (1,357) 5,949 9,694 (3,745)
Provision for federal income taxes (769) (1,044) 275 (1,253) (2,060) 807
Net income $ 2,871 $ 3,953 $ (1,082) $ 4,696 $ 7,634 $ (2,938)
(1) Reflects the impact of a 10 basis point guaranty fee increase implemented pursuant to the TCCA, the incremental revenue from which isremitted to Treasury. The resulting revenue is included in net interest income and the expense is recognized as “TCCA fees.”
(2) Consists of the benefit or provision for credit losses and foreclosed property income or expense.
Net interest incomeSingle-family net interest income decreased in the second quarter and first half of 2019 compared with the second quarter andfirst half of 2018, primarily due to a decline in net interest income from portfolios and a decline in net amortization income,partially offset by an increase in single-family base guaranty fee income. The drivers of net interest income for the single-familysegment for the second quarter and first half of 2019 are consistent with the drivers of net interest income discussed in ourcondensed consolidated statements of operations and comprehensive income, which we discuss in “Consolidated Results ofOperations—Net Interest Income.”
Fair value gains (losses), netFair value losses in the second quarter and first half of 2019 were primarily driven by decreases in the fair value of ourmortgage commitments and our pay-fixed risk management derivatives, and net interest expense accruals on our riskmanagement derivatives. In addition, increases in the fair value of our debt also resulted in fair value losses for the secondquarter and first half of 2019. Conversely, fair value gains in the second quarter of 2018 were primarily driven by pricedecreases on long-term debt of consolidated trusts held at fair value. Fair value gains in the first half of 2018 were primarilydriven by increases in the fair value of our mortgage commitments and our pay-fixed risk management derivatives anddecreases in fair value on long-term debt of consolidated trusts held at fair value.
The drivers of our fair value gains (losses), net for the single-family segment for all periods presented are consistent with thedrivers of fair value gains (losses), net in our condensed consolidated statements of operations and comprehensive income,which we discuss in “Consolidated Results of Operations—Fair Value Gains (Losses), Net.”
Credit-related incomeCredit-related income in the second quarter and first half of 2019 was primarily driven by the redesignation of certain single-family loans from HFI to HFS; an increase in actual and forecasted home prices; lower actual and projected mortgage interestrates; and changes in loan activity related to loan liquidations. Credit-related income in the second quarter and first half of2018 was primarily driven by the redesignation of certain single-family loans from HFI to HFS and an increase in actual andforecasted home prices. These factors were partially offset by the impact of higher actual and projected mortgage interestrates in the periods.
See “Consolidated Results of Operations—Credit-Related Income” in this report for more information on our credit-relatedincome.
MD&A | Single-Family Business
Fannie Mae Second Quarter 2019 Form 10-Q 25
Other expenses, netOther expenses, net increased in the second quarter and first half of 2019 compared with the second quarter and first half of2018, primarily due to an increase in credit enhancement costs resulting from higher volumes of credit risk transfertransactions. The drivers of other expenses, net for the single-family segment for the second quarter and first half of 2019 areconsistent with the drivers discussed in our condensed consolidated statements of operations and comprehensive income,which we discuss in “Consolidated Results of Operations—Other Expenses, net.”
MD&A | Single-Family Business
Fannie Mae Second Quarter 2019 Form 10-Q 26
Single-Family Mortgage Credit Risk ManagementThis section updates our discussion of single-family mortgage credit risk management in our 2018 Form 10-K. For informationon our acquisition and servicing policies, underwriting and servicing standards, quality control process, repurchase requests,and representation and warranty framework, see “MD&A—Single-Family Business—Single-Family Mortgage Credit RiskManagement” in our 2018 Form 10-K.
Single-Family Portfolio Diversification and Monitoring The profile of our single-family guaranty book of business includes the following key loan attributes:
• Loan-to-value ratio. Loan-to-value (“LTV”) ratio is a strong predictor of credit performance. The likelihood of default andthe gross severity of a loss in the event of default are typically lower as the LTV ratio decreases. This also applies tothe estimated mark-to-market LTV ratios, particularly those over 100%, as this indicates that the borrower’s mortgagebalance exceeds the property value.
• Product type. Certain loan product types have features that may result in increased risk. Generally, intermediate-term,fixed-rate mortgages exhibit the lowest default rates, followed by long-term, fixed-rate mortgages. Historically,adjustable-rate mortgages (“ARMs”), including negative-amortizing and interest-only loans, and balloon/resetmortgages have exhibited higher default rates than fixed-rate mortgages, partly because the borrower’s paymentsrose, within limits, as interest rates changed.
• Number of units. Mortgages on one-unit properties tend to have lower credit risk than mortgages on two-, three- orfour-unit properties.
• Property type. Certain property types have a higher risk of default. For example, condominiums generally areconsidered to have higher credit risk than single-family detached properties.
• Occupancy type. Mortgages on properties occupied by the borrower as a primary or secondary residence tend to havelower credit risk than mortgages on investment properties.
• Credit score. Credit score is a measure often used by the financial services industry, including us, to assess borrowercredit quality and the likelihood that a borrower will repay future obligations as expected. A higher credit score typicallyindicates lower credit risk.
• Debt-to-income ratio. Debt-to-income (“DTI”) ratio refers to the ratio of a borrower’s outstanding debt obligations(including both mortgage debt and certain other long-term and significant short-term debts) to that borrower’s reportedor calculated monthly income, to the extent the income is used to qualify for the mortgage. As a borrower’s DTI ratioincreases, the associated risk of default on the loan generally increases, especially if other higher-risk factors arepresent. From time to time, we revise our guidelines for determining a borrower’s DTI ratio. The amount of incomereported by a borrower and used to qualify for a mortgage may not represent the borrower’s total income; therefore,the DTI ratios we report may be higher than borrowers’ actual DTI ratios.
• Loan purpose. Loan purpose refers to how the borrower intends to use the funds from a mortgage loan—either for ahome purchase or refinancing of an existing mortgage. Cash-out refinancings have a higher risk of default than eithermortgage loans used for the purchase of a property or other refinancings that restrict the amount of cash returned tothe borrower.
• Geographic concentration. Local economic conditions affect borrowers’ ability to repay loans and the value of collateralunderlying loans. Geographic diversification reduces mortgage credit risk.
• Loan age. We monitor year of origination and loan age, which is defined as the number of years since origination.Credit losses on mortgage loans typically do not peak until the third through sixth year following origination; however,this range can vary based on many factors, including changes in macroeconomic conditions and foreclosure timelines.
The table below displays our single-family conventional business volumes and our single-family conventional guaranty book ofbusiness, based on certain key risk characteristics that we use to evaluate the risk profile and credit quality of our single-familyloans. We exclude from the single-family credit statistics reported below approximately 1% of our single-family guaranty bookof business for which our loan-level information was incomplete as of June 30, 2019 and December 31, 2018.
We provide additional information on the credit characteristics of our single-family loans in quarterly financial supplements,which we submit to the Securities and Exchange Commission (‘‘SEC’‘) with current reports on Form 8-K. Information in ourquarterly financial supplements is not incorporated by reference into this report.

Risk Characteristics of Single-Family Conventional Business Volume andGuaranty Book of Business(1)
Percent of Single-Family Conventional Business Volume at Acquisition(2)
Percent of Single-Family ConventionalGuaranty Book of Business(3)
As ofFor the Three Months
Ended June 30,For the Six Months
Ended June 30,2019 2018 2019 2018 June 30, 2019 December 31, 2018
Original LTV ratio:(4)
<= 60% 15 % 16 % 15 % 17 % 19 % 19 %
60.01% to 70% 11 11 11 12 13 13
70.01% to 80% 37 37 36 38 38 38
80.01% to 90% 14 13 13 12 12 12
90.01% to 95% 15 15 16 14 11 11
95.01% to 100% 8 8 9 7 4 4
Greater than 100% * * * * 3 3
Total 100 % 100 % 100 % 100 % 100 % 100 %
Weighted average 78 % 77 % 78 % 76 % 76 % 75 %
Average loan amount $ 248,993 $ 231,490 $ 244,880 $ 231,890 $ 171,020 $ 170,076Estimated mark-to-market LTV
ratio:(5)
<= 60% 55 % 54 %
60.01% to 70% 18 18
70.01% to 80% 15 16
80.01% to 90% 8 8
90.01% to 100% 4 4
Greater than 100% * *
Total 100 % 100 %
Weighted average 56 % 57 %
Product type:
Fixed-rate:(6)
Long-term 89 % 89 % 90 % 88 % 85 % 84 %
Intermediate-term 10 9 9 10 13 14
Total fixed-rate 99 98 99 98 98 98
Adjustable-rate 1 2 1 2 2 2
Total 100 % 100 % 100 % 100 % 100 % 100 %
Number of property units:
1 unit 98 % 98 % 98 % 97 % 97 % 97 %
2 to 4 units 2 2 2 3 3 3
Total 100 % 100 % 100 % 100 % 100 % 100 %
Property type:
Single-family homes 90 % 90 % 90 % 90 % 91 % 91 %
Condo/Co-op 10 10 10 10 9 9
Total 100 % 100 % 100 % 100 % 100 % 100 %
MD&A | Single-Family Business
Fannie Mae Second Quarter 2019 Form 10-Q 27

Percent of Single-Family Conventional Business Volume at Acquisition(2)
Percent of Single-Family ConventionalGuaranty Book of Business(3)
As ofFor the Three Months
Ended June 30,For the Six Months
Ended June 30,2019 2018 2019 2018 June 30, 2019 December 31, 2018
Occupancy type:
Primary residence 91 % 89 % 90 % 89 % 89 % 89 %
Second/vacation home 4 5 4 4 4 4
Investor 5 6 6 7 7 7
Total 100 % 100 % 100 % 100 % 100 % 100 %
FICO credit score at origination:
< 620 * % * % * % * % 1 % 2 %
620 to < 660 4 6 5 6 5 5
660 to < 680 4 5 5 5 5 5
680 to < 700 8 9 8 9 7 7
700 to < 740 24 23 24 23 21 20
>= 740 60 57 58 57 61 61
Total 100 % 100 % 100 % 100 % 100 % 100 %
Weighted average 746 743 744 743 746 746
DTI ratio at origination:(7)
<= 43% 70 % 65 % 68 % 66 % 76 % 77 %
43.01% to 45% 10 9 10 9 9 9
Greater than 45% 20 26 22 25 15 14
Total 100 % 100 % 100 % 100 % 100 % 100 %
Weighted average 37 % 38 % 37 % 38 % 35 % 35 %
Loan purpose:
Purchase 62 % 65 % 64 % 59 % 45 % 43 %
Cash-out refinance 19 22 20 24 19 20
Other refinance 19 13 16 17 36 37
Total 100 % 100 % 100 % 100 % 100 % 100 %
Geographic concentration:(8)
Midwest 13 % 14 % 14 % 13 % 15 % 15 %
Northeast 13 12 13 13 17 17
Southeast 23 24 23 23 22 22
Southwest 22 22 22 21 18 18
West 29 28 28 30 28 28
Total 100 % 100 % 100 % 100 % 100 % 100 %
Origination year:
2013 and prior 37 % 40 %
2014 5 6
2015 9 10
2016 15 16
2017 14 15
2018 14 13
2019 6 —
Total 100 % 100 %
* Represents less than 0.5% of single-family conventional business volume or book of business.
MD&A | Single-Family Business
Fannie Mae Second Quarter 2019 Form 10-Q 28
(1) Second-lien mortgage loans held by third parties are not reflected in the original LTV or the estimated mark-to-market LTV ratios in thistable.
(2) Calculated based on the unpaid principal balance of single-family loans for each category at time of acquisition.(3) Calculated based on the aggregate unpaid principal balance of single-family loans for each category divided by the aggregate unpaid
principal balance of loans in our single-family conventional guaranty book of business as of the end of each period.(4) The original LTV ratio generally is based on the original unpaid principal balance of the loan divided by the appraised property value
reported to us at the time of acquisition of the loan. Excludes loans for which this information is not readily available.(5) The aggregate estimated mark-to-market LTV ratio is based on the unpaid principal balance of the loan as of the end of each reported
period divided by the estimated current value of the property, which we calculate using an internal valuation model that estimates periodicchanges in home value. Excludes loans for which this information is not readily available.
(6) Long-term fixed-rate consists of mortgage loans with maturities greater than 15 years, while intermediate-term fixed-rate loans havematurities equal to or less than 15 years.
(7) Excludes loans for which this information is not readily available.(8) Midwest consists of IL, IN, IA, MI, MN, NE, ND, OH, SD and WI. Northeast consists of CT, DE, ME, MA, NH, NJ, NY, PA, PR, RI, VT and
VI. Southeast consists of AL, DC, FL, GA, KY, MD, MS, NC, SC, TN, VA and WV. Southwest consists of AZ, AR, CO, KS, LA, MO, NM,OK, TX and UT. West consists of AK, CA, GU, HI, ID, MT, NV, OR, WA and WY.
Characteristics of our New Single-Family Loan Acquisitions
The share of our single-family loan acquisitions consisting of refinance loans rather than home purchase loans increased inthe second quarter of 2019 compared with the second quarter of 2018, primarily due to a lower interest rate environment,which encouraged refinance activity. However, the share of our single-family loan acquisitions consisting of refinance loansdecreased in the first half of 2019 compared with the first half of 2018, as the higher interest rate environment in late 2018discouraged refinance activity in the first quarter of 2019.
The overall volume of our home purchase loan acquisitions was higher in the first half of 2019 compared with the first half of2018. Typically, home purchase loans have higher LTV ratios than refinance loans. This trend contributed to an increase in thepercentage of our single-family loan acquisitions with LTV ratios over 90%—from 21% in the first half of 2018 to 25% in thefirst half of 2019, as well as an increase in the average loan amount of our acquisitions, as home purchase loans are generallylarger than refinance loans.
Our share of acquisitions of loans with DTI ratios above 45% decreased in the second quarter of 2019 compared with thesecond quarter of 2018. This decrease was driven in part by changes in our eligibility guidelines implemented in December2018 to further limit risk layering, particularly with respect to loans with DTI ratios above 45%, as well as a higher volume ofrefinance loan acquisitions.
Desktop Underwriter Update
As part of our comprehensive risk management approach, we periodically update our proprietary automated underwritingsystem, Desktop Underwriter® (“DU”), to reflect changes to our underwriting and eligibility guidelines. In July 2019, weimplemented the following changes to DU:
• HomeReady® income limits. To better align with our housing goals, we changed the income limit requirement forHomeReady loans, our flagship affordable product, to set a maximum borrower income limit of 80% of area medianincome for the property’s location. Previously, a borrower could be eligible for a HomeReady loan if the borrower’stotal annual income did not exceed 100% of area median income or if the property was located in a low-incomecensus tract. We expect this change will reduce the proportion of our loan acquisitions consisting of HomeReadyloans, which we also expect may reduce the proportion of our loan acquisitions with LTV ratios over 90%.Approximately 9% of our single-family conventional loan acquisitions in the second quarter of 2019 consisted ofHomeReady loans.
• DU eligibility assessment. As part of normal business operations, we regularly review DU to determine whether itsrisk analysis and eligibility assessment are appropriate based on the current market environment and loanperformance information. As a result of our most recent review, we updated the DU eligibility assessment to betteralign the mix of business delivered to us with the composition of business in the overall market. We expect thischange will result in fewer acquisitions of loans with multiple higher-risk characteristics.
We will continue to monitor loan acquisitions and market conditions and, as appropriate, make changes in our eligibility criteriaso that the loans we acquire are consistent with our risk appetite.
For further information regarding Desktop Underwriter, please see “MD&A—Single-Family Business—Single-Family MortgageCredit Risk Management—Single-Family Acquisition and Servicing Policies and Underwriting and Servicing Standards” in our2018 Form 10-K.
For a discussion of factors that may impact the credit characteristics of loans we acquire in the future, see “MD&A—Single-Family Business—Single-Family Mortgage Credit Risk Management—Single-Family Portfolio Diversification and Monitoring” inour 2018 Form 10-K. In this section of our 2018 Form 10-K, we also provide more information on the credit characteristics of
MD&A | Single-Family Business
Fannie Mae Second Quarter 2019 Form 10-Q 29
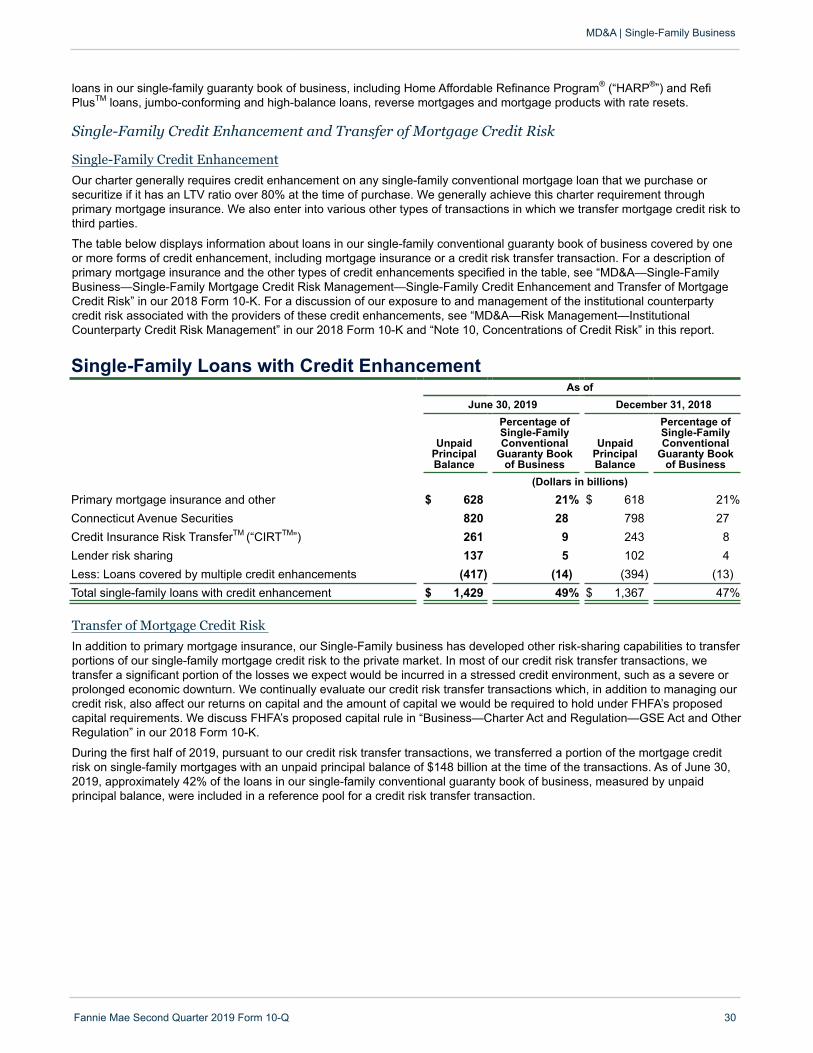
loans in our single-family guaranty book of business, including Home Affordable Refinance Program® (“HARP®”) and RefiPlusTM loans, jumbo-conforming and high-balance loans, reverse mortgages and mortgage products with rate resets.
MD&A | Single-Family Business
Fannie Mae Second Quarter 2019 Form 10-Q 30
Single-Family Credit Enhancement and Transfer of Mortgage Credit Risk
Single-Family Credit Enhancement
Our charter generally requires credit enhancement on any single-family conventional mortgage loan that we purchase orsecuritize if it has an LTV ratio over 80% at the time of purchase. We generally achieve this charter requirement throughprimary mortgage insurance. We also enter into various other types of transactions in which we transfer mortgage credit risk tothird parties.
The table below displays information about loans in our single-family conventional guaranty book of business covered by oneor more forms of credit enhancement, including mortgage insurance or a credit risk transfer transaction. For a description ofprimary mortgage insurance and the other types of credit enhancements specified in the table, see “MD&A—Single-FamilyBusiness—Single-Family Mortgage Credit Risk Management—Single-Family Credit Enhancement and Transfer of MortgageCredit Risk” in our 2018 Form 10-K. For a discussion of our exposure to and management of the institutional counterpartycredit risk associated with the providers of these credit enhancements, see “MD&A—Risk Management—InstitutionalCounterparty Credit Risk Management” in our 2018 Form 10-K and “Note 10, Concentrations of Credit Risk” in this report.
Single-Family Loans with Credit EnhancementAs of
June 30, 2019 December 31, 2018
UnpaidPrincipalBalance
Percentage ofSingle-FamilyConventional
Guaranty Bookof Business
UnpaidPrincipalBalance
Percentage ofSingle-FamilyConventional
Guaranty Bookof Business
(Dollars in billions)Primary mortgage insurance and other $ 628 21% $ 618 21%Connecticut Avenue Securities 820 28 798 27Credit Insurance Risk TransferTM (“CIRTTM”) 261 9 243 8Lender risk sharing 137 5 102 4Less: Loans covered by multiple credit enhancements (417) (14) (394) (13)Total single-family loans with credit enhancement $ 1,429 49% $ 1,367 47%
Transfer of Mortgage Credit Risk
In addition to primary mortgage insurance, our Single-Family business has developed other risk-sharing capabilities to transferportions of our single-family mortgage credit risk to the private market. In most of our credit risk transfer transactions, wetransfer a significant portion of the losses we expect would be incurred in a stressed credit environment, such as a severe orprolonged economic downturn. We continually evaluate our credit risk transfer transactions which, in addition to managing ourcredit risk, also affect our returns on capital and the amount of capital we would be required to hold under FHFA’s proposedcapital requirements. We discuss FHFA’s proposed capital rule in “Business—Charter Act and Regulation—GSE Act and OtherRegulation” in our 2018 Form 10-K.
During the first half of 2019, pursuant to our credit risk transfer transactions, we transferred a portion of the mortgage creditrisk on single-family mortgages with an unpaid principal balance of $148 billion at the time of the transactions. As of June 30,2019, approximately 42% of the loans in our single-family conventional guaranty book of business, measured by unpaidprincipal balance, were included in a reference pool for a credit risk transfer transaction.
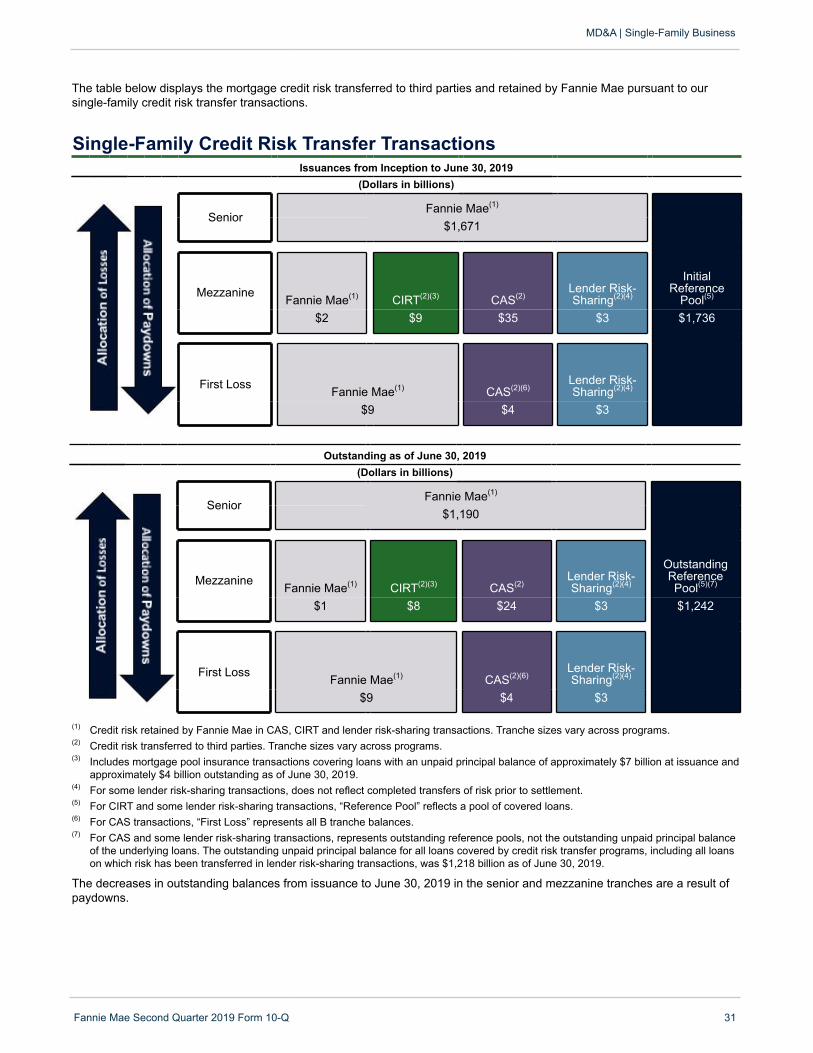
The table below displays the mortgage credit risk transferred to third parties and retained by Fannie Mae pursuant to oursingle-family credit risk transfer transactions.
Single-Family Credit Risk Transfer TransactionsIssuances from Inception to June 30, 2019
(Dollars in billions)
SeniorFannie Mae(1)
InitialReference
Pool(5)
$1,671
Mezzanine Fannie Mae(1) CIRT(2)(3) CAS(2)Lender Risk-Sharing(2)(4)
$2 $9 $35 $3 $1,736
First Loss Fannie Mae(1) CAS(2)(6)Lender Risk-Sharing(2)(4)
$9 $4 $3
Outstanding as of June 30, 2019(Dollars in billions)
SeniorFannie Mae(1)
OutstandingReferencePool(5)(7)
$1,190
Mezzanine Fannie Mae(1) CIRT(2)(3) CAS(2)Lender Risk-Sharing(2)(4)
$1 $8 $24 $3 $1,242
First Loss Fannie Mae(1) CAS(2)(6)Lender Risk-Sharing(2)(4)
$9 $4 $3
(1) Credit risk retained by Fannie Mae in CAS, CIRT and lender risk-sharing transactions. Tranche sizes vary across programs.(2) Credit risk transferred to third parties. Tranche sizes vary across programs.(3) Includes mortgage pool insurance transactions covering loans with an unpaid principal balance of approximately $7 billion at issuance and
approximately $4 billion outstanding as of June 30, 2019. (4) For some lender risk-sharing transactions, does not reflect completed transfers of risk prior to settlement.(5) For CIRT and some lender risk-sharing transactions, “Reference Pool” reflects a pool of covered loans. (6) For CAS transactions, “First Loss” represents all B tranche balances.(7) For CAS and some lender risk-sharing transactions, represents outstanding reference pools, not the outstanding unpaid principal balance
of the underlying loans. The outstanding unpaid principal balance for all loans covered by credit risk transfer programs, including all loanson which risk has been transferred in lender risk-sharing transactions, was $1,218 billion as of June 30, 2019.
The decreases in outstanding balances from issuance to June 30, 2019 in the senior and mezzanine tranches are a result ofpaydowns.
MD&A | Single-Family Business
Fannie Mae Second Quarter 2019 Form 10-Q 31
The following table displays the approximate cash paid or transferred to investors for these credit risk transfer transactions.The cash represents the portion of guaranty fee paid to investors as compensation for taking on a share of the credit risk.These expenses increased from the first half of 2018 to the first half of 2019 as the percentage of our single-familyconventional guaranty book of business on which we have transferred a portion of credit risk increased.
Credit Risk Transfer TransactionsFor the Six Months Ended June 30,
2019 2018Cash paid or transferred for: (Dollars in millions)
CAS transactions(1) $ 474 $ 425CIRT transactions 174 130Lender risk-sharing transactions 134 59
(1) Consists of cash paid for interest expense net of LIBOR on outstanding CAS debt and amounts paid for CAS REMICTM transactions. “CASREMICs” are Connecticut Avenue Securities that are structured as notes issued by trusts that qualify as REMICs.
We updated the following terms of our July 2019 CAS REMIC transaction compared to our prior CAS REMIC transactions:extended the term from 12.5 years to 20 years; shortened the call option from 10 years to 7 years; and retained a smaller first-loss position (that is, investors purchased a larger portion of the risk that we refer to as the first-loss tranche). These updateswere primarily designed to further reduce the amount of capital we would be required to hold for the associated loans in thereference pool under FHFA’s proposed capital framework. We currently expect that our future CAS REMIC transactions willcontain similar terms.
MD&A | Single-Family Business
Fannie Mae Second Quarter 2019 Form 10-Q 32
Single-Family Problem Loan ManagementOur problem loan management strategies are primarily focused on reducing defaults to avoid losses that would otherwiseoccur and pursuing foreclosure alternatives to mitigate the severity of the losses we incur. See “MD&A—Single-FamilyBusiness—Single-Family Mortgage Credit Risk Management—Problem Loan Management” in our 2018 Form 10-K for adiscussion of delinquency statistics on our problem loans, efforts undertaken to manage our problem loans, metrics regardingour loan workout activities, real estate owned (“REO”) management and other single-family credit-related disclosures. Thediscussion below updates some of that information.
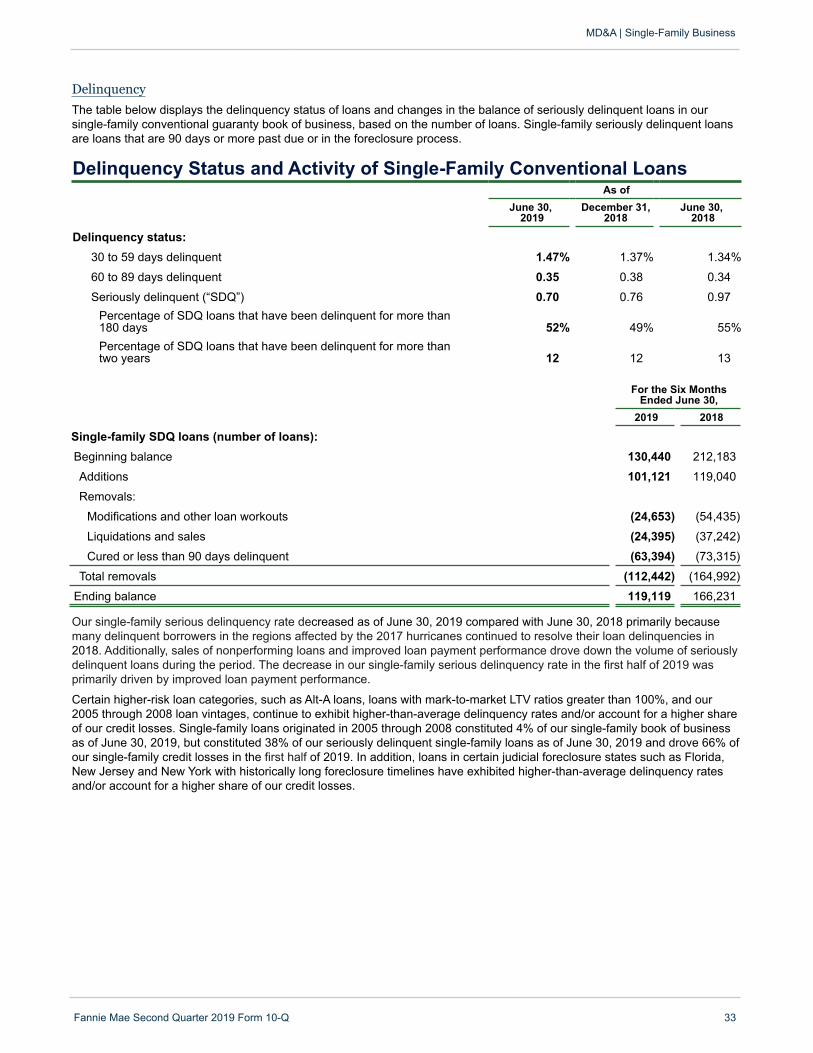
Delinquency
The table below displays the delinquency status of loans and changes in the balance of seriously delinquent loans in oursingle-family conventional guaranty book of business, based on the number of loans. Single-family seriously delinquent loansare loans that are 90 days or more past due or in the foreclosure process.
Delinquency Status and Activity of Single-Family Conventional LoansAs of
June 30, 2019
December 31,2018
June 30, 2018
Delinquency status:30 to 59 days delinquent 1.47% 1.37% 1.34%
60 to 89 days delinquent 0.35 0.38 0.34
Seriously delinquent (“SDQ”) 0.70 0.76 0.97Percentage of SDQ loans that have been delinquent for more than 180 days 52% 49% 55%Percentage of SDQ loans that have been delinquent for more than two years 12 12 13
For the Six MonthsEnded June 30,
2019 2018
Single-family SDQ loans (number of loans):Beginning balance 130,440 212,183
Additions 101,121 119,040
Removals:
Modifications and other loan workouts (24,653) (54,435)
Liquidations and sales (24,395) (37,242)
Cured or less than 90 days delinquent (63,394) (73,315)
Total removals (112,442) (164,992)
Ending balance 119,119 166,231
Our single-family serious delinquency rate decreased as of June 30, 2019 compared with June 30, 2018 primarily becausemany delinquent borrowers in the regions affected by the 2017 hurricanes continued to resolve their loan delinquencies in2018. Additionally, sales of nonperforming loans and improved loan payment performance drove down the volume of seriouslydelinquent loans during the period. The decrease in our single-family serious delinquency rate in the first half of 2019 wasprimarily driven by improved loan payment performance.
Certain higher-risk loan categories, such as Alt-A loans, loans with mark-to-market LTV ratios greater than 100%, and our2005 through 2008 loan vintages, continue to exhibit higher-than-average delinquency rates and/or account for a higher shareof our credit losses. Single-family loans originated in 2005 through 2008 constituted 4% of our single-family book of businessas of June 30, 2019, but constituted 38% of our seriously delinquent single-family loans as of June 30, 2019 and drove 66% ofour single-family credit losses in the first half of 2019. In addition, loans in certain judicial foreclosure states such as Florida,New Jersey and New York with historically long foreclosure timelines have exhibited higher-than-average delinquency ratesand/or account for a higher share of our credit losses.
MD&A | Single-Family Business
Fannie Mae Second Quarter 2019 Form 10-Q 33

The table below displays the serious delinquency rates for, and the percentage of our total seriously delinquent single-familyconventional loans represented by, the specified loan categories. Percentage of book outstanding calculations are based onthe unpaid principal balance of loans for each category divided by the unpaid principal balance of our total single-familyconventional guaranty book of business for which we have detailed loan-level information. We also include information for ourloans in California, as this state accounts for a large share of our single-family conventional guaranty book of business. Thereported categories are not mutually exclusive.
Single-Family Conventional Seriously Delinquent Loan Concentration AnalysisAs of
June 30, 2019 December 31, 2018 June 30, 2018
Percentageof Book
Outstanding
Percentageof SeriouslyDelinquent
Loans(1)
SeriousDelinquency
Rate
Percentageof Book
Outstanding
Percentageof SeriouslyDelinquent
Loans(1)
SeriousDelinquency
Rate
Percentageof Book
Outstanding
Percentageof SeriouslyDelinquent
Loans(1)
SeriousDelinquency
Rate
States:
California 19% 6% 0.33% 19% 6% 0.34% 19% 5% 0.36%
Florida 6 9 0.94 6 10 1.16 6 17 2.51
New Jersey 4 6 1.28 4 5 1.38 4 5 1.68
New York 5 8 1.32 5 8 1.40 5 7 1.66
All other states 66 71 0.69 66 71 0.75 66 66 0.88
Product type:
Alt-A(2) 2 11 3.25 2 11 3.35 2 12 4.21
Vintages:
2004 and prior 3 22 2.61 3 23 2.69 3 23 3.00
2005-2008 4 38 4.45 5 39 4.61 6 41 5.54
2009-2019 93 40 0.32 92 38 0.34 91 36 0.41
Estimated mark-to-market LTV ratio:
<= 60% 55 51 0.55 54 48 0.58 55 45 0.69
60.01% to 70% 18 17 0.81 18 17 0.87 18 17 1.07
70.01% to 80% 15 14 0.83 16 14 0.90 15 15 1.19
80.01% to 90% 8 9 1.10 8 10 1.24 8 10 1.69
90.01% to 100% 4 4 1.15 4 5 1.33 3 6 2.46
Greater than 100% * 5 10.63 * 6 9.85 1 7 11.41
Credit enhanced:(3)
Primary MI & other(4) 22 26 1.01 21 26 1.11 20 24 1.40
Credit risk transfer(5) 42 11 0.24 39 10 0.24 36 8 0.29
Non-credit enhanced 51 68 0.79 53 69 0.85 56 71 1.06
* Represents less than 0.5% of single-family conventional business volume or book of business.(1) Calculated based on the number of single-family loans that were seriously delinquent for each category divided by the total number of
single-family conventional loans that were seriously delinquent.(2) For a description of our Alt-A loan classification criteria, see “MD&A—Glossary of Terms Used in this Report” in our 2018 Form 10-K. (3) The credit-enhanced categories are not mutually exclusive. A loan with primary mortgage insurance that is also covered by a credit risk
transfer transaction will be included in both the “Primary MI & other” category and the “Credit risk transfer” category. As a result, the “Creditenhanced” and “Non-credit enhanced” categories do not sum to 100%. The total percentage of our single-family conventional guarantybook of business with some form of credit enhancement as of June 30, 2019 was 49%.
(4) Refers to loans included in an agreement used to reduce credit risk by requiring primary mortgage insurance, collateral, letters of credit,corporate guarantees, or other agreements to provide an entity with some assurance that it will be compensated to some degree in theevent of a financial loss. Excludes loans covered by credit risk transfer transactions unless such loans are also covered by primarymortgage insurance.
(5) Refers to loans included in reference pools for credit risk transfer transactions, including loans in these transactions that are also coveredby primary mortgage insurance. For CAS and some lender risk-sharing transactions, this represents outstanding unpaid principal balanceof the underlying loans on the single-family mortgage credit book, not the outstanding reference pool, as of the specified date. Loansincluded in our credit risk transfer transactions have all been acquired since 2012. Newer vintages typically have significantly lowerdelinquency rates than more seasoned loans.
MD&A | Single-Family Business
Fannie Mae Second Quarter 2019 Form 10-Q 34
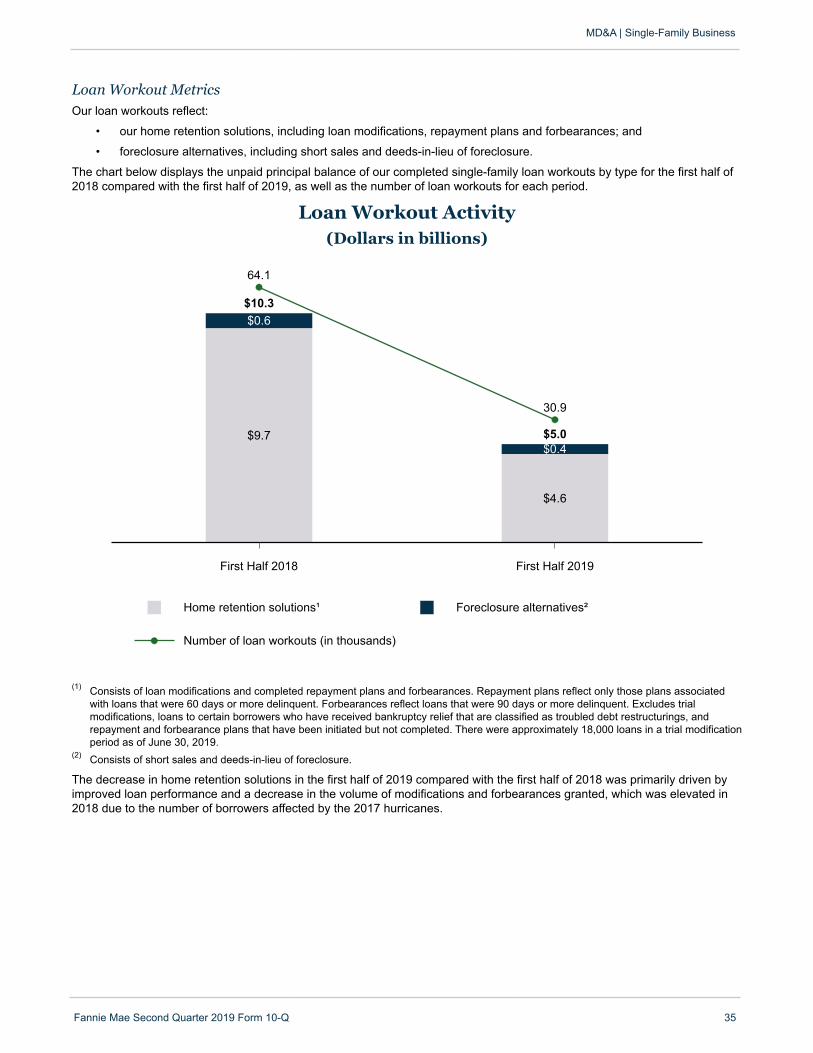
Loan Workout MetricsOur loan workouts reflect:
• our home retention solutions, including loan modifications, repayment plans and forbearances; and
• foreclosure alternatives, including short sales and deeds-in-lieu of foreclosure.
The chart below displays the unpaid principal balance of our completed single-family loan workouts by type for the first half of2018 compared with the first half of 2019, as well as the number of loan workouts for each period.
Loan Workout Activity (Dollars in billions)
Home retention solutions¹ Foreclosure alternatives²
Number of loan workouts (in thousands)
First Half 2018 First Half 2019
$9.7
$4.6
$0.6$10.3
$0.4$5.0
64.1
30.9
(1) Consists of loan modifications and completed repayment plans and forbearances. Repayment plans reflect only those plans associatedwith loans that were 60 days or more delinquent. Forbearances reflect loans that were 90 days or more delinquent. Excludes trialmodifications, loans to certain borrowers who have received bankruptcy relief that are classified as troubled debt restructurings, andrepayment and forbearance plans that have been initiated but not completed. There were approximately 18,000 loans in a trial modificationperiod as of June 30, 2019.
(2) Consists of short sales and deeds-in-lieu of foreclosure.
The decrease in home retention solutions in the first half of 2019 compared with the first half of 2018 was primarily driven byimproved loan performance and a decrease in the volume of modifications and forbearances granted, which was elevated in2018 due to the number of borrowers affected by the 2017 hurricanes.
MD&A | Single-Family Business
Fannie Mae Second Quarter 2019 Form 10-Q 35
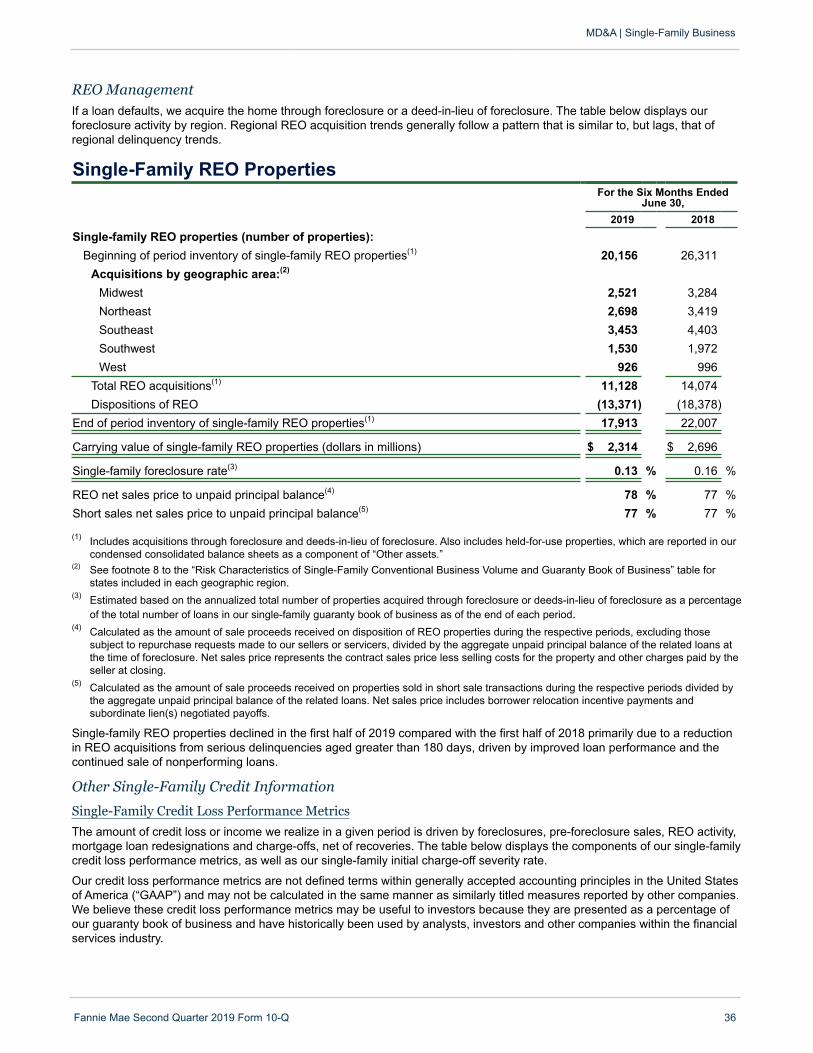
REO ManagementIf a loan defaults, we acquire the home through foreclosure or a deed-in-lieu of foreclosure. The table below displays ourforeclosure activity by region. Regional REO acquisition trends generally follow a pattern that is similar to, but lags, that ofregional delinquency trends.
Single-Family REO PropertiesFor the Six Months Ended
June 30,2019 2018
Single-family REO properties (number of properties):Beginning of period inventory of single-family REO properties(1) 20,156 26,311
Acquisitions by geographic area:(2)
Midwest 2,521 3,284Northeast 2,698 3,419Southeast 3,453 4,403Southwest 1,530 1,972West 926 996
Total REO acquisitions(1) 11,128 14,074Dispositions of REO (13,371) (18,378)
End of period inventory of single-family REO properties(1) 17,913 22,007
Carrying value of single-family REO properties (dollars in millions) $ 2,314 $ 2,696
Single-family foreclosure rate(3) 0.13 % 0.16 %
REO net sales price to unpaid principal balance(4) 78 % 77 %Short sales net sales price to unpaid principal balance(5) 77 % 77 %
(1) Includes acquisitions through foreclosure and deeds-in-lieu of foreclosure. Also includes held-for-use properties, which are reported in ourcondensed consolidated balance sheets as a component of “Other assets.”
(2) See footnote 8 to the “Risk Characteristics of Single-Family Conventional Business Volume and Guaranty Book of Business” table forstates included in each geographic region.
(3) Estimated based on the annualized total number of properties acquired through foreclosure or deeds-in-lieu of foreclosure as a percentageof the total number of loans in our single-family guaranty book of business as of the end of each period.
(4) Calculated as the amount of sale proceeds received on disposition of REO properties during the respective periods, excluding thosesubject to repurchase requests made to our sellers or servicers, divided by the aggregate unpaid principal balance of the related loans atthe time of foreclosure. Net sales price represents the contract sales price less selling costs for the property and other charges paid by theseller at closing.
(5) Calculated as the amount of sale proceeds received on properties sold in short sale transactions during the respective periods divided bythe aggregate unpaid principal balance of the related loans. Net sales price includes borrower relocation incentive payments andsubordinate lien(s) negotiated payoffs.
Single-family REO properties declined in the first half of 2019 compared with the first half of 2018 primarily due to a reductionin REO acquisitions from serious delinquencies aged greater than 180 days, driven by improved loan performance and thecontinued sale of nonperforming loans.
MD&A | Single-Family Business
Fannie Mae Second Quarter 2019 Form 10-Q 36
Other Single-Family Credit Information
Single-Family Credit Loss Performance Metrics
The amount of credit loss or income we realize in a given period is driven by foreclosures, pre-foreclosure sales, REO activity,mortgage loan redesignations and charge-offs, net of recoveries. The table below displays the components of our single-familycredit loss performance metrics, as well as our single-family initial charge-off severity rate.
Our credit loss performance metrics are not defined terms within generally accepted accounting principles in the United Statesof America (“GAAP”) and may not be calculated in the same manner as similarly titled measures reported by other companies.We believe these credit loss performance metrics may be useful to investors because they are presented as a percentage ofour guaranty book of business and have historically been used by analysts, investors and other companies within the financialservices industry.

Single-Family Credit Loss Performance MetricsFor the Three Months Ended June 30, For the Six Months Ended June 30,
2019 2018 2019 2018Amount Ratio(1) Amount Ratio(1) Amount Ratio(1) Amount Ratio(1)
(Dollars in millions)
Charge-offs, net ofrecoveries $ (534) 7.4 bps $ (651) 8.8 bps $ (860) 5.9 bps $(1,043) 7.1 bps
Foreclosed propertyexpense (126) 1.7 (136) 1.9 (269) 1.9 (298) 2.0
Credit losses andcredit loss ratio $ (660) 9.1 bps $ (787) 10.7 bps $(1,129) 7.8 bps $(1,341) 9.1 bps
Single-family initialcharge-off severityrate(2) 7.51 % 10.68 % 8.41 % 12.08 %
(1) Basis points are calculated based on the amount of each line item divided by the average single-family conventional guaranty book ofbusiness during the period.
(2) Credit losses on single-family loans initially charged off during the period divided by the average defaulted unpaid principal balance ofthose loans. The initial charge-off event is defined as the earliest of (1) when the loan is charged off pursuant to the provisions of theAdvisory Bulletin, or (2) when there is a short sale, deed-in-lieu of foreclosure, or foreclosure of the underlying collateral. This severity ratedoes not reflect any gains or losses associated with subsequent events, such as REO transactions that occur after we acquire theproperty.
Our single-family credit losses and credit loss ratio decreased in the second quarter and first half of 2019 compared with thesecond quarter and first half of 2018 primarily due to reduced foreclosures and foreclosure alternatives, lower charge-offexpenses on the loans we redesignated from HFI to HFS, and lower charge-off severity rates due to continued home priceappreciation.
For information on our credit-related income or expense, which includes changes in our allowance, see “Single-FamilyFinancial Results.”
Single-Family Loss Reserves
Our single-family loss reserves, which include our allowance for loan losses and reserve for guaranty losses, provide for anestimate of credit losses incurred in our single-family guaranty book of business, including concessions we granted borrowersupon modification of their loans. The table below summarizes the changes in our single-family loss reserves.
Single-Family Loss ReservesFor the Three Months Ended
June 30,For the Six Months Ended
June 30,2019 2018 2019 2018
(Dollars in millions)
Changes in loss reserves:Beginning balance $ (13,019) $ (18,568) $ (14,007) $ (19,155)
Benefit for credit losses 1,252 1,295 1,913 1,491
Charge-offs 561 738 947 1,214
Recoveries (27) (87) (87) (171)
Other (6) (16) (5) (17)
Ending balance $ (11,239) $ (16,638) $ (11,239) $ (16,638)
As ofJune 30,
2019December 31,
2018Loss reserves as a percentage of:
Single-family guaranty book of business 0.39% 0.49%
Recorded investment in nonaccrual loans 37.95 44.24
MD&A | Single-Family Business
Fannie Mae Second Quarter 2019 Form 10-Q 37
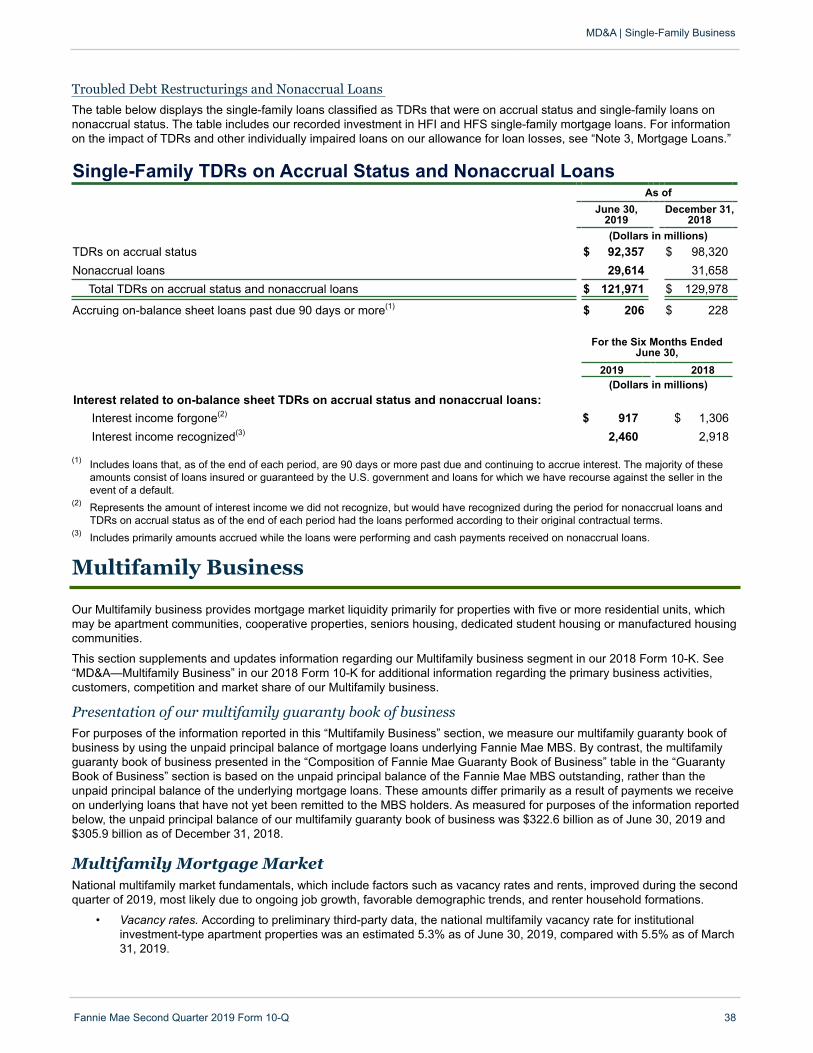
Troubled Debt Restructurings and Nonaccrual Loans
The table below displays the single-family loans classified as TDRs that were on accrual status and single-family loans onnonaccrual status. The table includes our recorded investment in HFI and HFS single-family mortgage loans. For informationon the impact of TDRs and other individually impaired loans on our allowance for loan losses, see “Note 3, Mortgage Loans.”
Single-Family TDRs on Accrual Status and Nonaccrual LoansAs of
June 30,2019
December 31,2018
(Dollars in millions)TDRs on accrual status $ 92,357 $ 98,320Nonaccrual loans 29,614 31,658
Total TDRs on accrual status and nonaccrual loans $ 121,971 $ 129,978
Accruing on-balance sheet loans past due 90 days or more(1) $ 206 $ 228
For the Six Months EndedJune 30,
2019 2018(Dollars in millions)
Interest related to on-balance sheet TDRs on accrual status and nonaccrual loans:Interest income forgone(2) $ 917 $ 1,306Interest income recognized(3) 2,460 2,918
(1) Includes loans that, as of the end of each period, are 90 days or more past due and continuing to accrue interest. The majority of theseamounts consist of loans insured or guaranteed by the U.S. government and loans for which we have recourse against the seller in theevent of a default.
(2) Represents the amount of interest income we did not recognize, but would have recognized during the period for nonaccrual loans andTDRs on accrual status as of the end of each period had the loans performed according to their original contractual terms.
(3) Includes primarily amounts accrued while the loans were performing and cash payments received on nonaccrual loans.
MD&A | Single-Family Business
Fannie Mae Second Quarter 2019 Form 10-Q 38
Multifamily Business
Our Multifamily business provides mortgage market liquidity primarily for properties with five or more residential units, whichmay be apartment communities, cooperative properties, seniors housing, dedicated student housing or manufactured housingcommunities.
This section supplements and updates information regarding our Multifamily business segment in our 2018 Form 10-K. See“MD&A—Multifamily Business” in our 2018 Form 10-K for additional information regarding the primary business activities,customers, competition and market share of our Multifamily business.
Presentation of our multifamily guaranty book of businessFor purposes of the information reported in this “Multifamily Business” section, we measure our multifamily guaranty book ofbusiness by using the unpaid principal balance of mortgage loans underlying Fannie Mae MBS. By contrast, the multifamilyguaranty book of business presented in the “Composition of Fannie Mae Guaranty Book of Business” table in the “GuarantyBook of Business” section is based on the unpaid principal balance of the Fannie Mae MBS outstanding, rather than theunpaid principal balance of the underlying mortgage loans. These amounts differ primarily as a result of payments we receiveon underlying loans that have not yet been remitted to the MBS holders. As measured for purposes of the information reportedbelow, the unpaid principal balance of our multifamily guaranty book of business was $322.6 billion as of June 30, 2019 and$305.9 billion as of December 31, 2018.
Multifamily Mortgage MarketNational multifamily market fundamentals, which include factors such as vacancy rates and rents, improved during the secondquarter of 2019, most likely due to ongoing job growth, favorable demographic trends, and renter household formations.
• Vacancy rates. According to preliminary third-party data, the national multifamily vacancy rate for institutionalinvestment-type apartment properties was an estimated 5.3% as of June 30, 2019, compared with 5.5% as of March31, 2019.
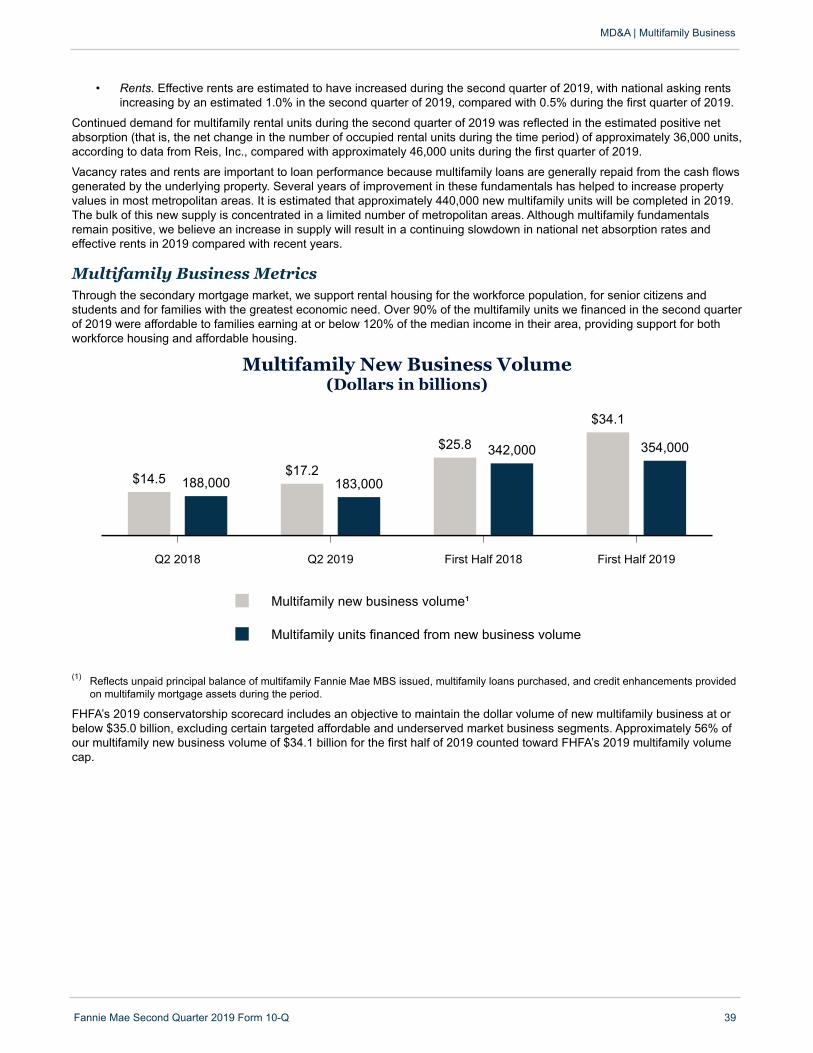
• Rents. Effective rents are estimated to have increased during the second quarter of 2019, with national asking rentsincreasing by an estimated 1.0% in the second quarter of 2019, compared with 0.5% during the first quarter of 2019.
Continued demand for multifamily rental units during the second quarter of 2019 was reflected in the estimated positive netabsorption (that is, the net change in the number of occupied rental units during the time period) of approximately 36,000 units,according to data from Reis, Inc., compared with approximately 46,000 units during the first quarter of 2019.
Vacancy rates and rents are important to loan performance because multifamily loans are generally repaid from the cash flowsgenerated by the underlying property. Several years of improvement in these fundamentals has helped to increase propertyvalues in most metropolitan areas. It is estimated that approximately 440,000 new multifamily units will be completed in 2019.The bulk of this new supply is concentrated in a limited number of metropolitan areas. Although multifamily fundamentalsremain positive, we believe an increase in supply will result in a continuing slowdown in national net absorption rates andeffective rents in 2019 compared with recent years.
MD&A | Multifamily Business
Fannie Mae Second Quarter 2019 Form 10-Q 39
Multifamily Business Metrics Through the secondary mortgage market, we support rental housing for the workforce population, for senior citizens andstudents and for families with the greatest economic need. Over 90% of the multifamily units we financed in the second quarterof 2019 were affordable to families earning at or below 120% of the median income in their area, providing support for bothworkforce housing and affordable housing.
Multifamily New Business Volume(Dollars in billions)
Multifamily new business volume¹
Multifamily units financed from new business volume
Q2 2018 Q2 2019 First Half 2018 First Half 2019
$14.5 $17.2
$25.8
$34.1
188,000 183,000
342,000 354,000
(1) Reflects unpaid principal balance of multifamily Fannie Mae MBS issued, multifamily loans purchased, and credit enhancements providedon multifamily mortgage assets during the period.
FHFA’s 2019 conservatorship scorecard includes an objective to maintain the dollar volume of new multifamily business at orbelow $35.0 billion, excluding certain targeted affordable and underserved market business segments. Approximately 56% ofour multifamily new business volume of $34.1 billion for the first half of 2019 counted toward FHFA’s 2019 multifamily volumecap.
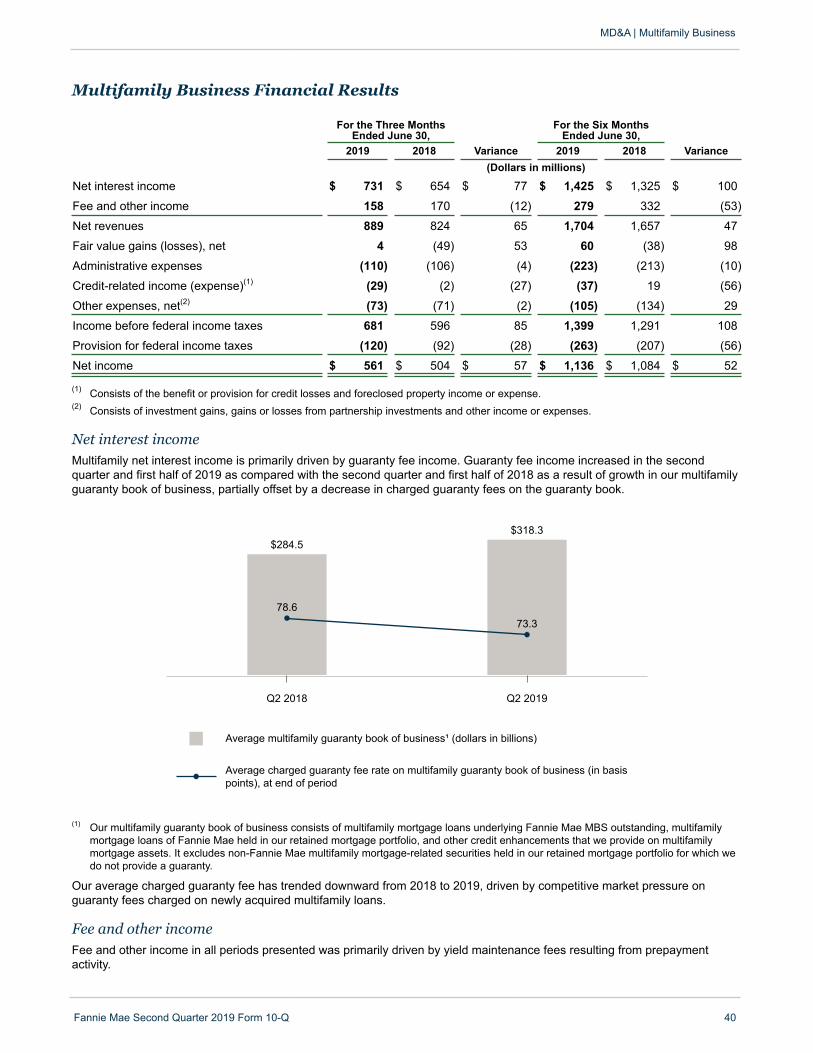
Multifamily Business Financial Results
For the Three MonthsEnded June 30,
For the Six MonthsEnded June 30,
2019 2018 Variance 2019 2018 Variance(Dollars in millions)
Net interest income $ 731 $ 654 $ 77 $ 1,425 $ 1,325 $ 100
Fee and other income 158 170 (12) 279 332 (53)
Net revenues 889 824 65 1,704 1,657 47
Fair value gains (losses), net 4 (49) 53 60 (38) 98
Administrative expenses (110) (106) (4) (223) (213) (10)
Credit-related income (expense)(1) (29) (2) (27) (37) 19 (56)
Other expenses, net(2) (73) (71) (2) (105) (134) 29
Income before federal income taxes 681 596 85 1,399 1,291 108
Provision for federal income taxes (120) (92) (28) (263) (207) (56)
Net income $ 561 $ 504 $ 57 $ 1,136 $ 1,084 $ 52
(1) Consists of the benefit or provision for credit losses and foreclosed property income or expense.(2) Consists of investment gains, gains or losses from partnership investments and other income or expenses.
Net interest incomeMultifamily net interest income is primarily driven by guaranty fee income. Guaranty fee income increased in the secondquarter and first half of 2019 as compared with the second quarter and first half of 2018 as a result of growth in our multifamilyguaranty book of business, partially offset by a decrease in charged guaranty fees on the guaranty book.
Average multifamily guaranty book of business¹ (dollars in billions)
Average charged guaranty fee rate on multifamily guaranty book of business (in basispoints), at end of period
Q2 2018 Q2 2019
$284.5$318.3
78.673.3
(1) Our multifamily guaranty book of business consists of multifamily mortgage loans underlying Fannie Mae MBS outstanding, multifamilymortgage loans of Fannie Mae held in our retained mortgage portfolio, and other credit enhancements that we provide on multifamilymortgage assets. It excludes non-Fannie Mae multifamily mortgage-related securities held in our retained mortgage portfolio for which wedo not provide a guaranty.
Our average charged guaranty fee has trended downward from 2018 to 2019, driven by competitive market pressure onguaranty fees charged on newly acquired multifamily loans.
Fee and other incomeFee and other income in all periods presented was primarily driven by yield maintenance fees resulting from prepaymentactivity.
MD&A | Multifamily Business
Fannie Mae Second Quarter 2019 Form 10-Q 40
Fair value gains (losses), netDepending on portfolio activity, our Multifamily business may be in a net buy or net sell position during any given period. Fairvalue gains in the first half of 2019 were primarily driven by gains on commitments to buy multifamily mortgage-relatedsecurities as a result of increases in prices as interest rates decreased during the commitment periods.
Fair value losses in the second quarter and first half of 2018 were primarily driven by losses on commitments to buymultifamily mortgage-related securities as a result of increasing interest rates during the commitment periods.
Credit-related income (expense)Credit-related expense in the second quarter and first half of 2019 was primarily driven by an increase in the allowance forloan losses due to a slight increase in downgrades on loan risk ratings resulting in a larger population of substandard loansand an increase in the individually impaired loan population. See “Multifamily Mortgage Credit Risk Management—MultifamilyPortfolio Diversification and Monitoring” for more information regarding substandard loans.
Credit-related income in the first half of 2018 was primarily driven by a decrease in the allowance for loan losses as a result ofupdated estimated losses from the 2017 hurricanes.
MD&A | Multifamily Business
Fannie Mae Second Quarter 2019 Form 10-Q 41
Multifamily Mortgage Credit Risk Management This section updates our discussion of multifamily mortgage credit risk management in our 2018 Form 10-K in “MD&A—Multifamily Business—Multifamily Mortgage Credit Risk Management.”
Multifamily Acquisition Policy and Underwriting Standards Our standards for multifamily loans specify maximum original LTV ratio and minimum original debt service coverage ratio(“DSCR”) values that vary based on loan characteristics. Our experience has been that original LTV ratio and DSCR valueshave been reliable indicators of future credit performance.
At underwriting, we evaluate the DSCR based on both actual and underwritten debt service payments. Underwritten debtservice payments are based on debt service calculations that include both principal and interest payments. The original DSCRfor the loan is calculated using these underwritten debt service payments rather than the actual debt service payments, which,depending on the interest rate of the loan and loan structure, may result in a more conservative estimate of the debt servicepayments. This approach is used for all loans, including those with full and partial interest-only terms.
The following table displays key risk characteristics of our multifamily guaranty book of business.
Multifamily Guaranty Book of Business Key Risk CharacteristicsAs of
June 30, 2019
December 31,2018
June 30, 2018
Weighted average original LTV ratio 66 % 66 % 67 %
Original LTV ratio greater than 80% 1 1 1
Original DSCR less than or equal to 1.10 11 12 13
Full interest-only loans 26 24 22
Partial interest-only loans(1) 49 49 48
(1) Consists of mortgage loans that were underwritten with an interest-only term, regardless of whether the loan is currently in its interest-onlyperiod.
We provide additional information on the credit characteristics of our multifamily loans in quarterly financial supplements,which we submit to the SEC with current reports on Form 8-K. Information in our quarterly financial supplements is notincorporated by reference into this report.
Transfer of Multifamily Mortgage Credit RiskLender risk-sharing is a cornerstone of our Multifamily business. We primarily transfer risk through our Delegated Underwritingand Servicing (“DUS®”) program, which delegates to DUS lenders the ability to underwrite and service multifamily loans, inaccordance with our standards and requirements. DUS lenders receive credit risk-related revenues for their respective portionof credit risk retained, and, in turn, are required to fulfill any loss sharing obligation. This aligns the interests of the lender andFannie Mae throughout the life of the loan.
Our DUS model typically results in our lenders sharing on a pro-rata or tiered basis approximately one-third of the credit riskon our multifamily loans. In the first half of 2019, nearly 100% of our new multifamily business volume had lender risk-sharing.
As of June 30, 2019 and December 31, 2018, 98% of the unpaid principal balance of loans in our multifamily guaranty book ofbusiness had lender risk-sharing.
To complement our lender risk-sharing program through our DUS model, we engage in multifamily CIRT transactions, pursuantto which we transfer a portion of the mortgage credit risk on multifamily loans in our multifamily guaranty book of business toinsurers or reinsurers. As of June 30, 2019, we have completed five multifamily CIRT transactions since the inception of theprogram, which covered multifamily loans with an unpaid principal balance of approximately $51.3 billion at the time of thetransactions. As of June 30, 2019, 15% of the loans in our multifamily guaranty book of business, measured by unpaidprincipal balance, were covered by a CIRT transaction.
Multifamily Portfolio Diversification and MonitoringDiversification within our multifamily book of business by geographic concentration, term to maturity, interest rate structure,borrower concentration, loan size and credit enhancement coverage, are important factors that influence credit performanceand help reduce our credit risk.
As part of our ongoing credit risk management process, we and our lenders monitor the performance of our multifamily loansand the underlying properties on an ongoing basis throughout the loan term at the asset and portfolio level. We require lendersto provide quarterly and annual financial updates for the loans for which we are contractually entitled to receive suchinformation. We closely monitor loans with an estimated current DSCR below 1.0, as that is an indicator of heightened defaultrisk. The percentage of loans in our multifamily guaranty book of business, calculated based on unpaid principal balance, witha current DSCR less than 1.0 was approximately 2% as of June 30, 2019 and December 31, 2018. Our estimates of currentDSCRs are based on the latest available income information for these properties. Although we use the most recently availableresults from our multifamily borrowers, there is a lag in reporting, which typically can range from three to six months, but insome cases may be longer.
In addition to the factors discussed above, we track the following credit risk characteristics to determine loan credit qualityindicators, which are the internal risk categories we use and which are further discussed in “Note 3, Mortgage Loans”:
• the physical condition of the property;
• delinquency status;
• the relevant local market and economic conditions that may signal changing risk or return profiles; and
• other risk factors.
The percentage of our multifamily loans categorized as substandard based on these characteristics increased from 2018 to2019 but has remained relatively flat in 2019, driven by profitability pressure on certain properties in competitive markets.Substandard loans are loans that have a well-defined weakness that could impact the timely full repayment. While the vastmajority of the substandard loans in our multifamily guaranty book of business are currently making timely payments, wecontinue to monitor the performance of the full substandard loan population.
MD&A | Multifamily Business
Fannie Mae Second Quarter 2019 Form 10-Q 42
Multifamily Problem Loan Management and Foreclosure PreventionThe multifamily serious delinquency rate was 0.05% as of June 30, 2019, compared with 0.06% as of December 31, 2018 and0.10% as of June 30, 2018. We classify multifamily loans as seriously delinquent when payment is 60 days or more past due.The decrease in the multifamily serious delinquency rate from June 30, 2018 to June 30, 2019 resulted primarily from adecrease in delinquent loans subject to forbearance agreements granted to borrowers in the regions affected by the 2017hurricanes.
Other Multifamily Credit Information
Multifamily Credit Loss Performance Metrics
The amount of credit loss or income we realize in a given period is driven by foreclosures, pre-foreclosure sales, REO activityand charge-offs, net of recoveries. Our credit performance metrics are not defined terms within GAAP and may not becalculated in the same manner as similarly titled measures reported by other companies. We believe our credit performancemetrics may be useful to investors because they have historically been used by analysts, investors and other companies withinthe financial services industry.
We had $4 million in multifamily credit losses in the second quarter of 2019 and in the second quarter of 2018. We had $1million in multifamily credit losses in the first half of 2019 compared with $8 million in the first half of 2018.
Credit losses in the second quarter of 2019 were driven by charge-off activity partially offset by recoveries on previouslycharged-off amounts. Credit losses in the first half of 2019 were driven by charge-off activity in the second quarter, largelyoffset by small net gains on the sale of foreclosed properties and recoveries on previously charged-off amounts.
For information on our credit-related income or expense, which includes changes in our allowance, see “Multifamily FinancialResults.”
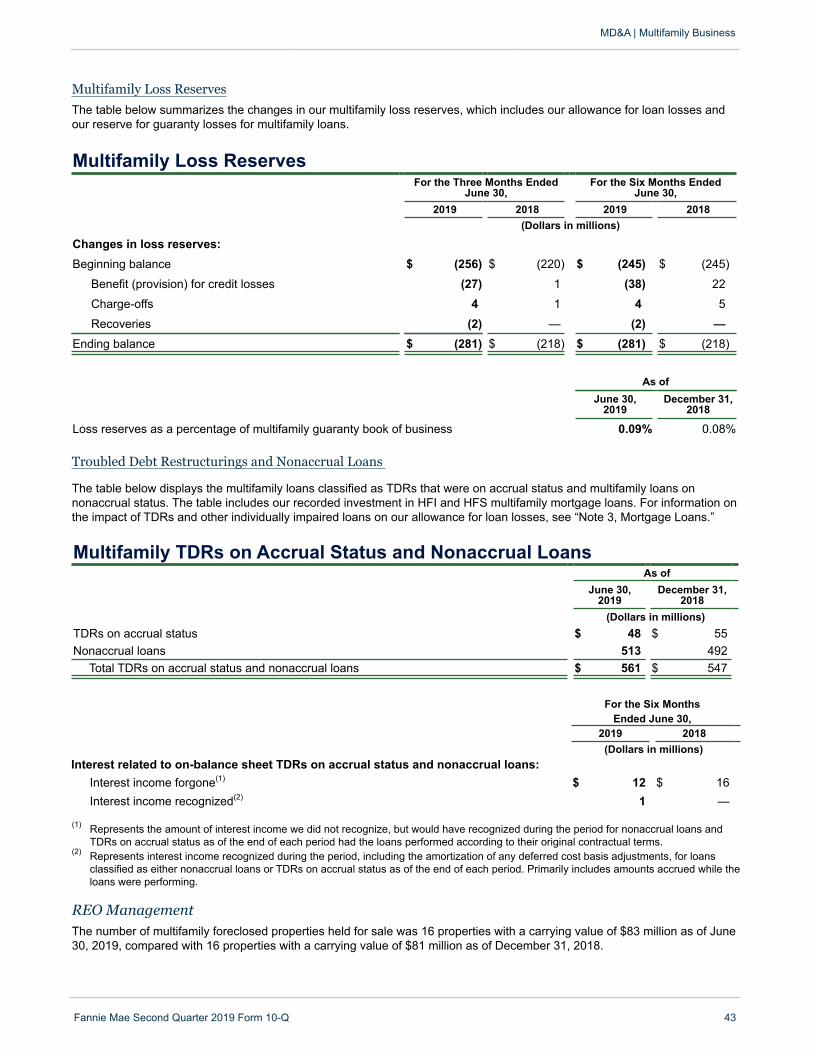
Multifamily Loss Reserves
The table below summarizes the changes in our multifamily loss reserves, which includes our allowance for loan losses andour reserve for guaranty losses for multifamily loans.
Multifamily Loss ReservesFor the Three Months Ended
June 30,For the Six Months Ended
June 30,2019 2018 2019 2018
(Dollars in millions)
Changes in loss reserves:Beginning balance $ (256) $ (220) $ (245) $ (245)
Benefit (provision) for credit losses (27) 1 (38) 22
Charge-offs 4 1 4 5
Recoveries (2) — (2) —Ending balance $ (281) $ (218) $ (281) $ (218)
As ofJune 30,
2019December 31,
2018
Loss reserves as a percentage of multifamily guaranty book of business 0.09% 0.08%
MD&A | Multifamily Business
Fannie Mae Second Quarter 2019 Form 10-Q 43
Troubled Debt Restructurings and Nonaccrual Loans
The table below displays the multifamily loans classified as TDRs that were on accrual status and multifamily loans onnonaccrual status. The table includes our recorded investment in HFI and HFS multifamily mortgage loans. For information onthe impact of TDRs and other individually impaired loans on our allowance for loan losses, see “Note 3, Mortgage Loans.”
Multifamily TDRs on Accrual Status and Nonaccrual LoansAs of
June 30,2019
December 31,2018
(Dollars in millions)TDRs on accrual status $ 48 $ 55Nonaccrual loans 513 492
Total TDRs on accrual status and nonaccrual loans $ 561 $ 547
For the Six MonthsEnded June 30,
2019 2018(Dollars in millions)
Interest related to on-balance sheet TDRs on accrual status and nonaccrual loans:Interest income forgone(1) $ 12 $ 16Interest income recognized(2) 1 —
(1) Represents the amount of interest income we did not recognize, but would have recognized during the period for nonaccrual loans andTDRs on accrual status as of the end of each period had the loans performed according to their original contractual terms.
(2) Represents interest income recognized during the period, including the amortization of any deferred cost basis adjustments, for loansclassified as either nonaccrual loans or TDRs on accrual status as of the end of each period. Primarily includes amounts accrued while theloans were performing.
REO Management The number of multifamily foreclosed properties held for sale was 16 properties with a carrying value of $83 million as of June30, 2019, compared with 16 properties with a carrying value of $81 million as of December 31, 2018.

Liquidity and Capital Management
Liquidity ManagementThis section supplements and updates information regarding liquidity management in our 2018 Form 10-K. See “MD&A—Liquidity and Capital Management—Liquidity Management” and “Risk Factors” in our 2018 Form 10-K for additionalinformation, including discussions of our primary sources and uses of funds, our liquidity and funding risk managementpractices and contingency planning, factors that influence our debt funding activity, factors that may impact our access to orthe cost of our debt funding, and factors that could adversely affect our liquidity and funding.
MD&A | Liquidity and Capital Management
Fannie Mae Second Quarter 2019 Form 10-Q 44
Debt Funding
Outstanding Debt Total outstanding debt of Fannie Mae includes short-term and long-term debt and excludes debt of consolidated trusts. Short-term debt of Fannie Mae consists of borrowings with an original contractual maturity of one year or less and, therefore, doesnot include the current portion of long-term debt. Long-term debt of Fannie Mae consists of borrowings with an originalcontractual maturity of greater than one year.
The chart and table below display information on the outstanding short-term and long-term debt of Fannie Mae based onoriginal contractual maturity. The decrease in debt of Fannie Mae from December 31, 2018 to June 30, 2019 was primarilydriven by lower funding needs, as our retained mortgage portfolio continued to decline. We did not replace all of our debt ofFannie Mae that paid off during the first half of 2019 with new debt issuances.
Short-term debt
Long-term debt maturing within oneyear
Long-term debt, excluding portionmaturing within one year
Debt of Fannie Mae(1)(Dollars in billions)
12/31/2018 06/30/2019
$24.9 $22.9
$61.6 $63.0
$145.6
$232.1
$130.9
$216.8
Selected Debt InformationAs of
December 31,2018
June 30,2019
(Dollars in billions)Selected Weighted-Average Interest
Rates(1)
Interest rate on short-term debt 2.29% 2.39%Interest rate on long-term debt, includingportion maturing within one year 2.83% 3.03%
Interest rate on callable long-term debt 2.95% 3.28%
Selected Maturity DataWeighted-average maturity of debtmaturing within one year (in days) 163 121Weighted-average maturity of debtmaturing in more than one year (in months) 63 63
Other DataOutstanding callable debt $ 64.3 $ 52.9
Connecticut Avenue Securities debt(2) $ 25.6 $ 24.2
(1) Outstanding debt amounts and weighted-average interest rates reported in this chart and table include the effects of discounts, premiums,other cost basis adjustments and fair value gains and losses associated with debt that we elected to carry at fair value. Reported amountsinclude unamortized cost basis adjustments and fair value adjustments of $174 million and $432 million as of June 30, 2019 andDecember 31, 2018, respectively.
(2) Represents CAS debt issued prior to the implementation of our CAS REMIC structure in November 2018. See “MD&A—Single-FamilyBusiness—Single-Family Mortgage Credit Risk Management—Single-Family Credit Enhancement and Transfer of Mortgage Credit Risk—Credit Risk Transfer Transactions” in our 2018 Form 10-K and in this report for information regarding our Connecticut Avenue Securities.
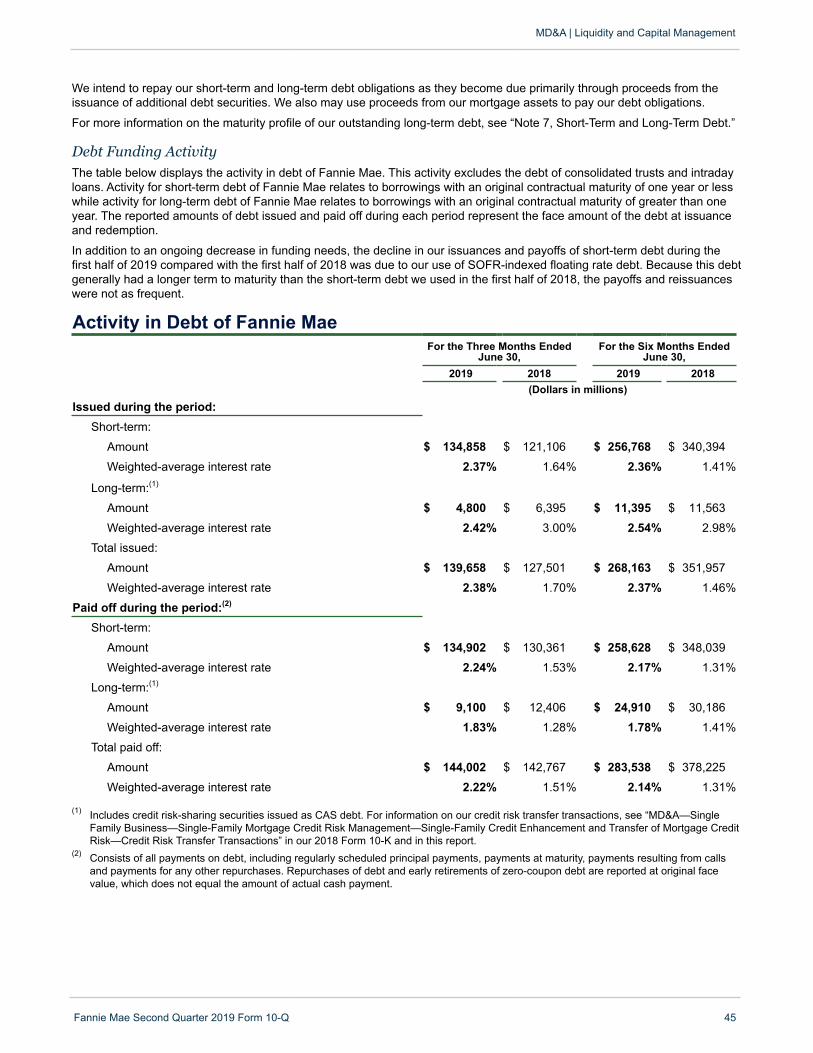
We intend to repay our short-term and long-term debt obligations as they become due primarily through proceeds from theissuance of additional debt securities. We also may use proceeds from our mortgage assets to pay our debt obligations.
For more information on the maturity profile of our outstanding long-term debt, see “Note 7, Short-Term and Long-Term Debt.”
Debt Funding Activity The table below displays the activity in debt of Fannie Mae. This activity excludes the debt of consolidated trusts and intradayloans. Activity for short-term debt of Fannie Mae relates to borrowings with an original contractual maturity of one year or lesswhile activity for long-term debt of Fannie Mae relates to borrowings with an original contractual maturity of greater than oneyear. The reported amounts of debt issued and paid off during each period represent the face amount of the debt at issuanceand redemption.
In addition to an ongoing decrease in funding needs, the decline in our issuances and payoffs of short-term debt during thefirst half of 2019 compared with the first half of 2018 was due to our use of SOFR-indexed floating rate debt. Because this debtgenerally had a longer term to maturity than the short-term debt we used in the first half of 2018, the payoffs and reissuanceswere not as frequent.
Activity in Debt of Fannie MaeFor the Three Months Ended
June 30,For the Six Months Ended
June 30,2019 2018 2019 2018
(Dollars in millions)Issued during the period:
Short-term:
Amount $ 134,858 $ 121,106 $ 256,768 $ 340,394
Weighted-average interest rate 2.37% 1.64% 2.36% 1.41%
Long-term:(1)
Amount $ 4,800 $ 6,395 $ 11,395 $ 11,563
Weighted-average interest rate 2.42% 3.00% 2.54% 2.98%
Total issued:
Amount $ 139,658 $ 127,501 $ 268,163 $ 351,957
Weighted-average interest rate 2.38% 1.70% 2.37% 1.46%
Paid off during the period:(2)
Short-term:
Amount $ 134,902 $ 130,361 $ 258,628 $ 348,039
Weighted-average interest rate 2.24% 1.53% 2.17% 1.31%
Long-term:(1)
Amount $ 9,100 $ 12,406 $ 24,910 $ 30,186
Weighted-average interest rate 1.83% 1.28% 1.78% 1.41%
Total paid off:
Amount $ 144,002 $ 142,767 $ 283,538 $ 378,225
Weighted-average interest rate 2.22% 1.51% 2.14% 1.31%
(1) Includes credit risk-sharing securities issued as CAS debt. For information on our credit risk transfer transactions, see “MD&A—SingleFamily Business—Single-Family Mortgage Credit Risk Management—Single-Family Credit Enhancement and Transfer of Mortgage CreditRisk—Credit Risk Transfer Transactions” in our 2018 Form 10-K and in this report.
(2) Consists of all payments on debt, including regularly scheduled principal payments, payments at maturity, payments resulting from callsand payments for any other repurchases. Repurchases of debt and early retirements of zero-coupon debt are reported at original facevalue, which does not equal the amount of actual cash payment.
MD&A | Liquidity and Capital Management
Fannie Mae Second Quarter 2019 Form 10-Q 45

Other Investments Portfolio The chart below displays information on the composition of our other investments portfolio. The balance of our otherinvestments portfolio fluctuates as a result of changes in our cash flows, liquidity in the fixed-income markets, and our liquidityrisk management framework and practices.
Other Investments Portfolio (Dollars in billions)
Cash and cash equivalents
Federal funds sold and securities purchased under agreements to resell or similar arrangements
U.S. Treasury securities
12/31/2018 06/30/2019
$25.6 $30.8
$32.9 $19.6
$35.5
$94.0
$35.3
$85.7
MD&A | Liquidity and Capital Management
Fannie Mae Second Quarter 2019 Form 10-Q 46
Cash FlowsSix Months Ended June 30, 2019. Cash, cash equivalents and restricted cash increased from $49.4 billion as of December 31,2018 to $61.0 billion as of June 30, 2019. The increase was primarily driven by cash inflows from the sale of Fannie Mae MBSto third parties and the net decrease in federal funds sold and securities purchased under agreements to resell or similaragreements.
Partially offsetting these cash inflows were cash outflows primarily from purchases of loans held for investment and theredemption of funding debt, which outpaced issuances, due to lower funding needs.
Six Months Ended June 30, 2018. Cash, cash equivalents and restricted cash decreased from $60.3 billion as of December31, 2017 to $48.7 billion as of June 30, 2018. The decrease was primarily driven by cash outflows from (1) the redemption offunding debt, which outpaced issuances, due to lower funding needs, (2) the purchase of Fannie Mae MBS from third parties,and (3) the acquisition of delinquent loans out of MBS trusts.
Partially offsetting these cash outflows were cash inflows from, among other things, (1) the sale of Fannie Mae MBS to thirdparties and (2) proceeds from repayments and sales of loans of Fannie Mae.
Credit Ratings As of June 30, 2019, our credit ratings have not changed since we filed our 2018 Form 10-K. For information on our creditratings, see “MD&A—Liquidity and Capital Management—Liquidity Management—Credit Ratings” in our 2018 Form 10-K.
Capital Management
Regulatory Capital The deficit of our core capital over statutory minimum capital was $137.0 billion as of June 30, 2019 and $137.1 billion as ofDecember 31, 2018. For information on our current and proposed capital requirements, see “Business—Charter Act andRegulation—GSE Act and Other Regulation” and “Note 12, Regulatory Capital Requirements” in our 2018 Form 10-K.

Capital Activity The current dividend provisions of the senior preferred stock provide for quarterly dividends consisting of the amount, if any, bywhich our net worth as of the end of the immediately preceding fiscal quarter exceeds a $3.0 billion capital reserve amount.Because we had a net worth of $5.4 billion as of March 31, 2019, we paid Treasury a second quarter 2019 dividend of $2.4billion on June 28, 2019. We expect to pay Treasury a third quarter 2019 dividend of $3.4 billion by September 30, 2019 basedon our net worth of $6.4 billion as of June 30, 2019.
See “Business—Conservatorship, Treasury Agreements and Housing Finance Reform—Treasury Agreements” in our 2018Form 10-K for more information on the terms of our senior preferred stock and our senior preferred stock purchase agreementwith Treasury. See “Risk Factors” in our 2018 Form 10-K for a discussion of the risks associated with the limit on our capitalreserves.
MD&A | Liquidity and Capital Management
Fannie Mae Second Quarter 2019 Form 10-Q 47
Off-Balance Sheet Arrangements
Our off-balance sheet arrangements result primarily from the following:
• our guaranty of mortgage loan securitization and resecuritization transactions, and other guaranty commitments, overwhich we do not have control;
• liquidity support transactions; and
• partnership interests.
Following our implementation of the Single Security Initiative in June 2019, some of the securities we issue are structuredsecurities backed, in whole or in part, by Freddie Mac securities. When we issue a structured security, we provide a guarantythat we will supplement amounts received from the underlying mortgage-related security as required to permit timely paymentof principal and interest on the certificates related to the resecuritization trust. Accordingly, when we issue structured securitiesbacked in whole or in part by Freddie Mac securities, we extend our guaranty to the underlying Freddie Mac security includedin the structured security. Our issuance of structured securities backed in whole or in part by Freddie Mac securities createsadditional off-balance sheet exposure as we do not have control over the Freddie Mac mortgage loan securitizations. Becausewe do not have the power to direct matters (primarily the servicing of mortgage loans) that impact the credit risk to which weare exposed, which constitute control of these securitization trusts, we do not consolidate these trusts in our condensedconsolidated balance sheet, giving rise to off-balance sheet exposure.
The total amount of our off-balance sheet exposure related to unconsolidated Fannie Mae MBS net of any beneficial interestthat we retain, and other financial guarantees was $27.9 billion as of June 30, 2019. Approximately $5.7 billion of this amountconsisted of the unpaid principal balance of Freddie Mac-issued UMBS backing Fannie Mae-issued Supers. Additionally, off-balance sheet exposure includes approximately $2.0 billion of the unpaid principal balance of Freddie Mac securities backingFannie Mae-issued REMICs; however, a portion of these Freddie Mac securities may be backed in whole or in part by FannieMae MBS. Therefore, our total exposure to Freddie Mac securities included in Fannie Mae REMIC collateral may be lower. Weexpect our off-balance sheet exposure to Freddie Mac securities to increase as we issue more structured securities backed byFreddie Mac securities in the future. The total amount of our off-balance sheet exposure related to unconsolidated Fannie MaeMBS and other financial guarantees was $21.1 billion as of December 31, 2018. We did not have any Freddie Mac-issuedUMBS backing Fannie Mae structured securities as of December 31, 2018.
We also have off-balance sheet exposure to losses from liquidity support transactions and partnership interests.
• Our total outstanding liquidity commitments to advance funds for securities backed by multifamily housing revenuebonds totaled $7.7 billion as of June 30, 2019 and $8.3 billion as of December 31, 2018. These commitments requireus to advance funds to third parties that enable them to repurchase tendered bonds or securities that are unable tobe remarketed. We hold cash and cash equivalents in our other investments portfolio in excess of thesecommitments to advance funds.
• We make investments in various limited partnerships and similar legal entities, which consist of low-income housingtax credit investments, community investments and other entities. When we do not have a controlling financialinterest in those entities, our condensed consolidated balance sheets reflect only our investment rather than the fullamount of the partnership’s assets and liabilities.
Risk Management
Our business activities expose us to the following major categories of risk: credit risk (including mortgage credit risk andinstitutional counterparty credit risk), market risk (including interest rate risk), liquidity and funding risk and operational risk(including cyber/information security risk, third-party risk and model risk), as well as strategic risk, compliance risk andreputational risk. See “MD&A—Risk Management” in our 2018 Form 10-K for a discussion of our management of these risks.
MD&A | Risk Management
Fannie Mae Second Quarter 2019 Form 10-Q 48
Institutional Counterparty Credit Risk Management This section updates our discussion of institutional counterparty credit risk management in our 2018 Form 10-K. See “MD&A—Risk Management—Institutional Counterparty Credit Risk Management” and “Risk Factors—Credit Risk” in our 2018 Form 10-K for additional information, including our exposure to institutional counterparty credit risk and our strategy for managing thisrisk.
Counterparty Credit Risk Exposure arising from the Single Security InitiativeThe Single Security Initiative has increased our credit risk exposure and operational risk exposure to Freddie Mac, and our riskexposure to Freddie Mac is expected to increase as we issue more structured securities backed by Freddie Mac securitiesgoing forward. With implementation of the Single Security Initiative, we now issue structured securities backed by Fannie MaeMBS, Freddie Mac securities, or both. Our inclusion of Freddie Mac securities as collateral for the structured securities that weissue increases our counterparty credit risk exposure to Freddie Mac. In the event Freddie Mac were to fail (for credit oroperational reasons) to make a payment on a payment date on Freddie Mac securities that we had resecuritized in a FannieMae-issued structured security, we would be responsible for making the entire payment on the Freddie Mac securities includedin that structured security in order to make payments on any of our outstanding single-family Fannie Mae MBS to be paid onthat payment date. Accordingly, as the amount of structured securities we issue that are backed by Freddie Mac securitiesgrows, if Freddie Mac were to fail to meet its obligations to us under the terms of these securities, it could have a materialadverse effect on our earnings and financial condition. We believe the risk of default by Freddie Mac is negligible because ofthe funding commitment available to Freddie Mac through its senior preferred stock purchase agreement with Treasury. Asdescribed in “Single Security Initiative & Common Securitization Platform,” in June 2019, we and Freddie Mac entered into anindemnification agreement pursuant to which Freddie Mac has agreed to indemnify us for losses caused by its failure to meetits payment and certain other obligations relating to the Freddie Mac securities that we have resecuritized into Fannie Mae-issued structured securities.
As of June 30, 2019, approximately $7.7 billion in Freddie Mac securities were backing Fannie Mae-issued structuredsecurities. We had no such transactions or activity in 2018. See “Single Security Initiative & Common Securitization Platform”and “Risk Factors” in this report for more information on the Single Security Initiative and the risks associated with the SingleSecurity Initiative.
Market Risk Management, Including Interest Rate Risk Management
This section supplements and updates information regarding market risk management in our 2018 Form 10-K. See “MD&A—Risk Management—Market Risk Management, Including Interest Rate Risk Management” and “Risk Factors” in our 2018Form 10-K for additional information, including our sources of interest rate risk exposure, business risks posed by changes ininterest rates, and our strategy for managing interest rate risk.
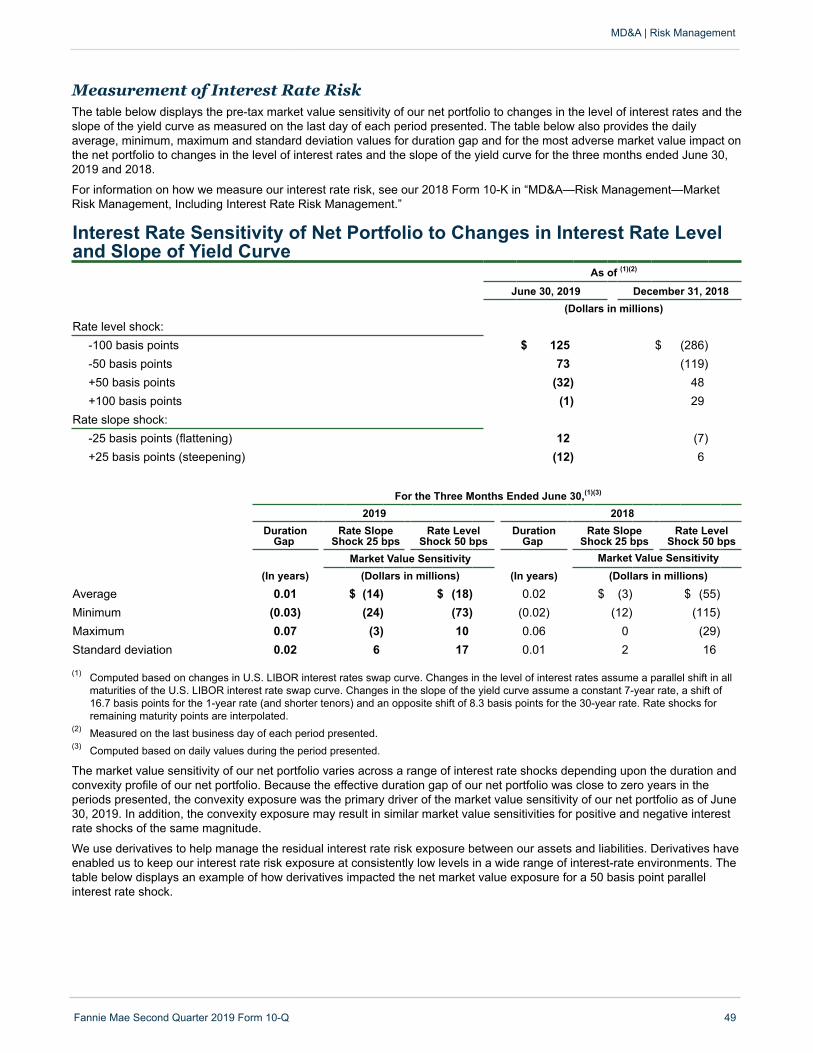
Measurement of Interest Rate Risk The table below displays the pre-tax market value sensitivity of our net portfolio to changes in the level of interest rates and theslope of the yield curve as measured on the last day of each period presented. The table below also provides the dailyaverage, minimum, maximum and standard deviation values for duration gap and for the most adverse market value impact onthe net portfolio to changes in the level of interest rates and the slope of the yield curve for the three months ended June 30,2019 and 2018.
For information on how we measure our interest rate risk, see our 2018 Form 10-K in “MD&A—Risk Management—MarketRisk Management, Including Interest Rate Risk Management.”
Interest Rate Sensitivity of Net Portfolio to Changes in Interest Rate Leveland Slope of Yield Curve
As of (1)(2)
June 30, 2019 December 31, 2018(Dollars in millions)
Rate level shock:-100 basis points $ 125 $ (286)-50 basis points 73 (119)+50 basis points (32) 48+100 basis points (1) 29
Rate slope shock:-25 basis points (flattening) 12 (7)+25 basis points (steepening) (12) 6
For the Three Months Ended June 30,(1)(3)
2019 2018Duration
GapRate Slope
Shock 25 bpsRate Level
Shock 50 bpsDuration
GapRate Slope
Shock 25 bpsRate Level
Shock 50 bpsMarket Value Sensitivity Market Value Sensitivity
(In years) (Dollars in millions) (In years) (Dollars in millions)Average 0.01 $ (14) $ (18) 0.02 $ (3) $ (55)Minimum (0.03) (24) (73) (0.02) (12) (115)Maximum 0.07 (3) 10 0.06 0 (29)Standard deviation 0.02 6 17 0.01 2 16
(1) Computed based on changes in U.S. LIBOR interest rates swap curve. Changes in the level of interest rates assume a parallel shift in allmaturities of the U.S. LIBOR interest rate swap curve. Changes in the slope of the yield curve assume a constant 7-year rate, a shift of16.7 basis points for the 1-year rate (and shorter tenors) and an opposite shift of 8.3 basis points for the 30-year rate. Rate shocks forremaining maturity points are interpolated.
(2) Measured on the last business day of each period presented. (3) Computed based on daily values during the period presented.
The market value sensitivity of our net portfolio varies across a range of interest rate shocks depending upon the duration andconvexity profile of our net portfolio. Because the effective duration gap of our net portfolio was close to zero years in theperiods presented, the convexity exposure was the primary driver of the market value sensitivity of our net portfolio as of June30, 2019. In addition, the convexity exposure may result in similar market value sensitivities for positive and negative interestrate shocks of the same magnitude.
We use derivatives to help manage the residual interest rate risk exposure between our assets and liabilities. Derivatives haveenabled us to keep our interest rate risk exposure at consistently low levels in a wide range of interest-rate environments. Thetable below displays an example of how derivatives impacted the net market value exposure for a 50 basis point parallelinterest rate shock.
MD&A | Risk Management
Fannie Mae Second Quarter 2019 Form 10-Q 49
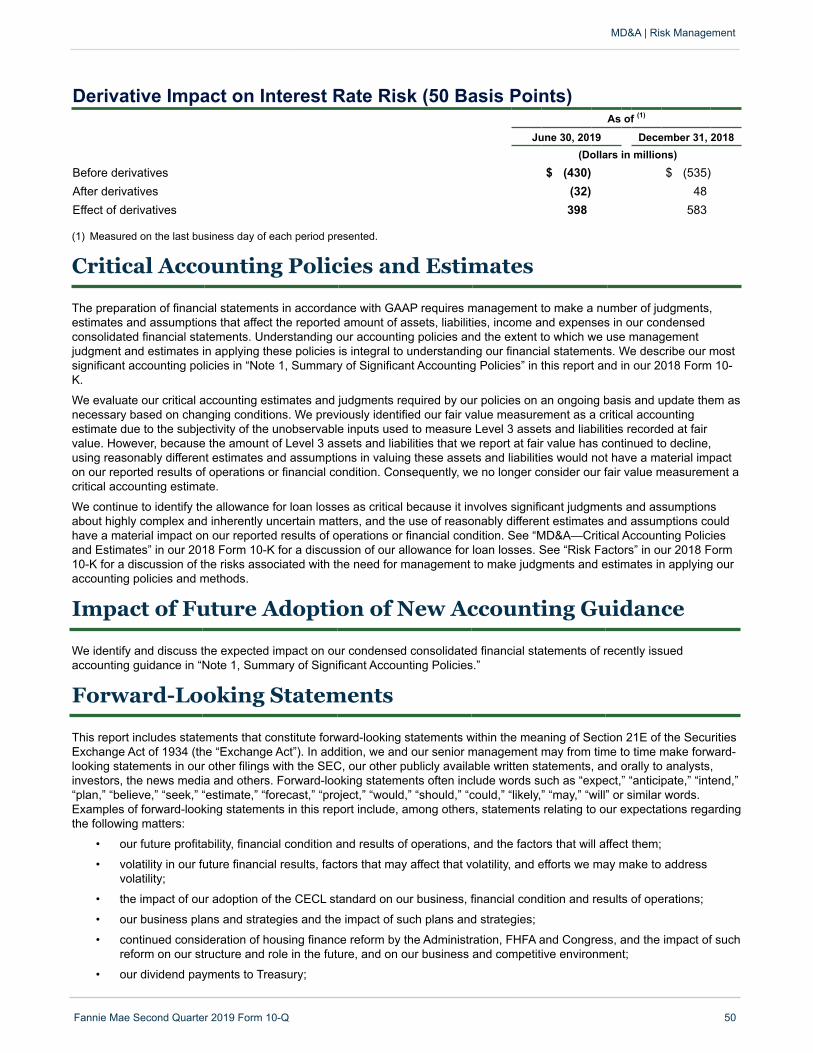
Derivative Impact on Interest Rate Risk (50 Basis Points)As of (1)
June 30, 2019 December 31, 2018(Dollars in millions)
Before derivatives $ (430) $ (535)After derivatives (32) 48Effect of derivatives 398 583
(1) Measured on the last business day of each period presented.
MD&A | Risk Management
Fannie Mae Second Quarter 2019 Form 10-Q 50
Critical Accounting Policies and Estimates
The preparation of financial statements in accordance with GAAP requires management to make a number of judgments,estimates and assumptions that affect the reported amount of assets, liabilities, income and expenses in our condensedconsolidated financial statements. Understanding our accounting policies and the extent to which we use managementjudgment and estimates in applying these policies is integral to understanding our financial statements. We describe our mostsignificant accounting policies in “Note 1, Summary of Significant Accounting Policies” in this report and in our 2018 Form 10-K.
We evaluate our critical accounting estimates and judgments required by our policies on an ongoing basis and update them asnecessary based on changing conditions. We previously identified our fair value measurement as a critical accountingestimate due to the subjectivity of the unobservable inputs used to measure Level 3 assets and liabilities recorded at fairvalue. However, because the amount of Level 3 assets and liabilities that we report at fair value has continued to decline,using reasonably different estimates and assumptions in valuing these assets and liabilities would not have a material impacton our reported results of operations or financial condition. Consequently, we no longer consider our fair value measurement acritical accounting estimate.
We continue to identify the allowance for loan losses as critical because it involves significant judgments and assumptionsabout highly complex and inherently uncertain matters, and the use of reasonably different estimates and assumptions couldhave a material impact on our reported results of operations or financial condition. See “MD&A—Critical Accounting Policiesand Estimates” in our 2018 Form 10-K for a discussion of our allowance for loan losses. See “Risk Factors” in our 2018 Form10-K for a discussion of the risks associated with the need for management to make judgments and estimates in applying ouraccounting policies and methods.
Impact of Future Adoption of New Accounting Guidance
We identify and discuss the expected impact on our condensed consolidated financial statements of recently issuedaccounting guidance in “Note 1, Summary of Significant Accounting Policies.”
Forward-Looking Statements
This report includes statements that constitute forward-looking statements within the meaning of Section 21E of the SecuritiesExchange Act of 1934 (the “Exchange Act”). In addition, we and our senior management may from time to time make forward-looking statements in our other filings with the SEC, our other publicly available written statements, and orally to analysts,investors, the news media and others. Forward-looking statements often include words such as “expect,” “anticipate,” “intend,”“plan,” “believe,” “seek,” “estimate,” “forecast,” “project,” “would,” “should,” “could,” “likely,” “may,” “will” or similar words.Examples of forward-looking statements in this report include, among others, statements relating to our expectations regardingthe following matters:
• our future profitability, financial condition and results of operations, and the factors that will affect them;
• volatility in our future financial results, factors that may affect that volatility, and efforts we may make to addressvolatility;
• the impact of our adoption of the CECL standard on our business, financial condition and results of operations;
• our business plans and strategies and the impact of such plans and strategies;
• continued consideration of housing finance reform by the Administration, FHFA and Congress, and the impact of suchreform on our structure and role in the future, and on our business and competitive environment;
• our dividend payments to Treasury;
• our retained mortgage portfolio;
• the impact of legislation and regulation on our business or financial results;
• our payments to HUD and Treasury funds under the GSE Act;
• our plans relating to and the effects of our credit risk transfer transactions;
• factors that could affect or mitigate our credit risk exposure;
• mortgage market and economic conditions (including home price appreciation rates) and the impact of suchconditions on our business or financial results;
• the risks to our business;
• our loan acquisitions, the credit risk profile of such acquisitions, and the factors that will affect them; and
• our response to legal and regulatory proceedings and their impact on our business or financial condition.
Forward-looking statements reflect our management’s current expectations, forecasts or predictions of future conditions,events or results based on various assumptions and management’s estimates of trends and economic factors in the marketsin which we are active and that otherwise impact our business plans. Forward-looking statements are not guaranties of futureperformance. By their nature, forward-looking statements are subject to risks and uncertainties. Our actual results andfinancial condition may differ, possibly materially, from the anticipated results and financial condition indicated in these forward-looking statements.
There are a number of factors that could cause actual conditions, events or results to differ materially from those described inour forward-looking statements, including, among others, the following:
• the uncertainty of our future;
• future legislative and regulatory requirements or changes affecting us, such as the enactment of housing financereform legislation (including all or any portion of Treasury’s Housing Reform Plan);
• actions by FHFA, Treasury, HUD, the CFPB or other regulators that affect our business;
• changes in the structure and regulation of the financial services industry;
• the timing and level of, as well as regional variation in, home price changes;
• changes in interest rates and credit spreads;
• uncertainties relating to the potential discontinuance of LIBOR, or other market changes that could impact the loanswe own or guarantee or our MBS;
• credit availability;
• disruptions or instability in the housing and credit markets;
• the size and our share of the U.S. mortgage market and the factors that affect them, including population growth andhousehold formation;
• growth, deterioration and the overall health and stability of the U.S. economy, including the U.S. GDP, unemploymentrates, personal income and other indicators thereof;
• changes in the fiscal and monetary policies of the Federal Reserve;
• our and our competitors’ future guaranty fee pricing and the impact of that pricing on our competitive environment andguaranty fee revenues;
• the volume of mortgage originations;
• the size, composition and quality of our guaranty book of business and retained mortgage portfolio;
• the competitive environment in which we operate, including the impact of legislative or other developments on levelsof competition in our industry and other factors affecting our market share;
• the life of the loans in our guaranty book of business;
• challenges we face in retaining and hiring qualified executives and other employees;
• our future serious delinquency rates;
• the deteriorated credit performance of many loans in our guaranty book of business;
• changes in the demand for Fannie Mae MBS, in general or from one or more major groups of investors;
• our conservatorship, including any changes to or termination (by receivership or otherwise) of the conservatorshipand its effect on our business;
• the investment by Treasury and its effect on our business;
MD&A | Forward-Looking Statements
Fannie Mae Second Quarter 2019 Form 10-Q 51
• adverse effects from activities we undertake to support the mortgage market and help borrowers;
• actions we may be required to take by FHFA, in its role as our conservator or as our regulator, such as changes in thetype of business we do or actions relating to the Single Security Initiative;
• limitations on our business imposed by FHFA, in its role as our conservator or as our regulator;
• our future objectives and activities in support of those objectives, including actions we may take to reach additionalunderserved creditworthy borrowers;
• a decrease in our credit ratings;
• limitations on our ability to access the debt capital markets;
• significant changes in modification and foreclosure activity;
• the volume and pace of future nonperforming and reperforming loan sales and their impact on our results and seriousdelinquency rates;
• changes in borrower behavior;
• the effectiveness of our loss mitigation strategies, management of our REO inventory and pursuit of contractualremedies;
• defaults by one or more institutional counterparties;
• resolution or settlement agreements we may enter into with our counterparties;
• our need to rely on third parties to fully achieve some of our corporate objectives;
• our reliance on mortgage servicers;
• changes in GAAP, guidance by the Financial Accounting Standards Board and changes to our accounting policies;
• changes in the fair value of our assets and liabilities;
• the stability and adequacy of the systems and infrastructure that impact our operations, including ours and those ofCSS, our other counterparties and other third parties;
• operational control weaknesses;
• our reliance on models and future updates we make to our models, including the assumptions used by these models;
• domestic and global political risks and uncertainties;
• natural disasters, environmental disasters, terrorist attacks, pandemics or other major disruptive events;
• cyber attacks or other information security breaches or threats; and
• the other factors described in “Risk Factors” in this report and in our 2018 Form 10-K.
Readers are cautioned not to unduly rely on the forward-looking statements we make and to place these forward-lookingstatements into proper context by carefully considering the factors discussed in “Risk Factors” in our 2018 Form 10-K and inthis report. These forward-looking statements are representative only as of the date they are made, and we undertake noobligation to update any forward-looking statement as a result of new information, future events or otherwise, except asrequired under the federal securities laws.
MD&A | Forward-Looking Statements
Fannie Mae Second Quarter 2019 Form 10-Q 52
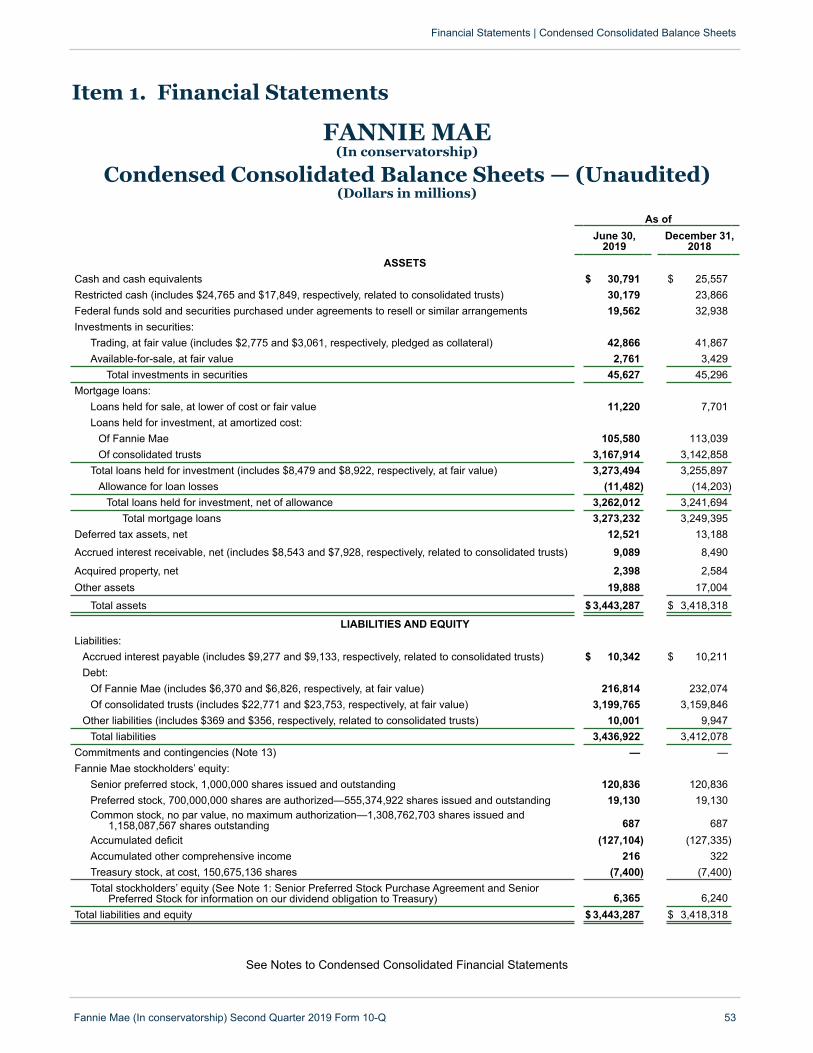
Item 1. Financial Statements
Financial Statements | Condensed Consolidated Balance Sheets
Fannie Mae (In conservatorship) Second Quarter 2019 Form 10-Q 53
FANNIE MAE(In conservatorship)
Condensed Consolidated Balance Sheets — (Unaudited)(Dollars in millions)
As ofJune 30,
2019December 31,
2018ASSETS
Cash and cash equivalents $ 30,791 $ 25,557Restricted cash (includes $24,765 and $17,849, respectively, related to consolidated trusts) 30,179 23,866Federal funds sold and securities purchased under agreements to resell or similar arrangements 19,562 32,938Investments in securities:
Trading, at fair value (includes $2,775 and $3,061, respectively, pledged as collateral) 42,866 41,867Available-for-sale, at fair value 2,761 3,429
Total investments in securities 45,627 45,296Mortgage loans:
Loans held for sale, at lower of cost or fair value 11,220 7,701Loans held for investment, at amortized cost:
Of Fannie Mae 105,580 113,039Of consolidated trusts 3,167,914 3,142,858
Total loans held for investment (includes $8,479 and $8,922, respectively, at fair value) 3,273,494 3,255,897Allowance for loan losses (11,482) (14,203)
Total loans held for investment, net of allowance 3,262,012 3,241,694Total mortgage loans 3,273,232 3,249,395
Deferred tax assets, net 12,521 13,188
Accrued interest receivable, net (includes $8,543 and $7,928, respectively, related to consolidated trusts) 9,089 8,490
Acquired property, net 2,398 2,584Other assets 19,888 17,004
Total assets $ 3,443,287 $ 3,418,318
LIABILITIES AND EQUITYLiabilities:
Accrued interest payable (includes $9,277 and $9,133, respectively, related to consolidated trusts) $ 10,342 $ 10,211Debt:
Of Fannie Mae (includes $6,370 and $6,826, respectively, at fair value) 216,814 232,074Of consolidated trusts (includes $22,771 and $23,753, respectively, at fair value) 3,199,765 3,159,846
Other liabilities (includes $369 and $356, respectively, related to consolidated trusts) 10,001 9,947Total liabilities 3,436,922 3,412,078
Commitments and contingencies (Note 13) — —Fannie Mae stockholders’ equity:
Senior preferred stock, 1,000,000 shares issued and outstanding 120,836 120,836Preferred stock, 700,000,000 shares are authorized—555,374,922 shares issued and outstanding 19,130 19,130Common stock, no par value, no maximum authorization—1,308,762,703 shares issued and
1,158,087,567 shares outstanding 687 687Accumulated deficit (127,104) (127,335)Accumulated other comprehensive income 216 322Treasury stock, at cost, 150,675,136 shares (7,400) (7,400)Total stockholders’ equity (See Note 1: Senior Preferred Stock Purchase Agreement and Senior
Preferred Stock for information on our dividend obligation to Treasury) 6,365 6,240Total liabilities and equity $ 3,443,287 $ 3,418,318
See Notes to Condensed Consolidated Financial Statements
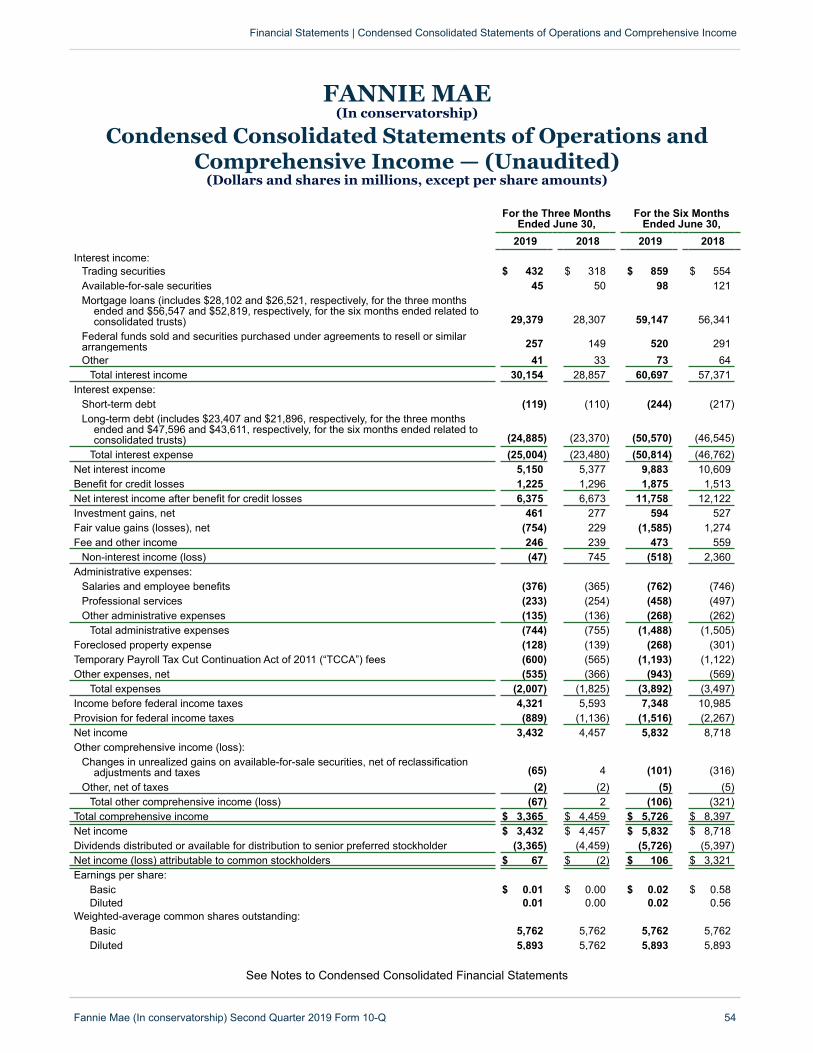
FANNIE MAE(In conservatorship)
Condensed Consolidated Statements of Operations andComprehensive Income — (Unaudited)
(Dollars and shares in millions, except per share amounts)
For the Three MonthsEnded June 30,
For the Six MonthsEnded June 30,
2019 2018 2019 2018Interest income:
Trading securities $ 432 $ 318 $ 859 $ 554Available-for-sale securities 45 50 98 121Mortgage loans (includes $28,102 and $26,521, respectively, for the three months
ended and $56,547 and $52,819, respectively, for the six months ended related toconsolidated trusts) 29,379 28,307 59,147 56,341
Federal funds sold and securities purchased under agreements to resell or similararrangements 257 149 520 291Other 41 33 73 64
Total interest income 30,154 28,857 60,697 57,371Interest expense:
Short-term debt (119) (110) (244) (217)Long-term debt (includes $23,407 and $21,896, respectively, for the three months
ended and $47,596 and $43,611, respectively, for the six months ended related toconsolidated trusts) (24,885) (23,370) (50,570) (46,545)
Total interest expense (25,004) (23,480) (50,814) (46,762)Net interest income 5,150 5,377 9,883 10,609Benefit for credit losses 1,225 1,296 1,875 1,513Net interest income after benefit for credit losses 6,375 6,673 11,758 12,122Investment gains, net 461 277 594 527Fair value gains (losses), net (754) 229 (1,585) 1,274Fee and other income 246 239 473 559
Non-interest income (loss) (47) 745 (518) 2,360Administrative expenses:
Salaries and employee benefits (376) (365) (762) (746)Professional services (233) (254) (458) (497)Other administrative expenses (135) (136) (268) (262)
Total administrative expenses (744) (755) (1,488) (1,505)Foreclosed property expense (128) (139) (268) (301)Temporary Payroll Tax Cut Continuation Act of 2011 (“TCCA”) fees (600) (565) (1,193) (1,122)Other expenses, net (535) (366) (943) (569)
Total expenses (2,007) (1,825) (3,892) (3,497)Income before federal income taxes 4,321 5,593 7,348 10,985Provision for federal income taxes (889) (1,136) (1,516) (2,267)Net income 3,432 4,457 5,832 8,718Other comprehensive income (loss):
Changes in unrealized gains on available-for-sale securities, net of reclassificationadjustments and taxes (65) 4 (101) (316)
Other, net of taxes (2) (2) (5) (5)Total other comprehensive income (loss) (67) 2 (106) (321)
Total comprehensive income $ 3,365 $ 4,459 $ 5,726 $ 8,397Net income $ 3,432 $ 4,457 $ 5,832 $ 8,718Dividends distributed or available for distribution to senior preferred stockholder (3,365) (4,459) (5,726) (5,397)Net income (loss) attributable to common stockholders $ 67 $ (2) $ 106 $ 3,321Earnings per share:
Basic $ 0.01 $ 0.00 $ 0.02 $ 0.58Diluted 0.01 0.00 0.02 0.56
Weighted-average common shares outstanding:Basic 5,762 5,762 5,762 5,762Diluted 5,893 5,762 5,893 5,893
See Notes to Condensed Consolidated Financial Statements
Financial Statements | Condensed Consolidated Statements of Operations and Comprehensive Income
Fannie Mae (In conservatorship) Second Quarter 2019 Form 10-Q 54
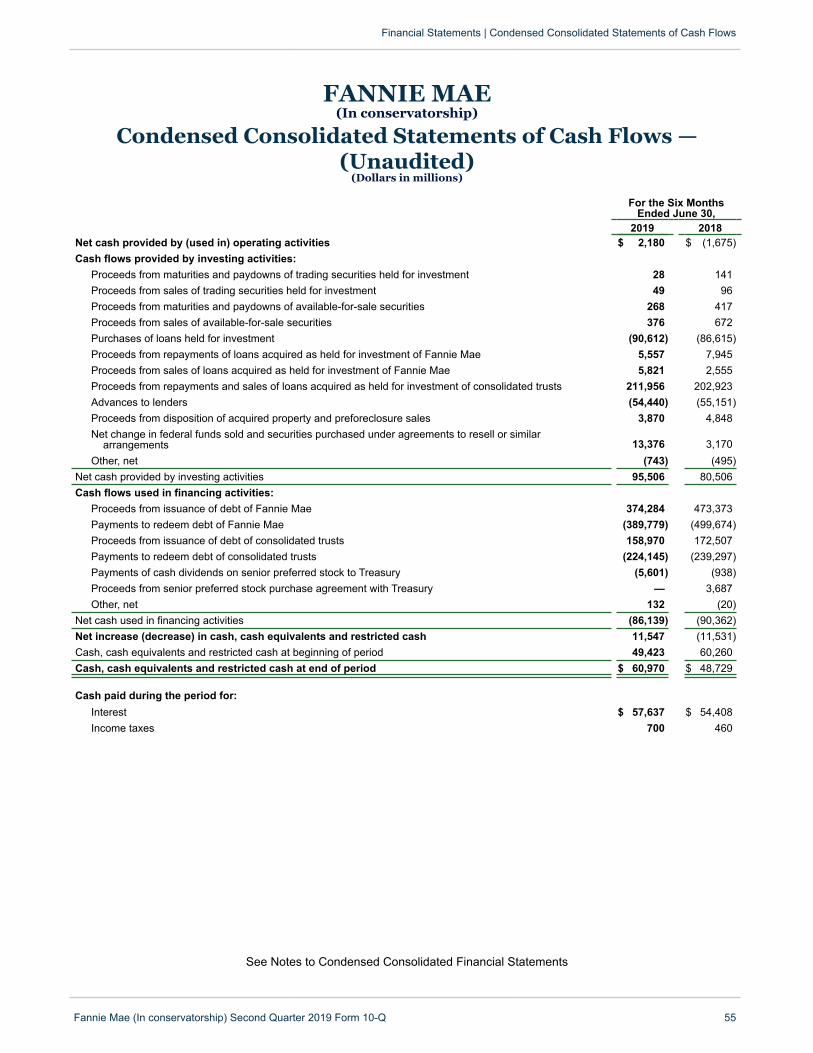
FANNIE MAE(In conservatorship)
Condensed Consolidated Statements of Cash Flows —(Unaudited)
(Dollars in millions)
For the Six MonthsEnded June 30,
2019 2018Net cash provided by (used in) operating activities $ 2,180 $ (1,675)Cash flows provided by investing activities:
Proceeds from maturities and paydowns of trading securities held for investment 28 141Proceeds from sales of trading securities held for investment 49 96Proceeds from maturities and paydowns of available-for-sale securities 268 417Proceeds from sales of available-for-sale securities 376 672Purchases of loans held for investment (90,612) (86,615)Proceeds from repayments of loans acquired as held for investment of Fannie Mae 5,557 7,945Proceeds from sales of loans acquired as held for investment of Fannie Mae 5,821 2,555Proceeds from repayments and sales of loans acquired as held for investment of consolidated trusts 211,956 202,923Advances to lenders (54,440) (55,151)Proceeds from disposition of acquired property and preforeclosure sales 3,870 4,848Net change in federal funds sold and securities purchased under agreements to resell or similar
arrangements 13,376 3,170Other, net (743) (495)
Net cash provided by investing activities 95,506 80,506Cash flows used in financing activities:
Proceeds from issuance of debt of Fannie Mae 374,284 473,373Payments to redeem debt of Fannie Mae (389,779) (499,674)Proceeds from issuance of debt of consolidated trusts 158,970 172,507Payments to redeem debt of consolidated trusts (224,145) (239,297)Payments of cash dividends on senior preferred stock to Treasury (5,601) (938)Proceeds from senior preferred stock purchase agreement with Treasury — 3,687Other, net 132 (20)
Net cash used in financing activities (86,139) (90,362)Net increase (decrease) in cash, cash equivalents and restricted cash 11,547 (11,531)Cash, cash equivalents and restricted cash at beginning of period 49,423 60,260Cash, cash equivalents and restricted cash at end of period $ 60,970 $ 48,729
Cash paid during the period for:Interest $ 57,637 $ 54,408Income taxes 700 460
See Notes to Condensed Consolidated Financial Statements
Financial Statements | Condensed Consolidated Statements of Cash Flows
Fannie Mae (In conservatorship) Second Quarter 2019 Form 10-Q 55
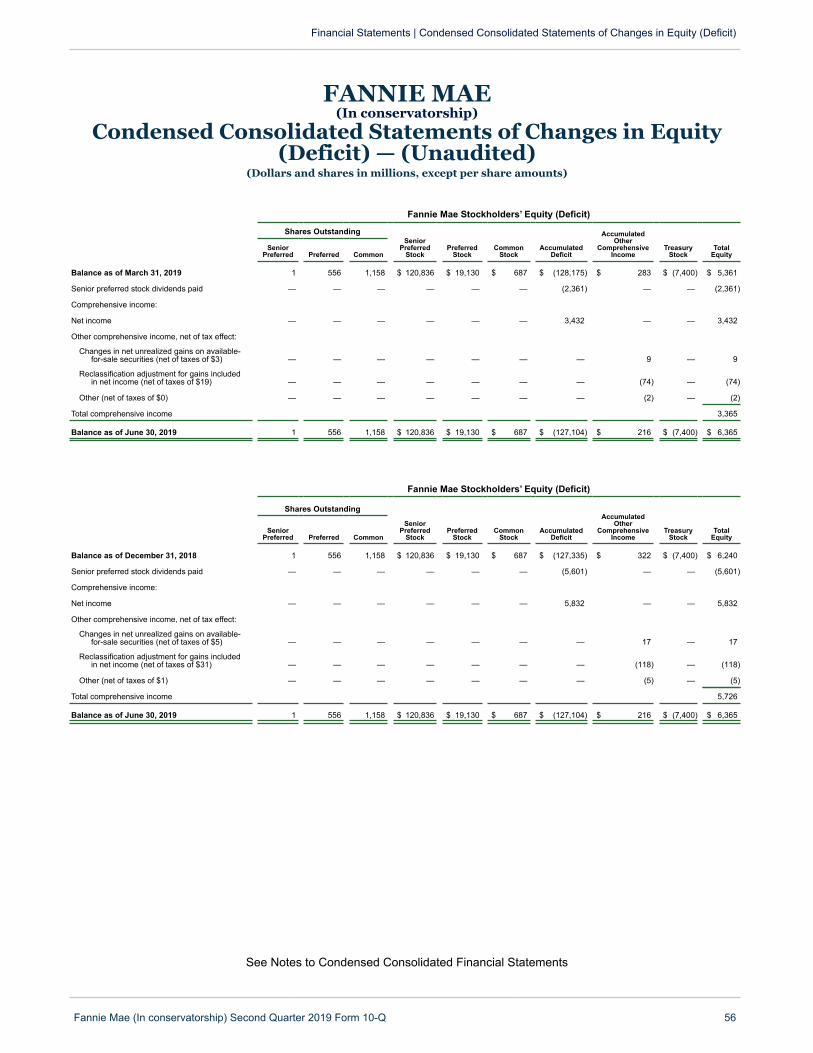
FANNIE MAE(In conservatorship)
Condensed Consolidated Statements of Changes in Equity(Deficit) — (Unaudited)
(Dollars and shares in millions, except per share amounts)
Fannie Mae Stockholders’ Equity (Deficit)
Shares OutstandingSenior
PreferredStock
PreferredStock
CommonStock
AccumulatedDeficit
Accumulated Other
ComprehensiveIncome
TreasuryStock
TotalEquity
SeniorPreferred Preferred Common
Balance as of March 31, 2019 1 556 1,158 $ 120,836 $ 19,130 $ 687 $ (128,175) $ 283 $ (7,400) $ 5,361
Senior preferred stock dividends paid — — — — — — (2,361) — — (2,361)
Comprehensive income:
Net income — — — — — — 3,432 — — 3,432
Other comprehensive income, net of tax effect:
Changes in net unrealized gains on available-for-sale securities (net of taxes of $3) — — — — — — — 9 — 9
Reclassification adjustment for gains includedin net income (net of taxes of $19) — — — — — — — (74) — (74)
Other (net of taxes of $0) — — — — — — — (2) — (2)
Total comprehensive income 3,365
Balance as of June 30, 2019 1 556 1,158 $ 120,836 $ 19,130 $ 687 $ (127,104) $ 216 $ (7,400) $ 6,365
Fannie Mae Stockholders’ Equity (Deficit)
Shares Outstanding
SeniorPreferred
StockPreferred
StockCommon
StockAccumulated
Deficit
Accumulated Other
ComprehensiveIncome
TreasuryStock
TotalEquity
SeniorPreferred Preferred Common
Balance as of December 31, 2018 1 556 1,158 $ 120,836 $ 19,130 $ 687 $ (127,335) $ 322 $ (7,400) $ 6,240
Senior preferred stock dividends paid — — — — — — (5,601) — — (5,601)
Comprehensive income:
Net income — — — — — — 5,832 — — 5,832
Other comprehensive income, net of tax effect:
Changes in net unrealized gains on available-for-sale securities (net of taxes of $5) — — — — — — — 17 — 17
Reclassification adjustment for gains includedin net income (net of taxes of $31) — — — — — — — (118) — (118)
Other (net of taxes of $1) — — — — — — — (5) — (5)
Total comprehensive income 5,726
Balance as of June 30, 2019 1 556 1,158 $ 120,836 $ 19,130 $ 687 $ (127,104) $ 216 $ (7,400) $ 6,365
See Notes to Condensed Consolidated Financial Statements
Financial Statements | Condensed Consolidated Statements of Changes in Equity (Deficit)
Fannie Mae (In conservatorship) Second Quarter 2019 Form 10-Q 56
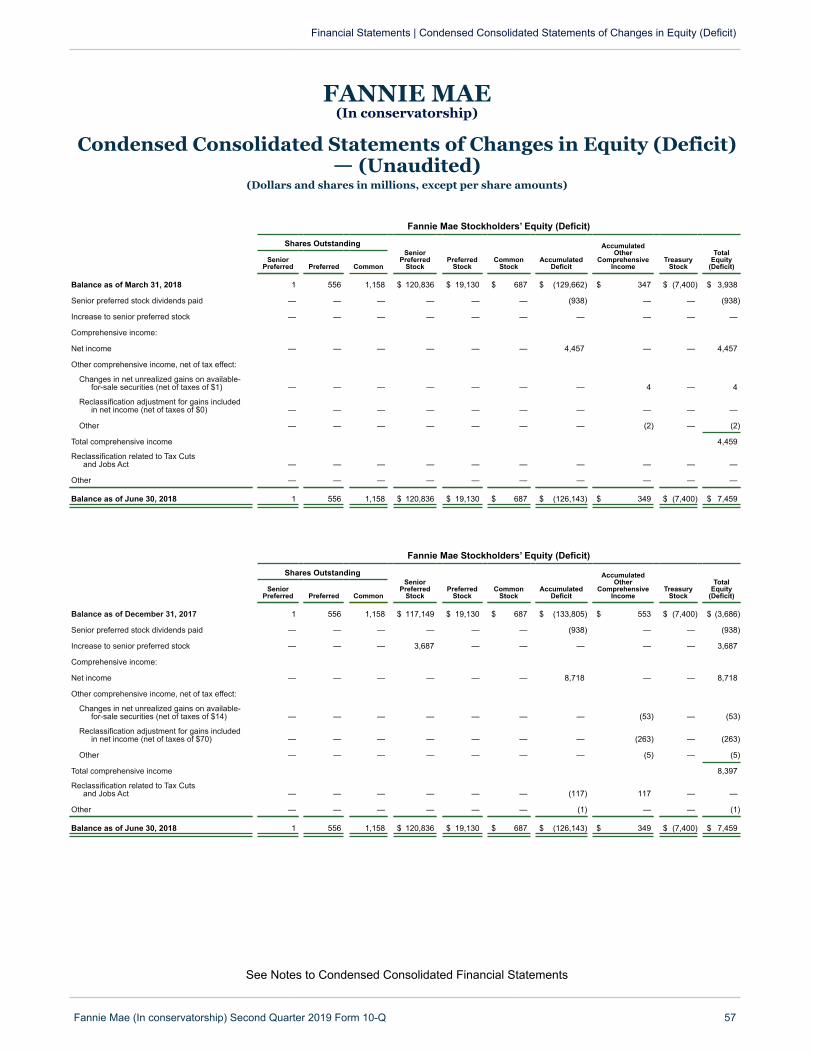
FANNIE MAE(In conservatorship)
Condensed Consolidated Statements of Changes in Equity (Deficit)— (Unaudited)
(Dollars and shares in millions, except per share amounts)
Fannie Mae Stockholders’ Equity (Deficit)
Shares OutstandingSenior
PreferredStock
PreferredStock
CommonStock
AccumulatedDeficit
Accumulated Other
ComprehensiveIncome
TreasuryStock
TotalEquity
(Deficit)Senior
Preferred Preferred Common
Balance as of March 31, 2018 1 556 1,158 $ 120,836 $ 19,130 $ 687 $ (129,662) $ 347 $ (7,400) $ 3,938
Senior preferred stock dividends paid — — — — — — (938) — — (938)
Increase to senior preferred stock — — — — — — — — — —
Comprehensive income:
Net income — — — — — — 4,457 — — 4,457
Other comprehensive income, net of tax effect:
Changes in net unrealized gains on available-for-sale securities (net of taxes of $1) — — — — — — — 4 — 4
Reclassification adjustment for gains includedin net income (net of taxes of $0) — — — — — — — — — —
Other — — — — — — — (2) — (2)
Total comprehensive income 4,459
Reclassification related to Tax Cutsand Jobs Act — — — — — — — — — —
Other — — — — — — — — — —
Balance as of June 30, 2018 1 556 1,158 $ 120,836 $ 19,130 $ 687 $ (126,143) $ 349 $ (7,400) $ 7,459
Fannie Mae Stockholders’ Equity (Deficit)
Shares OutstandingSenior
PreferredStock
PreferredStock
CommonStock
AccumulatedDeficit
Accumulated Other
ComprehensiveIncome
TreasuryStock
TotalEquity
(Deficit)Senior
Preferred Preferred Common
Balance as of December 31, 2017 1 556 1,158 $ 117,149 $ 19,130 $ 687 $ (133,805) $ 553 $ (7,400) $ (3,686)
Senior preferred stock dividends paid — — — — — — (938) — — (938)
Increase to senior preferred stock — — — 3,687 — — — — — 3,687
Comprehensive income:
Net income — — — — — — 8,718 — — 8,718
Other comprehensive income, net of tax effect:
Changes in net unrealized gains on available-for-sale securities (net of taxes of $14) — — — — — — — (53) — (53)
Reclassification adjustment for gains includedin net income (net of taxes of $70) — — — — — — — (263) — (263)
Other — — — — — — — (5) — (5)
Total comprehensive income 8,397
Reclassification related to Tax Cutsand Jobs Act — — — — — — (117) 117 — —
Other — — — — — — (1) — — (1)
Balance as of June 30, 2018 1 556 1,158 $ 120,836 $ 19,130 $ 687 $ (126,143) $ 349 $ (7,400) $ 7,459
See Notes to Condensed Consolidated Financial Statements
Financial Statements | Condensed Consolidated Statements of Changes in Equity (Deficit)
Fannie Mae (In conservatorship) Second Quarter 2019 Form 10-Q 57

FANNIE MAE(In conservatorship)
Notes to Condensed Consolidated Financial Statements(Unaudited)
Notes to Condensed Consolidated Financial Statements | Summary of Significant Accounting Policies
Fannie Mae (In conservatorship) Second Quarter 2019 Form 10-Q 58
1. Summary of Significant Accounting Policies We are a stockholder-owned corporation organized and existing under the Federal National Mortgage Association Charter Act(the “Charter Act” or our “charter”). We are a government-sponsored enterprise (“GSE”), and we are subject to governmentoversight and regulation. Our regulators include the Federal Housing Finance Agency (“FHFA”), the U.S. Department ofHousing and Urban Development (“HUD”), the U.S. Securities and Exchange Commission (“SEC”), and the U.S. Departmentof the Treasury (“Treasury”). The U.S. government does not guarantee our securities or other obligations.
We have been under conservatorship, with FHFA acting as conservator, since September 6, 2008. See below and “Note 1,Summary of Significant Accounting Policies” in our annual report on Form 10-K for the year ended December 31, 2018 (“2018Form 10-K”) for additional information on our conservatorship and the impact of U.S. government support of our business.
The unaudited interim condensed consolidated financial statements as of and for the three and six months ended June 30,2019 and related notes, should be read in conjunction with our audited consolidated financial statements and related notesincluded in our 2018 Form 10-K.
Basis of Presentation The accompanying unaudited interim condensed consolidated financial statements have been prepared in accordance withgenerally accepted accounting principles in the United States of America (“GAAP”) for interim financial information and with theSEC’s instructions to Form 10-Q and Article 10 of Regulation S-X. Accordingly, they do not include all of the information andnote disclosures required by GAAP for complete consolidated financial statements. In the opinion of management, alladjustments of a normal recurring nature considered necessary for a fair presentation have been included. The accompanyingcondensed consolidated financial statements include our accounts as well as the accounts of other entities in which we have acontrolling financial interest. All intercompany accounts and transactions have been eliminated. To conform to our currentperiod presentation, we have reclassified certain amounts reported in our prior period condensed consolidated financialstatements. Results for the three and six months ended June 30, 2019 may not necessarily be indicative of the results for theyear ending December 31, 2019.
Use of EstimatesPreparing condensed consolidated financial statements in accordance with GAAP requires management to make estimatesand assumptions that affect our reported amounts of assets and liabilities, disclosure of contingent assets and liabilities as ofthe dates of our condensed consolidated financial statements, as well as our reported amounts of revenues and expensesduring the reporting periods. Management has made significant estimates in a variety of areas including, but not limited to, theallowance for loan losses. Actual results could be different from these estimates.
ConservatorshipOn September 7, 2008, the Secretary of the Treasury and the Director of FHFA announced several actions taken by Treasuryand FHFA regarding Fannie Mae, which included: (1) placing us in conservatorship and (2) the execution of a senior preferredstock purchase agreement by our conservator, on our behalf, and Treasury, pursuant to which we issued to Treasury bothsenior preferred stock and a warrant to purchase common stock.
There continues to be significant uncertainty regarding our future, including how long we will continue to exist in our currentform, the extent of our role in the market, how long we will be in conservatorship, what form we will have and what ownershipinterest, if any, our current common and preferred stockholders will hold in us after the conservatorship is terminated andwhether we will continue to exist following conservatorship. Treasury has made a commitment under the senior preferred stockpurchase agreement to provide funding to us under certain circumstances if we have a net worth deficit. We are not aware ofany plans of FHFA to fundamentally change our business model or reduce the aggregate amount available to or held by thecompany under our capital structure, which includes the senior preferred stock purchase agreement, in the near term.
Senior Preferred Stock Purchase Agreement and Senior PreferredStockTreasury has made a commitment under the senior preferred stock purchase agreement to provide funding to us under certaincircumstances if we have a net worth deficit. Pursuant to the senior preferred stock purchase agreement, we have received a
total of $119.8 billion from Treasury as of June 30, 2019, and the amount of remaining funding available to us under theagreement was $113.9 billion.
Pursuant to the senior preferred stock purchase agreement, we issued shares of senior preferred stock to Treasury in 2008.Acting as successor to the rights, titles, powers and privileges of the Board, our conservator has declared and directed us topay dividends to Treasury on the senior preferred stock on a quarterly basis for every dividend period for which dividends werepayable since we entered conservatorship in 2008. The current dividend provisions of the senior preferred stock provide forquarterly dividends consisting of the amount, if any, by which our net worth as of the end of the immediately preceding fiscalquarter exceeds a $3.0 billion capital reserve amount. We refer to this as a “net worth sweep” dividend. On June 28, 2019, wepaid Treasury a dividend of $2.4 billion based on our net worth of $5.4 billion as of March 31, 2019, less the applicable capitalreserve amount of $3.0 billion. Because we had a net worth of $6.4 billion as of June 30, 2019, we expect to pay Treasury adividend of $3.4 billion for the third quarter of 2019 by September 30, 2019.
The liquidation preference of the senior preferred stock is subject to adjustment. The aggregate liquidation preference of thesenior preferred stock was $123.8 billion as of June 30, 2019.
See “Note 11, Equity (Deficit)” in our 2018 Form 10-K for additional information about the senior preferred stock purchaseagreement and the senior preferred stock.
Principles of ConsolidationOur condensed consolidated financial statements include our accounts as well as the accounts of the other entities in whichwe have a controlling financial interest. All intercompany balances and transactions have been eliminated. The typicalcondition for a controlling financial interest is ownership of a majority of the voting interests of an entity. A controlling financialinterest may also exist in entities through arrangements that do not involve voting interests, such as a variable interest entity(“VIE”).
Single Security InitiativeThe Single Security Initiative is a joint initiative among Fannie Mae, Freddie Mac, and our jointly owned limited liabilitycompany, Common Securitization Solutions, LLC (“CSS”), under the direction of FHFA, to develop a single common mortgage-backed security issued by both Fannie Mae and Freddie Mac to finance fixed-rate mortgage loans backed by one- to four-unitsingle-family properties. The objective of the Single Security Initiative is to enhance the overall liquidity of Fannie Mae andFreddie Mac mortgage-backed securities eligible for trading in the to-be-announced (“TBA”) market by supporting theirfungibility without regard to which company is the issuer. We and Freddie Mac began issuing uniform mortgage-backedsecurities (“UMBS”) pursuant to the Single Security Initiative in June 2019. We and Freddie Mac also began resecuritizingUMBS certificates into structured securities in June 2019. The structured securities backed by UMBS that we may issueinclude Supers, which are single-class resecuritization transactions, and Real Estate Mortgage Investment Conduit securities(“REMICs”) and interest-only and principal-only strip securities (“SMBS”), which are multi-class resecuritization transactions.
Beginning in June 2019 and going forward, we may include UMBS, Supers and other structured securities issued by FreddieMac in our resecuritization trusts. The mortgage loans that serve as collateral for Freddie Mac-issued UMBS are not held intrusts that are consolidated by Fannie Mae. When we include Freddie Mac securities in our structured securities we aresubject to additional credit risk because we guarantee securities that were not previously guaranteed by Fannie Mae.However, Freddie Mac continues to guarantee the payment of principal and interest on the underlying Freddie Mac securitiesthat we have resecuritized. As such, we have concluded that this additional credit risk is negligible because of the fundingcommitment available to Freddie Mac through its senior preferred stock purchase agreement with Treasury. Prior to theimplementation of the Single Security Initiative, the vast majority of underlying assets of our resecuritization trusts were limitedto Fannie Mae securities that were collateralized by mortgage loans held in consolidated trusts.
Single-Class Resecuritization TrustsFannie Mae single-class resecuritization trusts are created by depositing mortgage-backed securities (“MBS”) into a newsecuritization trust for the purpose of aggregating multiple mortgage-related securities into a single security. Single-classresecuritization securities pass through directly to the holders of the securities all of the cash flows of the underlying mortgage-backed securities held in the resecuritization trust. As a result of the Single Security Initiative, these securities can now becollateralized directly or indirectly by cash flows from underlying securities issued by Fannie Mae, Freddie Mac, or acombination of both. Resecuritization trusts backed directly or indirectly only by Fannie Mae MBS are non-commingledresecuritization trusts. Resecuritization trusts collateralized directly or indirectly by cash flows either in part or in whole fromFreddie Mac securities are commingled resecuritization trusts.
Securities issued by our non-commingled single-class resecuritization trusts are backed solely by Fannie Mae MBS and theguarantee we provide on the trust does not subject us to additional credit risk because we have already provided a guaranteeon the underlying securities. Further, the securities issued by our non-commingled single-class resecuritization trusts passthrough all of the cash flows of the underlying Fannie Mae MBS directly to the holders of the securities. Accordingly, thesesecurities are deemed to be substantially the same as the underlying Fannie Mae MBS collateral. Additionally, our involvement
Notes to Condensed Consolidated Financial Statements | Summary of Significant Accounting Policies
Fannie Mae (In conservatorship) Second Quarter 2019 Form 10-Q 59
with these trusts does not provide us with any incremental rights or powers that would enable us to direct any activities of thetrusts. As a result, we have concluded that we are not the primary beneficiaries of, and as a result, we do not consolidate, ournon-commingled single-class resecuritization trusts. Therefore, we account for purchases and sales of securities issued bynon-commingled single-class resecuritization trusts as extinguishments and issuances of the underlying MBS debt,respectively.
Securities issued by our commingled single-class resecuritization trusts are backed in whole or in part by Freddie Macsecurities. The guaranty we provide to the commingled single-class resecuritization trust subjects us to additional credit riskbecause we are providing a guaranty for the timely payment of principal and interest on the underlying Freddie Mac securitiesthat we have not previously guaranteed. Accordingly, securities issued by our commingled resecuritization trusts are notdeemed to be substantially the same as the underlying collateral. We do not have any incremental rights or powers related tocommingled single-class resecuritization trusts that would enable us to direct any activities of the underlying trusts. As a result,we have concluded that we are not the primary beneficiary of, and therefore do not consolidate, our commingled single-classresecuritization trusts unless we have the unilateral right to dissolve the trust. We have this right when we hold 100% of thebeneficial interests issued by the resecuritization trust. Therefore, we account for purchases and sales of these securities aspurchases and sales of investment securities.
Multi-Class Resecuritization TrustsMulti-class resecuritization trusts are trusts we create to issue multi-class Fannie Mae structured securities, including REMICsand SMBS, in which the cash flows of the underlying mortgage assets are divided, creating several classes of securities, eachof which represents a beneficial ownership interest in a separate portion of cash flows. We guarantee to each multi-classresecuritization trust that we will supplement amounts received by the trusts as required to permit timely payments of principaland interest, as applicable, on the related Fannie Mae structured securities. As a result of the Single Security Initiative, thesemulti-class structured securities can now be collateralized, directly or indirectly, by securities issued by Fannie Mae, FreddieMac, or a combination of both.
The guaranty we provide to our non-commingled multi-class resecuritization trusts does not subject us to additional credit risk,because the underlying assets are Fannie Mae-issued securities for which we have already provided a guaranty. However, forcommingled multi-class structured securities, we are subject to additional credit risk because we are providing a guaranty forthe timely payment of principal and interest on the underlying Freddie Mac securities that we have not previously guaranteed.For both commingled and non-commingled multi-class resecuritization trusts, we may also be exposed to prepayment risk viaour ownership of securities issued by these trusts. We do not have the ability via our involvement with a multi-classresecuritization trust to impact either the credit risk or prepayment risk to which we are exposed. Therefore, we haveconcluded that we do not have the characteristics of a controlling financial interest and do not consolidate multi-classresecuritization trusts unless we have the unilateral right to dissolve the trust as noted below.
Securities issued by multi-class resecuritization trusts do not directly pass through all of the cash flows of the underlyingsecurities and therefore the issued and underlying securities are not considered substantially the same. Accordingly, if a multi-class resecuritization trust is not consolidated, we account for purchases and sales of securities issued by the trust aspurchases and sales of investment securities.
Beginning June 2019, in connection with the Single Security Initiative, we may now include UMBS, Supers and otherstructured securities backed by securities issued by Freddie Mac in our resecuritization trusts. As a result, we adopted aconsolidation threshold for multi-class resecuritization trusts that is based on our ability to unilaterally dissolve theresecuritization trust. This ability exists only when we hold 100% of the outstanding beneficial interests issued by theresecuritization trust. This new consolidation threshold was applied prospectively upon implementation of the Single SecurityInitiative in the second quarter of 2019 and prior period amounts were not recast. Prior to the implementation of the SingleSecurity Initiative, we consolidated multi-class resecuritization trusts when we held a substantial portion of the outstandingbeneficial interests issued by the trust. Our adoption of the new consolidation threshold did not have a material impact on ourcondensed consolidated financial statements for the second quarter or first half of 2019.
Notes to Condensed Consolidated Financial Statements | Summary of Significant Accounting Policies
Fannie Mae (In conservatorship) Second Quarter 2019 Form 10-Q 60
Regulatory CapitalWe submit capital reports to FHFA, which monitors our capital levels. The deficit of core capital over statutory minimum capitalwas $137.0 billion as of June 30, 2019 and $137.1 billion as of December 31, 2018. Due to the terms of our senior preferredstock, we do not expect to eliminate our deficit of core capital over statutory minimum capital.
Related PartiesBecause Treasury holds a warrant to purchase shares of Fannie Mae common stock equal to 79.9% of the total number ofshares of Fannie Mae common stock, we and Treasury are deemed related parties. As of June 30, 2019, Treasury held aninvestment in our senior preferred stock with an aggregate liquidation preference of $123.8 billion. See “Senior Preferred StockPurchase Agreement and Senior Preferred Stock” above for additional information on transactions under this agreement.

FHFA’s control of both Fannie Mae and Freddie Mac has caused Fannie Mae, FHFA and Freddie Mac to be deemed relatedparties. Additionally, Fannie Mae and Freddie Mac jointly own CSS, a limited liability company created to operate a commonsecuritization platform; as such, CSS is deemed a related party.
In the ordinary course of business, Fannie Mae may purchase and sell securities issued by Treasury and Freddie Mac. Thesetransactions occur on the same terms as those prevailing at the time for comparable transactions with unrelated parties. Withour implementation of the Single Security Initiative in June 2019, some of the structured securities we issue are backed inwhole or in part by Freddie Mac securities. Additionally, we make regular income tax payments to and receive tax refunds fromthe Internal Revenue Service (“IRS”), a bureau of Treasury.
Transactions with TreasuryOur administrative expenses were reduced by $5 million and $6 million for the three months ended June 30, 2019 and 2018,respectively, and $10 million and $13 million for the six months ended June 30, 2019 and 2018, respectively, due toreimbursements from Treasury and Freddie Mac for expenses incurred as program administrator for Treasury’s HomeAffordable Modification Program and other initiatives under Treasury’s Making Home Affordable Program.
In December 2011, Congress enacted the Temporary Payroll Cut Continuation Act of 2011 (“TCCA”) which, among otherprovisions, required that we increase our single-family guaranty fees by at least 10 basis points and remit this increase toTreasury. Effective April 1, 2012, we increased the guaranty fee on all single-family residential mortgages delivered to us by 10basis points. FHFA and Treasury advised us to remit this fee increase to Treasury with respect to all loans acquired by us on orafter April 1, 2012 and before January 1, 2022, and to continue to remit these amounts to Treasury on and after January 1,2022 with respect to loans we acquired before this date until those loans are paid off or otherwise liquidated. The resulting feerevenue and expense are recorded in “Mortgage loans interest income” and “TCCA fees,” respectively, in our condensedconsolidated statements of operations and comprehensive income. We recognized $600 million and $565 million in TCCA feesduring the three months ended June 30, 2019 and 2018, respectively, and $1.2 billion and $1.1 billion for the six months endedJune 30, 2019 and 2018, respectively, of which $600 million had not been remitted to Treasury as of June 30, 2019.
Under the Federal Housing Enterprises Financial Safety and Soundness Act of 1992, as amended, including by the FederalHousing Finance Regulatory Reform Act of 2008 (together, the “GSE Act”), we are required to set aside certain fundingobligations, a portion of which is attributable to Treasury’s Capital Magnet Fund. These funding obligations, recognized in“Other expenses, net” in our condensed consolidated statements of operations and comprehensive income, are measured asthe product of 4.2 basis points and the unpaid principal balance of our total new business purchases for the respective period,and 35% of this amount is payable to Treasury’s Capital Magnet Fund. We recognized a total of $21 million and $19 million in“Other expenses, net” for the three months ended June 30, 2019 and 2018, respectively, and $36 million and $37 million forthe six months ended June 30, 2019 and 2018, respectively, relating to amounts payable to Treasury’s Capital Magnet Fund.In 2020, we expect to pay the $36 million recognized for the six months ended June 30, 2019 to Treasury’s Capital MagnetFund, along with additional amounts based on our new business purchases in the second half of 2019. In April 2019, we paid$75 million to Treasury’s Capital Magnet Fund based on our new business purchases in 2018.
Transactions with FHFAThe GSE Act authorizes FHFA to establish an annual assessment for regulated entities, including Fannie Mae, which ispayable on a semi-annual basis (April and October), for FHFA’s costs and expenses, as well as to maintain FHFA’s workingcapital. We recognized FHFA assessment fees, which are recorded in “Administrative expenses” in our condensedconsolidated statements of operations and comprehensive income, of $29 million and $26 million for the three months endedJune 30, 2019 and 2018, respectively, and $59 million and $55 million for the six months ended June 30, 2019 and 2018,respectively.
Transactions with CSS and Freddie MacWe contributed capital to CSS, the company we jointly own with Freddie Mac, of $26 million and $35 million for the threemonths ended June 30, 2019 and 2018, respectively, and $62 million and $76 million for the six months ended June 30, 2019and 2018, respectively. In the second quarter of 2019, Fannie Mae, Freddie Mac and CSS entered into an amendment to thecustomer services agreement that sets forth the terms under which CSS provides mortgage securitization services to us andFreddie Mac. In June 2019, we entered into an indemnification agreement with Freddie Mac relating to the commingledstructured securities that we and Freddie Mac issue. Under the indemnification agreement, Fannie Mae and Freddie Mac eachhave agreed to indemnify the other party for losses caused by: its failure to meet its payment or other specified obligationsunder the trust agreements pursuant to which the underlying resecuritized securities were issued; its failure to meet itsobligations under the customer services agreement; its violations of laws; or with respect to material misstatements oromissions in offering documents, ongoing disclosures and related materials relating to the underlying resecuritized securities.
Notes to Condensed Consolidated Financial Statements | Summary of Significant Accounting Policies
Fannie Mae (In conservatorship) Second Quarter 2019 Form 10-Q 61
Earnings per Share Earnings per share (“EPS”) is presented for basic and diluted EPS. We compute basic EPS by dividing net income attributableto common stockholders by the weighted-average number of shares of common stock outstanding during the period. However,as a result of our conservatorship status and the terms of the senior preferred stock, no amounts would be available todistribute as dividends to common or preferred stockholders (other than to Treasury as the holder of the senior preferredstock). Weighted average common shares includes 4.6 billion shares for the periods ended June 30, 2019 and 2018 thatwould be issued upon the full exercise of the warrant issued to Treasury from the date the warrant was issued through June30, 2019 and 2018.
The calculation of diluted EPS includes all the components of basic earnings per share, plus the dilutive effect of commonstock equivalents such as convertible securities and stock options. Weighted average shares outstanding is increased toinclude the number of additional common shares that would have been outstanding if the dilutive potential common shareshad been issued. For the three months ended June 30, 2019 and six months ended June 30, 2019 and 2018, our diluted EPSweighted average shares outstanding includes shares of common stock that would be issuable upon the conversion of 131million shares of convertible preferred stock. For the three months ended June 30, 2018, convertible preferred stock is notincluded in the calculation because a net loss attributable to common shareholders was incurred and it would have an anti-dilutive effect.
Notes to Condensed Consolidated Financial Statements | Summary of Significant Accounting Policies
Fannie Mae (In conservatorship) Second Quarter 2019 Form 10-Q 62
New Accounting GuidanceThe following updates information about our significant accounting policies that have recently been adopted or yet to beadopted from the information included in “Note 1, Summary of Significant Accounting Policies” in our 2018 Form 10-K.
The Financial Accounting Standards Board (the “FASB”) issued Accounting Standards Update (“ASU”) 2016-13, FinancialInstruments—Credit Losses (Topic 326), Measurement of Credit Losses on Financial Instruments (“CECL”) in June 2016. Itwas amended by ASU 2019-04, Codification Improvements (to Topic 326), Financial Instruments—Credit Losses in April 2019.The standard replaces the incurred loss impairment methodology in current GAAP with a methodology that reflects lifetimeexpected credit losses and requires consideration of a broader range of reasonable and supportable information to informcredit loss estimates. The amendments in this standard also require credit losses related to available-for-sale debt securities tobe recorded through an allowance for credit losses. We do not expect a material impact for establishing an allowance for creditlosses related to our available-for-sale debt securities.
CECL will become effective for our fiscal year beginning January 1, 2020. We are continuing to update the allowance modelsand accounting systems that will be used to estimate credit losses and record accounting impacts under CECL, and we are inthe process of validating their results. All updates to our allowance models are subject to our model oversight and reviewgovernance process. We expect model and system testing to continue in 2019, followed by full integrated testing across allaffected systems and processes. We are managing the implementation of this guidance in accordance with our changemanagement governance standards, which are designed to ensure compliance with GAAP as well as operational readiness atadoption. Senior management and the Audit Committee receive regular updates regarding the status of our implementationplan, results of modeled impacts and any identified key risks.
We will use a discounted cash flow method to measure credit impairment on our single-family mortgage loans and anundiscounted loss method to measure credit impairment on our multifamily mortgage loans. The models we will use toestimate credit losses will incorporate our historical credit loss experience, adjusted for current economic forecasts and thecurrent credit profile of our loan book of business. The models will use reasonable and supportable forecasts for key economicdrivers, such as home prices (Single-Family), rental income (Multifamily) and capitalization rates (Multifamily).
Based on the composition of the loans in our book of business as of June 30, 2019 and our current expectations of futureeconomic conditions, we estimate that our adoption of CECL will result in a reduction in our retained earnings of up to $4billion on an after-tax basis in the first quarter of 2020. We are still assessing the impact of various implementation issues aswell as the FASB’s recently proposed guidance relating to the standard. The resolution of these items may reduce CECL’simpact on our retained earnings upon adoption. In addition, we continue to evaluate the results of our modeled loss estimatesand may make refinements to our approach and assumptions. The impact of our adoption of CECL on our retained earningswill be further influenced by the credit risk profile of the loans in our book of business as of the January 1, 2020 adoption date,as well as economic conditions and forecasts of future economic conditions at that time.

2. Consolidations and Transfers of Financial Assets
Notes to Condensed Consolidated Financial Statements | Consolidations and Transfers of Financial Assets
Fannie Mae (In conservatorship) Second Quarter 2019 Form 10-Q 63
We have interests in various entities that are considered to be variable interest entities (“VIEs”). The primary types of entitiesare securitization and resecuritization trusts, limited partnerships and special purpose vehicles (“SPVs”). These interestsinclude investments in securities issued by VIEs, such as Fannie Mae MBS created pursuant to our securitization transactionsand our guaranty to the entity. We consolidate the substantial majority of our single-class securitization trusts because our roleas guarantor and master servicer provides us with the power to direct matters (primarily the servicing of mortgage loans) thatimpact the credit risk to which we are exposed. In contrast, we do not consolidate single-class securitization trusts when otherorganizations have the power to direct these activities. Historically, the vast majority of underlying assets of our resecuritizationtrusts were limited to Fannie Mae securities that were collateralized by mortgage loans held in consolidated trusts. However,beginning with the implementation of the Single Security Initiative in June 2019, we include securities issued by Freddie Mac insome of our resecuritization trusts. The mortgage loans that serve as collateral for Freddie Mac-issued UMBS are not held intrusts that are consolidated by Fannie Mae.
Unconsolidated VIEsWe do not consolidate VIEs when we are not deemed to be the primary beneficiary. Our unconsolidated VIEs includesecuritization trusts, limited partnerships, and certain SPVs designed to transfer credit risk. The following table displays thecarrying amount and classification of our assets and liabilities that relate to our involvement with unconsolidated securitizationand resecuritization trusts.
As ofJune 30, 2019 December 31, 2018
Assets and liabilities recorded in our condensed consolidated balance sheetsrelated to mortgage-backed trusts:
(Dollars in millions)
Assets:Trading securities:
Fannie Mae $ 2,173 $ 1,422Non-Fannie Mae 4,352 4,809
Total trading securities 6,525 6,231Available-for-sale securities:
Fannie Mae 1,615 1,704Non-Fannie Mae 791 1,207
Total available-for-sale securities 2,406 2,911Other assets 60 66
Other liabilities (90) (101)Net carrying amount $ 8,901 $ 9,107
Our maximum exposure to loss generally represents the greater of our recorded investment in the entity or the unpaid principalbalance of the assets covered by our guaranty. Our involvement in unconsolidated resecuritization trusts may give rise toadditional exposure to loss depending on the type of resecuritization trust. Fannie Mae non-commingled resecuritization trustsrefers to our resecuritization trusts that are backed entirely by Fannie Mae MBS. These non-commingled single-class andmulti-class resecuritization trusts that are not consolidated do not give rise to any additional exposure to loss as we alreadyconsolidate the underlying collateral.
Fannie Mae commingled resecuritization trusts refers to our resecuritization trusts that are backed in whole or in part byFreddie Mac securities. The guaranty that we provide to these commingled resecuritization trusts increases our exposure toloss relating to the Freddie Mac securities that serve as the underlying collateral. Our maximum exposure to loss for theseunconsolidated trusts is measured by the amount of Freddie Mac securities that back these resecuritization trusts. However aportion of these Freddie Mac securities may be backed in whole or in part by Fannie Mae MBS. Therefore, to the extent thatthese Freddie Mac securities are backed by Fannie Mae MBS, it would not give rise to any additional exposure and our totalexposure to collateral that is ultimately guaranteed by Freddie Mac may be lower than the disclosed maximum exposure toloss. Our maximum exposure to loss related to unconsolidated securitization and resecuritization trusts was approximately $20billion and $14 billion as of June 30, 2019 and December 31, 2018, respectively. The total assets of our unconsolidatedsecuritization and resecuritization trusts were approximately $110 billion and $80 billion as of June 30, 2019 and December31, 2018, respectively.
The maximum exposure to loss for our unconsolidated limited partnerships and similar legal entities, which consist of low-income housing tax credit investments (“LIHTC”), community investments and other entities, was $96 million and the relatedcarrying value was $75 million as of June 30, 2019. As of December 31, 2018, the maximum exposure to loss was $111 million
and the related carrying value was $89 million. The total assets of these limited partnership investments were $2.1 billion and$2.3 billion as of June 30, 2019 and December 31, 2018, respectively.
The maximum exposure to loss related to our involvement with unconsolidated SPVs that transfer credit risk represents theunpaid principal balance and accrued interest payable of obligations issued by the Connecticut Avenue Securities (“CAS”)SPVs. The maximum exposure to loss related to these unconsolidated SPVs was $4.6 billion and $920 million as of June 30,2019 and December 31, 2018, respectively. The total assets related to these unconsolidated SPVs were $4.7 billion and $931million as of June 30, 2019 and December 31, 2018, respectively.
The unpaid principal balance of our multifamily loan portfolio was $310.9 billion as of June 30, 2019. As our lendingrelationship does not provide us with a controlling financial interest in the borrower entity, we do not consolidate theseborrowers regardless of their status as either a VIE or a voting interest entity. We have excluded these entities from our VIEdisclosures. However, the disclosures we have provided in “Note 3, Mortgage Loans,” “Note 4, Allowance for Loan Losses”and “Note 6, Financial Guarantees” with respect to this population are consistent with the FASB’s stated objectives for thedisclosures related to unconsolidated VIEs.
Notes to Condensed Consolidated Financial Statements | Consolidations and Transfers of Financial Assets
Fannie Mae (In conservatorship) Second Quarter 2019 Form 10-Q 64
Transfers of Financial AssetsWe issue Fannie Mae MBS through portfolio securitization transactions by transferring pools of mortgage loans or mortgage-related securities to one or more trusts or special purpose entities. We are considered to be the transferor when we transferassets from our own retained mortgage portfolio in a portfolio securitization transaction. For the three months ended June 30,2019 and 2018, the unpaid principal balance of portfolio securitizations was $57.3 billion and $51.6 billion, respectively. For thesix months ended June 30, 2019 and 2018, the unpaid principal balance of portfolio securitizations was $98.7 billion and$115.9 billion, respectively.
We retain interests from the transfer and sale of mortgage-related securities to unconsolidated single-class and multi-classportfolio securitization trusts. As of June 30, 2019, the unpaid principal balance of retained interests was $2.7 billion and itsrelated fair value was $3.7 billion. As of December 31, 2018, the unpaid principal balance of retained interests was $1.5 billionand its related fair value was $2.2 billion. For the three months ended June 30, 2019 and 2018, the principal, interest and otherfees received on retained interests was $122 million and $128 million, respectively. For the six months ended June 30, 2019and 2018, the principal, interest and other fees received on retained interests was $238 million and $354 million, respectively.
Managed LoansManaged loans include primarily loans that are guaranteed or insured, in whole or in part, by the U.S. government. For thoseloans that we have securitized in unconsolidated portfolio securitization trusts, the outstanding unpaid principal balance was$1.1 billion as of June 30, 2019 and $1.2 billion as of December 31, 2018. For information regarding on-balance sheetmanaged loans, see “Note 3, Mortgage Loans.”
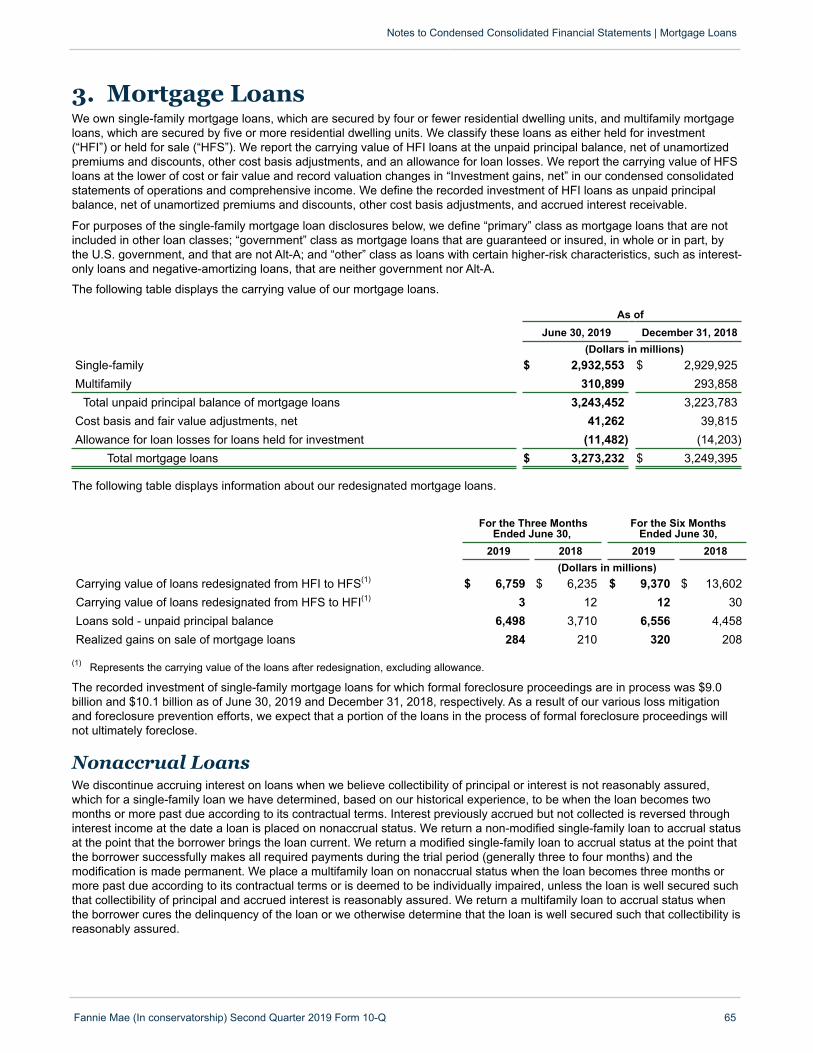
3. Mortgage Loans
Notes to Condensed Consolidated Financial Statements | Mortgage Loans
Fannie Mae (In conservatorship) Second Quarter 2019 Form 10-Q 65
We own single-family mortgage loans, which are secured by four or fewer residential dwelling units, and multifamily mortgageloans, which are secured by five or more residential dwelling units. We classify these loans as either held for investment(“HFI”) or held for sale (“HFS”). We report the carrying value of HFI loans at the unpaid principal balance, net of unamortizedpremiums and discounts, other cost basis adjustments, and an allowance for loan losses. We report the carrying value of HFSloans at the lower of cost or fair value and record valuation changes in “Investment gains, net” in our condensed consolidatedstatements of operations and comprehensive income. We define the recorded investment of HFI loans as unpaid principalbalance, net of unamortized premiums and discounts, other cost basis adjustments, and accrued interest receivable.
For purposes of the single-family mortgage loan disclosures below, we define “primary” class as mortgage loans that are notincluded in other loan classes; “government” class as mortgage loans that are guaranteed or insured, in whole or in part, bythe U.S. government, and that are not Alt-A; and “other” class as loans with certain higher-risk characteristics, such as interest-only loans and negative-amortizing loans, that are neither government nor Alt-A.
The following table displays the carrying value of our mortgage loans.
As ofJune 30, 2019 December 31, 2018
(Dollars in millions)Single-family $ 2,932,553 $ 2,929,925Multifamily 310,899 293,858
Total unpaid principal balance of mortgage loans 3,243,452 3,223,783Cost basis and fair value adjustments, net 41,262 39,815Allowance for loan losses for loans held for investment (11,482) (14,203)
Total mortgage loans $ 3,273,232 $ 3,249,395
The following table displays information about our redesignated mortgage loans.
For the Three MonthsEnded June 30,
For the Six MonthsEnded June 30,
2019 2018 2019 2018(Dollars in millions)
Carrying value of loans redesignated from HFI to HFS(1) $ 6,759 $ 6,235 $ 9,370 $ 13,602Carrying value of loans redesignated from HFS to HFI(1) 3 12 12 30Loans sold - unpaid principal balance 6,498 3,710 6,556 4,458Realized gains on sale of mortgage loans 284 210 320 208
(1) Represents the carrying value of the loans after redesignation, excluding allowance.
The recorded investment of single-family mortgage loans for which formal foreclosure proceedings are in process was $9.0billion and $10.1 billion as of June 30, 2019 and December 31, 2018, respectively. As a result of our various loss mitigationand foreclosure prevention efforts, we expect that a portion of the loans in the process of formal foreclosure proceedings willnot ultimately foreclose.
Nonaccrual LoansWe discontinue accruing interest on loans when we believe collectibility of principal or interest is not reasonably assured,which for a single-family loan we have determined, based on our historical experience, to be when the loan becomes twomonths or more past due according to its contractual terms. Interest previously accrued but not collected is reversed throughinterest income at the date a loan is placed on nonaccrual status. We return a non-modified single-family loan to accrual statusat the point that the borrower brings the loan current. We return a modified single-family loan to accrual status at the point thatthe borrower successfully makes all required payments during the trial period (generally three to four months) and themodification is made permanent. We place a multifamily loan on nonaccrual status when the loan becomes three months ormore past due according to its contractual terms or is deemed to be individually impaired, unless the loan is well secured suchthat collectibility of principal and accrued interest is reasonably assured. We return a multifamily loan to accrual status whenthe borrower cures the delinquency of the loan or we otherwise determine that the loan is well secured such that collectibility isreasonably assured.

Aging AnalysisThe following tables display an aging analysis of the total recorded investment in our HFI mortgage loans by portfolio segmentand class, excluding loans for which we have elected the fair value option.
As of June 30, 2019
30 - 59Days
Delinquent
60 - 89Days
DelinquentSeriously
Delinquent(1)Total
Delinquent Current Total
RecordedInvestmentin Loans 90
Days orMore
Delinquentand
AccruingInterest
RecordedInvestment
inNonaccrual
Loans(Dollars in millions)
Single-family:Primary $ 33,030 $ 7,308 $ 13,547 $ 53,885 $ 2,827,424 $ 2,881,309 $ 22 $ 24,035Government(2) 46 18 152 216 18,691 18,907 152 —Alt-A 2,228 645 1,533 4,406 43,083 47,489 1 2,528Other 733 236 590 1,559 10,986 12,545 2 944Total single-
family 36,037 8,207 15,822 60,066 2,900,184 2,960,250 177 27,507Multifamily(3) 24 N/A 187 211 313,334 313,545 — 513
Total $ 36,061 $ 8,207 $ 16,009 $ 60,277 $ 3,213,518 $ 3,273,795 $ 177 $ 28,020
As of December 31, 2018
30 - 59Days
Delinquent
60 - 89Days
DelinquentSeriously
Delinquent(1)Total
Delinquent Current Total
RecordedInvestmentin Loans 90
Days orMore
Delinquentand
AccruingInterest
RecordedInvestment
inNonaccrual
Loans
(Dollars in millions)Single-family:
Primary $ 30,471 $ 7,881 $ 14,866 $ 53,218 $ 2,816,047 $ 2,869,265 $ 22 $ 26,170Government(2) 57 17 169 243 21,887 22,130 169 —Alt-A 2,332 821 1,844 4,997 48,274 53,271 2 3,082Other 804 283 713 1,800 13,038 14,838 2 1,128Total single-
family 33,664 9,002 17,592 60,258 2,899,246 2,959,504 195 30,380Multifamily(3) 56 N/A 171 227 295,437 295,664 — 492
Total $ 33,720 $ 9,002 $ 17,763 $ 60,485 $ 3,194,683 $ 3,255,168 $ 195 $ 30,872(1) Single-family seriously delinquent loans are loans that are 90 days or more past due or in the foreclosure process. Multifamily seriously
delinquent loans are loans that are 60 days or more past due.(2) Primarily consists of reverse mortgages, which due to their nature, are not aged and are included in the current column.(3) Multifamily loans 60-89 days delinquent are included in the seriously delinquent column.
Notes to Condensed Consolidated Financial Statements | Mortgage Loans
Fannie Mae (In conservatorship) Second Quarter 2019 Form 10-Q 66

Credit Quality Indicators The following table displays the total recorded investment in our single-family HFI loans by class and credit quality indicator,excluding loans for which we have elected the fair value option.
As ofJune 30, 2019(1) December 31, 2018(1)
Primary Alt-A Other Primary Alt-A Other(Dollars in millions)
Estimated mark-to-market loan-to-value (“LTV”) ratio:(2)
Less than or equal to 80% $ 2,551,443 $ 41,960 $ 10,773 $ 2,521,766 $ 45,476 $ 12,291Greater than 80% and less than or equal to 90% 221,190 2,819 874 228,614 3,804 1,195Greater than 90% and less than or equal to 100% 102,585 1,383 435 109,548 1,997 645Greater than 100% 6,091 1,327 463 9,337 1,994 707
Total $ 2,881,309 $ 47,489 $ 12,545 $ 2,869,265 $ 53,271 $ 14,838
(1) Excludes $18.9 billion and $22.1 billion as of June 30, 2019 and December 31, 2018, respectively, of mortgage loans guaranteed orinsured, in whole or in part, by the U.S. government or one of its agencies, that are not Alt-A loans. The class is primarily reversemortgages for which we do not calculate an estimated mark-to-market LTV ratio.
(2) The aggregate estimated mark-to-market LTV ratio is based on the unpaid principal balance of the loan divided by the estimated currentvalue of the property as of the end of each reported period, which we calculate using an internal valuation model that estimates periodicchanges in home value.
Notes to Condensed Consolidated Financial Statements | Mortgage Loans
Fannie Mae (In conservatorship) Second Quarter 2019 Form 10-Q 67
The following table displays the total recorded investment in our multifamily HFI loans by credit quality indicator, excludingloans for which we have elected the fair value option.
As ofJune 30, December 31,
2019 2018(Dollars in millions)
Credit risk profile by internally assigned grade:Non-classified $ 306,257 $ 289,231Classified(1) 7,288 6,433
Total $ 313,545 $ 295,664
(1) Includes loans classified as “Substandard” or “Doubtful.” Loans classified as “Substandard” have a well-defined weakness that jeopardizesthe timely full repayment. Loans classified as “Doubtful” have weakness that makes collection or liquidation in full highly questionable andimprobable based on existing conditions and values. As of June 30, 2019, we had loans with recorded investment of less than $0.5 millionclassified as doubtful, compared with $1 million as of December 31, 2018.

Individually Impaired LoansIndividually impaired loans include troubled debt restructurings (“TDRs”), acquired credit-impaired loans and multifamily loansthat we have assessed as probable that we will not collect all contractual amounts due, regardless of whether we are currentlyaccruing interest, excluding loans classified as HFS and loans for which we have elected the fair value option. The followingtables display the total unpaid principal balance, recorded investment, related allowance, average recorded investment andinterest income recognized for individually impaired loans.
As ofJune 30, 2019 December 31, 2018
UnpaidPrincipalBalance
TotalRecorded
Investment
RelatedAllowancefor LoanLosses
UnpaidPrincipalBalance
TotalRecorded
Investment
RelatedAllowancefor LoanLosses
(Dollars in millions)
Individually impaired loans:With related allowance recorded:
Single-family:Primary $ 74,143 $ 71,549 $ (7,615) $ 81,791 $ 78,688 $ (9,406)Government 261 267 (54) 264 270 (55)Alt-A 13,703 12,554 (2,129) 16,576 15,158 (2,793)Other 4,520 4,268 (774) 5,482 5,169 (1,001)
Total single-family 92,627 88,638 (10,572) 104,113 99,285 (13,255)Multifamily 340 343 (55) 197 196 (40)Total individually impaired loans with related
allowance recorded 92,967 88,981 (10,627) 104,310 99,481 (13,295)With no related allowance recorded:(1)
Single-family:Primary 16,638 15,866 — 15,939 15,191 —Government 59 55 — 61 56 —Alt-A 2,445 2,193 — 2,628 2,363 —Other 654 602 — 718 666 —
Total single-family 19,796 18,716 — 19,346 18,276 —Multifamily 431 433 — 343 346 —Total individually impaired loans with no related
allowance recorded 20,227 19,149 — 19,689 18,622 —Total individually impaired loans(2) $ 113,194 $ 108,130 $ (10,627) $ 123,999 $ 118,103 $ (13,295)
(1) The discounted cash flows or collateral value equals or exceeds the carrying value of the loan and, as such, no valuation allowance isrequired.
(2) Includes single-family loans restructured in a TDR with a recorded investment of $107.0 billion and $117.2 billion as of June 30, 2019 andDecember 31, 2018, respectively. Includes multifamily loans restructured in a TDR with a recorded investment of $188 million and $187million as of June 30, 2019 and December 31, 2018, respectively.
Notes to Condensed Consolidated Financial Statements | Mortgage Loans
Fannie Mae (In conservatorship) Second Quarter 2019 Form 10-Q 68
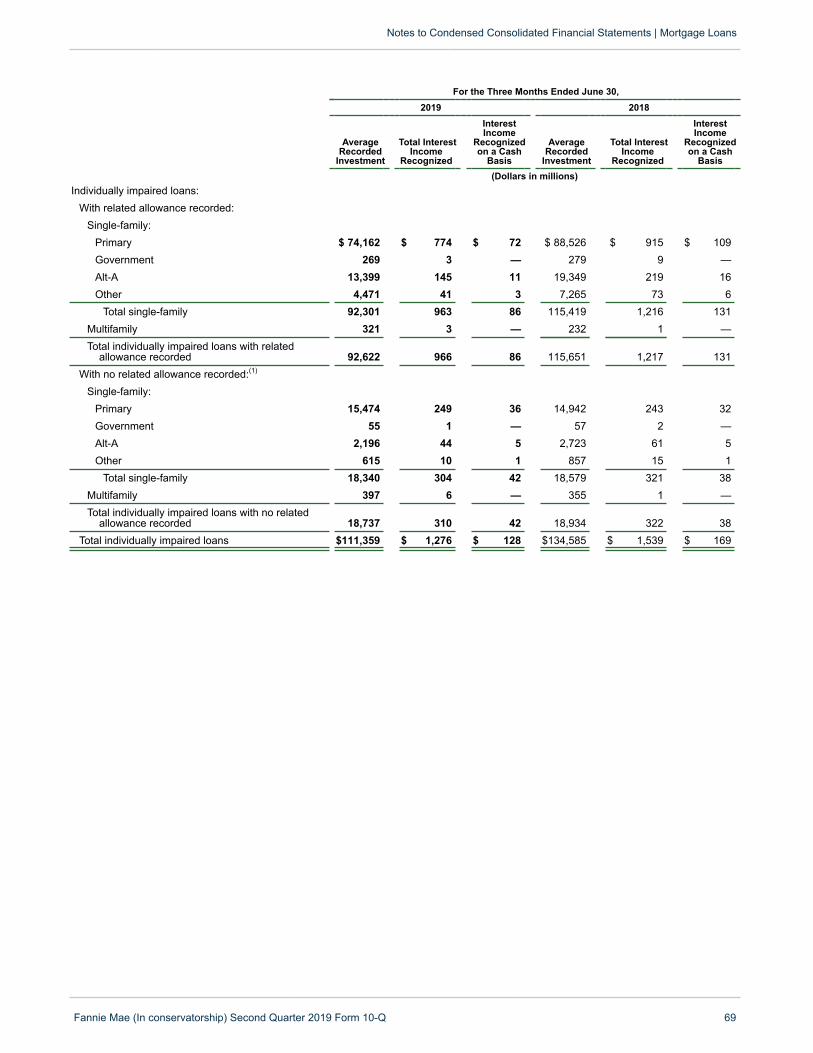
For the Three Months Ended June 30,2019 2018
AverageRecorded
Investment
Total InterestIncome
Recognized
InterestIncome
Recognizedon a Cash
Basis
AverageRecorded
Investment
Total InterestIncome
Recognized
InterestIncome
Recognizedon a Cash
Basis(Dollars in millions)
Individually impaired loans:With related allowance recorded:
Single-family:Primary $ 74,162 $ 774 $ 72 $ 88,526 $ 915 $ 109Government 269 3 — 279 9 —Alt-A 13,399 145 11 19,349 219 16Other 4,471 41 3 7,265 73 6
Total single-family 92,301 963 86 115,419 1,216 131Multifamily 321 3 — 232 1 —Total individually impaired loans with related
allowance recorded 92,622 966 86 115,651 1,217 131With no related allowance recorded:(1)
Single-family:Primary 15,474 249 36 14,942 243 32Government 55 1 — 57 2 —Alt-A 2,196 44 5 2,723 61 5Other 615 10 1 857 15 1
Total single-family 18,340 304 42 18,579 321 38Multifamily 397 6 — 355 1 —Total individually impaired loans with no related
allowance recorded 18,737 310 42 18,934 322 38Total individually impaired loans $111,359 $ 1,276 $ 128 $134,585 $ 1,539 $ 169
Notes to Condensed Consolidated Financial Statements | Mortgage Loans
Fannie Mae (In conservatorship) Second Quarter 2019 Form 10-Q 69
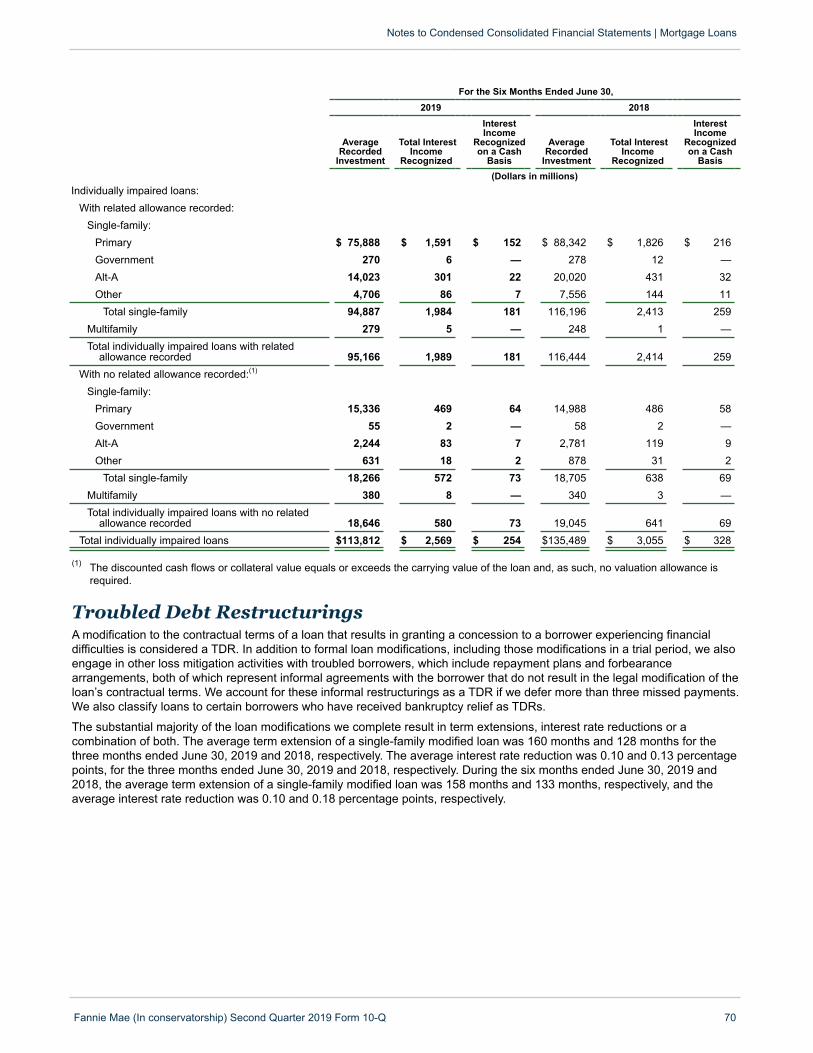
For the Six Months Ended June 30,2019 2018
AverageRecorded
Investment
Total InterestIncome
Recognized
InterestIncome
Recognizedon a Cash
Basis
AverageRecorded
Investment
Total InterestIncome
Recognized
InterestIncome
Recognizedon a Cash
Basis(Dollars in millions)
Individually impaired loans:With related allowance recorded:
Single-family:Primary $ 75,888 $ 1,591 $ 152 $ 88,342 $ 1,826 $ 216Government 270 6 — 278 12 —Alt-A 14,023 301 22 20,020 431 32Other 4,706 86 7 7,556 144 11
Total single-family 94,887 1,984 181 116,196 2,413 259Multifamily 279 5 — 248 1 —Total individually impaired loans with related
allowance recorded 95,166 1,989 181 116,444 2,414 259With no related allowance recorded:(1)
Single-family:Primary 15,336 469 64 14,988 486 58Government 55 2 — 58 2 —Alt-A 2,244 83 7 2,781 119 9Other 631 18 2 878 31 2
Total single-family 18,266 572 73 18,705 638 69Multifamily 380 8 — 340 3 —Total individually impaired loans with no related
allowance recorded 18,646 580 73 19,045 641 69Total individually impaired loans $113,812 $ 2,569 $ 254 $135,489 $ 3,055 $ 328
(1) The discounted cash flows or collateral value equals or exceeds the carrying value of the loan and, as such, no valuation allowance isrequired.
Notes to Condensed Consolidated Financial Statements | Mortgage Loans
Fannie Mae (In conservatorship) Second Quarter 2019 Form 10-Q 70
Troubled Debt RestructuringsA modification to the contractual terms of a loan that results in granting a concession to a borrower experiencing financialdifficulties is considered a TDR. In addition to formal loan modifications, including those modifications in a trial period, we alsoengage in other loss mitigation activities with troubled borrowers, which include repayment plans and forbearancearrangements, both of which represent informal agreements with the borrower that do not result in the legal modification of theloan’s contractual terms. We account for these informal restructurings as a TDR if we defer more than three missed payments.We also classify loans to certain borrowers who have received bankruptcy relief as TDRs.
The substantial majority of the loan modifications we complete result in term extensions, interest rate reductions or acombination of both. The average term extension of a single-family modified loan was 160 months and 128 months for thethree months ended June 30, 2019 and 2018, respectively. The average interest rate reduction was 0.10 and 0.13 percentagepoints, for the three months ended June 30, 2019 and 2018, respectively. During the six months ended June 30, 2019 and2018, the average term extension of a single-family modified loan was 158 months and 133 months, respectively, and theaverage interest rate reduction was 0.10 and 0.18 percentage points, respectively.
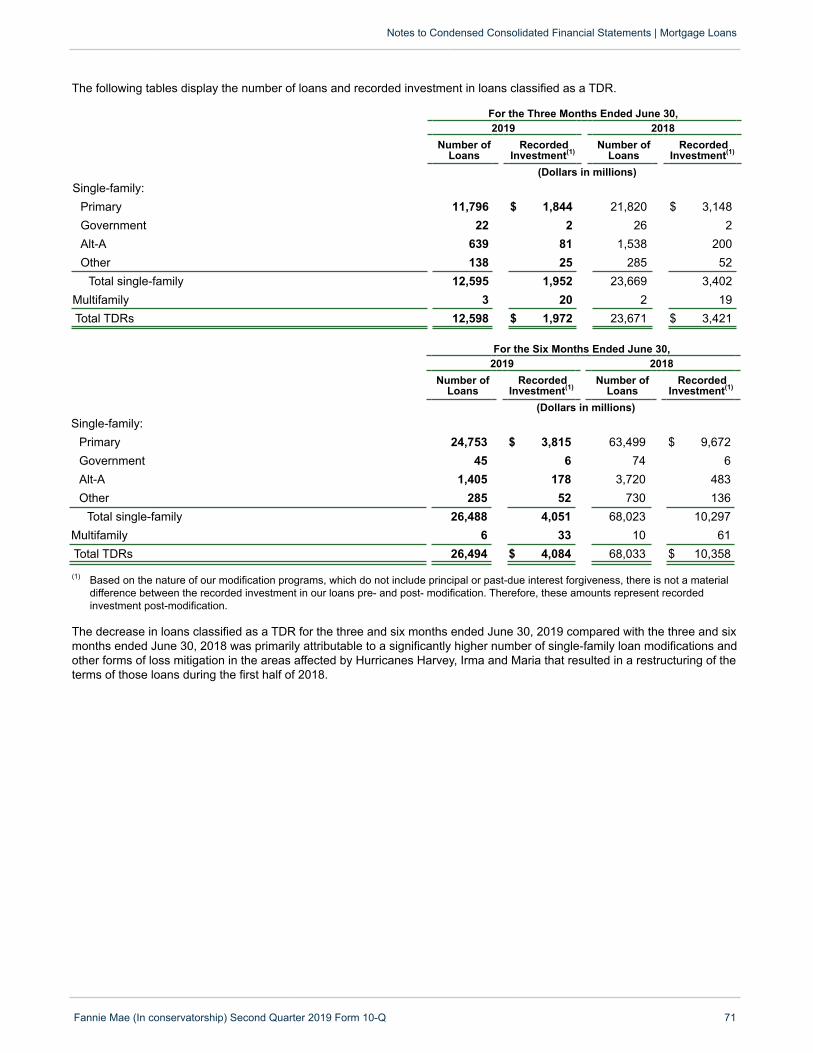
The following tables display the number of loans and recorded investment in loans classified as a TDR.
For the Three Months Ended June 30,2019 2018
Number ofLoans
RecordedInvestment(1)
Number ofLoans
RecordedInvestment(1)
(Dollars in millions)Single-family:
Primary 11,796 $ 1,844 21,820 $ 3,148Government 22 2 26 2Alt-A 639 81 1,538 200Other 138 25 285 52
Total single-family 12,595 1,952 23,669 3,402Multifamily 3 20 2 19Total TDRs 12,598 $ 1,972 23,671 $ 3,421
For the Six Months Ended June 30,2019 2018
Number ofLoans
RecordedInvestment(1)
Number ofLoans
RecordedInvestment(1)
(Dollars in millions)Single-family:
Primary 24,753 $ 3,815 63,499 $ 9,672Government 45 6 74 6Alt-A 1,405 178 3,720 483Other 285 52 730 136
Total single-family 26,488 4,051 68,023 10,297Multifamily 6 33 10 61Total TDRs 26,494 $ 4,084 68,033 $ 10,358
(1) Based on the nature of our modification programs, which do not include principal or past-due interest forgiveness, there is not a materialdifference between the recorded investment in our loans pre- and post- modification. Therefore, these amounts represent recordedinvestment post-modification.
The decrease in loans classified as a TDR for the three and six months ended June 30, 2019 compared with the three and sixmonths ended June 30, 2018 was primarily attributable to a significantly higher number of single-family loan modifications andother forms of loss mitigation in the areas affected by Hurricanes Harvey, Irma and Maria that resulted in a restructuring of theterms of those loans during the first half of 2018.
Notes to Condensed Consolidated Financial Statements | Mortgage Loans
Fannie Mae (In conservatorship) Second Quarter 2019 Form 10-Q 71
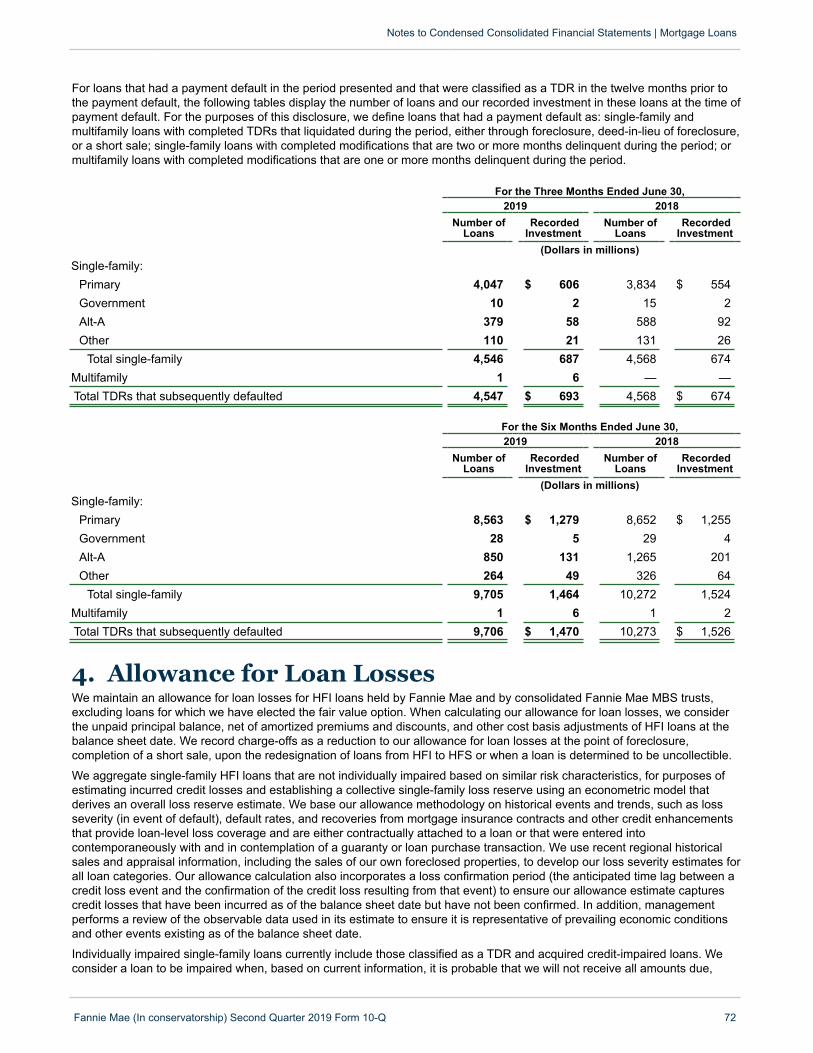
For loans that had a payment default in the period presented and that were classified as a TDR in the twelve months prior tothe payment default, the following tables display the number of loans and our recorded investment in these loans at the time ofpayment default. For the purposes of this disclosure, we define loans that had a payment default as: single-family andmultifamily loans with completed TDRs that liquidated during the period, either through foreclosure, deed-in-lieu of foreclosure,or a short sale; single-family loans with completed modifications that are two or more months delinquent during the period; ormultifamily loans with completed modifications that are one or more months delinquent during the period.
For the Three Months Ended June 30,2019 2018
Number ofLoans
RecordedInvestment
Number ofLoans
RecordedInvestment
(Dollars in millions)Single-family:
Primary 4,047 $ 606 3,834 $ 554Government 10 2 15 2Alt-A 379 58 588 92Other 110 21 131 26
Total single-family 4,546 687 4,568 674Multifamily 1 6 — —Total TDRs that subsequently defaulted 4,547 $ 693 4,568 $ 674
For the Six Months Ended June 30,2019 2018
Number ofLoans
RecordedInvestment
Number ofLoans
RecordedInvestment
(Dollars in millions)Single-family:
Primary 8,563 $ 1,279 8,652 $ 1,255Government 28 5 29 4Alt-A 850 131 1,265 201Other 264 49 326 64
Total single-family 9,705 1,464 10,272 1,524Multifamily 1 6 1 2Total TDRs that subsequently defaulted 9,706 $ 1,470 10,273 $ 1,526
Notes to Condensed Consolidated Financial Statements | Mortgage Loans
Fannie Mae (In conservatorship) Second Quarter 2019 Form 10-Q 72
4. Allowance for Loan Losses We maintain an allowance for loan losses for HFI loans held by Fannie Mae and by consolidated Fannie Mae MBS trusts,excluding loans for which we have elected the fair value option. When calculating our allowance for loan losses, we considerthe unpaid principal balance, net of amortized premiums and discounts, and other cost basis adjustments of HFI loans at thebalance sheet date. We record charge-offs as a reduction to our allowance for loan losses at the point of foreclosure,completion of a short sale, upon the redesignation of loans from HFI to HFS or when a loan is determined to be uncollectible.
We aggregate single-family HFI loans that are not individually impaired based on similar risk characteristics, for purposes ofestimating incurred credit losses and establishing a collective single-family loss reserve using an econometric model thatderives an overall loss reserve estimate. We base our allowance methodology on historical events and trends, such as lossseverity (in event of default), default rates, and recoveries from mortgage insurance contracts and other credit enhancementsthat provide loan-level loss coverage and are either contractually attached to a loan or that were entered intocontemporaneously with and in contemplation of a guaranty or loan purchase transaction. We use recent regional historicalsales and appraisal information, including the sales of our own foreclosed properties, to develop our loss severity estimates forall loan categories. Our allowance calculation also incorporates a loss confirmation period (the anticipated time lag between acredit loss event and the confirmation of the credit loss resulting from that event) to ensure our allowance estimate capturescredit losses that have been incurred as of the balance sheet date but have not been confirmed. In addition, managementperforms a review of the observable data used in its estimate to ensure it is representative of prevailing economic conditionsand other events existing as of the balance sheet date.
Individually impaired single-family loans currently include those classified as a TDR and acquired credit-impaired loans. Weconsider a loan to be impaired when, based on current information, it is probable that we will not receive all amounts due,
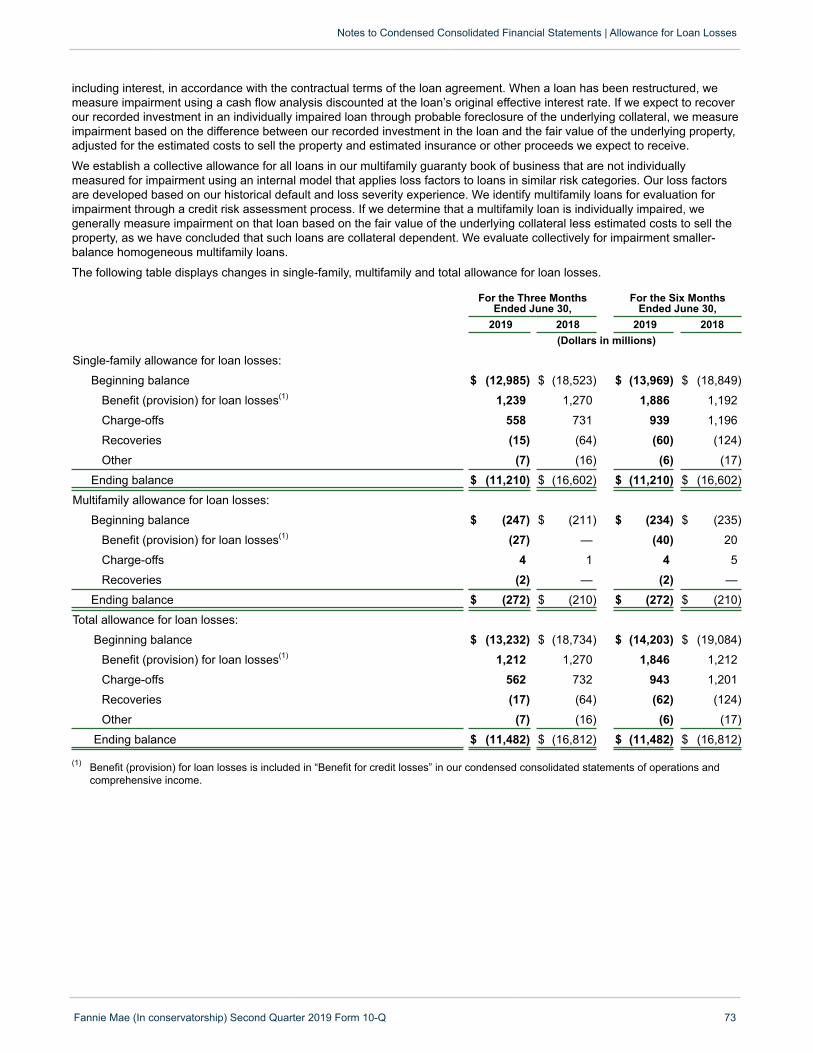
including interest, in accordance with the contractual terms of the loan agreement. When a loan has been restructured, wemeasure impairment using a cash flow analysis discounted at the loan’s original effective interest rate. If we expect to recoverour recorded investment in an individually impaired loan through probable foreclosure of the underlying collateral, we measureimpairment based on the difference between our recorded investment in the loan and the fair value of the underlying property,adjusted for the estimated costs to sell the property and estimated insurance or other proceeds we expect to receive.
We establish a collective allowance for all loans in our multifamily guaranty book of business that are not individuallymeasured for impairment using an internal model that applies loss factors to loans in similar risk categories. Our loss factorsare developed based on our historical default and loss severity experience. We identify multifamily loans for evaluation forimpairment through a credit risk assessment process. If we determine that a multifamily loan is individually impaired, wegenerally measure impairment on that loan based on the fair value of the underlying collateral less estimated costs to sell theproperty, as we have concluded that such loans are collateral dependent. We evaluate collectively for impairment smaller-balance homogeneous multifamily loans.
The following table displays changes in single-family, multifamily and total allowance for loan losses.
For the Three MonthsEnded June 30,
For the Six MonthsEnded June 30,
2019 2018 2019 2018(Dollars in millions)
Single-family allowance for loan losses:
Beginning balance $ (12,985) $ (18,523) $ (13,969) $ (18,849)
Benefit (provision) for loan losses(1) 1,239 1,270 1,886 1,192
Charge-offs 558 731 939 1,196
Recoveries (15) (64) (60) (124)
Other (7) (16) (6) (17)
Ending balance $ (11,210) $ (16,602) $ (11,210) $ (16,602)
Multifamily allowance for loan losses:
Beginning balance $ (247) $ (211) $ (234) $ (235)
Benefit (provision) for loan losses(1) (27) — (40) 20
Charge-offs 4 1 4 5
Recoveries (2) — (2) —
Ending balance $ (272) $ (210) $ (272) $ (210)
Total allowance for loan losses:
Beginning balance $ (13,232) $ (18,734) $ (14,203) $ (19,084)
Benefit (provision) for loan losses(1) 1,212 1,270 1,846 1,212
Charge-offs 562 732 943 1,201
Recoveries (17) (64) (62) (124)
Other (7) (16) (6) (17)
Ending balance $ (11,482) $ (16,812) $ (11,482) $ (16,812)
(1) Benefit (provision) for loan losses is included in “Benefit for credit losses” in our condensed consolidated statements of operations andcomprehensive income.
Notes to Condensed Consolidated Financial Statements | Allowance for Loan Losses
Fannie Mae (In conservatorship) Second Quarter 2019 Form 10-Q 73
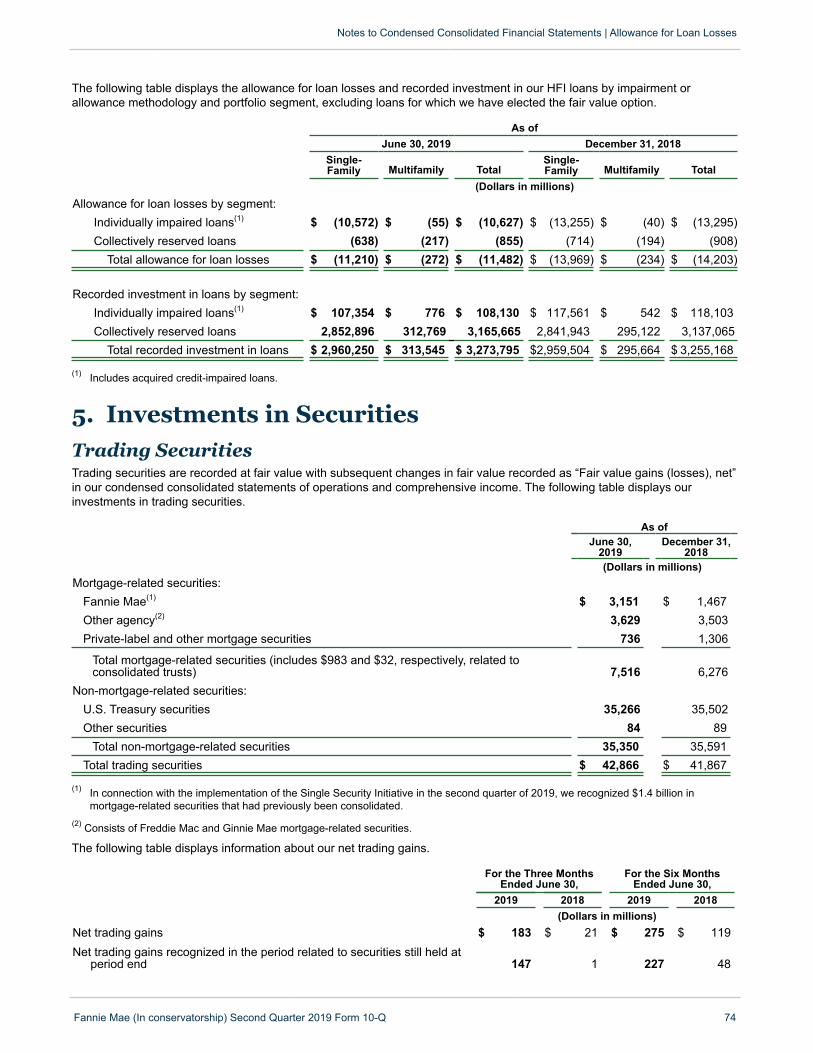
The following table displays the allowance for loan losses and recorded investment in our HFI loans by impairment orallowance methodology and portfolio segment, excluding loans for which we have elected the fair value option.
As ofJune 30, 2019 December 31, 2018
Single-Family Multifamily Total
Single-Family Multifamily Total
(Dollars in millions)Allowance for loan losses by segment:
Individually impaired loans(1) $ (10,572) $ (55) $ (10,627) $ (13,255) $ (40) $ (13,295)Collectively reserved loans (638) (217) (855) (714) (194) (908)
Total allowance for loan losses $ (11,210) $ (272) $ (11,482) $ (13,969) $ (234) $ (14,203)
Recorded investment in loans by segment:Individually impaired loans(1) $ 107,354 $ 776 $ 108,130 $ 117,561 $ 542 $ 118,103Collectively reserved loans 2,852,896 312,769 3,165,665 2,841,943 295,122 3,137,065
Total recorded investment in loans $ 2,960,250 $ 313,545 $ 3,273,795 $2,959,504 $ 295,664 $ 3,255,168
(1) Includes acquired credit-impaired loans.
Notes to Condensed Consolidated Financial Statements | Allowance for Loan Losses
Fannie Mae (In conservatorship) Second Quarter 2019 Form 10-Q 74
5. Investments in Securities
Trading SecuritiesTrading securities are recorded at fair value with subsequent changes in fair value recorded as “Fair value gains (losses), net”in our condensed consolidated statements of operations and comprehensive income. The following table displays ourinvestments in trading securities.
As ofJune 30,
2019December 31,
2018(Dollars in millions)
Mortgage-related securities:Fannie Mae(1) $ 3,151 $ 1,467Other agency(2) 3,629 3,503Private-label and other mortgage securities 736 1,306
Total mortgage-related securities (includes $983 and $32, respectively, related toconsolidated trusts) 7,516 6,276
Non-mortgage-related securities:U.S. Treasury securities 35,266 35,502Other securities 84 89
Total non-mortgage-related securities 35,350 35,591Total trading securities $ 42,866 $ 41,867
(1) In connection with the implementation of the Single Security Initiative in the second quarter of 2019, we recognized $1.4 billion inmortgage-related securities that had previously been consolidated.
(2) Consists of Freddie Mac and Ginnie Mae mortgage-related securities.
The following table displays information about our net trading gains.
For the Three MonthsEnded June 30,
For the Six MonthsEnded June 30,
2019 2018 2019 2018(Dollars in millions)
Net trading gains $ 183 $ 21 $ 275 $ 119Net trading gains recognized in the period related to securities still held at
period end 147 1 227 48

Available-for-Sale SecuritiesWe record AFS securities at fair value with unrealized gains and losses, recorded net of tax, as a component of “Othercomprehensive income (loss)” and we recognize realized gains and losses from the sale of AFS securities in “Investmentgains, net” in our condensed consolidated statements of operations and comprehensive income.
The following table displays the gross realized gains and proceeds on sales of AFS securities.
For the Three MonthsEnded June 30,
For the Six MonthsEnded June 30,
2019 2018 2019 2018(Dollars in millions)
Gross realized gains $ 110 $ — $ 171 $ 363Total proceeds (excludes initial sale of securities from new portfolio
securitizations) 245 6 376 641
Notes to Condensed Consolidated Financial Statements | Investments in Securities
Fannie Mae (In conservatorship) Second Quarter 2019 Form 10-Q 75
The following tables display the amortized cost, gross unrealized gains and losses, and fair value by major security type forAFS securities.
As of June 30, 2019
TotalAmortized
Cost(1)
GrossUnrealized
Gains
GrossUnrealizedLosses(2)
TotalFair
Value(Dollars in millions)
Fannie Mae $ 1,536 $ 90 $ (11) $ 1,615Other agency 209 19 — 228Alt-A and subprime private-label securities 109 111 — 220Mortgage revenue bonds 356 11 (3) 364Other mortgage-related securities 329 5 — 334
Total $ 2,539 $ 236 $ (14) $ 2,761
As of December 31, 2018
TotalAmortized
Cost(1)
GrossUnrealized
Gains
GrossUnrealizedLosses(2)
TotalFair
Value(Dollars in millions)
Fannie Mae $ 1,754 $ 69 $ (26) $ 1,797Other agency 239 17 — 256Alt-A and subprime private-label securities 325 267 — 592Mortgage revenue bonds 425 13 (4) 434Other mortgage-related securities 336 14 — 350
Total $ 3,079 $ 380 $ (30) $ 3,429
(1) Amortized cost consists of unpaid principal balance, unamortized premiums, discounts and other cost basis adjustments, as well as netother-than-temporary impairments (“OTTI”) recognized in “Investment gains, net” in our condensed consolidated statements of operationsand comprehensive income.
(2) Represents the gross unrealized losses on securities for which we have not recognized OTTI, as well as the noncredit component of OTTIand cumulative changes in fair value of securities for which we previously recognized the credit component of OTTI in “Accumulated othercomprehensive income” in our condensed consolidated balance sheets.

The following tables display additional information regarding gross unrealized losses and fair value by major security type forAFS securities in an unrealized loss position.
As of June 30, 2019Less Than 12
Consecutive Months12 Consecutive
Months or LongerGross
UnrealizedLosses
FairValue
GrossUnrealized
LossesFair
Value(Dollars in millions)
Fannie Mae $ — $ — $ (11) $ 366Mortgage revenue bonds — — (3) 5
Total $ — $ — $ (14) $ 371
As of December 31, 2018Less Than 12
Consecutive Months12 Consecutive
Months or LongerGross
UnrealizedLosses
FairValue
GrossUnrealized
LossesFair
Value(Dollars in millions)
Fannie Mae $ — $ — $ (26) $ 487Mortgage revenue bonds (1) 24 (3) 19
Total $ (1) $ 24 $ (29) $ 506
Notes to Condensed Consolidated Financial Statements | Investments in Securities
Fannie Mae (In conservatorship) Second Quarter 2019 Form 10-Q 76
Other-Than-Temporary ImpairmentsThe cumulative outstanding balance related to other-than-temporary-impairment (OTTI) credit loss amounts previouslyrecognized in our condensed consolidated statements of operations and comprehensive income throughout the life of AFSdebt securities held in portfolio were $57 million and $635 million as of June 30, 2019 and December 31, 2018, respectively.Those amounts were $733 million and $1.1 billion as of June 30, 2018 and December 31, 2017, respectively. The decrease inthe cumulative outstanding balance in the first six months of 2019 and 2018 was primarily driven by securities that we nolonger hold in portfolio.
The following table displays net unrealized gains on AFS securities and other amounts within accumulated othercomprehensive income (“AOCI”), net of tax, by major categories.
As ofJune 30, December 31,
2019 2018(Dollars in millions)
Net unrealized gains on AFS securities for which we have not recorded OTTI $ 80 $ 52Net unrealized gains on AFS securities for which we have recorded OTTI 95 224Other 41 46
Accumulated other comprehensive income $ 216 $ 322
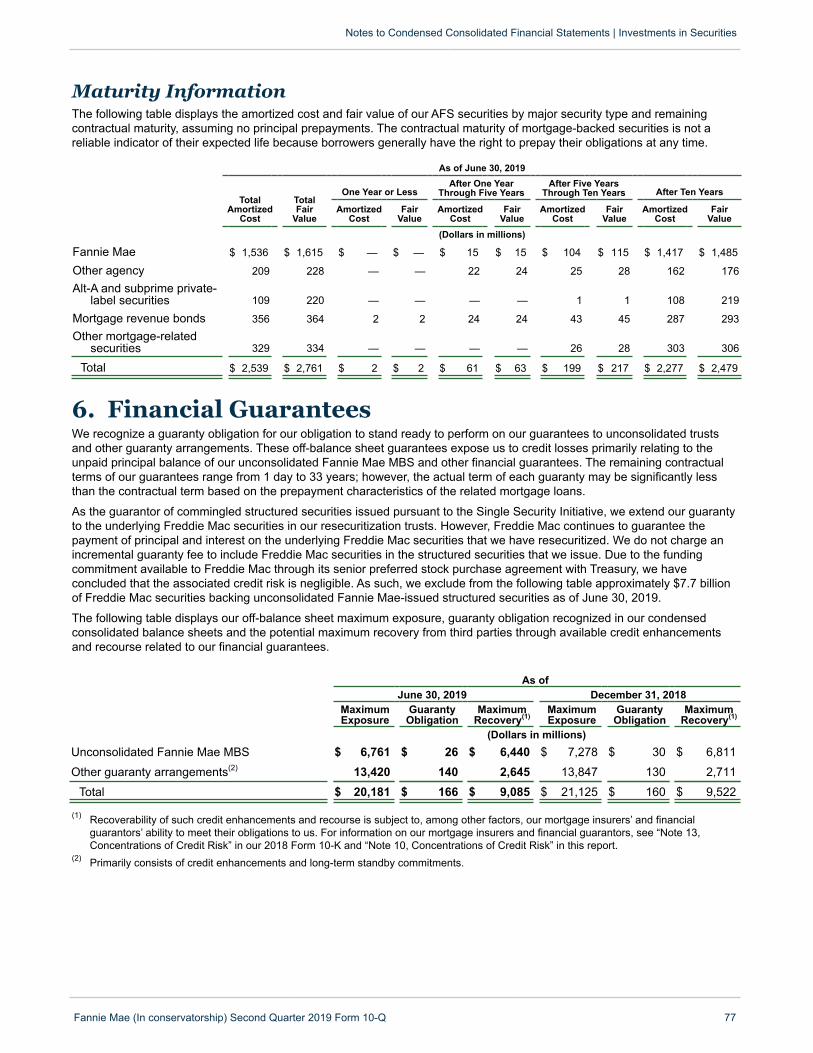
Maturity InformationThe following table displays the amortized cost and fair value of our AFS securities by major security type and remainingcontractual maturity, assuming no principal prepayments. The contractual maturity of mortgage-backed securities is not areliable indicator of their expected life because borrowers generally have the right to prepay their obligations at any time.
As of June 30, 2019
TotalAmortized
Cost
Total Fair
Value
One Year or LessAfter One Year
Through Five YearsAfter Five Years
Through Ten Years After Ten Years
AmortizedCost
FairValue
AmortizedCost
FairValue
AmortizedCost
FairValue
AmortizedCost
FairValue
(Dollars in millions)
Fannie Mae $ 1,536 $ 1,615 $ — $ — $ 15 $ 15 $ 104 $ 115 $ 1,417 $ 1,485
Other agency 209 228 — — 22 24 25 28 162 176Alt-A and subprime private-
label securities 109 220 — — — — 1 1 108 219
Mortgage revenue bonds 356 364 2 2 24 24 43 45 287 293Other mortgage-related
securities 329 334 — — — — 26 28 303 306
Total $ 2,539 $ 2,761 $ 2 $ 2 $ 61 $ 63 $ 199 $ 217 $ 2,277 $ 2,479
Notes to Condensed Consolidated Financial Statements | Investments in Securities
Fannie Mae (In conservatorship) Second Quarter 2019 Form 10-Q 77
6. Financial Guarantees We recognize a guaranty obligation for our obligation to stand ready to perform on our guarantees to unconsolidated trustsand other guaranty arrangements. These off-balance sheet guarantees expose us to credit losses primarily relating to theunpaid principal balance of our unconsolidated Fannie Mae MBS and other financial guarantees. The remaining contractualterms of our guarantees range from 1 day to 33 years; however, the actual term of each guaranty may be significantly lessthan the contractual term based on the prepayment characteristics of the related mortgage loans.
As the guarantor of commingled structured securities issued pursuant to the Single Security Initiative, we extend our guarantyto the underlying Freddie Mac securities in our resecuritization trusts. However, Freddie Mac continues to guarantee thepayment of principal and interest on the underlying Freddie Mac securities that we have resecuritized. We do not charge anincremental guaranty fee to include Freddie Mac securities in the structured securities that we issue. Due to the fundingcommitment available to Freddie Mac through its senior preferred stock purchase agreement with Treasury, we haveconcluded that the associated credit risk is negligible. As such, we exclude from the following table approximately $7.7 billionof Freddie Mac securities backing unconsolidated Fannie Mae-issued structured securities as of June 30, 2019.
The following table displays our off-balance sheet maximum exposure, guaranty obligation recognized in our condensedconsolidated balance sheets and the potential maximum recovery from third parties through available credit enhancementsand recourse related to our financial guarantees.
As ofJune 30, 2019 December 31, 2018
MaximumExposure
GuarantyObligation
MaximumRecovery(1)
MaximumExposure
GuarantyObligation
MaximumRecovery(1)
(Dollars in millions)Unconsolidated Fannie Mae MBS $ 6,761 $ 26 $ 6,440 $ 7,278 $ 30 $ 6,811
Other guaranty arrangements(2) 13,420 140 2,645 13,847 130 2,711
Total $ 20,181 $ 166 $ 9,085 $ 21,125 $ 160 $ 9,522
(1) Recoverability of such credit enhancements and recourse is subject to, among other factors, our mortgage insurers’ and financialguarantors’ ability to meet their obligations to us. For information on our mortgage insurers and financial guarantors, see “Note 13,Concentrations of Credit Risk” in our 2018 Form 10-K and “Note 10, Concentrations of Credit Risk” in this report.
(2) Primarily consists of credit enhancements and long-term standby commitments.
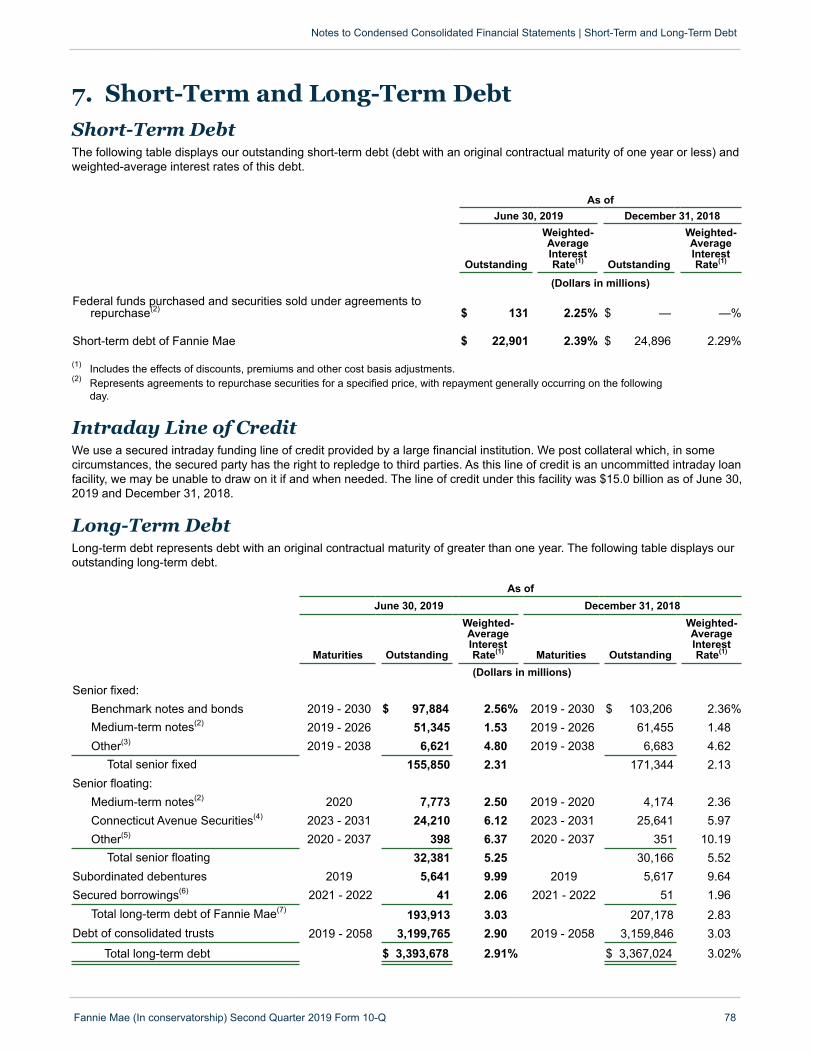
7. Short-Term and Long-Term Debt
Notes to Condensed Consolidated Financial Statements | Short-Term and Long-Term Debt
Fannie Mae (In conservatorship) Second Quarter 2019 Form 10-Q 78
Short-Term DebtThe following table displays our outstanding short-term debt (debt with an original contractual maturity of one year or less) andweighted-average interest rates of this debt.
As ofJune 30, 2019 December 31, 2018
Outstanding
Weighted-AverageInterestRate(1) Outstanding
Weighted-AverageInterestRate(1)
(Dollars in millions)
Federal funds purchased and securities sold under agreements torepurchase(2) $ 131 2.25% $ — —%
Short-term debt of Fannie Mae $ 22,901 2.39% $ 24,896 2.29%
(1) Includes the effects of discounts, premiums and other cost basis adjustments.(2) Represents agreements to repurchase securities for a specified price, with repayment generally occurring on the following
day.
Intraday Line of CreditWe use a secured intraday funding line of credit provided by a large financial institution. We post collateral which, in somecircumstances, the secured party has the right to repledge to third parties. As this line of credit is an uncommitted intraday loanfacility, we may be unable to draw on it if and when needed. The line of credit under this facility was $15.0 billion as of June 30,2019 and December 31, 2018.
Long-Term DebtLong-term debt represents debt with an original contractual maturity of greater than one year. The following table displays ouroutstanding long-term debt.
As ofJune 30, 2019 December 31, 2018
Maturities Outstanding
Weighted-AverageInterestRate(1) Maturities Outstanding
Weighted-AverageInterestRate(1)
(Dollars in millions)Senior fixed:
Benchmark notes and bonds 2019 - 2030 $ 97,884 2.56% 2019 - 2030 $ 103,206 2.36%Medium-term notes(2) 2019 - 2026 51,345 1.53 2019 - 2026 61,455 1.48Other(3) 2019 - 2038 6,621 4.80 2019 - 2038 6,683 4.62
Total senior fixed 155,850 2.31 171,344 2.13Senior floating:
Medium-term notes(2) 2020 7,773 2.50 2019 - 2020 4,174 2.36Connecticut Avenue Securities(4) 2023 - 2031 24,210 6.12 2023 - 2031 25,641 5.97Other(5) 2020 - 2037 398 6.37 2020 - 2037 351 10.19
Total senior floating 32,381 5.25 30,166 5.52Subordinated debentures 2019 5,641 9.99 2019 5,617 9.64Secured borrowings(6) 2021 - 2022 41 2.06 2021 - 2022 51 1.96
Total long-term debt of Fannie Mae(7) 193,913 3.03 207,178 2.83Debt of consolidated trusts 2019 - 2058 3,199,765 2.90 2019 - 2058 3,159,846 3.03
Total long-term debt $ 3,393,678 2.91% $ 3,367,024 3.02%
(1) Includes the effects of discounts, premiums and other cost basis adjustments.(2) Includes long-term debt with an original contractual maturity of greater than 1 year and up to 10 years, excluding zero-coupon debt.(3) Includes other long-term debt with an original contractual maturity of greater than 10 years and foreign exchange bonds.(4) Credit risk-sharing securities that transfer a portion of the credit risk on specified pools of single-family mortgage loans to the investors in
these securities, a portion of which is reported at fair value. Represents Connecticut Avenue Securities issued prior to the implementationof our CAS REMIC structure in November 2018. See “Note 2, Consolidations and Transfers of Financial Assets” in our 2018 Form 10-K formore information about our CAS REMIC structure.
(5) Consists of structured debt instruments that are reported at fair value.(6) Represents our remaining liability resulting from the transfer of financial assets from our condensed consolidated balance sheets that did
not qualify as a sale under the accounting guidance for the transfer of financial instruments.(7) Includes unamortized discounts and premiums, other cost basis adjustments and fair value adjustments of $151 million and $413
million as of June 30, 2019 and December 31, 2018, respectively.
Notes to Condensed Consolidated Financial Statements | Short-Term and Long-Term Debt
Fannie Mae (In conservatorship) Second Quarter 2019 Form 10-Q 79
8. Derivative Instruments Derivative instruments are an integral part of our strategy in managing interest rate risk. Derivative instruments may beprivately-negotiated, bilateral contracts, or they may be listed and traded on an exchange. We refer to our derivativetransactions made pursuant to bilateral contracts as our over-the-counter (“OTC”) derivative transactions and our derivativetransactions accepted for clearing by a derivatives clearing organization as our cleared derivative transactions. We typically donot settle the notional amount of our risk management derivatives; rather, notional amounts provide the basis for calculatingactual payments or settlement amounts. The derivative contracts we use for interest rate risk management purposes consistprimarily of interest rate swaps and interest rate options.
We enter into various forms of credit risk-sharing agreements that we account for as derivatives, including some of our creditrisk transfer transactions and swap credit enhancements. The majority of our credit-related derivatives are credit risk transfertransactions, whereby a portion of the credit risk associated with losses on a reference pool of mortgage loans is transferred toa third party. Additionally, we enter into derivative transactions that are associated with some of our other credit risk transfertransactions, whereby we manage investment risk to guarantee that certain unconsolidated VIEs have sufficient cash flows topay their contractual obligations.
We enter into forward purchase and sale commitments that lock in the future delivery of mortgage loans and mortgage-relatedsecurities at a fixed price or yield. Certain commitments to purchase mortgage loans and purchase or sell mortgage-relatedsecurities meet the criteria of a derivative. We typically settle the notional amount of our mortgage commitments that areaccounted for as derivatives.
We recognize all derivatives as either assets or liabilities in our condensed consolidated balance sheets at their fair value on atrade date basis. Fair value amounts, which are netted to the extent a legal right of offset exists and is enforceable by law atthe counterparty level and are inclusive of the right or obligation associated with the cash collateral posted or received, arerecorded in “Other assets” or “Other liabilities” in our condensed consolidated balance sheets. See “Note 12, Fair Value” foradditional information on derivatives recorded at fair value. We present cash flows from derivatives as operating activities inour condensed consolidated statements of cash flows.
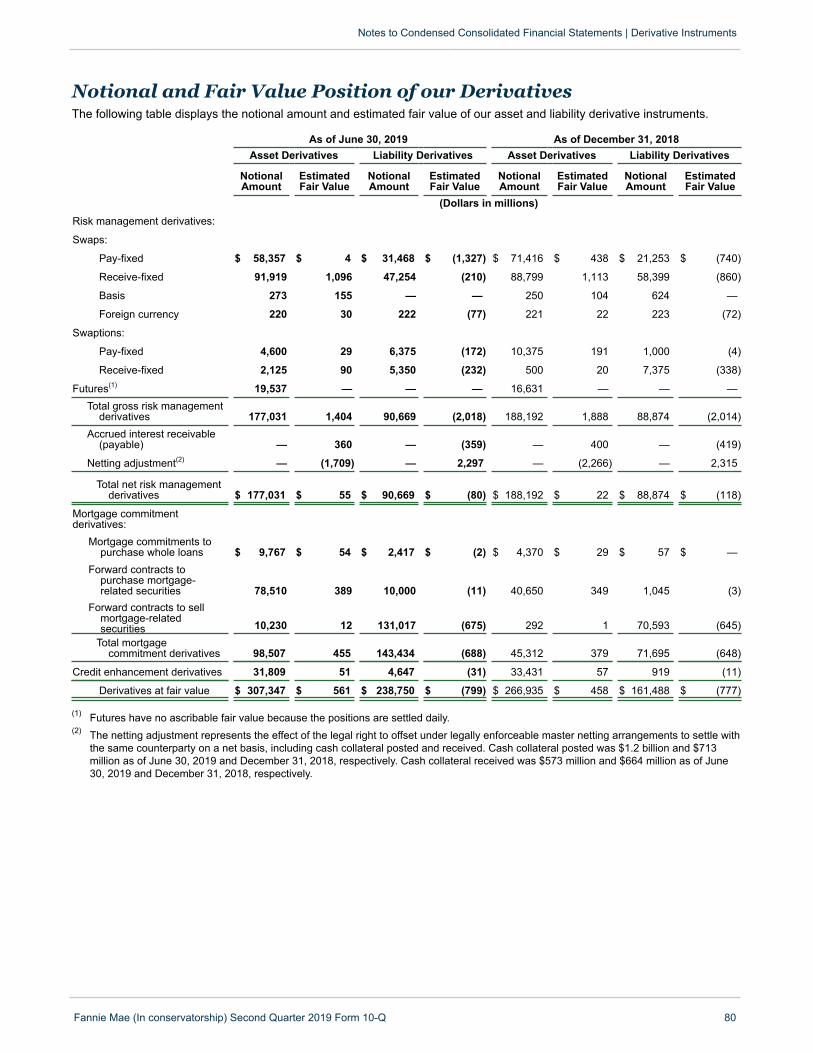
Notional and Fair Value Position of our DerivativesThe following table displays the notional amount and estimated fair value of our asset and liability derivative instruments.
As of June 30, 2019 As of December 31, 2018Asset Derivatives Liability Derivatives Asset Derivatives Liability Derivatives
NotionalAmount
EstimatedFair Value
NotionalAmount
EstimatedFair Value
NotionalAmount
EstimatedFair Value
NotionalAmount
EstimatedFair Value
(Dollars in millions)Risk management derivatives:
Swaps:
Pay-fixed $ 58,357 $ 4 $ 31,468 $ (1,327) $ 71,416 $ 438 $ 21,253 $ (740)
Receive-fixed 91,919 1,096 47,254 (210) 88,799 1,113 58,399 (860)
Basis 273 155 — — 250 104 624 —
Foreign currency 220 30 222 (77) 221 22 223 (72)
Swaptions:
Pay-fixed 4,600 29 6,375 (172) 10,375 191 1,000 (4)
Receive-fixed 2,125 90 5,350 (232) 500 20 7,375 (338)
Futures(1) 19,537 — — — 16,631 — — —Total gross risk management
derivatives 177,031 1,404 90,669 (2,018) 188,192 1,888 88,874 (2,014)Accrued interest receivable
(payable) — 360 — (359) — 400 — (419)
Netting adjustment(2) — (1,709) — 2,297 — (2,266) — 2,315
Total net risk managementderivatives $ 177,031 $ 55 $ 90,669 $ (80) $ 188,192 $ 22 $ 88,874 $ (118)
Mortgage commitmentderivatives:
Mortgage commitments topurchase whole loans $ 9,767 $ 54 $ 2,417 $ (2) $ 4,370 $ 29 $ 57 $ —
Forward contracts topurchase mortgage-related securities 78,510 389 10,000 (11) 40,650 349 1,045 (3)
Forward contracts to sellmortgage-relatedsecurities 10,230 12 131,017 (675) 292 1 70,593 (645)
Total mortgagecommitment derivatives 98,507 455 143,434 (688) 45,312 379 71,695 (648)
Credit enhancement derivatives 31,809 51 4,647 (31) 33,431 57 919 (11)
Derivatives at fair value $ 307,347 $ 561 $ 238,750 $ (799) $ 266,935 $ 458 $ 161,488 $ (777)
(1) Futures have no ascribable fair value because the positions are settled daily.(2) The netting adjustment represents the effect of the legal right to offset under legally enforceable master netting arrangements to settle with
the same counterparty on a net basis, including cash collateral posted and received. Cash collateral posted was $1.2 billion and $713million as of June 30, 2019 and December 31, 2018, respectively. Cash collateral received was $573 million and $664 million as of June30, 2019 and December 31, 2018, respectively.
Notes to Condensed Consolidated Financial Statements | Derivative Instruments
Fannie Mae (In conservatorship) Second Quarter 2019 Form 10-Q 80
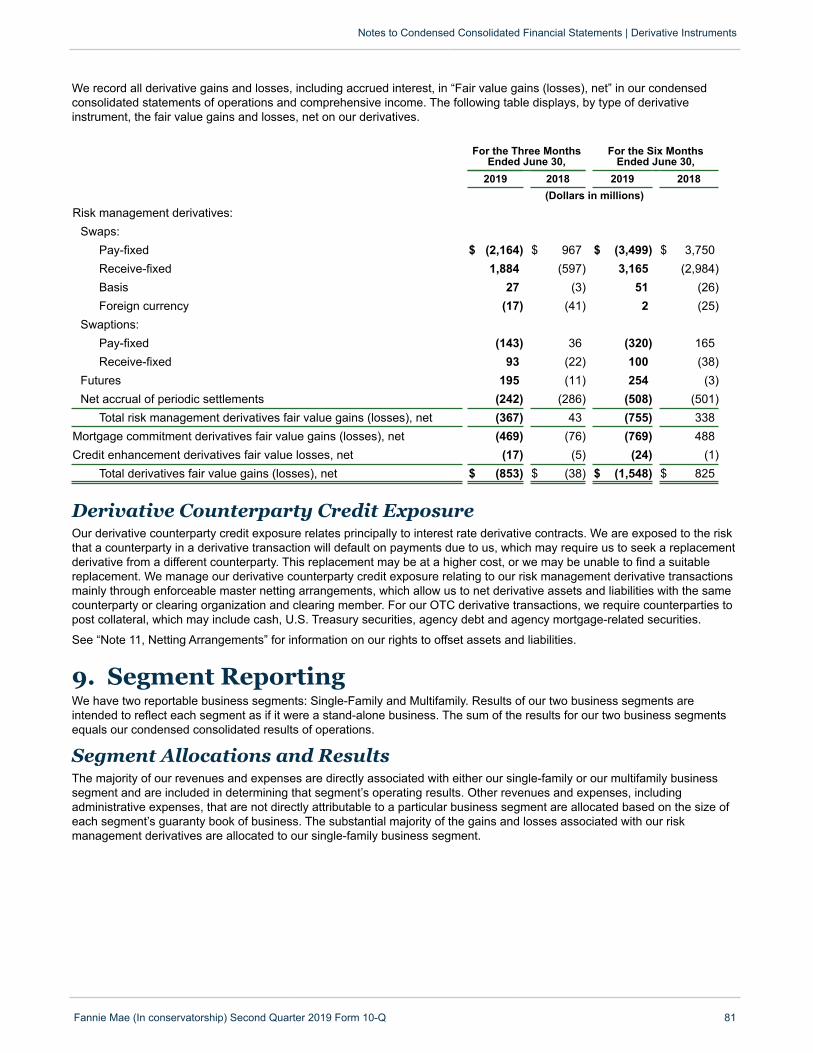
We record all derivative gains and losses, including accrued interest, in “Fair value gains (losses), net” in our condensedconsolidated statements of operations and comprehensive income. The following table displays, by type of derivativeinstrument, the fair value gains and losses, net on our derivatives.
For the Three MonthsEnded June 30,
For the Six MonthsEnded June 30,
2019 2018 2019 2018(Dollars in millions)
Risk management derivatives:Swaps:
Pay-fixed $ (2,164) $ 967 $ (3,499) $ 3,750Receive-fixed 1,884 (597) 3,165 (2,984)Basis 27 (3) 51 (26)Foreign currency (17) (41) 2 (25)
Swaptions:Pay-fixed (143) 36 (320) 165Receive-fixed 93 (22) 100 (38)
Futures 195 (11) 254 (3)Net accrual of periodic settlements (242) (286) (508) (501)
Total risk management derivatives fair value gains (losses), net (367) 43 (755) 338Mortgage commitment derivatives fair value gains (losses), net (469) (76) (769) 488Credit enhancement derivatives fair value losses, net (17) (5) (24) (1)
Total derivatives fair value gains (losses), net $ (853) $ (38) $ (1,548) $ 825
Notes to Condensed Consolidated Financial Statements | Derivative Instruments
Fannie Mae (In conservatorship) Second Quarter 2019 Form 10-Q 81
Derivative Counterparty Credit ExposureOur derivative counterparty credit exposure relates principally to interest rate derivative contracts. We are exposed to the riskthat a counterparty in a derivative transaction will default on payments due to us, which may require us to seek a replacementderivative from a different counterparty. This replacement may be at a higher cost, or we may be unable to find a suitablereplacement. We manage our derivative counterparty credit exposure relating to our risk management derivative transactionsmainly through enforceable master netting arrangements, which allow us to net derivative assets and liabilities with the samecounterparty or clearing organization and clearing member. For our OTC derivative transactions, we require counterparties topost collateral, which may include cash, U.S. Treasury securities, agency debt and agency mortgage-related securities.
See “Note 11, Netting Arrangements” for information on our rights to offset assets and liabilities.
9. Segment Reporting We have two reportable business segments: Single-Family and Multifamily. Results of our two business segments areintended to reflect each segment as if it were a stand-alone business. The sum of the results for our two business segmentsequals our condensed consolidated results of operations.
Segment Allocations and ResultsThe majority of our revenues and expenses are directly associated with either our single-family or our multifamily businesssegment and are included in determining that segment’s operating results. Other revenues and expenses, includingadministrative expenses, that are not directly attributable to a particular business segment are allocated based on the size ofeach segment’s guaranty book of business. The substantial majority of the gains and losses associated with our riskmanagement derivatives are allocated to our single-family business segment.
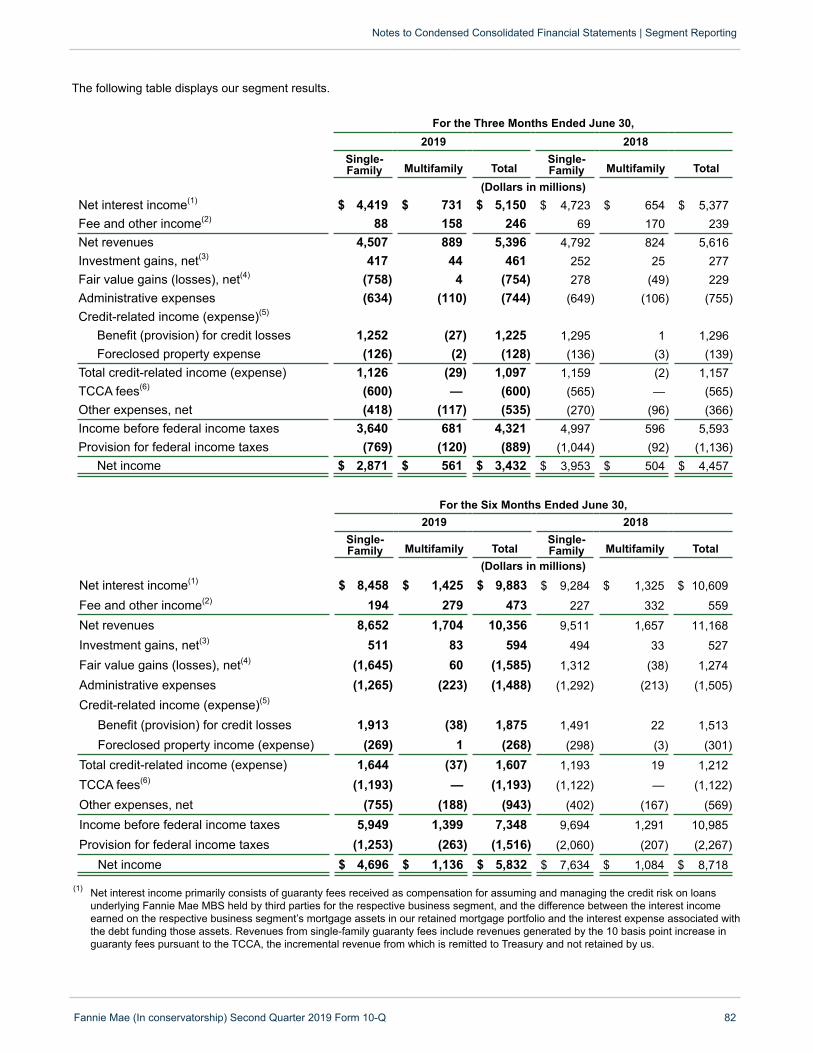
The following table displays our segment results.
For the Three Months Ended June 30,2019 2018
Single-Family Multifamily Total
Single-Family Multifamily Total
(Dollars in millions)Net interest income(1) $ 4,419 $ 731 $ 5,150 $ 4,723 $ 654 $ 5,377Fee and other income(2) 88 158 246 69 170 239Net revenues 4,507 889 5,396 4,792 824 5,616Investment gains, net(3) 417 44 461 252 25 277Fair value gains (losses), net(4) (758) 4 (754) 278 (49) 229Administrative expenses (634) (110) (744) (649) (106) (755)Credit-related income (expense)(5)
Benefit (provision) for credit losses 1,252 (27) 1,225 1,295 1 1,296Foreclosed property expense (126) (2) (128) (136) (3) (139)
Total credit-related income (expense) 1,126 (29) 1,097 1,159 (2) 1,157TCCA fees(6) (600) — (600) (565) — (565)Other expenses, net (418) (117) (535) (270) (96) (366)Income before federal income taxes 3,640 681 4,321 4,997 596 5,593Provision for federal income taxes (769) (120) (889) (1,044) (92) (1,136)
Net income $ 2,871 $ 561 $ 3,432 $ 3,953 $ 504 $ 4,457
For the Six Months Ended June 30,2019 2018
Single-Family Multifamily Total
Single-Family Multifamily Total
(Dollars in millions)
Net interest income(1) $ 8,458 $ 1,425 $ 9,883 $ 9,284 $ 1,325 $ 10,609Fee and other income(2) 194 279 473 227 332 559Net revenues 8,652 1,704 10,356 9,511 1,657 11,168Investment gains, net(3) 511 83 594 494 33 527Fair value gains (losses), net(4) (1,645) 60 (1,585) 1,312 (38) 1,274Administrative expenses (1,265) (223) (1,488) (1,292) (213) (1,505)Credit-related income (expense)(5)
Benefit (provision) for credit losses 1,913 (38) 1,875 1,491 22 1,513Foreclosed property income (expense) (269) 1 (268) (298) (3) (301)
Total credit-related income (expense) 1,644 (37) 1,607 1,193 19 1,212TCCA fees(6) (1,193) — (1,193) (1,122) — (1,122)Other expenses, net (755) (188) (943) (402) (167) (569)Income before federal income taxes 5,949 1,399 7,348 9,694 1,291 10,985Provision for federal income taxes (1,253) (263) (1,516) (2,060) (207) (2,267)
Net income $ 4,696 $ 1,136 $ 5,832 $ 7,634 $ 1,084 $ 8,718
(1) Net interest income primarily consists of guaranty fees received as compensation for assuming and managing the credit risk on loansunderlying Fannie Mae MBS held by third parties for the respective business segment, and the difference between the interest incomeearned on the respective business segment’s mortgage assets in our retained mortgage portfolio and the interest expense associated withthe debt funding those assets. Revenues from single-family guaranty fees include revenues generated by the 10 basis point increase inguaranty fees pursuant to the TCCA, the incremental revenue from which is remitted to Treasury and not retained by us.
Notes to Condensed Consolidated Financial Statements | Segment Reporting
Fannie Mae (In conservatorship) Second Quarter 2019 Form 10-Q 82

(2) Single-Family fee and other income primarily consists of compensation for engaging in structured transactions and providing other lenderservices, and income resulting from settlement agreements resolving certain claims relating to private-label securities we purchased orthat we have guaranteed. Multifamily fee and other income consists of fees associated with Multifamily business activities, including yieldmaintenance income.
(3) Investment gains and losses primarily consist of gains and losses on the sale of mortgage assets for the respective business segment. (4) Single-Family fair value gains and losses primarily consist of fair value gains and losses on risk management and mortgage commitment
derivatives, trading securities and other financial instruments associated with our single-family guaranty book of business. Multifamily fairvalue gains and losses primarily consist of fair value gains and losses on MBS commitment derivatives, trading securities and otherfinancial instruments associated with our multifamily guaranty book of business.
(5) Credit-related income or expense is based on the guaranty book of business of the respective business segment and consists of theapplicable segment’s benefit or provision for credit losses and foreclosed property income or expense on loans underlying the segment’sguaranty book of business.
(6) Consists of the portion of our single-family guaranty fees that is remitted to Treasury pursuant to the TCCA.
Notes to Condensed Consolidated Financial Statements | Segment Reporting
Fannie Mae (In conservatorship) Second Quarter 2019 Form 10-Q 83
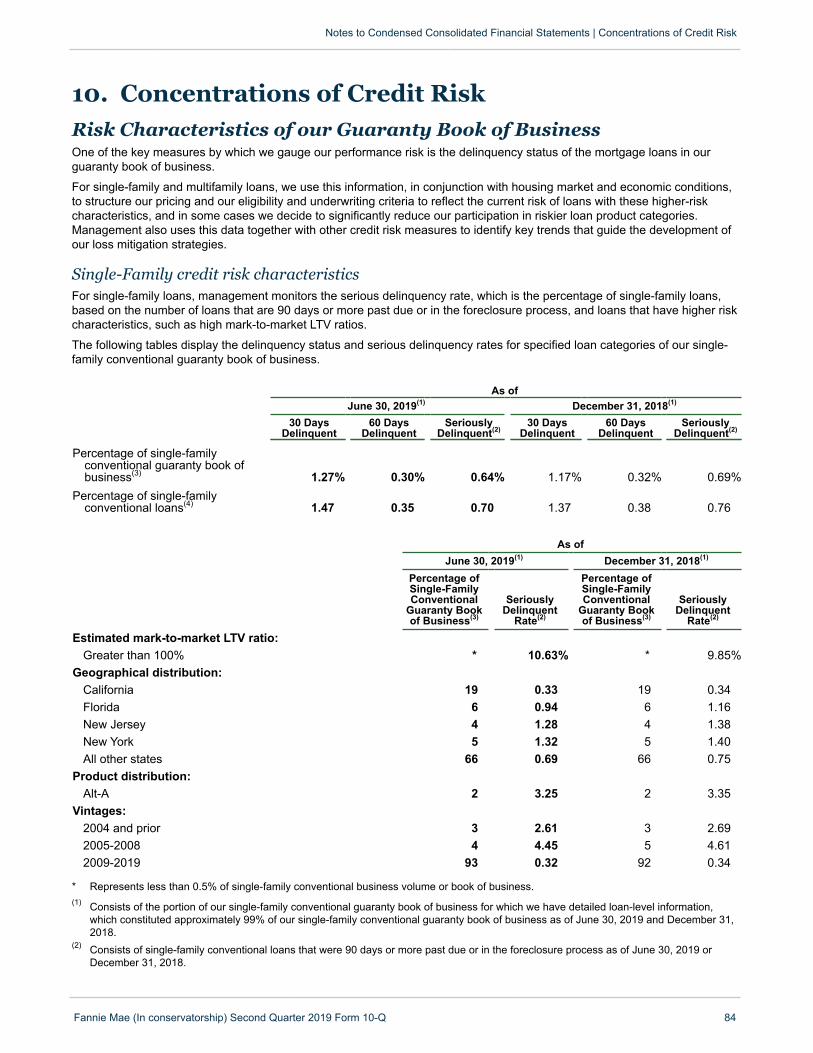
10. Concentrations of Credit Risk
Notes to Condensed Consolidated Financial Statements | Concentrations of Credit Risk
Fannie Mae (In conservatorship) Second Quarter 2019 Form 10-Q 84
Risk Characteristics of our Guaranty Book of BusinessOne of the key measures by which we gauge our performance risk is the delinquency status of the mortgage loans in ourguaranty book of business.
For single-family and multifamily loans, we use this information, in conjunction with housing market and economic conditions,to structure our pricing and our eligibility and underwriting criteria to reflect the current risk of loans with these higher-riskcharacteristics, and in some cases we decide to significantly reduce our participation in riskier loan product categories.Management also uses this data together with other credit risk measures to identify key trends that guide the development ofour loss mitigation strategies.
Single-Family credit risk characteristicsFor single-family loans, management monitors the serious delinquency rate, which is the percentage of single-family loans,based on the number of loans that are 90 days or more past due or in the foreclosure process, and loans that have higher riskcharacteristics, such as high mark-to-market LTV ratios.
The following tables display the delinquency status and serious delinquency rates for specified loan categories of our single-family conventional guaranty book of business.
As ofJune 30, 2019(1) December 31, 2018(1)
30 DaysDelinquent
60 DaysDelinquent
SeriouslyDelinquent(2)
30 DaysDelinquent
60 DaysDelinquent
SeriouslyDelinquent(2)
Percentage of single-familyconventional guaranty book ofbusiness(3) 1.27% 0.30% 0.64% 1.17% 0.32% 0.69%
Percentage of single-familyconventional loans(4) 1.47 0.35 0.70 1.37 0.38 0.76
As ofJune 30, 2019(1) December 31, 2018(1)
Percentage of Single-FamilyConventional
Guaranty Bookof Business(3)
SeriouslyDelinquent
Rate(2)
Percentage of Single-FamilyConventional
Guaranty Bookof Business(3)
SeriouslyDelinquent
Rate(2)
Estimated mark-to-market LTV ratio:Greater than 100% * 10.63% * 9.85%
Geographical distribution:California 19 0.33 19 0.34Florida 6 0.94 6 1.16New Jersey 4 1.28 4 1.38New York 5 1.32 5 1.40All other states 66 0.69 66 0.75
Product distribution:Alt-A 2 3.25 2 3.35
Vintages:2004 and prior 3 2.61 3 2.692005-2008 4 4.45 5 4.612009-2019 93 0.32 92 0.34
* Represents less than 0.5% of single-family conventional business volume or book of business.(1) Consists of the portion of our single-family conventional guaranty book of business for which we have detailed loan-level information,
which constituted approximately 99% of our single-family conventional guaranty book of business as of June 30, 2019 and December 31,2018.
(2) Consists of single-family conventional loans that were 90 days or more past due or in the foreclosure process as of June 30, 2019 orDecember 31, 2018.
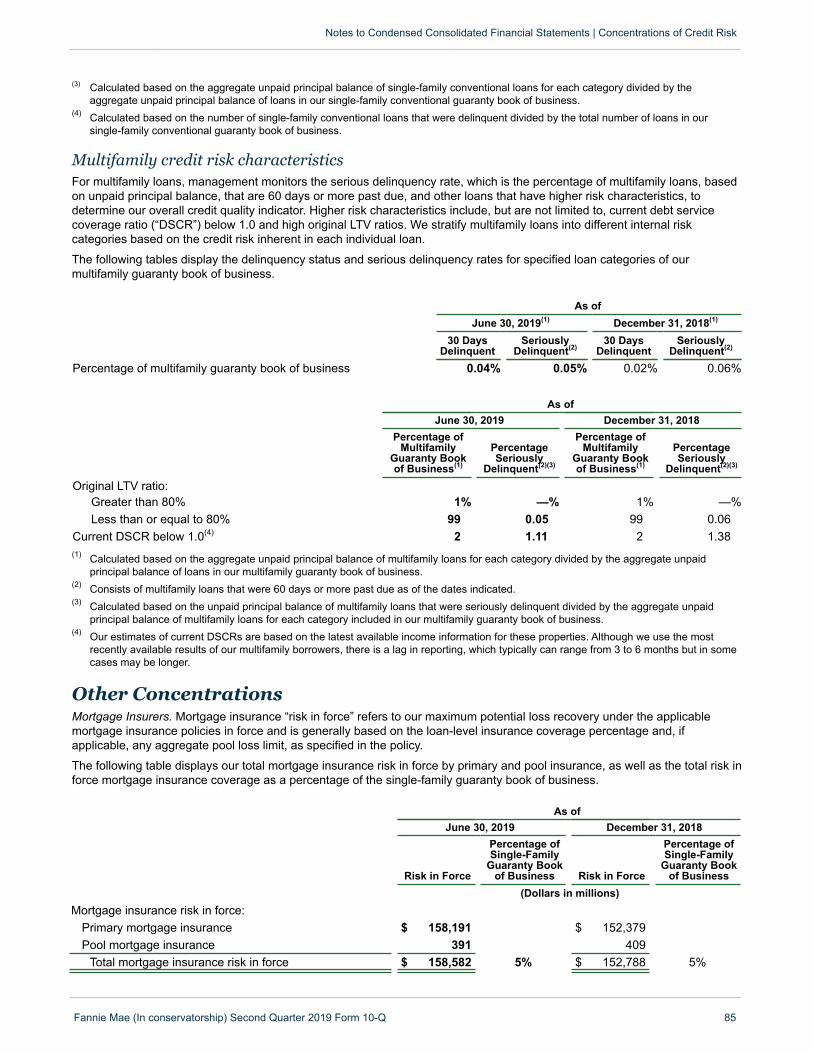
(3) Calculated based on the aggregate unpaid principal balance of single-family conventional loans for each category divided by theaggregate unpaid principal balance of loans in our single-family conventional guaranty book of business.
(4) Calculated based on the number of single-family conventional loans that were delinquent divided by the total number of loans in oursingle-family conventional guaranty book of business.
Notes to Condensed Consolidated Financial Statements | Concentrations of Credit Risk
Fannie Mae (In conservatorship) Second Quarter 2019 Form 10-Q 85
Multifamily credit risk characteristicsFor multifamily loans, management monitors the serious delinquency rate, which is the percentage of multifamily loans, basedon unpaid principal balance, that are 60 days or more past due, and other loans that have higher risk characteristics, todetermine our overall credit quality indicator. Higher risk characteristics include, but are not limited to, current debt servicecoverage ratio (“DSCR”) below 1.0 and high original LTV ratios. We stratify multifamily loans into different internal riskcategories based on the credit risk inherent in each individual loan.
The following tables display the delinquency status and serious delinquency rates for specified loan categories of ourmultifamily guaranty book of business.
As ofJune 30, 2019(1) December 31, 2018(1)
30 DaysDelinquent
SeriouslyDelinquent(2)
30 DaysDelinquent
SeriouslyDelinquent(2)
Percentage of multifamily guaranty book of business 0.04% 0.05% 0.02% 0.06%
As ofJune 30, 2019 December 31, 2018
Percentage ofMultifamily
Guaranty Bookof Business(1)
PercentageSeriously
Delinquent(2)(3)
Percentage ofMultifamily
Guaranty Bookof Business(1)
PercentageSeriously
Delinquent(2)(3)
Original LTV ratio:Greater than 80% 1% —% 1% —%Less than or equal to 80% 99 0.05 99 0.06
Current DSCR below 1.0(4) 2 1.11 2 1.38(1) Calculated based on the aggregate unpaid principal balance of multifamily loans for each category divided by the aggregate unpaid
principal balance of loans in our multifamily guaranty book of business.(2) Consists of multifamily loans that were 60 days or more past due as of the dates indicated.(3) Calculated based on the unpaid principal balance of multifamily loans that were seriously delinquent divided by the aggregate unpaid
principal balance of multifamily loans for each category included in our multifamily guaranty book of business.(4) Our estimates of current DSCRs are based on the latest available income information for these properties. Although we use the most
recently available results of our multifamily borrowers, there is a lag in reporting, which typically can range from 3 to 6 months but in somecases may be longer.
Other ConcentrationsMortgage Insurers. Mortgage insurance “risk in force” refers to our maximum potential loss recovery under the applicablemortgage insurance policies in force and is generally based on the loan-level insurance coverage percentage and, ifapplicable, any aggregate pool loss limit, as specified in the policy.
The following table displays our total mortgage insurance risk in force by primary and pool insurance, as well as the total risk inforce mortgage insurance coverage as a percentage of the single-family guaranty book of business.
As ofJune 30, 2019 December 31, 2018
Risk in Force
Percentage ofSingle-Family
Guaranty Bookof Business Risk in Force
Percentage ofSingle-Family
Guaranty Bookof Business
(Dollars in millions)Mortgage insurance risk in force:
Primary mortgage insurance $ 158,191 $ 152,379Pool mortgage insurance 391 409
Total mortgage insurance risk in force $ 158,582 5% $ 152,788 5%

The table below displays our mortgage insurer counterparties that provided approximately 10% or more of the risk in forcemortgage insurance coverage on mortgage loans in our single-family guaranty book of business.
Percentage of Risk in Force Coverageby Mortgage Insurer
As ofJune 30, 2019 December 31, 2018
Counterparty:(1)
Arch Capital Group Ltd. 24% 25%Radian Guaranty, Inc. 20 21Mortgage Guaranty Insurance Corp. 18 18Genworth Mortgage Insurance Corp.(2) 15 15Essent Guaranty, Inc. 13 12Others 10 9
Total 100% 100%(1) Insurance coverage amounts provided for each counterparty may include coverage provided by affiliates and subsidiaries of the
counterparty.(2) Genworth Financial, Inc., the ultimate parent company of Genworth Mortgage Insurance Corp., is in the process of being acquired by
China Oceanwide Holdings Group Co., Ltd. We have approved the acquisition subject to specified conditions, including GenworthFinancial, Inc. receiving all required and outstanding regulatory approvals. Upon acquisition, Genworth Mortgage Insurance Corp. willcontinue to be subject to our ongoing review of financial and operational eligibility requirements.
Three of our mortgage insurer counterparties that are currently not approved to write new business are in run-off: PMIMortgage Insurance Co. (“PMI”), Triad Guaranty Insurance Corporation (“Triad”) and Republic Mortgage Insurance Company(”RMIC”). Entering run-off may close off a source of profits and liquidity that may have otherwise assisted a mortgage insurerin paying claims under insurance policies, and could also cause the quality and speed of its claims processing to deteriorate.These three mortgage insurers provided a combined $4.0 billion, or 3%, of our risk in force mortgage insurance coverage ofour single-family guaranty book of business as of June 30, 2019.
PMI and Triad have been paying only a portion of policyholder claims and deferring the remaining portion. PMI is currentlypaying 74.5% of claims under its mortgage insurance policies in cash and is deferring the remaining 25.5%, and Triad iscurrently paying 75% of claims in cash and deferring the remaining 25%. It is uncertain whether PMI or Triad will be permittedin the future to pay any remaining deferred policyholder claims and/or increase or decrease the amount of cash they pay onclaims. RMIC is no longer deferring payments on policyholder claims and has paid us its previously outstanding deferredpayment obligations as well as interest on those obligations; however, RMIC remains in run-off.
We have counterparty credit risk relating to the potential insolvency of, or non-performance by, mortgage insurers that insuresingle-family loans we purchase or guarantee. There is risk that these counterparties may fail to fulfill their obligations to payour claims under insurance policies. If we determine that it is probable that we will not collect all of our claims from one ormore of our mortgage insurer counterparties, it could increase our loss reserves, which could adversely affect our results ofoperations, liquidity, financial condition and net worth.
When we estimate the credit losses that are inherent in our mortgage loans and under the terms of our guaranty obligationswe also consider the recoveries that we will receive on primary mortgage insurance, as mortgage insurance recoveries wouldreduce the severity of the loss associated with defaulted loans. We evaluate the financial condition of our mortgage insurercounterparties and adjust the contractually due recovery amounts to ensure that only probable losses as of the balance sheetdate are included in our loss reserve estimate. As a result, if our assessment of one or more of our mortgage insurercounterparties’ ability to fulfill their respective obligations to us worsens, it could increase our loss reserves. As of June 30,2019 and December 31, 2018, our estimated benefit from mortgage insurance reduced our loss reserves by $563 million and$691 million, respectively.
As of June 30, 2019 and December 31, 2018, we had outstanding receivables of $685 million and $745 million, respectively,recorded in “Other assets” in our condensed consolidated balance sheets related to amounts claimed on insured, defaultedloans excluding government-insured loans. As of June 30, 2019 and December 31, 2018, we assessed these outstandingreceivables for collectibility, and established a valuation allowance of $546 million and $564 million, respectively, whichreduces our claim receivable to the amount considered probable of collection.
Mortgage Servicers and Sellers. Mortgage servicers collect mortgage and escrow payments from borrowers, pay taxes andinsurance costs from escrow accounts, monitor and report delinquencies, and perform other required activities on our behalf.Our mortgage servicers and sellers may also be obligated to repurchase loans or foreclosed properties, reimburse us forlosses or provide other remedies under certain circumstances, such as if it is determined that the mortgage loan did not meetour underwriting or eligibility requirements, if certain loan representations and warranties are violated or if mortgage insurers
Notes to Condensed Consolidated Financial Statements | Concentrations of Credit Risk
Fannie Mae (In conservatorship) Second Quarter 2019 Form 10-Q 86
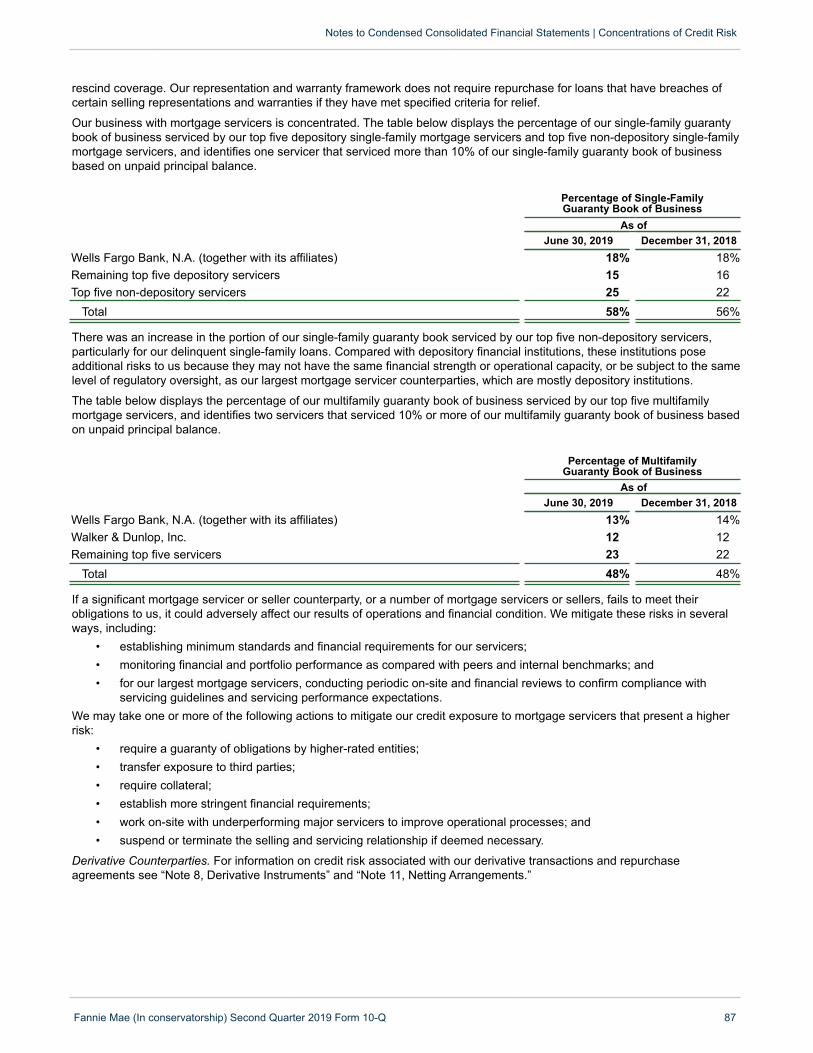
rescind coverage. Our representation and warranty framework does not require repurchase for loans that have breaches ofcertain selling representations and warranties if they have met specified criteria for relief.
Our business with mortgage servicers is concentrated. The table below displays the percentage of our single-family guarantybook of business serviced by our top five depository single-family mortgage servicers and top five non-depository single-familymortgage servicers, and identifies one servicer that serviced more than 10% of our single-family guaranty book of businessbased on unpaid principal balance.
Percentage of Single-FamilyGuaranty Book of Business
As ofJune 30, 2019 December 31, 2018
Wells Fargo Bank, N.A. (together with its affiliates) 18% 18%Remaining top five depository servicers 15 16Top five non-depository servicers 25 22
Total 58% 56%
There was an increase in the portion of our single-family guaranty book serviced by our top five non-depository servicers,particularly for our delinquent single-family loans. Compared with depository financial institutions, these institutions poseadditional risks to us because they may not have the same financial strength or operational capacity, or be subject to the samelevel of regulatory oversight, as our largest mortgage servicer counterparties, which are mostly depository institutions.
The table below displays the percentage of our multifamily guaranty book of business serviced by our top five multifamilymortgage servicers, and identifies two servicers that serviced 10% or more of our multifamily guaranty book of business basedon unpaid principal balance.
Percentage of MultifamilyGuaranty Book of Business
As ofJune 30, 2019 December 31, 2018
Wells Fargo Bank, N.A. (together with its affiliates) 13% 14%Walker & Dunlop, Inc. 12 12Remaining top five servicers 23 22
Total 48% 48%
If a significant mortgage servicer or seller counterparty, or a number of mortgage servicers or sellers, fails to meet theirobligations to us, it could adversely affect our results of operations and financial condition. We mitigate these risks in severalways, including:
• establishing minimum standards and financial requirements for our servicers;• monitoring financial and portfolio performance as compared with peers and internal benchmarks; and• for our largest mortgage servicers, conducting periodic on-site and financial reviews to confirm compliance with
servicing guidelines and servicing performance expectations.We may take one or more of the following actions to mitigate our credit exposure to mortgage servicers that present a higherrisk:
• require a guaranty of obligations by higher-rated entities;• transfer exposure to third parties;• require collateral;• establish more stringent financial requirements;• work on-site with underperforming major servicers to improve operational processes; and• suspend or terminate the selling and servicing relationship if deemed necessary.
Derivative Counterparties. For information on credit risk associated with our derivative transactions and repurchaseagreements see “Note 8, Derivative Instruments” and “Note 11, Netting Arrangements.”
Notes to Condensed Consolidated Financial Statements | Concentrations of Credit Risk
Fannie Mae (In conservatorship) Second Quarter 2019 Form 10-Q 87
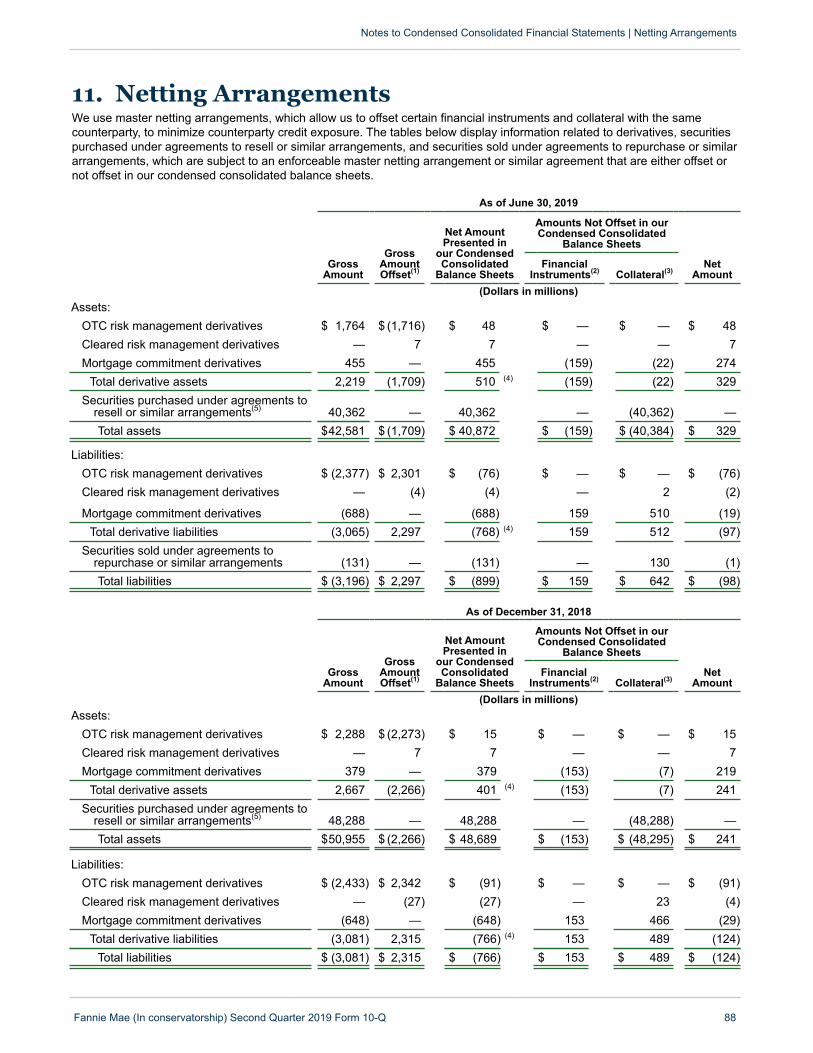
11. Netting Arrangements We use master netting arrangements, which allow us to offset certain financial instruments and collateral with the samecounterparty, to minimize counterparty credit exposure. The tables below display information related to derivatives, securitiespurchased under agreements to resell or similar arrangements, and securities sold under agreements to repurchase or similararrangements, which are subject to an enforceable master netting arrangement or similar agreement that are either offset ornot offset in our condensed consolidated balance sheets.
As of June 30, 2019
GrossAmountOffset(1)
Net AmountPresented in
our CondensedConsolidated
Balance Sheets
Amounts Not Offset in ourCondensed Consolidated
Balance Sheets
GrossAmount
FinancialInstruments(2) Collateral(3)
NetAmount
(Dollars in millions)Assets:
OTC risk management derivatives $ 1,764 $ (1,716) $ 48 $ — $ — $ 48Cleared risk management derivatives — 7 7 — — 7Mortgage commitment derivatives 455 — 455 (159) (22) 274
Total derivative assets 2,219 (1,709) 510 (4) (159) (22) 329Securities purchased under agreements to
resell or similar arrangements(5) 40,362 — 40,362 — (40,362) —Total assets $42,581 $ (1,709) $ 40,872 $ (159) $ (40,384) $ 329
Liabilities:OTC risk management derivatives $ (2,377) $ 2,301 $ (76) $ — $ — $ (76)Cleared risk management derivatives — (4) (4) — 2 (2)
Mortgage commitment derivatives (688) — (688) 159 510 (19)Total derivative liabilities (3,065) 2,297 (768) (4) 159 512 (97)
Securities sold under agreements torepurchase or similar arrangements (131) — (131) — 130 (1)Total liabilities $ (3,196) $ 2,297 $ (899) $ 159 $ 642 $ (98)
As of December 31, 2018
GrossAmountOffset(1)
Net AmountPresented in
our CondensedConsolidated
Balance Sheets
Amounts Not Offset in ourCondensed Consolidated
Balance Sheets
GrossAmount
FinancialInstruments(2) Collateral(3)
NetAmount
(Dollars in millions)Assets:
OTC risk management derivatives $ 2,288 $ (2,273) $ 15 $ — $ — $ 15Cleared risk management derivatives — 7 7 — — 7Mortgage commitment derivatives 379 — 379 (153) (7) 219
Total derivative assets 2,667 (2,266) 401 (4) (153) (7) 241Securities purchased under agreements to
resell or similar arrangements(5) 48,288 — 48,288 — (48,288) —Total assets $50,955 $ (2,266) $ 48,689 $ (153) $ (48,295) $ 241
Liabilities:OTC risk management derivatives $ (2,433) $ 2,342 $ (91) $ — $ — $ (91)Cleared risk management derivatives — (27) (27) — 23 (4)Mortgage commitment derivatives (648) — (648) 153 466 (29)
Total derivative liabilities (3,081) 2,315 (766) (4) 153 489 (124)Total liabilities $ (3,081) $ 2,315 $ (766) $ 153 $ 489 $ (124)
Notes to Condensed Consolidated Financial Statements | Netting Arrangements
Fannie Mae (In conservatorship) Second Quarter 2019 Form 10-Q 88

(1) Represents the effect of the right to offset under legally enforceable master netting arrangements to settle with the same counterparty on anet basis, including cash collateral posted and received and accrued interest.
(2) Mortgage commitment derivative amounts reflect where we have recognized both an asset and a liability with the same counterparty underan enforceable master netting arrangement but we have not elected to offset the related amounts in our condensed consolidated balancesheets.
(3) Represents collateral received that has not been recognized and is not offset in our condensed consolidated balance sheets as well ascollateral posted which has been recognized but not offset in our condensed consolidated balance sheets. The fair value of non-cashcollateral we pledged was $1.6 billion and $1.9 billion as of June 30, 2019 and December 31, 2018, respectively, which the counterpartywas permitted to sell or repledge. The fair value of non-cash collateral received was $40.4 billion and $48.4 billion, of which $37.9 billionand $45.7 billion could be sold or repledged as of June 30, 2019 and December 31, 2018, respectively. None of the underlying collateralwas sold or repledged as of June 30, 2019 or December 31, 2018.
(4) Excludes derivative assets of $51 million and $57 million as of June 30, 2019 and December 31, 2018, respectively, and derivativeliabilities of $31 million and $11 million recognized in our condensed consolidated balance sheets as of June 30, 2019 and December 31,2018, respectively, that are not subject to enforceable master netting arrangements.
(5) Includes $20.8 billion and $15.4 billion in securities purchased under agreements to resell classified as “Cash and cash equivalents” in ourcondensed consolidated balance sheets as of June 30, 2019 and December 31, 2018, respectively.
Derivative instruments are recorded at fair value and securities purchased under agreements to resell or similar arrangementsare recorded at amortized cost in our condensed consolidated balance sheets. For how we determine our rights to offset theassets and liabilities presented above with the same counterparty, including collateral posted or received, see “Note 14,Netting Arrangements” in our 2018 Form 10-K.
Notes to Condensed Consolidated Financial Statements | Netting Arrangements
Fannie Mae (In conservatorship) Second Quarter 2019 Form 10-Q 89
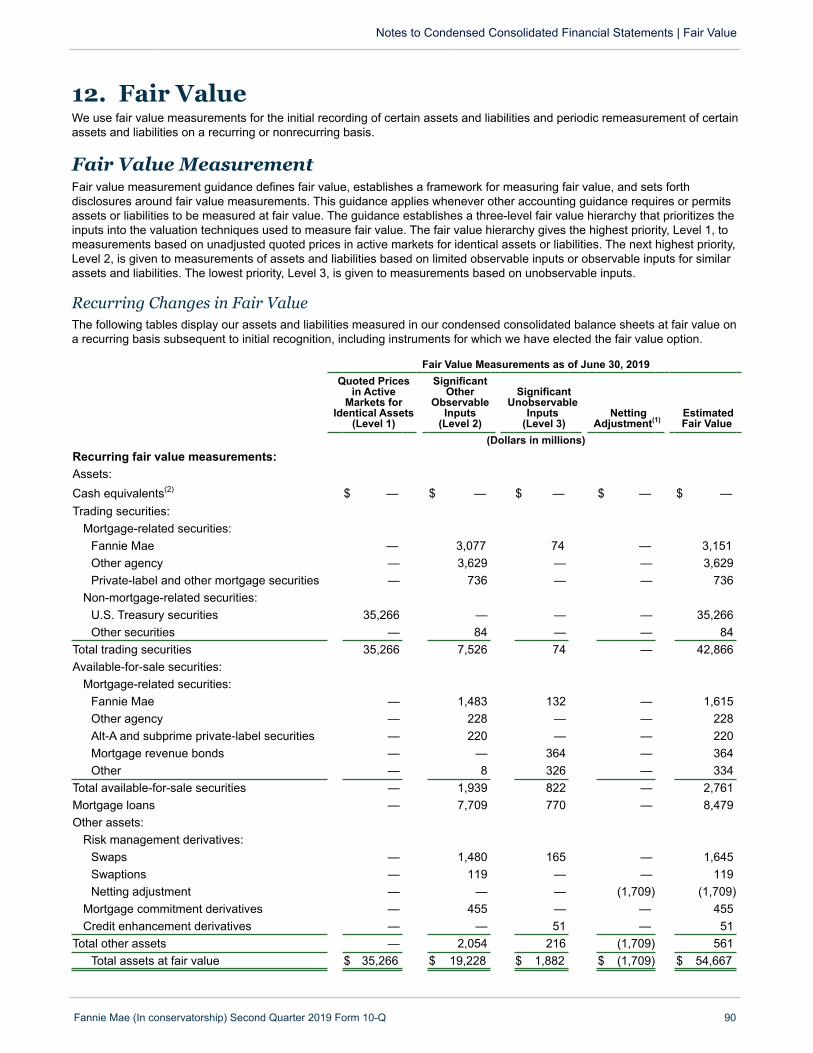
12. Fair Value
Notes to Condensed Consolidated Financial Statements | Fair Value
Fannie Mae (In conservatorship) Second Quarter 2019 Form 10-Q 90
We use fair value measurements for the initial recording of certain assets and liabilities and periodic remeasurement of certainassets and liabilities on a recurring or nonrecurring basis.
Fair Value MeasurementFair value measurement guidance defines fair value, establishes a framework for measuring fair value, and sets forthdisclosures around fair value measurements. This guidance applies whenever other accounting guidance requires or permitsassets or liabilities to be measured at fair value. The guidance establishes a three-level fair value hierarchy that prioritizes theinputs into the valuation techniques used to measure fair value. The fair value hierarchy gives the highest priority, Level 1, tomeasurements based on unadjusted quoted prices in active markets for identical assets or liabilities. The next highest priority,Level 2, is given to measurements of assets and liabilities based on limited observable inputs or observable inputs for similarassets and liabilities. The lowest priority, Level 3, is given to measurements based on unobservable inputs.
Recurring Changes in Fair Value The following tables display our assets and liabilities measured in our condensed consolidated balance sheets at fair value ona recurring basis subsequent to initial recognition, including instruments for which we have elected the fair value option.
Fair Value Measurements as of June 30, 2019Quoted Prices
in ActiveMarkets for
Identical Assets(Level 1)
SignificantOther
ObservableInputs
(Level 2)
SignificantUnobservable
Inputs(Level 3)
NettingAdjustment(1)
EstimatedFair Value
(Dollars in millions)Recurring fair value measurements:Assets:Cash equivalents(2) $ — $ — $ — $ — $ —Trading securities:
Mortgage-related securities:Fannie Mae — 3,077 74 — 3,151Other agency — 3,629 — — 3,629Private-label and other mortgage securities — 736 — — 736
Non-mortgage-related securities:U.S. Treasury securities 35,266 — — — 35,266Other securities — 84 — — 84
Total trading securities 35,266 7,526 74 — 42,866Available-for-sale securities:
Mortgage-related securities:Fannie Mae — 1,483 132 — 1,615Other agency — 228 — — 228Alt-A and subprime private-label securities — 220 — — 220Mortgage revenue bonds — — 364 — 364Other — 8 326 — 334
Total available-for-sale securities — 1,939 822 — 2,761Mortgage loans — 7,709 770 — 8,479Other assets:
Risk management derivatives:Swaps — 1,480 165 — 1,645Swaptions — 119 — — 119Netting adjustment — — — (1,709) (1,709)
Mortgage commitment derivatives — 455 — — 455Credit enhancement derivatives — — 51 — 51
Total other assets — 2,054 216 (1,709) 561Total assets at fair value $ 35,266 $ 19,228 $ 1,882 $ (1,709) $ 54,667

Fair Value Measurements as of June 30, 2019Quoted Prices
in ActiveMarkets for
Identical Assets(Level 1)
SignificantOther
ObservableInputs
(Level 2)
SignificantUnobservable
Inputs (Level 3)
NettingAdjustment(1)
EstimatedFair Value
(Dollars in millions)Liabilities:Long-term debt:
Of Fannie Mae:Senior floating $ — $ 5,972 $ 398 $ — $ 6,370
Total of Fannie Mae — 5,972 398 — 6,370Of consolidated trusts — 22,669 102 — 22,771
Total long-term debt — 28,641 500 — 29,141Other liabilities:
Risk management derivatives:Swaps — 1,971 2 — 1,973Swaptions — 404 — — 404Netting adjustment — — — (2,297) (2,297)
Mortgage commitment derivatives — 688 — — 688Credit enhancement derivatives — — 31 — 31
Total other liabilities — 3,063 33 (2,297) 799Total liabilities at fair value $ — $ 31,704 $ 533 $ (2,297) $ 29,940
Notes to Condensed Consolidated Financial Statements | Fair Value
Fannie Mae (In conservatorship) Second Quarter 2019 Form 10-Q 91
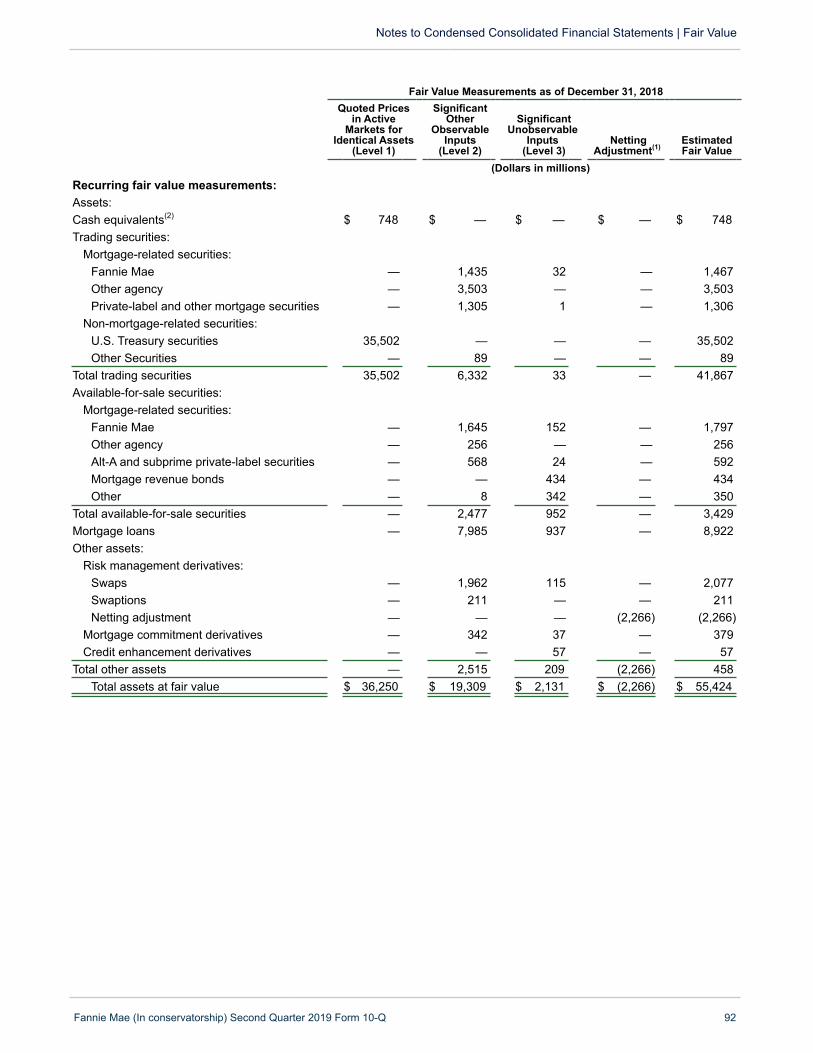
Fair Value Measurements as of December 31, 2018Quoted Prices
in ActiveMarkets for
Identical Assets(Level 1)
SignificantOther
ObservableInputs
(Level 2)
SignificantUnobservable
Inputs (Level 3)
NettingAdjustment(1)
EstimatedFair Value
(Dollars in millions)Recurring fair value measurements:Assets:Cash equivalents(2) $ 748 $ — $ — $ — $ 748Trading securities:
Mortgage-related securities:Fannie Mae — 1,435 32 — 1,467Other agency — 3,503 — — 3,503Private-label and other mortgage securities — 1,305 1 — 1,306
Non-mortgage-related securities:U.S. Treasury securities 35,502 — — — 35,502Other Securities — 89 — — 89
Total trading securities 35,502 6,332 33 — 41,867Available-for-sale securities:
Mortgage-related securities:Fannie Mae — 1,645 152 — 1,797Other agency — 256 — — 256Alt-A and subprime private-label securities — 568 24 — 592Mortgage revenue bonds — — 434 — 434Other — 8 342 — 350
Total available-for-sale securities — 2,477 952 — 3,429Mortgage loans — 7,985 937 — 8,922Other assets:
Risk management derivatives:Swaps — 1,962 115 — 2,077Swaptions — 211 — — 211Netting adjustment — — — (2,266) (2,266)
Mortgage commitment derivatives — 342 37 — 379Credit enhancement derivatives — — 57 — 57
Total other assets — 2,515 209 (2,266) 458Total assets at fair value $ 36,250 $ 19,309 $ 2,131 $ (2,266) $ 55,424
Notes to Condensed Consolidated Financial Statements | Fair Value
Fannie Mae (In conservatorship) Second Quarter 2019 Form 10-Q 92

Fair Value Measurements as of December 31, 2018Quoted Prices
in ActiveMarkets for
Identical Assets(Level 1)
SignificantOther
ObservableInputs
(Level 2)
SignificantUnobservable
Inputs (Level 3)
NettingAdjustment(1)
EstimatedFair Value
(Dollars in millions)Liabilities:Long-term debt:
Of Fannie Mae:Senior floating $ — $ 6,475 $ 351 $ — $ 6,826
Total of Fannie Mae — 6,475 351 — 6,826Of consolidated trusts — 23,552 201 — 23,753
Total long-term debt — 30,027 552 — 30,579Other liabilities:
Risk management derivatives:Swaps — 2,089 2 — 2,091Swaptions — 342 — — 342Netting adjustment — — — (2,315) (2,315)
Mortgage commitment derivatives — 646 2 — 648Credit enhancement derivatives — — 11 — 11
Total other liabilities — 3,077 15 (2,315) 777Total liabilities at fair value $ — $ 33,104 $ 567 $ (2,315) $ 31,356
(1) Derivative contracts are reported on a gross basis by level. The netting adjustment represents the effect of the legal right to offset underlegally enforceable master netting arrangements to settle with the same counterparty on a net basis, including cash collateral posted andreceived.
(2) Cash equivalents are comprised of U.S. Treasuries that have a maturity at the date of acquisition of three months or less.
Notes to Condensed Consolidated Financial Statements | Fair Value
Fannie Mae (In conservatorship) Second Quarter 2019 Form 10-Q 93
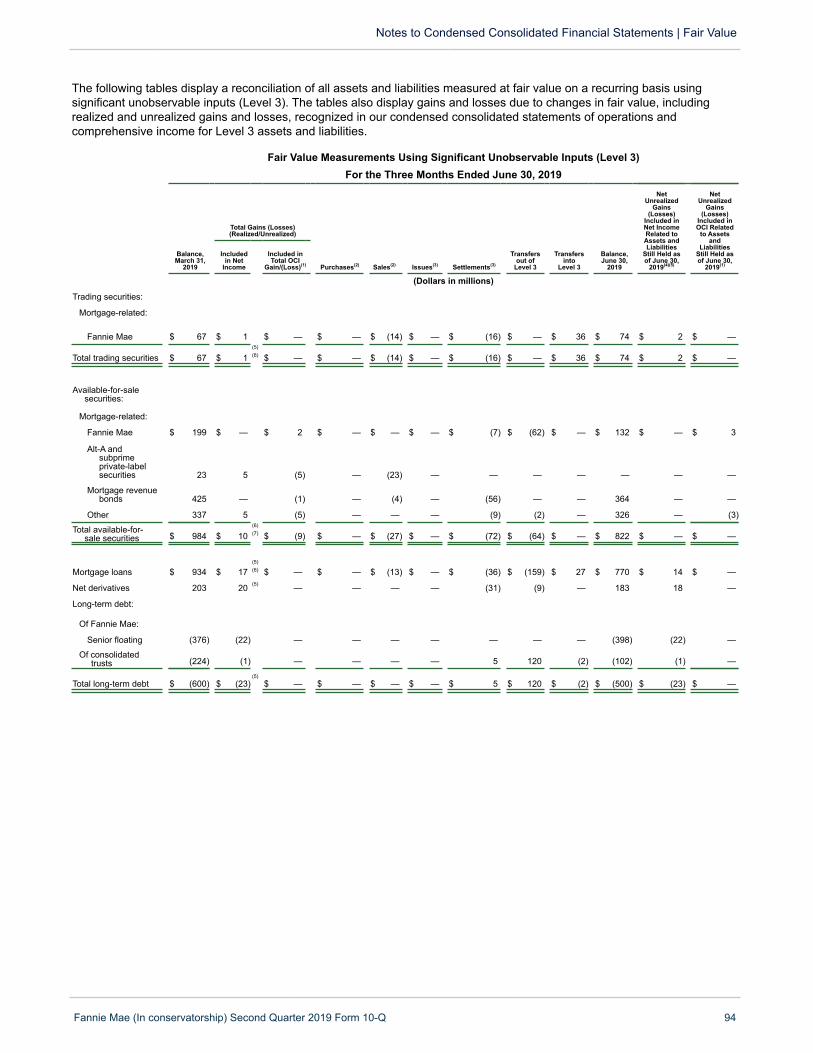
The following tables display a reconciliation of all assets and liabilities measured at fair value on a recurring basis usingsignificant unobservable inputs (Level 3). The tables also display gains and losses due to changes in fair value, includingrealized and unrealized gains and losses, recognized in our condensed consolidated statements of operations andcomprehensive income for Level 3 assets and liabilities.
Fair Value Measurements Using Significant Unobservable Inputs (Level 3)For the Three Months Ended June 30, 2019
Total Gains (Losses)(Realized/Unrealized)
NetUnrealized
Gains(Losses)
Included inNet IncomeRelated toAssets andLiabilities
Still Held asof June 30,
2019(4)(5)
NetUnrealized
Gains(Losses)
Included inOCI Related
to Assetsand
LiabilitiesStill Held asof June 30,
2019(1)
Balance,March 31,
2019
Includedin Net
Income
Included inTotal OCI
Gain/(Loss)(1) Purchases(2) Sales(2) Issues(3) Settlements(3)
Transfersout of
Level 3
Transfersinto
Level 3
Balance,June 30,
2019
(Dollars in millions)
Trading securities:
Mortgage-related:
Fannie Mae $ 67 $ 1 $ — $ — $ (14) $ — $ (16) $ — $ 36 $ 74 $ 2 $ —
Total trading securities $ 67 $ 1(5)(6) $ — $ — $ (14) $ — $ (16) $ — $ 36 $ 74 $ 2 $ —
Available-for-salesecurities:
Mortgage-related:
Fannie Mae $ 199 $ — $ 2 $ — $ — $ — $ (7) $ (62) $ — $ 132 $ — $ 3
Alt-A andsubprimeprivate-labelsecurities 23 5 (5) — (23) — — — — — — —
Mortgage revenuebonds 425 — (1) — (4) — (56) — — 364 — —
Other 337 5 (5) — — — (9) (2) — 326 — (3)
Total available-for-sale securities $ 984 $ 10
(6)(7) $ (9) $ — $ (27) $ — $ (72) $ (64) $ — $ 822 $ — $ —
Mortgage loans $ 934 $ 17(5)(6) $ — $ — $ (13) $ — $ (36) $ (159) $ 27 $ 770 $ 14 $ —
Net derivatives 203 20 (5) — — — — (31) (9) — 183 18 —
Long-term debt:
Of Fannie Mae:
Senior floating (376) (22) — — — — — — — (398) (22) —
Of consolidatedtrusts (224) (1) — — — — 5 120 (2) (102) (1) —
Total long-term debt $ (600) $ (23)(5)
$ — $ — $ — $ — $ 5 $ 120 $ (2) $ (500) $ (23) $ —
Notes to Condensed Consolidated Financial Statements | Fair Value
Fannie Mae (In conservatorship) Second Quarter 2019 Form 10-Q 94
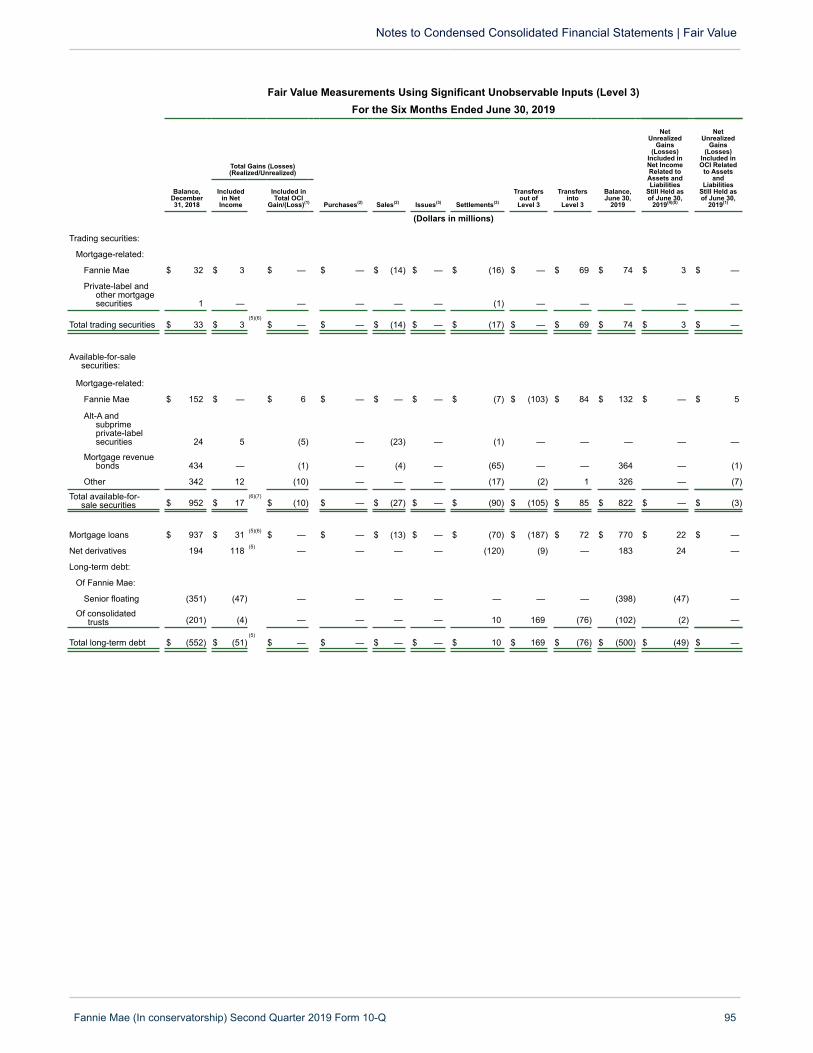
Fair Value Measurements Using Significant Unobservable Inputs (Level 3)For the Six Months Ended June 30, 2019
Total Gains (Losses)(Realized/Unrealized)
NetUnrealized
Gains(Losses)
Included inNet IncomeRelated toAssets andLiabilities
Still Held asof June 30,
2019(4)(5)
NetUnrealized
Gains(Losses)
Included inOCI Related
to Assetsand
LiabilitiesStill Held asof June 30,
2019(1)
Balance,December31, 2018
Includedin Net
Income
Included inTotal OCI
Gain/(Loss)(1) Purchases(2) Sales(2) Issues(3) Settlements(3)
Transfersout of
Level 3
Transfersinto
Level 3
Balance,June 30,
2019
(Dollars in millions)
Trading securities:
Mortgage-related:
Fannie Mae $ 32 $ 3 $ — $ — $ (14) $ — $ (16) $ — $ 69 $ 74 $ 3 $ —
Private-label andother mortgagesecurities 1 — — — — — (1) — — — — —
Total trading securities $ 33 $ 3(5)(6)
$ — $ — $ (14) $ — $ (17) $ — $ 69 $ 74 $ 3 $ —
Available-for-salesecurities:
Mortgage-related:
Fannie Mae $ 152 $ — $ 6 $ — $ — $ — $ (7) $ (103) $ 84 $ 132 $ — $ 5
Alt-A andsubprimeprivate-labelsecurities 24 5 (5) — (23) — (1) — — — — —
Mortgage revenuebonds 434 — (1) — (4) — (65) — — 364 — (1)
Other 342 12 (10) — — — (17) (2) 1 326 — (7)
Total available-for-sale securities $ 952 $ 17
(6)(7)$ (10) $ — $ (27) $ — $ (90) $ (105) $ 85 $ 822 $ — $ (3)
Mortgage loans $ 937 $ 31 (5)(6) $ — $ — $ (13) $ — $ (70) $ (187) $ 72 $ 770 $ 22 $ —
Net derivatives 194 118 (5) — — — — (120) (9) — 183 24 —
Long-term debt:
Of Fannie Mae:
Senior floating (351) (47) — — — — — — — (398) (47) —
Of consolidatedtrusts (201) (4) — — — — 10 169 (76) (102) (2) —
Total long-term debt $ (552) $ (51)(5)
$ — $ — $ — $ — $ 10 $ 169 $ (76) $ (500) $ (49) $ —
Notes to Condensed Consolidated Financial Statements | Fair Value
Fannie Mae (In conservatorship) Second Quarter 2019 Form 10-Q 95
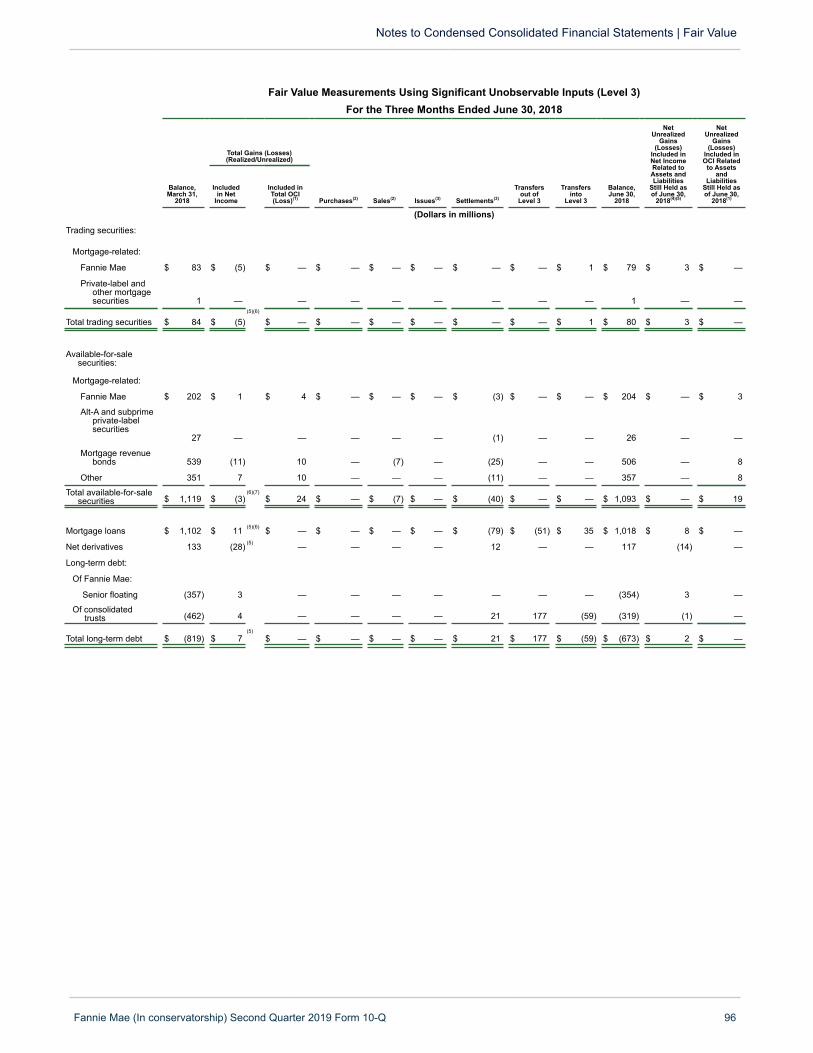
Fair Value Measurements Using Significant Unobservable Inputs (Level 3)For the Three Months Ended June 30, 2018
Total Gains (Losses)(Realized/Unrealized)
NetUnrealized
Gains(Losses)
Included inNet IncomeRelated toAssets andLiabilities
Still Held asof June 30,
2018(4)(5)
NetUnrealized
Gains(Losses)
Included inOCI Related
to Assetsand
LiabilitiesStill Held asof June 30,
2018(1)
Balance,March 31,
2018
Includedin Net
Income
Included inTotal OCI(Loss)(1) Purchases(2) Sales(2) Issues(3) Settlements(3)
Transfersout of
Level 3
Transfersinto
Level 3
Balance,June 30,
2018
(Dollars in millions)
Trading securities:
Mortgage-related:
Fannie Mae $ 83 $ (5) $ — $ — $ — $ — $ — $ — $ 1 $ 79 $ 3 $ —
Private-label andother mortgagesecurities 1 — — — — — — — — 1 — —
Total trading securities $ 84 $ (5)(5)(6)
$ — $ — $ — $ — $ — $ — $ 1 $ 80 $ 3 $ —
Available-for-salesecurities:
Mortgage-related:
Fannie Mae $ 202 $ 1 $ 4 $ — $ — $ — $ (3) $ — $ — $ 204 $ — $ 3
Alt-A and subprimeprivate-labelsecurities
27 — — — — — (1) — — 26 — —
Mortgage revenuebonds 539 (11) 10 — (7) — (25) — — 506 — 8
Other 351 7 10 — — — (11) — — 357 — 8
Total available-for-salesecurities $ 1,119 $ (3)
(6)(7)$ 24 $ — $ (7) $ — $ (40) $ — $ — $ 1,093 $ — $ 19
Mortgage loans $ 1,102 $ 11 (5)(6) $ — $ — $ — $ — $ (79) $ (51) $ 35 $ 1,018 $ 8 $ —
Net derivatives 133 (28) (5) — — — — 12 — — 117 (14) —
Long-term debt:
Of Fannie Mae:
Senior floating (357) 3 — — — — — — — (354) 3 —
Of consolidatedtrusts (462) 4 — — — — 21 177 (59) (319) (1) —
Total long-term debt $ (819) $ 7(5)
$ — $ — $ — $ — $ 21 $ 177 $ (59) $ (673) $ 2 $ —
Notes to Condensed Consolidated Financial Statements | Fair Value
Fannie Mae (In conservatorship) Second Quarter 2019 Form 10-Q 96
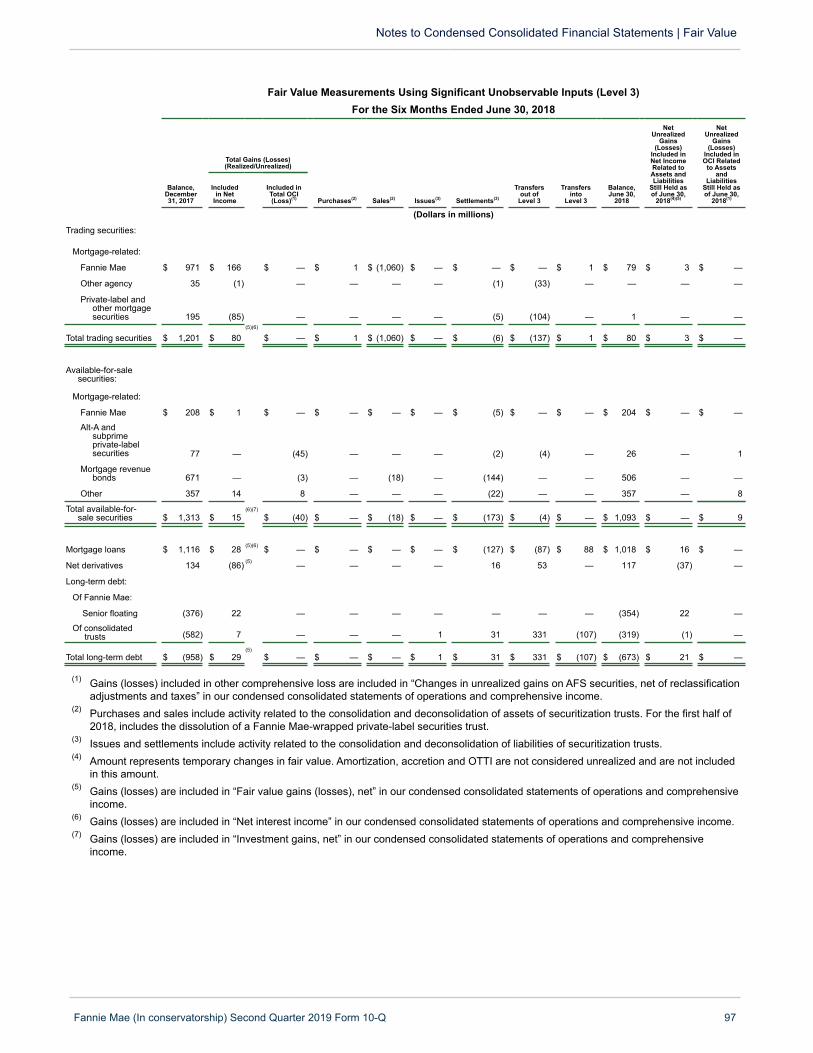
Fair Value Measurements Using Significant Unobservable Inputs (Level 3)For the Six Months Ended June 30, 2018
Total Gains (Losses)(Realized/Unrealized)
NetUnrealized
Gains(Losses)
Included inNet IncomeRelated toAssets andLiabilities
Still Held asof June 30,
2018(4)(5)
NetUnrealized
Gains(Losses)
Included inOCI Related
to Assetsand
LiabilitiesStill Held asof June 30,
2018(1)
Balance,December31, 2017
Includedin Net
Income
Included inTotal OCI(Loss)(1) Purchases(2) Sales(2) Issues(3) Settlements(3)
Transfersout of
Level 3
Transfersinto
Level 3
Balance,June 30,
2018
(Dollars in millions)
Trading securities:
Mortgage-related:
Fannie Mae $ 971 $ 166 $ — $ 1 $ (1,060) $ — $ — $ — $ 1 $ 79 $ 3 $ —
Other agency 35 (1) — — — — (1) (33) — — — —
Private-label andother mortgagesecurities 195 (85) — — — — (5) (104) — 1 — —
Total trading securities $ 1,201 $ 80(5)(6)
$ — $ 1 $ (1,060) $ — $ (6) $ (137) $ 1 $ 80 $ 3 $ —
Available-for-salesecurities:
Mortgage-related:
Fannie Mae $ 208 $ 1 $ — $ — $ — $ — $ (5) $ — $ — $ 204 $ — $ —
Alt-A andsubprimeprivate-labelsecurities 77 — (45) — — — (2) (4) — 26 — 1
Mortgage revenuebonds 671 — (3) — (18) — (144) — — 506 — —
Other 357 14 8 — — — (22) — — 357 — 8
Total available-for-sale securities $ 1,313 $ 15
(6)(7)
$ (40) $ — $ (18) $ — $ (173) $ (4) $ — $ 1,093 $ — $ 9
Mortgage loans $ 1,116 $ 28 (5)(6) $ — $ — $ — $ — $ (127) $ (87) $ 88 $ 1,018 $ 16 $ —
Net derivatives 134 (86) (5) — — — — 16 53 — 117 (37) —
Long-term debt:
Of Fannie Mae:
Senior floating (376) 22 — — — — — — — (354) 22 —
Of consolidatedtrusts (582) 7 — — — 1 31 331 (107) (319) (1) —
Total long-term debt $ (958) $ 29(5)
$ — $ — $ — $ 1 $ 31 $ 331 $ (107) $ (673) $ 21 $ —
(1) Gains (losses) included in other comprehensive loss are included in “Changes in unrealized gains on AFS securities, net of reclassificationadjustments and taxes” in our condensed consolidated statements of operations and comprehensive income.
(2) Purchases and sales include activity related to the consolidation and deconsolidation of assets of securitization trusts. For the first half of2018, includes the dissolution of a Fannie Mae-wrapped private-label securities trust.
(3) Issues and settlements include activity related to the consolidation and deconsolidation of liabilities of securitization trusts.(4) Amount represents temporary changes in fair value. Amortization, accretion and OTTI are not considered unrealized and are not included
in this amount.(5) Gains (losses) are included in “Fair value gains (losses), net” in our condensed consolidated statements of operations and comprehensive
income.(6) Gains (losses) are included in “Net interest income” in our condensed consolidated statements of operations and comprehensive income.(7) Gains (losses) are included in “Investment gains, net” in our condensed consolidated statements of operations and comprehensive
income.
Notes to Condensed Consolidated Financial Statements | Fair Value
Fannie Mae (In conservatorship) Second Quarter 2019 Form 10-Q 97

The following tables display valuation techniques and the range and the weighted average of significant unobservable inputsfor our Level 3 assets and liabilities measured at fair value on a recurring basis, excluding instruments for which we haveelected the fair value option. Changes in these unobservable inputs can result in significantly higher or lower fair valuemeasurements of these assets and liabilities as of the reporting date.
Fair Value Measurements as of June 30, 2019
FairValue
SignificantValuation
Techniques
SignificantUnobservable
Inputs(1) Range(1)Weighted -Average(1)
(Dollars in millions)Recurring fair value measurements:Trading securities:
Mortgage-related securities:Agency(2) $ 74 Various
Available-for-sale securities:Mortgage-related securities:
Agency(2) $ 106 Consensus26 Various
Total agency 132Mortgage revenue bonds 250 Single Vendor Spreads(bps) 16.5 - 193.3 66.1
114 VariousTotal mortgage revenue bonds 364
Other 283Discounted CashFlow Default Rate(%) 5.5 5.5
Prepayment Speed(%) 5.5 5.5Severity(%) 95.0 95.0Spreads(bps) 59.3 - 294.0 292.4
43 VariousTotal other 326
Total available-for-sale securities $ 822
Net derivatives $ 163 Dealer Mark20 Various
Total net derivatives $ 183
Notes to Condensed Consolidated Financial Statements | Fair Value
Fannie Mae (In conservatorship) Second Quarter 2019 Form 10-Q 98
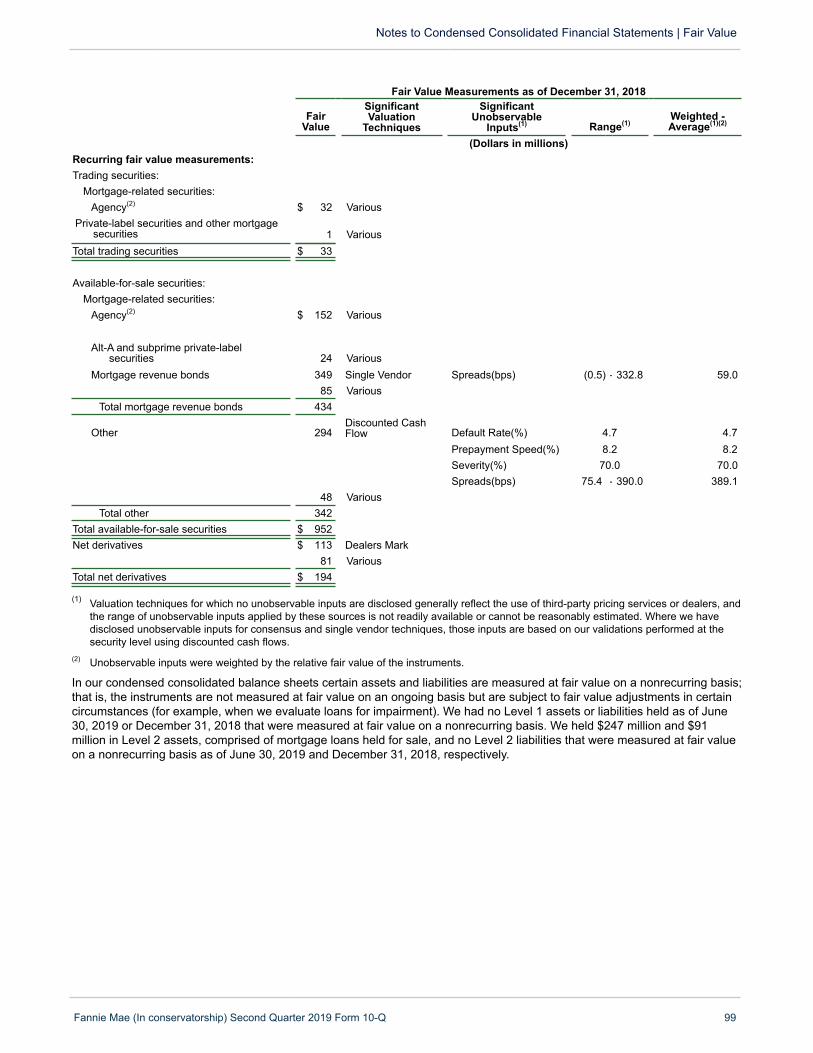
Fair Value Measurements as of December 31, 2018
FairValue
SignificantValuation
Techniques
SignificantUnobservable
Inputs(1) Range(1)Weighted -Average(1)(2)
(Dollars in millions)Recurring fair value measurements:Trading securities:
Mortgage-related securities:Agency(2) $ 32 Various
Private-label securities and other mortgagesecurities 1 Various
Total trading securities $ 33
Available-for-sale securities:Mortgage-related securities:
Agency(2) $ 152 Various
Alt-A and subprime private-labelsecurities 24 Various
Mortgage revenue bonds 349 Single Vendor Spreads(bps) (0.5) - 332.8 59.085 Various
Total mortgage revenue bonds 434
Other 294Discounted CashFlow Default Rate(%) 4.7 4.7
Prepayment Speed(%) 8.2 8.2Severity(%) 70.0 70.0Spreads(bps) 75.4 - 390.0 389.1
48 VariousTotal other 342
Total available-for-sale securities $ 952Net derivatives $ 113 Dealers Mark
81 VariousTotal net derivatives $ 194
(1) Valuation techniques for which no unobservable inputs are disclosed generally reflect the use of third-party pricing services or dealers, andthe range of unobservable inputs applied by these sources is not readily available or cannot be reasonably estimated. Where we havedisclosed unobservable inputs for consensus and single vendor techniques, those inputs are based on our validations performed at thesecurity level using discounted cash flows.
(2) Unobservable inputs were weighted by the relative fair value of the instruments.
In our condensed consolidated balance sheets certain assets and liabilities are measured at fair value on a nonrecurring basis;that is, the instruments are not measured at fair value on an ongoing basis but are subject to fair value adjustments in certaincircumstances (for example, when we evaluate loans for impairment). We had no Level 1 assets or liabilities held as of June30, 2019 or December 31, 2018 that were measured at fair value on a nonrecurring basis. We held $247 million and $91million in Level 2 assets, comprised of mortgage loans held for sale, and no Level 2 liabilities that were measured at fair valueon a nonrecurring basis as of June 30, 2019 and December 31, 2018, respectively.
Notes to Condensed Consolidated Financial Statements | Fair Value
Fannie Mae (In conservatorship) Second Quarter 2019 Form 10-Q 99
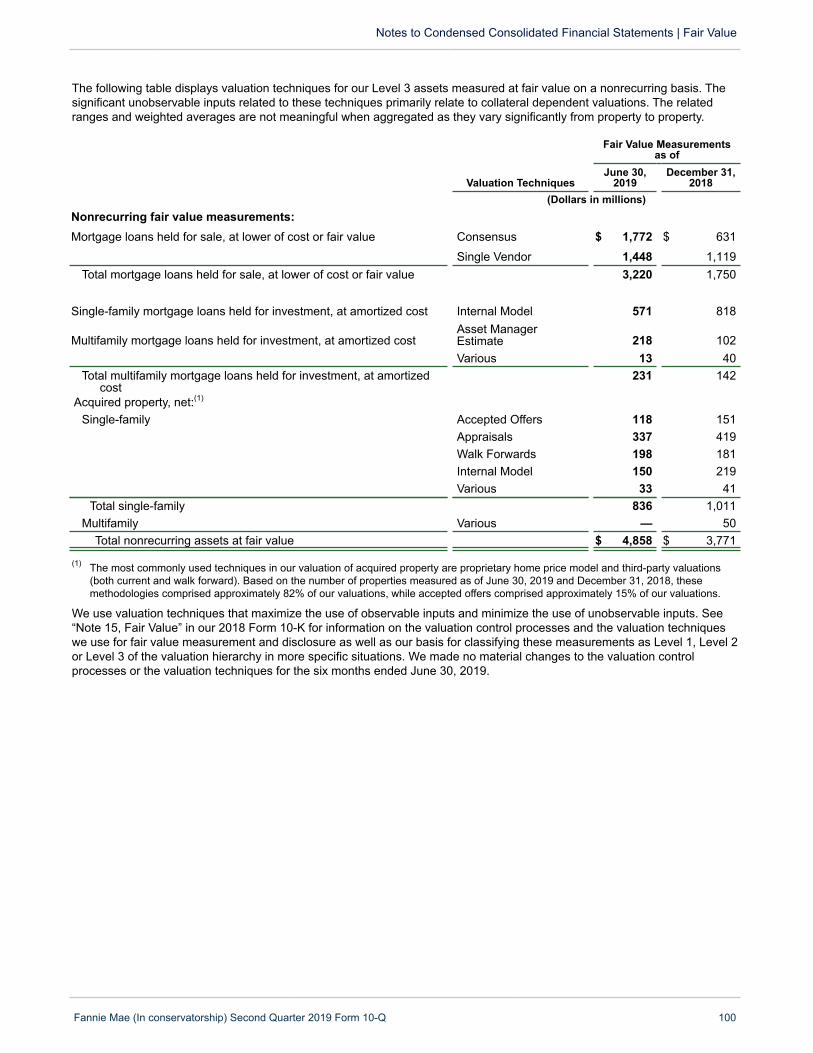
The following table displays valuation techniques for our Level 3 assets measured at fair value on a nonrecurring basis. Thesignificant unobservable inputs related to these techniques primarily relate to collateral dependent valuations. The relatedranges and weighted averages are not meaningful when aggregated as they vary significantly from property to property.
Fair Value Measurements as of
Valuation TechniquesJune 30,
2019December 31,
2018(Dollars in millions)
Nonrecurring fair value measurements:Mortgage loans held for sale, at lower of cost or fair value Consensus $ 1,772 $ 631
Single Vendor 1,448 1,119Total mortgage loans held for sale, at lower of cost or fair value 3,220 1,750
Single-family mortgage loans held for investment, at amortized cost Internal Model 571 818
Multifamily mortgage loans held for investment, at amortized costAsset ManagerEstimate 218 102Various 13 40
Total multifamily mortgage loans held for investment, at amortizedcost
231 142
Acquired property, net:(1)
Single-family Accepted Offers 118 151Appraisals 337 419Walk Forwards 198 181Internal Model 150 219Various 33 41
Total single-family 836 1,011Multifamily Various — 50
Total nonrecurring assets at fair value $ 4,858 $ 3,771
(1) The most commonly used techniques in our valuation of acquired property are proprietary home price model and third-party valuations(both current and walk forward). Based on the number of properties measured as of June 30, 2019 and December 31, 2018, thesemethodologies comprised approximately 82% of our valuations, while accepted offers comprised approximately 15% of our valuations.
We use valuation techniques that maximize the use of observable inputs and minimize the use of unobservable inputs. See“Note 15, Fair Value” in our 2018 Form 10-K for information on the valuation control processes and the valuation techniqueswe use for fair value measurement and disclosure as well as our basis for classifying these measurements as Level 1, Level 2or Level 3 of the valuation hierarchy in more specific situations. We made no material changes to the valuation controlprocesses or the valuation techniques for the six months ended June 30, 2019.
Notes to Condensed Consolidated Financial Statements | Fair Value
Fannie Mae (In conservatorship) Second Quarter 2019 Form 10-Q 100
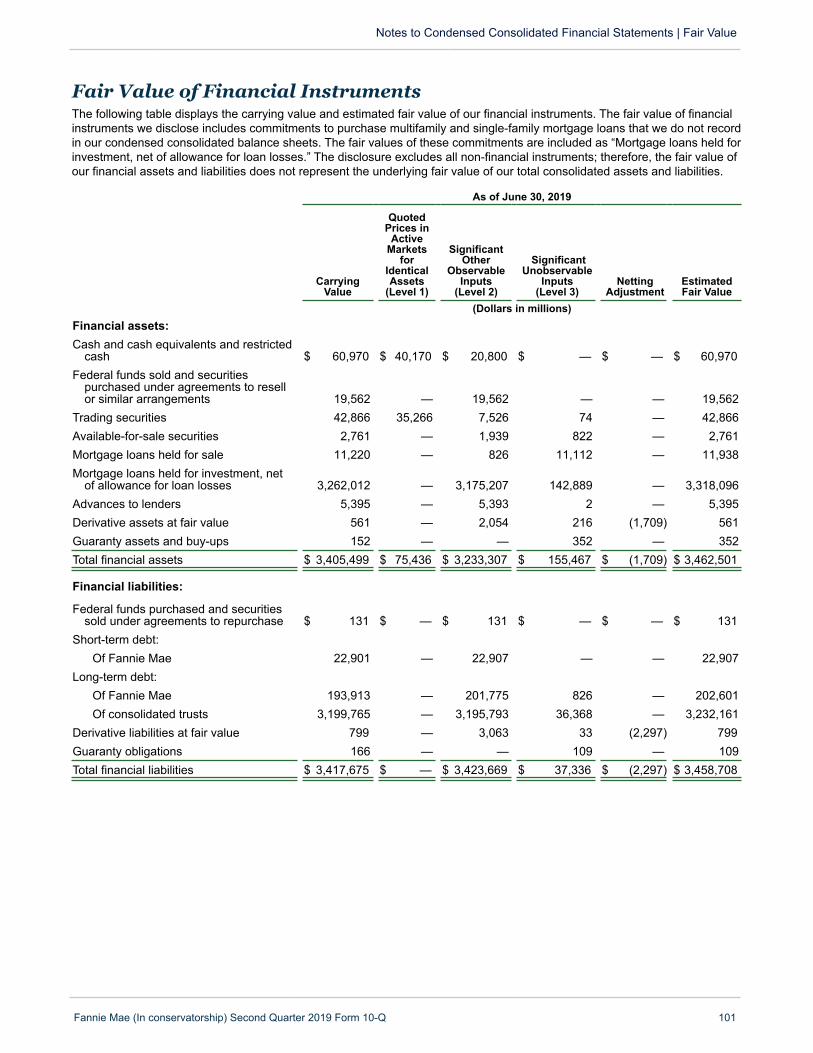
Fair Value of Financial InstrumentsThe following table displays the carrying value and estimated fair value of our financial instruments. The fair value of financialinstruments we disclose includes commitments to purchase multifamily and single-family mortgage loans that we do not recordin our condensed consolidated balance sheets. The fair values of these commitments are included as “Mortgage loans held forinvestment, net of allowance for loan losses.” The disclosure excludes all non-financial instruments; therefore, the fair value ofour financial assets and liabilities does not represent the underlying fair value of our total consolidated assets and liabilities.
As of June 30, 2019
Carrying Value
QuotedPrices in
ActiveMarkets
forIdenticalAssets
(Level 1)
SignificantOther
ObservableInputs
(Level 2)
SignificantUnobservable
Inputs(Level 3)
NettingAdjustment
Estimated Fair Value
(Dollars in millions)Financial assets:Cash and cash equivalents and restricted
cash $ 60,970 $ 40,170 $ 20,800 $ — $ — $ 60,970Federal funds sold and securities
purchased under agreements to resellor similar arrangements 19,562 — 19,562 — — 19,562
Trading securities 42,866 35,266 7,526 74 — 42,866Available-for-sale securities 2,761 — 1,939 822 — 2,761Mortgage loans held for sale 11,220 — 826 11,112 — 11,938Mortgage loans held for investment, net
of allowance for loan losses 3,262,012 — 3,175,207 142,889 — 3,318,096Advances to lenders 5,395 — 5,393 2 — 5,395Derivative assets at fair value 561 — 2,054 216 (1,709) 561Guaranty assets and buy-ups 152 — — 352 — 352Total financial assets $ 3,405,499 $ 75,436 $ 3,233,307 $ 155,467 $ (1,709) $ 3,462,501
Financial liabilities:
Federal funds purchased and securitiessold under agreements to repurchase $ 131 $ — $ 131 $ — $ — $ 131
Short-term debt:Of Fannie Mae 22,901 — 22,907 — — 22,907
Long-term debt:Of Fannie Mae 193,913 — 201,775 826 — 202,601Of consolidated trusts 3,199,765 — 3,195,793 36,368 — 3,232,161
Derivative liabilities at fair value 799 — 3,063 33 (2,297) 799Guaranty obligations 166 — — 109 — 109Total financial liabilities $ 3,417,675 $ — $ 3,423,669 $ 37,336 $ (2,297) $ 3,458,708
Notes to Condensed Consolidated Financial Statements | Fair Value
Fannie Mae (In conservatorship) Second Quarter 2019 Form 10-Q 101
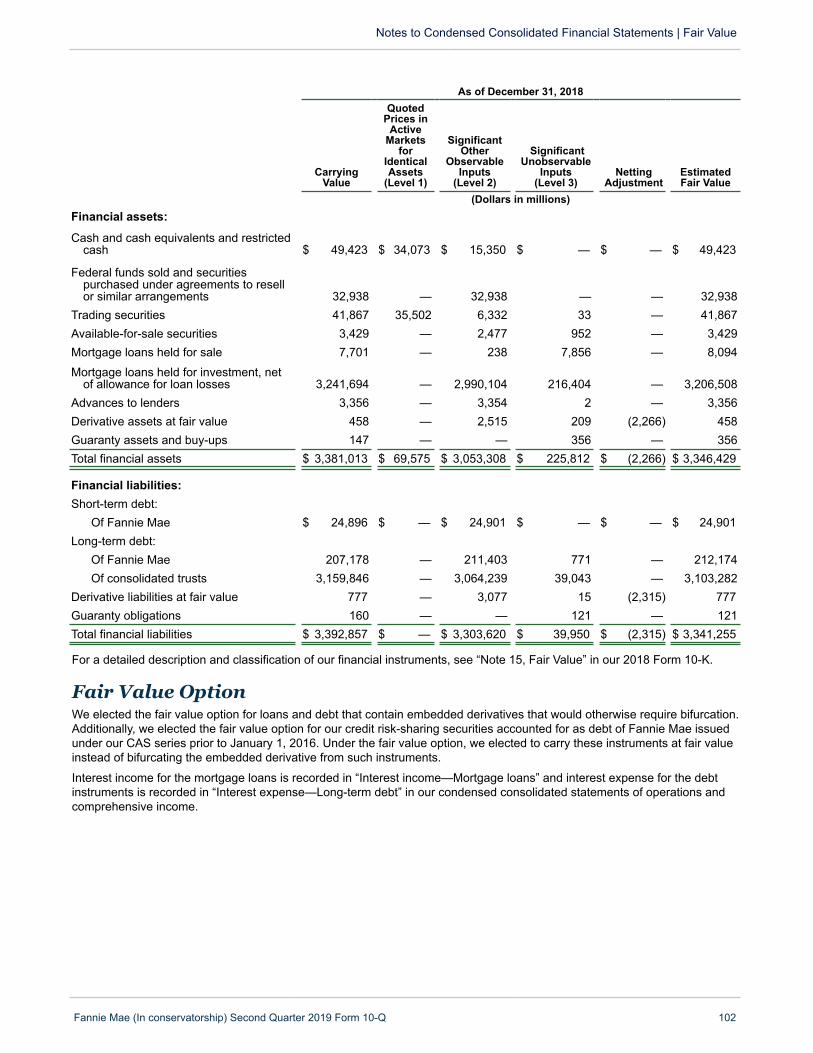
As of December 31, 2018
Carrying Value
QuotedPrices in
ActiveMarkets
forIdenticalAssets
(Level 1)
SignificantOther
ObservableInputs
(Level 2)
SignificantUnobservable
Inputs(Level 3)
NettingAdjustment
Estimated Fair Value
(Dollars in millions)Financial assets:
Cash and cash equivalents and restrictedcash $ 49,423 $ 34,073 $ 15,350 $ — $ — $ 49,423
Federal funds sold and securitiespurchased under agreements to resellor similar arrangements 32,938 — 32,938 — — 32,938
Trading securities 41,867 35,502 6,332 33 — 41,867Available-for-sale securities 3,429 — 2,477 952 — 3,429Mortgage loans held for sale 7,701 — 238 7,856 — 8,094
Mortgage loans held for investment, netof allowance for loan losses 3,241,694 — 2,990,104 216,404 — 3,206,508
Advances to lenders 3,356 — 3,354 2 — 3,356Derivative assets at fair value 458 — 2,515 209 (2,266) 458Guaranty assets and buy-ups 147 — — 356 — 356Total financial assets $ 3,381,013 $ 69,575 $ 3,053,308 $ 225,812 $ (2,266) $ 3,346,429
Financial liabilities:Short-term debt:
Of Fannie Mae $ 24,896 $ — $ 24,901 $ — $ — $ 24,901Long-term debt:
Of Fannie Mae 207,178 — 211,403 771 — 212,174Of consolidated trusts 3,159,846 — 3,064,239 39,043 — 3,103,282
Derivative liabilities at fair value 777 — 3,077 15 (2,315) 777Guaranty obligations 160 — — 121 — 121Total financial liabilities $ 3,392,857 $ — $ 3,303,620 $ 39,950 $ (2,315) $ 3,341,255
For a detailed description and classification of our financial instruments, see “Note 15, Fair Value” in our 2018 Form 10-K.
Notes to Condensed Consolidated Financial Statements | Fair Value
Fannie Mae (In conservatorship) Second Quarter 2019 Form 10-Q 102
Fair Value OptionWe elected the fair value option for loans and debt that contain embedded derivatives that would otherwise require bifurcation.Additionally, we elected the fair value option for our credit risk-sharing securities accounted for as debt of Fannie Mae issuedunder our CAS series prior to January 1, 2016. Under the fair value option, we elected to carry these instruments at fair valueinstead of bifurcating the embedded derivative from such instruments.
Interest income for the mortgage loans is recorded in “Interest income—Mortgage loans” and interest expense for the debtinstruments is recorded in “Interest expense—Long-term debt” in our condensed consolidated statements of operations andcomprehensive income.
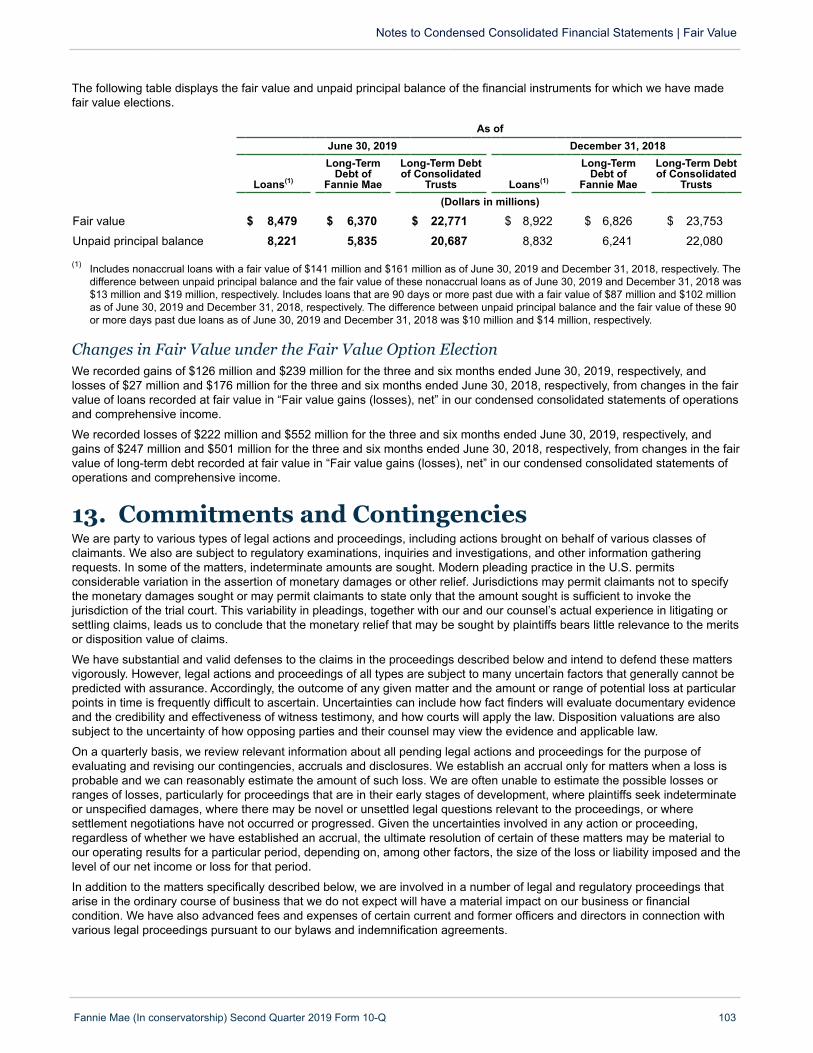
The following table displays the fair value and unpaid principal balance of the financial instruments for which we have madefair value elections.
As ofJune 30, 2019 December 31, 2018
Loans(1)
Long-TermDebt of
Fannie Mae
Long-Term Debtof Consolidated
Trusts Loans(1)
Long-TermDebt of
Fannie Mae
Long-Term Debtof Consolidated
Trusts(Dollars in millions)
Fair value $ 8,479 $ 6,370 $ 22,771 $ 8,922 $ 6,826 $ 23,753
Unpaid principal balance 8,221 5,835 20,687 8,832 6,241 22,080
(1) Includes nonaccrual loans with a fair value of $141 million and $161 million as of June 30, 2019 and December 31, 2018, respectively. Thedifference between unpaid principal balance and the fair value of these nonaccrual loans as of June 30, 2019 and December 31, 2018 was$13 million and $19 million, respectively. Includes loans that are 90 days or more past due with a fair value of $87 million and $102 millionas of June 30, 2019 and December 31, 2018, respectively. The difference between unpaid principal balance and the fair value of these 90or more days past due loans as of June 30, 2019 and December 31, 2018 was $10 million and $14 million, respectively.
Changes in Fair Value under the Fair Value Option ElectionWe recorded gains of $126 million and $239 million for the three and six months ended June 30, 2019, respectively, andlosses of $27 million and $176 million for the three and six months ended June 30, 2018, respectively, from changes in the fairvalue of loans recorded at fair value in “Fair value gains (losses), net” in our condensed consolidated statements of operationsand comprehensive income.
We recorded losses of $222 million and $552 million for the three and six months ended June 30, 2019, respectively, andgains of $247 million and $501 million for the three and six months ended June 30, 2018, respectively, from changes in the fairvalue of long-term debt recorded at fair value in “Fair value gains (losses), net” in our condensed consolidated statements ofoperations and comprehensive income.
Notes to Condensed Consolidated Financial Statements | Fair Value
Fannie Mae (In conservatorship) Second Quarter 2019 Form 10-Q 103
13. Commitments and Contingencies We are party to various types of legal actions and proceedings, including actions brought on behalf of various classes ofclaimants. We also are subject to regulatory examinations, inquiries and investigations, and other information gatheringrequests. In some of the matters, indeterminate amounts are sought. Modern pleading practice in the U.S. permitsconsiderable variation in the assertion of monetary damages or other relief. Jurisdictions may permit claimants not to specifythe monetary damages sought or may permit claimants to state only that the amount sought is sufficient to invoke thejurisdiction of the trial court. This variability in pleadings, together with our and our counsel’s actual experience in litigating orsettling claims, leads us to conclude that the monetary relief that may be sought by plaintiffs bears little relevance to the meritsor disposition value of claims.
We have substantial and valid defenses to the claims in the proceedings described below and intend to defend these mattersvigorously. However, legal actions and proceedings of all types are subject to many uncertain factors that generally cannot bepredicted with assurance. Accordingly, the outcome of any given matter and the amount or range of potential loss at particularpoints in time is frequently difficult to ascertain. Uncertainties can include how fact finders will evaluate documentary evidenceand the credibility and effectiveness of witness testimony, and how courts will apply the law. Disposition valuations are alsosubject to the uncertainty of how opposing parties and their counsel may view the evidence and applicable law.
On a quarterly basis, we review relevant information about all pending legal actions and proceedings for the purpose ofevaluating and revising our contingencies, accruals and disclosures. We establish an accrual only for matters when a loss isprobable and we can reasonably estimate the amount of such loss. We are often unable to estimate the possible losses orranges of losses, particularly for proceedings that are in their early stages of development, where plaintiffs seek indeterminateor unspecified damages, where there may be novel or unsettled legal questions relevant to the proceedings, or wheresettlement negotiations have not occurred or progressed. Given the uncertainties involved in any action or proceeding,regardless of whether we have established an accrual, the ultimate resolution of certain of these matters may be material toour operating results for a particular period, depending on, among other factors, the size of the loss or liability imposed and thelevel of our net income or loss for that period.
In addition to the matters specifically described below, we are involved in a number of legal and regulatory proceedings thatarise in the ordinary course of business that we do not expect will have a material impact on our business or financialcondition. We have also advanced fees and expenses of certain current and former officers and directors in connection withvarious legal proceedings pursuant to our bylaws and indemnification agreements.
Senior Preferred Stock Purchase Agreements LitigationA consolidated putative class action (“In re Fannie Mae/Freddie Mac Senior Preferred Stock Purchase Agreement Class ActionLitigations”) and two non-class action lawsuits filed by Fannie Mae and Freddie Mac shareholders against us, FHFA as ourconservator, and Freddie Mac are pending in the U.S. District Court for the District of Columbia. The lawsuits challenge theAugust 2012 amendment to each company’s senior preferred stock purchase agreement with Treasury.
In the consolidated class action and two of the non-class action suits, Arrowood Indemnity Company v. Fannie Mae andFairholme Funds v. FHFA, plaintiffs filed amended complaints on November 1, 2017 alleging that the net worth sweep dividendprovisions of the senior preferred stock that were implemented pursuant to the August 2012 amendments nullified certain ofthe shareholders’ rights, particularly the right to receive dividends. Plaintiffs seek unspecified damages, equitable andinjunctive relief, and costs and expenses, including attorneys’ fees. Plaintiffs in the class action seek to represent severalclasses of preferred and/or common shareholders of Fannie Mae and/or Freddie Mac who held stock as of the publicannouncement of the August 2012 amendments. On September 28, 2018, the court dismissed all of the plaintiffs’ claimsexcept for their claims for breach of an implied covenant of good faith and fair dealing. On October 15, 2018, defendants fileda motion for partial reconsideration. On May 16, 2019, the court denied this motion.
On May 21, 2018, a pro se plaintiff in a non-class action case, Angel v. Federal Home Loan Mortgage Corporation, filed acomplaint for declaratory relief and compensatory damages against Fannie Mae (including certain members of its Board ofDirectors), Freddie Mac (including certain members of its Board of Directors) and FHFA, as conservator, in the U.S. DistrictCourt for the District of Columbia. Plaintiff in that case asserts claims for breach of contract, breach of implied covenants ofgood faith and fair dealing, and aiding and abetting the federal government in avoiding an alleged implicit guarantee ofdividend payments. On March 6, 2019, the court granted defendants’ motion to dismiss and on March 18, 2019, plaintiff movedto alter or amend the judgment and to file an amended complaint. On May 24, 2019, the court denied this motion. On June 19,2019, plaintiff filed a notice of appeal of the court’s dismissal and related orders with the U.S. Court of Appeals for the Districtof Columbia Circuit.
Given the stage of these lawsuits, the substantial and novel legal questions that remain, and our substantial defenses, we arecurrently unable to estimate the reasonably possible loss or range of loss arising from this litigation.
Notes to Condensed Consolidated Financial Statements | Commitments and Contingencies
Fannie Mae (In conservatorship) Second Quarter 2019 Form 10-Q 104
Item 3. Quantitative and Qualitative Disclosures aboutMarket RiskInformation about market risk is set forth in “MD&A—Risk Management—Market Risk Management, including Interest RateRisk Management.”
Quantitative and Qualitative Disclosures about Market Risk
Fannie Mae Second Quarter 2019 Form 10-Q 105
Item 4. Controls and Procedures
OverviewWe are required under applicable laws and regulations to maintain controls and procedures, which include disclosure controlsand procedures as well as internal control over financial reporting, as further described below.
Evaluation of Disclosure Controls and Procedures
Disclosure Controls and ProceduresDisclosure controls and procedures refer to controls and other procedures designed to provide reasonable assurance thatinformation required to be disclosed in the reports we file or submit under the Exchange Act is recorded, processed,summarized and reported within the time periods specified in the rules and forms of the SEC. Disclosure controls andprocedures include, without limitation, controls and procedures designed to provide reasonable assurance that informationrequired to be disclosed by us in the reports that we file or submit under the Exchange Act is accumulated and communicatedto management, including our Chief Executive Officer and Chief Financial Officer, as appropriate, to allow timely decisionsregarding our required disclosure. In designing and evaluating our disclosure controls and procedures, managementrecognizes that any controls and procedures, no matter how well designed and operated, can provide only reasonableassurance of achieving the desired control objectives, and management was required to apply its judgment in evaluating andimplementing possible controls and procedures.
Evaluation of Disclosure Controls and ProceduresAs required by Rule 13a-15 under the Exchange Act, management has evaluated, with the participation of our Chief ExecutiveOfficer and Chief Financial Officer, the effectiveness of our disclosure controls and procedures as in effect as of June 30,2019, the end of the period covered by this report. As a result of management’s evaluation, our Chief Executive Officer andChief Financial Officer concluded that our disclosure controls and procedures were not effective at a reasonable assurancelevel as of June 30, 2019 or as of the date of filing this report.
Our disclosure controls and procedures were not effective as of June 30, 2019 or as of the date of filing this report becausethey did not adequately ensure the accumulation and communication to management of information known to FHFA that isneeded to meet our disclosure obligations under the federal securities laws. As a result, we were not able to rely upon thedisclosure controls and procedures that were in place as of June 30, 2019 or as of the date of this filing, and we continue tohave a material weakness in our internal control over financial reporting. This material weakness is described in more detailbelow under “Description of Material Weakness.” Based on discussions with FHFA and the structural nature of this materialweakness, we do not expect to remediate this material weakness while we are under conservatorship.
Description of Material WeaknessThe Public Company Accounting Oversight Board’s Auditing Standard 2201 defines a material weakness as a deficiency, or acombination of deficiencies, in internal control over financial reporting, such that there is a reasonable possibility that amaterial misstatement of the company’s annual or interim financial statements will not be prevented or detected on a timelybasis.
Management has determined that we continued to have the following material weakness as of June 30, 2019 and as of thedate of filing this report:
• Disclosure Controls and Procedures. We have been under the conservatorship of FHFA since September 6, 2008.Under the GSE Act, FHFA is an independent agency that currently functions as both our conservator and our regulatorwith respect to our safety, soundness and mission. Because of the nature of the conservatorship under the GSE Act,which places us under the “control” of FHFA (as that term is defined by securities laws), some of the information thatwe may need to meet our disclosure obligations may be solely within the knowledge of FHFA. As our conservator,FHFA has the power to take actions without our knowledge that could be material to our shareholders and otherstakeholders, and could significantly affect our financial performance or our continued existence as an ongoingbusiness. Although we and FHFA attempted to design and implement disclosure policies and procedures that wouldaccount for the conservatorship and accomplish the same objectives as a disclosure controls and procedures policy ofa typical reporting company, there are inherent structural limitations on our ability to design, implement, test or operate
effective disclosure controls and procedures. As both our regulator and our conservator under the GSE Act, FHFA islimited in its ability to design and implement a complete set of disclosure controls and procedures relating to FannieMae, particularly with respect to current reporting pursuant to Form 8-K. Similarly, as a regulated entity, we are limitedin our ability to design, implement, operate and test the controls and procedures for which FHFA is responsible.
Due to these circumstances, we have not been able to update our disclosure controls and procedures in a manner thatadequately ensures the accumulation and communication to management of information known to FHFA that isneeded to meet our disclosure obligations under the federal securities laws, including disclosures affecting ourcondensed consolidated financial statements. As a result, we did not maintain effective controls and proceduresdesigned to ensure complete and accurate disclosure as required by GAAP as of June 30, 2019 or as of the date offiling this report. Based on discussions with FHFA and the structural nature of this weakness, we do not expect toremediate this material weakness while we are under conservatorship.
Mitigating Actions Related to Material WeaknessAs described above under “Description of Material Weakness,” we continue to have a material weakness in our internal controlover financial reporting relating to our disclosure controls and procedures. However, we and FHFA have engaged in thefollowing practices intended to permit accumulation and communication to management of information needed to meet ourdisclosure obligations under the federal securities laws:
• FHFA has established the Division of Conservatorship, which is intended to facilitate operation of the company withthe oversight of the conservator.
• We have provided drafts of our SEC filings to FHFA personnel for their review and comment prior to filing. We alsohave provided drafts of external press releases, statements and speeches to FHFA personnel for their review andcomment prior to release.
• FHFA personnel, including senior officials, have reviewed our SEC filings prior to filing, including this quarterly reporton Form 10-Q for the quarter ended June 30, 2019 (“Second Quarter 2019 Form 10-Q”), and engaged in discussionsregarding issues associated with the information contained in those filings. Prior to filing our Second Quarter 2019Form 10-Q, FHFA provided Fannie Mae management with written acknowledgment that it had reviewed the SecondQuarter 2019 Form 10-Q, and it was not aware of any material misstatements or omissions in the Second Quarter2019 Form 10-Q and had no objection to our filing the Second Quarter 2019 Form 10-Q.
• Our senior management meets regularly with senior leadership at FHFA, including, but not limited to, the Director.
• FHFA representatives attend meetings frequently with various groups within the company to enhance the flow ofinformation and to provide oversight on a variety of matters, including accounting, credit and market riskmanagement, external communications and legal matters.
• Senior officials within FHFA’s Office of the Chief Accountant have met frequently with our senior finance executivesregarding our accounting policies, practices and procedures.
Changes in Internal Control Over Financial Reporting
OverviewManagement has evaluated, with the participation of our Chief Executive Officer and Chief Financial Officer, whether anychanges in our internal control over financial reporting that occurred during our last fiscal quarter have materially affected, orare reasonably likely to materially affect, our internal control over financial reporting. Below we describe changes in ourinternal control over financial reporting since March 31, 2019 that management believes have materially affected, or arereasonably likely to materially affect, our internal control over financial reporting.
In the ordinary course of business, we review our system of internal control over financial reporting and make changes that webelieve will improve these controls and increase efficiency, while continuing to ensure that we maintain effective internalcontrols. Changes may include implementing new, more efficient systems, automating manual processes and updatingexisting systems. For example, we are currently implementing changes to various financial system applications in stagesacross the company. As we continue to implement these changes, each implementation may become a significant componentof our internal control over financial reporting.
Common Securitization PlatformIn May 2019, we began using the common securitization platform operated by CSS to perform certain aspects of thesecuritization process for our single-family Fannie Mae MBS issuances. We began issuing UMBS using the commonsecuritization platform in June 2019. Our use of the common securitization platform for single-family Fannie Mae MBSissuances represents a significant change to our control environment and requires us to rely on CSS for effective controlsrelated to these securities issuances and related functions. In connection with this transition of activities to CSS, we modifiedour accounting and financial reporting processes, including replacing or redesigning existing internal controls over financial
Controls and Procedures
Fannie Mae Second Quarter 2019 Form 10-Q 106

reporting that were previously considered effective with new or modified controls. We will continue to monitor and test thesenew and modified controls for adequate design and operating effectiveness. Because our transition to using the commonsecuritization platform for single-family Fannie Mae MBS issuances occurred during the second quarter, we used both ourlegacy securitization processes and related controls, as well as the new and modified controls, in preparing our second quarter2019 condensed consolidated financial statements included in this report.
Treasury Cash Management SystemIn July 2019, we consolidated our treasury systems used for cash activities, liquidity management and bank accountadministration into a fully integrated new treasury cash management system. In connection with this implementation andrelated business process changes, we redesigned or replaced multiple existing controls that were previously consideredeffective with new or modified controls and, in some cases, removed controls that are no longer applicable. We will continue tomonitor and test these new and modified controls for adequate design and operating effectiveness. Because this new systemwas not implemented until July 2019, we continued to use our legacy treasury cash management system controls in preparingour second quarter 2019 condensed consolidated financial statements included in this report.
Controls and Procedures
Fannie Mae Second Quarter 2019 Form 10-Q 107

PART II—OTHER INFORMATION
Other Information
Fannie Mae Second Quarter 2019 Form 10-Q 108
Item 1. Legal ProceedingsThe information in this item supplements and updates information regarding certain legal proceedings set forth in “LegalProceedings” in our 2018 Form 10-K and our First Quarter 2019 Form 10-Q. We also provide information regarding materiallegal proceedings in “Note 13, Commitments and Contingencies,” which is incorporated herein by reference. In addition to thematters specifically described or incorporated by reference in this item, we are involved in a number of legal and regulatoryproceedings that arise in the ordinary course of business that we do not expect will have a material impact on our business orfinancial condition. However, litigation claims and proceedings of all types are subject to many factors and their outcome andeffect on our business and financial condition generally cannot be predicted accurately.
We establish an accrual for legal claims only when a loss is probable and we can reasonably estimate the amount of suchloss. The actual costs of resolving legal claims may be substantially higher or lower than the amounts accrued for thoseclaims. If certain of these matters are determined against us, FHFA or Treasury, it could have a material adverse effect on ourresults of operations, liquidity and financial condition, including our net worth.
Senior Preferred Stock Purchase Agreements Litigation Between June 2013 and August 2018, preferred and common stockholders of Fannie Mae and Freddie Mac filed lawsuits inmultiple federal courts against one or more of the United States, Treasury and FHFA, challenging actions taken by thedefendants relating to the Fannie Mae and Freddie Mac senior preferred stock purchase agreements and the conservatorshipsof Fannie Mae and Freddie Mac. Some of these lawsuits also contain claims against Fannie Mae and Freddie Mac. The legalclaims being advanced by one or more of these lawsuits include challenges to the net worth sweep dividend provisions of thesenior preferred stock that were implemented pursuant to August 2012 amendments to the agreements, the payment ofdividends to Treasury under the net worth sweep dividend provisions, and FHFA’s decision to require Fannie Mae and FreddieMac to draw funds from Treasury in order to pay dividends to Treasury prior to the August 2012 amendments. Some of thelawsuits also challenge the constitutionality of FHFA’s structure. The plaintiffs seek various forms of equitable and injunctiverelief, including rescission of the August 2012 amendments, as well as damages. The cases that remain pending or wereterminated after March 31, 2019 are as follows:
District of Columbia. Fannie Mae is a defendant in three cases pending in the U.S. District Court for the District of Columbia—a consolidated putative class action and two additional cases. On September 28, 2018, the court dismissed all of the plaintiffs’claims in these cases, except for their claims for breach of an implied covenant of good faith and fair dealing. In a fourth casethat was filed in the U.S. District Court for the District of Columbia on May 21, 2018, the court granted defendants’ motion todismiss on March 6, 2019, and on March 18, 2019, plaintiff moved to alter or amend the judgment and to file an amendedcomplaint. On May 24, 2019, the court denied this motion. On June 19, 2019, plaintiff filed a notice of appeal of the court’sdismissal and related orders with the U.S. Court of Appeals for the District of Columbia Circuit. All four cases are described in“Note 13, Commitments and Contingencies.”
Southern District of Texas. On October 20, 2016, preferred and common stockholders filed a complaint against FHFA andTreasury in the U.S. District Court for the Southern District of Texas. On May 22, 2017, the court dismissed the case. On July16, 2018, the U.S Court of Appeals for the Fifth Circuit affirmed the dismissal, and on November 15, 2018 the Fifth Circuitgranted plaintiffs’ and FHFA’s petitions for rehearing en banc.
Western District of Michigan. On June 1, 2017, preferred and common stockholders of Fannie Mae and Freddie Mac filed acomplaint for declaratory and injunctive relief against FHFA and Treasury in the U.S. District Court for the Western District ofMichigan. FHFA and Treasury moved to dismiss the case on September 8, 2017, and plaintiffs filed a motion for summaryjudgment on October 6, 2017.
District of Minnesota. On June 22, 2017, preferred and common stockholders of Fannie Mae and Freddie Mac filed acomplaint for declaratory and injunctive relief against FHFA and Treasury in the U.S. District Court for the District of Minnesota.The court dismissed the case on July 6, 2018, and plaintiffs filed a notice of appeal with the U.S. Court of Appeals for theEighth Circuit on July 10, 2018.
Eastern District of Pennsylvania. On August 16, 2018, common stockholders of Fannie Mae and Freddie Mac filed a complaintfor declaratory and injunctive relief against FHFA and Treasury in the U.S. District Court for the Eastern District ofPennsylvania. FHFA and Treasury moved to dismiss the case on November 16, 2018, and plaintiffs filed a motion for summaryjudgment on December 21, 2018.
U.S. Court of Federal Claims. Numerous cases are pending against the United States in the U.S. Court of Federal Claims.Fannie Mae is a nominal defendant in three of these cases: Fisher v. United States of America, filed on December 2, 2013;Rafter v. United States of America, filed on August 14, 2014; and Perry Capital LLC v. United States of America, filed onAugust 15, 2018. Plaintiffs in these cases allege that the net worth sweep dividend provisions of the senior preferred stock thatwere implemented pursuant to the August 2012 amendment constitute a taking of Fannie Mae’s property without justcompensation in violation of the U.S. Constitution. The Fisher plaintiffs are pursuing this claim derivatively on behalf of Fannie

Mae, while the Rafter and Perry Capital plaintiffs are pursing the claim both derivatively and directly against the United States.Plaintiffs in Rafter also allege direct and derivative breach of contract claims against the government. The Perry Capitalplaintiffs allege similar breach of contract claims, as well as breach of fiduciary duty claims against the government. Plaintiffs inFisher request just compensation to Fannie Mae in an unspecified amount. Plaintiffs in Rafter and Perry Capital seek justcompensation for themselves on their direct claims and payment of damages to Fannie Mae on their derivative claims. TheUnited States filed a motion to dismiss the Fisher and Rafter cases on August 1, 2018.
LIBOR LawsuitAs described further in our 2018 Form 10-K, in October 2013, Fannie Mae filed a lawsuit in the U.S. District Court for theSouthern District of New York against a number of banks and other defendants alleging they manipulated LIBOR. On July 22,2019, we entered into an agreement resolving our claims against two of the defendants in this lawsuit: Citigroup Inc. andCitibank, N.A. The financial impact of the settlement was not material to our financial statements.
Other Information
Fannie Mae Second Quarter 2019 Form 10-Q 109
Item 1A. Risk FactorsIn addition to the information in this report, you should carefully consider the risks relating to our business that we identify in“Risk Factors” in our 2018 Form 10-K. This section supplements and updates that discussion. Also refer to “MD&A—RiskManagement,” “MD&A—Single-Family Business” and “MD&A—Multifamily Business” in our 2018 Form 10-K and in this reportfor more detailed descriptions of the primary risks to our business and how we seek to manage those risks.
The risks we face could materially adversely affect our business, results of operations, financial condition, liquidity and networth, and could cause our actual results to differ materially from our past results or the results contemplated by any forward-looking statements we make. We believe the risks described in the sections of this report and our 2018 Form 10-K identifiedabove are the most significant we face; however, these are not the only risks we face. In addition to the risks we discuss in thisreport and in our 2018 Form 10-K, we face risks and uncertainties not currently known to us or that we currently believe areimmaterial.
The future of our company is uncertain.There continues to be significant uncertainty regarding the future of our company, including how long the company willcontinue to exist in its current form, the extent of our role in the market, how long we will be in conservatorship, what form wewill have and what ownership interest, if any, our current common and preferred stockholders will hold in us after theconservatorship is terminated, and whether we will continue to exist following conservatorship. The conservatorship isindefinite in duration and the timing, conditions and likelihood of our emerging from conservatorship are uncertain. Ourconservatorship could terminate through a receivership. Termination of the conservatorship, other than in connection with areceivership, requires Treasury’s consent under the senior preferred stock purchase agreement.
In March 2019, President Trump issued a memorandum directing the Secretary of the Treasury to develop a Treasury HousingReform Plan, which is described in “MD&A—Legislation and Regulation—Housing Finance Reform.” As of the time of thisfiling, the Treasury Housing Reform Plan has not been published. The Senate Committee on Banking, Housing, and UrbanAffairs held a hearing in June 2019 on whether we should be regulated as a systemically important financial institution, whichwould result in our becoming subject to additional regulation and oversight by the Federal Reserve Board if it occurred. Weexpect the Administration, FHFA and Congress to continue to consider housing finance reform, which could result in significantchanges in our structure and role in the future, as well as other changes to our business and competitive environment.
Congress, FHFA or other agencies may also consider legislation, regulation or other administrative actions aimed at increasingthe competition we face, reducing our market share, expanding our obligations to provide funds to Treasury, constraining ourbusiness operations, or subjecting us to new obligations that could impose substantial burdens or adversely affect our resultsof operations or financial condition. We cannot predict the timing or final content of housing finance reform legislation, otherlegislation, regulations or administrative actions related to our activities, nor can we predict the impact any such enactedlegislation, regulations or administrative actions would have on our business and financial condition.
Our business and results of operations may be materially adversely affected if we are unable to retain and recruitwell-qualified senior executives and other employees. The conservatorship, the uncertainty of our future andlimitations on our executive and employee compensation put us at a disadvantage compared to many othercompanies in attracting and retaining these employees.Our business processes are highly dependent on the talents and efforts of our senior executives and other employees. Theconservatorship, the uncertainty of our future and limitations on executive and employee compensation have had, and arelikely to continue to have, an adverse effect on our ability to retain and recruit well-qualified executives and other employees.Turnover in key management positions and challenges in integrating new management could harm our ability to manage ourbusiness effectively and successfully implement our and FHFA’s current strategic initiatives, and ultimately could adverselyaffect our financial performance.
Actions taken by Congress, FHFA and Treasury to date, or that may be taken by them or other government agencies in thefuture, have had, and may continue to have, an adverse effect on our retention and recruitment of senior executives and other
employees. We are subject to significant restrictions on the amount and type of compensation we may pay our executives andother employees while under conservatorship. For example:
• The Equity in Government Compensation Act of 2015 caps the annual direct compensation payable to our chiefexecutive officer to no more than $600,000 while we are in conservatorship or receivership.
• The STOCK Act prohibits our senior executives from receiving bonuses during any period of conservatorship.
• In April 2019, legislation was introduced in the U.S. Senate that would prohibit either Fannie Mae or Freddie Mac fromtransferring or delegating any duty or responsibility, as of November 25, 2015, of its chief executive officer to anyother position. The legislation would also provide that the Director of FHFA may be removed for cause for approvingthe compensation of any chief executive officer of Fannie Mae or Freddie Mac at a level greater than that permittedunder the Equity in Government Compensation Act of 2015.
• As our conservator, FHFA has the authority to approve the terms and amount of our executive compensation. TheDirector of FHFA has recently stated that FHFA is reviewing the compensation of Fannie Mae’s and Freddie Mac’sexecutive officers.
• The terms of our senior preferred stock purchase agreement with Treasury contain specified restrictions relating tocompensation.
As a result of the restrictions on our compensation practices, we have not been able to incent and reward excellentperformance with compensation structures that provide upside potential to our executives, which places us at a disadvantagecompared to many other companies in attracting and retaining executives. In addition, the uncertainty of potential action byCongress or the Administration with respect to housing finance reform, which may result in the wind-down or significantrestructuring of the company, and with respect to the compensation and role of our executives, also negatively affects ourability to retain and recruit executives and other employees.
Our inability to offer market-based compensation to our chief executive officer also makes retention and succession planningfor this position difficult. We believe the limit applicable to our chief executive officer compensation negatively affected ourability to retain our former Chief Executive Officer, who left the company in October 2018.
We face competition from the financial services and technology industries, and from businesses outside of these industries, forqualified executives and other employees. If we are unable to retain, promote and attract executives and other employees withthe necessary skills and talent, we would face increased risks for operational failures. If there were several high-leveldepartures at approximately the same time, our ability to conduct our business would likely be materially adversely affected,which could have a material adverse effect on our results of operations and financial condition.
The Single Security Initiative may have an adverse effect on the liquidity or market value of our MBS. The SingleSecurity Initiative also increases our counterparty credit risk and operational risk.On June 3, 2019, we and Freddie Mac began issuing UMBS. We also began using the common securitization platformoperated by CSS to perform certain aspects of the securitization process for our single-family Fannie Mae MBS issuancesbeginning in May 2019. This represents the final implementation of FHFA’s Single Security Initiative that we, Freddie Mac andFHFA have been working on since 2014. The Single Security Initiative and the common securitization platform representsignificant changes for the mortgage market and for our securitization operations and business.
Historically, single-family Fannie Mae MBS had a trading advantage over comparable Freddie Mac single-family mortgage-backed securities. The Single Security Initiative has eliminated this trading advantage. We believe this has contributed, andwill continue to contribute, to competitive pressure on our single-family guaranty fee pricing.
Uncertainty in connection with the Single Security Initiative could contribute to declines in the liquidity or market value ofFannie Mae MBS or otherwise adversely affect our financial condition or results of operations. The industry has expressedconcerns that Fannie Mae-issued UMBS and Freddie Mac-issued UMBS may not be truly fungible. FHFA, as conservator, haspreviously responded to industry input by imposing alignment mandates on Fannie Mae and Freddie Mac, and adopted a ruleto align Fannie Mae and Freddie Mac programs, policies and practices that affect the prepayment rates of TBA-eligiblemortgage-backed securities. However, these alignment efforts may not be successful and the prepayment rates on FannieMae-issued UMBS and Freddie Mac-issued UMBS could diverge. If investors do not accept the fungibility of Fannie Mae-issued UMBS and Freddie Mac-issued UMBS, or if investors prefer Freddie Mac-issued UMBS over Fannie Mae-issuedUMBS, it could adversely affect the volume of our UMBS issuances and the liquidity and market value of Fannie Mae MBS,which could have a significant adverse impact on our business, liquidity, financial condition, net worth and results ofoperations.
The continued support of FHFA, Treasury, the Securities Industry and Financial Markets Association, and certain otherregulatory bodies is critical to the success of the Single Security Initiative. If these entities were to cease their support, theliquidity and market value of Fannie Mae-issued UMBS could be adversely affected. Furthermore, if either we or Freddie Macexit conservatorship in the future, it is unclear whether our and Freddie Mac’s programs, policies and practices in support ofthe Single Security Initiative would be sustained.
The Single Security Initiative has also resulted in increased credit risk exposure and operational risk exposure to Freddie Mac.We and Freddie Mac can now commingle Fannie Mae-issued UMBS and Freddie Mac-issued UMBS in resecuritizations.
Other Information
Fannie Mae Second Quarter 2019 Form 10-Q 110
When we resecuritize Freddie Mac-issued UMBS or other Freddie Mac securities, our guaranty of principal and interestextends to the underlying Freddie Mac security. Our risk exposure to Freddie Mac is expected to increase as we issue morestructured securities backed directly or indirectly by Freddie Mac-issued UMBS going forward. In the event Freddie Mac wereto fail (for credit or operational reasons) to make a payment due on its securities underlying a Fannie Mae-issued structuredsecurity, we would be obligated under our guaranty to fund any shortfall and make the entire payment on the related FannieMae-issued structured security on that payment date. Our pricing does not currently reflect any incremental credit, liquidity oroperational risk associated with our guaranty of resecuritized Freddie Mac securities. As a result, we could be dependent onFreddie Mac and on the senior preferred stock purchase agreements that we and Freddie Mac each have with Treasury toavoid a liquidity event or a default under our guaranty.
The Single Security Initiative has created significant interdependence between the single-family mortgage securitizationprograms of Fannie Mae and Freddie Mac. Accordingly, the market value of single-family Fannie Mae MBS could be affectedby events relating to Freddie Mac, even if those events do not directly relate to Fannie Mae or Fannie Mae MBS. For example,any actual or perceived change in Freddie Mac’s financial performance or condition, mortgage credit quality, or systems anddata reliability could adversely affect the market value of single-family Fannie Mae MBS. Similarly, any disruption in FreddieMac’s securitization activities or any adverse events affecting Freddie Mac’s significant mortgage sellers and servicers alsocould adversely the market value of single-family Fannie Mae MBS.
We no longer use our individual proprietary securitization function for our single-family MBS issuances. In addition to using thecommon securitization platform for our newly issued UMBS issuances, we are also now using the common securitizationplatform for certain ongoing administrative functions for our previously issued and outstanding single-family Fannie Mae MBS.Accordingly, we are reliant on the common securitization platform and CSS for the operation of several of our single-familysecuritization activities. These activities are complex and present significant operational and technological challenges andrisks. Any measures we take to mitigate these challenges and risks might not be sufficient to prevent a disruption to oursecuritization activities. Our business activities could be adversely affected and the market for single-family Fannie Mae MBScould be disrupted if the common securitization platform were to fail or otherwise become unavailable to us or if CSS wereunable to perform its obligations to us. Any such failure or unavailability could have a significant adverse impact on ourbusiness, liquidity, financial condition, net worth and results of operations, and could adversely affect the liquidity or marketvalue of our single-family MBS. In addition, a failure by CSS to maintain effective controls and procedures could result inmaterial errors in our reported results or disclosures that are not complete or accurate. See “Risk Factors” in our 2018 Form10-K for a discussion of other operational risks associated with our implementation of the Single Security Initiative and relatedinternal infrastructure upgrades.
Our business and financial results are affected by general economic conditions, particularly home prices andemployment trends, and a deterioration of economic conditions or the financial markets may materially adverselyaffect our results of operations, net worth and financial condition.Our business is significantly affected by the status of the U.S. economy, particularly home prices and employment trends. Aprolonged period of slow growth in the U.S. economy or any deterioration in general economic conditions or the financialmarkets could materially adversely affect our results of operations, net worth and financial condition. In general, if home pricesdecrease, or the unemployment rate increases, it could result in significantly higher levels of credit losses and credit-relatedexpense.
Global economic conditions can also adversely affect our business and financial results. Changes or volatility in marketconditions resulting from deterioration in or uncertainty regarding global economic conditions can adversely affect the value ofour assets, which could materially adversely affect our results of operations, net worth and financial condition. A slowdown ineconomic growth around the world remains a concern for policy makers and financial markets. To the extent global economicconditions negatively affect the U.S. economy, they also could negatively affect the credit performance of the loans in our bookof business.
Volatility or uncertainty in global political conditions also can significantly affect U.S. economic conditions and financialmarkets. Currently, there is elevated uncertainty around several unresolved global political events, including the UnitedKingdom’s exit from the European Union and ongoing international trade negotiations, that could impact global growth andfinancial markets. See “Risk Factors” in our 2018 Form 10-K for a description of the risks to our business posed by changes ininterest rates and changes in spreads. In addition, as described in “Risk Factors” in our 2018 Form 10-K, future changes ordisruptions in the financial markets could significantly change the amount, mix and cost of funds we obtain, as well as ourliquidity position.
A decline in activity in the U.S. housing market, increasing interest rates, or longer-term effects of tax law changescould lower our business volumes or otherwise adversely affect our results of operations, net worth and financialcondition.Our business volume is affected by the rate of growth in total U.S. residential mortgage debt outstanding and the size of theU.S. residential mortgage market. A decline in mortgage debt outstanding reduces the unpaid principal balance of mortgageloans available for us to acquire, which in turn could reduce our net interest income. Even if we were able to increase ourshare of the secondary mortgage market, it may not be sufficient to make up for a decline in the rate of growth in mortgageoriginations.
Other Information
Fannie Mae Second Quarter 2019 Form 10-Q 111

Mortgage interest rates also affect our business volume. Rising interest rates generally result in fewer mortgage originations,particularly for refinances. An increase in interest rates, particularly if the increase is sudden and steep, could significantlyreduce our business volume. Significant reductions in our business volume could adversely affect our results of operations andfinancial condition.
The cap on mortgage interest deductions, the increase in the amount of the standard deduction and other changes in tax lawsmay also adversely affect housing demand, home prices or other housing or mortgage market conditions, which could impactour business volumes and adversely affect our results of operations, net worth and financial condition.
The continued run-off of mortgage-backed securities from the Federal Reserve’s portfolio could adversely affect ourbusiness, results of operations, financial condition, liquidity and net worth.In recent years, the Federal Reserve has purchased a significant amount of mortgage-backed securities issued by us, FreddieMac and Ginnie Mae. In October 2017, the Federal Reserve initiated a balance sheet normalization program to reduce itsholdings of Treasury securities and mortgage-backed securities. In March 2019, the Federal Reserve announced a plan to endthe runoff of its portfolio. The Federal Reserve has indicated it will reduce its holdings of mortgage-backed securities andincrease its holdings of Treasury securities. This may create upward pressure on mortgage interest rates and reduce demandfor mortgage-backed securities, which could adversely affect our business, results of operations, financial condition, liquidityand net worth.
Legislative, regulatory or judicial actions could negatively impact our business, results of operations, financialcondition or net worth. Legislative, regulatory or judicial actions at the federal, state or local level could negatively impact our business, results ofoperations, financial condition, liquidity or net worth. Legislative, regulatory or judicial actions could affect us in a number ofways, including by imposing significant additional costs on us and diverting management attention or other resources. Forexample, we could be affected by:
• Legislation designed to affect how we and Freddie Mac manage our business. For example, legislation introduced inthe U.S. Senate in April 2019 would prohibit either Fannie Mae or Freddie Mac from transferring or delegating anyduty or responsibility, as of November 25, 2015, of its chief executive officer to any other position. If enacted, thislegislation could negatively impact our business by requiring us to change our current management structure andlimiting our ability to determine the roles and responsibilities of our executives in response to evolving businessneeds.
• Legislative or regulatory changes that expand our, or our servicers’, responsibility and liability for securing,maintaining or otherwise overseeing vacant properties prior to foreclosure, which could increase our costs.
• State laws and court decisions granting new or expanded priority rights over our mortgages to homeownersassociations or through initiatives that provide a lien priority to loans used to finance energy efficiency or similarimprovements, which could adversely affect our ability to recover our losses on affected loans.
• State and local laws and regulations expanding rent control and other tenant protections, such as New York’sHousing Stability and Tenant Protection Act of 2019, which could negatively affect the housing market in theapplicable areas and increase our credit risk on the loans we guarantee in those areas.
In addition, as described in “Risk Factors” in this report and in our 2018 Form 10-K, our business could be materially adverselyaffected by legislative and regulatory actions relating to housing finance reform or the financial services industry, or by legal orregulatory proceedings.
Uncertainty relating to the potential discontinuance of LIBOR after 2021 may adversely affect our results ofoperations, financial condition, liquidity and net worth.We routinely engage in transactions involving financial instruments that reference LIBOR, including acquiring loans andsecurities, selling securities and entering into derivative transactions that reference LIBOR. In 2017, the United Kingdom’sFinancial Conduct Authority, which regulates LIBOR, announced its intention to stop persuading or compelling the group ofmajor banks that sustain LIBOR to submit rate quotations after 2021. As a result, it is uncertain whether LIBOR will continue tobe quoted after 2021. We continue to analyze potential risks associated with the LIBOR transition, including financial,operational, legal, reputational and compliance risks.
Efforts are underway to identify and transition to a set of alternative reference rates. The transition may lead to disruption,including yield volatility on LIBOR-based securities. In 2017, the ARRC recommended the alternative reference rate SOFR andthe Federal Reserve Bank of New York began publishing SOFR in 2018. However, SOFR is calculated based on differentcriteria than LIBOR. Accordingly, SOFR and LIBOR may diverge, particularly in times of macroeconomic stress. Since theinitial publication of SOFR in 2018, daily changes in SOFR have at times been more volatile than daily changes in comparablebenchmark or market rates. Additionally, we cannot anticipate how long it will take to develop the systems and processesnecessary to adopt SOFR or other benchmark replacements, which may delay and contribute to uncertainty and volatilitysurrounding the LIBOR transition.
Other Information
Fannie Mae Second Quarter 2019 Form 10-Q 112
While many of our LIBOR-indexed financial instruments allow us to take discretionary action to select an alternative referencerate if LIBOR is discontinued, our use of an alternative reference rate may be subject to legal challenges. There isconsiderable uncertainty as to how the financial services industry will address the discontinuance of LIBOR in financialinstruments. This uncertainty could result in disputes and litigation with counterparties and borrowers surrounding theimplementation of alternative reference rates in our financial instruments that reference LIBOR. If LIBOR ceases or changes ina manner that causes regulators or market participants to question its viability, financial instruments indexed to LIBOR couldexperience disparate outcomes based on their contractual terms, ability to amend those terms, market or product type, legal orregulatory jurisdiction, and a host of other factors. There can be no assurance that legislative or regulatory actions will dictatewhat happens if LIBOR ceases or is no longer viable, or what those actions might be. In addition, while the ARRC was createdto ensure a successful transition from LIBOR, there can be no assurance that the ARRC will endorse practices that create asmooth transition and minimize value transfers between market participants, or that its endorsed practices will be broadlyadopted by market participants. Divergent industry or market participant actions could result after LIBOR is no longer availableor viable. It is uncertain what effect any divergent industry practices will have on the performance of financial instruments,including those that we own or have issued. Alternative reference rates that replace LIBOR may not yield the same or similareconomic results over the lives of the financial instruments, which could adversely affect the value of and return on theseinstruments. The LIBOR transition could result in our paying higher interest rates on our current LIBOR-indexed obligations,adversely affect the yield on and fair value of the loans and securities we hold or guaranty that reference LIBOR, and increasethe costs of or affect our ability to effectively use derivative instruments to manage interest rate risk.
These developments could have a material impact on us, adjustable-rate mortgage borrowers, investors, and our customersand counterparties. This could result in losses, reputational damage, litigation or costs, or otherwise adversely affect ourbusiness, financial condition, liquidity, net worth or results of operations.
Other Information
Fannie Mae Second Quarter 2019 Form 10-Q 113
Item 2. Unregistered Sales of Equity Securities and Use ofProceeds
Recent Sales of Unregistered SecuritiesUnder the terms of our senior preferred stock purchase agreement with Treasury, we are prohibited from selling or issuing ourequity interests, other than as required by (and pursuant to) the terms of a binding agreement in effect on September 7, 2008,without the prior written consent of Treasury. During the quarter ended June 30, 2019, we did not sell any equity securities.
Information about Certain Securities Issuances by Fannie MaePursuant to SEC regulations, public companies are required to disclose certain information when they incur a material directfinancial obligation or become directly or contingently liable for a material obligation under an off-balance sheet arrangement.The disclosure must be made in a current report on Form 8-K under Item 2.03 or, if the obligation is incurred in connection withcertain types of securities offerings, in prospectuses for that offering that are filed with the SEC.
Because the securities we issue are exempted securities under the Securities Act of 1933, we do not file registrationstatements or prospectuses with the SEC with respect to our securities offerings. To comply with the disclosure requirementsof Form 8-K relating to the incurrence of material financial obligations, we report our incurrence of these types of obligationseither in offering circulars or prospectuses (or supplements thereto) that we post on our website or in a current report onForm 8-K that we file with the SEC, in accordance with a “no-action” letter we received from the SEC staff in 2004. In caseswhere the information is disclosed in a prospectus or offering circular posted on our website, the document will be posted onour website within the same time period that a prospectus for a non-exempt securities offering would be required to be filedwith the SEC.
The website address for disclosure about our debt securities is www.fanniemae.com/debtsearch. From this address, investorscan access the offering circular and related supplements for debt securities offerings under Fannie Mae’s universal debtfacility, including pricing supplements for individual issuances of debt securities.
Disclosure about our obligations pursuant to the MBS we issue, some of which may be off-balance sheet obligations, can befound at www.fanniemae.com/mbsdisclosure. From this address, investors can access information and documents about ourMBS, including prospectuses and related prospectus supplements.
We are providing our website address solely for your information. Information appearing on our website is not incorporated intothis report.
Our Purchases of Equity SecuritiesWe did not repurchase any of our equity securities during the second quarter of 2019.
Dividend Restrictions Our payment of dividends is subject to the following restrictions:
Restrictions Relating to Conservatorship. Our conservator announced on September 7, 2008 that we would not pay anydividends on the common stock or on any series of preferred stock, other than the senior preferred stock. In addition, FHFA’sregulations relating to conservatorship and receivership operations prohibit us from paying any dividends while inconservatorship unless authorized by the Director of FHFA. The Director of FHFA has directed us to make dividend paymentson the senior preferred stock on a quarterly basis for every dividend period for which dividends were payable.
Restrictions Under Senior Preferred Stock Purchase Agreement and Senior Preferred Stock. The senior preferred stockpurchase agreement prohibits us from declaring or paying any dividends on Fannie Mae equity securities (other than thesenior preferred stock) without the prior written consent of Treasury. In addition, pursuant to the dividend provisions of thesenior preferred stock and quarterly directives from our conservator, we are obligated to pay Treasury each quarter anydividends declared consisting of the amount, if any, by which our net worth as of the end of the immediately preceding fiscalquarter exceeds $3.0 billion. As a result, our net income is not available to common stockholders. For more information on theterms of the senior preferred stock purchase agreement and senior preferred stock, see “Business—Conservatorship,Treasury Agreements and Housing Finance Reform” in our 2018 Form 10-K.
Additional Restrictions Relating to Preferred Stock. Payment of dividends on our common stock is also subject to the priorpayment of dividends on our preferred stock and our senior preferred stock. Payment of dividends on all outstanding preferredstock, other than the senior preferred stock, is also subject to the prior payment of dividends on the senior preferred stock.
Statutory Restrictions. Under the GSE Act, FHFA has authority to prohibit capital distributions, including payment of dividends,if we fail to meet our capital requirements. If FHFA classifies us as significantly undercapitalized, approval of the Director ofFHFA is required for any dividend payment. Under the Charter Act and the GSE Act, we are not permitted to make a capitaldistribution if, after making the distribution, we would be undercapitalized. The Director of FHFA, however, may permit us torepurchase shares if the repurchase is made in connection with the issuance of additional shares or obligations in at least anequivalent amount and will reduce our financial obligations or otherwise improve our financial condition.
Other Information
Fannie Mae Second Quarter 2019 Form 10-Q 114
Item 3. Defaults Upon Senior SecuritiesNone.
Item 4. Mine Safety DisclosuresNone.
Item 5. Other InformationNone.
Item 6. ExhibitsThe exhibits listed below are being filed or furnished with or incorporated by reference into this report.
Item Description3.1 Fannie Mae Charter Act (12 U.S.C. § 1716 et seq.) as amended through May 24, 2018 (Incorporated by
reference to Exhibit 3.1 to Fannie Mae’s Quarterly Report on Form 10-Q (Commission file number000-50231) for the quarter ended June 30, 2018, filed August 2, 2018.)
3.2 Fannie Mae Bylaws, as amended through January 29, 2019 (Incorporated by reference to Exhibit 3.2 toFannie Mae’s Annual Report on Form 10-K (Commission file number 000-50231) for the year endedDecember 31, 2018, filed February 14, 2019.)
31.1 Certification of Chief Executive Officer pursuant to Securities Exchange Act Rule 13a-14(a)
31.2 Certification of Chief Financial Officer pursuant to Securities Exchange Act Rule 13a-14(a)
32.1 Certification of Chief Executive Officer pursuant to 18 U.S.C. Section 1350
32.2 Certification of Chief Financial Officer pursuant to 18 U.S.C. Section 1350
101. INS XBRL Instance Document* - the instance document does not appear in the Interactive Data File because itsXBRL tags are embedded within the Inline XBRL document
101. SCH XBRL Taxonomy Extension Schema*
101. CAL XBRL Taxonomy Extension Calculation*
101. DEF XBRL Taxonomy Extension Definition*
101. LAB XBRL Taxonomy Extension Label*
101. PRE XBRL Taxonomy Extension Presentation*
104 Cover Page Interactive Data File* - the cover page interactive data file does not appear in the InteractiveData File because its XBRL tags are embedded within the Inline XBRL document
* The financial information contained in these XBRL documents is unaudited.
Other Information
Fannie Mae Second Quarter 2019 Form 10-Q 115

SIGNATURES
Pursuant to the requirements of the Securities Exchange Act of 1934, the registrant has duly caused this report to be signedon its behalf by the undersigned thereunto duly authorized.
Federal National Mortgage Association
By: /s/ Hugh R. Frater
Hugh R. FraterChief Executive Officer
Date: August 1, 2019
By: /s/ Celeste M. Brown Celeste M. BrownExecutive Vice President andChief Financial Officer
Date: August 1, 2019
Signatures
Fannie Mae Second Quarter 2019 Form 10-Q 116