federal health reform: answering the “five ws” nielsen.pdf · • sharon homan, phd vice...
TRANSCRIPT

Moderator:Marcia Nielsen, PhD, MPHVice Chancellor for Public Policy and PlanningAssociate Professor in Health Policy and ManagementUniversity of Kansas Medical Center
Federal health reform: Answering the “Five Ws”

Panelists• Andy Allison, PhD▫ Executive Director, Kansas Health Policy Authority
• Sandy Praeger▫ Commissioner, Kansas Insurance Department
• Jen Brull, MD▫ President, Kansas Academy of Family Physicians and
private practice physician
• Sharon Homan, PhD▫ Vice president for Public Health, Kansas Health Institute
• Susan Sherry▫ Community Catalyst, Boston, MA

Who can you believe?

Federal health reform: Answering the Five Ws
Starting with, “Why?”

Note: $US PPP = purchasing power parity.Source: Organization for Economic Cooperation and Development, OECD Health Data, 2009 (Paris: OECD, Nov. 2009).
Average spending on healthper capita ($US PPP)
0
2
4
6
8
10
12
14
16
1980 1984 1988 1992 1996 2000 2004
United StatesGermanyCanadaNetherlandsNew ZealandAustraliaUnited Kingdom
Total expenditures on healthas percent of GDP
$7,290
$2,454
16%
8%
We spend too much as a nation
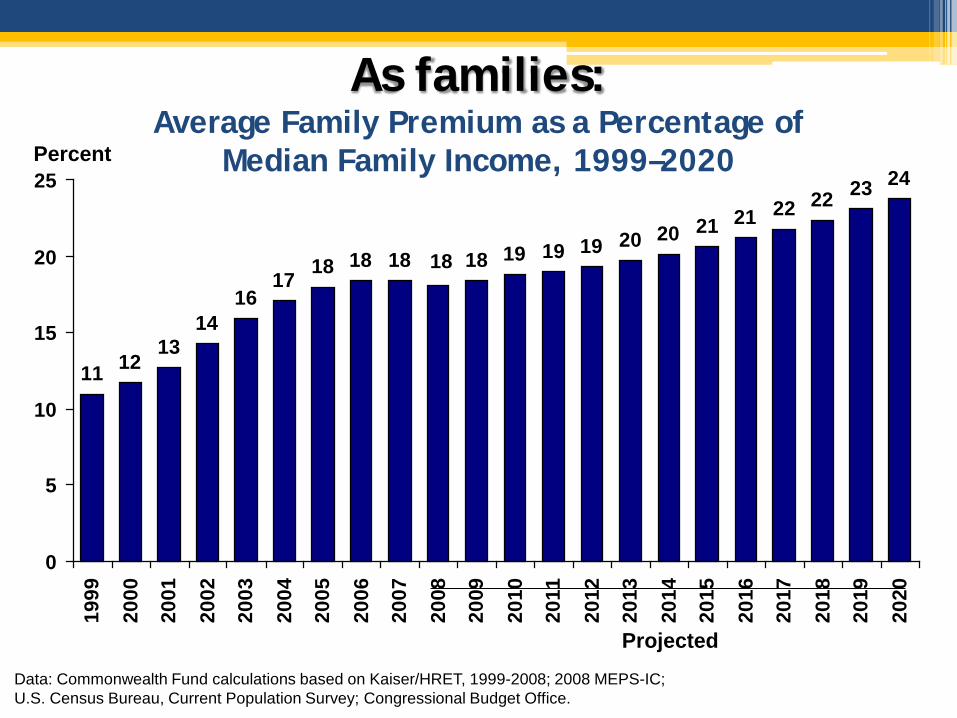
As families: Average Family Premium as a Percentage of
Median Family Income, 1999–2020
11 1213
1416
17 18 18 18 18 19 19 19 20 20 21 21 22 22 23 24
18
0
5
10
15
20
25
1999
2000
2001
2002
2003
2004
2005
2006
2007
2008
2009
2010
2011
2012
2013
2014
2015
2016
2017
2018
2019
2020
Data: Commonwealth Fund calculations based on Kaiser/HRET, 1999-2008; 2008 MEPS-IC; U.S. Census Bureau, Current Population Survey; Congressional Budget Office.
Projected
Percent

In the private and public sectors: Health Care Expenditure per Capita
by Source of Funding, 2007*
3,3074,005
2,618 2,726 2,844 2,7582,124 2,446
2,056
3,092
449 589 510 360
441
890
720
1,350 580 246 470528
571542
2,716
38
8820479 343
0
1,000
2,000
3,000
4,000
5,000
6,000
7,000
8,000
US NOR SWITZ CAN FR GER SWE AUS* UK ITA
Out-of-pocket spending
Private spending Public spending
* 2006Source: OECD Health Data 2009 (June 2009).
Dollars
*Adjusted for Differences in Cost of Living

We get too little value in outcomes
81.1 80.782.282.382.382.482.983.083.083.784.084.284.4
78.2 77.1 75.477.278.077.278.278.978.479.078.479.277.5
0
10
20
30
40
50
60
70
80
90
FR SWITZ* ITA* AUS CAN* SWE NOR* GER* NETH OECDMedian
NZ UK** US*
Female Male
* 2006** 2005Source: OECD Health Data 2009 (June 2009).
Years Mortality rate at birth, 2007

7681
88 84 89 8999 97
8897
109 106116 115 113
130 134128
115
65 71 71 74 74 77 80 82 82 84 84 90 93 96 101 103 103 104 110
0
50
100
150
Fran
ceJa
pan
Austra
liaSpa
in
Italy
Canad
aNor
wayNeth
erlan
dsSwed
enGre
ece
Austri
aGer
many
Finlan
dNew
Zeala
ndDen
mark
United
King
dom
Irelan
dPor
tuga
lUnit
ed S
tates
1997/98 2002/03Deaths per 100,000 population*
Source: 2008 Commonwealth Fund * Countries’ age-standardized death rates before age 75; including ischemic heart disease, diabetes, stroke, and bacterial infections.See report Appendix B for list of all conditions considered amenable to health care in the analysis.Data: E. Nolte and C. M. McKee, London School of Hygiene and Tropical Medicine analysis of World Health Organization mortality files (Nolte and McKee 2008).
In access to health care:Mortality Amenable to Health Care
9
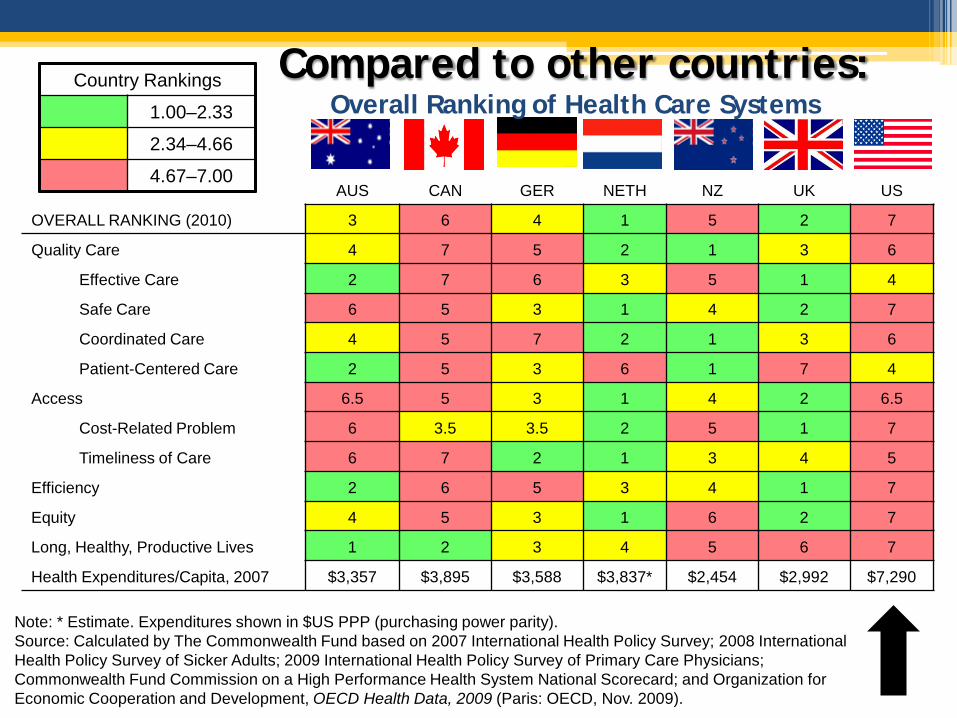
Note: * Estimate. Expenditures shown in $US PPP (purchasing power parity).Source: Calculated by The Commonwealth Fund based on 2007 International Health Policy Survey; 2008 International Health Policy Survey of Sicker Adults; 2009 International Health Policy Survey of Primary Care Physicians; Commonwealth Fund Commission on a High Performance Health System National Scorecard; and Organization for Economic Cooperation and Development, OECD Health Data, 2009 (Paris: OECD, Nov. 2009).
AUS CAN GER NETH NZ UK US
OVERALL RANKING (2010) 3 6 4 1 5 2 7
Quality Care 4 7 5 2 1 3 6
Effective Care 2 7 6 3 5 1 4
Safe Care 6 5 3 1 4 2 7
Coordinated Care 4 5 7 2 1 3 6
Patient-Centered Care 2 5 3 6 1 7 4
Access 6.5 5 3 1 4 2 6.5
Cost-Related Problem 6 3.5 3.5 2 5 1 7
Timeliness of Care 6 7 2 1 3 4 5
Efficiency 2 6 5 3 4 1 7
Equity 4 5 3 1 6 2 7
Long, Healthy, Productive Lives 1 2 3 4 5 6 7
Health Expenditures/Capita, 2007 $3,357 $3,895 $3,588 $3,837* $2,454 $2,992 $7,290
Country Rankings
1.00–2.33
2.34–4.66
4.67–7.00
Compared to other countries:Overall Ranking of Health Care Systems

53.4
36.9 37.9
30.0 31.034.7
40.638.4
44.849.6
0
10
20
30
40
50
60
1963 1968 1974 1980 1987 1990 1995 2000 2005 2010
Millions uninsured
Note: Figures for 1963-1974 are U.S. residents without hospital insurance.Data: National Health Interview Survey, Current Population Survey, The Lewin Group.
We don’t spend wisely
Total Number of Uninsured, 1963–2010

Or timely: Ability to See Doctor When Sick or Need Care
36
26
42 43
6054
48
26
0
20
40
60
80
AUSCAN FR
GERNETH NZ UK US
18
34
1826
38
14
23
0
20
40
60
80
AUSCAN FR
GERNETH NZ UK US
Same-day appointment 6+ days wait or never ableto get appointment
Data collection: Harris Interactive, Inc.Source: 2008 Commonwealth Fund International Health Policy Survey of Sicker Adults.
Base: Adults with any chronic conditionPercent

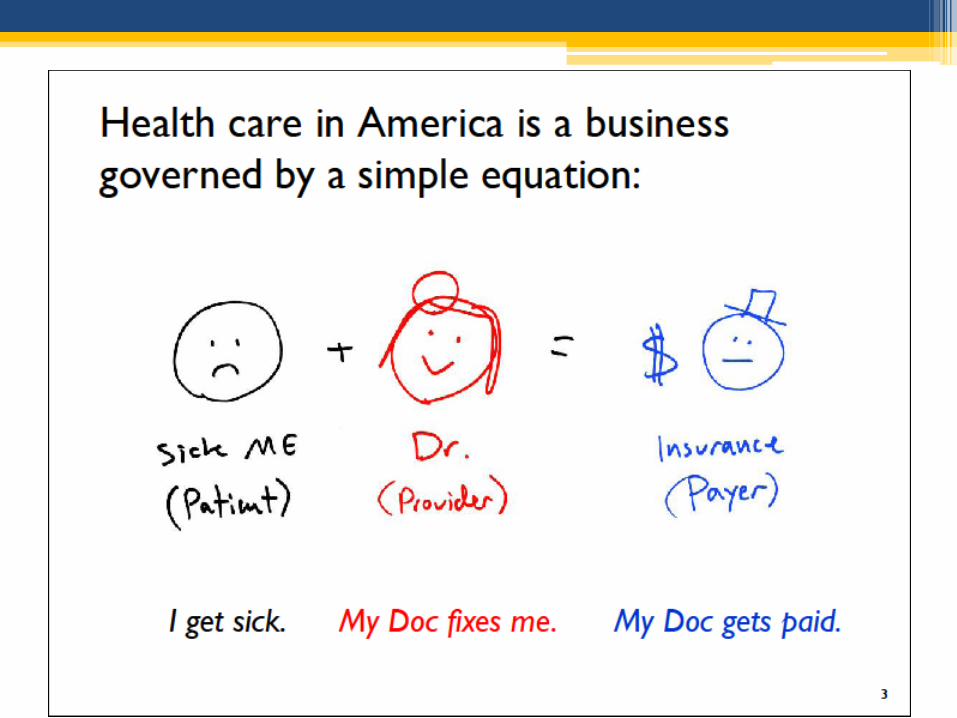
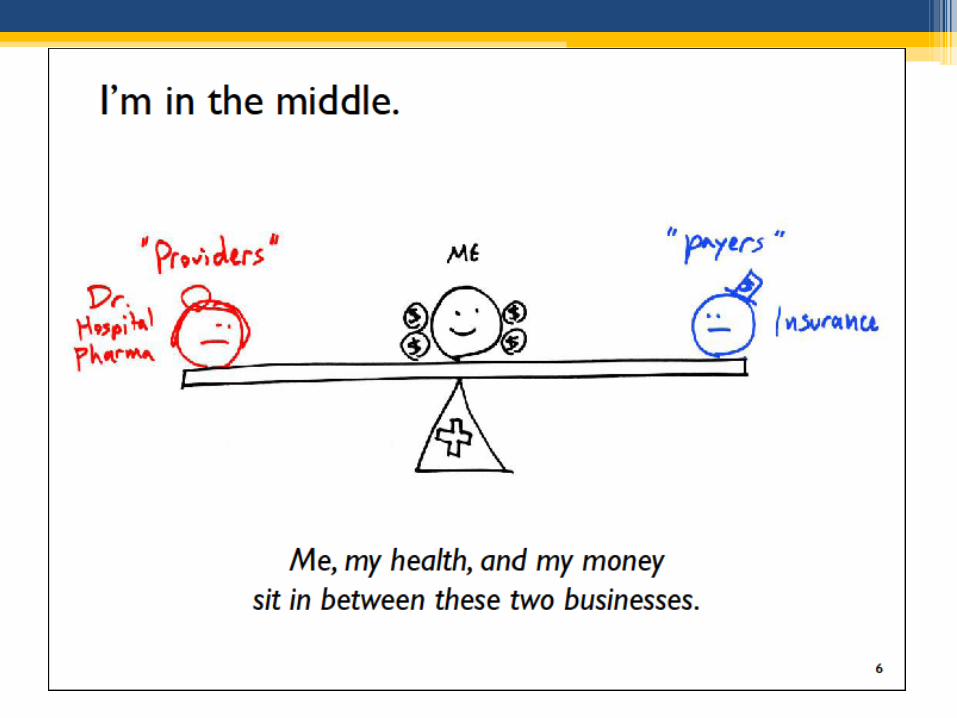
We see health care as a business
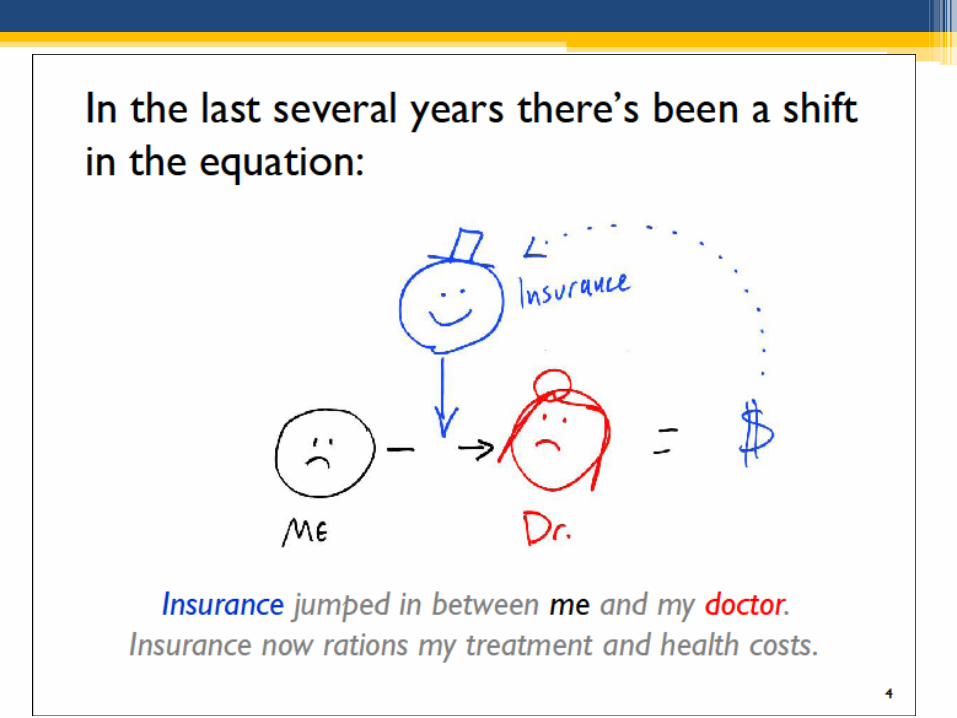
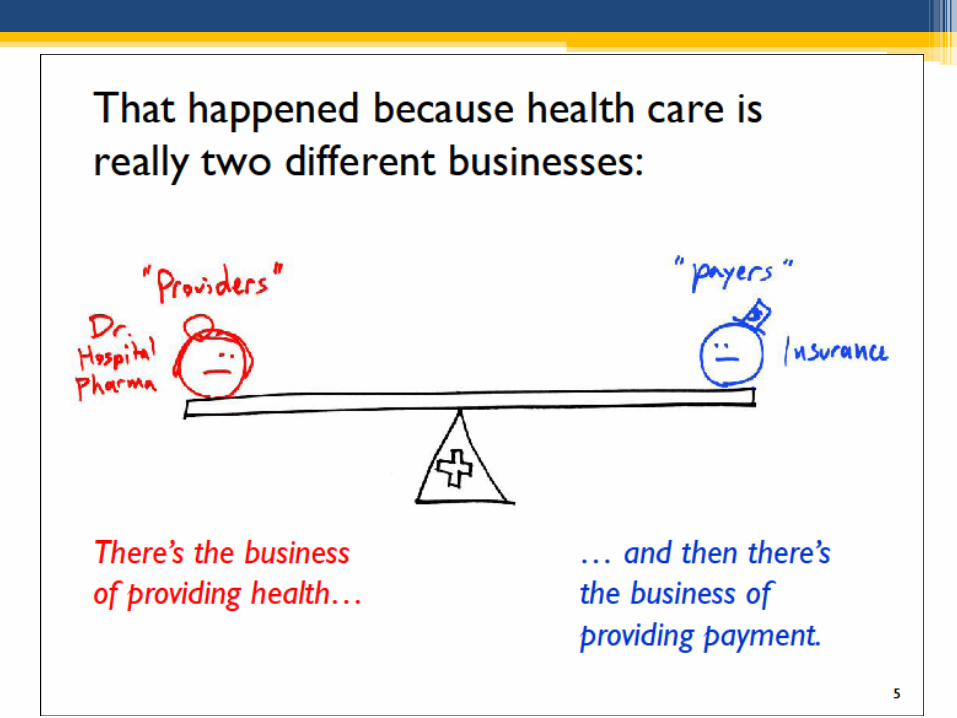


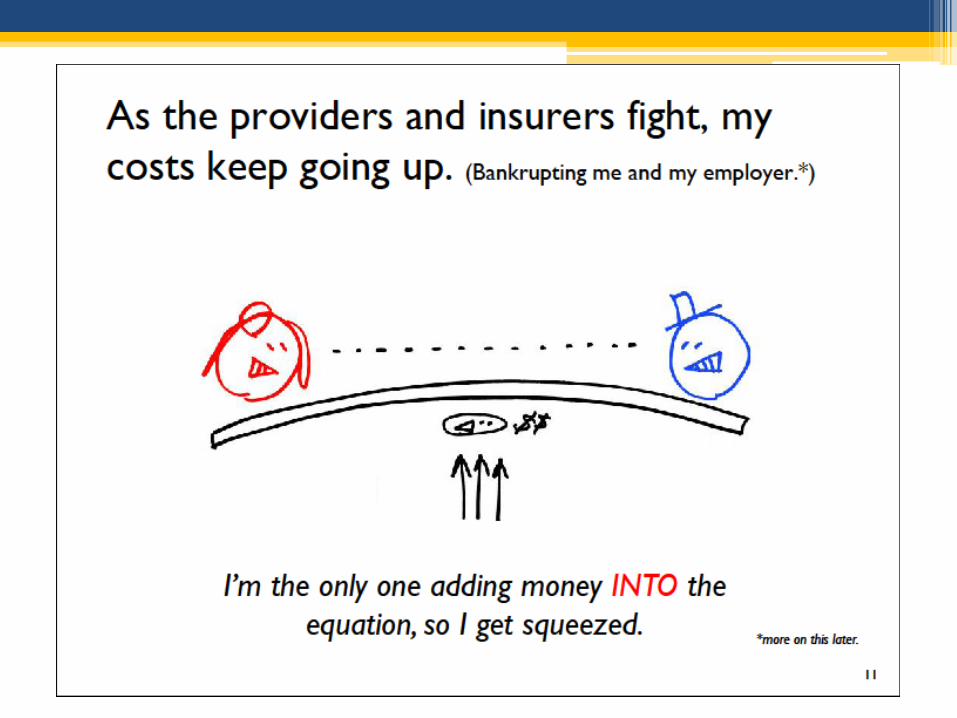
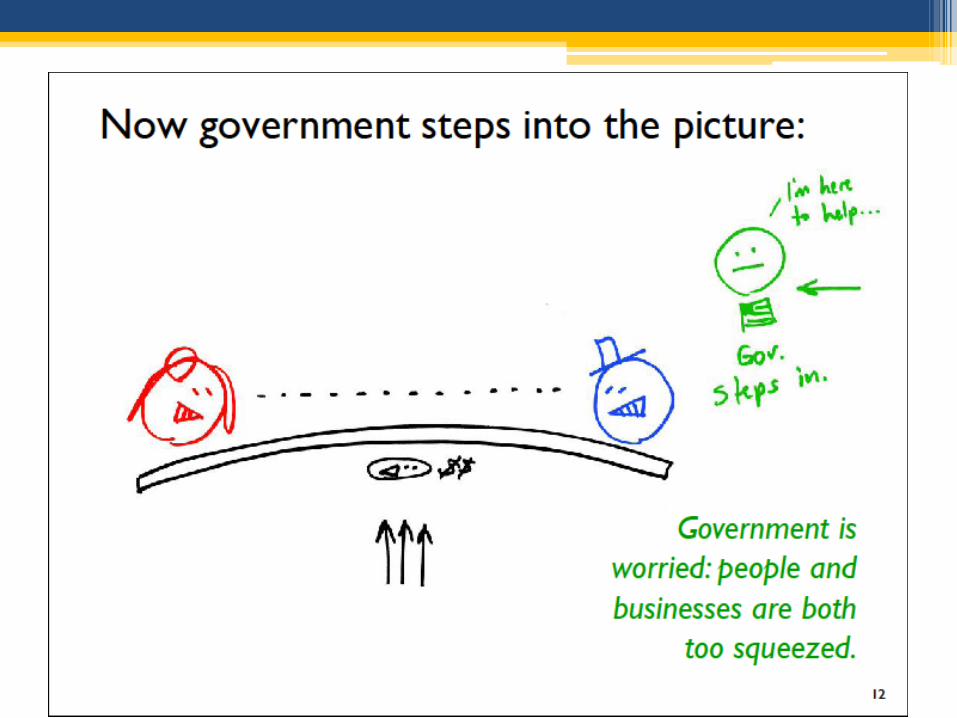


We do NOT see health care as a system

What constitutes a system?…Interstate Highway SYSTEM: A Primer
• Named after Dwight Eisenhowser, who championed its formation in 1956
• Largest and most expensive public works program (investment!) in history
• Idea came from German autobahn• Standards are a necessity▫ Speed limits▫ Horizontal, vertical, and tunnel clearance▫ Bridge strength
• Kansas first state to start paving
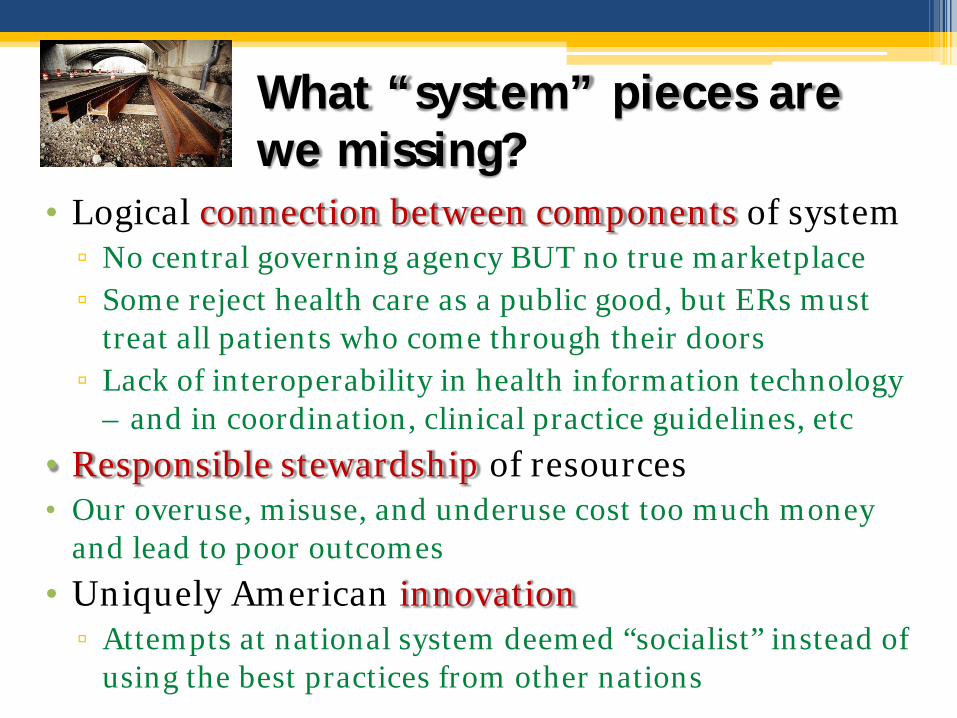
What “system” pieces are we missing?
• Logical connection between components of system▫ No central governing agency BUT no true marketplace▫ Some reject health care as a public good, but ERs must
treat all patients who come through their doors▫ Lack of interoperability in health information technology
– and in coordination, clinical practice guidelines, etc
• Responsible stewardship of resources• Our overuse, misuse, and underuse cost too much money
and lead to poor outcomes
• Uniquely American innovation▫ Attempts at national system deemed “socialist” instead of
using the best practices from other nations

Where? Reform to be implemented by states Benefits Challenges
• Majority of costs are borne by the federal government
• Reduction in the # of uninsured
• Allowed to design and oversee insurance Exchanges based on their own needs
• Assistance with high risk pools for uninsurable adults
• Enroll newly eligible beneficiaries in Medicaid despite significant budget cuts and limited administrative resources (2014)
• Coordinate Medicaid enrollment with Exchanges
• Implement other Medicaid specific changes
• Maintain current Medicaid and CHIP eligibility through 2019
• Implement new waste, fraud and abuse provisions
• Consider demonstration projects for tort reform
28

When? Timeline for federal reform

Panelist discussion

Sample questions for panelists• First of all, does this presentation leave out important
aspects of the “why, when, where” of federal health reform?
• Second, from your perspective, how would you each answer the other “W” questions? i.e. “who” and “what” are the most important aspects of health reform?
• Third, from your perspective, what got left out of federal health reform?
• Fourth, what is your organization doing to get ready for federal health reform?
• Fifth, what would you like the folks in the audience, Sunflower grantees and the general public, to know or do in the next sixth months to help advance health reform?