federal fiscal year 2018 - rhode island rhode island ... · federal fiscal year 2018 ... prepared...
TRANSCRIPT
State of Rhode Island
Highway Safety PlanFederal Fiscal Year 2018
GINA M. RAIMONDO Governor
PETER R. ALVITI, JR., PE Director
July 2017
PREPARED FOR
U.S. Department of Transportation National Highway Traffic Safety Administration
PREPARED BY
Rhode Island Department of Transportation Office of Highway Safety Two Capitol Hill Providence, RI 02903


Rhode Island Highway Safety Plan | FFY 2018
i Table of Contents
Table of Contents
Introduction to the Rhode Island Highway Safety Planning Process ..................................................... 1
1.1 Mission Statement .............................................................................................................................................. 2 1.2 Organization and Staffing ............................................................................................................................... 5
OHS Personnel ..................................................................................................................................................... 6 1.3 Timeline and Planning Purpose .................................................................................................................. 11
Strategic Partners and Stakeholders ........................................................................................................ 12 Grant Funding Process ................................................................................................................................... 13 Other Funds ........................................................................................................................................................ 15 Countermeasure and Strategy Selection Process ............................................................................... 18
1.4 Coordination with Strategic Highway Safety Plan .............................................................................. 19
FFY 2016 Performance Report ............................................................................................................ 23
Highway Safety Performance Plan ..................................................................................................... 27
3.1 Problem Identification Process ................................................................................................................... 27 3.2 Statewide Demographics .............................................................................................................................. 28 3.3 Highway Safety Problem Areas .................................................................................................................. 32 3.4 Additional Challenges to Highway Safety .............................................................................................. 34 3.5 Rhode Island Comparison to New England and United States ..................................................... 35 3.6 Legislative Updates ......................................................................................................................................... 36 3.7 Performance Trends and Goals .................................................................................................................. 36 3.8 Core Performance Measures ....................................................................................................................... 40
C-1 – Fatalities ................................................................................................................................................... 41 C-2 – Serious Injuries ...................................................................................................................................... 42 C-3 – Fatality Rate ............................................................................................................................................ 43 C-4 – Unrestrained Motor Vehicle Occupant Fatalities ..................................................................... 44 C-5 – Fatalities Involving Driver or Motorcycle Operator with ≥0.08 BAC................................ 45 C-6 – Speed ........................................................................................................................................................ 46 C-7 – Motorcycle Fatalities ........................................................................................................................... 47 C-8 – Unhelmeted Motorcycle Fatalities ................................................................................................ 48 C-9 – Young Drivers ........................................................................................................................................ 49 C-10 – Pedestrian ............................................................................................................................................. 50 C-11 – Bicycle .................................................................................................................................................... 51 B-1 – Observed Belt Use ................................................................................................................................ 52
3.9 Additional Performance Measures ............................................................................................................ 53 3.9.1 Occupant Protection ........................................................................................................................ 53 3.9.2 Impaired Driving ................................................................................................................................ 53 3.9.3 Pedestrians ........................................................................................................................................... 54 3.9.4 Traffic Records .................................................................................................................................... 54
Rhode Island Highway Safety Plan | FFY 2018
ii Table of Contents
3.9.5 Distracted Driving .............................................................................................................................. 54 3.9.6 Planning and Administration ........................................................................................................ 55
Highway Safety Countermeasures and Projects for FFY 2018 (by Program Area) ................................ 57
4.1 Occupant Protection ....................................................................................................................................... 58 Problem Identification and Analysis ......................................................................................................... 58 Child Passenger Safety ................................................................................................................................... 63 Strategic Partners ............................................................................................................................................. 65 Alignment with the SHSP .............................................................................................................................. 65 Performance Targets ....................................................................................................................................... 65 List of Countermeasures (Strategies) ....................................................................................................... 66 Project Descriptions ........................................................................................................................................ 67
4.2 Impaired Driving ............................................................................................................................................... 74 Problem Identification and Analysis ......................................................................................................... 74 Strategic Partners ............................................................................................................................................. 80 Alignment with the SHSP .............................................................................................................................. 80 Performance Targets ....................................................................................................................................... 81 List of Countermeasures (Strategies) ....................................................................................................... 81 Project Descriptions ........................................................................................................................................ 82
4.3 Speed .................................................................................................................................................................... 92 Problem Identification and Analysis ......................................................................................................... 92 Strategic Partners ............................................................................................................................................. 95 Alignment with the SHSP .............................................................................................................................. 95 Performance Targets ....................................................................................................................................... 95 List of Countermeasures (Strategies) ....................................................................................................... 96 Project Descriptions ........................................................................................................................................ 97
4.4 Motorcycles ...................................................................................................................................................... 100 Problem Identification and Analysis ....................................................................................................... 100 Strategic Partners ........................................................................................................................................... 109 Alignment with the SHSP ............................................................................................................................ 109 Performance Targets ..................................................................................................................................... 109 List of Countermeasures (Strategies) ..................................................................................................... 110 Project Descriptions ...................................................................................................................................... 111
4.5 Young Driver .................................................................................................................................................... 112 Problem Identification and Analysis ....................................................................................................... 112 Strategic Partners ........................................................................................................................................... 115 Alignment with the SHSP ............................................................................................................................ 116 Performance Targets ..................................................................................................................................... 116 List of Countermeasures (Strategies) ..................................................................................................... 117 Project Descriptions ...................................................................................................................................... 118
4.6 Pedestrians and Bicyclists ........................................................................................................................... 119 Problem Identification and Analysis ....................................................................................................... 119 Strategic Partners ........................................................................................................................................... 126 Alignment with the SHSP ............................................................................................................................ 127 Performance Targets ..................................................................................................................................... 127

Rhode Island Highway Safety Plan | FFY 2018
iii Table of Contents
List of Countermeasures (Strategies) ..................................................................................................... 128 Project Descriptions ...................................................................................................................................... 128
4.7 Traffic Records ................................................................................................................................................. 133 Problem Identification and Analysis ....................................................................................................... 133 Strategic Partners ........................................................................................................................................... 138 Alignment with the SHSP ............................................................................................................................ 138 Performance Targets ..................................................................................................................................... 139 List of Countermeasures (Strategies) ..................................................................................................... 140 Project Descriptions ...................................................................................................................................... 141
4.8 Traffic Safety Enforcement Plan ............................................................................................................... 145 4.9 Distracted Driving .......................................................................................................................................... 150
Problem Identification and Analysis ....................................................................................................... 150 Alignment with the SHSP ............................................................................................................................ 151 Performance Targets ..................................................................................................................................... 152 Strategic Partners ........................................................................................................................................... 152 List of Countermeasures (Strategies) ..................................................................................................... 152 Project Descriptions ...................................................................................................................................... 153
4.10 Planning and Administration ..................................................................................................................... 154 Automated Traffic Enforcement Survey ................................................................................................ 154 Strategic Partners ........................................................................................................................................... 154 Performance Targets ..................................................................................................................................... 154 List of Countermeasures (Strategies) ..................................................................................................... 155 Project Descriptions ...................................................................................................................................... 156
4.11 NHTSA Equipment Approval ..................................................................................................................... 158 4.12 Paid Advertising .............................................................................................................................................. 158
Cost Summary .................................................................................................................................. 161
Certifications and Assurances .......................................................................................................... 169
Section 405 Grant Program .............................................................................................................. 181

Rhode Island Highway Safety Plan | FFY 2018
iv Table of Contents
List of Tables Table No. Description Page
Table 1.1 Rhode Island Office on Highway Safety Annual Safety Planning Calendar .................................. 11
Table 2.1 Progress in Meeting FFY 2017 Performance Targets ................................................................................. 23
Table 3.1 U.S. Census Population Estimate by County and Town (2016) ............................................................ 30
Table 3.2 Rhode Island Drivers, Vehicles, and Population ............................................................................................ 31
Table 3.3 Crash Conditions as Percent of Total Fatalities (2015) .............................................................................. 35
Table 3.4 FFY 2018 Performance Goals and Targets ....................................................................................................... 37
Table 4.1 Motor Vehicle Fatalities by Restraint System – Use and Nonuse (2016) ........................................ 61
Table 4.2 Top Five Cities/Towns for Unrestrained Motor Vehicle Occupant Fatalities (2011-2015) ..... 63
Table 4.3 CPST Certification Events ........................................................................................................................................... 63
Table 4.4 Active Network of Child Restraint Inspection Stations FFY 2018 ........................................................ 64
Table 4.5 Top Five Cities/Towns by Fatal Impaired Driving Crashes ....................................................................... 79
Table 4.6 BAC Test Results and Gender for Drivers or Motorcycle Operators Involved in Fatal Crashes (2015) .................................................................................................................................................................................... 79
Table 4.7 Most Frequently Detected Drugs in Motor Vehicle-Related Cases (2016) .................................... 79
Table 4.8 Speed-Related Fatalities by Posted Speed Limit .......................................................................................... 93
Table 4.9 Top Five Cities/Towns by Fatal Speeding Crashes ....................................................................................... 95
Table 4.10 Top Three Cities/Towns by Fatal Motorcycle Crashes ............................................................................ 109
Table 4.11 Motorcycle Models Data Source (OSCAR) .................................................................................................... 109
Table 4.12 Top Four Cities/Towns by Fatal Younger Driver Crashes ...................................................................... 114
Table 4.13 Fatal Crashes and Fatalities involving Young Drivers (Age 16 to 20) ............................................. 115
Table 4.14 Top Three Cities/Towns by Fatal Pedestrian Crashes ............................................................................. 124
Table 4.15 Top Cities/Towns by Fatal Bicycle Crashes .................................................................................................... 125
Table 4.16 BAC Test Results for Pedestrians Involved in Fatal Crashes ................................................................ 126
Table 4.17 Age and Gender of Pedestrians involved in Fatal Crashes Testing Positive for Blood Alcohol (2011-2015) .................................................................................................................................................................... 126
Table 4.18 MMUCC-compliant data Measurements ...................................................................................................... 134
Table 4.19 MMUCC-compliant data SQL Queries of Crash Database .................................................................. 134
Table 4.20 Reports with Complete Location Data Measurements .......................................................................... 136
Table 4.21 Complete Location SQL Queries of Crash Database ............................................................................... 136
Table 4.22 Campaign Efforts for FFY 2018 ............................................................................................................................ 150
Table 4.23 Distraction-affected Crashes (2011-2015) ..................................................................................................... 151
Table 5.1 Cost Summary............................................................................................................................................................... 162
Table 5.2 Cost Summary by Department ............................................................................................................................ 167

Rhode Island Highway Safety Plan | FFY 2018
v Table of Contents
List of Figures Figure No. Description Page
Figure 1.1 Fatality Trends and Projections ....................................................................................................... 3
Figure 1.2 Serious Injury Trends and Projections .......................................................................................... 3
Figure 1.3 RIDOT Highway Safety Program Relationship System .......................................................... 4
Figure 1.4 RIDOT OHS Organizational Chart .................................................................................................. 5
Figure 1.5 OHS Application Process ................................................................................................................ 15
Figure 3.1 Rhode Island Population Estimate (2015) ................................................................................ 28
Figure 3.2 Rhode Island Drivers, Vehicles, and Population .................................................................... 31
Figure 3.3 Percentage of Rhode Island Fatal and Serious Injury Crashes by Month-of-Year (2016)............................................................................................................................................ 32
Figure 3.4 Percentage of Rhode Island Fatal and Serious Injury Crashes by Day of Week (2016) ...................................................................................................................................................... 33
Figure 3.5 Percentage of Rhode Island Fatal and Serious Injury Crashes by Time of Day (2016) ...................................................................................................................................................... 33
Figure 3.6 Rhode Island Traffic Fatalities (2007 to 2016) ........................................................................ 34
Figure 3.7 Fatality Rates (Per 100 Million VMT) .......................................................................................... 35
Figure 3.8 C-1 Fatalities ........................................................................................................................................ 41
Figure 3.9 C-2 Serious Injuries ........................................................................................................................... 42
Figure 3.10 C-3 Fatality Rate per 100 Million VMT ...................................................................................... 43
Figure 3.11 C-4 Unrestrained Motor Vehicle Occupant Fatalities .......................................................... 44
Figure 3.12 C-5 Fatalities Involving Driver or Motorcycle Operator with ≥0.08 BAC ..................... 45
Figure 3.13 C-6 Speed-Related Fatalities ......................................................................................................... 46
Figure 3.14 C-7 Number of Motorcyclist Fatalities ...................................................................................... 47
Figure 3.15 C-8 Unhelmeted Motorcycle Fatalities ...................................................................................... 48
Figure 3.16 Drivers Age 20 or Younger Involved in Fatal Crashes ......................................................... 49
Figure 3.17 C-10 Pedestrian Fatalities ............................................................................................................... 50
Figure 3.18 C-11 Bicyclist Fatalities .................................................................................................................... 51
Figure 3.19 Percent Observed Belt Use for Passenger Vehicles (Front Seat Outboard Occupants (2011-2016) ................................................................................................................... 52
Figure 4.1 Observed Safety Belt Use Rate (Rhode Island and Nationwide) ..................................... 60
Figure 4.2 Restraint Nonuse for Rhode Island Motor Vehicle Fatalities ........................................... 61
Figure 4.3 Number of Unrestrained Fatalities by Age Group 2011 to 2016 .................................... 62
Figure 4.4 Unrestrained Fatalities by Race (2011 to 2015) ..................................................................... 62
Figure 4.5 Driving Fatalities Involving BAC ≥0.08 ...................................................................................... 77

Rhode Island Highway Safety Plan | FFY 2018
vi Table of Contents
Figure 4.6 Alcohol-Related Fatalities ............................................................................................................... 77
Figure 4.7 Drivers and Motorcycle Operators in Fatal Crashes with BAC ≥ 0.08 by age (2011 to 2015) ..................................................................................................................................... 78
Figure 4.8 Alcohol Involved Drivers in Fatal Crashes by Race 2011 to 2015 ................................... 78
Figure 4.9 Percent of Fatalities Resulting from Crashes Involving Speeding Versus Total Fatalities ................................................................................................................................................. 93
Figure 4.10 Age of Drivers in Fatal Speeding Crashes (2011 to 2015) ................................................. 94
Figure 4.11 Ethnicity of Drivers in Fatal Speeding Crashes (2011 to 2015) ........................................ 94
Figure 4.12 Motorcyclist Fatalities and Serious Injuries ........................................................................... 104
Figure 4.13 Motorcyclist Fatalities as Percent of Total Fatalities (Rhode Island, New England, and U.S.) ............................................................................................................................ 104
Figure 4.14 BAC Involved in Motorcycle Fatalities (2009 to 2013) ...................................................... 105
Figure 4.15 Motorcycle Fatalities by Age (2011 to 2016) ........................................................................ 105
Figure 4.16 Motorcycle Fatalities by Race (2011 to 2016)....................................................................... 106
Figure 4.17 Fatal Motorcycle Crashes by Month (2012 to 2016) .......................................................... 106
Figure 4.18 Fatal Motorcycle Crashes by Day of Week (2012 to 2016) ............................................. 107
Figure 4.19 Fatal Motorcycle Crashes by Time of Day (2012 to 2016) ............................................... 108
Figure 4.20 Total Young Driver Involved in Fatality and Serious Injury Crashes ............................ 114
Figure 4.21 Total Fatalities and Serious Injuries Involving Pedestrians .............................................. 121
Figure 4.22 Total Bicyclist Fatalities and Serious Injuries ......................................................................... 121
Figure 4.23 Pedestrian Fatalities as a Percent of Total Fatalities .......................................................... 122
Figure 4.24 Bicyclist Involved Fatalities as Percent of Total Fatalities ................................................. 122
Figure 4.25 Pedestrian Fatalities by Age Group (2011 to 2015) ........................................................... 123
Figure 4.26 Pedestrian Fatalities by Race (2011 to 2015) ........................................................................ 123
Figure 4.27 Bicyclist Fatalities by Age Group (2011 to 2016) ................................................................. 124
Figure 4.28 Bicyclist Fatalities by Race (2011 to 2015) ............................................................................. 125
Figure 4.29 SQL Query – MMUCC-compliant crash data ........................................................................ 135
Figure 4.30 SQL Query – Latitude/Longitude Crash Data ....................................................................... 138

Rhode Island Highway Safety Plan | FFY 2018
vii Table of Contents
Acronym Guide
AAASNE American Automobile Association, Southern New England
AR Annual Report
ARIDE Advanced Roadside Impaired Driving Enforcement
BAC Blood Alcohol Concentration
BHDDH Behavioral Healthcare, Developmental Disabilities, and Hospitals
BIARI Brain Injury Association of Rhode Island
CARE Combined Accident Reduction Effort
CCF Connecting for Children and Families, Inc.
CCRI Community College of Rhode Island
CDL Commercial Driver’s License
CDMS Crash Data Management System
CIOT Click It or Ticket
COZ Child Opportunity Zone
CPS Child Passenger Safety
CPST Child Passenger Safety Technician
CSEA Center for Southeast Asians
CTM Countermeasures that Work
DDACTS Data-Driven Approaches to Crime and Traffic Safety
DITEP Drug Impairment Training for Educational Professionals
DNTL Drive Now Text Later
DOC Department of Corrections
DRE Drug Recognition Expert
DSoGPO Drive Sober or Get Pulled Over
DUI Driving Under the Influence
DWI Driving While Intoxicated
EMT Emergency Medical Technician
EUDL Enforcing the Underage Drinking Laws
FARS Fatality Analysis Reporting System
FFY Federal Fiscal Year
FHWA Federal Highway Administration
FMCSA Federal Motor Carrier Safety Administration
GDL Graduated Driver’s Licensing
GHSA Governor’s Highway Safety Association
HS 1 Highway Safety Grant application
HSM Highway Safety Manual
HSP Highway Safety Plan
HVE High-Visibility Enforcement
IACP International Association of Chiefs of Police
IHSDM Interactive Highway Design Model
ILSR Institute for Labor Studies and Research
LEHSTC Law Enforcement Highway Safety Training Coordinator
LEL Law Enforcement Liaison
MADD Mothers Against Drunk Driving
MAP-21 Moving Ahead of for Progress in the 21st Century
MOU Memorandum of Understanding
NHTSA National Highway Traffic Safety Administration

Rhode Island Highway Safety Plan | FFY 2018
viii Table of Contents
NOPUS National Occupant Protection Use Survey
OHS Office on Highway Safety
OSCAR On-Line System Crash Analysis and Reporting
PCL Providence Community Library
PEP Performance Enhancement Plan
RFP Request for Proposal
RIBHDDH Rhode Island Department of Behavioral Healthcare, Developmental Disabilities, and Hospitals
RIDOC Rhode Island Department of Corrections
RIDOT Rhode Island Department of Transportation
RIDMV Rhode Island Division of Motor Vehicles
RIIL Rhode Island Interscholastic League
RIMPA Rhode Island Municipal Police Academy
RIPCA Rhode Island Police Chiefs Association
RIPTIDE Rhode Island Police Teaming for Impaired Driving Enforcement
RISP Rhode Island State Police
SADD Students Against Destructive Decisions
SAFETEA-LU Safe, Accountable, Flexible, and Efficient Transportation Equity Act: A Legacy for Users
SFST Standardized Field Sobriety Testing
SHSP Strategic Highway Safety Plan
SIDNE Simulated Impaired Driving Experience
TOPS Traffic Occupant Protection Strategies
TRCC Traffic Records Coordinating Committee
TSRFT Traffic Safety Resource Forensic Toxicologist
TSRP Traffic Safety Resource Prosecutor
URI University of Rhode Island
VMS Variable Message Sign
VMT Vehicle Miles Traveled

Rhode Island Highway Safety Plan | FFY 2018
1 Introduction to the Rhode Island Highway Safety Planning Process
Introduction to the Rhode Island Highway Safety Planning Process On behalf of the Rhode Island Highway Safety Representative and Director of the Rhode Island Department of Transportation (RIDOT) I am pleased to present the Federal Fiscal Year (FFY) 2018 Highway Safety Plan (HSP) for the State of Rhode Island.
As Chief of the Rhode Island (RI) Office of Highway Safety (OHS), a unit within the RIDOT, I am concerned by a small, yet significant increase in traffic fatalities in FFY 2016. Although we maintain a low five year trend in traffic fatalities any uptick in fatalities and/or serious injuries is concerning. We cannot celebrate any fatality number until it squarely rests on ZERO, especially since the majority of our crashes are due to dangerous driving behaviors.
As we plan for FFY 2018 we do so by incorporating additional partners and a laser focused strategy to decrease our impaired driving fatalities which continue to represent more than one third of our Rhode Island fatalities. The programs and projects outlined in this report are aligned with the strategies included in the state Strategic Highway Safety Plan (SHSP) and the Highway Safety Improvement Plan (HSIP). The Rhode Island SHSP is now coordinated and facilitated through the OHS. This ensures alignment of the HSP with the SHSP and emphasizes coordinated performance measures throughout all safety issue areas. The SHSP is being reviewed, reinforced, and extended within FFY 2017. It is our goal to create a distinct and workable linear correlation between this FFY 2018 HSP and our 2017-2022 SHSP.
In FFY 2016 OHS facilitated three National Highway Traffic Safety Administration (NHTSA) led safety issue assessments. We have adopted many of the assessment recommendations and look to include some within the newly revised SHSP and future HSPs. In order to meet some of the essential recommendations we will continue to rely on assistance from our stakeholder partners.
We continue to implement a compressive prevention approach which includes a media component. During the end of FFY 2016 we were very concerned regarding the previously mentioned uptick in fatalities. The OHS team and leadership within the RIDOT decided to riddle the end of the year with every prevention strategy we had at our disposal. We made great use of our statewide safety message boards which ran unique, yet direct, safety messages during the Holiday Season. We also worked with a RI based media team to create a campaign called #beyondthecrash which speaks to the ripple effects of impaired driving. This social media campaign witnessed 2 million hits and several thousand shares. It was later awarded a New England Emmy for its superb messaging impact. Although it may only be offered as anecdotal proof, RI witnessed two less fatalities during our 2016 holiday season than we saw during our 2015 holiday season. We layered the media program with our high visibility enforcement campaign and our ongoing education efforts. The public’s reaction was intense and positive.

Rhode Island Highway Safety Plan | FFY 2018
2 Introduction to the Rhode Island Highway Safety Planning Process
Impaired Driving and our safety efforts in general stood out among the drowning sound of commercialism. It was a team effort, internally and externally and I’m proud that it was RIDOT/OHS who led the way. The extension of that program is outlined in our media programs within our FFY 2018 plan.
The entire staff of the OHS and the leadership of the RIDOT remain committed to building the most comprehensive and effective traffic safety program in the country. Our safety partners are also committed to our mission of moving Rhode Island Toward Zero Deaths.
1.1 Mission Statement The RIDOT OHS is the agency responsible for implementing Federally-funded highway safety projects in Rhode Island. As a fundamental component of improving the quality of life for the citizens and visitors to the State, the mission of the OHS consists of two goals:
1. Reduce the number of fatalities and serious injuries on Rhode Island roadways.
2. Reduce the number of traffic crashes and the severity of their consequences.
The OHS provides the required resources to plan and carry out activities to fulfill this mission. To ensure effectiveness, relationships are developed and maintained with advocacy groups, citizens, community safety groups, complementary state and Federal agencies, and local and state police departments. The OHS conducts data analysis to monitor crash trends in the State and ensure state and Federal resources target the areas of greatest need. In FFY 2017 the OHS assumed the lead in the development and implementation of the State SHSP, providing expertise related to driver behavioral issues, education, and enforcement-related countermeasures. The OHS works closely within the RIDOT to ensure coordination between the HSP and the SHSP, ideally resulting in one comprehensive and strategic highway safety program for the State. Figure 1.3 illustrates the relationship between the SHSP and the engineering counterpart to the HSP, the HSIP. While the relationships will not change, the Emphasis Areas listed for the SHSP reflect those adopted in the SHSP most recently amended in October 2014. The newest SHSP is for the five-year period between 2017 and 2022. This FFY 2018 SHSP is intended to align with the goals, strategies, and emphasis areas to be adopted by the 2017-2022 SHSP.
The OHS establishes and implements a comprehensive program to accomplish its goals effectively. The HSP for FFY 2018 describes the process used to identify specific highway safety problem areas, including the development of countermeasures to correct those problems, and processes to monitor the performance of those countermeasures.

Rhode Island Highway Safety Plan | FFY 2018
3 Introduction to the Rhode Island Highway Safety Planning Process
Figure 1.1 Fatality Trends and Projections
Source: RIDOT/OHS (2017) and FARS (2017). Note: 2016 values are preliminary
Figure 1.2 Serious Injury Trends and Projections
Source: RIDOT/OHS, 2016. Note: Beginning in 2013, RIDOT transitioned to reporting a 5-year average annual crashes rather than a 3-year average as more
data became available. 2016 values are preliminary
66 64 65 51 45
70 69 69
63
58
51
55
53
0
10
20
30
40
50
60
70
80
2011 2012 2013 2014 2015 2016 2017 2018
Crashes
Fatalities (Actual) 5‐Yr Average Trend 5‐Yr Average Target
455
422
366
438
427
494473
454 445422
491
429
373
0
100
200
300
400
500
600
2011 2012 2013 2014 2015 2016 2017 2018
Crashes
Serious Injuries Average Trend 5‐Yr Average Target

Rhode Island Highway Safety Plan | FFY 2018
4 Introduction to the Rhode Island Highway Safety Planning Process
Figure 1.3 RIDOT Highway Safety Program Relationship System

Rhode Island Highway Safety Plan | FFY 2018
5 Introduction to the Rhode Island Highway Safety Planning Process
1.2 Organization and Staffing Figure 1.4 shows the RIDOT OHS organizational chart. In addition to operational and administrative tasks, each OHS Program Coordinator is responsible for overseeing specific programs and emphasis areas which promote identified countermeasures to enhance highway safety across the State. The program areas addressed by OHS are assigned to Program Coordinators based on their individual safety training and the capacity of the OHS, as noted below. As discussed with the NHTSA Region 1 office, we will assure that all OHS personnel attend the United States Department of Transportation (USDOT) Transportation Safety Institute (TSI) training at least every five years to keep up to date with the latest changes on program policies and Federal legislation.
Figure 1.4 RIDOT OHS Organizational Chart

Rhode Island Highway Safety Plan | FFY 2018
6 Introduction to the Rhode Island Highway Safety Planning Process
OHS Personnel
Gabrielle M. Abbate Chief of Highway Safety
Ms. Abbate became the Chief of the OHS in November 2014. Before coming to the OHS Ms. Abbate was employed by Mothers Against Drunk Driving (MADD) for 25 years as their Executive Director in Rhode Island. She currently oversees the development, implementation, and evaluation of Rhode Island’s HSP and the programs listed within its scope. Ms. Abbate and the OHS also work to support the SHSP within the RIDOT.
NHTSA and Governors Highway Safety Association (GHSA) courses:
Highway Safety Program Management, 2015 Managing Federal Finances, 2015
GHSA Executive Seminar, 2015 Impaired Driving, 2016
Marijuana Regulation summit, 2016
James Barden, Jr. Highway Safety Program Coordinator
Mr. Barden has been a Highway Safety Program Coordinator with OHS for the past 14 years. He has the longest institutional knowledge and relationship with the NHTSA Regional Office in Cambridge, Massachusetts. He has garnered their respect and acknowledgment for his capabilities, knowledge and skills and serves as the point person for all staff on programming and procedural issues. Mr. Barden is a trained Child Passenger Safety Technician (CPST) and a Traffic Occupant Protection Strategies Instructor (TOPS).
Mr. Barden coordinates the Occupant Protection and Impaired Driving Programs. He also manages all the media purchases for the office. He is the current chairman of the Rhode Island SHSP Occupant Protection Subcommittee.
NHTSA and GHSA courses:
Highway Safety Program Management (3), 2014
Managing Federal Finances, 2007 Data Analysis, 2008
Instructor Development, 2010
Impaired Driving, 2007 and 2015
Occupant Protection (2), 2010 and 2014
Traffic Occupant Protection Strategies, 2000
Child Passenger Safety Technician Certification, 2000, 2007, and 2016
Media Skills Workshop, 2001
Communications Workshop, 2007
Public Information Officer (2), 2010
Ignition Interlock Institute, 2011
Simulated Impaired Driving Experience, 2013
Marijuana Workshop, 2013
Highway Safety Program Management, 2006
Managing Federal Finances, 2007
Data Analysis, 2008 Instructor Development, 2010
Motorcycle Safety Program Management, 2009
Speed Management, 2011
GHSA Executive Seminar, 2013

Rhode Island Highway Safety Plan | FFY 2018
7 Introduction to the Rhode Island Highway Safety Planning Process
Kevin J Murphy Highway Safety Program Coordinator
Mr. Murphy has been a Highway Safety Program Coordinator since 2016. His responsibilities are related to this office’s community efforts and strategies. Mr. Murphy recently retired from a municipal Police Department heading up the Traffic Division for more than a decade. In addition to his enforcement responsibilities Mr. Murphy also was the lead crash reconstructionist for the department. Mr. Murphy was one of the first DRE drug recognition experts in the State. Prior to becoming a Police Officer Murphy was an Emergency Medical Technician, EMT-I. He now teaches Workzone Safety and Occupant Protection Strategies at the Municipal Police Academy. Murphy also is on staff at the Community College of Rhode Island where he is an instructor for the Teen Re-Education for Driving Safer, TREDS.
NHTSA and FHWA courses:
Highway Safety Program Management, 2017
Traffic Incident Management 2014
Occupant Protection Program Management 2017 Member of the following:
Incident Management Task Force Rhode Island Traffic Safety Coalition
Andrew Tainsh Highway Safety Program Coordinator
Mr. Tainsh has been a Highway Safety coordinator with the OHS since January 2017. He recently retired as a Captain from the Warwick R.I. Police Department. He is a Drug Recognition Expert Instructor, Standardized Field Sobriety Testing Instructor, Traffic Occupant Protection Strategies Instructor, and is also a Traffic Collision Reconstructionist. As a Program Coordinator Mr. Tainsh manages several community based organization’s grant activities, and also serves as a liaison between these groups and the OHS. Mr. Tainsh also coordinates the Speed and Pedestrian/Bicycle grant programs.
Member of the following: Rhode Island Traffic Safety Coalition Rhode Island Strategic Highway Safety Plan Management, 2017 Highway Safety Program Management, 2017
Diane Duhaime Supervising Accountant
Ms. Duhaime has been the Supervising Accountant within OHS for the last 5 years. She joined the RIDOT Financial Management Office 10 years ago. She has been instrumental in the changes to our financial system to track and report on a project basis instead of program basis in order to comply with MAP 21 requirements.
Ms. Duhaime ensures appropriate handling of all OHS requisitions, purchase orders, vendor payments, Oracle draft invoices for revenue and corresponding cash receipt vouchers through RIFANS, fund transfers, tracking of liquidation rates, reconciliation of the accounts, and revenue. She handles the Federal reimbursement vouchers processed with NHTSA. Ms. Duhaime also assists the OHS Supervisor in the development of our annual budget and tracking of the financial portion of the HSP and Annual Report (AR).
NHTSA courses:
Managing Federal Finances, 2010

Rhode Island Highway Safety Plan | FFY 2018
8 Introduction to the Rhode Island Highway Safety Planning Process
Sharon Bazor Principal Research Technician
Ms. Bazor has been with OHS for 18 years. She is the Principal Research Technician responsible for the Fatality Analysis Reporting System (FARS) as the FARS analyst and as such, she is responsible for gathering and reporting all motor vehicle-related fatalities within the State to NHTSA. This data is then utilized by NHTSA to develop their national analysis on crashes, including causation, trends, and potential programming. The data required for each crash comes from many sources, including crash reports, the medical examiner’s office, Department of Health (HEALTH) (Vital Records, Toxicology Laboratory), Emergency Medical Technician (EMT) Units, Department of Motor Vehicles (DMV), state and local police departments, and Attorney General’s Office. Due to different reporting time requirements for each agency, cases may not close out for many months. This information also is used by OHS to develop the yearly HSP and AR, as well as custom queries for other divisions within the RIDOT, DMV, law enforcement partners, media inquiries, and many of our stakeholders. Ms. Bazor is the main point person for the RIDOT in the development of any fatalities report.
NHTSA courses:
Managing Federal Finances (2), last time in 2010 FARS New Analyst Training, 2009
FARS System-wide Training, regularly attending since 2009
Colonel (Retired) Richard Sullivan Law Enforcement Highway Safety Training Coordinator
Colonel Sullivan is a retired Colonel of the Providence Police Department. He joined OHS as the Law Enforcement Highway Safety Training Coordinator (LEHSTC) in 2006. RIDOT OHS currently funds his salary through the Rhode Island Municipal Police Academy. As law enforcement liaison between RIDOT OHS and the state enforcement agencies, Colonel Sullivan performs the following activities:
Traffic Safety Coalition tri-chair. Tri-chair to the newly formed Impaired Driving Task Force.
Liaison for the Rhode Island Police Teaming for Impaired Driving Enforcement (RIPTIDE), speed, texting and occupant protection grants, and Variable Message Signs (VMS).
Rhode Island Drug Recognition Expert (DRE) Coordinator. Responsible for the 52 existing DREs, ensuring that they are updated on the latest impaired driving information, as well as keeper of records for the DRE (eight-hour in-service requirement), evaluations conducted on impaired drivers, and maintaining the International Association of Chiefs of Police (IACP) database. Responsible for 15 DRE instructors to ensure they are on call and available for
other DREs to assist in investigations. Responsible for all aspects of training, travel, lodging, applications, interviews,
etc., for all DRE candidates.
Coordinate all aspects of SFST Schools, DRE Schools, and DRE Instructor Schools to include manuals, travel, reimbursements, hotels, light lunch, and printing.
Rhode Island Advanced Roadside Impaired Driving Enforcement (ARIDE) Coordinator, to ensure the same requirements as DRE (stated above). ARIDE is the “bridge” between the SFST and DRE trainings.

Rhode Island Highway Safety Plan | FFY 2018
9 Introduction to the Rhode Island Highway Safety Planning Process
Rhode Island SFST Coordinator, responsible for the three-year in-service training for 23 instructors, as well as ensuring that up-to-date materials are utilized in current training.
Rhode Island TOPS training, police academies recruit training, as well as in-service.
Rhode Island coordinator for Saved by the Belt with law enforcement.
Rhode Island coordinator for Law Enforcement Challenge (officer and department recognition awards) Highway Safety Champion Award.
Rhode Island Coordinator of the Drug Impairment Training for Educational Professionals (DITEP) (not compensated with NHTSA funds).
Rhode Island coordinator for the Data-Driven Approach to Crime and Traffic Safety (DDACTS).
Assistance Coordinator for the High School Buckle Up Shuffle Seat Belt Challenge.
Oversee police departments’ involvement in child passenger safety (CPS) programs and training.
Instruct Law Enforcement in the Older Driver NHTSA training (not compensated with NHTSA funds).
Liaison with Community College of Rhode Island (CCRI) in DWI, Motorcycle, Student Driver Education, Driver Improvement Program, and Offenders Alcohol School (not compensated with NHTSA funds).
Liaison with RIDOT’s OHS on all aspects of law enforcement involvement of the safety programs; press events; weekly, monthly, and special holiday enforcement campaigns; as well as schedule annual meetings as well as midyear meetings.
Liaison with MADD for victim ride-alongs and press events.
NHTSA Region 1 liaison for Rhode Island training, speed management, media, instructor development, occupant protection, and national LEL training.
Member of the following: TRCC Rhode Island SHSP Colin Foote Law (habitual offender) retraining Committee Rhode Island Marijuana Attorney General’s Marijuana Task Force
John Corrigan Traffic Safety Resource Prosecutor (TSRP)
Mr. Corrigan is a prosecutor within the Rhode Island Attorney General Office who joined the OHS team in March 2016. In addition to serving as TSRP, he is also Chief of the District Court Unit and oversees department prosecutions at the Rhode Island Traffic Tribunal. He was formerly Chief of the Newport County office. He has conducted trainings for more than ten years in conjunction with the Department of Health at the RI Municipal Police Academy concerning driving under the influence (DUI) and chemical test refusal prosecutions. He has multiple years of litigation experience and personally prosecutes DUI cases in Providence County. RIDOT OHS funds two-thirds of his salary. Mr. Corrigan implements training programs for prosecutors and law enforcement to improve prosecution rates in DUI cases, and assists RIDOT OHS in evaluating the impact of Rhode Island’s highway safety efforts. The TSRP also secures and tracks important court related data which includes ignition

Rhode Island Highway Safety Plan | FFY 2018
10 Introduction to the Rhode Island Highway Safety Planning Process
interlock sanctions, as well as, all dispositions and sanctions related to court proceedings. Mr. Corrigan performs the following duties:
RIDOT OHS Traffic Safety Resource Prosecutor.
Part of the DRE training team. “It Can Wait” distracted driving campaign speaker.
Member of the following: Traffic Records Coordinating Committee (TRCC) Rhode Island SHSP Rhode Island Traffic Safety Coalition RIDOT/OHS/Rhode Island State Police (RISP) Impaired Driving Prevention
Alliance
Implements training programs for prosecutors, law enforcement, and the judiciary to improve prosecution rates in DUI cases, and assists RIDOT OHS in evaluating the impact of Rhode Island’s chemical test refusal law on impaired driving arrest rates.
As noted previously, RIDOT OHS is funding a LEHSTC through the Rhode Island Municipal Police Academy. The LEHSTC, Colonel Sullivan, works with law enforcement agencies and the TSRP, John Corrigan, for all enforcement campaigns and essential training programs.
Lynn Bassignani Administrative Assistant
Ms. Bassignani is the support staff within the Office of Highway Safety, and specifically serves as assistant to the Supervisor of OHS. She coordinates meetings, prepares documents for media buys, produces draft and final copies of correspondence.
Lynn initializes grantee awards by processing requisitions and preparing grantee award letters. She also is involved in preparing and processing paperwork like financial forms, travel reimbursements, requisitions and ordering office supplies. Ms. Bassignani is responsible for establishing and maintaining the OHS central program files.
Ms. Bassignani also assists with outreach events. Coordinates the time sheets for all staff and processes interoffice communications for the chief. She is the point person for the Supervisor on day to day operations and the necessary administrative duties to support the office.

Rhode Island Highway Safety Plan | FFY 2018
11 Introduction to the Rhode Island Highway Safety Planning Process
1.3 Timeline and Planning Purpose The RIDOT OHS conducts transportation safety planning year round. Emerging trends and safety needs are identified through data monitoring and outreach to key safety stakeholders. Table 1.1 describes the OHS planning cycle.
Table 1.1 Rhode Island Office on Highway Safety Annual Safety Planning Calendar
Month Activities
January-March Staff conducts grant oversight and monitoring visits.
Section 405 grant application preparation.
Plan spring and summer safety campaigns to include outreach that complements the work in all Rhode Island municipalities.
February-April Staff conducts data collection, grant oversight and monitoring.
Develop all the activities to support the national Click It or Ticket (CIOT) campaign in May.
Staff conducts strategic planning and sessions with key stakeholders to review recent crash trends and emerging issues and to create project proposals within each program area.
Applications and instructions for Grant Funding (HS 1) proposals are issued based on the projected availability of Federal funding to state agencies, law enforcement agencies, and community stakeholders and advocates.
May-June Submitted Grant applications are reviewed by the OHS team. Applications which support targets and performance measures are approved as submitted or returned for modifications.
A draft of the HSP is prepared for review and approval by OHS staff. Staff prepares Sections 405 grant applications.
Staff supports all activities to support the national “Drive Sober or Get Pulled Over” (DSoGPO) and Border to Border Campaigns.
July The final HSP is submitted to NHTSA. Meetings are held with potential grantees.
August-September
Request for Proposals (RFP) are issued or received based on availability of Federal funding. FFY 2018 grants and contracts are finalized.
Staff conducts activities to support the “Drive Sober or Get Pulled Over” campaign (conducted in late August through Labor Day).
October Begin work on the FFY 2017 Annual Report.
November-December
The FFY 2017 Annual Report is finalized. The OHS administers closeout of the prior fiscal year. OHS collects and reviews reports from its grantees. Occasionally, OHS revises grant applications and awards with its grantees based on the availability/timeliness of Federal funding.

Rhode Island Highway Safety Plan | FFY 2018
12 Introduction to the Rhode Island Highway Safety Planning Process
Strategic Partners and Stakeholders
During this planning cycle, OHS contacted safety stakeholders to share information on safety problems and effective countermeasures being implemented by other agencies. The OHS staff also offered our partners updated data and grant application guidance. Opportunities to enhance partnerships and collaboration also were identified. The list of stakeholders is provided below:
› American Automobile Association, Southern New England (AAA)
› Bike Newport
› Brain Injury Association of Rhode Island (BIARI)
› Community College of Rhode Island (CCRI)
› Connecting for Children and Families, Inc. – Woonsocket COZ Safe Communities (CCF)
› Cranston Child Opportunity Zone (COZ)
› Mothers Against Drunk Driving (MADD)
› Oasis International
› Rhode Island Bike Coalition
› Rhode Island Department of Revenue, Division of Motor Vehicles (RIDMV)
› Rhode Island Department of Health – Prevention and Control
› Rhode Island Department of Behavioral Healthcare, Developmental Disabilities and Hospitals (BHDDH) Rhode Island Hospital Injury Prevention Center
› Rhode Island Hospital – Injury Prevention Center
› Rhode Island Hospitality and Tourism Association – Rhode Island Hospitality Association Education Foundation
› Rhode Island Motorcycle Association
› Rhode Island Municipal Police Academy
› Rhode Island Office of the Attorney General
› Rhode Island Police Chiefs Association (RIPCA)
› Rhode Island State Police (RISP)
› Rhode Island Student Assistance Services (RISAS)
› Rhode Island Traffic Tribunal
› Riverzedge Arts
› Nobidade TV
› The Genesis Center
› Young Voices
› Statewide Substance Abuse Task Forces

Rhode Island Highway Safety Plan | FFY 2018
13 Introduction to the Rhode Island Highway Safety Planning Process
In addition to these stakeholders, the OHS works with numerous other agencies and organizations throughout the year:
› 38 local police departments
› AMICA Insurance
› Federal Highway Administration (FHWA)
› Federal Motor Carrier Safety Administration (FMCSA)
› Rhode Island Judiciary
› Motorcycle retail and repair representatives
› National Highway Traffic Safety Administration (NHTSA)
› Rhode Island Association of Independent Insurers
› Rhode Island Department of Corrections (DOC)
› Rhode Island Interscholastic League (RIIL)
› Rhode Island Safe Kids Coalition
› Students Against Destructive Decisions (SADD)
› University of Rhode Island (URI)
Grant Funding Process
Currently, the two methods for awarding a grantee funding for projects to support the OHS efforts include a Highway Safety Grant application (HS-1) or a response to a RFP.
Normally the OHS invites all stakeholders to an introductory meeting in early spring. During the course of the two-hour meeting OHS offers an explanation of the grant funding process. Program Coordinators are introduced and offer more in-depth information regarding application criteria and funding cycles and processes. A developed PowerPoint is shown which depicts the process and offers concrete examples of important grant components. This year the OHS decided that all highway safety stakeholders would receive a letter of explanation detailing the grant application process with attachments previously offered at the meeting. Assistance for grant preparation was offered if needed.
The OHS received multiple grants from new and past grant sub-recipients. Some of the applicants include law enforcement agencies, community advocates, state agency representatives, minority community advocates, and substance abuse prevention specialists. Each stakeholder received attachments which included a new condensed application, application instructions, budget sheet, and a PowerPoint listing target audiences, performance measures, and updated fatality and serious injury data. They also received copies of NHTSA countermeasures and the 2017 HSP. This was the second year that grant submissions were accepted on-line into a secured DOT electronic mailbox. OHS staff worked as a unit to create a streamlined process that benefits both the state and its sub-recipients. A due date for submissions was offered and stakeholders were told incomplete grant submissions would not be accepted.
Once applications are received they are reviewed by the Chief of Highway Safety and the OHS team which consists of program coordinators, financial accountant, and the Rhode Island LEL. The OHS staff applies the guidelines within a listed criteria sheet to score each application. Every applicant is required to provide a data-driven problem identification statement, project description, potential outcomes, and a description of how the goals and
Rhode Island Highway Safety Plan | FFY 2018
14 Introduction to the Rhode Island Highway Safety Planning Process
outcomes will be measured. Grantees must also provide a detailed budget, including the source of all funding, and any matching funds, which may be required.
Applications may be approved or rejected immediately or an applicant may be asked to offer additional modifications/revisions for review. Once these grant revisions are received the OHS staff will review the revised application. Each grantee will also be held to Rhode Island risk assessment criteria. Those standards include the sub-recipient’s financial systems, accurate and timely submissions of their application, any amendments made, fiscal reporting, and their submitted budgets. We will review their prior experiences with similar and past OHS sub-awards, as well as, any previous audit results. For monitoring purposes, a sub-recipient will be considered low risk for monitoring if they receive a low grade on the assessment criteria, a medium risk if they receive a higher assessment and a HIGH risk if the criteria standards show them to be at a high level during their pre-award assessment. All grantees will be subject to the risk assessment process.
When the proposed program, along with its attached budget, has been approved OHS staff determine if the goods or services can be provided by any other entity. If these services cannot be provided by others (excluding state and municipal agencies), a grant can be issued after a Grants and Assurances document has been signed by the grantee.
All grantees are required to provide monthly reports to their designated OHS Program Coordinator, including invoices, timesheets, and additional backup documentation necessary for monitoring, reporting, and oversight of program areas. Field visits are required for evaluation of the effectiveness of the program and to ensure that appropriate State and Federal procedures are being followed.
OHS grant partners are essential for the ultimate success of the Rhode Island HSP. They develop, implement, and evaluate programs designed to target Highway Safety Performance Measures and Outcomes. The OHS grant application funding process for projects is shown in Figure 1.5.

Rhode Island Highway Safety Plan | FFY 2018
15 Introduction to the Rhode Island Highway Safety Planning Process
Figure 1.5 OHS Application Process
Other Funds
RIDOT/OHS and Local Law Enforcement
Thousands of dollars in state and local funding are provided to state and local law enforcement agencies to enforce traffic laws and conduct safety educational initiatives throughout the year. Enforcement includes speeding, seatbelt use, impaired driving, distracted driving, and liquor license compliance laws. Many departments promote and sustain on-line ARIDE training for all officers which affords more officers an introduction to drugged driving.
› The RISP and U.S. Attorney have created and facilitated educational presentations that attempt to make educators and school aged children more aware of the harmful effects of these legal and illegal substances and how they impact their personal and community safety. Many communities arrange community forums to get the message out and generate conversation on the effects drugs have on driving. RIDOT and OHS are often invited to speak on safety initiatives at these forums.
› Police departments across the State conduct year round outreach within middle schools and high schools across the State. School Resource Officers and other law enforcement agency representatives promote occupant protection, underage drinking education, impaired driving, and distracted driving concerns.
› Police conduct in-service training year round on impaired driving, occupant protection, speed, and distracted driving best practices and approved protocols.
› Due to some high-profile Wrong Way Driving crashes OHS worked with local and state police to create a protocol of action which compliments new infrastructure improvements on many of our busiest state highway exits and entrances. This mitigation effort is a continuing program with tests being conducted regularly on installed safety tools.

Rhode Island Highway Safety Plan | FFY 2018
16 Introduction to the Rhode Island Highway Safety Planning Process
› Our state and local agencies provide Traffic Incident Management (TIMS) statewide training for police, fire, RIDOT, DPW, RIPTA, EMS, DOH which OHS supports but does not fund or staff.
› Ongoing statewide SFST and breathalyzer updates are offered to every police department, every year as part of their certification.
› Local police departments conduct ‘safety days,’ Night Out Programs in several communities and offer OHS the opportunity to share important highway safety education.
RIDOT/OHS and High Schools
The High School Driver Education Program – whereby 7,500 students are taught about highway safety and several also bring in police and other guest speakers.
› Rhode Island’s Attorney General and AT&T provide the It Can Wait distracted driving program across the State to any high school which requests it at no cost to the high school. The program is funded through AT&T.
› The Tori Lynn Andreozzi Foundation funds several police department safety initiatives and offers presentations through the Rhode Island Brain Injury Foundation and MADD.
› The DeCubellis Foundation creates safety messages which mirror and complement those we use at the OHS to serve compelling testimony to not drink and drive.
› AAA has created several award categories for enforcement in the areas of pedestrian safety, speed safety, and impaired driving initiatives. They also conduct older driving programs and include RIDOT and OHS in their efforts to support safe senior driving.
OHS and Media
Although Rhode Island OHS budgets fund numerous national and local media campaigns, our funds are complemented with several additional earned media highlights featuring crashes, safety messaging, and violation and fatalities and serious injury arrests that serve as awareness and deterrent messages.
OHS contracts with the PawSox organization in order to highlight our Occupant Protection and Impaired Driving messages. As an added value to the contract they hold a safety night for RIDOT. The RIDOT Director is invited to throw out the first game ball and offer scripted safety messages via their video broadcasting. It offers a public forum that speaks to families but more importantly to our target audience of males between the ages of 30-50.

Rhode Island Highway Safety Plan | FFY 2018
17 Introduction to the Rhode Island Highway Safety Planning Process
In FFY 2017 we partnered with Rhode Island State Police to create a holiday awareness campaign called #beyondthecrash. It was a social media campaign but we also purchased cinema space. It was well received and increased everyone’s attention to the impaired driving problem and solutions. It has been nominated for an EMMY. In FFY 2018 we are planning to develop the identical campaign to include not only law enforcement voices but those of parents, medical professionals, victims, and offenders. We think it would increase ownership of the problem and awareness of the problem.

Rhode Island Highway Safety Plan | FFY 2018
18 Introduction to the Rhode Island Highway Safety Planning Process
OHS and AAA
The following safe driving projects promoted and implemented by AAA address older driver fatalities and serious injuries. The OHS supports these programs and will fund additional staff training and the development of additional OHS projects supported with NHTSA funds in future years. In FFY 2018 AAA has invited the OHS to partner with them to create a senior driver summit in order to promote safety programs directed towards seniors as well to complement the strategies of older drivers included with our SHSP emphasis area.
› Driver Improvement for Mature Operators: This program is a 6- to 8-hour defensive driving class. Rhode Island insurance companies offer a reduction or rebate for drivers 55+ who complete the course. The class reviews changes in traffic laws (such as Slow Down, Move Over, primary belt, etc.) as well as risks common to older drivers. The curriculum also addresses changes in roadway engineering, vehicle design, and traffic control devices.
The Older and Wiser Driver: A very popular program, frequently delivered at senior centers of community or service groups. It is offered as a 1-hour program addressing the changes (physical and neurological) that come with age and how drivers must compensate for those changes. We often adapt this program to meet the needs of the community or practical information such as driving in winter weather. We also can extend this program to walk seniors through a 30-minute on-line evaluation (Roadwise Review).
Keeping The Keys: Through this program AAA educates and assists families in creating a plan for mobility for aging relatives. This program encourages seniors to write a “contract” to address limiting their driving or “retiring” from driving and their mobility needs. Families will work together to ensure that the senior has a ride or mode of transportation to meet their needs (including social, spiritual, and physical).
Countermeasure and Strategy Selection Process
During the grant planning OHS staff conducts strategic planning/listening sessions with stakeholders to review recent crash trends and emerging issues, gather input on safety problems, and discuss effective countermeasures being implemented by other agencies. The OHS relies heavily on support and partnerships derived from our involvement in the Rhode Island Traffic Safety Coalition. Being active members of the Coalition offers the opportunity to listen to a diverse group of people committed to traffic safety efforts in several different ways and at several different levels. This group offers insights into how OHS can support Rhode Island HSP in an efficient and effective manner. The coalition membership includes professionals from AAA, AMICA Insurance, RISP, municipal law enforcement officers, MADD, pedestrian and bicycling advocates, representatives from FHWA, substance abuse prevention and treatment specialists, hospital personnel, NHTSA, and members of the Rhode Island Motorcycle Association. In addition, the Occupant Protection Coordinator serves as team leader for the SHSP Occupant Protection emphasis area, and the staff are active members of the Impaired Driving, Young Driving, and Speed emphasis areas where they are focused on addressing the most significant traffic safety issues in the State. These experiences, coupled with the staff’s knowledge of the data,

Rhode Island Highway Safety Plan | FFY 2018
19 Introduction to the Rhode Island Highway Safety Planning Process
literature, and the State cultural and political climate all serve to inform the selection of countermeasures and strategies for the HSP.
Section 4.0 shows what activities will take place in FFY 2018 by program area. Each section contains a description of the problem using state crash and demographic data that justifies inclusion of the program area, and guides the selection and implementation of countermeasures to address the problem in a way that is specific to Rhode Island. Countermeasures are activities that will be implemented in the next FFY by the highway safety office and the safety partners. The selected countermeasures are proven effective nationally, have been successful in Rhode Island, and are appropriate given the data in the problem identification and the resources available. The OHS used the Countermeasures that Work (CTW): A Highway Safety Countermeasure Guide for State Highway Safety Offices, 8th Edition, 2015 as a reference in the selection of effective, evidence-based countermeasure strategies. The 2015 edition of Countermeasures That Work can be viewed in its entirety on the NHTSA web site at: http://www.nhtsa.gov/staticfiles/nti/pdf/812202-CountermeasuresThatWork8th.pdf.
1.4 Coordination with Strategic Highway Safety Plan The OHS has been an active partner in the Strategic Highway Safety Plan (SHSP) process since the development of the first plan in 2006. The 2017-2022 SHSP focuses on the following ten emphasis areas:
› Impaired Driving
› Occupant Protection
› Older Drivers
› Vulnerable Road Users (pedestrians, bicyclists, motorcyclists, work zones)
› Younger Drivers
› Distracted Driving
› Speed
› Traffic Incident Management
› Data
› Infrastructure (Intersections and Run Off the Road)
This list of emphasis areas includes three new emphasis areas not formally considered as part of the October 2014 amended SHSP: Distracted Driving, Traffic Incident Management, and Data. Additionally, the scope of the Vulnerable User emphasis area has been expanded to include motorcycles and work zones.
OHS staff are members of the SHSP Steering Committee and in many cases serve as team leaders for the Impaired Driving, Occupant Protection, Older Driver, Vulnerable Road User, Younger Driver, Distracted Driving, Speed, Traffic Incident Management, and Data emphasis areas. The OHS will continue to adopt Toward Zero Deaths (TZD) as a goal for the plan.

Rhode Island Highway Safety Plan | FFY 2018
20 Introduction to the Rhode Island Highway Safety Planning Process
Data availability, access points, and integration continue to challenge the state. Through the SHSP update process interest addressing the following data gaps and deficiencies were apparent:
› In Rhode Island fatality numbers are relatively low and do not necessarily show the complete picture.
› No way of integrating available data in Rhode Island (e.g., obtaining information from hospitals and integrating it into the system).
› Generally flawed injury data because severity is based on a subjective determination by an officer on the scene.
› Lack of serious injury data for speed-related crashes (During calendar year 2016 RIDOT has begun manually reviewing all serious injury crashes to fill this data need).
› Lack of roadway/roadside inventory data for selecting and implementing infrastructure type improvements (During calendar year 2016 RIDOT has begun manually reviewing all serious injury crashes to fill this data need).
› Incomplete or nonexistent toxicology reports for impaired driving-related crashes, making serious injury numbers virtually useless.
› Lack of data on contributing factors in run-off-road fatalities, which account for more than 50 percent of the total fatalities (During calendar year 2016 RIDOT has begun manually reviewing all serious injury crashes to fill this data need).
› Lack of data obtained in the field by enforcement agencies for distracted driving.
The Steering Committee discussed several options to address these data deficiencies, including making data an emphasis area; forming a task force that is not an emphasis area, but rather takes on the issue to come up with specific solutions; or having the TRCC handle the data deficiency issues as part of their work. The final decision was to have the TRCC handle this issue. The TRCC coordinator is a member of the SHSP Steering Committee, team leader for the Data emphasis area, and attends all meetings.
The behavioral goals, strategies, and action steps in the Rhode Island SHSP reflect the activities and programs in the HSP and the HSIP. The goal for the Rhode Island SHSP is Toward Zero Deaths. A number of the strategies and action steps in the SHSP reflect OHS programs and activities. During FFY 2017 OHS assumed the lead in developing and implementing this extension of the SHSP. Following is a sampling of this coordination which shows the amended October 2014 SHSP action step and the role of OHS:
› Impaired Driving: Broaden public awareness of the dangers of drinking and driving:
Continue and enhance High-Visibility Enforcement campaigns (i.e., Drive Sober or Get Pulled Over). Impaired driving patrols (including B.A.T. Mobile), with support from OHS, continue during NHTSA High-Visibility Enforcement (HVE) periods and many departments conduct patrols on a weekly basis.
Conduct additional outreach and education programs for the hospitality industry (e.g., over serving programs via merchants associations and insurance companies). OHS put together a Designated Driver program with clubs in downtown Providence which kicked off on March 17, 2013. The program was repeated this year on March 13 with an increased participation of more night clubs.

Rhode Island Highway Safety Plan | FFY 2018
21 Introduction to the Rhode Island Highway Safety Planning Process
The OHS will leverage HSIP data identifying high risk ramps for WWD to inform enforcement location decisions.
› Occupant Protection: Increase enforcement of occupant protection laws:
Conduct 24-hour occupant enforcement programs, including CIOT. Thirty-eight communities received safety belt grants from OHS. OHS has completed a survey that reported 88 percent compliance statewide.
Increase the number of collected seat belt citations, use e-citation where possible, and make sure law enforcement officers notify drivers of the required court appearance for a third violation.
› Young Drivers: Increase public outreach and education on the basics of roadway safety aimed at drivers age 16 to 24:
Develop a media campaign that reinforces safe driving among young drivers focusing on safety belts, impaired driving, speed and distracted driving, and utilize media outlets used by the target population (e.g., social media).
› Speed: Improve the collection of speed and aggressive driving-related data:
Develop a method to collect speed and aggressive driving-related data from crash reconstruction reports on fatal and serious injury crashes and forward data to RIDOT.
› Vulnerable Road Users: Target pedestrian initiatives at the 21 through 55 age population that is experiencing the greatest number of pedestrian fatalities and serious injuries. Educate all road users about the unique safety needs of vulnerable road users (pedestrians, bicyclists, moped users).
Develop educational materials that are focused at individuals age 21 through 55, i.e., use insurance companies and the workplace to deliver information.
Work with local communities to improve enforcement and educational initiatives in their Pedestrian Safety Action Plans as well as the Statewide Vulnerable Road Users Safety Plan which includes municipal examples.
› Aging Road Users: Identify mechanisms and methods to do outreach and education to the aging road user community.
Develop and distribute an Older Driver guidebook that provides essential information to aging road users.
Educate aging road users about the dangers of distracted driving particularly cell phone use and hands-free devices.
The OHS will leverage HSIP data identifying high-density older driver communities to inform education target location decisions.
Beginning with this Highway Safety Plan, OHS will begin to align behavioral goals, strategies, and action steps with the 2017-2022 Rhode Island SHSP. The goal for the Rhode Island SHSP continues to be Toward Zero Deaths. Section 4.0 of this document highlights strategies that align the FFY2018 HSP with the 2017-2022 SHSP.

Rhode Island Highway Safety Plan | FFY 2018
22 Introduction to the Rhode Island Highway Safety Planning Process
This page intentionally left blank.

Rhode Island Highway Safety Plan | FFY 2018
23 FFY 2016 Performance Report
FFY 2016 Performance Report Table 2.1 provides the results of Rhode Island progress in meeting the core (shaded areas) and secondary performance measures identified in the FFY 2017 HSP. Targets for core performance measures are set for five-year average fatalities over the period 2013 to 2017.
Table 2.1 Progress in Meeting FFY 2017 Performance Targets
Program Area Performance Measure Performance Target Realized a
OHS Program Goals
C-1
Reduce traffic fatalities
Reduce the five-year average traffic fatalities by 9 percent
Baseline: 63 fatalities (2010-2014)
Target: 57 fatalities (2013-2017)
Preliminary data indications
2016: 51 fatalities
2012-2016 average: 55 fatalities
Average trending downward
C-2
Reduce serious injuries (SI)
Reduce the five-year average serious injuries by 16 percent
Baseline: 451 SI (2010-2014)
Target: 379 SI (2013-2017)
Preliminary data indications
2016: 491 SI
2012-2016 average: 429 SI
Average trending downward
C-3
Reduce the rate of traffic fatalities per 100 million vehicle miles traveled (VMT)
Reduce the five-year average traffic fatalities per 100 million VMT by 14 percent
Baseline: 0.80 (2010-2014)
Target: 0.69 (2013-2017)
Preliminary data indications
2016: 0.65 fatalities per 100M VMT
2012-2016 average: 0.71 fatalities per 100M VMT
Average trending downward
Occupant Protection
C-4
Reduce unrestrained occupant fatalities
Reduce the five-year average unrestrained occupant fatalities by 5 percent
Baseline: 20 fatalities (2010-2014)
Target: 19 fatalities (2013-2017)
Preliminary data indications
2016: 14 fatalities
2012-2016 average: 16 fatalities
Average trending downward
B-1
Increase observed seat belt use
Increase observed seat belt use
Baseline: 86.7 percent (2015)
Target: 90 percent (2013-2017)
2016: 87.5 percent
Survey indicates upward trend
Increase safety belt use among pickup truck drivers
Increase pickup truck driver safety belt usage
Baseline: 72.3 percent (2015)
Target: 80 percent (2017)
Observed pickup truck drivers safety belt use
2016: 76.7 percent
Survey indicates upward trend
Increase perception of being ticketed for failure to wear safety belts “always” or “nearly always”
Increase public perception
Baseline: 41.1 percent (2015)
Target: 47 percent (2017)
Perception of being ticketed for failure to wear safety belts “Always” or “Nearly Always” 2016: 46.4 percent
Survey indicates upward trend

Rhode Island Highway Safety Plan | FFY 2018
24 FFY 2016 Performance Report
Program Area Performance Measure Performance Target Realized a
Increase awareness of “Click It or Ticket” slogan
Increase public awareness
Baseline: 89.5 percent (2015)
Target: 92 percent (2017)
Awareness of “Click It or Ticket” slogan
2016: 88.9 percent
Survey indicates downward trend
In FFY 2018 OHS will revise the DMV survey to include questions to better identify the target audience for CIOT media campaigns to address observed reduced awareness during the FFY 2017.
Impaired Driving C-5 Decrease alcohol impaired driving fatalities involving driver or motorcycle operator with a blood alcohol content (BAC) of 0.08 or greater a
Reduce the five-year average impaired driving fatalities by 13 percent
Baseline: 25 fatalities (2010-2014)
Target: 21 fatalities (2013-2017)
Preliminary data indications
2015: 19 fatalities
2011-2015 average: 23 fatalities
Average trending downward
Increase perception of being arrested by law enforcement after drinking and driving “Always” or “Nearly Always”
Increase public perception
Baseline: 47.7 percent (2015)
Target: 60 percent (2017)
Perception of being arrested for driving and driving “Always” or “Nearly Always” 2016: 47.4 percent
Increase recognition of DSoGPO impaired driving enforcement slogan
Increase recognition
Baseline: 50.0 percent (2015)
Target: 60 percent (2017)
Recognition of “Drive Sober or Get Pulled Over” slogan
2016: 55.8 percent
Speed C-6 Reduce speed-related fatalities
Reduce the five-year average speed-related fatalities by 4 percent
Baseline: 23 fatalities (2010-2014)
Target: 22 fatalities (2013-2017)
Preliminary data indications
2016: 23 fatalities
2012-2016 average: 21 fatalities
Average trending slightly downward
Motorcycles C-7 Reduce motorcycle fatalities
Reduce the five-year average motorcyclist fatalities by 7 percent
Baseline: 12 fatalities (2010-2014)
Target: 11 fatalities (2013-2017)
Preliminary data indications
2016: 4 fatalities
2012-2016 average: 8 fatalities
Average trending downward
C-8 Reduce unhelmeted motorcyclist fatalities
Reduce the five-year average unhelmeted motorcyclist fatalities by 7 percent
Baseline: 8 fatalities (2010-2014)
Target: 7 fatalities (2013-2017)
Preliminary data indications
2016: 4 fatalities
2012-2016 average: 5 fatalities
Average trending downward

Rhode Island Highway Safety Plan | FFY 2018
25 FFY 2016 Performance Report
Program Area Performance Measure Performance Target Realized a
Young Drivers C-9 Reduce or maintain the number of drivers age 20 or younger involved in fatal crashes
Maintain number of drivers age 20 or younger involved in fatal crashes
Baseline: 5 fatalities (2015 annual)
Target: 5 or fewer annually (2017)
Preliminary data indications
2016: 9 fatalities
2012-2016 average: 6 fatalities
Average trending upward
OHS will continue to monitor younger driver crashes and contributing factors such as speed, impairment, and distraction. With a small number of fatalities each crash makes a significant impact, specifically multiple fatality crashes, as seen in 2016.
Pedestrians C-10 Reduce or maintain number of crash fatalities among pedestrians
Reduce the five-year average number of pedestrians in fatal crashes by 9 percent
Baseline: 11 fatalities (2010-2014)
Target: 10 fatalities (2013 to 2017)
Preliminary data indications
2016: 14 fatalities
2012-2016 average: 11 fatalities
Average is unchanged
Reduce the number of pedestrian fatalities with a BAC of 0.08 or greater a
Reduce by 10 percent
Baseline: 2.8 fatalities (2006-2010)
Target: 2.5 fatalities (2013-2017)
Preliminary data indications
2016: 2 fatalities
2012-2016 average: 2.2 fatalities
Average is unchanged
Bicyclists C-11 Maintain zero crash fatalities among bicyclists
Maintain the five-year average number of bicyclist fatalities
Baseline: 1 fatality (2010-2014)
Target: 1 fatality (2013-2017)
Preliminary data indications
2016: 2 fatalities
2012-2016 average: 1.4 fatalities
Average is unchanged
Older Drivers Reduce the number of older drivers involved in fatal crashes
Reduce by 28 percent
Baseline: 14 fatalities (2010-2014)
Target: 11 fatalities (2013 to 2017)
Preliminary data indications
2016: 11 fatalities
2012-2016 average: 13 fatalities
Average is unchanged
Traffic Records Reduce the percentage of citation records with missing critical data elements
Increase completeness
Baseline: zero percent (July, 2015)
Target: 5 percent (Sept., 2016)
In progress
Maintained percentage of crash records with no errors in MMUCC critical data elements: 98.94% (April 2015 to March 2016) increased to 98.95% (April 2016 to March 2017).
Increased completeness for reports with latitude and longitude values by 10.8% from 66.7% (April 2015 to March 2016) to 77.4% (April 2016 to March 2017).
Reduce the percentage of appropriate records in the crash database that are not linked to another system on file
Increase integration
Baseline: zero percent (July, 2015)
Target: 5 percent (Sept., 2016)
In progress

Rhode Island Highway Safety Plan | FFY 2018
26 FFY 2016 Performance Report
Program Area Performance Measure Performance Target Realized a
Reduce the percentage of appropriate records in the crash database that are not linked to crime data
Increase integration
Baseline: zero percent (July, 2015)
Target: 2 percent (Sept., 2016)
In progress
Planning and Administration
Administer a fiscally responsible, effective highway safety program that is data-driven, includes stakeholders, and addresses State specific safety characteristics
Conducted stakeholder meeting to receive input for development of the FFY 2018 HSP
FFY 2017 Annual Report delivered by December 31, 2017
Deliver FFY 2018 HSP by July 1, 2017
Note: Performance measures based on five-year averages show measurement period in parenthesis. a 2016 crash data is preliminary. b Serious injury crashes 2011-2015 have been reviewed and validated resulting in slight changes to previously reported
values. c Measure based on NHTSA imputed values.

Rhode Island Highway Safety Plan | FFY 2018
27 Highway Safety Performance Plan
3 Highway Safety Performance Plan
3.1 Problem Identification Process The OHS emphasizes activities that most effectively use available resources to save lives, reduce injuries, and improve highway safety. Specific performance targets, measures, and strategies are determined by:
› Using data, highway safety research, and prior experience to identify problem areas
› Soliciting input and project proposals from local and regional organizations having expertise in areas relevant to highway safety
› Analyzing trends in serious injury and fatality rates and comparing them to regional and national trends
› Reviewing highway safety data and researching best practices including the following:
FARS
NHTSA
National Occupant Protection Use Survey (NOPUS)
RIDOT OHS
Rhode Island DMV
Rhode Island Department of Health
Rhode Island Police Chiefs Association
Rhode Island State Police
Rhode Island Statewide Planning Program
RIDOT’s Crash Data Management System (CDMS)
Rhode Island Attorney General’s Office
Rhode Island Courts
› Key data sources include:
Rhode Island Department of Transportation, Office on Highway Safety
Fatality Analysis Reporting System (FARS)
United States Census Bureau
United States Federal Highway Association
Rhode Island Department of Motor Vehicles
2016 Rhode Island Observed Restraint Use Surveys

Rhode Island Highway Safety Plan | FFY 2018
28 Highway Safety Performance Plan
National Highway Traffic Safety Administration
Rhode Island Department of Health, Forensic Sciences Unit
Online System for Crash Analysis and Reporting (OSCAR)
3.2 Statewide Demographics Rhode Island is the smallest state in the nation (1,045 square miles, bisected by Narragansett Bay), with 8 cities and 31 towns. The State contains about 6,100 miles of public roadway, including 70 miles of Interstate Highway (52 urban miles and 18 rural miles).
One-fifth of all Rhode Island residents are under 18 years of age; 5.2 percent are under age five. Inhabitants over age 65 make up 16.1 percent of the population.
About nine-tenths of the population reside in urban areas, the largest of which is Providence, the State capital. Rhode Island has one of the fastest growing Hispanic and Southeast Asian communities in the nation. Since 1980, the Hispanic population of Rhode Island has more than doubled, and this ethnicity makes up 14 percent of the Rhode Island population. As shown in Figure 3.1, African Americans, Asian Americans, and Native Americans now comprise one-eighth of the State population. Generally speaking, these demographic breakdowns tend to be reflected in the breakdown of crashes by race.
Figure 3.1 Rhode Island Population Estimate (2015)
Source: U.S. Census Bureau, 2011-2015 American Community Survey 5-Year Estimates
Because crashes are measured in relation to population, licensed drivers, and vehicle miles traveled (VMT), the tables below provide a brief overview of these characteristics. The U.S. Census Bureau estimated the population of Rhode Island to
7.9%1.0%
3.6%0.2%
14.4%
2.6%
73.9%
African American
American Indian and AlaskanNative
Asian
Native Hawaiian and OtherPacific Islander
Persons of Hispanic or LatinoOrigin
Persons reporting two or moreraces
White (Non‐Hispanic)

Rhode Island Highway Safety Plan | FFY 2018
29 Highway Safety Performance Plan
be 1,056,426 in 2016 (Table 3.1). As shown in Table 3.2 and Figure 3.2, in 2016, there were 935,712 registered motor vehicles and 753,143 licensed drivers (with 77,768 endorsed motorcycle operators).
In this plan, data are generally presented over a five-year period to show trends. When assessing safety needs and potential programming, it is important to understand how Rhode Island percentages differ from national percentages. The state population and annual number of fatalities in Rhode Island are relatively low compared to the nation, however, one fatality can significantly affect a percentage. Interpretation of increases and decreases in percentages, particularly from one year to the next, must be carefully examined. Therefore, raw numbers, percentages, and rates are provided in this plan, and both fatality and serious injury (defined as “incapacitating injuries”) data are presented when available.

Rhode Island Highway Safety Plan | FFY 2018
30 Highway Safety Performance Plan
Table 3.1 U.S. Census Population Estimate by County and Town (2016)
County and Town 2016 Population Estimates Bristol County 49,067 Barrington 16,272 Bristol 22,305 Warren 10,490 Kent County 164,614 Coventry 34,996 East Greenwich 13,111 Warwick 81,579 West Greenwich 6,148 West Warwick 28,780 Newport County 82,784 Jamestown 5,460 Little Compton 3,490 Middletown 15,973 Newport 24,779 Portsmouth 17,344 Tiverton 15,738 Providence County 633,673 Burrillville 16,341 Central Falls 19,347 Cranston 81,034 Cumberland 34,694 East Providence 47,337 Foster 4,708 Gloucester 10,035 Johnston 29,230 Lincoln 21,709 North Providence 32,494 North Smithfield 12,352 Pawtucket 71,427 Providence 179,219 Scituate 10,566 Smithfield 21,774 Woonsocket 41,406 Washington County 126,288 Charlestown 7,773 Exeter 6,552 Hopkinton 8,116 Narragansett 15,605 New Shoreham 1,045 North Kingstown 26,142 Richmond 7,613 South Kingstown 30,791 Westerly 22,651 Total State Population 1,056,426

Rhode Island Highway Safety Plan | FFY 2018
31 Highway Safety Performance Plan
Table 3.2 Rhode Island Drivers, Vehicles, and Population
2011 2012 2013 2014 2015 2016 Change (2011-2016)
Licensed Drivers 746,476 748,327 717,870 748,337 745,470 753,143 0.9%
Endorsed Motorcycle Operators
75,698 76,904 77,179 77,724 77,559 77,768 2.7%
Registered Vehicles 1,114,211 1,118,688 910,460 908,626 919,237 935,712 -16.0%
Registered Motorcycles (incl. Mopeds)
31,745 33,218 33,576 32,216 34,874 34,397 8.4%
Total Population of RI 1,051,302 1,050,292 1,051,511 1,055,173 1,056,298 1,056,426 0.5%
VMT (in millions) 7,901 7,807 7,775 7,677 7,833 n/a -0.9%1
Source: RIDOT/OHS (2017), FARS, (2017), FHWA State Statistical Abstracts (2017). n/a Indicates data not available at this time. 1. VMT percent change is from 2011 to 2015.
Figure 3.2 Rhode Island Drivers, Vehicles, and Population
Source: RIDOT/OHS (2017) and FARS (2017).
0
200
400
600
800
1,000
1,200
2011 2012 2013 2014 2015 2016
IN THOUSA
NDS
Licensed Drivers Registered Vehicles Population

Rhode Island Highway Safety Plan | FFY 2018
32 Highway Safety Performance Plan
3.3 Highway Safety Problem Areas Any traffic deaths in Rhode Island are unacceptable, unaffordable, and avoidable. In 2016, the highest percentage of fatal crashes in Rhode Island occurred in September and August, which is a shift from prior years. Noticeable spikes in fatalities also occurred in March, May, July and December, as shown in Figure 3.3. This figure also shows that the highest percentages of serious injuries occurred in July, September, and December. Figure 3.4 shows that 29 percent of crashes occurred on Thursdays followed by 17 percent and 15 percent of crashes occurring on Wednesdays and Tuesdays respectively. Serious injuries were somewhat more uniform across the days of the week ranging from 19 percent on Fridays down to 11 percent on Mondays. Figure 3.5 makes note that most crashes occurred between the hours of 1:00 p.m. and 10:00 p.m. and between 1:00 a.m. and 4:00 a.m.
Figure 3.6 depicts the multiple highway safety problems in Rhode Island, including impaired driving, occupant protection, speed, motorcycles, and other road users (including pedestrians and bicyclists), which are program areas in the FFY 2017 HSP and described in detail in Section 4.0. Not shown in Figure 3.6, but also priority program areas for FFY 2016, are older drivers and younger drivers. The OHS will continue to concentrate on improving State traffic records through crash data collection and reporting as part of the Section 405c records grant process. The HSP also addresses agency planning and administration functions.
Figure 3.3 Percentage of Rhode Island Fatal and Serious Injury Crashes by Month-of-Year (2016)
Source: RIDOT/OHS (2017) and FARS (2017). Note: Missing bars indicate 0% of crashes occurring.
8%
8%
10%
2%
10%
4%
10%
13%
15%
6%
2%
10%
7%
6%
7%
7%
8%
8%
14%
8%
11%
9%
8%
9%
0%
2%
4%
6%
8%
10%
12%
14%
16%
Fatal Crashes Serious Injury Crashes

Rhode Island Highway Safety Plan | FFY 2018
33 Highway Safety Performance Plan
Figure 3.4 Percentage of Rhode Island Fatal and Serious Injury Crashes by Day of Week (2016)
Source: RIDOT/OHS (2017) and FARS (2017).
Figure 3.5 Percentage of Rhode Island Fatal and Serious Injury Crashes by Time of Day (2016)
Source: RIDOT/OHS (2017) and FARS (2017).
10%
10%
15% 17%
29%
8%
10%12%
11% 12%
15%
15%
19%
17%
0%
5%
10%
15%
20%
25%
30%
35%
Sunday Monday Tuesday Wednesday Thursday Friday Saturday
Fatal Crashes Serious Injury Crashes
17%
6%
8%
6%
17%
19%
17%
10%
2%
5%
9%
12%
15%
18%
22%
16%
0%
5%
10%
15%
20%
25%
1 a.m. to3:59 a.m.
4 a.m. to6:59 a.m.
7 a.m. to9:59 a.m.
10 a.m. to12:59 p.m.
1 p.m. to3:59 p.m.
4 p.m. to6:59 p.m.
7 p.m. to9:59 p.m.
10 p.m. to12:59 a.m.
Fatal Crashes Serious Injury Crashes

Rhode Island Highway Safety Plan | FFY 2018
34 Highway Safety Performance Plan
Figure 3.6 Rhode Island Traffic Fatalities (2007 to 2016)
Source: RIDOT/OHS (2017) and FARS (2017). Note: Alcohol-involved crashes imputed by NHTSA, 2016 data not available.
3.4 Additional Challenges to Highway Safety Rhode Island has several laws and policies which have a direct impact on specific highway safety initiatives. In addition to the highway safety problem areas identified in this plan, Rhode Island faces the following significant legislative and institutional challenges:
› Rhode Island does not have a universal helmet law for all motorcyclists (the Rhode Island motorcycle helmet use law covers all passengers (regardless of age) and all operators during the first year of licensure (regardless of age).
› Sobriety checkpoints are banned by judicial ruling in Rhode Island.
› Required installation of alcohol ignition interlocks becomes mandated when an impaired driver demonstrates a BAC of 0.15 or higher or if that driver is a repeat offender. It is at the discretion of the sentencing judge for anyone with a lower BAC. RIDOT made an effort to change the law to include all impaired drivers but it was not successful in the 2016 legislative session.
› No requirement for behind-the-wheel training for novice drivers; only classroom instruction is required.
0
10
20
30
40
50
60
70
80
90
100
2007 2008 2009 2010 2011 2012 2013 2014 2015 2016
CRASH
ES
Total Fatal Crashes Motorcyclists Pedestrians
Bicyclists Alcohol‐Involved Unrestrained Speeding

Rhode Island Highway Safety Plan | FFY 2018
35 Highway Safety Performance Plan
3.5 Rhode Island Comparison to New England and United States As shown in Figure 3.7, Rhode Island has consistently had a lower fatality rate (per 100 million VMT) than the national average. The Rhode Island fatality rate also has been lower than the New England region fatality rate at various times throughout the period from 2007 to 2015, including 2007, 2008, 2010, 2014, and 2015.
Figure 3.7 Fatality Rates (Per 100 Million VMT)
Source: RIDOT/OHS (2017) and FARS (2017). Note: Regional data not currently available for 2016. Rhode Island data is preliminary for 2016.
Table 3.3 Crash Conditions as Percent of Total Fatalities (2015)
Unbelted Vehicle
Occupant Alcohol-Impaired Motorcycle
Speed Related Bicycle Pedestrian
Fatalities
Rhode Island 36% 42% 20% 44% 0% 18%
New England 30% 34% 19% 33% 2% 17%
USA 24% 29% 14% 27% 2% 15%
Source: FARS (2017).
0
0.2
0.4
0.6
0.8
1
1.2
1.4
1.6
2007 2008 2009 2010 2011 2012 2013 2014 2015 2016
CRASH
RATE PER
100M VMT
Rhode Island New England United States

Rhode Island Highway Safety Plan | FFY 2018
36 Highway Safety Performance Plan
3.6 Legislative Updates › In 2011, Rhode Island became the 33rd state in the country to enact a primary
seat belt law. The law went into effect on June 30, 2011 and was set to expire on June 30, 2013. However, the General Assembly passed a law removing the sunset on the primary seat belt law and also changed the fine from $85.00 for all offenders to $85.00 for all unbelted passengers up to seven years old and $40.00 for all offenders eight years of age.
› The Rhode Island General Assembly modified the Move Over Law to include construction and maintenance vehicles performing work on the side of the road.
› During the 2014 Session of the Rhode Island General Assembly, legislation was approved and signed into law by the Governor that provides for expanded use of Ignition Interlock Devices (IID) by making installation of the devices mandatory for repeat DUI and Chemical Test Refusal offenders, and providing for judicial discretion to impose IIDs as part of sentencing of first-time offenders of both of these offenses.
› An important transportation safety bill which clarifies the fine schedule for unauthorized use of personal wireless communication devices on a school bus was passed during the 2015 legislative session. The act clarifies the definition of “use” to prohibit any use of a wireless handset or a personal wireless communication device other than hands-free use, to conform Rhode Island legislation to Federal guidelines.
› During the 2016 legislative session the OHS supported a “hands-free” mobile device bill, a bill which supported speed cameras in school and work zones, and another bill which would increase the look back window for DUI offenses from five years to ten years. The hands-free mobile device bill was signed into law and will take effect on June 1, 2018.
› Children under 2 are now required to be restrained in rear-facing car seats.
We also continue to watch considerations being offered on behalf of a bill for an enhancement to the GDL statute which would mandate classes for parents of driver education students under age 18.
3.7 Performance Trends and Goals NHTSA identified 11 core performance measures and one behavioral measure for states to use to judge the effectiveness of their programs. The measures are total fatalities, total serious injuries, fatality rate, total fatalities according to common crash factors, and seat belt usage. Table 3.4 presents Rhode Island FFY 2018 program areas and targets for the core performance measures. These goals are consistent with the latest revision of the 2017-2022 SHSP and its TZD target of halving fatalities and serious injuries by 2030 using 2011 as the base-year (2011 – 2015 five-year averages). OHS worked with RIDOT engineering safety division to align our fatality targets with those within the Rhode Island FFY 2018 HSIP.

Rhode Island Highway Safety Plan | FFY 2018
37 Highway Safety Performance Plan
Table 3.5 on the following pages depicts the trends from 2006 to 2015, presents preliminary 2016 crash values, and presents the FFY 2018 targets for each measure. The trends on subsequent pages provide insight into how the targets were selected.
Table 3.4 FFY 2018 Performance Goals and Targets
Core Performance Measures Target
C-1) Traffic Fatalities Reduce the five-year average traffic fatalities by 9 percent from 58 (2011 to 2015 average) to 53 (2014 to 2018 average) by December 31, 2018.
C-2) Serious Injuries Reduce the five-year average serious injuries by 12 percent from 422 (2011 to 2015 average) to 373 (2014 to 2018 average) by December 31, 2018.
C-3) Traffic Fatalities per 100 million VMT
Reduce the five-year average traffic fatalities per 100 million VMT by 9 percent from 0.75 (2011 to 2015 average) to 0.68 (2013 to 2017 average) by December 31, 2018.
C-4) Unrestrained Passenger Vehicle Occupant Fatalities
Reduce the five-year average unrestrained occupant fatalities by 11 percent from 18 (2011 to 2015 average) to 16 (2014 to 2018 average) by December 31, 2018.
C-5) Fatalities Involving Driver or Motorcycle Operator with 0.08 BAC
Reduce the five-year average impaired driving fatalities by 9 percent from 23 (2011 to 2015 average) to 21 (2014 to 2018 average) by December 31, 2018.
C-6) Speed-Related Fatalities Reduce the five-year average speed-related fatalities by 10 percent from 21 (2011 to 2015 average) to 19 (2014 to 2018 average) by December 31, 2018.
C-7) Motorcyclist Fatalities Reduce the five-year average motorcyclist fatalities by 36 percent from 11 (2011 to 2015 average) to 7 (2014 to 2018 average) by December 31, 2018.
C-8) Unhelmeted Motorcyclist Fatalities
Reduce the five-year average unhelmeted motorcyclist fatalities by 33 percent from 6 (2011 to 2015 average) to 4 (2014 to 2018 average) by December 31, 2018.
C-9) Drivers Age 20 or Younger Involved in Fatal Crashes
Maintain five-year average number of drivers age 20 or younger involved in fatal crashes at 5 or below by December 31, 2018.
C-10) Pedestrian Fatalities Reduce the five-year average number of pedestrians in fatal crashes by 9 percent from 11 (2011 to 2015 average) to 10 (2013 to 2017) by December 31, 2018.
C-11) Bicyclist Fatalities Maintain the five-year average number of bicyclist fatalities at or below one by December 31, 2018.
B-1) Observed Seat Belt Use Increase observed seat belt use from 87.5 percent in 2016 to 91 percent by 2018.
Source: RIDOT/OHS (2017), FARS (2017), Rhode Island DMV (2017), 2016 Rhode Island Observed Restraint Use Surveys.

Rhod
e Is
land
Hig
hway
Saf
ety
Plan
| FF
Y 20
18
38
H
ighw
ay S
afet
y Pe
rfor
man
ce P
lan
Tabl
e 3.
5 Pe
rfor
man
ce T
rend
s an
d Ta
rget
s
Perf
orm
ance
Mea
sure
s 20
06
2007
20
08
2009
20
10
2011
20
12
2013
20
14
2015
20
16b
2018
Ta
rget
Co
re P
erfo
rman
ce M
easu
res
C-1
Traf
fic F
atal
ities
(Act
ual)
81
69
65
83
67
66
64
65
51
45
51
Five
-Yea
r Mov
ing
Aver
age
– 85
77
77
73
70
69
69
63
58
55
53
C-2
Serio
us In
jurie
s (A
ctua
l) 1,
305
842
421
484
542
455
422
366
438
427
491
Five
-Yea
r Mov
ing
Aver
age
– –
– –
– 49
4 47
3 45
4 44
5 42
2 42
9 37
3
C-3
Traf
fic F
atal
ities
per
100
M V
MT
0.98
0.
80
0.79
1.
01
0.81
0.
84
0.82
0.
84
0.66
0.
57
0.65
Five
-Yea
r Mov
ing
Aver
age
– 1.
01
0.92
0.
92
0.88
0.
85
0.85
0.
86
0.79
0.
75
0.71
0.
68
C-4
Unr
estr
aine
d O
ccup
ant F
atal
ities
35
19
29
32
26
23
20
19
10
16
14
Five
-Yea
r Mov
ing
Aver
age
– 37
33
30
28
26
26
24
20
18
16
16
C-5
Fata
litie
s In
volv
ing
Driv
er o
r M
otor
cycl
e O
pera
tor
0.08
BAC
a 30
22
23
34
27
26
28
23
17
19
n/
a
Five
-Yea
r Mov
ing
Aver
age
– 35
29
29
27
26
28
28
24
23
n/
a 21
C-6
Spee
d-Re
late
d Fa
talit
ies
42
20
20
39
33
23
30
17
13
20
23
Five
-Yea
r Mov
ing
Aver
age
– 40
33
32
31
27
29
28
23
21
21
19
C-7
Mot
orcy
clis
t Fat
aliti
es
16
13
7 19
15
15
8
11
10
9 4
Five
-Ye
ar M
ovin
g Av
erag
e –
13
12
14
14
14
13
14
12
11
8 7
C-8
Unh
elm
eted
Mot
orcy
clis
t Fa
talit
ies
11
9 2
12
11
8 5
6 7
4 4
Five
-Yea
r Mov
ing
Aver
age
– 8
7 8
9 8
8 8
7 6
5 4
C-9
Driv
ers
Age
20 o
r You
nger
In
volv
ed in
Fat
al C
rash
es
14
16
9 11
7
4 4
7 4
6 9
Five
-Yea
r Mov
ing
Aver
age
– 18
15
14
11
9
7 7
5 5
6 5
C-10
Pe
dest
rian
Fata
litie
s 15
13
12
16
9
14
5 14
14
8
14

Rhod
e Is
land
Hig
hway
Saf
ety
Plan
| FF
Y 20
18
39
H
ighw
ay S
afet
y Pe
rfor
man
ce P
lan
Perf
orm
ance
Mea
sure
s 20
06
2007
20
08
2009
20
10
2011
20
12
2013
20
14
2015
20
16b
2018
Ta
rget
Five
-Yea
r Mov
ing
Aver
age
– 12
12
14
13
13
11
12
11
11
11
10
C-11
Bi
cycl
ist F
atal
ities
1
1 1
0 2
0 2
3 0
0 2
Five
-Yea
r Mov
ing
Aver
age
– 1
1 1
1 1
1 1
1 1
1 1
B-1
Perc
ent O
bser
ved
Belt
Use
for
Pass
enge
r Veh
icle
s –
Fron
t Sea
t O
utbo
ard
Occ
upan
ts
74%
79
%
72%
75
%
78%
80
%
78%
86
%
87%
87
%
88%
91
%
A
ctiv
ity M
easu
res
Trac
ked
(no
goal
s se
t)
N
umbe
r of S
peed
ing
Cita
tions
Is
sued
Dur
ing
Gra
nt-F
unde
d En
forc
emen
t Act
iviti
es
– –
– 4,
630
5,80
2 6,
446
7,31
7 8,
446
9,60
7 6,
200
8,09
2 –
N
umbe
r of S
afet
y be
lt Ci
tatio
ns
Issu
ed D
urin
g G
rant
-Fun
ded
Enfo
rcem
ent A
ctiv
ities
2,
024
2,22
6 2,
336
2,55
3 2,
181
2,17
2 5,
958
5,34
6 2,
825
7,09
9 5,
562
–
N
umbe
r of I
mpa
ired
Driv
ing
Arre
sts
Mad
e du
ring
Gra
nt-
Fund
ed E
nfor
cem
ent A
ctiv
ities
2,
519
U/A
U
/A
253
288
253
417
438
507
404
363
–
Sour
ce:
RID
OT/
OH
S (J
une
2017
), Rh
ode
Isla
nd D
MV
(Jun
e 20
17);
FARS
(201
7).
Not
e:
Prio
r to
2013
, Ser
ious
Inju
ry a
vera
ges
wer
e ca
lcul
ated
usi
ng 3
yea
rs o
f dat
a, n
ot 5
yea
rs d
ue to
dat
a lim
itatio
ns.
a N
HTS
A im
pute
d nu
mbe
r. b
Prel
imin
ary.

Rhode Island Highway Safety Plan | FFY 2018
40 Highway Safety Performance Plan
3.8 Core Performance Measures Figures 3.8 through 3.19 provide greater detail on the 11 national core and one behavioral performance measures and include data points and an associated trend line. OHS and RIDOT conducted a target setting workshop in Spring 2017 to finalize performance targets that are consistent between the SHSP, HSP, and HSIP for Fiscal Year 2018 (Fatality, Fatality Rate, Serious Injuries) as required by the FAST Act. As part of the target setting exercise, data was projected using the FORCAST function in Excel using 2011-2015 averages as the baseline. Staff then compared the projected crashes based on the historical trendline and discussed if and how Rhode Island could maintain this trendline. Factors such as current year fatality and serious injury projections, recently implemented and proposed programs and projects, and funding were considered when determining targets for Fiscal Year 2018.
Projecting to 2018, fatalities were forecasted to decrease by 12 percent, or 4 percent annually, while fatality rate and serious injuries were forecasted to decrease by 8 percent or slightly less than 3 percent annually.
To reach RI’s longer-term goals of toward zero deaths and halving the number of serious injuries based on a base average year of 2015, an annual reduction in average annual fatalities and serious injuries of 4 percent would be required. However, an increase in the number of fatalities in 2016 may negate gains from prior years and slow the downward trend in average annual numbers.
The 2017-2022 Rhode Island SHSP adopted a 3 percent reduction in average annual fatalities and serious injuries to account for the recent increases for both numbers. The 2018 fatality and fatality rate targets for the HSP and HSIP align with the SHSP with a three percent annual reduction to the end of a trend line of average annual FARS numbers from 2011-2015. The 2018 serious injuries target for the HSP and HSIP take a slightly more aggressive approach that applies a four percent annual reduction. This more aggressive approach is applied to the 2018 HSP and HSIP as a head start to help Rhode Island reach its targets stated in the 2017-2022 SHSP. The core measures described in the subsequent sections apply a three to four percent approach described above unless specific programs or prevailing trends result in an alternate trajectory. The 2016 values shown in the subsequent figures are preliminary and are provided by RIDOT/OHS.

Rhode Island Highway Safety Plan | FFY 2018
41 Highway Safety Performance Plan
C-1 – Fatalities › Goal. Reduce the five-year average traffic fatalities by 9 percent from 58 (2011 to
2015 average) to 53 (2014 to 2018 average) by 2018.
› Justification. Overall, fatalities have steadily declined in recent years. Based on preliminary data there were 51 fatalities in 2016, a slight rise to 2014 levels. With low numbers to begin with, it becomes increasingly harder to move the needle, which is proving to be the case in 2016.
Figure 3.8 C-1 Fatalities
Source: RIDOT/OHS (2017) and FARS (2017). Note: 2016 crash values are preliminary
Trend line represents the five-year average historic trend through 2015 and the projected decline in crashes assuming a rate of -4% annually, consistent with the 2017-2022 SHSP.
66 64 65 51 45
70 69 69
63
58
51
55
53
0
10
20
30
40
50
60
70
80
2011 2012 2013 2014 2015 2016 2017 2018
Crashes
Fatalities (Actual) 5‐Yr Average Trend 5‐Yr Average Target

Rhode Island Highway Safety Plan | FFY 2018
42 Highway Safety Performance Plan
C-2 – Serious Injuries › Goal. Reduce the five-year average serious injuries by 12 percent from 422 (2011
to 2015 average) to 373 (2014 to 2018 average) by 2018.
› Justification. The five year rolling average for serious injuries in Rhode Island have steadily decreased for the last five years, however the annual number of serious injuries per year have fluctuated with a low of 366 in 2013 and a high of 455 in 2011. Serious injuries are projected to be higher than average in 2016.
Figure 3.9 C-2 Serious Injuries
Source: RIDOT/OHS (2017). Note: 2016 crash values are preliminary
Trend line represents the five-year average historic trend through 2015 and the projected decline in crashes assuming a rate of -4% annually, consistent with the 2017-2022 SHSP. Beginning in 2013, RIDOT transitioned to reporting a 5-year moving average from a 3-year moving average. 2011-2015 crashes have been reviewed and validated since the prior Highway Safety Plan submission. Values may not match prior reports.
455
422
366
438
427
494473
454 445422
491
429
373
0
100
200
300
400
500
600
2011 2012 2013 2014 2015 2016 2017 2018
Crashes
Serious Injuries Average Trend 5‐Yr Average Target

Rhode Island Highway Safety Plan | FFY 2018
43 Highway Safety Performance Plan
C-3 – Fatality Rate › Goal. Reduce the five-year average traffic fatalities per 100 million VMT by
9 percent from 0.75 (2011 to 2015 average) to 0.68 (2014 to 2018 average) by 2018.
› Justification. The fatality crash rate has declined slightly in recent years with a minor increase in 2013. Based on preliminary data the rate in 2016 is 0.65, a slight increase over 2015. Rates in 2016 once again appear to be consistent with 2014.
Figure 3.10 C-3 Fatality Rate per 100 Million VMT
Source: RIDOT/OHS (2017) and FARS (2017). Note: 2016 crash values, and therefore rates, are preliminary
Trend line represents the five-year average historic trend through 2015 and the projected decline in crashes assuming a rate of -4% annually, consistent with the 2017-2022 SHSP.
0.84
0.82
0.84
0.66
0.57
0.85 0.85 0.86
0.790.75
0.65
0.71
0.68
0
0.1
0.2
0.3
0.4
0.5
0.6
0.7
0.8
0.9
1
2011 2012 2013 2014 2015 2016 2017 2018
Crashes
Fatality Rate 5‐Yr Average Trend 5‐Yr Average Target

Rhode Island Highway Safety Plan | FFY 2018
44 Highway Safety Performance Plan
C-4 – Unrestrained Motor Vehicle Occupant Fatalities › Goal. Reduce the five-year average unrestrained occupant fatalities by 11 percent
from 18 (2011 to 2015 average) to 16 (2014 to 2018 average) by 2018.
› Justification. Unrestrained fatalities in Rhode Island have generally decreased for the last five years. There was a slight rise in crashes in 2015, however, preliminary data for 2016 suggests that the number of annual crashes will come down again. From 2014 to 2016 crashes are not projected to reach 2013 and prior levels, which is when the primary seat belt law changed. The goal for this performance measure is 16 fatalities (5-year average) in 2018.
Figure 3.11 C-4 Unrestrained Motor Vehicle Occupant Fatalities
Source: RIDOT/OHS (2017) and FARS (2017). Note: Restraint usage restated to reflect all motor vehicle occupants except buses.
2016 crash values are preliminary Trend line represents the five-year average historic trend through 2015 and the projected decline in crashes assuming a rate of -4% annually, consistent with the 2017-2022 SHSP.
23 20 19 10 16
26 26
24
20
18
14
16
16
0
5
10
15
20
25
30
2011 2012 2013 2014 2015 2016 2017 2018
Crashes
Fatalities (Actual) 5‐Yr Average Trend 5‐Yr Average Target

Rhode Island Highway Safety Plan | FFY 2018
45 Highway Safety Performance Plan
C-5 – Fatalities Involving Driver or Motorcycle Operator with ≥0.08 BAC › Goal. Reduce the five-year average impaired driving fatalities by 9 percent from
23 (2011 to 2015 average) to 21 (2014 to 2018 average) by 2018.
› Justification. Between 2011 and 2015 5-year average fatalities have remained between a low of 23 and a high of 28 with 2015 having the lowest number of average crashes. Despite a small increase of two crashes in 2015, Rhode Island will move toward its TZD goal by establishing a target of 21 fatalities, consistent with the percentage decline proposed in other performance measures. This is a reflection on the high level of importance RIDOT and the OHS have placed on mitigating impaired driving crashes through recent and upcoming education, media, and enforcement campaigns.
Figure 3.12 C-5 Fatalities Involving Driver or Motorcycle Operator with ≥0.08 BAC
Source: NHTSA Imputed data (2017). Note: Restraint usage restated to reflect all motor vehicle occupants except buses.
2016 crash values not currently available. Trend line represents the five-year average historic trend through 2015 and the projected decline in crashes assuming a rate of -4% annually, consistent with the 2017-2022 SHSP.
26 28 23 17 19
26
28 28
2423
21
0
5
10
15
20
25
30
2011 2012 2013 2014 2015 2016 2017 2018
Crashes
Fatalities (Actual) 5‐Yr Average Trend Target

Rhode Island Highway Safety Plan | FFY 2018
46 Highway Safety Performance Plan
C-6 – Speed › Goal. Reduce the five-year average speed-related fatalities by 10 percent from 21
(2011 to 2015 average) to 19 (2014 to 2018 average) by 2018.
› Justification. Speed-related fatalities have fluctuated over the last five years, with as few as 13 in 2014 and has many as 30 in 2012. Preliminary 2016 values are comparable to the recent five-year average at 23. Large fluctuations mean that the annual crashes and the five-year average will not easily align. Continued decreases in the five-year average are anticipated, however, our target is more cautious. The SHSP goal of TZD still provides a realistic goal.
Figure 3.13 C-6 Speed-Related Fatalities
Source: RIDOT/OHS (2017) and FARS (2017). Note: 2016 crash values are preliminary
Trend line represents the five-year average historic trend through 2015 and the projected decline in crashes assuming a rate of -4% annually, consistent with the 2017-2022 SHSP.
23 30 17 13 20
2729
28
2321
23
21
19
0
5
10
15
20
25
30
35
2011 2012 2013 2014 2015 2016 2017 2018
Crashes
Fatalities (Actual) 5‐Yr Average Trend 5‐Yr Average Target

Rhode Island Highway Safety Plan | FFY 2018
47 Highway Safety Performance Plan
C-7 – Motorcycle Fatalities › Goal. Reduce the five-year average motorcyclist fatalities from 11 (2011 to 2015
average) to 7 (2014 to 2018 average) by 2017.
› Justification. Motorcycle fatalities have been somewhat inconsistent over the last five years with an overall downward trend. Preliminary data for 2016 suggests four motorcycle fatalities in 2016, potentially an outlier compared to other recent years of data. The SHSP goal of TZD results in a target higher than the preliminary 2016 average, therefore a slightly more aggressive target of 7 fatalities (2014 to 2018 average) was chosen. The 2016 NHTSA motorcycle assessment recommendations are anticipated to help OHS reach this goal.
Figure 3.14 C-7 Number of Motorcyclist Fatalities
Source: RIDOT/OHS (2017) and FARS (2017). Note: 2016 crash values are preliminary
Trend line represents the five-year average historic trend through 2015 and the projected decline in crashes assuming a rate of -4% annually, consistent with the 2017-2022 SHSP.
15 8 11 10 9
14
13
14
12
11
4
8
7
0
2
4
6
8
10
12
14
16
2011 2012 2013 2014 2015 2016 2017 2018
Crashes
Fatalities (Actual) 5‐Yr Average Trend 5‐Yr Average Target

Rhode Island Highway Safety Plan | FFY 2018
48 Highway Safety Performance Plan
C-8 – Unhelmeted Motorcycle Fatalities › Goal. Reduce the five-year average unhelmeted motorcyclist fatalities from 6
(2011 to 2015 average) to 4 (2014 to 2018 average) by 2018.
› Justification. The overall unhelmeted fatality numbers have decreased over recent years. As the number of fatalities gets smaller it will be harder to further reduce. If the number of crashes remains at or below the current level over the upcoming years a five-year average of four crashes could be achieved. The 2016 NHTSA motorcycle assessment recommendations are anticipated to help OHS reach this goal.
Figure 3.15 C-8 Unhelmeted Motorcycle Fatalities
Source: RIDOT/OHS (2017) and FARS (2017). Note: 2016 crash values are preliminary
Trend line represents the five-year average historic trend through 2015 and the projected decline in crashes assuming a rate of -4% annually, consistent with the 2017-2022 SHSP.
8 5 6 7 4
8 8 8
7
6
4
5
4
0
1
2
3
4
5
6
7
8
9
2011 2012 2013 2014 2015 2016 2017 2018
Crashes
Fatalities (Actual) 5‐Yr Average Trend 5‐Yr Average Target

Rhode Island Highway Safety Plan | FFY 2018
49 Highway Safety Performance Plan
C-9 – Young Drivers › Goal. Maintain the number of drivers age 20 or younger involved in fatal crashes
at a five-year average of 5 (2014 to 2018 average) or below by 2018.
› Justification. The number of younger driver involved fatalities has varied over the last five years, and preliminarily the number of 2016 fatalities has jumped to nine from values as low as four in 2011, 2012, and 2014. With very small numbers of crashes percentile decreases are difficult to measure. A goal of 5 fatalities (2014 to 2018 average) has been chosen with the intent of returning to prior lower levels and maintaining or further reducing those values.
Figure 3.16 Drivers Age 20 or Younger Involved in Fatal Crashes
Source: RIDOT/OHS (2017) and FARS (2017). Note: 2016 crash values are preliminary
Trend line represents the five-year average historic trend through 2015 and the projected decline in crashes assuming a rate of -4% annually, consistent with the 2017-2022 SHSP.
4 4 7 4 6
9
7 7
5 5
9
6
5
0
1
2
3
4
5
6
7
8
9
10
2011 2012 2013 2014 2015 2016 2017 2018
Crashes
Fatalities (Actual) 5‐Yr Average Trend 5‐Yr Average Target

Rhode Island Highway Safety Plan | FFY 2018
50 Highway Safety Performance Plan
C-10 – Pedestrian › Goal. Reduce the five-year average number of pedestrians in fatal crashes by 9
percent from 11 (2011 to 2015 average) to 10 (2014 to 2018 average) by 2018.
› Justification. Pedestrian fatalities have been somewhat inconsistent over the last five years. Preliminary data indicates there were 14 pedestrian fatalities in 2016, which is consistent with 2011, 2013, and 2014. A consistent trend during recent years and a low number of crashes makes moving the needle difficult, however, the SHSP goal of TZD was chosen. However, with the new statewide vulnerable road user programs targeting Providence and other municipalities with high pedestrian crashes, we believe we will see a modest reduction in this area.
Figure 3.17 C-10 Pedestrian Fatalities
Source: RIDOT/OHS (2017) and FARS (2017). Note: 2016 crash values are preliminary
Trend line represents the five-year average historic trend through 2015 and the projected decline in crashes assuming a rate of -3% annually for vulnerable road users, consistent with the 2017-2022 SHSP.
14 5 14 14 8
13
11
12
11 11
14
11
10
0
2
4
6
8
10
12
14
16
2011 2012 2013 2014 2015 2016 2017 2018
Crashes
Fatalities (Actual) 5‐Yr Average Trend 5‐Yr Average Target

Rhode Island Highway Safety Plan | FFY 2018
51 Highway Safety Performance Plan
C-11 – Bicycle › Goal. Achieve a five-year average number of bicyclist fatalities at the five-year
average of less than one (2014 to 2018 average) by 2018.
› Justification. Bicyclists fatalities have been very low in Rhode Island over the past five years with only 2012 and 2013 having fatalities. Preliminary 2016 values show two fatalities. On average, between 2011 and 2015, fatalities have been consistent at one and it is highly likely this trend will continue through the continuation of bicycle events and programs.
Figure 3.18 C-11 Bicyclist Fatalities
Source: RIDOT/OHS (2017) and FARS (2017). Note: 2016 crash values are preliminary
Trend line represents the five-year average historic trend through 2015 and the projected decline in crashes assuming a rate of -3% annually for vulnerable road users, consistent with the 2017-2022 SHSP.
0 2 3 0 0
0.81.0
1.4 1.4
1.0
2
1.4
1
0
0.5
1
1.5
2
2.5
3
3.5
2011 2012 2013 2014 2015 2016 2017 2018
Crashes
Fatalities (Actual) 5‐Yr Average Trend 5‐Yr Average Target

Rhode Island Highway Safety Plan | FFY 2018
52 Highway Safety Performance Plan
B-1 – Observed Belt Use › Goal. Increase observed seat belt use from 87.5 percent in 2015 to 91 percent by
2018.
› Justification. Since the 2013 removal of the sunset on the primary seat belt law seat belt usage has made very minor but steady improvements. The intent is for the rate to continue to rise to 91 percent by 2018, which is achievable with the continuation of the primary seat belt law, fines, enforcement, and education programs.
Figure 3.19 Percent Observed Belt Use for Passenger Vehicles (Front Seat Outboard Occupants (2011-2016)
Source: RIDOT/OHS (2017) and FARS (2017).
80% 78% 86% 87% 87% 88%
77% 77% 79% 82% 84% 85%
91%
0%
10%
20%
30%
40%
50%
60%
70%
80%
90%
100%
2011 2012 2013 2014 2015 2016 2017 2018
Crashes
Belt Use 5‐Yr Average Target Trend Target

Rhode Island Highway Safety Plan | FFY 2018
53 Highway Safety Performance Plan
3.9 Additional Performance Measures The Office of Highway Safety elected to adopt additional performance measures in areas of concern to improve their ability to track trends and better respond to changing needs.
3.9.1 Occupant Protection › Goal. Increase safety belt use among pickup truck drivers, as measured by
observations, from 76.7 percent in 2016 to 80 percent in 2018.
Justification. Pickup drivers exhibit the lowest safety belt use rate among the vehicle types tracked in the annual Rhode Island seat belt use survey, ten percent less than passenger cars. Changing the safety behavior of these users is a key component of the initiatives in the HSP. A dedicated enforcement and education focus on these users will help move percentage use upwards.
› Goal. Increase awareness of the Click It or Ticket slogan, as measured by a DMV intercept survey, from 88.9 percent in 2016 to 92 percent in 2018.
Justification. Rhode Island survey respondents in prior years exhibited an awareness of the CIOT slogan above 90 percent. With dedicated efforts between CIOT partners, Rhode Island can move toward this target.
› Goal. Increase the perception people will be ticketed for failure to wear safety belts “always” or “nearly always,” as measured by a DMV intercept survey, from 46.4 percent in 2016 to 47 percent in 2018.
Justification. The percentage of responses to this survey question that are “always” or “nearly always” increased from 41 percent in 2014 to over 46 percent in 2016. Building on the exhibited success of Rhode Island efforts will continue to move this percentage upward.
3.9.2 Impaired Driving › Goal. Increase the percentage of survey participants responding “Always” or
“Nearly Always” to the chances of getting arrested by law enforcement after drinking and driving from 47.4 percent in 2015 to 60 percent in 2018.
Justification. The percentage of responses to this survey question that are “always” or “nearly always” was 60 percent in 2014. Recalibrating enforcement and education efforts will help move the percentage back and beyond previously exhibited results.
› Goal. Increase percent of survey respondents that recognize the DSoGPO impaired driving enforcement slogan from 55.8 percent recognition in 2016 to 65 percent in 2018.
Justification. Awareness of this slogan rose from 45 percent in 2014 to almost 56 percent in 2016. Continued enforcement and education efforts that build on prior successes will move this percentage upward.

Rhode Island Highway Safety Plan | FFY 2018
54 Highway Safety Performance Plan
3.9.3 Pedestrians › Goal. To decrease the five-year average number of pedestrian fatalities testing
positive for blood alcohol, by 15 percent from 2.6 (2011 to 2015) to 2.2 (2014 to 2018) by 2018.
Justification. The average annual number of impaired pedestrian fatalities was 4 from 2006-2010. This average has declined over the five subsequent years. Continued enforcement and education efforts will help drive the number down, however, Rhode Island recognizes increased pedestrian volumes may negate some successes.
3.9.4 Traffic Records › Goal. Reduce the percentage of citation records with missing critical data
elements.
Justification. Rhode Island crash reports continue to show high accuracy based on MMUCC compliance. There is still a small percentage of reports that exhibit inaccuracies, however, that percentage continues to drop annually.
› Goal. Increase the percentage of crash records with latitude and longitude values entered by the officer from 77.45 percent in March 2017 to 90 percent in March 2018.
Justification. The percentage of crash reports with complete location data measurements increased by 22 percent in 2014 to 77 percent in 2017. This success is expected to continue as Rhode Island data partners work together to improve their data systems.
› Goal. Increase the percentage of appropriate records in the crash database that are linked to another records database from zero percent in July 2017 to five percent by September 2018.
Justification. Rhode Island data partners are actively working on data integration efforts between agencies and are identifying steps and actions to enable these data integration activities.
› Goal. Increase the percentage of appropriate records in the crash database that are integrated with the crime database from zero percent to two percent by September 2018.
Justification. Rhode Island data partners are actively working on data integration efforts between agencies and are identifying steps and actions to enable these data integration activities.
3.9.5 Distracted Driving › Goal. Increase the number of DMV survey respondents who never talk on a hand-
held cellular phone while driving from 33 percent to at least 75 percent.
Justification. Ideally this target should be set at 100 percent, however, as an interim target, reaching 75 percent can be attainable. The 2016 DMV survey

Rhode Island Highway Safety Plan | FFY 2018
55 Highway Safety Performance Plan
results showed that 33 percent of respondents had a “never” answer. In the same survey, the number of respondents who “never” text while driving is 67 percent. With a cell phone ban starting in 2018, Rhode Island is encouraged more drivers will stop using their mobile devices while driving.
3.9.6 Planning and Administration › Goal. Administer a fiscally responsible, effective highway safety program that is
data-driven, includes stakeholders, and addresses State specific safety characteristics.
Justification. The HSP is developed using a data-driven process to identify areas of concerns and engages partners across the state who champion the various programs and activities in the Plan. This approach promotes accountability and helps identify measures of effectiveness for the adopted programs and activities.

Rhode Island Highway Safety Plan | FFY 2018
56 Highway Safety Performance Plan
This page intentionally left blank.

Rhode Island Highway Safety Plan | FFY 2018
57 Highway Safety Countermeasures and Projects
Highway Safety Countermeasures and Projects for FFY 2018 (by Program Area) Section 4 provides details on the program areas, performance targets and measures, project descriptions, and funding levels and sources. The program areas in the Rhode Island FFY 2018 HSP include occupant protection, impaired driving, speed, motorcycles, younger drivers, vulnerable road users (pedestrians, bicyclists), traffic records, evidence-based enforcement, distracted driving, and planning and administration. Each section contains the following information.
› Safety Focus Area. The areas of highway safety that will be focused on in FFY 2018.
› Problem Identification. A description of the problem using state crash and demographic data that provide justification for including the program area and guides the selection and implementation of countermeasures.
› Strategic Partners. A list of partnerships to assist OHS in delivering programs and projects and meeting the FFY 2018 performance targets.
› Countermeasures. Summary of the high-level, proven approaches which guide the project selection for each Program Area. Countermeasures that will be implemented in the next year by the highway safety office and the safety partners are proven effective nationally, have been successful in Rhode Island, and are appropriate given the data in the problem identification and the resources available. The OHS used the Countermeasures That Work (CTW): A Highway Safety Countermeasure Guide for State Highway Safety Offices, Eighth Edition, 2015 as a reference to aid in the selection of effective, evidence-based countermeasure strategies for the FFY 2017 HSP program areas. Evidence of effectiveness citations, which reference CTW, followed by the chapter and related countermeasure section (e.g., CTW, Chapter 2, Section 2.1), are identified in the program/project descriptions and denotes the effectiveness of the related countermeasure strategy where appropriate. Note that CTW is not referenced for OHS administrative functions and activities. The 2015 edition of Countermeasures That Work can be viewed in its entirety on the NHTSA web site at: http://www.nhtsa.gov/staticfiles/nti/pdf/812202-CountermeasuresThatWork8th.pdf .
› Performance Targets. The targets for, and in addition to, major injuries or fatalities by safety focus area.
› Programs/Projects. Data-driven activities that will be implemented in the next year to achieve the identified countermeasures for each program area.

Rhode Island Highway Safety Plan | FFY 2018
58 Highway Safety Countermeasures and Projects
4.1 Occupant Protection
Problem Identification and Analysis
Lack of restraint use continues to be a significant contributing factor in Rhode Island’s crash fatalities and serious injuries. Fatalities resulting from crashes where restraints were not used accounted for approximately 27 percent of the total fatalities in 2016. Figure 4.1 shows that the safety belt use rate for Rhode Island has been well below the national rate over the last decade with usage in 2014 matching the national rate. The increase in safety belt use also appears to be associated with the continued decline of unrestrained fatalities.
Additional analysis of 2011-2015 data show that the majority of unrestrained drivers in fatal crashes are white (79%). One-quarter of drivers are under age 25, however, none were under age 16. The cities of Providence and Warwick have the highest numbers of unrestrained motor vehicle occupant fatalities at 12 and 10 respectively.
All of this information, as well as, the key recommendations listed below from the Rhode Island Occupant Protection Assessment in April 2016 will continue to be used to develop appropriate educational and marketing materials and target enforcement activities to reduce restraint nonuse.
During FFY 2017 OHS was able to fill a Program Coordinator vacancy for the Occupant Protection program, as well as other program areas. This has enabled OHS to enhance occupant protection programs and outreach. This includes introducing a initiative to enhance child passenger safety technician training program for fire services, rescue, and ambulance personnel.
Key Assessment Recommendations:
› Program Management
Engage leadership on the importance of occupant protection so that it becomes a priority within the State. This message from the top down will create momentum in the program to reach the State’s goal of 90 percent seat belt use.
Hire personnel to fill vacant OHS positions and, once fully staffed, prioritize staff to high risk emphasis areas. This may require reorganization of existing personnel to separate major emphasis areas from single staff members which will allow more centralization of time and effort to meet performance goals for occupant protection.
› Legislation/Regulation And Policy
Engage law enforcement to conduct sustained occupant protection high visibility enforcement with coordinated media and educational efforts that address all age groups.
Develop and make readily accessible occupant protection fact sheets to include highlights of the law, consequences of not buckling, and the economic impact of unrestrained injuries and fatalities.

Rhode Island Highway Safety Plan | FFY 2018
59 Highway Safety Countermeasures and Projects
› Law Enforcement
Develop a statewide occupant protection work plan using elements of community oriented policing, a community based intervention model (from the Centers for Disease Control and Prevention), and DDACTS to reduce unrestrained crashes, injuries and deaths.
Develop, and distribute a law enforcement agency survey to assess how officers use their professional discretion when performing seat belt enforcement activities. The purpose of this survey is to better understand officers’ decision-making process and how the OHS may refine and clarify their expectations when communicating with law enforcement agencies.
Sponsor a program to advocate for all law enforcement agencies to adopt the principles of the “Below 100” program endorsed by the International Association of Chiefs of Police and the National Sheriffs Association, and create a roll call training video emphasizing the importance for seat belt use for officer safety.
› Communication
Advertise all four enforcement mobilizations with earned and paid media and a strong enforcement-focused message (e.g., extra patrols on now) with localized ads that feature Rhode Island law enforcement.
Develop a unified, multi-faceted, enforcement-focused communications campaign that includes print materials that are designed to carry forward the messages and look of the television and radio ads. Work with the media buy contractor to determine which print elements will be needed. As an example, web ads could make use of bonus media opportunities and billboard visuals. Ensure that the entire campaign uses similar fonts, colors and themes so motorists know the messages are connected.
Contract with a public relations specialist who will assist the OHS team in identifying fresh news approaches for messaging and who will aggressively pitch news stories to reporters with the end goal of obtaining the most comprehensive news coverage and message exposure possible and the ability to measure results.
› Occupant Protection For Children
Seek alternative funding for purchase of car seats to help meet the demand.
Obtain injury data, child passenger observational surveys and car seat misuse information to support child passenger safety programming.
› Outreach
Create an educational program for law enforcement officers to identify proper child car seat use and law violations by developing a roll call video with a pocket card containing key messages. Measure to determine if this effort results in an increase in child passenger safety citations.
Sponsor training on media outreach, grant writing, program evaluation and strategic planning to facilitate communication among the many traffic safety stakeholder organizations and grant recipients. Ensure ample time is left on the agenda for informal networking and the sharing of creative ideas and best practices.

Rhode Island Highway Safety Plan | FFY 2018
60 Highway Safety Countermeasures and Projects
› Data and Evaluation
Undertake an analysis of data from the observational and attitudinal surveys to identify locations and populations where seat belt usage is below the State average.
Improve information collected regarding citations.
Work with the Rhode Island Traffic Tribunal to obtain counts of seat belt and child restraint citations.
Develop a citation tracking system to determine the eventual outcome of all seat belt and child restraint citations.
Require agencies to report seat belt and child restraint citations written outside of grant-funded activities.
Conduct an analysis of morbidity data to evaluate the burden of motor vehicle crashes within Rhode Island.
Analyze data from the Rhode Island Hospital and Hasbro Children’s Hospital trauma registry to determine the experiences of the most severely injured crash victims.
Utilize contacts within the TRCC to conduct an analysis of the emergency department and hospital discharge databases to gain a broader picture of injuries resulting from motor vehicle crashes.
Reestablish efforts to link the motor vehicle crash and hospital databases.
Figure 4.1 Observed Safety Belt Use Rate (Rhode Island and Nationwide)
Source: RIDOT/OHS (2017); FARS (2017). Note: National safety belt use rates for 2016 are not available at this time.
74% 79%
72% 75% 78%
80%
78%
86%
87%
87%
88%
81%
82%
83%
84%
85%
84%
86%
87%
87%
89%
90%
0%
10%
20%
30%
40%
50%
60%
70%
80%
90%
100%
2006 2007 2008 2009 2010 2011 2012 2013 2014 2015 2016
Rhode Island USA

Rhode Island Highway Safety Plan | FFY 2018
61 Highway Safety Countermeasures and Projects
Figure 4.2 Restraint Nonuse for Rhode Island Motor Vehicle Fatalities
Source: RIDOT/OHS (2017).
Table 4.1 Motor Vehicle Fatalities by Restraint System – Use and Nonuse (2016)
Driver Passenger Total None Used/Not Applicable 9 6 15
Shoulder and Lap Belt 12 2 14
Child Restraints 0 0 0
Unknown 2 0 2
Total 23 8 31 Source: FARS (2017) - Preliminary.
19
29
33
26
23
20
17
10
1614
0
5
10
15
20
25
30
35
2006 2007 2008 2009 2010 2011 2012 2013 2014 2015 2016 2017
FATA
LITIES

Rhode Island Highway Safety Plan | FFY 2018
62 Highway Safety Countermeasures and Projects
Figure 4.3 Number of Unrestrained Fatalities by Age Group 2011 to 2016
Source: RIDOT/OHS (2017).
Figure 4.4 Unrestrained Fatalities by Race (2011 to 2015)
Source: RIDOT/OHS, 2016.
13%
13%
23%
12%
13%
6%
20%
Age 16‐20
Age 21‐24
Age 25‐34
Age 35‐44
Age 45‐54
Age 55‐64
Age 65+
79%
8%
0%0%
11%
2%
White
Black
Asian
American Indian
Hispanic
Unknown

Rhode Island Highway Safety Plan | FFY 2018
63 Highway Safety Countermeasures and Projects
Table 4.2 Top Five Cities/Towns for Unrestrained Motor Vehicle Occupant Fatalities (2011-2015)
City/Town 2011 2012 2013 2014 2015 Total
Providence 2 3 3 0 4 12
Warwick 3 4 2 0 1 10
North Kingstown 3 0 0 1 2 6
Pawtucket 1 0 1 0 4 6
Coventry 1 1 1 1 1 5
Source: RIDOT/OHS, (2016)
Child Passenger Safety
While unrestrained child fatalities have not been observed in the most recent five years, OHS places a high importance on providing the education and resources necessary for all families to provide appropriate child passenger safety while riding in a vehicle. Table 4.3 lists planned Child Passenger Safety Technician Events planned for FFY 2018. Table 4.4 summarizes the active network of child restraint inspection stations proposed for FFY 2018.
Table 4.3 CPST Certification Events
Class No. of Classes
No. of Students
Location
CPST Certification Course
2 40
Injury Prevention Center
Rhode Island Hospital
55 Claverick Street
Providence, RI 02903
CPST Certification Renewal Course
1 TBD
Injury Prevention Center
Rhode Island Hospital
55 Claverick Street
Providence, RI 02903
CPST Update 1 100
Source: RIDOT/OHS, (2017)

Rhode Island Highway Safety Plan | FFY 2018
64 Highway Safety Countermeasures and Projects
Table 4.4 Active Network of Child Restraint Inspection Stations FFY 2018
City/Town Urban/Rural Population At Risk Area State Police Hope Valley, Richmond statewide Lincoln Woods, Lincoln statewide Portsmouth, Portsmouth statewide Scituate, Scituate statewide Wickford, North Kingstown statewide Local Police Barrington Urban 16,310 Bristol Urban 22,954 Burrillville Urban/Rural 15,955 Central Falls Urban 19,376 Yes Coventry Urban/Rural 35,014 Cranston Urban/Rural 80,387 Cumberland Urban 33,506 East Greenwich Urban/Rural 13,146 East Providence Urban 47,037 Jamestown Urban 5,405 Johnston Urban/Rural 28,769 Lincoln Urban 21,105 Middletown Urban 16,150 Newport Urban/Rural 24,672 Yes North Providence Urban 26,486 Pawtucket Urban 71,148 Yes Portsmouth Urban 17,389 Providence Urban 178,042 Richmond Urban 7,708 Yes Smithfield Urban/Rural 21,430 South Kingstown Urban/Rural 30,369 Tiverton Urban/Rural 15,780 Warren Urban 10,611 Warwick Urban 82,672 West Warwick Urban 29,191 Westerly Urban/Rural 17,936 Woonsocket Urban 41,186 Yes
TOTAL POPULATION SERVED 929,734 (88%) Other Women & Infants Hospital, Providence, RI Brown University, Providence, RI Department of Public Safety, Providence, RI Connecting for Children and Families, Woonsocket, RI Injury Prevention Center, Rhode Island Hospital, Providence, RI
Source: RIDOT/OHS, (2017).

Rhode Island Highway Safety Plan | FFY 2018
65 Highway Safety Countermeasures and Projects
Strategic Partners
The OHS works primarily with 38 local law enforcement agencies and the RISP as partners for national traffic safety initiatives to increase safety belt use. More recently, OHS began working with schools and communities to reach younger drivers and older drivers. Similar to past years, in FFY 2018, OHS will continue to expand this network to include:
› An expanded school-based network to promote safety belt use with a focus on teens via the “buckle up seat belt shuffle challenge” among schools; and
› A community-based network to promote safety belt use by establishing connections with local organizations, senior centers, and religious leaders.
Alignment with the SHSP
The 2017-2022 SHSP includes the following strategies to reduce unrestrained occupant fatalities:
› Leadership
Establish an Occupant Protection Task Force to engage leadership from various agencies on occupant protection issues.
Staff key occupant protection program positions.
› Criminal Justice System
Continue sustained high visibility enforcement of occupant protection laws.
Develop an occupant protection enforcement work plan.
Assess the quality of occupant protection enforcement efforts.
Provide continuing education efforts for law enforcement.
Explore regulations to increase restraint use.
› Prevention & Treatment
Support education and outreach to provide information concerning occupant protection laws.
Establish employer and fleet programs to increase seat belt use.
› Evaluation
Improve the quality of occupant restraint use data.
Use data to target occupant protection efforts.
Performance Targets › Goal. Reduce the five-year average unrestrained occupant fatalities by 11 percent
from 18 (2011 to 2015 average) to 16 (2014 to 2018 average) by 2018.
Justification. Unrestrained fatalities in Rhode Island have generally decreased for the last five years. There was a slight rise in crashes in 2015, however, preliminary data for 2016 suggests that the number of annual crashes will come down again. From 2014 to 2016 crashes are not projected to reach 2013 and prior levels, which is when the primary seat belt law changed. The goal for this performance measure is 16 fatalities (5-year average) in 2018.

Rhode Island Highway Safety Plan | FFY 2018
66 Highway Safety Countermeasures and Projects
› Goal. Increase observed seat belt use from 87.5 percent in 2015 to 91 percent by 2018.
Justification. Since the 2013 removal of the sunset on the primary seat belt law seat belt usage has made very minor but steady improvements. The intent is for the rate to continue to rise to 91 percent by 2018, which is achievable with the continuation of the primary seat belt law, fines, enforcement, and education programs.
› Goal. Increase safety belt use among pickup truck drivers, as measured by observations, from 76.7 percent in 2016 to 80 percent in 2018.
Justification. Pickup drivers exhibit the lowest safety belt use rate among the vehicle types tracked in the annual Rhode Island seat belt use survey, ten percent less than passenger cars. Changing the safety behavior of these users is a key component of the initiatives in the HSP. A dedicated enforcement and education focus on these users will help move percentage use upwards.
› Goal. Increase awareness of the Click It or Ticket slogan, as measured by a DMV intercept survey, from 88.9 percent in 2016 to 92 percent in 2018.
Justification. Rhode Island survey respondents in prior years exhibited an awareness of the CIOT slogan above 90 percent. With dedicated efforts between CIOT partners, Rhode Island can move toward this target.
› Goal. Increase the perception people will be ticketed for failure to wear safety belts “always” or “nearly always,” as measured by a DMV intercept survey, from 46.4 percent in 2016 to 47 percent in 2018.
Justification. The percentage of responses to this survey question that are “always” or “nearly always” increased from 41 percent in 2014 to over 46 percent in 2016. Building on the exhibited success of Rhode Island efforts will continue to move this percentage upward.
List of Countermeasures (Strategies)
1. Increase awareness among drivers that Rhode Island law requires all drivers and passengers to wear safety belts and failure to do so is a “primary offense.” Increase the perception among Rhode Island drivers that a motorist who is not wearing a safety belt, or whose passengers are not wearing their seat belts, will be cited by police:
a. Conduct Click It or Ticket (CIOT) media campaigns.
b. Conduct a CIOT enforcement campaigns (five weeks from November 23, 2015 to November 29, 2016; from March 21, 2017 to March 27, 2017; from May 23, 2017 to June 5, 2017; and from September 19 2017 to September 25, 2017).
c. Expand the number of agencies conducting nighttime safety belt enforcement.
d. Maintain an aggressive sports marketing campaign.
2. In media and education programs, address at-risk communities (males, pickup truck drivers, counties with a high percentage of unbelted fatalities, and low belt-use rate counties):
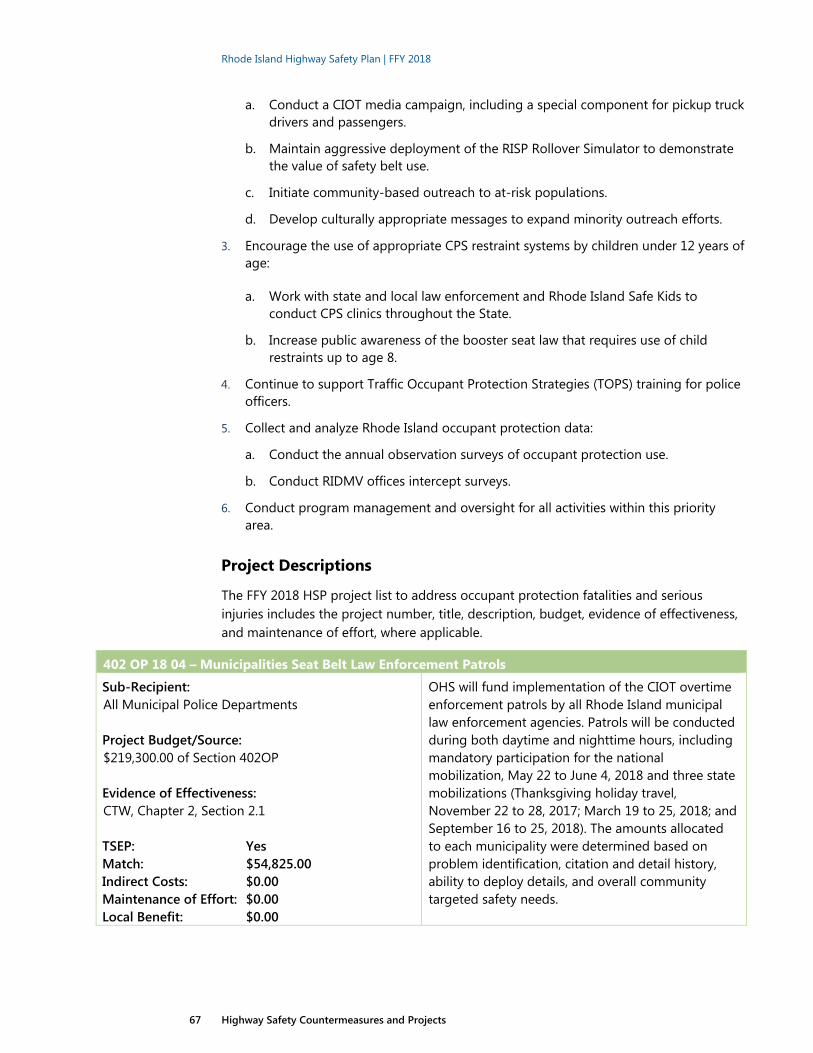
Rhode Island Highway Safety Plan | FFY 2018
67 Highway Safety Countermeasures and Projects
a. Conduct a CIOT media campaign, including a special component for pickup truck drivers and passengers.
b. Maintain aggressive deployment of the RISP Rollover Simulator to demonstrate the value of safety belt use.
c. Initiate community-based outreach to at-risk populations.
d. Develop culturally appropriate messages to expand minority outreach efforts.
3. Encourage the use of appropriate CPS restraint systems by children under 12 years of age:
a. Work with state and local law enforcement and Rhode Island Safe Kids to conduct CPS clinics throughout the State.
b. Increase public awareness of the booster seat law that requires use of child restraints up to age 8.
4. Continue to support Traffic Occupant Protection Strategies (TOPS) training for police officers.
5. Collect and analyze Rhode Island occupant protection data:
a. Conduct the annual observation surveys of occupant protection use.
b. Conduct RIDMV offices intercept surveys.
6. Conduct program management and oversight for all activities within this priority area.
Project Descriptions
The FFY 2018 HSP project list to address occupant protection fatalities and serious injuries includes the project number, title, description, budget, evidence of effectiveness, and maintenance of effort, where applicable.
402 OP 18 04 – Municipalities Seat Belt Law Enforcement Patrols
Sub-Recipient: All Municipal Police Departments Project Budget/Source: $219,300.00 of Section 402OP Evidence of Effectiveness: CTW, Chapter 2, Section 2.1 TSEP: Yes Match: $54,825.00 Indirect Costs: $0.00 Maintenance of Effort: $0.00 Local Benefit: $0.00
OHS will fund implementation of the CIOT overtime enforcement patrols by all Rhode Island municipal law enforcement agencies. Patrols will be conducted during both daytime and nighttime hours, including mandatory participation for the national mobilization, May 22 to June 4, 2018 and three state mobilizations (Thanksgiving holiday travel, November 22 to 28, 2017; March 19 to 25, 2018; and September 16 to 25, 2018). The amounts allocated to each municipality were determined based on problem identification, citation and detail history, ability to deploy details, and overall community targeted safety needs.

Rhode Island Highway Safety Plan | FFY 2018
68 Highway Safety Countermeasures and Projects
402 OP 18 02 – State Agencies (RISP) Seat Belt Law Enforcement Patrols
Sub-Recipient: Rhode Island State Police Project Budget/Source: $10,720.00 of Section 402OP Evidence of Effectiveness: CTW, Chapter 2, Section 2.1 TSEP: Yes Match: $2,680.00 Indirect Costs: $0.00 Maintenance of Effort: $0.00 Local Benefit: $0.00
OHS will fund implementation of the CIOT overtime enforcement patrols by the RISP. Patrols will be conducted during both daytime and nighttime hours, including mandatory participation for the national mobilization, May 22 to June 4, 2018 and three state mobilizations (Thanksgiving holiday travel, November 22 to 28, 2017; March 19 to 25, 2018; and September 16 to 25, 2018).
402 OP 18 05 – Municipalities Child Passenger Safety (CPS)
Sub-Recipient: All Municipal Police Departments Project Budget/Source: $90,000.00 of Section 402OP Evidence of Effectiveness: CTW, Chapter 2, Section 5.1 TSEP: Yes Match: $22,500.00 Indirect Costs: $0.00 Maintenance of Effort: $0.00 Local Benefit: $0.00
This project provides funds for Rhode Island municipal police departments with qualified personnel (nationally certified Child Passenger Safety Technicians) to conduct CPS checks on an appointment basis. We expect that the car seat inspections will take place regularly throughout the Federal Fiscal Year timeline, declining during the winter. We have 34 municipalities participating in this project. Funding is included to enable the agency to send at least one CPST to the Rhode Island Safe Kids one-day CPST Update. The amounts allocated to each municipality were determined based on the problem identification, citation and detail history, ability to deploy details, and overall community targeted safety needs.
402 OP 18 03 - State Agencies (RISP) Child Passenger Safety (CPS)
Sub-Recipient: Rhode Island State Police Project Budget/Source: $4,000.00 of Section 402OP Evidence of Effectiveness: CTW, Chapter 2, Section 5.1 TSEP: Yes Match: $1,000.00 Indirect Costs: $0.00 Maintenance of Effort: $0.00 Local Benefit: $0.00
This project provides funds for RISP personnel to conduct CPS checks on an appointment basis at any of the five RISP barracks (Scituate, Lincoln Woods, Wickford, Hope Valley, and Portsmouth) by officers who are CPSTs. We expect that the car seat inspections will take place regularly through the Federal Fiscal Year, declining during the winter.

Rhode Island Highway Safety Plan | FFY 2018
69 Highway Safety Countermeasures and Projects
402 OP 18 08 – Rhode Island Hospital/Lifespan Car Seat Distribution/CPS Education for to Low-Income Families/Pediatric Practice CPST/CPST Update Continuing Education Event
Sub-Recipient: Rhode Island Hospital Project Budget/Source: $64,914.00 of Section 402OP Evidence of Effectiveness: CTW, Chapter 2, Section 7.2 TSEP: No Match: $27,748.34 Indirect Costs: $14,001.05 Maintenance of Effort: $0.00 Local Benefit: $0.00
OHS will reimburse Safe Kids Rhode Island for the expenses related to providing a full-time to assist families with car seat installation and use. The CPST also will answer caregivers’ questions about child restraints and will provide families with educational materials. Safe Kids Rhode Island will evaluate the program by having parents fill out a knowledge survey at the initial interaction, and then reassess families approximately four months later with both a second survey to compare to the first and a second car seat check. Families that participate in the follow-up will be provided with a backless booster seat. This award will encompass 20 percent of the Director’s salary and 100 percent of two part-time program coordinators from LifeSpan.
402 OP 18 11 – CIOT Observational Surveys
Sub-Recipient: Rhode Island Department of Transportation Project Budget/Source: $69,500.00 of Section 402OP Evidence of Effectiveness: NHTSA Requirement TSEP: No Match: $17,375.00 Indirect Costs: $0.00 Maintenance of Effort: $0.00 Local Benefit: $0.00
OHS will conduct the annual “Mini-Pre” paid and earned media and enforcement observational safety belt use survey in May and the full observational safety belt survey following the enforcement period in June, according to NHTSA regulations.
402 PM 18 01 – Paid Media (OP)
Sub-Recipient: State-Approved Media Vendor
Project Budget/Source: $200,000.00 of Section 402PM Evidence of Effectiveness: CTW, Chapter 2, Section 3.2 TSEP: No Match: $50,000.00 Indirect Costs: $0.00 Maintenance of Effort: $0.00 Local Benefit: $0.00
OHS will develop and implement a statewide paid and earned media campaign for the CIOT campaigns scheduled for November 2017, March 2018, May 2018, and September 2018. The target audience will be 18- to 34-year old males. Media materials will be produced in both English and Spanish with the venues chosen based on market data for each audience. This task will meet the requirements within the Grant Funding Policy Part II E by ensuring that all television advertisements include closed captioning. In addition, this project will be evaluated based on the criteria set out in the Section 402 Advertising Space Guidance.

Rhode Island Highway Safety Plan | FFY 2018
70 Highway Safety Countermeasures and Projects
402 PM 18 02 – Creative Media (OP)
Sub-Recipient: State-Approved Media Vendor Project Budget/Source: $100,000.00 of Section 402PM Evidence of Effectiveness: CTW, Chapter 2, Section 3.1 TSEP: No Match: $25,000.00 Indirect Costs: $0.00 Maintenance of Effort: $0.00 Local Benefit: $0.00
OHS will contract with a State of RI approved media consultant to create and produce a major occupant restraint campaign. Our target market would be rural drivers. Pickup truck drivers (majority located in rural sections of state) remain high in unbelted usage rates. Our consultant will target that area using media components which attract that population. We will use Texas DOT “Buckle Up in Your Truck” 2011 campaign as a starting point for our creative media campaign.
402 OP 18 10 – CIOT DMV Intercept Survey
Sub-Recipient: Rhode Island DOT Project Budget/Source: $11,550.00 of Section 402OP Evidence of Effectiveness: NHTSA Recommendation TSEP: No Match: $2,887.50 Indirect Costs: $0.00 Maintenance of Effort: $0.00 Local Benefit: $0.00
“Pre” and “Post” DMV office intercept surveys will be conducted to assess the public awareness and effectiveness of the CIOT media and enforcement campaigns conducted with the national mobilization of May 23, 2018 to June 5, 2018. The survey will be revised to better understand the demographics of those individuals that do not recognize the CIOT slogan. This will allow OGS to better target media and campaign efforts in terms or communication medium, target audience, and funding required.
402 OP 18 07 – State Agencies (RISP) – Rollover Simulator Demonstrations
Project Budget/Source: $15,000.00 of Section 402OP Evidence of Effectiveness: CTW, Chapter 2, Section 3.1 – 3.2 and 6.1 – 6.2 TSEP Yes Match: $3,750.00 Indirect Costs: $0.00 Maintenance of Effort: $0.00 Local Benefit: $0.00
OHS will work with RISP to promote and conduct Rollover Simulator demonstrations in as many locations as possible (with a warranted size audience). For each demonstration, two persons are required to operate the Simulator. Wherever possible, one RISP officer and an OHS Program Manager (all have been trained for these demonstrations) will attend the event. If a program manager is not available, OHS will fund two RISP officers for the event. The projected number of demonstrations for FY 18 will be approximately 16

Rhode Island Highway Safety Plan | FFY 2018
71 Highway Safety Countermeasures and Projects
based on a four-year average.
2012 – 16
2013 – 13
2014 – 19
2015 – 15
This office has noticed a steady increase in OP safety day requests with the Rollover Simulator. The State Police has posted a Rollover Request form link to the Department web site for the general public to make requests directly without the need for telephone or personal contact. The Simulator and tow vehicle are utilized by the RISP for many functions to include; school career and safety fairs, college demonstrations, high school football games, Pawtucket Red Sox safety events, church safety events, touch-a-truck details, Construction Career Days, municipality safety days for local law enforcement and fire agencies, and numerous other events. As the Rollover Simulators’ popularity increases, so do the requests for its presence.
The RISP has trained and certified a large group of Troopers on mechanics, operation, and presentation for “Rollover Simulator” demonstrations. These demonstrations present a graphic depiction, without the risk on human life, of the consequences of not properly wearing a safety belt while inside a motor vehicle. For each detail – two Troopers are assigned, no exceptions. The Planning and Research Unit requires one Rollover Check Sheet be completed for each detail by assigned Troopers. This check sheet includes mechanic/operative checks before, during, and after the event. These steps are clearly labeled to ensure proper care and maintenance of the simulator. The RISP has received many phone calls, personal letters, and accolades from patrons who have coordinated a Rollover event. Evaluations of this nature from the general public, along with a steady increase in detail requests proves that the Rollover Simulator continues to grow in popularity and prove a valuable tool in the realm of highway safety education for each and every member of the community.

Rhode Island Highway Safety Plan | FFY 2018
72 Highway Safety Countermeasures and Projects
402 SA 18 07 - Student Safety Educational Information (OP)
Sub-Recipient: Rhode Island Department of Transportation Project Budget/Source: $25,000.00 of Section 402SA Evidence of Effectiveness: CTW, Chapter 2, Section 6.1 TSEP: No Match: $6,250.00 Indirect Costs: $0.00 Maintenance of Effort: $0.00 Local Benefit: $0.00
OHS will create appropriate educational and resource material and develop new dissemination points across Rhode Island. This material will include city/town and state programs for all age levels addressing, among other issues, CPS and CIOT. We’ve begun developing localized brochures and booklets addressing our safety issue areas. The funds are meant to create, produce, and print several of them. These materials will replace the multiple promotional items previously purchased. Our 2016 Impaired Driving and Occupant Protection assessments suggested developing educational and informational materials to support all our programs.
M2 PE 18 03 – Paid Media (CPS)
Sub-Recipient: State-Approved Media Vendor Project Budget/Source: $25,000.00 of Section 405B Evidence of Effectiveness: CTW, Chapter 2, Section 6.2 TSEP: No Match Amount: $6,250.00 Indirect Cost: $0.00 Maintenance of Effort: $0.00 Local Benefit: $0.00
OHS will inform the public via paid media of all the steps of child restraints, including infant seats, convertible seats, forward facing seats, booster seats, and safety belts. The media buy is expected to cover on-line/web/Internet and “out of home” (billboard/bus) with the target market of parents and caregivers, with emphasis on women between 18 and 40. The media buy will coincide with the National Child Passenger Safety Week. This task will meet the requirements within the Grant Funding Policy Part II E by ensuring that all television advertisements include closed captioning. In addition, this project will be evaluated based on the criteria set out in the Section 402 Advertising Space Guidance.
402 SA 18 05 – Buckle Up Before You Start Up (Oasis International)
Project Budget/Source: $15,000.00 of Section 402SA Evidence of Effectiveness: CTW, Chapter 2, Section 1 TSEP: No Match: $3,750.00 Indirect Costs: $0.00 Maintenance of Effort: $0.00 Local Benefit: $0.00
Oasis International will work with African Groups, Mosques, and Faith-Based Organizations to continue providing seatbelt education to the African Immigrant and African American residents of Providence with emphasis on residents of the Southwest Providence. The problem they will address is how to increase seatbelt use among the African immigrant and low-to-moderate income residents in Providence with an emphasis on residents of Southwest Providence, which have been identified as their target market. They will use culturally competent materials that they developed

Rhode Island Highway Safety Plan | FFY 2018
73 Highway Safety Countermeasures and Projects
to deliver seatbelt safety messaging to the identified target population. Oasis has trained 15 community residents as presenters and has recruited 8 interpreters who are competent in several African tribal presentations to deliver their presentations. Their presentations include:
Explaining the Rhode Island Primary Seatbelt Law
Present Statistics on Seatbelt Use in Rhode Island
Fatality Rates When Not Using Seatbelts Lives Saved When Seatbelts Are Used
Oasis' PSA Video on Seatbelt Use
Question and Answer Portion with Community
Oasis is looking through this grant to double the percentage of the population reached in the past to 4,000 people. To measure behavioral changes among participants in all the workshops, they will use a pre and post-survey.
402 OP 18 09 – Connecting Children and Families Primary Seatbelt Education and “SHIELD FOR LIFE” Program
Sub-Recipient: Connecting for Children and Families Project Budget/Source: $20,515.00 of Section 402OP Evidence of Effectiveness: CTW, Chapter 2, Section 1 TSEP: No Match Amount: $5,128.75 Indirect Costs: $1,865.00 Maintenance of Effort: $0.00 Local Benefit: $0.00
Connecting for Children and Families, in cooperation with the Woonsocket Education Department, will build upon their successful seatbelt safety program “Shield for Life” that educates Rhode Islanders about the State’s primary seatbelt law. The program also promotes driver safety habits, including seatbelt use. The project’s objective is to increase awareness about and adherence to seatbelt laws, with a primary focus on strategies that are tailored to reach an economically, culturally, and ethnically diverse audience of males aged 18-35. “Shield For Life” presentations will be one strategy facilitated by the Partnership once again. The program uses a presentation format to educate participants about driver and passenger seatbelt safety. A “Shield For Life” PSA will be created and presented on-line and on radio. Outreach efforts include education information dissemination, driver education partners, outreach to hair salon and barber shop venues and they will host a Mother’s Day awareness event to highlight child passenger safety and a parent’s role in providing that safety. Their program also includes outreach to high schools and colleges. The program will use a pre/post-testing evaluation component.

Rhode Island Highway Safety Plan | FFY 2018
74 Highway Safety Countermeasures and Projects
M2 HVE 18 01 – State Agencies (URI) Seat Belt Law Enforcement Patrols
Sub-Recipient: University of Rhode Island Project Budget/Source: $1,000.00 of Section 405B Evidence of Effectiveness: CTW, Chapter 2, Section 7.1 TSEP: Yes Match: $250.00 Indirect Costs: $0.00 Maintenance of Effort: $0.00 Local Benefit: $0.00
OHS will fund implementation of the CIOT overtime enforcement patrols by the URI Police Department. Patrols will be conducted during both daytime and nighttime hours, including mandatory participation for the national mobilization, May 22 to June 4, 2018 and three state mobilizations (Thanksgiving holiday travel, November 22 to 28, 2017; March 19 to 25, 2018; and September 16 to 25, 2018).
402 OP 18 06 – Buckle Up Saves Lives Series and Statewide Seatbelt Challenge
Sub-Recipient: Warwick Police Department Project Budget/Source: $25,000.00 of Section 402OP Evidence of Effectiveness: CTW, Chapter 2, Section 7.1 TSEP: No Match: $6,250.00 Indirect Costs: $0.00 Maintenance of Effort: $0.00 Local Benefit: $0.00
Warwick Police Department, with the assistance of the OHS, will offer all Rhode Island high schools the opportunity to participate in this data-driven, seat belt-focused program. Students will work to develop a week of seat belt-related awareness at their schools. Efforts will include local media. OHS will be available to participate in awareness activities. The week of awareness will be preceded and followed by seat belt observational surveys to be conducted by students at their school parking lot. Survey evaluation will determine the effectiveness of the awareness/education program.
4.2 Impaired Driving
Problem Identification and Analysis
Alcohol-impaired driving continues to be a significant contributing factor in Rhode Island’s crash fatalities and serious injuries. Alcohol-impaired crashes accounted for 42 percent of the total crashes in 2016, second to speed-related at 44 percent. Figure 4.5 shows that alcohol impairment in fatal crashes in Rhode Island in 2015 significantly exceed that of New England (34%) and the nation (29%). This trend of Rhode Island having a higher proportion of impaired driving fatalities than New England or the nation has been true for eight of the last 10 years. Based on NHTSA imputed data from 2011 through 2015, the majority of Rhode Island’s alcohol-related fatalities involved a driver or motorcycle operator with a BAC greater than or equal to the legal limit of 0.08, as shown in Figure 4.6.
Rhode Island Highway Safety Plan | FFY 2018
75 Highway Safety Countermeasures and Projects
Over a quarter (27%) of impaired driving fatal crashes involved a driver age 21-24 years old. The Cities of Providence and Warwick have the highest number of impaired driver fatal crashes with 16 fatalities and 10 fatalities respectively over the most recent five year period (2011-2015).
This information will be used to develop appropriate educational and marketing materials and target enforcement activities to reduce impaired driving fatalities.
Several state laws, policies, and practices affect how the State identifies, enforces, and reports on impaired driving:
› In July 2003, Rhode Island enacted a law making it a crime for anyone to operate a motor vehicle with a BAC of 0.08 or above. For young drivers, a BAC level of 0.02 results in license suspension until the age of 21.
› The Rhode Island Supreme Court has ruled that sobriety checkpoints are unconstitutional.
› A police officer may or may not indicate suspicion of alcohol involvement in a crash report.
› BAC testing is often performed only on persons who are killed in a crash and not on surviving drivers.
› Prior to June 28, 2006, refusing a chemical test carried a lower penalty than a DUI, resulting in a greater number of citations for chemical test refusals. The significant number of refusals severely limited the availability of BAC data and hindered problem identification. On June 28, 2006, Governor Carcieri signed legislation doubling the license suspension for a first offense refusal; criminalizing second and subsequent offenses; increasing fines, imprisonment, and license suspensions; and requiring community service. The intent of the law was to make the choice of chemical test refusal less attractive and increase BAC data.
The Rhode Island DUI law provides for higher sanctions at increasing BAC levels: 0.08 to <0.10, 0.10 to <0.15, and 0.15 and greater. Of the 58 drivers and motorcycle operators involved in fatal crashes in 2015, 46 were male; 11 were female; and 1 was unknown. Table 4.6 provides the BAC test results for these drivers.
Drugs also are prevalent in the State’s motor vehicle crashes. Table 4.7 identifies the types of drugs that are most frequently detected in cases involving motor vehicles. The data were obtained from medical examiner and law enforcement cases.
During FFY 2017 RIDOT, the Director, and the OHS placed a new emphasis on reducing and eliminating impaired driving crashes. This effort included establishing a 10-year plan for eliminating impaired driving crashes that is tied to funding needs and identifies potential sources. Through this planning effort, OHS and its partners also began to expand the conversation around impaired driving to include drugged driving and are working to better understand the magnitude and impacts of drugged driving in Rhode Island.
One of the notable outcomes of this renewed emphasis on reducing impaired driving fatalities was the previously described #beyondthecrash social media campaign. This campaign was completed in partnership with the Rhode Island State Police. It featured law enforcement officers describing how they have been impacted by impaired driving fatalities.

Rhode Island Highway Safety Plan | FFY 2018
76 Highway Safety Countermeasures and Projects
In FFY 2018 we are planning to develop the identical campaign to include not only law enforcement voices but those of parents, medical professionals, victims, and offenders. We think it would increase ownership of the problem and awareness of the problem.
During FFY 2016 RIDOT OHS invited NHTSA to lead an impaired Driving Assessment. During FFY 2018 OHS will continue to make efforts to employ strategies which support many of the recommendations. Some of the recommendations we hope to realize during FFY 2018 are listed below.
Key Impaired Driving Assessment Recommendations › Program Management and Strategic Planning
Continue the Rhode Island Impaired Driving Alliance.
› Prevention
Conduct an analysis of the relationship between tax, price, sales and consumption in Rhode Island to understand the recent dramatic change in apparent consumption and determine the potential impact of sustaining recent temporary tax increases.
Enact a comprehensive social host liability statute.
Integrate needs assessment and prevention goals and objectives from the Strategic Plan for Substance Abuse Prevention; the Preventing Violence and Injuries a Plan for the State and other alcohol and substance abuse and health promotion plans with highway safety plans.
› Criminal Justice System
Strengthen sanctions for DUI.
Pass a law or Constitutional Amendment specifically sanctioning sobriety checkpoints.
Pass a statute creating an enhanced penalty for DUI where any injury occurs.
Amend the law to allow for officers to seek and secure blood draw warrants to gather evidence in all DUI cases.
Continue to provide traffic data to law enforcement agencies and encourage data driven traffic enforcement initiatives.
Execute a thorough examination of the statewide practices of sentencing and reductions and create data driven uniformity of terms, appropriate monitoring of offenders and enforcement of terms for consistency across the State.
Prohibit the practice of attorneys serving as both prosecuting Solicitors and defense attorneys.
Develop a DUI tracking system that is available to all those who interact with impaired drivers so that a driver can be tracked from arrest through adjudication to post-adjudication treatment and compliance.
› Program Evaluation and Data
Develop a DUI tracking system that is available to all those who interact with impaired drivers so that a driver can be tracked from arrest through adjudication to post-adjudication treatment and compliance.
Require reporting of any charge of DUI to the driver history record, regardless of disposition.

Rhode Island Highway Safety Plan | FFY 2018
77 Highway Safety Countermeasures and Projects
Figure 4.5 Driving Fatalities Involving BAC ≥0.08
Source: FARS (2017). Note: Reflects NHTSA imputed data.
Figure 4.6 Alcohol-Related Fatalities
Source: FARS (2017). Note: Reflects NHTSA imputed data.
8
7
3
6
4
3
5
4
1
4
30
22 23
34
27
26
28
23
18 19
0
5
10
15
20
25
30
35
40
2006 2007 2008 2009 2010 2011 2012 2013 2014 2015
BAC 0.01‐0.07 BAC ≥ 0.08
37%
32% 35%
41%
40%
39%
38%
36%
34%
42%
34% 35%
31% 34%
34%
33%
34% 36%
37%
34%
32%
32%
31%
32%
31%
30%
31%
31%
31%
29%
0%
5%
10%
15%
20%
25%
30%
35%
40%
45%
50%
2006 2007 2008 2009 2010 2011 2012 2013 2014 2015
Rhode Island New England USA

Rhode Island Highway Safety Plan | FFY 2018
78 Highway Safety Countermeasures and Projects
Figure 4.7 Drivers and Motorcycle Operators in Fatal Crashes with BAC ≥ 0.08 by age (2011 to 2015)
Source: FARS (2017).
Figure 4.8 Alcohol Involved Drivers in Fatal Crashes by Race 2011 to 2015
Source: FARS (2017). Note: Zero alcohol involved drivers in fatal crashes were identified as Asian.
7%
21%
27%
15%
26%
3% 1%
Age 16‐20
Age 21‐24
Age 25‐34
Age 35‐44
Age 45‐54
Age 55‐64
Age 65+
80%
7%
10%1%2%
White
Black
Asian
Hispanic
All Other Races
Unknown

Rhode Island Highway Safety Plan | FFY 2018
79 Highway Safety Countermeasures and Projects
Table 4.5 Top Five Cities/Towns by Fatal Impaired Driving Crashes
City/Town 2011 2012 2013 2014 2015 Total Providence 4 3 3 1 5 16 Warwick 3 2 2 2 1 10 North Kingstown 2 1 0 1 3 7 South Kingstown 1 2 1 1 0 6 Coventry, Cranston, Pawtucket, Portsmouth, and Woonsocket 5
Source: RIDOT/OHS (2016) Note: Five municipalities each had 5 impaired driving related fatalities in the period 2011-2015. Table 4.6 BAC Test Results and Gender for Drivers or Motorcycle Operators Involved in Fatal Crashes
(2015)
Male Female Unknown/Blank Total
BAC Test None Given 15 8 1 24
BAC 0.00 14 2 0 16
BAC 0.01-0.07 3 0 0 3
BAC 0.08-0.14 3 0 0 3
BAC 0.15-0.19 7 0 0 7
BAC greater than 0.19 4 1 0 5
Blank 0 0 0 0
Total 46 11 1 58
Total BAC 0.01+ 17 1 0 18
Total BAC 0.08+ 14 1 0 15 Source: FARS (2017). Table 4.7 Most Frequently Detected Drugs in Motor Vehicle-Related Cases (2016)
Detected Drug
Detection Frequency (Percent of Total Cases)
(N=203) THC and/or metabolites (marijuana) 63%
Narcotic analgesics/Opiates 57%
Benzodiazepines 49%
Antidepressants/psychotics 12%
Cocaine and/or metabolites 16%
Other CNS Depressants (Sedatives, sleeping agents, muscle relaxants)
13%
Amphetamine 2%
Source: Statistics compiled by the Forensic Toxicology Laboratory (RIDOH Forensic Sciences Unit), 2017.

Rhode Island Highway Safety Plan | FFY 2018
80 Highway Safety Countermeasures and Projects
Strategic Partners
These OHS initiatives complement the activities of other partners, such as Rhode Island State Police, MADD and SADD; Department of Behavioral Healthcare, Developmental Disabilities and Hospitals (BHDDH), Division of Behavioral Health Care Services’ Enforcing the Underage Drinking Laws Advisory Committee; Substance Abuse Task Forces; the Department of Health and its Injury Prevention Plan; the Attorney General’s Office; the Department of Corrections; the University of Rhode Island’s Transportation Center; and the Judiciary.
Alignment with the SHSP
The 2017-2022 SHSP includes the following strategies to reduce impaired driving fatalities:
› Leadership
Develop an Impaired Driving and Drugged Driving Plan and update it on a regular basis.
Establish an Impaired and Drugged Driving Commission.
Recruit active involvement of State agency directors, local representatives, and business leaders.
Recruit alternative driving leaders.
Create joint media efforts between other state agencies and businesses.
› Criminal Justice System
Explore legislation to strengthen impaired driving laws and the enforcement of these laws.
Establish training for law enforcement and officers of the court on best practices for impaired and drugged driving policies.
› Prevention & Treatment
Conduct public training on impaired driving identification.
Identify legislative actions to prevent driving impairment.
Develop advertising that is unique to Rhode Island.
Identify legislative actions to address treatment of substance abusers.
Create effective DUI offender tracking system statewide.
Identify training opportunities to educate key stakeholders on treatment options.
Provide recommendations on how DUI and drugs are handled by the court system.
› Evaluation
Obtain data on dispositions of arrests for DUI and Refusal, calculate conviction rate and compare rates of A.G.'s Office vs. Municipal Solicitors.
Obtain number of interlocks installed monthly and annually.

Rhode Island Highway Safety Plan | FFY 2018
81 Highway Safety Countermeasures and Projects
Conduct Data Driven Approach to Crime and Traffic Safety (DDACTS) training for all law enforcement.
Implement mandatory evaluation for all OHS supported sub-recipients.
Performance Targets › Goal. Reduce the five-year average impaired driving fatalities by 9 percent from 23
(2011 to 2015 average) to 21 (2014 to 2018 average) by 2018.
Justification. Between 2011 and 2015 5-year average fatalities have remained between a low of 23 and a high of 28 with 2015 having the lowest number of average crashes. Despite a small increase of two crashes in 2015, Rhode Island will move toward its TZD goal by establishing a target of 21 fatalities, consistent with the percentage decline proposed in other performance measures. This is a reflection on the high level of importance RIDOT and the OHS have placed on mitigating impaired driving crashes through recent and upcoming education, media, and enforcement campaigns.
› Goal. Increase the percentage of survey participants responding “Always” or “Nearly Always” to the chances of getting arrested by law enforcement after drinking and driving from 47.4 percent in 2015 to 60 percent in 2018.
Justification. The percentage of responses to this survey question that are “always” or “nearly always” was 60 percent in 2014. Recalibrating enforcement and education efforts will help move the percentage back and beyond previously exhibited results.
› Goal. Increase percent of survey respondents that recognize the DSoGPO impaired driving enforcement slogan from 55.8 percent recognition in 2016 to 65 percent in 2018.
Justification. Awareness of this slogan rose from 45 percent in 2014 to almost 56 percent in 2016. Continued enforcement and education efforts that build on prior successes will move this percentage upward.
List of Countermeasures (Strategies)
1. Increase average frequency of Operation Blue RIPTIDE (Rhode Island Police Teaming for Impaired Driving Enforcement) patrols.
2. Expand impaired driving resources for state and local law enforcement agencies:
a. Conduct HVE mobilizations and monthly sustained DUI enforcement programs combined with a Variable Message Sign (VMS) program. Launched in FFY 2009, local police departments and the RISP use VMS, with appropriate messaging, for all OHS-funded patrols. Participating agencies also are encouraged to apply for the International Association of Chiefs of Police “Law Enforcement Challenge” Award Program as well as the RIDOT “Chiefs Challenge” Incentive Reward Program.

Rhode Island Highway Safety Plan | FFY 2018
82 Highway Safety Countermeasures and Projects
b. Offer DRE and SFST refresher training courses via the LEHSTC, the latter in coordination with those offered by the Rhode Island Department of Health. Forensic Sciences Section’s Breath Analysis Unit.
c. Continue LEHSTC coordination of Operation Blue RIPTIDE and continue LEHSTC outreach to police chiefs and implementation of traffic safety training initiatives.
d. Promote more timely analysis of specimens by the Rhode Island Department of Health’s Forensic Sciences Section to increase the DUI conviction rate.
3. Expand media messages, including participation in national HVE mobilizations:
a. Conduct HVE Media Campaign.
b. Implement coordinated paid and earned media plan.
c. Promote public awareness of regional saturation patrols under Operation Blue RIPTIDE.
d. Develop culturally appropriate messages and expand minority outreach efforts.
4. Implement youth programs to prevent underage drinking.
5. Continue to fund the MADD-Rhode Island Youth Education and Influencer project, which employs peer-to-peer and environmental underage drinking-and-driving prevention models.
6. Improve collection and analysis of impaired driving data on highway safety in Rhode Island:
a. Increase the quantity and linkage of BAC data in the FARS and Crash Data Management System files.
b. Improve the quality and coordination of alcohol-related databases.
c. Continue to work with the TSRP to evaluate the impact of Rhode Island’s breath test refusal law on refusal rates.
7. Fund 75 percent of the salary of a TSRP within the Attorney General’s Office.
8. Fund 100 percent of the salary of a Traffic Safety Resource Forensic Toxicologist within the Department of Health.
9. Include program management and oversight for all activities within this priority area.
10. Support and enhance the coordination of the Impaired Driving Prevention Alliance and its six sub committees to reduce impaired driving through education and community awareness and enforcement activities.
Project Descriptions
The FFY 2018 HSP project list to address impaired driving fatalities and serious injuries includes the project number, title, description, budget, evidence of effectiveness, and maintenance of effort, where applicable.

Rhode Island Highway Safety Plan | FFY 2018
83 Highway Safety Countermeasures and Projects
M5 HVE 18 04 / 164 AL 18 10 – Municipalities Impaired Driving Law Enforcement Patrols (Including DRE)
Sub-recipient: All Municipal Police Departments Project Budget/ Source: $258,500.00 of Section 405D $90,000.00 of Section 164AL Evidence of Effectiveness: CTW, Chapter 1, Section 2.1 TSEP: Yes Match: $64,625.00 Indirect Costs: $0.00 Maintenance of Effort: $0.00 Local Benefit: $0.00
Implementation of Drive Sober or Get Pulled Over (DSoGPO) overtime enforcement patrols by various municipalities. Each law enforcement agency is funded to participate in the two DSoGPO annual mobilizations scheduled for December 17, 2017 to January 2, 2018 and August 18 to September 4, 2018, as well as monthly sustained enforcement. Patrols are conducted on Thursday, Friday, and Saturday evenings. Participating officers must be fully trained in the use of SFST or DRE detection techniques. Includes funding for overtime for Drug Recognition Experts to perform evaluations of drivers suspected to be under the influence of drugs other than alcohol on an as-needed basis by various local police departments. The amounts allocated to each municipality were determined based on the problem need, historical liquidation rates, and amount requested by the enforcement agency. Every department is encouraged to run details on the weekends – Friday, Saturday into Sunday (Thursday night if clubs have concerts scheduled). Departments follow the NHTSA statistical information on when most fatal and serious car crashes take place. Police Departments also use DDACTS to send out patrols where their individual community needs dictate different hours and days of week. In addition to the weekends police departments send out patrols for special and not so special holidays; St Patrick, Halloween, Thanksgiving, Christmas, New Year, super Bowl, Cinco de Mayo, sporting events, concerts, football games, start of school and end of school, etc.
M5 HVE 18 02 - State Agencies (RISP) Impaired Driving Law Enforcement Patrols (Including DRE)
Sub-Recipient: Rhode Island State Police Project Budget/Source: $171,520.00 of Section 405D Evidence of Effectiveness: CTW, Chapter 1, Section 2.1 TSEP: Yes Match $42,880.00 Indirect Costs: $0.00 Maintenance of Effort: $0.00 Local Benefit: $0.00
Implementation of Drive Sober or Get Pulled Over (DSoGPO) overtime enforcement patrols by the RISP. RISP is funded to participate in the two DSoGPO annual mobilizations scheduled for December 17, 2017 to January 2, 2018 and August 18 to September 4, 2018, as well as monthly sustained enforcement. Patrols are conducted on Thursday, Friday, and Saturday evenings. Participating officers must be fully trained in the use of SFST or DRE detection techniques. Includes funding for overtime for Drug Recognition Experts to perform evaluations of drivers suspected to be under the influence of drugs other than alcohol on an as needed basis.

Rhode Island Highway Safety Plan | FFY 2018
84 Highway Safety Countermeasures and Projects
M5 BAC 18 01 - Municipalities Impaired Driving – BAT (Breath Alcohol Testing) Mobile
Sub-Recipient: All Municipal Police Departments Project Budget/Source: $61,325.00 of Section 405D Evidence of Effectiveness: CTW, Chapter 1, Section 2.1, 2.2, 2.3 TSEP: Yes Match: $15,331.25 Indirect Costs: $0.00 Maintenance of Effort: $0.00 Local Benefit: $0.00
OHS will reimburse the Providence Police Department (PPD) for all necessary B.A.T. equipment, and overtime for the PPD at two officers per day for three days per week for at least 18 weeks of the FFY, gas, maintenance, specialized “Impaired Driving Task Force” safety vests, and two Guth Simulators to calibrate the Intoxilyzer 9000s There is no equipment over $5000.00 to be acquired as part of this project. BATMobile Mobilization Calendar
10/08: (Columbus Day)
10/20 10/31: (Halloween)
11/11
11/22: (Thanksgiving Eve)
12/14 12/20
12/22
12/23 12/31: New Year’s Eve
1/12
1/27 2/4: Superbowl Sunday
2/14
3/10: Newport St. Patrick’s Day Parade 3/17: St. Patrick’s Day
3/31
4/13 4/28
5/5: Cinco de Mayo
5/26 6/9
6/22
7/3: Bristol’s 4th of July Parade 7/4
7/20
8/11 8/31: Labor Day Weekend
9/2: Labor Day Weekend
9/21

Rhode Island Highway Safety Plan | FFY 2018
85 Highway Safety Countermeasures and Projects
164PM 18 01 / 164 PM 18 04 – Paid Media (AL)
Sub-Recipient: State-Approved Media Vendor Project Budget/Source: $1,300,000.00 of Section 164PM Evidence of Effectiveness: CTW, Chapter 1, Section 5.2 TSEP: No Match: $0.00 Indirect Costs: $0.00 Maintenance of Effort: $0.00 Local Benefit: $0.00
OHS will develop and implement a statewide paid media campaign for the DSoGPO campaigns to coincide with enforcement mobilizations scheduled for December 2017 and August/September 2018 in addition to supporting monthly sustained enforcement. The target audience is 30- to 50-year-old males. The media buy is expected to cover print, on-line/web/Internet and “out of home” (billboard/bus/movie theater). Media materials are produced in both English and Spanish and the venues are chosen based on market data for each audience. This task will meet the requirements within the Grant Funding Policy Part II E by ensuring that all television advertisements include closed captioning. In addition, this project will be evaluated based on the criteria set out in the Section 402 Advertising Space Guidance. When OHS implements a media plan we receive reach and frequency numbers and impressions listed to answer the “penetration of the target audience”. It is significant – we will have 90+ reach and a lot of frequency. There is a need to create more localized messages that highlight local stories, local issues, local strengths and local partners. OHS will also increase our Social media presence. We also use our DMV survey data and we rely on Providence media expertise to purchase media buys and media creative.
164PM 18 02 / 164 PM 18 03 / 164 PM 18 05 – Creative Media (AL)
Sub-Recipient: State-Approved Media Vendor Project Budget/Source: $870,000.00 of Section 164PM Evidence of Effectiveness: CTW, Chapter 1, Section 5.2 TSEP: No Match: $0.00 Indirect Costs: $0.00 Maintenance of Effort: $0.00 Local Benefit: $0.00
OHS will enter into a contract with a public relations firm for creative media to create and produce ads for each of the major campaigns. When OHS implements a media plan we receive reach and frequency numbers and impressions listed to answer the “penetration of the target audience”. There is a need to create more localized messages that highlight local stories, local issues, local strengths and local partners. OHS will also increase our Social media presence. We also use our DMV survey data and we rely on Providence media expertise to purchase media buys and creative.

Rhode Island Highway Safety Plan | FFY 2018
86 Highway Safety Countermeasures and Projects
164 AL 18 05 – Alcohol Survey
Sub-Recipient: Rhode Island Department of Transportation Project Budget/Source: $11,550.00 of Section 164AL Evidence of Effectiveness: CTW, Chapter 1, Section 5.2 TSEP: No Match: $0.00 Indirect Costs: $0.00 Maintenance of Effort: $0.00 Local Benefit: $0.00
This RIDMV Intercept survey will be conducted following the August/September national impaired driving campaign to determine the behavioral and social impact of the earned and paid media efforts, which were conducted prior to and during the mobilization period. Each year, we survey about 500 persons pre and 500 persons post. RIDMV intercept surveys are at all the RIDMV facilities across the State. No oversampling is taken for any particular demo as oversampling would increase the cost of the contract, the prices of which are considered “fixed and firm.”
M5 CS 18 01 - State Agencies (AG)–Traffic Safety Resource Prosecutor (TSRP)
Sub-Recipient: Rhode Island Attorney General’s Office Project Budget/Source: $134,346.44 of Section 405D Evidence of Effectiveness: CTW, Chapter 1, Sections 3.1 and 6.5 TSEP: No Match: $44,782.12 Indirect Costs: $0.00 Maintenance of Effort: $0.00 Local Benefit: $0.00
OHS will pay 75% of the salary of a prosecuting attorney from the Attorney General’s staff, to serve as the TSRP. The TSRP will: The TSRP will be an active member on the Traffic Safety
Coalition and agree to attend monthly meetings. He/She will also be an active participant on several emphasis teams which deal with dangerous driving behavior. His/her presence and participation should be included on the Impaired Driving, Speeding, OP, and Young Driver teams.
The TSRP will organize and lead a committee (to include the OHS) to review RI’s Impaired Driving statute in order to create a list of agreed upon statute changes/enhancements.
The TSRP will review RI’s social host law and offer recommendations for changes and/or enhancements.
The TSRP will obtain and share with OHS data on disposition of arrests for DUI and refusal, calculate conviction rates and compare rates of the AG’s office and municipal solicitors.
The TSRP will offer interlock data to include the number of interlocks installed monthly and annually.
The TSRP will support and assist in judicial trainings and prosecution trainings in testimony, evidence, and prosecution.
The TSRP will continue to train police officers and recruits at annual recertification classes for breathalyzer operators in the area of DUI and Implied Consent Prosecution. The recruit training at will include lecture and mock trail exercises.
The TSRP will participate on NHTSA TSRP focused webinars and teleconferences on behalf of the OHS.

Rhode Island Highway Safety Plan | FFY 2018
87 Highway Safety Countermeasures and Projects
164 AL 18 06 – Alcohol Program Resources
Sub-Recipient: Rhode Island Department of Transportation Project Budget/Source: $50,000.00 of Section 164AL Evidence of Effectiveness: CTW, Chapter 1, Section 5.2 TSEP: No Match: $0.00 Indirect Costs: $0.00 Maintenance of Effort: $0.00 Local Benefit: $0.00
OHS will develop, maintain, and disseminate appropriate resource and educational materials for use by local and state programs addressing “DSoGPO” and underage alcohol use in regards to dangerous driving behaviors.
M2 HVE 18 02 / 402 PT 18 03 / M5 HVE 18 01 – Law Enforcement Highway Safety Training Coordinator (LEHSTC) Including Drug Recognition Expert (DRE) Training and Statewide Program
Sub-Recipient: Rhode Island Municipal Police Academy Project Budget/Source: $93,565.00 of Section 405B $93,564.00 of Section 405D $93,565.00 of Section 402PT Total: $280,694.00 Evidence of Effectiveness: CTW, Chapter 1, Section 7.1 TSEP No Match: $70,173.50 Indirect Costs: $0.00 Maintenance of Effort: $0.00 Local Benefit: $0.00
OHS will contract with a qualified consultant to serve as the LEHSTC. The LEHSTC will work as the liaison through the Office of Highway Safety and will promote law enforcement participation in Operation Blue RIPTIDE, conduct outreach to police chiefs, and provide traffic safety training. The LEHSTC will also serve as the Program Coordinator for the Standardized Field Sobriety Testing (SFST) Refresher Training courses.
OHS will continue to reinvigorate DRE training and program implementation through the Law Enforcement Highway Safety Training Coordinator. DRE duties will include; maintaining certifications for 72+ DRE’s as well as planned training for DRE, SFST, and ARIDE courses, to include instructions on alcohol/drug blocks at the recruit level training at all Rhode Island police academies; Rhode Island Municipal Police Training Academy, Providence Police, and Rhode Island State Police. The grant period; October 1, 2017 through September 30, 2018 will include additional duties as the Rhode Island DRE Coordinator as well Rhode Island’s SFST Coordinator, and will account for an additional percentage of the LEHSTC’s total time.
The primary responsibility of the LEHSTC is taking the lead role in promoting highway safety programs to the local cities and towns through Rhode Island through training and other duties as determine by the OHS. The LEHSTC will accomplish these duties and responsibilities through day to day contact with all Grant Managers in the municipalities as well as act as the highway safety contact with the Rhode Island Chiefs of Police and other highway safety advocates in Rhode Island.

Rhode Island Highway Safety Plan | FFY 2018
88 Highway Safety Countermeasures and Projects
M5 CS 18 02 / 164 AL 18 11 – State Agencies (HEALTH) – Traffic Safety Resource Forensic Toxicologist (TSRFT) and Preliminary Breath Testing and Intoxilyzer 9000s Implementation Program
Sub-Recipient: Rhode Island Department of Health Project Budget/Source: $70,000.00 of Section 405D $201,794.00 of Section 164 AL Evidence of Effectiveness: CTW, Chapter 1, Section 2.3 TSEP: No Match: $17,500.00 Indirect Costs: $0.00 Maintenance of Effort: $0.00 Local Benefit: $0.00
OHS will reimburse 60% of the salary of a Traffic Safety Resource Forensic Toxicologist at the Rhode Island Department of Health, Forensics Laboratory. We will also support 40% of the salary of a forensic scientist and the full salary of a senior laboratory technician. Includes equipment with a per-unit cost of less than $5,000. Includes an FTE as well as overtime in HEALTH’s Forensics Unit, Breath Analysis Section to calibrate Preliminary Breath Testers to expand use of these instruments and to calibrate and set up Intoxilyzer 9000s in the lab. Also, to download data from these instruments for reporting to OHS and to conduct associated tasks that arise with the implementation of these instruments. The Sr. Lab Technician position was a completely new position funded solely by federal monies. This was never a state funded position. He provides monthly data on breath alcohol cases from the 9000 units as part of the reporting module within the program. He maintains all PBT’s for the federally funded DRE program and plays a critical role in transitioning the entire state to the new units purchased by federal funding. The lab technician duties are to implement, certify, and maintain monthly certification on the Intoxilyzer 9000 and PBT’s, all purchased solely with federal funds.
M5 HVE 18 03 – State Agencies (URI) Impaired Driving Law Enforcement Patrols
Sub-Recipient: University of Rhode Island Project Budget/ Source: $500.00 of Section 405D Evidence of Effectiveness: CTW, Chapter 2, Section 2.5 TSEP: Yes Match: $125.00 Indirect Costs: $0.00 Maintenance of Effort: $0.00 Local Benefit: $0.00
OHS will fund implementation of the “DSoGPO” impaired driving enforcement patrols by the University of Rhode Island Police. Patrols are conducted during 24 hours and there is mandatory participation in one annual enforcement period, during the third week of August. The project will fund 10 enforcement hours.
164 AL 18 02 – State Agencies (RISP) RI Impaired Driving Task Force
Sub-Recipient: Rhode Island State Police Project Budget/Source: $122,890.00 of Section 164AL Evidence of Effectiveness: CTW, Chapter 5
OHS will reimburse the RISP for the expenses of hosting the Rhode Island Impaired Driving Prevention Task Force. The RISP with the guidance of leaders and partners from Rhode Island’s Traffic Safety Coalition will be responsible for organizing monthly meetings, trainings for committee members on various impaired driving goals and initiatives, coordinating community outreach efforts, tracking supported policy changes, assisting each subcommittee created within the IDPA and their

Rhode Island Highway Safety Plan | FFY 2018
89 Highway Safety Countermeasures and Projects
TSEP: Yes Match: $0.00 Indirect Costs: $0.00 Maintenance of Effort: $0.00 Local Benefit: $0.00
activities, increasing the capacity, outreach and identity of the impaired driving emphasis team, as well as other responsibilities outlined in a scope of work to be developed and approved by the OHS, and the State Police. Funds will be set aside for a coordinator, impaired driving trainings for law enforcement and other individuals associated with the scope of work listed within the Strategic Plan.
164 AL 18 08 – Nobidade TV Alcohol Education
Sub-Recipient: Nobidade TV Project Budget/Source: $25,300.00 of Section 164AL Evidence of Effectiveness: CTW, Chapter 1, Section 5.2 TSEP: No Match: $0.00 Indirect Cost: $1,000.00 Maintenance of Effort: $0.00 Local Benefit: $0.00
From October 2017 to September 2018, Nobidade TV with input from impaired driving target populations, and tools provided and approved by Rhode Island OHS, will launch, implement, and evaluate a multimedia public education and behavior change campaign called 5 Cities, 4 Languages, 3 Issues, 2 Partners, 1 Application targeting the risks of drinking and driving. Project inputs and outputs will be created and presented in Cape Verdean Creole, Spanish, Khmer, and Lao with English translation mixed in as needed. On-line and video surveys will enable tracking of changes in knowledge, behavior, and attitude. Information will be solicited at community events and venues at the heart of Cape Verdean, Latino, Southeast Asian, and Low-income communities.
402 TR 18 02 / 164 AL 18 04 / 402 PS 18 04 – RIPCA Safety Partnership Program
Sub-Recipient: Rhode Island Police Chiefs Association (RIPCA) Project Budget/Source: $55,761.07 of Section 402TR $55,761.06 of Section 164AL $55,761.07 of Section 402PS Total: $167,283.20 Evidence of Effectiveness: In support and promotion of sustained law enforcement efforts TSEP: Yes Match: $27,780.54 Indirect Costs: $0.00 Maintenance of Effort: $0.00 Local Benefit: $0.00
There is increasing need for statewide law enforcement executive oversight of Highway Safety funds in order to promote more efficient and effective use of them in every municipality to maintain consistent law enforcement efforts and introduce information and training opportunities targeting highway safety initiatives. Promoting that at the Chiefs’ level will elevate it to priority status. RIDOT is dependent upon all police departments in the state to submit specific data in order for RIDOT to give accurate statistical information to NHTSA which in turn justifies the request for future funding within the state. Many times, the data transferals depend on department leadership priorities. The RIPCA will encourage priority of data collection at an Executive Level. The partnership between RIPCA and RIDOT/OHS is currently being handled by individuals at local levels as well as through the Executive Board at RIPCA. RIPCA has recognized that full time chiefs do not have the time necessary to handle these issues on a statewide basis.

Rhode Island Highway Safety Plan | FFY 2018
90 Highway Safety Countermeasures and Projects
RIDOT/OHS will partner with RIPCA on other traffic safety initiatives to include distracted driving and pedestrian safety. Funding will allow the RIPCA to disseminate information from the Office on Highway Safety to all active law enforcement leadership entities and other state agencies (ie; DEM). The RIPCA will also lead a media effort which includes law enforcement safety information by all municipalities. This project supports a portion of the salary of the RI Police Chiefs’ Executive Director’s salary. It also affords the membership of the RIPCA an opportunity to create and buy media pieces which highlight municipal law enforcement messages and efforts. Any media pieces will be pre-approved by the OHS. Success will be measured by the increased buy in and law enforcement participation by PD Chiefs regarding all highway safety initiatives.
M5OT 18 01 – SFST Training Assessment
Sub-Recipient: Rhode Island Department of Transportation Project Budget/Source: $40,000.00 of Section 405D Evidence of Effectiveness: NHTSA Recommended TSEP: No Match: $0.00 Indirect Costs: $0.00 Maintenance of Effort: $0.00 Local Benefit: $0.00
OHS has requested NHTSA to initiate a comprehensive assessment of all aspects of the State’s SFST program, including initial recruit training at Rhode Island’s three police academies as well as refresher training.
164 AL 18 12 – Leadership Committee Statute/Outreach
Sub-Recipient: Rhode Island Department of Transportation Project Budget/Source: $20,000.00 of Section 164AL Evidence of Effectiveness: CTW, Chapter 1, Section 5 TSEP: No Match: $0.00 Indirect Costs: $0.00 Maintenance of Effort: $0.00 Local Benefit: $0.00
The Office on Highway Safety will conduct outreach activities for local government leaders with relevant highway safety information.
A multimedia informational package will be created which will address highway safety issues in Rhode Island and highlight countermeasures that work in an attempt to create a holistic approach to combating serious injuries and deaths on our roadways and allow the state’s policy makers to have relevant information at their disposal.
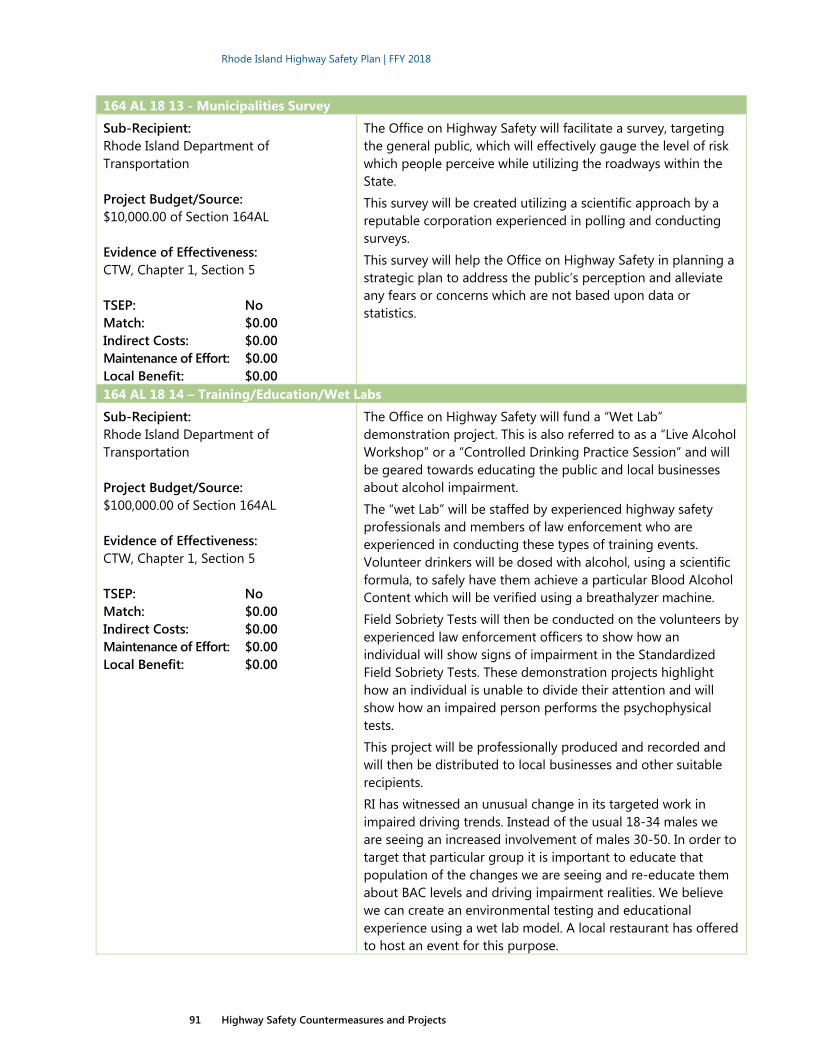
Rhode Island Highway Safety Plan | FFY 2018
91 Highway Safety Countermeasures and Projects
164 AL 18 13 - Municipalities Survey
Sub-Recipient: Rhode Island Department of Transportation Project Budget/Source: $10,000.00 of Section 164AL Evidence of Effectiveness: CTW, Chapter 1, Section 5 TSEP: No Match: $0.00 Indirect Costs: $0.00 Maintenance of Effort: $0.00 Local Benefit: $0.00
The Office on Highway Safety will facilitate a survey, targeting the general public, which will effectively gauge the level of risk which people perceive while utilizing the roadways within the State.
This survey will be created utilizing a scientific approach by a reputable corporation experienced in polling and conducting surveys.
This survey will help the Office on Highway Safety in planning a strategic plan to address the public’s perception and alleviate any fears or concerns which are not based upon data or statistics.
164 AL 18 14 – Training/Education/Wet Labs
Sub-Recipient: Rhode Island Department of Transportation Project Budget/Source: $100,000.00 of Section 164AL Evidence of Effectiveness: CTW, Chapter 1, Section 5 TSEP: No Match: $0.00 Indirect Costs: $0.00 Maintenance of Effort: $0.00 Local Benefit: $0.00
The Office on Highway Safety will fund a “Wet Lab” demonstration project. This is also referred to as a “Live Alcohol Workshop” or a “Controlled Drinking Practice Session” and will be geared towards educating the public and local businesses about alcohol impairment.
The “wet Lab” will be staffed by experienced highway safety professionals and members of law enforcement who are experienced in conducting these types of training events. Volunteer drinkers will be dosed with alcohol, using a scientific formula, to safely have them achieve a particular Blood Alcohol Content which will be verified using a breathalyzer machine.
Field Sobriety Tests will then be conducted on the volunteers by experienced law enforcement officers to show how an individual will show signs of impairment in the Standardized Field Sobriety Tests. These demonstration projects highlight how an individual is unable to divide their attention and will show how an impaired person performs the psychophysical tests.
This project will be professionally produced and recorded and will then be distributed to local businesses and other suitable recipients.
RI has witnessed an unusual change in its targeted work in impaired driving trends. Instead of the usual 18-34 males we are seeing an increased involvement of males 30-50. In order to target that particular group it is important to educate that population of the changes we are seeing and re-educate them about BAC levels and driving impairment realities. We believe we can create an environmental testing and educational experience using a wet lab model. A local restaurant has offered to host an event for this purpose.

Rhode Island Highway Safety Plan | FFY 2018
92 Highway Safety Countermeasures and Projects
164 AL 18 15 / M5TR 18-02 – Criminal Justice Training
Sub-Recipient: Rhode Island Department of Transportation Project Budget/ Source: $80,000.00 of Section 164AL $20,000.00 of Section 405D Evidence of Effectiveness: CTW, Chapter 1, Sections 3 and 4 Rhode Island Impaired Driving Assessment, 2016 TSEP: No Match: $0.00 Indirect Costs: $0.00 Maintenance of Effort: $0.00 Local Benefit: $0.00
Members of the Judiciary will be educated on the effectiveness of Standardized Field Sobriety Testing and the Drug Recognition Expert Program. There have been many other states which have taken Judicial Notice regarding these two programs which law enforcement uses and it is necessary to educate the judiciary on just how effective they are in identifying impaired drivers. These programs are excellent at identifying both alcohol and drug impaired drivers and use a good amount of science.
To accomplish this task a multimedia presentation will be produced by Highway Safety Professionals, and Law Enforcement Officers, showing the effectiveness of the SFST and DRE programs.
A summit will be conducted utilizing subject matter experts to include other Judges and Medical Doctors.
Several sessions will be conducted throughout the fiscal year to ensure all relevant members of the judiciary have an opportunity to partake in this educational undertaking.
4.3 Speed
Problem Identification and Analysis
In Rhode Island, a fatality is defined as speed-related if one of the driver-related factors includes driving over the speed limit, excessive speed, driving too fast for conditions, or racing. A speed-related serious injury crash is defined as occurring when a citation is issued to a driver involved in the crash for exceeding the lawful speed limit.
Speed was a likely factor in over one-third (35%) of all fatalities over the most recent five-year period (2011-2015). Over this period, the percentage of speeding-related fatalities to total fatalities ranged from a low of 25 percent in 2014 to a high of 44 percent in 2015, and was considerably greater than those of both the NHTSA Region 1 and the nation in 2010, 2012, and 2015. As stated, in 2015 44 percent of Rhode Island’s traffic fatalities were recorded as speed-related, compared to 33 percent in the region and 27 percent nationwide. The majority of drivers in speed-related fatal crashes are between age 16 and 34 (60%), and 81 percent are white. The cities of Providence and Warwick have the highest numbers of speeding crashes in the most recent five years with 14 and 12 respectively.
As shown in Table 4.8, in Rhode Island from 2011 to 2015, 47 percent of speeding-related fatalities occurred on roads with a speed limit of 30 mph or below. This percentage was higher than the region percentage (32 percent), and both were higher than the nationwide percentage of 14 percent. Ninety percent of the speeding-related fatalities in the State occurred on roads with a speed limit of 50 mph or less. This percentage was higher than the region (77 percent) and the nation as a whole (54 percent).

Rhode Island Highway Safety Plan | FFY 2018
93 Highway Safety Countermeasures and Projects
Enforcement efforts have improved annually and Rhode Island increased the number of citations issued to 8,092 in 2016. OHS seeks to increase the citation level to 10,000+ in FFY 2018. Part of the multifaceted approach to this issue is paid media. OHS also has increased its’ level of paid media buys during August, one of the highest months for speed-related fatalities, to support the annual speed enforcement campaign in Rhode Island during that period. Fatal crashes will continue to be monitored and campaigns adjusted accordingly.
Figure 4.9 Percent of Fatalities Resulting from Crashes Involving Speeding Versus Total Fatalities
Source: FARS, (2017)
Table 4.8 Speed-Related Fatalities by Posted Speed Limit
Posted Speed
Rhode Island Total 2011-2015
2011 (N=23)
2012 (N=31)
2013 (N=17)
2014 (N=11)
2015 (N=19)
Rhode Island
(N=101) Region
(N=1,492) U.S.
(N=45,405) 30 or less 12 19 7 3 6 47% 32% 14% 35 5 4 7 3 4 23% 15% 13% 40 3 1 2 0 1 7% 10% 7% 45 1 4 0 0 1 6% 11% 14% 50 1 2 0 3 2 8% 9% 4% 55 0 1 0 2 4 7% 8% 25% 60 0 0 0 0 0 0% 0% 3% 65+ 0 0 0 0 1 1% 9% 15% No limit 0 0 0 0 0 0% 0% 0% Unknown 1 0 1 0 0 2% 6% 3% Total 23 31 17 11 19 100.0% 100.0% 100.0%
52%
29% 31%
47% 49%
35%
47%
26%
23%
44%
35%
35%
30%
34% 38%
36%
33%
30%
28%
33%
32%
32%
31%
32%
32%
31%
30%
29%
28%
27%
0%
10%
20%
30%
40%
50%
60%
2006 2007 2008 2009 2010 2011 2012 2013 2014 2015
Rhode Island New England USA

Rhode Island Highway Safety Plan | FFY 2018
94 Highway Safety Countermeasures and Projects
Source: FARS (2017).
Figure 4.10 Age of Drivers in Fatal Speeding Crashes (2011 to 2015)
Source: RIDOT/OHS, (2016)
Figure 4.11 Ethnicity of Drivers in Fatal Speeding Crashes (2011 to 2015)
Source: RIDOT/OHS, (2017)
0%11%
20%
29%
13%
17%
7%3%
Age 10‐15
Age 16‐20
Age 21‐24
Age 25‐34
Age 35‐44
Age 45‐54
Age 55‐64
Age 65+
81%
10%
5%4%
White
Black
Hispanic
Unknown

Rhode Island Highway Safety Plan | FFY 2018
95 Highway Safety Countermeasures and Projects
Table 4.9 Top Five Cities/Towns by Fatal Speeding Crashes
City/Town 2011 2012 2013 2014 2015 Total
Providence 4 4 2 0 4 14
Warwick 3 2 2 1 4 12
Cranston 0 2 1 4 0 7
North Kingstown 2 1 0 1 2 6
Westerly 2 1 1 0 1 5
Source: RIDOT/OHS (2016)
Strategic Partners
OHS has partnerships with local community safety organizations which promote respect to speed limits, the Rhode Island Department of Health, state and local law enforcement agencies, and AAA Northeast. In cooperation with the RIDOT, these groups promote transportation safety and the incorporation of safe roadway behavior including driving at posted speed limits.
Alignment with the SHSP
The 2017-2022 SHSP includes the following strategies to reduce speed-related driving fatalities:
› Leadership
Establish a Speeding Task Force to engage leadership from various agencies.
› Criminal Justice System
Enforce speeding laws to act as a deterrent to keep people from engaging in speed and aggressive driving behaviors.
Provide continuing education efforts for law enforcement.
› Prevention & Treatment
Support education and outreach to promote safer driving.
› Evaluation
Improve the quality of speeding data.
Use data to target speeding initiatives.
› Infrastructure
Enhance roadway design to promote safe transportation practices among all users.
Performance Targets › Goal. Reduce the five-year average speed-related fatalities by 10 percent from 21
(2011 to 2015 average) to 19 (2014 to 2018 average) by 2018.

Rhode Island Highway Safety Plan | FFY 2018
96 Highway Safety Countermeasures and Projects
Justification. Speed-related fatalities have fluctuated over the last five years, with as few as 13 in 2014 and has many as 30 in 2012. Preliminary 2016 values are comparable to the recent five-year average at 23. Large fluctuations mean that the annual crashes and the five-year average will not easily align. Continued decreases in the five-year average are anticipated, however, our target is more cautious. The SHSP goal of TZD still provides a realistic goal.
List of Countermeasures (Strategies) 1. Use variable message signs (VMS) to increase visibility of speed enforcement
activities.
2. Conduct a statewide speeding/aggressive driving campaign targeted to males 16- to 34 years old.
3. Conduct sustained monthly enforcement for statewide high-publicity speed activities as well as one annual high-visibility “speed wave” enforcement.
4. Target speed enforcement patrols on non-Interstate roadways with speed limits of 35 mph or less.
5. Continue overtime speed patrols with the RISP and Operation Blue RIPTIDE.
6. Employ speed-activated roadside displays showing speed limit and actual speed traveled.
7. Conduct program management and oversight for all activities within this priority area.
8. Use recently purchases radar units and software to analyze speed data in enforcement areas and compare to crash locations for all Police Departments.
9. Develop a method to collect speed-related data from crash reconstruction reports on fatal and serious injury crashes and forward data to RIDOT.
10. Develop policies on the collection of speed-related serious injury data, including a review of current state policies, laws, and regulations with assistance from the Rhode Island Police Chief’s Association’s Traffic Safety Committee. (TSRP/Attorney General)
11. Expand existing and planned HVE programs and speed enforcement patrols.
12. Use highway message boards to communicate a speed prevention message during the periods of the speed campaign.
13. Utilize DDACTS to conduct regular coordinated enforcement efforts with state and local law enforcement in known trouble spots for speed violations. (LEL/OHS)
14. Review appropriateness of speed limits statewide.
15. Review the placement and use of speed limit signs statewide.

Rhode Island Highway Safety Plan | FFY 2018
97 Highway Safety Countermeasures and Projects
16. Use variable speed limits on limited access highways in Rhode Island
Project Descriptions
The FFY 2018 HSP project list to address speed-related driving fatalities and serious injuries includes the project number, title, description, budget, evidence of effectiveness, and maintenance of effort, where applicable.
402 PT 18 04 – Municipalities Speed Enforcement Patrols
Sub-Recipient: All Municipal Police Departments Project Budget/Source: $271,100.00 of Section 402PT Evidence of Effectiveness: CTW, Chapter 3, Section 2.2 TSEP: Yes Match: $67,775.00 Indirect Costs: $0.00 Maintenance of Effort: $0.00 Local Benefit: $0.00
OHS will fund implementation of the “Obey the Sign or Pay the Fine” overtime speed enforcement patrols by local city/town police departments. OHS is expecting participation from potentially 38 communities. Patrols are conducted 24-hours and there is mandatory participation in one annual enforcement period, during the first week of August. The amounts allocated to each municipality were determined based on problem identification, citation and detail history, ability to deploy details, and overall community targeted safety needs.
402 PT 18 02 – State Agencies (RISP) Speed Enforcement
Sub-Recipient: Rhode Island State Police Project Budget/Source: $115,190.00 of Section 402PT Evidence of Effectiveness: CTW, Chapter 3, Section 2.2 TSEP: Yes Match: $28,797.50 Indirect Costs: $0.00 Maintenance of Effort: $0.00 Local Benefit: $0.00
OHS will fund implementation of the “Obey the Sign or Pay the Fine” overtime speed enforcement patrols by the RISP. Patrols are conducted 24 hours and there is mandatory participation in one annual enforcement period, during the first week of August. This also includes RISP C.A.R.E. patrols and travel.

Rhode Island Highway Safety Plan | FFY 2018
98 Highway Safety Countermeasures and Projects
402 PT 18 05 – State Agencies (URI) Speed Enforcement
Sub-Recipient: University of Rhode Island Project Budget/Source: $1,000.00 of Section 402PT Evidence of Effectiveness: CTW, Chapter 3, Section 2.2 TSEP: Yes Match: $250.00 Indirect Costs: $0.00 Maintenance of Effort: $0.00 Local Benefit: $0.00
OHS will fund implementation of the “Obey the Sign or Pay the Fine” overtime speed enforcement patrols by the URI Police. Patrols are conducted during 24 hours and there is mandatory participation in one annual enforcement period, during the first week of August.
402 PM 18 03 – Paid Media (PT)
Sub-Recipient: State-Approved Media Vendor Project Budget/Source: $100,000.00 of Section 402PM Evidence of Effectiveness: CTW, Chapter 3, Section 4.1 TSEP: No Match: $25,000.00 Indirect Costs: $0.00 Maintenance of Effort: $0.00 Local Benefit: $0.00
OHS will develop and implement statewide paid and earned media campaigns for the “Obey the Sign or Pay the Fine” law enforcement mobilizations. The target audience will be 16- to 34-year-old males. Media materials will be produced in both English and Spanish and the venues will be chosen based on market data for each audience. This task will meet the requirements within the Grant Funding Policy Part II E by ensuring that all television advertisements include closed captioning. In addition, this project will be evaluated based on the criteria set out in the Section 402 Advertising Space Guidance.
402 PM 18 04 – Creative Media (PT)
Sub-Recipient: State-Approved Media Vendor Project Budget/Source: $150,000.00 of Section 402PM Evidence of Effectiveness: CTW, Chapter 3, Section 4.1 TSEP: No Match: $37,500.00 Indirect Costs: $0.00 Maintenance of Effort: $0.00 Local Benefit: $0.00
OHS’ contract with a public relations firm for creative media will include creation and production of ads for the “Obey the Sign or Pay the Fine” campaign. This task will meet the requirements within the Grant Funding Policy Part II E by ensuring that all television advertisements include closed captioning. In addition, this project will be evaluated based on the criteria set out in the Section 402 Advertising Space Guidance.
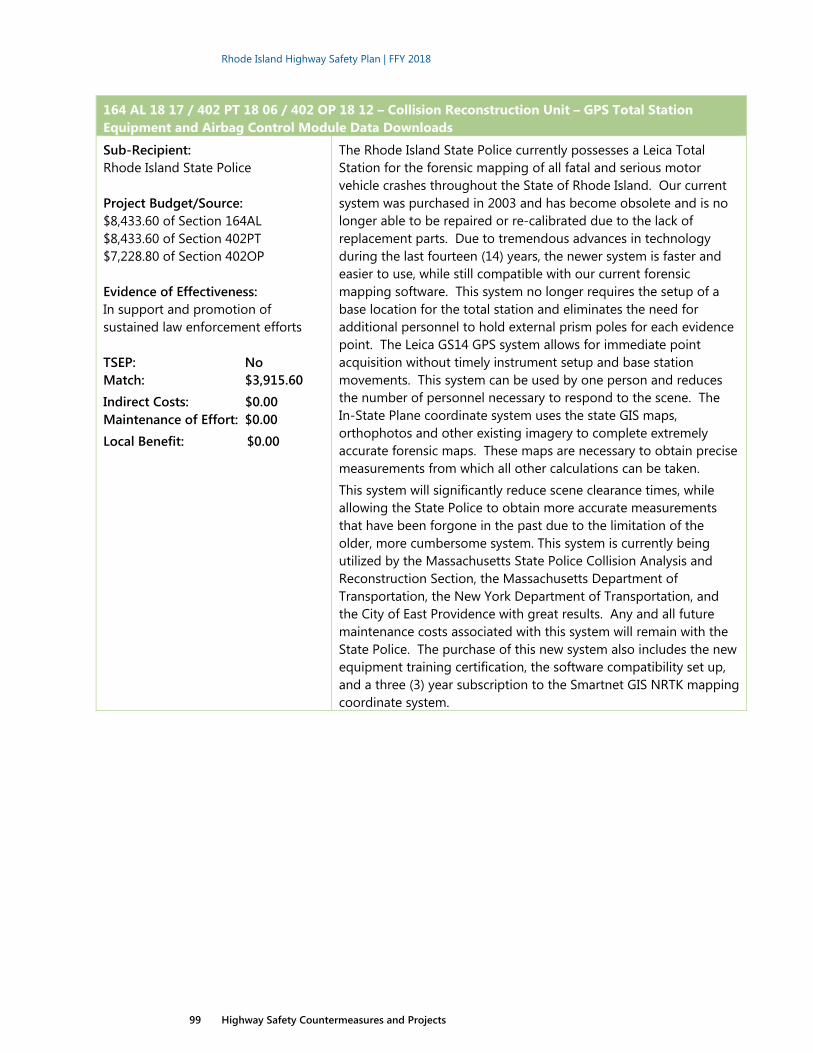
Rhode Island Highway Safety Plan | FFY 2018
99 Highway Safety Countermeasures and Projects
164 AL 18 17 / 402 PT 18 06 / 402 OP 18 12 – Collision Reconstruction Unit – GPS Total Station Equipment and Airbag Control Module Data Downloads
Sub-Recipient: Rhode Island State Police Project Budget/Source: $8,433.60 of Section 164AL $8,433.60 of Section 402PT $7,228.80 of Section 402OP Evidence of Effectiveness: In support and promotion of sustained law enforcement efforts TSEP: No Match: $3,915.60 Indirect Costs: $0.00 Maintenance of Effort: $0.00 Local Benefit: $0.00
The Rhode Island State Police currently possesses a Leica Total Station for the forensic mapping of all fatal and serious motor vehicle crashes throughout the State of Rhode Island. Our current system was purchased in 2003 and has become obsolete and is no longer able to be repaired or re-calibrated due to the lack of replacement parts. Due to tremendous advances in technology during the last fourteen (14) years, the newer system is faster and easier to use, while still compatible with our current forensic mapping software. This system no longer requires the setup of a base location for the total station and eliminates the need for additional personnel to hold external prism poles for each evidence point. The Leica GS14 GPS system allows for immediate point acquisition without timely instrument setup and base station movements. This system can be used by one person and reduces the number of personnel necessary to respond to the scene. The In-State Plane coordinate system uses the state GIS maps, orthophotos and other existing imagery to complete extremely accurate forensic maps. These maps are necessary to obtain precise measurements from which all other calculations can be taken.
This system will significantly reduce scene clearance times, while allowing the State Police to obtain more accurate measurements that have been forgone in the past due to the limitation of the older, more cumbersome system. This system is currently being utilized by the Massachusetts State Police Collision Analysis and Reconstruction Section, the Massachusetts Department of Transportation, the New York Department of Transportation, and the City of East Providence with great results. Any and all future maintenance costs associated with this system will remain with the State Police. The purchase of this new system also includes the new equipment training certification, the software compatibility set up, and a three (3) year subscription to the Smartnet GIS NRTK mapping coordinate system.

Rhode Island Highway Safety Plan | FFY 2018
100 Highway Safety Countermeasures and Projects
4.4 Motorcycles
Problem Identification and Analysis
From 2011 through 2015, motorcyclist fatalities in Rhode Island fluctuated between a low of 8 in 2012 to a high of 15 in 2011. Preliminary data for 2016 is showing four motorcycle fatalities bringing the five-year average from 2012 to 2016 down to eight. This steep drop is part of a trend starting in 2012 of motorcycle fatalities on a steady downward trend.
Unhelmeted motorcycle fatalities have also been on a downward trend over the most recent five years (2011-2015) with preliminary data for 2016 showing that unhelmeted motorcycle fatalities remained at four fatalities for a second consecutive year. After achieving a low of two in 2008, there are still opportunities for improvement. Over the period 2009-2013 50 percent of the motorcycle drivers involved in a fatal crash had a BAC of .08 or greater. Figure 4.13 shows that motorcycle fatal crashes in Rhode Island exceeded that of New England and the nation in 2011, 2013, 2014, and 2015. Preliminary 2016 data indicates that all motorcycles involved in a fatal crash were not wearing a helmet. Rhode Island does not have a universal helmet law for all motorcyclists. The state motorcycle helmet use law only covers all passengers (regardless of age) and all operators during the first year of licensure (regardless of age), which makes it challenging to lower unhelmeted motorcycle fatalities.
Additional analysis shows that the majority of impaired drivers in fatal crashes are white (82%). About one-quarter (27%) of drivers are between the ages of 25 to 34 and another quarter (23%) are between the ages of 45 to 54. In 2015, alcohol played a factor in about half of the crashes resulting in a fatality. From 2012 to 2016, 76 percent of crashes occurred between may and September with June and July being the highest individual months; 68 percent of crashes occurred between Thursday and Saturdays; and half of crashes occurred between 8:00 PM and 2:00 AM. The Cities of Providence, Warwick, and Cranston have the highest numbers of motorcycle fatalities in the most recent five-year period (2011-2015) with 11, 6, and 6 respectively.
In addition to this information we will also refer to our state’s most recent NHTSA Motorcycle Assessment to develop appropriate educational, training, and marketing materials and target enforcement activities to reduce motorcycle fatalities.
The key recommendations from that assessment are as follows:
Annual Motorcycles Skills Revival Rally

Rhode Island Highway Safety Plan | FFY 2018
101 Highway Safety Countermeasures and Projects
Program Management
› Implement a Strategic Plan for Motorcycle Safety with priorities that are based on data, best practices, and proven strategies. Ensure all motorcycle programs and projects align with this plan.
› Develop a formal, ongoing process to define the elements to be measured for each activity, e.g., value, effectiveness, impact, and outcomes.
› Develop a motorcycle safety subcommittee within the Traffic Safety Coalition, comprised of stakeholders from both government and non-government entities (e.g., representatives from motorcycle dealers, the rider education program, emergency medical services, highway engineering, law enforcement, rider groups, independent riders, and researchers).
› Identify motorcycle safety as an independent emphasis area in the SHSP.
› Use motorcycle injury collision data in order to better understand collision causation and pinpoint potential ‘hot spots’ for motorcycle crashes.
Motorcycle Personal Protective Equipment
› Enact a universal helmet law requiring helmets compliant with Federal Motor Vehicle Safety Standard No. 218 be worn securely fastened on the heads of all motorcycle riders and passengers.
› Amend §31-10.1.1-4 to provide specifications for eye protection that is compliant with the most recent standards and specifications established by ANSI.
› Conduct observational surveys of helmet and eye protection usage in order to establish a baseline for measurement of success of campaigns to encourage the use of personal protective equipment.
Motorcycle Operator Licensing
› Ensure all required licensing tests are being completed in compliance with §31-10.1-1.2.
› Amend the existing motorcycle license test waiver program to require additional training or practice during the leaner’s permit period to ensure individuals seeking their first H restriction have the necessary knowledge, skills, and experience to responsibly operate a motorcycle on public roadways.
› Update the Rhode Island-specific completion certificate to include security features, serialization, whether rider training was in-state or out-of-state, printed instructor name, and a seal.
› Document and publish the standards used by Community College of Rhode Island to evaluate out-of-state rider training courses that result in the issuance of the Rhode Island-specific completion certificate.
› Reemphasize DMV’s authority and responsibility to administer and regulate the motorcycle licensing process by auditing the rider training testing and the issuance of completion certificates.

Rhode Island Highway Safety Plan | FFY 2018
102 Highway Safety Countermeasures and Projects
Motorcycle Rider Education and Training
› Amend §31-10.1-1.2 to delete all references to Motorcycle Safety Foundation. Replace it with language that gives the Board of Governors for Higher Education authority and responsibility to develop or approve curriculums, certify instructors, and define student completion requirements.
› Develop a policy and procedures manual for the Rhode Island Rider Education Program that includes such topics as general administration, instructors, curriculum, quality assurance, criteria for accepting out-of-state course completion cards, etc.
› Evaluate the effectiveness of the current rider training curriculum to determine if it meets the needs of students and addresses the safety issues identified through an analysis of Rhode Island crash, injury, and fatality data.
Motorcycle Operation under the Influence of Alcohol or Other Drugs
› Incorporate motorcycle-specific messages and imagery into current and future Rhode Island impaired driving campaign materials. Develop a professionally produced impaired riding prevention campaign.
› Engage the Traffic Safety Coalition in impaired riding prevention efforts with motorcycle organizations, dealers, and other community-based groups to work toward culture change with regards to riding impaired.
Law Enforcement
› Develop data-driven enforcement strategies that support motorcycle safety and specifically target high-risk motorist and motorcyclist behaviors.
› Implement motorcycle safety law enforcement workshops to share and review law enforcement strategies. Feature crash re-constructionists specifically educated in motorcycle crashes to train law enforcement colleagues on motorcycle crash causation factors and enforcement strategies. Include refresher training on motorcycle specific issues, such as personal safety equipment (helmets and eye protection), and vehicle equipment violations, such as illegal exhaust systems and handlebars.
Highway Engineering
› Consider the safety needs of motorcyclists in roadway design, construction, maintenance and repair.
› Ensure that design and work zone operations policies for new and reconstructed roadways consider the roadway surface needs of motorcyclists and include warning signage.
Motorcycle Rider Conspicuity and Motorist Awareness Programs
› Develop Rhode Island-specific materials addressing motorcyclist conspicuity, such as wearing retro-reflective gear, the importance of lane positioning and following distance in order to see and be seen, as well as strategies to prevent involvement in left-turn collisions with other vehicles. Partner with dealerships, rider groups, and other partners to distribute the materials.

Rhode Island Highway Safety Plan | FFY 2018
103 Highway Safety Countermeasures and Projects
› Declare a Motorcycle Safety Awareness Month and develop opportunities to include motorist awareness and rider conspicuity messages in earned media during the month.
Communications Program
› Develop or adapt Rhode Island-specific motorcycle safety materials addressing helmet and personal protective equipment use, impaired riding, licensing, and rider training. Research the most appropriate methods of reaching the target audience with these materials (e.g., Division of Motor Vehicles, rider training sites, dealerships, direct mail, rider groups).
› Ensure that the comprehensive outreach plan includes a research component to ensure that appropriate themes and messages are developed.
› Allocate more funds to targeted digital campaign buys, rather than television or radio, to reach the audience. Establish a contract with a creative agency to develop banner ads for these campaigns. Provide them to partnership groups for placement on their websites.
› Pursue a standalone website or unique URL (e.g., RIMotorcycleSafety.org) and a website or webpage that includes motorcycle safety program information (licensing and rider training requirements, crash data, rider resources, and safety messages). The site/page should be easily updated by OHS program staff. If this is not feasible with current restrictions, utilize the networks of program partners or the Traffic Safety Coalition.
Program Evaluation and Data
› Create a central data repository, or a process to link or integrate data systems, that is managed by an agency or contractor that can access all the data files, develop queries, produce standardized and ad hoc reports, and support the formal evaluation of Rhode Island’s motorcycle safety efforts.
› Create a working group within the Traffic Safety Coalition to develop and formalize a process to evaluate and measure the value, effectiveness, impact, and outcomes of Rhode Island’s motorcycle safety efforts.

Rhode Island Highway Safety Plan | FFY 2018
104 Highway Safety Countermeasures and Projects
Figure 4.12 Motorcyclist Fatalities and Serious Injuries
Source: RIDOT/OHS, (2017) Note: 2016 data is preliminary.
Figure 4.13 Motorcyclist Fatalities as Percent of Total Fatalities (Rhode Island, New England, and U.S.)
Source: FARS (2017)
90 63 72 69 68 68 72 83 62 68
13
7
1915 15
811
10
94
0
20
40
60
80
100
120
2007 2008 2009 2010 2011 2012 2013 2014 2015 2016
CRASH
ES
Serious Injuries Fatalities Fatalities
20%
20%
11%
23%
22% 23%
13%
15%
19% 20%
14% 15%
15%
17%
17%
14%
16%
14%
14%
19%
11%
13% 14%
13% 14%
14% 15%
15%
14%
14%
0%
5%
10%
15%
20%
25%
2006 2007 2008 2009 2010 2011 2012 2013 2014 2015
Rhode Island New England USA

Rhode Island Highway Safety Plan | FFY 2018
105 Highway Safety Countermeasures and Projects
Figure 4.14 BAC Involved in Motorcycle Fatalities (2009 to 2013)
Source: RIDOT/OHS, 2015.
Figure 4.15 Motorcycle Fatalities by Age (2011 to 2016)
Source: RIDOT/OHS (2017).
5%
14%
28%
12%
23%
16%
2%
Age 16‐20
Age 21‐24
Age 25‐34
Age 35‐44
Age 45‐54
Age 55‐64
Age 65+
6%
40%
54%
0%
10%
20%
30%
40%
50%
60%
BAC = 0.01‐0.07 BAC = 0.08+ BAC = 0.0, unknown, Test Not Given

Rhode Island Highway Safety Plan | FFY 2018
106 Highway Safety Countermeasures and Projects
Figure 4.16 Motorcycle Fatalities by Race (2011 to 2016)
Source: RIDOT/OHS (2017). Note: Zero motorcycle fatalities were identified as American Indian or Asian.
Figure 4.17 Fatal Motorcycle Crashes by Month (2012 to 2016)
Source: RIDOT/OHS (2017)
0 0
2
1
5
8
7
6
5
3
4
00
1
2
3
4
5
6
7
8
9
CRASH
ES
82%
5%
7%2% 4%
White
Black
Hispanic (all‐races)
Asian
American Indian
Multiple Races
Unknown

Rhode Island Highway Safety Plan | FFY 2018
107 Highway Safety Countermeasures and Projects
Figure 4.18 Fatal Motorcycle Crashes by Day of Week (2012 to 2016)
Source: RIDOT/OHS (2017)
5
3
2
3
8
10 10
0
1
2
3
4
5
6
7
8
9
10
11
SUNDAY MONDAY TUESDAY WEDNESDAY THURSDAY FRIDAY SATURDAY
CRASH
ES

Rhode Island Highway Safety Plan | FFY 2018
108 Highway Safety Countermeasures and Projects
Figure 4.19 Fatal Motorcycle Crashes by Time of Day (2012 to 2016)
Source: RIDOT/OHS, (2017)
2
1
2
5
1
2
4
3
3
2
1
2
1
0
0
1
0
0
0
0
1
0
6
4
0 1 2 3 4 5 6 7
11:00 PM
10:00 PM
9:00 PM
8:00 PM
7:00 PM
6:00 PM
5:00 PM
4:00 PM
3:00 PM
2:00 PM
1:00 PM
12:00 PM
11:00 AM
10:00 AM
9:00 AM
8:00 AM
7:00 AM
6:00 AM
5:00 AM
4:00 AM
3:00 AM
2:00 AM
1:00 AM
12:00 AM
CRASHES

Rhode Island Highway Safety Plan | FFY 2018
109 Highway Safety Countermeasures and Projects
Table 4.10 Top Three Cities/Towns by Fatal Motorcycle Crashes
City/Town 2011 2012 2013 2014 2015 2016 Total
Providence 4 2 2 1 1 1 11
Warwick 1 0 2 1 2 0 6
Cranston 0 1 1 4 0 0 6
Source: RIDOT/OHS, (2017) Table 4.11 Motorcycle Models Data Source (OSCAR)
Vehicle Model Fatal Crashes Ducati 1
Harley Davidson 12
Honda 8
Kawasaki 6
Suzuki 8
Triumph 1
Victory 1
Yamaha 4
Other 1
Grand Total 42 Source: OSCAR (2017)
Strategic Partners
Partners will include the RIDOT, and Department of Health, as well as the RIDMV, RISP, CCRI, AAA, Rhode Island Hospitality Association, Injury Prevention Center, representatives from all of the motorcycle retail and repair shops in the State, as well as representatives from organized motorcycle clubs.
Alignment with the SHSP
The 2017-2022 SHSP addresses motorcycle fatalities within the Vulnerable Road User emphasis area with pedestrians, bicyclists, and work zone safety. The full list of vulnerable road user emphasis area strategies is included in Section 4.6.
Performance Targets › Goal. Reduce the five-year average motorcyclist fatalities from 11 (2011 to 2015
average) to 7 (2014 to 2018 average) by 2017.
Justification. Motorcycle fatalities have been somewhat inconsistent over the last five years with an overall downward trend. Preliminary data for 2016 suggests four motorcycle fatalities in 2016, potentially an outlier compared to other recent years

Rhode Island Highway Safety Plan | FFY 2018
110 Highway Safety Countermeasures and Projects
of data. The SHSP goal of TZD results in a target higher than the preliminary 2016 average, therefore a slightly more aggressive target of 7 fatalities (2014 to 2018 average) was chosen. The 2016 NHTSA motorcycle assessment recommendations are anticipated to help OHS reach this goal.
› Goal. Reduce the five-year average unhelmeted motorcyclist fatalities from 6 (2011 to 2015 average) to 4 (2014 to 2018 average) by 2018.
Justification. The overall unhelmeted fatality numbers have decreased over recent years. As the number of fatalities gets smaller it will be harder to further reduce. If the number of crashes remains at or below the current level over the upcoming years a five-year average of four crashes could be achieved. The 2016 NHTSA motorcycle assessment recommendations are anticipated to help OHS reach this goal.
List of Countermeasures (Strategies)
1. Increase the emphasis on the importance of wearing all the appropriate gear all the time.
2. Work with CCRI to create an on-line registration program to facilitate registration and develop and maintain a comprehensive database of students that have completed rider training. Upon completion of this system, the contents of the database will be used to directly market Motorcycle Safety messages to new riders.
3. Increase awareness of helmet and safety gear use through the use of paid media.
4. Develop comprehensive impaired riding program to educate motorcyclists on the consequences of riding under the influence.
5. Develop and disseminate printed safety materials to all motorcyclists on the three target areas, Awareness, Impaired Riding, and Speed.
6. Expand and enhance the Motorcycle Awareness Campaign:
a. Emphasize the consequences of riding a motorcycle impaired, and correlate motorcyclist fatalities to alcohol.
b. Increase automobile drivers’ awareness of the characteristics of motorcycle operation.
c. Continue the Motorcycle Safety and Awareness Campaign preceding the national “Motorcycle Awareness Month” in May.
7. Continue to develop a motorcycle database with the assistance of the RIDMV:
a. Periodically mail safety and awareness information to all riders with registered motorcycles in the State.
b. Continue to work with CCRI to expand the number of rider training classes offered through the CCRI Motorcycle Training Program.
8. Conduct program management and oversight for all activities within this priority area.

Rhode Island Highway Safety Plan | FFY 2018
111 Highway Safety Countermeasures and Projects
9. Develop an exploratory committee to determine the need for mandatory, annual, or biannual Police Motorcycle Training. Currently, Rhode Island does not require motorcycle patrols to have any additional training beyond the current BRC class when obtaining a motorcycle endorsement. Many motorcycle patrol officers have been involved in serious motorcycle crashes, while on patrol. Providing a comprehensive training course in the State will improve driver safety and reduce the number of crashes experienced by Police Officers that ride motorcycle patrol.
Project Descriptions
The FFY 2018 HSP project list to address motorcycle fatalities and serious injuries includes the project number, title, description, budget, evidence of effectiveness, and maintenance of effort, where applicable.
M9 MA 18 02 / 402 PM 18 05 – Paid Media (MC) Awareness Campaign
Sub-Recipient: State-Approved Media Vendor Project Budget/Source: $29,000.00 of Section 405F $65,000.00 of Section 402PM Evidence of Effectiveness: CTW, Chap. 5, Sec. 4.1, 4.2 TSEP: No Match: $23,500.00 Indirect Costs: $0.00 Maintenance of Effort: $0.00 Local Benefit: $0.00
OHS will utilize paid and earned media to address visibility issues, safety, and motorcycle awareness for all drivers, particularly during Motorcycle Awareness month. As supported by data, the target audience for motorcycle media is older than for most of other media programs and includes males 35 to 54 years of age. This task will meet the requirements within the Grand Funding Policy Part II E by ensuring that all television advertisements include closed captioning. In addition, this project will be evaluated based on the criteria set out in the Section 402 Advertising Space Guidance. The portion of media funded by 405(f) funds will be dedicated to increasing motorist awareness of motorcyclists on the road.
402 PM 18 06 – Creative Media (MC) – Awareness, Personal Protective Gear, and Impaired Riding
Sub-Recipient: State-Approved Media Vendor
Project Budget/Source: $50,000.00 of Section 402PM Evidence of Effectiveness: CTW, Chapter 5, Section 2.2 TSEP: No Match: $12,500.00 Indirect Costs: $0.00 Maintenance of Effort: $0.00 Local Benefit: $0.00
OHS will develop creative media in the three major areas to address and appeal to motorcycle riders in specific age groups and demographics based on 2009 to 2014 data trends that we have found. As supported by data, the target audience for motorcycle media is older than for most of other media programs and includes males 35 to 54 years of age. This task will meet the requirements within the Grant Funding Policy Part II E by ensuring that all television advertisements developed under this plan include closed captioning. In addition, this project will be evaluated based on the criteria set out in the Section 402 Advertising Space Guidance.

Rhode Island Highway Safety Plan | FFY 2018
112 Highway Safety Countermeasures and Projects
402 MC 18 02 – Motorcycle Public Education Awareness and Outreach Campaign
Sub-Recipient: State-Approved Media Vendor Project Budget/Source: $30,000.00 of Section 402MC Evidence of Effectiveness: CTW, Chap. 5, Sec. 1, 2, 3, 4 TSEP: No Match: $7,500.00 Indirect Costs: $0.00 Maintenance of Effort: $0.00 Local Benefit: $0.00
In Rhode Island, 47% of all motorcycle fatalities involve impaired riding. We will be using this information to develop these materials that will appeal to these demographics. OHS will develop motorcycle educational materials based on Rhode Island data on impaired riding, personal protective gear, and the importance of rider training. The development of these targeted materials and messages will enable us to engage this, often unreachable, population in a manner that is appealing to them.
4.5 Young Driver
Problem Identification and Analysis
Over the years, crash statistics in Rhode Island have shown young drivers are overrepresented in serious injury and fatal crashes. For example, in 2012, young drivers’ ages 16 to 20 years represented 4.1 percent of Rhode Island’s licensed driver population, yet comprised 4.6 percent of drivers involved in fatal crashes. In 2015 younger driver-related fatalities made up 10 percent of the five-year average crashes. Preliminarily, younger driver-related crashes make up 18 percent of the 2016 annual crashes. This is due to a jump from six crashes in 2015 to an estimated nine crashes in 2016.
The top communities for young driver fatalities from 2011 to 2015 are Providence, Cranston, North Kingstown, and Smithfield.
The OHS has made substantial inroads combating issues in young driver safety. As part of the multifaceted approach to this issue OHS has facilitated a program to reach young drivers through fun educational activities like ThinkFast with the hope that students will more readily retain important highway safety messaging if they are engaged in a fun activity as opposed to a classroom environment. The ThinkFast intervention produced statistically significant improvements in knowledge about highway safety (teens gained 28.66 points from pre to post-score) and significant improvement in attitudes towards the graduated driving licensing (GDL) related behaviors of being out after curfew, not obeying passenger restrictions, talking on a cell while driving, and speeding.

Rhode Island Highway Safety Plan | FFY 2018
113 Highway Safety Countermeasures and Projects
Legislation also was passed during 2014 to mandate “Distracted Driving information be taught and tested as part the State’s Drivers Licensing program.”
The new “hands-free” law taking effect on June 1, 2018 will assist police to enforce the cell phone laws for young drivers.
We may see other problems in the future. Research by the AAA Foundation for Traffic Safety (AAAFTS) and the Insurance Institute for Highway Safety recently reported that national trends indicate more and more young drivers are waiting until they are 18 before they get their driver’s license. When asked why they are waiting, teenagers sited cost as a factor in their decision to wait. In Rhode Island, no formal training is required to take the license and on-road exam if the driver is 18 or more years old.
GDL was passed in 1997 in Rhode Island. Current Rhode Island data is not available, the last study was conducted in 2006 and indicated 23 percent of teens were delayed getting their driver’s license in order to fulfill a GDL requirement. http://newsroom.aaa.com/wp-content/uploads/2013/07/Teens-Delay-Licensing-FTS-Report.pdf, http://www.lifesaversconference.org/handouts2014/McCartt.pdf. Observationally, this trend has continued leaving fewer drivers with a formal education.
OHS agrees with the findings of AAFTS which suggest that age alone does not lead to a higher rate of traffic fatalities. “Given the large proportion of new drivers who are 18 years old or older, further research is needed to investigate their levels of safety or risk, to evaluate the potential. The high rate of motor vehicle-related serious injuries and fatalities can be attributed to more than just inexperience. National studies have shown young drivers are more likely to participate in risky behaviors like distracted driving and not wearing a seat belt. These reasons point to the need for targeted education and enforcement for this population.” (AAAFTS)

Rhode Island Highway Safety Plan | FFY 2018
114 Highway Safety Countermeasures and Projects
Figure 4.20 Total Young Driver Involved in Fatality and Serious Injury Crashes
Source: RIDOT/OHS, (2017)
Table 4.12 Top Four Cities/Towns by Fatal Younger Driver Crashes
City/Town 2011 2012 2013 2014 2015 Total
Cranston 0 1 0 2 0 3
Providence 1 0 0 0 2 3
North Kingstown 0 1 0 0 1 2
Smithfield 0 1 1 0 0 2
Source: RIDOT/OHS, (2017)
180 68 88 84 69 59 51 45 41 52
16
9
117
44
74 6
9
0
50
100
150
200
250
2007 2008 2009 2010 2011 2012 2013 2014 2015 2016
CRASH
ES
Serious Injuries Fatalities

Rhode Island Highway Safety Plan | FFY 2018
115 Highway Safety Countermeasures and Projects
Table 4.13 Fatal Crashes and Fatalities involving Young Drivers (Age 16 to 20)
2011 2012 2013 2014 2015 Total Proportion of Area Fatalities
Rhode Island Young Driver Fatality
2 3 2 3 2 12 40%
Passenger of Young Driver Fatality
1 0 3 0 2 6 20%
Occupants of Other Vehicle Fatality
3 1 1 0 1 6 20%
Nonoccupant Fatality
0 0 2 1 3 6 20%
New England Young Driver Fatality
63 54 68 40 46 271 47%
Passenger of Young Driver Fatality
27 18 36 16 19 116 20%
Occupants of Other Vehicle Fatality
27 28 30 19 23 127 22%
Nonoccupant Fatality
8 15 21 9 13 66 11%
United States Young Driver Fatality
1,987 1,875 1,691 1,717 1,886 9,156 40%
Passenger of Young Driver Fatality
1,191 1,052 1,051 1,013 975 5,282 23%
Occupants of Other Vehicle Fatality
1,120 1,216 1,128 1,090 1,315 5,869 26%
Nonoccupant Fatality
469 497 463 452 526 2,407 11%
Source: FARS (2017)
Strategic Partners
The RIDMV is charged with licensing drivers. Currently, applicants between the ages of 16 and 18 are subject to GDL requirements. These rules are a key avenue for addressing the needs of young drivers, including training and restrictions on driving activities. Ensuring uniform and rigorous application of these laws, as well as evaluating their effectiveness and strengthening them where necessary, is pivotal. Driver training and high school outreach programs also play a critical role for the new driver. Forming partnerships to address training needs and training effectiveness also aid in strengthening the skills of new drivers. Other OHS partners include MADD, SADD, AAA, the Rhode Island Attorney General’s Office, Rhode Island Traffic Tribunal Court, the minority community, and law enforcement throughout the State.

Rhode Island Highway Safety Plan | FFY 2018
116 Highway Safety Countermeasures and Projects
Alignment with the SHSP
The 2017-2022 SHSP includes the following strategies to reduce younger driver-related driving fatalities:
› Leadership
Develop and regularly update a Younger Driver Plan.
Develop partnerships with youth organizations, local coalitions, advocacy groups, and faith-based groups.
› Criminal Justice System
Expand provisions of the Graduated Drivers Licensing.
Adopt and support codifying standards for driving schools and instructors to ensure consistent and appropriate education for drivers.
› Prevention & Treatment
Improve driver education/preparedness requirements and guidelines.
Encourage driver re-education.
Promote use of technology by younger drivers to monitor driving trends and incentivize good driving habits through insurance programs.
Develop instructional modules to standardize education on key topics and improve outreach effectiveness.
Use web-based and social media platforms to reach the younger driver audience.
› Evaluation
Utilize existing driver education and licensing data to inform and support legislative initiatives.
Utilize existing driving programs, such as TREDS, to collect data on driving violations and recidivism.
Performance Targets › Goal. Maintain the number of drivers age 20 or younger involved in fatal crashes at a
five-year average of 5 (2014 to 2018 average) or below by 2018.
Justification. The number of younger driver involved fatalities has varied over the last five years, and preliminarily the number of 2016 fatalities has jumped to nine from values as low as four in 2011, 2012, and 2014. With very small numbers of crashes percentile decreases are difficult to measure. A goal of 5 fatalities (2014 to 2018 average) has been chosen with the intent of returning to prior lower levels and maintaining or further reducing those values.

Rhode Island Highway Safety Plan | FFY 2018
117 Highway Safety Countermeasures and Projects
List of Countermeasures (Strategies) 1. Improve and expand educational outreach to high schools (including School
Resources Officers), colleges, and community partners:
a. Emphasize young drivers in impaired driving and occupant protection media campaigns.
b. Create and distribute an alcohol-related informational brochure for high school and/or college students.
c. Evaluate and coordinate public/private efforts in the area of young driver safety efforts statewide, using our contractor Preusser Research Group to conduct an oversample of young drivers to obtain a statistically valid number to determine the effective reach of current Young Driver programming.
d. Work with RIDMV to develop an informational/educational introduction packet for GDL license applicants and distribute to young drivers/parents as part of the process to obtain a driver license.
e. Expand the educational permit program with AAA Southern New England to be offered statewide to nonmembers to promote and encourage more parental and teen partnerships in the area of driver education on a state level.
f. Continue to work with the CCRI driver education administrator to identify and implement potential improvements to the drivers’ training program.
g. Develop culturally appropriate messages and expand minority outreach efforts.
h. Implement young driver/GDL enforcement in and around high schools.
i. Develop distracted driving awareness programs in high schools.
j. Collect and analyze age-related data on highway safety.
k. Conduct program management and oversight for all activities within this priority area.

Rhode Island Highway Safety Plan | FFY 2018
118 Highway Safety Countermeasures and Projects
Project Descriptions
The FFY 2018 HSP project list to address younger driver fatalities and serious injuries includes the project number, title, description, budget, evidence of effectiveness, and maintenance of effort, where applicable.
402 SA 18 03 – Young Voices Keeping Young Drivers Safe
Sub-Recipient: Young Voices Project Budget/Source: $9,600.00 of Section 402SA Evidence of Effectiveness: CTW, Chapter 4, Section 2.2 TSEP: No Match Amount: $2,400.00 Indirect Costs: $0.00 Maintenance of Effort: $0.00 Local Benefit: $0.00
Young Voices led by program facilitator Karen Feldman, have created comprehensive safety-driven distracted driving curriculum. It will be offered to 2,000 young drivers in order to reduce their texting while driving behavior. Monthly trainings will take place from October through September 2018. Through the training youth gain skills in creating communications and networking abilities that serve to support their safe behavior and begin a peer to peer change model. A pre- and post-test will be administered and returned data will be analyzed in order to promote ongoing strategies that support decreased distracted driving behavior by youth. Outreach efforts will include college campuses such as CCRI, URI, RIC, and Bryant University. Local high schools will also be included in the outreach efforts.
164 AL 18 07 / 402 SA 18 06 – Youth Educator and Influencer Program (MADD)
Sub-Recipient: MADD Project Budget/Source: $39,150.00 of Section 164AL $39,150.00 of Section 402SA Total: $78,300.00 Evidence of Effectiveness: CTW, Chapter 1, Section 6.5
TSEP: No Match: $9,787.50 Indirect Costs: $7,116.46 Maintenance of Effort: $0.00 Local Benefit: $0.00
MADD RI will engage two key demographics in the community through these two innovative programs. Youth in Action helps young people focus on law enforcement, educational, and policy-level changes, which affect underage drinking. Power of Parents is an interactive training session for parents who are looking for guidance when dealing with youth and destructive decisions. Team Spirit is a successful program that offers students in grades 9-12 with the opportunity to experience a three and one half day leadership training seminar followed by a school year implementing action plans developed at the seminar. The seminar highlights prevention, education, community and school alcohol and drug prevention strategies, team building, traffic safety education and substance free alternative activities.

Rhode Island Highway Safety Plan | FFY 2018
119 Highway Safety Countermeasures and Projects
402 DE 18 01 – Driver’s Education Assessment
Sub-Recipient: Rhode Island Department of Transportation Project Budget/Source: $40,000.00 of Section 402YA Evidence of Effectiveness: NHTSA Recommended TSEP: No Match: $10,000.00 Indirect Costs: $0.00 Maintenance of Effort: $0.00 Local Benefit: $0.00
NHTSA's Assessment Program provides technical assistance to State Highway Safety Offices. A team of outside experts conducts a comprehensive assessment of the highway safety program using an organized, objective approach and well-defined procedures. Although a comparison is made to existing standards, RI may also request technical assistance that addresses unique concerns, as well as specialized expertise on the team. Not only does the assessment provide useful recommendations, the dialogue and report are also educational for the State and its highway safety customers.
M5 TR 18 01 – Coastline EAP Education
Sub-Recipient: Rhode Island Student Assistance Services Project Budget/Source: $36,720.00 of Section 405D Evidence of Effectiveness: CTW, Chapter 5, Section 6.5 TSEP: No Match: $9,180.00 Indirect Costs: $3,320.00 Maintenance of Effort: $0.00 Local Benefit: $0.00
Using the Steer Your Teen Down the Right Road, developed by the National Safety Council’s Drive It Home initiative, RISAS will work with the Regional Coalition members in South County to share this presentation with parents of high school juniors and seniors. The 52 weekly safety messages will be promoted through social media to parents and in our agency’s electronic Parent Newsletter.
Graduating to Zero proposes a multi-part program effort to reduce deaths and injuries to Rhode Island youth on roadways. The first is an educational campaign focused on reducing the incidence of impaired driving from marijuana use by Rhode Island youth. The second is a targeted media campaign for youth aged 16-20. The program effort will take place over a 12-month project period, and will include message development, project execution and evaluation.
4.6 Pedestrians and Bicyclists
Problem Identification and Analysis
Concern for the needs of vulnerable road users, including pedestrians and bicyclists, has grown in recent years as the volume and prevalence of these road users has become more widely observed. The growing millennial generation is demanding walkable and bikeable facilities. As such it becomes even more important to monitor and enhance the safety of these roadway users.
Over the most recent five-year period (2011-2015) pedestrian fatalities averaged 11 per year. This has remained somewhat constant over the last five years going back to the 2007-2011 five-year average. Bicyclist fatalities have generally been low over the last five years with no fatalities in 2011, 2014, or 2015 making the five-year average one fatality

Rhode Island Highway Safety Plan | FFY 2018
120 Highway Safety Countermeasures and Projects
per year. Preliminarily, 2016 pedestrian fatalities are 14, consistent with 2011, 2013, and 2014 and 2016 bicycle fatalities are two, which is up from zero during the two prior years.
A total of 119 pedestrians were killed in motor vehicle crashes in Rhode Island from 2007 through 2016, as illustrated in Figure 4.21 and total fatalities involving pedestrians have fluctuated from as few as five to as many as 16 during this time. Over this period bicycle fatalities have totaled 11 with between zero and three occurring in a given year. As shown in Figure 4.23, Rhode Island has exceeded the national percentage for pedestrian fatalities during all but one of the last ten years. While the proportion of pedestrian fatalities dropped in 2015, the actual number of fatalities did not. In terms of bicycle fatalities as a proportion of total fatalities, the small number of fatalities occurring in the state causes each crash to have a significant impact.
By age, the majority of pedestrian fatalities are 65 and over ( 33%) or between the ages of 45 to 54 (22%). By race, the majority of pedestrian fatalities are white (71%) and 24 percent are identified as black or Hispanic.
The top communities for pedestrian fatalities from 2011 to 2016 are Providence, Cranston, and Warwick.
By age, bicycle fatalities are impacting users across age groups, primarily 16-20 year old, 35-44 year olds, and users age 65 and older. Given data from 2012 and 2013, bicycle fatalities included five individuals identified as white and two identified as Hispanic. As shown in Table 4.15, South Kingstown experienced two bicycle fatalities between 2011 and 2016, while five other communities experienced one.
All of this information will be used to develop appropriate educational and marketing materials and target enforcement activities to reduce pedestrian and bicycle fatalities and serious injuries.
Event with Bike Newport

Rhode Island Highway Safety Plan | FFY 2018
121 Highway Safety Countermeasures and Projects
Figure 4.21 Total Fatalities and Serious Injuries Involving Pedestrians
Source: RIDOT/OHS (2017).
Figure 4.22 Total Bicyclist Fatalities and Serious Injuries
Source: RIDOT/OHS (2017). Note: Zero bicycle fatalities occurred 2009, 2011, 2014 and 2015.
73 29 48 56 63 66 57 50 47 59
13
12
169
14 514
14
8
14
0
10
20
30
40
50
60
70
80
90
100
2007 2008 2009 2010 2011 2012 2013 2014 2015 2016
CRASH
ES
Serious Injuries Fatalities
28 16 11 17 33 23 18 17 23 12
1
12
2
3
2
0
5
10
15
20
25
30
35
2007 2008 2009 2010 2011 2012 2013 2014 2015 2016
CRASH
ES
Serious Injuries Fatalities

Rhode Island Highway Safety Plan | FFY 2018
122 Highway Safety Countermeasures and Projects
Figure 4.23 Pedestrian Fatalities as a Percent of Total Fatalities
Source: RIDOT/OHS (2017).
Figure 4.24 Bicyclist Involved Fatalities as Percent of Total Fatalities
Source: RIDOT/OHS (2017).
19%
19%
18% 19%
13%
21%
8%
22%
27%
18%
11% 12%
14%
11%
14%
14% 16%
15%
17%
17%
11%
11% 12%
12% 13%
14%
14% 16%
16%
15%
0%
5%
10%
15%
20%
25%
30%
2006 2007 2008 2009 2010 2011 2012 2013 2014 2015
Rhode Island New England USA
1%
1%
2%
0%
3%
0%
3%
5%
0%
0%
1%
2%
2%
1%
2%
2%
2%
2%
2%
2%2%
2%
2%
2%
2%
2%
2%
2%
2%
3%
0%
1%
1%
2%
2%
3%
3%
4%
4%
5%
5%
2006 2007 2008 2009 2010 2011 2012 2013 2014 2015
Rhode Island New England USA

Rhode Island Highway Safety Plan | FFY 2018
123 Highway Safety Countermeasures and Projects
Figure 4.25 Pedestrian Fatalities by Age Group (2011 to 2015)
Source: RIDOT/OHS (2017).
Figure 4.26 Pedestrian Fatalities by Race (2011 to 2015)
Source: RIDOT/OHS (2017). Note: Zero pedestrian fatalities were identified as American Indian.
5%2%2%
5%
9%
11%
22%
11%
33%
Under Age 10
Age 10‐15
Age 16‐20
Age 21‐24
Age 25‐34
Age 35‐44
Age 45‐54
Age 55‐64
Age 65+
71%
13%
2%0%
11%
3%
White
Black
Asian
American Indian
Hispanic
Unknown

Rhode Island Highway Safety Plan | FFY 2018
124 Highway Safety Countermeasures and Projects
Table 4.14 Top Three Cities/Towns by Fatal Pedestrian Crashes
City/Town 2011 2012 2013 2014 2015 2016 Total
Providence 1 2 5 3 3 4 18
Cranston 3 0 1 3 1 0 8
Warwick 3 1 1 1 1 2 9
Source: RIDOT/OHS, (2017)
Figure 4.27 Bicyclist Fatalities by Age Group (2011 to 2016)
Source: RIDOT/OHS (2017). Note: No fatalities for age groups 10-15, 21-24, 25-34, 45-54, or 55-64 during this period.
Age 16‐2028%
Age 35‐4429%
Age 65+43%
Age 10‐15
Age 16‐20
Age 21‐24
Age 25‐34
Age 35‐44
Age 45‐54
Age 55‐64
Age 65+

Rhode Island Highway Safety Plan | FFY 2018
125 Highway Safety Countermeasures and Projects
Figure 4.28 Bicyclist Fatalities by Race (2011 to 2015)
Source: RIDOT/OHS (2017).
Table 4.15 Top Cities/Towns by Fatal Bicycle Crashes
City/Town 2011 2012 2013 2014 2015 2016 Total
South Kingstown 0 0 1 0 0 1 2
Cranston 0 0 0 0 0 1 1
East Providence 0 0 1 0 0 0 1
Middletown 0 1 0 0 0 0 1
Newport 0 1 0 0 0 0 1
North Providence 0 0 1 0 0 0 1
Source: RIDOT/OHS, (2017)
In order to help guide pedestrian fatality countermeasures, pedestrian impairment was reviewed. Table 4.16 summarizes the blood alcohol content of pedestrians involved in fatal crashes. The majority of pedestrians (65%) had a BAC of 0.0%, however, almost a quarter (22%) of pedestrians had a BAC of 0.08 or greater. While the threshold of 0.08 is tied to the legal limit for operating a vehicle, data from the most recent five years (2011-2015) suggests that pedestrian fatalities are also falling within this boundary. Table 4.17 shows the age and gender of BAC test results for those pedestrians testing greater than 0.0 percent blood alcohol content.
71%
29%
White
Black
Asian
American Indian
Hispanic

Rhode Island Highway Safety Plan | FFY 2018
126 Highway Safety Countermeasures and Projects
Table 4.16 BAC Test Results for Pedestrians Involved in Fatal Crashes
2011 2012 2013 2014 2015 2016 Total (%)
BAC 0.00 8 2 8 9 7 11 45 (65%)
BAC 0.01 - 0.07 0 0 0 0 0 0 0 (0%)
BAC 0.08 - 0.11 2 1 0 0 0 0 3 (4%)
BAC 0.12 - 0.15 1 0 1 0 0 0 2 (3%)
BAC 0.16-0.20 0 0 2 0 0 0 2 (3%)
BAC 0.21 + 1 0 2 2 1 2 8 (12%)
Test not given 0 2 1 3 0 1 7 (10%)
Not Reported 2 0 0 0 0 0 2 (3%)
Total 14 5 14 14 8 14 69 (100%)
Source: FARS (2017). Table 4.17 Age and Gender of Pedestrians involved in Fatal Crashes Testing Positive for Blood Alcohol
(2011-2015)
Age
16-20
Age
21-24
Age
25-34
Age
35-44
Age
45-54
Age
55-64
Age
65+
Subtotal Grand Total
M F M F M F M F M F M F M F M F
BAC 0.01 - 0.07 0 0 0
BAC 0.08 - 0.11 1 1 1 2 1 3
BAC 0.12 - 0.15 1 1 2 0 2
BAC 0.16-0.20 1 1 2 0 2
BAC 0.21 + 1 1 1 1 1 1 4 2 6
Subtotal 1 0 2 0 2 1 1 1 2 0 1 0 1 1 10 3 13
Grand Total 1 2 3 2 2 1 2 13 13
Source: FARS (2017).
Strategic Partners
The OHS has partnerships with summer camps, the Rhode Island Safe Kids Coalition, the Rhode Island Department of Health, Bike Newport, The RI Bike Coalition, Cranston COZ, state and local law enforcement agencies, and AAA Northeast. In cooperation with the RIDOT, these groups promote transportation safety and the incorporation of bicycle and/or pedestrian-friendly policies in transportation planning.

Rhode Island Highway Safety Plan | FFY 2018
127 Highway Safety Countermeasures and Projects
Alignment with the SHSP
The 2017-2022 SHSP addresses vulnerable road users as pedestrian, bicyclists, motorcyclists, and work zone safety issues. The following strategies are aimed at all of those vulnerable road users:
› Leadership
Establish a Vulnerable Users Task Force to engage leadership from various agencies on issues related to these users.
› Criminal Justice System
Enforce pedestrian and bicycle laws particularly at locations where vulnerable road user crashes are a problem.
Provide continuing education efforts for law enforcement.
Explore regulations to augment the safety of vulnerable users.
› Prevention & Treatment
Support education and outreach to provide information about the unique needs of vulnerable users.
› Evaluation
Improve the quality of vulnerable user data.
Use data to target vulnerable user efforts.
› Infrastructure
Enhance roadway design to improve vulnerable user safety by improving and creating roadway designs that account for pedestrians, bicyclists, and motorcycle riders which will improve safe transportation practices among all users.
Performance Targets › Goal. Reduce the five-year average number of pedestrians in fatal crashes by 9
percent from 11 (2011 to 2015 average) to 10 (2014 to 2018 average) by 2018.
Justification. Pedestrian fatalities have been somewhat inconsistent over the last five years. Preliminary data indicates there were 14 pedestrian fatalities in 2016, which is consistent with 2011, 2013, and 2014. A consistent trend during recent years and a low number of crashes makes moving the needle difficult, however, the SHSP goal of TZD was chosen. However, with the new statewide vulnerable road user programs targeting Providence and other municipalities with high pedestrian crashes, we believe we will see a modest reduction in this area.
› Goal. Achieve a five-year average number of bicyclist fatalities at the five-year average of less than one (2014 to 2018 average) by 2018.
Justification. Bicyclists fatalities have been very low in Rhode Island over the past five years with only 2012 and 2013 having fatalities. Preliminary 2016 values show two fatalities. On average, between 2011 and 2015, fatalities have been consistent at one and it is highly likely this trend will continue through the continuation of bicycle events and programs.

Rhode Island Highway Safety Plan | FFY 2018
128 Highway Safety Countermeasures and Projects
› Goal. To decrease the five-year average number of pedestrian fatalities testing positive for blood alcohol, by 15 percent from 2.6 (2011 to 2015) to 2.2 (2014 to 2018) by 2018.
Justification. The average annual number of impaired pedestrian fatalities was 4 from 2006-2010. This average has declined over the five subsequent years. Continued enforcement and education efforts will help drive the number down, however, Rhode Island recognizes increased pedestrian volumes may negate some successes.
List of Countermeasures (Strategies)
1. Partner with local schools/agencies to participate in their safety programs.
2. Increase public awareness of the diversity of road users:
a. Conduct program management and oversight for all activities within this priority area.
Project Descriptions
The FFY 2018 HSP project list to address pedestrian and bicyclist fatalities and serious injuries includes the project number, title, description, budget, evidence of effectiveness, and maintenance of effort, where applicable.
402 SA 18 02 – Safe Communities Partnership Cranston Child Opportunity Zone (COZ)
Sub-Recipient: Cranston COZ Project Budget/Source: $20,315.35 of Section 402SA Evidence of Effectiveness: CTW, Chapter 9, Section 1.3 TSEP: No Match: $5,125.00 Indirect Costs: $0.00 Maintenance of Effort: $0.00 Local Benefit: $0.00
The COZ project will foster cooperation between Cranston families and community education, social service, health-care, and public safety organizations; conduct CPS clinics and individual seat checks; demonstrate correctly fitted bicycle helmets; and provide education/outreach on child restraint use, bicycle, and pedestrian safety the Cranston COZ reaches 3,000 students and their families a minimum of 12 times annually in person.

Rhode Island Highway Safety Plan | FFY 2018
129 Highway Safety Countermeasures and Projects
402 PS 18 02 – Newport Road Share Education
Sub-Recipient: Bike Newport Project Budget/Source: $165,000.00 of Section 402PS Evidence of Effectiveness: CTW, Chapter 9, Section 4.2 TSEP: No Match Amount: $41,250.00 Indirect Costs: $5,000.00 Maintenance of Effort: $0.00 Local Benefit: $0.00
Bike Newport will refine, improve, and expand our programs to reach more people with information about how to drive, cycle, and/or walk on a shared road. We will focus on the key efforts outlined below. Increase the number of trained safe cycling instructors: train
additional 10 instructors. Every time we add more trained instructors, our outreach efforts compound in effectiveness.
HS-1 combined with non-government funding makes it possible to increase trained safe cycling instructors.
Enhance community education partner relations
Bike Newport will partner in bicycle programs at the YMCA Summer Camp
Continue to grow in-school programs: to reach 400 middle school students
Expand Bike Newport Youth Reach
Expand Adult Reach: add a minimum of 50 adults per year to the Adult Program Attendance Roster. Our new systems in the Bike Garage enhance our tracking of attendance along with the age range, gender and interests of our participants. In all cases, information is optional and self-identified.
Adult road sharing education addresses three distinct challenges: a) how to ride correctly, b) how to be confident on the road with traffic, and c) how to maintain and secure a bicycle. We will continue to grow the numbers of adults we reach with safe cycling information.
We will continue to provide training to all those who lead and advise other cyclists in group rides and in recommended road sharing behaviors.
Bike Newport will produce and disseminate Print and Online Safety Information in both English and Spanish language
We propose working with RIDOT Highway Safety Program experts to optimize the audit/survey program and parameters. We will then train HS and college students to audit and record the behaviors of interest. This youth demographic is the top tier need for vulnerable road user education. It is educational to young people to train them to conduct the audits. They will provide a service, be compensated for their time, and learn a great deal about road sharing in the process. Additionally, we will engage a research expert to review, improve, implement, and interpret our road audit research, and conduct 50 hours of new on road research. By partnering with the Health Equity Zone (HEZ) initiative we ensure that we are informed by and responsive to all populations of Newport.
Support from multiple agencies, including NewportFed and RI Foundation, help bikers see and be seen! Since 2013, we have

Rhode Island Highway Safety Plan | FFY 2018
130 Highway Safety Countermeasures and Projects
distributed 300 sets of night safety equipment annually to Newport’s bicycle dependent workers. This group, due to language and financial barriers, might not otherwise access this important equipment and information.
Elliot’s Ride for Safety and Wellness, and is produced in partnership with the Newport County YMCA.
Education will include:
ABC Quick Check to learn to check the bike’s readiness for riding
Helmet Check to learn and practice proper helmet fitting
Bicycle Registration to deter theft Safety Town to practice road skills path
NEWPORT WAVES: The proposed expansion of the campaign for statewide use will include new video and print production, comprehensive website development, partner trainings, school mini curriculum, and earned media management. More detail is presented in the budget.
Bike Newport will add a bicycle friendly driver module to our education programs.
FHPE 18 01 – Pedestrian & Bicycle Education
Sub-Recipient: Rhode Island Department of Transportation Project Budget/Source: $50,000.00 of Section 405H Evidence of Effectiveness: CTW, Chapter 8, Section 4 Chapter 9, Section 1.3, 2.2, 4.1 TSEP No Match: $12,500.00 Indirect Costs: $0.00 Maintenance of Effort: $0.00 Local Benefit: $0.00
The Office on Highway Safety will conduct pedestrian and bicycle education geared towards the general public.
This educational program will focus on enlightening the general public about state and local laws involving both pedestrians and bicyclists. It is imperative that awareness is raised revolving around vulnerable road users. Informational handouts will be created in both English and Spanish highlighting motorist, bicyclist, and pedestrian responsibilities when interacting on the roadways.
“Roadsharing” will be a common theme and the target audience will be taught how to safely utilize our roadways and how to be inclusive of other modes of transportation such as pedestrians and bicyclists.

Rhode Island Highway Safety Plan | FFY 2018
131 Highway Safety Countermeasures and Projects
FHLE 18 01 – RISP Law Enforcement
Sub-Recipient: Rhode Island State Police Project Budget/Source: $2,010.00 of Section 405H Evidence of Effectiveness: CTW, Chapter 8, Section 4.4 and Chapter 9, Section 3.3 TSEP: Yes Match: $502.50 Indirect Costs: $0.00 Maintenance of Effort: $0.00 Local Benefit: $0.00
This task will provide funds to enable the Rhode Island State Police to conduct patrols aimed at enforcing the state’s pedestrian/bicycle laws.
Patrols will be conducted year-round with a focus on the summer months primarily in downtown locations during the morning and evening commuting hours. Specific times and locations will be based on local data.
FHTR 18 02 – Training/Education of LE for Pedestrian Safety
Sub-Recipient: RI Department of Transportation Project Budget/Source: $55,925.00 of Section 405H Evidence of Effectiveness: CTW, Chapter 8, Section 4 Chapter 9, Section 3.3 TSEP: No Match: $13,981.25 Indirect Costs: $0.00 Maintenance of Effort: $0.00 Local Benefit: $0.00
The Office on Highway safety conducts training for law enforcement officers for pedestrian safety. Officers are provided data showing the existing issue and are encouraged to conduct pedestrian enforcement activities, using a data driven approach, in their respective communities. Officers are also trained on how to properly conduct pedestrian enforcement “Decoy operations” and a review of local state laws is also conducted. A portion of the training encompasses bicycle safety as well.
FHLE 18 02 – Pedestrian/Bicycle Enforcement Patrols
Sub-Recipient: All Municipal Police Departments Project Budget/Source: $77,000.00 of Section 405H Evidence of Effectiveness: CTW, Chapter 8, Section 4.4 and Chapter 9, section 3.3 TSEP: Yes Match: $19,250.00 Indirect Costs: $0.00 Maintenance of Effort: $0.00 Local Benefit: $0.00
This task will provide funds to enable approximately 19 municipal law enforcement agencies to conduct patrols aimed at enforcing the state’s pedestrian/bicycle laws. Grants will be funded based on a competitive application including factors such as demonstrated need, number of crashes, community size, road configuration/congestion, and violations/warnings issued. Patrols will be conducted year round with a focus on the summer months primarily in downtown locations during the morning and evening commuting hours. Specific times and locations will be based on local data.

Rhode Island Highway Safety Plan | FFY 2018
132 Highway Safety Countermeasures and Projects
402 PS 18 03 – Statewide Smart Cycling Education
Sub-Recipient: Rhode Island Bike Coalition Project Budget/Source: $10,000.00 of Section 402PS Evidence of Effectiveness: CTW, Chapter 8, Section 4.1 TSEP: No Match: $2,500.00 Indirect Costs: $0.00 Maintenance of Effort: $0.00 Local Benefit: $0.00
The Rhode Island Bicycle Coalition education project will be implemented through an education and outreach program to communicate smart cycling skills to cyclists across the state. The project involves three components: (1) offering smart cycling classes to the public for free in communities where there is not currently access to such training (2) training and certifying more Rhode Islanders to offer these smart cycling training by bringing in a national certified coach (3) developing an educational booklet to provide Rhode Islanders with basic information on smart cycling. Survey evaluation will measure the effectiveness of this project.
402 PM 18 07 – Pedestrian Safety Paid Media
Sub-Recipient: State-Approved Media Vendor Project Budget/Source: $100,000 of Section 402PM Evidence of Effectiveness: CTW, Chapter 8, Section 3.1 TSEP: No Match: $25,000.00 Indirect Costs: $0.00 Maintenance of Effort: $0.00 Local Benefit: $0.00
OHS will develop and implement statewide paid and earned media campaigns for Pedestrian law enforcement efforts. Media materials will be produced in both English and Spanish and the venues will be chosen based on market data for each audience. This task will meet the requirements within the Grant Funding Policy Part II E by ensuring that all television advertisements include closed captioning. In addition, this project will be evaluated based on the criteria set out in the Section 402 Advertising Space Guidance
402 PM 18 08 – Pedestrian Safety Creative Media
Sub-Recipient: State-Approved Media Vendor Project Budget/Source: $50,000 of Section 402PS
OHS will contract with a public relations firm for creative media will include creation and production of ads for a pedestrian/bike safety campaign. This task will meet the requirements within the Grant Funding Policy Part II E by ensuring that all television advertisements include closed captioning. In addition, this project will be evaluated based on the criteria set out in the Section 402 Advertising Space Guidance. Evidence of Effectiveness:
CTW, Chapter 8, Section 3.1 TSEP: No Match: $12,500.00 Indirect Costs: $0.00 Maintenance of Effort: $0.00 Local Benefit: $0.00

Rhode Island Highway Safety Plan | FFY 2018
133 Highway Safety Countermeasures and Projects
402 PS 18 05 – Pedestrian/Bicycle Assessment
Sub-Recipient: Rhode Island Department Of Transportation Project Budget/Source: $40,000.00 of Section 402PS Evidence of Effectiveness: NHTSA Recommended TSEP: No Match: $10,000.00 Indirect Costs: $0.00 Maintenance of Effort: $0.00 Local Benefit: $0.00
NHTSA's Assessment Program provides technical assistance to State Highway Safety Offices. A team of outside experts conducts a comprehensive assessment of the highway safety program using an organized, objective approach and well-defined procedures. Although a comparison is made to existing standards, RI may also request technical assistance that addresses unique concerns, as well as specialized expertise on the team.
4.7 Traffic Records
Problem Identification and Analysis
The State of Rhode Island Traffic Records Coordinating Committee is responsible for promoting the improvement of the State’s traffic records data systems. These data systems consist of Crash, Driver, Vehicle, Roadway, Citation/Adjudication, and Injury Surveillance. The State has implemented or upgraded many of these systems including the State’s Crash Reporting System, the EMS Run Reporting System, and the Citation system. This plan includes an update of activity for existing projects and descriptions of proposed projects that will further improve the State’s traffic records data systems. Additionally, this plan includes performance measures that demonstrate improvements in performance for Crash timeliness and completeness for collection of location data (latitude and longitude).
The Rhode Island Crash Data Management System saw a significant update in CY2007 to increase its compliance with the MMUCC (Model Minimum Uniform Crash Criteria) national crash data standard. This system has a 100% adoption rate by law enforcement agencies in the State and has an impressive accuracy of 98.95% crashes that meet the Rhode Island crash data standard (see Section 3.1.2, Crash Accuracy).
Rhode Island DOT set a goal to improve the Accuracy of the Crash system as measured in terms of an increase in:
› The percentage of crash records with no errors in critical data elements. An error is defined as a crash report not meeting the State's MMUCC-compliant crash data standard.
The state will show measurable progress using the following method: The percentage of crash records with no errors in critical data elements. An error is defined as a crash report not meeting the State MMUCC-compliant data standard.

Rhode Island Highway Safety Plan | FFY 2018
134 Highway Safety Countermeasures and Projects
Table 4.18 MMUCC-compliant data Measurements
Period Errors Total Reports Accuracy (%)
April 1, 2013 – March 31, 2014 765 45,220 98.30%
April 1, 2014 – March 31, 2015 725 46,662 98.44%
April 1, 2015 – March 31, 2016 484 45,981 98.94%
April 1, 2016 – March 31, 2017 525 49,888 98.95%
Count the number of crash reports with no errors in critical data elements as defined by the State's MMUCC-compliant data standard (schema and audit rules) during the baseline period and the current performance period. Then, count the total number of reports for the same periods. Divide the total number of reports by the count of reports with no errors and multiply by 100 to get the percentage of reports with no critical errors for each period. Table 4.19 MMUCC-compliant data SQL Queries of Crash Database
SQL Queries 2016 Errors SELECT Count(*) Errors FROM ( SELECT reportingagency + reportnumber AS ReportNumber, Count( *) AS NumberOfErrorsPerReport FROM transmissionlog WHERE Cast(CONVERT(VARCHAR(10), Substring(Replace( Replace(Cast(TRY_CONVERT(XML,originalcrashreport).query('/RhodeIslandCrashReport/CrashReport/CrashDate')AS VARCHAR(max)),'<CrashDate>',''),'</CrashDate>',''), 1, 10), 101) AS DATETIME) BETWEEN '04/01/2015' AND '03/31/2016' AND receiveddateandtime >= '04/01/2015' AND receiveddateandtime < '04/30/2016' AND ( xsdresultfile IS NOT NULL OR xslresultfile IS NOT NULL) GROUP BY reportingagency + reportnumber 2016 Total Crashes during the Current Period SELECT Count(*) TotalCrashes FROM crashreport a INNER JOIN ( SELECT Min(receiveddateandtime) AS ReceivedDateAndTime, reportingagency, reportnumber FROM transmissionlog GROUP BY reportingagency, reportnumber ) AS b ON a.reportingagency = b.reportingagency AND a.reportnumber = b.reportnumber WHERE a.crashdate BETWEEN '04/01/2015' AND '03/31/2016' AND b.receiveddateandtime < '04/30/2016' 2017 Errors SELECT Count(*) Errors FROM ( SELECT reportingagency + reportnumber AS ReportNumber, Count( *) AS NumberOfErrorsPerReport FROM transmissionlog WHERE

Rhode Island Highway Safety Plan | FFY 2018
135 Highway Safety Countermeasures and Projects
Cast(CONVERT(VARCHAR(10), Substring(Replace( Replace(Cast(TRY_CONVERT(XML,originalcrashreport).query('/RhodeIslandCrashReport/CrashReport/CrashDate')AS VARCHAR(max)),'<CrashDate>',''),'</CrashDate>',''), 1, 10), 101) AS DATETIME) BETWEEN '04/01/2016' AND '03/31/2017' AND receiveddateandtime >= '04/01/2016' AND receiveddateandtime < '04/30/2017' AND ( xsdresultfile IS NOT NULL OR xslresultfile IS NOT NULL) GROUP BY reportingagency + reportnumber 2017 Total Crashes during the Current Period SELECT Count(*) TotalCrashes FROM crashreport a INNER JOIN ( SELECT Min(receiveddateandtime) AS ReceivedDateAndTime, reportingagency,reportnumber FROM transmissionlog GROUP BY reportingagency,reportnumber )AS b ON a.reportingagency=b.reportingagency AND a.reportnumber=b.reportnumber WHERE a.crashdate BETWEEN '04/01/2016' AND '03/31/2017' AND b.receiveddateandtime < '04/30/2017'
Figure 4.29 SQL Query – MMUCC-compliant crash data
RIDOT and law enforcement have also increased the completeness of the crash data by increasing the percentage of reports with location data (i.e. law enforcement entered latitude and longitude) from 67 percent to 77 percent of all crash reports over the past year. This plan includes a project to update MMUCC compliance to reflect the upcoming revision to the MMUCC standard.
Rhode Island will improve the Completeness of the Crash system as measured in terms of an increase in:

Rhode Island Highway Safety Plan | FFY 2018
136 Highway Safety Countermeasures and Projects
› The percentage of crash records with latitude and longitude values entered by the officer.
The baseline period is from April 1, 2015 to March 31, 2016 limited to reports entered into the database by April 30, 2016.
The current performance period is from April 1, 2016 to March 31, 2017 limited to reports entered into the database by April 30, 2017.
The baseline period had 30,663 reports with latitude and longitude values out of a total 45,981 reports resulting in 66.68% completeness.
The current period had 38,633 reports with latitude and longitude values out of a total 49,884 reports resulting in 77.45% completeness.
The result is an increase in completeness of 10.76%.
Table 4.20 Reports with Complete Location Data Measurements
Period Lat/Long Reports Total Reports Accuracy (%)
April 1, 2013 – March 31, 2014 10,289 45,220 22.75%
April 1, 2014 – March 31, 2015 18,396 46,662 39.42%
April 1, 2015 – March 31, 2016 30,663 45,981 66.68%
April 1, 2016 – March 31, 2017 38,633 49,888 77.45%
Count the number of crash reports with latitude and longitude values (count only non-null and non-zero values) for all reporting agencies in the State during the baseline period and the current performance period. Then, count the total number of reports for all reporting agencies in the State for the same periods. Divide the total number of reports by the count of reports with latitude and longitude and multiply by 100 to get the percentage of reports with latitude and longitude for each period. Note: Numbers in this performance measure represent all crashes entered into the state crash database from all state reporting agencies. Table 4.21 Complete Location SQL Queries of Crash Database
SQL Queries 2016 Crashes with latitude/longtitude Select Count(*) CrashesLatLong From Crashreport A inner join (Select Min(ReceivedDateAndTime) AS ReceivedDateAndTime, ReportingAgency, ReportNumber From TransmissionLog Group by ReportingAgency, Reportnumber) B On A.ReportingAgency = B.ReportingAgency and A.Reportnumber=B.ReportNumber Where A.CrashDate Between '4/1/2015' and '03/31/2016'and B.ReceivedDateAndTime < '04/30/2016' and A.Latitude is not null and A.Longitude is not null and A.Latitude <> 0 and A.Longitude <> 0

Rhode Island Highway Safety Plan | FFY 2018
137 Highway Safety Countermeasures and Projects
2016 Total Crashes during the Current Period SELECT Count(*) TotalCrashes FROM crashreport a INNER JOIN ( SELECT Min(receiveddateandtime) AS ReceivedDateAndTime, reportingagency, reportnumber FROM transmissionlog GROUP BY reportingagency, reportnumber ) AS b ON a.reportingagency = b.reportingagency AND a.reportnumber = b.reportnumber WHERE a.crashdate BETWEEN '04/01/2015' AND '03/31/2016' AND b.receiveddateandtime < '04/30/2016' 2017 Crashes with latitude/longtitude Select Count(*) CrashesLatLong From Crashreport A inner join (Select Min(ReceivedDateAndTime) AS ReceivedDateAndTime, ReportingAgency, ReportNumber From TransmissionLog Group by ReportingAgency, Reportnumber) B On A.ReportingAgency = B.ReportingAgency and A.Reportnumber=B.ReportNumber Where A.CrashDate Between '4/1/2016' and '03/31/2017'and B.ReceivedDateAndTime < '04/30/2017' and A.Latitude is not null and A.Longitude is not null and A.Latitude <> 0 and A.Longitude <> 0 2017 Total Crashes during the Current Period SELECT Count(*) TotalCrashes FROM crashreport a INNER JOIN ( SELECT Min(receiveddateandtime) AS ReceivedDateAndTime, reportingagency,reportnumber FROM transmissionlog GROUP BY reportingagency,reportnumber )AS b ON a.reportingagency=b.reportingagency AND a.reportnumber=b.reportnumber WHERE a.crashdate BETWEEN '04/01/2016' AND '03/31/2017' AND b.receiveddateandtime < '04/30/2017'

Rhode Island Highway Safety Plan | FFY 2018
138 Highway Safety Countermeasures and Projects
Figure 4.30 SQL Query – Latitude/Longitude Crash Data
For FFY2018, the State will continue to implement improvements related to NHTSA’s most recent Traffic Records Assessment recommendations.
The projects in this plan have been proposed to resolve deficiencies identified during the assessment and include a new Rhode Island State Trauma Registry (a core dataset of the Injury Surveillance System), as well as upgrades to the Citation and Crash data systems. In particular, a Rhode Island State Trauma Registry will provide a valuable addition to the State’s Injury Surveillance System and will assist highway safety stakeholders with understanding injury type, causation, severity, cost, and outcome of crashes occurring in the State.
Grant funds awarded under MAP-21, Section 405c shall be used to make quantifiable, measurable progress improvements in the accuracy, completeness, timeliness, uniformity, accessibility, or integration of data in a core highway safety database.
Strategic Partners
OHS will continue to work with members of the TRCC, including RIDOT, FMCSA, FHWA, RIDMV, Rhode Island Traffic Tribunal, Rhode Island Department of Health, local/state police, and public/private organizations to improve Rhode Island’s traffic records system.
Alignment with the SHSP
The 2017-2022 SHSP includes the following strategies to data gaps and challenges:
› Leadership
Improve inter-agency collaboration and data uniformity.

Rhode Island Highway Safety Plan | FFY 2018
139 Highway Safety Countermeasures and Projects
Improve timeliness, accuracy, and completeness of traffic records data collection, analysis processes, accessibility, distribution and systems.
› Criminal Justice System
Propose revisions to Rhode Island Crash Report to enhance the report while satisfying the Model Minimum Uniform Crash Criteria (MMUCC).
› Prevention & Treatment
Provide training to law enforcement to improve crash data collection and analysis.
Reach out to localities to support transportation safety data and analytical efforts.
Promote the importance of high quality traffic and crash data in enhance transportation safety.
› Evaluation
Evaluate data systems annually to identify possible deficiencies or data needs.
Improve injury data.
Continue to use and build upon the Crash Records Management Systems (CRMS).
Improve the completeness and accuracy of pedestrian and bicycle crash data.
› Infrastructure
Continue to make data-driven decisions surrounding traffic safety.
Identify and implement advanced technologies, techniques, and hardware to collect, and manage crash data.
Performance Targets › Goal. Reduce the percentage of citation records with missing critical data elements.
Justification. Rhode Island crash reports continue to show high accuracy based on MMUCC compliance. There is still a small percentage of reports that exhibit inaccuracies, however, that percentage continues to drop annually.
› Goal. Increase the percentage of crash records with latitude and longitude values entered by the officer from 77.45 percent in March 2017 to 90 percent in March 2018.
Justification. The percentage of crash reports with complete location data measurements increased by 22 percent in 2014 to 77 percent in 2017. This success is expected to continue as Rhode Island data partners work together to improve their data systems.
› Goal. Increase the percentage of appropriate records in the crash database that are linked to another records database from zero percent in July 2017 to five percent by September 2018.
Justification. Rhode Island data partners are actively working on data integration efforts between agencies and are identifying steps and actions to enable these data integration activities.
› Goal. Increase the percentage of appropriate records in the crash database that are integrated with the crime database from zero percent to two percent by September 2018.

Rhode Island Highway Safety Plan | FFY 2018
140 Highway Safety Countermeasures and Projects
Justification. Rhode Island data partners are actively working on data integration efforts between agencies and are identifying steps and actions to enable these data integration activities.
List of Countermeasures (Strategies)
1. Conduct three TRCC meetings in FFY 2018. (Meetings will be schedule for October 27, 2017, January 26, 2018, and April 13, 2018).
2. Expand and improve highway safety databases.
3. Improve and refine data integration and coordination with highway safety stakeholders.
4. Complete implementation and deployment of hardware, software, and training to support the electronic collection and transmission of traffic safety information (e-Citation, Crash form, and race data collection). Expand the effort beyond the municipal departments.
5. Expand sharing of problem identification data among shareholders, partners, and traffic safety advocates.
6. Monitor NHTSA section 405C grant-funded projects.
7. Increase the data linkage of traffic records with other data systems within the State and local highway and traffic safety programs.
8. Improve the maintenance, coordination, accuracy, and analysis of current transportation safety data:
a. Conduct regularly scheduled meetings of the TRCC.
b. Utilize NHTSA 405C grant funding to partner with other state agencies in data coordination, management, and analysis.
c. Utilize contractor services in regards to data coordination, management, and analysis.
d. Increase the availability of safety data and traffic records to highway safety stakeholders.
e. Use On-line System for Crash Analysis and Reporting (OSCAR) interface to generate community-wide data analysis. This analysis will be made available to highway safety stakeholders through improved web site access.
f. Hold informational meetings with potential grantees.
g. Expand the total number of potential program partners.
h. Continue working with the RIDOT/OHS to implement the Rhode Island SHSP.
i. Provide information on highway safety problem identification, process, program planning, and evaluation to potential grantees.

Rhode Island Highway Safety Plan | FFY 2018
141 Highway Safety Countermeasures and Projects
ii. Redesign the OHS web page to include a secure traffic records information section, which highway safety stakeholders can access. Create a public side to this page for public access to static information.
iii. Identify, adjust, track, and document systemwide and project-level performance measures for inclusion in final report to NHTSA on Section 405c.
iv. Continue development of a comprehensive inventory of highway safety information sources in the Rhode Island TRCC Five-Year Strategic Plan. The TRCC Strategic Plan will incorporate specific quantifiable and measurable anticipated improvements for the collection of MIRE FDEs. This will the included in the updated RIDOT Traffic Records Strategic Plan.
v. Conduct program management and oversight for all activities within this priority area.
Project Descriptions
The FFY 2018 HSP project list to address traffic record challenges and gaps includes the project number, title, description, budget, evidence of effectiveness, and maintenance of effort, where applicable.
M3 DA 18 06 – Department of Health State Agencies EMS
Sub-Recipient: Rhode Island Department of Health Project Budget/Source: $52,516.00 of Section 405C Evidence of Effectiveness: TR Assessment Recommendations TSEP: No Match: $13,129.00 Indirect Cost: $6,915.82 Maintenance of Effort: $0.00 Local Benefit: $0.00
NHTSA funds will support the Rhode Island Emergency Medical Services Information System (RI-EMSIS), specifically to defray the cost for the state’s vendor ImageTrend to host and maintain the system. Since its implementation in 2012, the Center for Emergency Medical Services (CEMS) has collected 729,027 electronic run reports, including 17,026 related to incidents involving motor vehicles and pedestrians.
Electronic patient care reports are valuable for numerous reasons. Foremost, critical medical information is conveyed to the hospital staff when patients are transported. Continuous quality improvement programs are founded in review of these reports by EMS administrators, physicians, nurses, and CEMS to ensure that proper EMS care is being delivered. Data is collected related to fatal motor vehicle crashes for entry into the Fatality Analysis Reporting System (FARS). Also, aggregate EMS data is transmitted from CEMS to the National EMS Information System (NEMSIS), which is a nationwide data repository funded by the NHTSA Office of Emergency Medical Services and is identified as one of the key initiatives of that particular office. This data collection and upload is accomplished via the ImageTrend system.

Rhode Island Highway Safety Plan | FFY 2018
142 Highway Safety Countermeasures and Projects
M3 DA 18 05 – Trauma Registry
Project Budget/Source: $256,400 of Section 405C Evidence of Effectiveness: TR Assessment Recommendations TSEP: No Match: $64,100.00 Indirect Costs: $0.00 Maintenance of Effort: $0.00 Local Benefit: $0.00
The Rhode Island Department of Health will contract with a data systems vendor to develop a trauma database that all hospitals can access via the web. Each hospital will enter demographic information, incident details, and medical information for each patient whose traumatic injuries lead to death, surgery, admission to the hospital or ICU. Information from the RI EMSIS EMS database will automatically carry over into the hospital database report in an effort to facilitate data entry and ensure accuracy and consistency of the record.
The database will be housed and maintained at the Rhode Island Department of Health. Since the database will be accessible on-line, hospitals are not required to purchase additional hardware or software. We will provide training to the hospitals and work with them to develop a schedule for data reporting that is mutually convenient. We anticipate that many hospitals will provide reports weekly while others may schedule monthly data reporting.
By linking data in the hospital record to crash scene details, we will have the ability to match patient outcomes to specific locations, crash types, use of safety devices, time of day, etc. We have the opportunity to design the database to include the data elements and create the reports that are most relevant to our state needs. Instituting a State Trauma Registry also will allow us to contribute to national trauma research efforts by giving us the opportunity to submit our state data to the National Trauma Data Bank.
Basis for Project: The American College of Surgery, the Institute of Medicine, and various Federal agencies support the development and implementation of state trauma registries. The 2006 article “Are statewide trauma registries comparable? Reaching for a national trauma dataset” in the Society for Academic Emergency Medicine found that 32 states already had a centralized trauma registry. Rhode Island is one of the few remaining states that do not have a trauma registry.
The information collected in this database will allow us to see the actual medical impact of traffic related trauma in our state. By linking the information in RI EMSIS with a trauma registry, we can specifically identify medical risks of various environmental and behavioral factors. This also will aid in our ability to track the health impact of our intervention strategies.

Rhode Island Highway Safety Plan | FFY 2018
143 Highway Safety Countermeasures and Projects
M3 DA 18 03 – Crash MMUCC Revision
Sub-Recipient: Rhode Island Department of Transportation Project Budget/Source: $65,000.00 of Section 405C Evidence of Effectiveness: TR Assessment Recommendations TSEP: No Match Amount: $16,250.00 Indirect Cost: $0.00 Maintenance of Effort: $0.00 Local Benefit: $0.00
The Rhode Island Uniform Crash Report will be revised to include new fields and make the crash report consistent with the latest version of the MMUCC. Additional fields for consideration are mile marker identification (to improve crash location accuracy) and a “lane departure” checkbox. Funds will be used to modify the State’s RMS systems for data input and the RIDOT import service for crash records.
M3 DA 18 07 – Traffic Records Data Warehouse
Sub-Recipient: Rhode Island Department of Transportation Project Budget/Source: $300,000.00 of Section 405C Evidence of Effectiveness: TR Assessment Recommendations TSEP: No Match: $75,000.00 Indirect Costs: $0.00 Maintenance of Effort: $0.00 Local Benefit: $0.00
Develop a data warehouse into which all traffic records systems submit data; develop linkages between the various data sets and provide data warehouse drill down and reporting capabilities that support highway safety decision-making.
We will build a shared drive within our unit dedicated to data storage (new and historical) and analytics of that data. The data will address all issue areas we address and will integrate those areas when necessary. We are looking at this as a tool to support our funding and program decision making processes.

Rhode Island Highway Safety Plan | FFY 2018
144 Highway Safety Countermeasures and Projects
F1906 18 01 – Consultant Annual Reports/Maintenance
Sub-Recipient: Rhode Island Department of Transportation Project Budget/Source: $374,900.00 of Section F1906 Evidence of Effectiveness: TR Assessment Recommendation TSEP: No Match Amount: $0.00 Indirect Cost: $0.00 Maintenance of Effort: $0.00 Local Benefit: $0.00
RIDOT/OHS will contract with outside consultants to create a reporting system (ATRION, Inc and another consultant for analytic purposes TBD), maintain IT requirements, and service all Rhode Island law enforcement agencies (ATRION) in their mandate to collect data sets included within Rhode Island’s CCPRA statute. The OHS will also provide updated software and equipment necessary for law enforcement agencies to comply with the statute. The funds will also support RIDOT’S MIS data maintenance and service requirements.
M3 DA 18 04 – RMS System Sub-Recipient: Rhode Island Police Chiefs Association Project Budget/Source: $200,000 of Section 405C TSEP: Yes Match: $50,000.00 Indirect Costs: $0.00 Maintenance of Effort: $0.00 Local Benefit: $0.00
The RIPCA respectfully requests consideration for grant funding to continue with the implementation of a Statewide Records Management, Traffic Records, and Computer Aided Dispatch System (RMS/CAD). The project will consolidate all Rhode Island law enforcement agencies onto a single RMS/CAD platform. Updating the system will allow police departments to contribute and receive information from one central records management system.
RIDOT/NHTSA will be a true partner and have access to real-time and accurate data. The RIPCA feels that the benefits of a single statewide RMS/CAD is critical to providing increased accuracy in traffic crash data amongst police agencies, providing for responder safety, and reducing long-term costs to all Rhode Island communities. Since 1998, all police agencies, except Providence and New Shoreham, have utilized IMC by Triptych for their RMS/CAD. While one would assume consistent data sharing exists, however this is not the case. The RIPCA recognized this as a problem and undertook an effort to see if it would be feasible to create a single statewide RMS/CAD. After study, it was identified that contracts would be expiring in the next few years and the time was ripe to undertake this statement RMS/CAD development. Additionally, it was identified that the State of Delaware recently completed a similar project, which could act as a model. Any investment would look at the statewide RMS/CAD from a holistic perspective to include the needs of other agencies, such as RIDOT/NHTSA, that would be affected by this system. The implementation of the system will be based on the items identified in the needs assessment and implementation plan.

Rhode Island Highway Safety Plan | FFY 2018
145 Highway Safety Countermeasures and Projects
The grant will fund a dedicated, high-level project manager to review the RFP (under development) and assist with the selection of the most appropriate vendor to provide and construct the system. The project manager will remain in place through the complete implementation to all law enforcement agencies. Funding also will be used for hardware (e.g., servers) and software.
4.8 Traffic Safety Enforcement Plan Rhode Island’s FFY 2018 HSP was constructed by incorporating data driven guidance from the Moving Ahead for Progress in the 21st Century Act (MAP-21) and the Fixing America’s Surface Transportation (FAST) Act and through the application of the Evidence Based Traffic Safety Enforcement Program.
In addition to the statewide crash analysis, the Office on Highway Safety utilizes collected data to chart crashes by counties, cities and towns, as a means to identify enforcement strategies for impaired, unbelted, distracted and speeding related problems in local jurisdictions. In an effort to strengthen the evidence-based
approach to statewide enforcement and streamline the applications and award agreements, the Office on Highway Safety has simplified the application process by acquiring, analyzing and front loading data for each applicant. The Office on Highway Safety has combined the Occupant Protection (OP) and DUI Enforcement projects into one application/sub-award agreement. Both the OP and DUI problem statements identify and list national data, state data and municipal county or town data. The data provides the basis for development of problem identification; projected goals; strategic countermeasures; measuring tools and planned outcomes, at both the state and local levels. This new process helps the OHS implement procedures and strategies to ensure enforcement resources are used efficiently and effectively in support of the goals of the state’s highway safety program.
The state goals and projected performance targets are identified using both numerical data and geographic studies of the high risk target areas using crash data, OP survey data, and crash pinpoint mapping. Standardizing the data across agencies, and over multiple years, ensures consistent baseline data for improved analysis of the who, what, where, when and why of crash injuries and fatalities.
The application also includes a section for sub-awardees to identify local geographical target areas not included in the Office on Highway Safety data, based on their specific traffic safety challenges. The applicants are to include a narrative indicating the factors that contribute to these issues as well as a list of specific roadways for focused enforcement.
Ensure Evidence Based Enforcement is incorporated into grant applications. Twins with the identification of these primary issues which inform the OHS development of countermeasures and strategies designed to reach selected goals and outcomes. The staff utilizes NHTSA’s Rhode Island’s Office on Highway Safety Program

Rhode Island Highway Safety Plan | FFY 2018
146 Highway Safety Countermeasures and Projects
publication Countermeasures That Work (2015, Eighth Edition) to identify “best practice” strategies that are evidence-based. These suggested countermeasures may be adjusted, amended or otherwise modified to address the demographics of a rural town. Countermeasures are selected by evaluating which particular strategy or combinations of tactics may be expected to make the most positive impact statewide. Rhode Island’s countermeasures are more broadly defined in the applicable sections of this document relating to the specified priorities. Occasionally, new, previously unmeasured or undetected traffic safety issues may emerge and become significant. In recent years, distracted driving is an example of a new problem. The national and local traffic safety communities responded to the review of crash data with a series of NHTSA sponsored pilots to develop sound and responsive strategies. Careful analysis of data provided the springboard for the success of these countermeasures. The Office on Highway Safety staff is prepared to identify and address emerging trends and issues affecting the level of traffic safety in the state.
Rhode Island will continue to rely on specific crash data to sustain the progress made toward our goal to reduce incidences of crashes resulting in death or serious injury. 2015 data indicates 51 of the state’s 57 fatalities occurred on rural roadways. As described in Goal C-1, the primary causes of the state’s fatalities are related to operator impairment, lack of occupant restraint, speeding and distracted or inattentive driving. To appropriately address these priorities, the OHS staff proportionately allocates federal funds to those projects which have the most potential for positive statewide impact. Data and information provided in the HSP demonstrates the appropriateness of this target which utilizes current data trends to create evidence based strategies.
Rhode Island’s execution of Evidence-Based Enforcement (E-BE) will continue into the FFY 2018 grant cycle. It is based on three major components:
› (1) Utilizing the Rhode Island Department of Transportation’s data analysis division, we will continue to collect and analyze specific data as it relates to the Office on Highway Safety’s emphasis and priority areas. The data RIDOT collects identifies who is crashing, where they are crashing, when they are crashing and how they are crashing. The analyzed data also includes performance data such as enforcement activities and citation data utilizing our newly developed productivity graphs;
› (2) The Office on Highway Safety deploys resources and allocates funding for enforcement to the sub-grantees based on problem identification for the implementation of effective and efficient strategies and countermeasures, using the 2015 Countermeasures that Work guidelines;
› (3) The Office on Highway Safety will continue monitoring, evaluation and making any necessary adjustments / modifications to strategies and countermeasures being utilized by all sub-grantees as appropriate.
These three (3) steps are integral to the Office on Highway Safety’s Evidence Based Enforcement protocol (E-BE) and principles and will remain in place for all future granting considerations.
To support Rhode Island’s Evidenced Based Enforcement (E-BE) strategies, specific data driven media messaging and public outreach have been created to increase impact and improve effectiveness of the Office on Highway Safety communication plan. With

Rhode Island Highway Safety Plan | FFY 2018
147 Highway Safety Countermeasures and Projects
NHTSA/OHS funding a law enforcement safety campaign called #beyondthecrash was created and displayed throughout social media forums during the 2016 holiday season. It also ran as an advertisement in all local cinema venues. The campaign featured state police officer vignettes which depicted specific ripple effects of impaired driving choices. We coupled this campaign with earned media and media events throughout the season in support of law enforcement efforts. At this time the campaign has been nominated for a NE Emmy award.
Rhode Island’s statewide and local data identifies the target audience to deliver the appropriate message to the right demographic. For example, local data indicates the geographic areas of the state with the lowest belt use rates. The Office on Highway Safety works with the contracted media consultant in creating specific visual and audio messaging. The occupant protection videos are produced on location using recognizable landmarks as points of reference for local viewers. Similarly, impaired driving messaging depicts locations, settings, and backgrounds which will resonate with the data identified targeted audience who are at higher risk to drive while impaired. In addition, media outreach and seasonal messaging is utilized to describe what types of enforcement activities a particular area of the state will see during special enforcement periods. These types of data based outreach and messaging not only support enforcement but provide an additional layer of deference for those who fail to comply. Overall, the Evidence Based Enforcement (E-BE) process described below incorporates DDACTS and closely follows the strategies listed in DDACTS’ seven guiding principles. (The utilization of geo-mapping and the identification of hot spot areas and specific locations provide a solid basis for the delivery of state-wide Evidence Based Enforcement (E-BE).
The following is a time-line description of the Rhode Island E-BE process. Statewide data is certainly important and serves as a well-defined background for operational planning and subsequent deployment of resources. But traffic safety problems are also local issues and are most effectively and efficiently addressed with local strategies and countermeasures. Rhode Island’s approach to using local data and attacking traffic safety issues at the local level with local data and available resources is a basic exercise in Evidence Based Enforcement (E-BE).
Data Analysis
Rhode Island is fortunate to have direct access to timely crash data and other traffic enforcement related information. The flexibility of the Office on Highway Safety’s Evidence Based Enforcement (E-BE) enables direct application to priority enforcement projects based on the evaluation of these data sets. For example, the seat belt use rate survey, occupant protection citations issued and improperly restrained (operators/occupants) crash data are incorporated into the strategies directing occupant protection enforcement grants. Likewise, impaired driving crashes and arrests are the basis for DUI and drugged driving enforcement efforts. The Evidence Based Enforcement (E-BE) approach is applied to speeding, distracted driving and all other Office on Highway Safety Emphasis areas as well as other priorities which may emerge.
The Office on Highway Safety Project Managers conduct analysis of timely state wide crash data. The process is enhanced by integrating county and local data supported by ancillary information relating to enforcement activities. Local data is the cornerstone for

Rhode Island Highway Safety Plan | FFY 2018
148 Highway Safety Countermeasures and Projects
addressing local traffic issues in a defined geographical area. All traffic safety issues are local problems which require the application of local data.
During the grant application process each potential sub-awardee is issued a pre-loaded application prepared by Office on Highway Safety with local data that identifies target areas of crash locations with associated times of the day and day(s) of the week that the majority of crashes occur. The data supports problem identification and is the foundation for setting performance targets and measurable outcomes.
Funding for sub-awardees is commensurate to the jurisdiction’s proportion of the overall state problem.
Deployment of Resources
Potential sub-awardees are required to use countermeasures and strategies to address the problem areas identified in their agreement. The selected strategies and accepted countermeasures are designed using appropriate local data. Evidence Based Enforcement (E-BE) is applicable to all Office on Highway Safety priority programs.
The applicant agency must demonstrate sufficient available resources to successfully accomplish the agency’s stated objectives. These enforcement resources must be deployed based on data analysis on focused data-driven strategies to ensure efficiency and effectiveness.
Rhode Island’s approach to Evidence Based Enforcement (E-BE) provides enforcement coverage in all of the state’s five counties. The Office on Highway Safety’s partnership with thirty nine (39) city and town police departments as well as the Rhode Island State Police provides a multi-tiered, interlocking system of sustained enforcement in those areas identified using all available data sets.
Clear and concise goals and expected outcomes are developed and clearly described within the agency’s grant application.
The OP and DUI grants focus on sustained traffic enforcement for seatbelt compliance, impaired driving, excessive speed and distracted driving. The
program director provides the team with a cohesive approach and consistent oversight to address local problems effectively and efficiently. The coordinator sets goals based on state and local data to confront traffic safety issues and continually implement evidence based enforcement. The coordinator also tracks and assesses productivity and progress through monitoring of activity reports and may initiate modifications in the strategies that are appropriate and necessary to achieve target goals. Quarterly meetings are held with a representative from each agency to discuss and evaluate the strategies and results of the enforcement activity. Modifications to the project are made based on the input and results of these meetings.
Continuous follow-up and adjustment of the enforcement plan
All participating agencies are required to submit monthly activity reports and quarterly progress reports. The Office on Highway Safety Project Managers evaluate all sub-grantees reports and assess productivity and progress towards defined goals and

Rhode Island Highway Safety Plan | FFY 2018
149 Highway Safety Countermeasures and Projects
outcomes. Program Managers work closely with the Chief of the Office on Highway Safety Chief and the Law Enforcement Liaison to determine if any strategic adjustments, modifications or other changes are appropriate. This continual and systematic process of project monitoring, evaluation and analysis of outcome measures provides feedback which enables project adjustments where and when appropriate.
Enforcement at all levels must be aggressively supported by powerful and effective media messaging, public outreach and education for all those who travel Rhode Island’s roadways. A media campaign utilizing evidence based enforcement to direct the messaging in an effective and efficient format is essential. The proposed calendar of campaign efforts is summarized in Table 4.22 below. In addition, impaired driving messaging will be designed to influence the behavior of those segments of the population, identified by data, who present an increased risk of driving while impaired.
High-Visibility Enforcement (HVE) strategies to support national mobilizations
Rhode Island will implement multiple activities in support of national highway safety goals to reduce motor vehicle related fatalities that also reflect the primary data-related crash factors within the State. High Visibility Enforcement (HVE) strategies will be complimented by earned and paid media, educational awareness efforts, and ongoing stakeholder reach out efforts.
The Office of Highway Safety will participate in and support the National high visibility law enforcement mobilizations. This will include more than three mobilization campaigns in FFY 2018 fiscal to reduce alcohol-impaired or drug-impaired operation of motor vehicles and increase use of seat belts by occupants of motor vehicles. Table 4.22 describes specific campaign efforts.
› National campaigns the State will participate in:
› Drive Sober or Get Pulled Over National Enforcement (August)
› Click It or Ticket National Enforcement Mobilization (May)
› Drive Sober or Get Pulled Over (Holiday Season)
› Drive Sober or Get Pulled Over (Fourth of July)
› Other (see listed calendar grid)

Rhode Island Highway Safety Plan | FFY 2018
150 Highway Safety Countermeasures and Projects
Table 4.22 Campaign Efforts for FFY 2018
Campaign Time Period Dates
Drive Sober or Get Pulled Over Halloween 10/31/2017
Click It or Ticket Thanksgiving 11/19/2017 – 11/25/2017
Drive Sober or Get Pulled Over Thanksgiving 11/25/2017 – 11/26/2017
Drive Sober or Get Pulled Over Holidays 12/17/2017 – 1/2/2018
Drive Sober or Get Pulled Over Superbowl Sunday 2/4/2018
Drive Now, Text Later April School Vacation 4/15/2018 – 4/21/2018
Drive Sober or Get Pulled Over Cinco de Mayo 5/5/2018 – 5/6/2018
Drive Sober or Get Pulled Over Memorial Day 5/26/2018 – 5/27/2018
Click It or Ticket May/June 5/20/2018 – 6/3/2018
Drive Sober or Get Pulled Over 4th of July 6/30/2018 – 7/4/2018
Drive Sober or Get Pulled Over August 8/8/2018 – 9/4/2018
Obey the Sign or Pay the Fine August 8/10/2018 – 8/12/2018
Drive Sober or Get Pulled Over Labor Day 9/9/2018 – 9/10/2018
4.9 Distracted Driving
Problem Identification and Analysis
Distracted driving crashes are often difficult to identify, as the officers arrive on scene after the fact and are dependent upon a driver account and recollection of the facts. Self-reported information is statistically unreliable and it is estimated that distracted driving-related crashes are severely underreported.
While cell phone use is only one example of a distraction, it is a growing issue for Rhode Island and nationally. Rhode Island has been collecting cell phone-related crash information since 2011. In 2015, one fatal crash was counted where at least one distraction was reported for at least one vehicle. There may have been distractions present in any of the 45 fatal crashes in Rhode Island in 2015, however, such circumstances were not reported in the crash data. Nationally, 10 percent of fatalities and 17 percent of injuries were distraction affected crashes. Regionally, the number of fatality crashes that are distraction-affected also remains at approximately 10 percent.
Due to public demand there has been significant pressure to strictly enforce the State’s cell phone law for those who are 18 and younger. There also has been increasing encouragement for policy-makers to create a hands-free statue for all drivers. This resulted in the passage of a hands-free law that will take effect on June 1, 2018.
While Table 4.22 below suggests that Rhode Island distraction-affected crashes have declined, data gaps and the challenges of identifying distracted driving that are mentioned previously continue to limit accurate reporting. Close data gaps within the Traffic Records program area can help improve reporting and countermeasure identification for distraction-affected crashes.

Rhode Island Highway Safety Plan | FFY 2018
151 Highway Safety Countermeasures and Projects
Table 4.23 Distraction-affected Crashes (2011-2015)
Location
2011 2012 2013 2014 2015
Crashes Percent Crashes Percent Crashes Percent Crashes Percent Crashes Percent
Rhode Island 3 5% 3 5% 6 9% 0 0% 1 2%
Region 98 11% 94 9% 92 10% 56 7% 108 10%
Nation 3,047 10% 3,098 10% 2,923 10% 2,972 10% 3,196 10%
Source: FARS (2017).
Alignment with the SHSP
The 2017-2022 SHSP includes the following strategies to reduce distracted driving fatalities:
› Leadership
Establish a Distracted Driving Task Force.
Create a uniform message discouraging distracted driving and distracted while walking.
› Criminal Justice System
Conduct distracted driving enforcement campaigns in hot-spots.
Explore revisions to the existing distracted driving laws and penalties.
› Prevention & Treatment
Spread awareness of the dangers of distracted driving through outreach campaigns.
Work with local businesses to encourage work place policies that discourage distracted driving during work related business.
Offer distracted driving workshops for law enforcement to better understand current distracted driving laws.
Provide legislative updates to the judiciary to ensure consistent understanding of state laws for all parties.
Continue to support the incorporation of distracted driving education in drivers’ education coursework.
› Evaluation
Enhance procedures for completing crash reports to help identify distracted driving crashes.
Improve the capture of distracted driving violations on the crash form.
Use surrogates such as run off the road and rear end type collisions to identify distracted driving crashes.
› Infrastructure
Provide the infrastructure and messaging appropriate to discourage distracted driving.
Identify and implement advanced technologies, techniques, and hardware to collect, and manage crash data.

Rhode Island Highway Safety Plan | FFY 2018
152 Highway Safety Countermeasures and Projects
Performance Targets › Goal. Increase the number of DMV survey respondents who never talk on a hand-held
cellular phone while driving from 33 percent to at least 75 percent.
Justification. Ideally this target should be set at 100 percent., however, as an interim target, reaching 75 percent can be attainable. The 2016 DMV survey results showed that 33 percent of respondents had a “never” answer. In the same survey, the number of respondents who “never” text while driving is 67 percent. With a cell phone ban starting in 2018, Rhode Island is encouraged more drivers will stop using their mobile devices while driving.
Strategic Partners
Rhode Island Attorney General; Municipal and State Police Agencies; Community Prevention Task Force Coordinators; High School Administrators and Health Teachers; and AAA.
List of Countermeasures (Strategies)
1. OHS will schedule overtime patrols for agencies identified throughout the report. These patrols will focus on enforcing the 18 and below no texting and driving law, as well as the no cellular phones law. Citations written for cell phone violations during the mobilization periods will be reviewed to determine if police agencies are effectively enforcing the laws.
2. OHS will coordinate paid and earned media activities to coincide with all enforcement activities, following the accepted NHTSA model for high-visibility enforcement.
Distracted Driving Partnership Community Event, Westerly, Rhode Island

Rhode Island Highway Safety Plan | FFY 2018
153 Highway Safety Countermeasures and Projects
Project Descriptions
The FFY 2018 HSP project list to address fatalities and serious injuries related to distracted driving includes the project number, title, description, budget, evidence of effectiveness, and maintenance of effort, where applicable.
SAFESDDLE 18 03 – Municipal Enforcement Distracted Driving Campaigns
Sub-Recipient: All Municipal Police Departments Project Budget/Source: $86,300.00 of Section 405E Evidence of Effectiveness: CTW, Chapter 4, Section 1.3 TSEP: Yes Match: $21,575.00 Indirect Costs: $0.00 Maintenance of Effort: $0.00 Local Benefit: $0.00
OHS will fund implementation of a Distracted Driving enforcement effort by local city/town police departments. OHS is expecting participation from potentially 22 communities. Patrols are conducted 24 hours and there is mandatory participation in one annual enforcement period during April 2018. The amounts allocated to each municipality were determined based on the problem need, historical liquidation rates, and amount requested by the enforcement agency. Prior to the start of these enforcement campaigns, departments are mandated to attend the Office on Highway Safety distracted driving enforcement training.
FESDEDDLE 18 02 – RISP Enforcement Distracted Driving Campaigns
Sub-Recipient: Rhode Island State Police Project Budget/Source: $36,850.00 of Section 405E Evidence of Effectiveness: CTW, Chapter 4, Section 1.3 TSEP: Yes Match: $9,212.50 Indirect Costs: $0.00 Maintenance of Effort: $0.00 Local Benefit: $0.00
OHS will fund implementation of specific Distracted Driving enforcement patrols by the RISP. Patrols are conducted 24 hours and there is mandatory participation in one annual enforcement period during the month of April 2018.

Rhode Island Highway Safety Plan | FFY 2018
154 Highway Safety Countermeasures and Projects
402 SA 18 04 – ThinkFast Interactive High School Education Program
Sub-Recipient: TjohneE Productions Project Budget/Source: $70,000.00 of Section 402SA Evidence of Effectiveness: CTW, Chapter 1, Section 6.5 CTW, Chapter 2, Section 7.1 TSEP: No Match: $17,500.00 Indirect Costs: $0.00 Maintenance of Effort: $0.00 Local Benefit: $0.00
Up to 50 high schools and middle schools will be offered the opportunity to experience the ThinkFast Interactive program during the 2018 school calendar. This game show style program blends critical highway safety messaging with engaging pop culture references to command the attention of a school assembly. Programming will be strategically coordinated to precede high-risk weekends (Halloween, homecoming, prom season, etc.). Participants accept the responsibility to complete pre-and post online, knowledge-based evaluation surveys.
4.10 Planning and Administration The OHS serves as the primary agency responsible for insuring that highway safety concerns for the State of Rhode Island are identified and addressed through the development, implementation, and support of appropriate countermeasures.
Automated Traffic Enforcement Survey
OHS is unable to certify that automated traffic enforcement systems are not used on any public roads in RI. We agree to conduct a survey of these systems in RI. We will send the outcome of the survey to NHTSA by March 1, 2018. The survey contents will include:
› A list of automated traffic enforcement systems in the State.
› Adequate data to measure transparency, accountability and safety attributes
› Comparison of each system with “Speed Enforcement Camera Systems Operational Guidelines and “Red Light Camera Systems Operational Guidelines.”
Strategic Partners
OHS will continue to work with the State traffic safety stakeholders, including state and local law enforcement agencies and all grant recipients.
Performance Targets › Goal. Administer a fiscally responsible, effective highway safety program that is data-
driven, includes stakeholders, and addresses State specific safety characteristics.
Justification. The HSP is developed using a data-driven process to identify areas of concerns and engages partners across the state who champion the various programs and activities in the Plan. This approach promotes accountability and helps identify measures of effectiveness for the adopted programs and activities.
Rhode Island Highway Safety Plan | FFY 2018
155 Highway Safety Countermeasures and Projects
List of Countermeasures (Strategies) 1. Administer the statewide traffic safety program:
a. Implement the FFY 2018 HSP.
b. Develop projects to support the current programs goals.
c. Provide sound fiscal management on all the traffic safety programs.
d. Coordinate state plans with other Federal, state, and local agencies.
e. Assess program and projects outcomes.
f. Share this vital information and relevant data with the public.
2. Provide data required for Federal and state reports.
3. Provide program staff, professional development, travel funds, space, equipment, materials, and fiscal support for all programs.
4. Provide data and information to policy and decision-makers on the benefits of various traffic safety laws.
5. Identify and prioritize highway safety problems for future OHS attention, programming, and activities.
6. Implement program management, oversight, and monitoring for activities within this priority area.
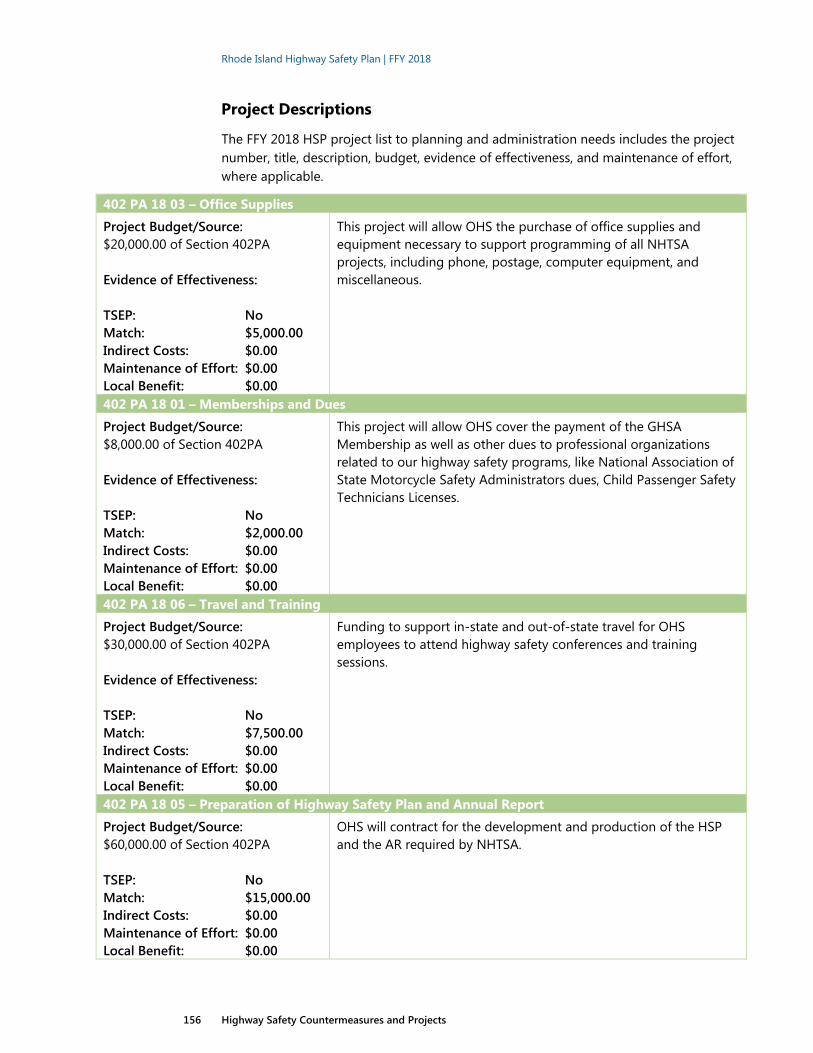
Rhode Island Highway Safety Plan | FFY 2018
156 Highway Safety Countermeasures and Projects
Project Descriptions
The FFY 2018 HSP project list to planning and administration needs includes the project number, title, description, budget, evidence of effectiveness, and maintenance of effort, where applicable.
402 PA 18 03 – Office Supplies
Project Budget/Source: $20,000.00 of Section 402PA Evidence of Effectiveness: TSEP: No Match: $5,000.00 Indirect Costs: $0.00 Maintenance of Effort: $0.00 Local Benefit: $0.00
This project will allow OHS the purchase of office supplies and equipment necessary to support programming of all NHTSA projects, including phone, postage, computer equipment, and miscellaneous.
402 PA 18 01 – Memberships and Dues
Project Budget/Source: $8,000.00 of Section 402PA Evidence of Effectiveness: TSEP: No Match: $2,000.00 Indirect Costs: $0.00 Maintenance of Effort: $0.00 Local Benefit: $0.00
This project will allow OHS cover the payment of the GHSA Membership as well as other dues to professional organizations related to our highway safety programs, like National Association of State Motorcycle Safety Administrators dues, Child Passenger Safety Technicians Licenses.
402 PA 18 06 – Travel and Training
Project Budget/Source: $30,000.00 of Section 402PA Evidence of Effectiveness: TSEP: No Match: $7,500.00 Indirect Costs: $0.00 Maintenance of Effort: $0.00 Local Benefit: $0.00
Funding to support in-state and out-of-state travel for OHS employees to attend highway safety conferences and training sessions.
402 PA 18 05 – Preparation of Highway Safety Plan and Annual Report
Project Budget/Source: $60,000.00 of Section 402PA TSEP: No Match: $15,000.00 Indirect Costs: $0.00 Maintenance of Effort: $0.00 Local Benefit: $0.00
OHS will contract for the development and production of the HSP and the AR required by NHTSA.

Rhode Island Highway Safety Plan | FFY 2018
157 Highway Safety Countermeasures and Projects
402 TR 18 01; M5 IDC 18 01 / 402 MC 18 01; M2 X 18 01 / 402 PS 18 01; 402 PT 18 01 / M3 DA 18 01 / 402 OP 18 01 / 164 AL 18 16 / 402 SA 18 01 / FESDDLE 18 01 / M9 MA 18 01 / FHX 18 01 / 164 AL 18 01 – Salaries (Impaired Driving, Motorcycle, Occupant Protection, Speed, Traffic Records, Pedestrian/Bicycle. Distracted Driving)
Project Budget/Source: $100,000.00 of Sec. 405B; $50,000.00 of Sec. 402MC; $100,000.00 of Sec. 402SA; $50,000.00 of Sec. 402PS; $100,000.00 of Sec. 402PT; $100,000.00 of Sec. 402TR; $115,000.00 of Sec. 405C; $170,000.00 of Sec. 402OP; $700,000.00 of Sec. 164AL; $230,000.00 of Sec. 405D; $100,000.00 of Sec. 405E; $50,000.00 of Sec. 405F; $25,000.00 of Sec. 405H Evidence of Effectiveness: TSEP: No Match: $297,500.00 Indirect Costs: $0.00 Maintenance of Effort: $0.00 Local Benefit: $0.00
Fees charged to NHTSA accounts for FARS Analyst, four Program Coordinators, Administrative Assistant, and Financial Accounting and Reporting, as well as, interns/co-op students. The Rhode Island Department of Transportation also receives 403 program funds to cover a portion of the FARS Analyst salary. We do not track these funds in GTS, which is why we do not have a project number for it.
164 PA 18 00 / 402 PA 18 00 / M2 X 18 00; M3 DA 18 00 / M5 X 18 00; M9 X 18 00 / F 1906 18 00 / FESX 18 00 / FHX 18 00 – Audit Fees
Project Budget/Source: $2,200.00 of Section 164PA; $1,400.00 of Section 402PA; $350.00 of Section 405B; $600.00 of Section 405C; $900.00 of Section 405D; $100.00 of Section 405E; $100.00 of Section 405F; $100.00 of Section F1906; $75.00 of Section 405H Evidence of Effectiveness: TSEP: No Match: $881.25 Indirect Costs: $0.00 Maintenance of Effort: $0.00 Local Benefit: $0.00
Fees charged by the State of Rhode Island based on cash receipts from NHTSA.

Rhode Island Highway Safety Plan | FFY 2018
158 Highway Safety Countermeasures and Projects
402 PA 18 02 – Office Equipment
Project Budget/Source: $10,000.00 of Section 402PA Evidence of Effectiveness: TSEP: No Match: $2,500.00 Indirect Costs: $0.00 Maintenance of Effort: $0.00 Local Benefit: $0.00
This project will fund OHS office copier/fax machine lease and maintenance.
4.11 NHTSA Equipment Approval Rhode Island’s total equipment needs and the associated funding are unclear at the time of this submittal. The OHS will submit a letter to NHTSA requesting approval prior to any purchase.
4.12 Paid Advertising The OHS will follow all Federal and state guidelines for purchasing media/advertising with Federal highway safety funds.
To support alcohol-impaired driving and occupant protection, high-visibility enforcement efforts in the diverse communities of Rhode Island, OHS will place culturally relevant and linguistically appropriate advertising in a variety of multicultural/multiethnic media outlets, including sports venues. OHS will use paid, earned, and owned media, including social media, to address the program areas in the HSP. Outdoor advertising (e.g., billboards, outdoor message boards) also will be included in the plan, if appropriate. OHS incorporates NHTSA’s Communications Calendar into its media plan activities; the 2018 media plan will be finalized once NHTSA releases the 2018 calendar.
OHS paid media buys will cover all media and statewide campaigns, including television, radio, and billboards. The creative and media buys will be targeted to reach key demographic groups (e.g., males between 21 and 50 years of age) with critical safety messages (e.g., Click It or Ticket, Drive/Ride Sober or Get Pulled Over) at key times of the year (e.g., late/spring and summer for teen drivers, in conjunction with national mobilizations).
All media will be evaluated to assess its effectiveness in reaching the target audience. Particular measures will include:
› Paid media tactics employed, along with channel, duration and impressions generated;
› Type and amount of collateral material (e.g., brochure, poster, safety aid) distributed to whom and for what;
› Media coverage generated by OHS and/or partner-related public outreach tactics (e.g., press releases/conference, safety fairs, campaigns), including channel, estimated

Rhode Island Highway Safety Plan | FFY 2018
159 Highway Safety Countermeasures and Projects
audience reach/impressions, tone (e.g., neutral, positive, negative), and value/advertising equivalency; and
› On-line engagement, including unique visits to the OHS web site, page clicks, and social media activities.
› As Internet-based communication continues to be a growing means for the dissemination of information, RIDOT will continue to develop and employ web sites accessible to the public. RIDOT’s web site houses data, publications, event/campaign information, etc. A new connected OHS site will be developed for impaired driving, occupant protection, speeding, and other road users (including motorcycles). This connected site will be appealing to younger audiences and will give greater flexibility towards social marketing.
In FFY 2018, the OHS will conduct a Driver Attitude Survey using intercept surveys administered at RIDMV offices throughout the State. As part of the survey, participants can respond to their awareness/knowledge of various highway safety campaigns.

Rhode Island Highway Safety Plan | FFY 2018
160 Highway Safety Countermeasures and Projects
This page intentionally left blank.

Rhode Island Highway Safety Plan | FFY 2018
161 Cost Summary
Cost Summary The following tables includes a summary of the proposed projects per program fund.
Table 5.1 indicates the project award number and award description, value of funds budgeted to the project, funding share to local for NHTSA federal funds, state funding match, indirect costs, maintenance of effort, and traffic safety enforcement program funds.
Table 5.2 lists all 38 municipalities and highlights funding to key program areas by municipality to show how funds are to be used statewide.

Rhod
e Is
land
Hig
hway
Saf
ety
Plan
| FF
Y 20
18
16
2 Co
st S
umm
ary
Tabl
e 5.
1 Co
st S
umm
ary
Award Number
Award Full Nam
e
Budget Amount
Share to Local
State Funds
Page #
NHTSA164AL1801
Salaries (Im
paired Driving)
$200,000.00
$‐
N/A
156
NHTSA164AL1802
State Agencies (RISP) RI Impaired Driving Task Force
$122,890.00
$149,156.00
N/A
88
NHTSA164AL1804
RI Police Chiefs Association‐Safety Partnership Program
$55,761.06
$22,304.42
N/A
89
NHTSA164AL1805
Alcohol Survey
$11,550.00
$4,620.00
N/A
86
NHTSA164AL1806
Alcohol Program
Resources
$50,000.00
$20,000.00
N/A
87
NHTSA164AL1807
Youth Educator and Influen
cer Program
(MADD)
$39,150.00
$15,660.00
N/A
118
NHTSA164AL1808
Nobidade TV Alcohol Education
$25,300.00
$10,120.00
N/A
89
NHTSA164AL1810
Municipalities Im
paired Driving Law Enforcem
ent Patrols Equipmen
t $90,000.00
$36,000.00
N/A
83
NHTSA164AL1811
State Agencies (HEA
LTH) Forensic Toxicologist (TSRFT), Prelim
inary
Breath Testing, Intoxilyzer 9000s Im
plemen
tation Program
& FBA Units
$201,794.00
$80,717.60
N/A
88
NHTSA164PA1800
Audit Fees
$2,200.00
$‐
N/A
157
NHTSA164PA1801
Travel/Training
$45,000.00
$‐
N/A
‐
NHTSA164PM1801
Paid M
edia (AL)
$300,000.00
$120,000.00
N/A
85
NHTSA164PM1802
Creative Med
ia (AL)
$250,000.00
$100,000.00
N/A
85
NHTSA164AL1812
Leadership Committee Statue/Outreach
$20,000.00
$8,000.00
N/A
90
NHTSA164AL1813
Municipalities Surveys
$10,000.00
$4,000.00
N/A
91
NHTSA164AL1814
Training/Education/W
et Labs
$100,000.00
$40,000.00
N/A
91
NHTSA164AL1815
Criminal Justice Training
$80,000.00
$32,000.00
N/A
92
NHTSA164AL1816
Salaries (Im
paired Driving)
$500,000.00
$200,000.00
N/A
156
NHTSA164AL1817
State Agencies (RISP) Crash Reconstruction Equipmen
t $8,433.60
$3,373.44
N/A
99
NHTSA164PM1803
Creative Med
ia (AL) ‐ Collateral
$120,000.00
$48,000.00
N/A
85
NHTSA164PM1804
Paid M
edia (AL)
$1,000,000.00
$400,000.00
N/A
85
NHTSA164PM1805
Creative Med
ia (AL)
$500,000.00
$200,000.00
N/A
85
TO
TAL 164 FU
NDS
$3,732,078.66
$1,493,951.46
N/A
NHTSA402MC1801
Salaries (Motorcycle)
$50,000.00
$‐
$12,500.00
156
NHTSA402MC1802
Motorcycle Public Education Awaren
ess and Outreach Cam
paign
$30,000.00
$12,000.00
$7,500.00
112
NHTSA402OP1801
Salaries (OP)
$170,000.00
$‐
$42,500.00
156
NHTSA402OP1802
State Agencies (RISP) Seat Belt Law
Enforcem
ent Patrols
$10,720.00
$4,288.00
$2,680.00
68
NHTSA402OP1803
State Agencies (RISP) Child
Passenger Safety (CPS)
$4,000.00
$1,600.00
$1,000.00
68

Rhod
e Is
land
Hig
hway
Saf
ety
Plan
| FF
Y 20
18
16
3 Co
st S
umm
ary
Award Number
Award Full Nam
e
Budget Amount
Share to Local
State Funds
Page #
NHTSA402OP1804
Municipalities Seat Belt Law
Enforcem
ent Patrols
$219,300.00
$87,720.00
$54,825.00
67
NHTSA402OP1805
Municipalities Child
Passenger Safety (CPS)
$90,000.00
$36,000.00
$22,500.00
68
NHTSA402OP1806
Buckle Up Saves Lives and Seat Belt Challenge
$25,000.00
$10,000.00
$6,250.00
74
NHTSA402OP1807
State Agencies (RISP) Rollover Simulator Dem
onstrations
$15,000.00
$6,000.00
$3,750.00
70
NHTSA402OP1808
RI H
ospital Child
Passenger Safety in
Rhode Island
$64,914.00
$25,965.60
$16,228.50
69
NHTSA402OP1809
Connecting for Children and Fam
ilies Primary Seatbelt Education and
Public Outreach
$20,515.00
$8,206.00
$5,128.75
73
NHTSA402OP1810
CIOT DMV Intercep
t Survey
$11,550.00
$4,620.00
$2,887.50
70
NHTSA402OP1811
CIOT Observational Surveys
$69,500.00
$27,800.00
$17,375.00
69
NHTSA402OP1812
State Agencies (RISP) Crash Reconstruction Equipmen
t $7,228.80
$2,891.52
$1,807.20
99
NHTSA402PA1800
Audit Fees
$1,400.00
$‐
$700.00
157
NHTSA402PA1801
Mem
berships and Dues
$8,000.00
$‐
$4,000.00
155
NHTSA402PA1802
Office Equipmen
t $10,000.00
$‐
$5,000.00
157
NHTSA402PA1803
Office Supplies
$20,000.00
$‐
$10,000.00
155
NHTSA402PA1805
Preparation of Highway Safety Perform
ance Plan and Annual Program
Evaluation Report (VHB)
$60,000.00
$‐
$30,000.00
156
NHTSA402PA1806
Travel and Training
$30,000.00
$‐
$15,000.00
156
NHTSA402PM1801
Paid M
edia (OP)
$200,000.00
$80,000.00
$50,000.00
69
NHTSA402PM1802
Creative Med
ia (OP)
$100,000.00
$40,000.00
$25,000.00
70
NHTSA402PM1803
Paid M
edia (PT)
$100,000.00
$40,000.00
$25,000.00
98
NHTSA402PM1804
Creative Med
ia (PT)
$150,000.00
$60,000.00
$37,500.00
98
NHTSA402PM1805
Paid M
edia (MC) Awaren
ess Cam
paign
(May)
$65,000.00
$26,000.00
$16,250.00
111
NHTSA402PM1806
Creative Med
ia (MC) Awaren
ess Personal Protective Gear
$50,000.00
$20,000.00
$12,500.00
111
NHTSA402PM1807
Paid M
edia (PS) Pedestrian/Bicycle Safety
$100,000.00
$40,000.00
$25,000.00
132
NHTSA402PM1808
Creative Med
ia (PS) Pedestrian/Bicycle Safety Education
$50,000.00
$20,000.00
$12,500.00
132
NHTSA402PS1801
Salaries (Pedestrian/Bicycle)
$50,000.00
$‐
$12,500.00
156
NHTSA402PS1802
Bike New
port Road
Share Education
$165,000.00
$66,000.00
$41,250.00
129
NHTSA402PS1803
RI B
ike Coalition ‐ Statewide Smart Cycling Education
$10,000.00
$4,000.00
$2,500.00
132
NHTSA402PS1804
RI Police Chiefs Association ‐ Safety Partnership Program
$55,761.07
$22,304.43
$13,940.27
89
NHTSA402PS1805
Pedestrian/Bicycle Assessm
ent
$40,000.00
$16,000.00
$10,000.00
133
NHTSA402PT1801
Salaries (Speed)
$100,000.00
$‐
$25,000.00
156

Rhod
e Is
land
Hig
hway
Saf
ety
Plan
| FF
Y 20
18
16
4 Co
st S
umm
ary
Award Number
Award Full Nam
e
Budget Amount
Share to Local
State Funds
Page #
NHTSA402PT1802
State Agencies (RISP) Speed Enforcem
ent/Eq
uipmen
t $115,190.00
$46,076.00
$28,797.50
97
NHTSA402PT1803
State Agencies (RIM
PA) Law Enforcem
ent Highway Safety Training
Coordinator (LEH
STC) Including Drug Recognition Expert (DRE) Training
and Statewide Program
& ATS
$93,565.00
$37,426.00
$23,391.25
87
NHTSA402PT1804
Municipalities Speed Enforcem
ent
$271,100.00
$108,440.00
$67,775.00
97
NHTSA402PT1805
State Agencies (URI) Speed Enforcem
ent
$1,000.00
$400.00
$250.00
98
NHTSA402PT1806
State Agencies (RISP) Crash Reconstruction Equipmen
t $8,433.60
$3,373.44
$2,108.40
99
NHTSA402SA
1801
Salaries (Yo
ung Drivers)
$100,000.00
$‐
$25,000.00
156
NHTSA402SA
1802
Cranston Child
Opportunity Zone (COZ) Passport to Safety
$20,500.00
$8,200.00
$5,125.00
128
NHTSA402SA
1803
Young Voices Keeping Yo
ung Drivers Safe
$9,600.00
$3,840.00
$2,400.00
118
NHTSA402SA
1804
Think Fast Interactive High School Education Program
$70,000.00
$28,000.00
$17,500.00
153
NHTSA402SA
1805
Oasis International Buckle Up Before You Start Up
$15,000.00
$6,000.00
$3,750.00
72
NHTSA402SA
1806
Youth Educator and Influen
cer Program
(MADD) OP
$39,150.00
$15,660.00
$9,787.50
118
NHTSA402SA
1807
Studen
t Safety Education
$25,000.00
$10,000.00
$6,250.00
72
NHTSA402TR
1801
Salaries (Traffic Records Research)
$100,000.00
$‐
$25,000.00
156
NHTSA402TR
1802
RI Police Chiefs Association ‐ Safety Partnership Program
$55,761.07
$22,304.43
$13,940.27
89
NHTSA402DE1801
Driver's Education Assessm
ent
$40,000.00
$16,000.00
$10,000.00
119
TO
TAL 402 FU
NDS
$3,117,188.54
$967,115.42
$811,647.14
NHTSAF19061800
Audit Fees
$100.00
N/A
N/A
157
NHTSAF19061801
Consultant Annual Rep
orts/Maint.
$374,900.00
N/A
N/A
144
To
tal F1906 Funds
$375,000.00
N/A
N/A
NHTSAM2HVE1801(405B)
State Agencies (URI) Seat Belt Law
Enforcem
ent Patrols
$1,000.00
N/A
$250.00
74
NHTSAM2HVE1802(405B)
State Agencies (RIM
PA) Law Enforcem
ent Highway Safety Training
Coordinator (LEH
STC) Including Drug Recognition Expert (DRE) Training
and Statewide Program
$93,565.00
N/A
$23,391.25
87
NHTSAM2PE1803(405B)
Paid M
edia(CPS)
$25,000.00
N/A
$6,250.00
72
NHTSAM2X1800(405B)
Audit Fees
$350.00
N/A
$87.50
157
NHTSAM2X1801(405B)
Salaries (Occupant Protection)
$100,000.00
N/A
$25,000.00
156
To
tal 405B Funds
$219,915.00
N/A
$54,978.75
NHTSAM3DA1800(405C)
Audit Fees
$600.00
N/A
$150.00
157
NHTSAM3DA1801(405C)
Salaries (Traffic Records)
$115,000.00
N/A
$28,750.00
156
NHTSAM3DA1802(405C)
TRCC Consultant Services
$‐
N/A
$‐
‐

Rhod
e Is
land
Hig
hway
Saf
ety
Plan
| FF
Y 20
18
16
5 Co
st S
umm
ary
Award Number
Award Full Nam
e
Budget Amount
Share to Local
State Funds
Page #
NHTSAM3DA1803(405C)
Crash M
MUCC Revision
$65,000.00
N/A
$16,250.00
143
NHTSAM3DA1804(405C)
RI Police Chiefs Association Statewide RMS Traffic Records System
$200,000.00
N/A
$50,000.00
144
NHTSAM3DA1805(405C)
Trauma Registry
$256,400.00
N/A
$64,100.00
142
NHTSAM3DA1806(405C)
State Agencies (HEA
LTH) EM
S $52,516.00
N/A
$13,129.00
141
NHTSAM3DA1807(405C)
Traffic Records Data Wareh
ouse
$300,000.00
N/A
$75,000.00
143
Total 405C
Funds
$989,516.00
N/A
$247,379.00
NHTSAM5BAC1801(405D)
Municipalities Im
paired Driving BAT (Breath Alcohol Testing) M
obile
Providence
$61,325.00
N/A
$15,331.25
84
NHTSAM5CS1801(405D)
State Agencies (AG) Traffic Safety Resource Prosecutor (TSRP)
$134,346.44
N/A
$44,782.12
86
NHTSAM5HVE1801(405D)
State Agencies (RIM
PA) Law Enforcem
ent Highway Safety Training
Coordinator (LEH
STC) Including Drug Recognition Expert (DRE) Training
and Statewide Program
$93,564.00
N/A
$23,391.00
87
NHTSAM5HVE1802(405D)
State Agencies (RISP) Im
paired Driving LE Patrols (Including DRE)
$171,520.00
N/A
$42,880.00
83
NHTSAM5HVE1803(405D)
State Agencies (URI) Im
paired Driving LE Patrols (Including DRE)
$500.00
N/A
$125.00
88
NHTSAM5HVE1804(405D)
Municipalities Im
paired Driving Law Enforcem
ent Patrols (Including
DRE)
$258,500.00
N/A
$64,625.00
83
NHTSAM5IDC1801(405D)
Salaries (Im
paired Driving)
$230,000.00
N/A
$57,500.00
156
NHTSAM5OT1801(405D)
SFST Training Assessm
ent
$40,000.00
N/A
$10,000.00
90
NHTSAM5TR
1801(405D)
Coastline EAP
$36,720.00
N/A
$9,180.00
119
NHTSAM5TR
1802(405D)
Criminal Justice Training
$20,000.00
N/A
$5,000.00
92
NHTSAM5X1800(405D)
Audit Fees
$900.00
N/A
$225.00
157
NHTSAM5CS1802(405D)
State Agencies (HEA
LTH) Forensic Toxicologist (TSRFT) and Prelim
inary
Breath Testing and Intoxilyzer 9000s Im
plemen
tation Program
& FBA
Units
$70,000.00
N/A
$17,500.00
88
Total 405D
Funds
$1,117,375.44
N/A
$290,539.37
NHTSAFESX1800(405E)
Audit Fees
$100.00
N/A
$25.00
157
NHTSAFESD
DLE1801(405E)
Salaries (Distracted Driving)
$100,000.00
N/A
$25,000.00
156
NHTSAFESD
DLE1802(405E)
State Agencies (RISP) Distracted Driving
$36,850.00
N/A
$9,212.50
153
NHTSAFESD
DLE1803(405E)
Municipalities Distracted Driving
$86,300.00
N/A
$21,575.00
153
To
tal 405E Funds
$223,250.00
N/A
$55,812.50
NHTSAM9MA1801(405F)
Salaries (MC)
$50,000.00
N/A
$12,500.00
156
NHTSAM9X1800(405F)
Audit Fees
$100.00
N/A
$25.00
157

Rhod
e Is
land
Hig
hway
Saf
ety
Plan
| FF
Y 20
18
16
6 Co
st S
umm
ary
Award Number
Award Full Nam
e
Budget Amount
Share to Local
State Funds
Page #
NHTSAM9MA1802(405F)
Paid M
edia (MC) Awaren
ess Cam
paign
(May)
$29,000.00
N/A
$7,250.00
111
Total 405F Funds
$79,100.00
N/A
$19,775.00
NHTSAFH
LE1801(405H)
State Agencies (RISP) En
forcem
ent
$2,010.00
N/A
$502.50
131
NHTSAFH
LE1802(405H)
Municipalities Pedestrian/Bicycle Enforcem
ent Patrols
$77,000.00
N/A
$19,250.00
131
NHTSAFH
PE1801(405H)
Pedestrian/Bicycle Public Education
$50,000.00
N/A
$12,500.00
130
NHTSAFH
TR1802(405H)
Ped Safety Training/Education for LE
$55,925.00
N/A
$13,981.25
131
NHTSAFH
X1800(405H)
Audit Fees
$75.00
N/A
$18.75
157
NHTSAFH
X1801(405H)
Salaries (Nonmotorized Safety)
$25,000.00
N/A
$6,250.00
156
Total 405H
Funds
$210,010.00
N/A
$52,502.50
GRAND TOTA
L $10,063,433.64
$2,461,066.88
$1,532,634.26

Rhod
e Is
land
Hig
hway
Saf
ety
Plan
| FF
Y 20
18
16
7 Co
st S
umm
ary
Tabl
e 5.
2 Co
st S
umm
ary
by D
epar
tmen
t
DEP
ARTM
ENT
ALCOHOL
NHTSA M
5 HVE 1804
(405D)
CIOT
NHTSA 402 OP 18 04
CPS/SEATS/
TRAINING
NHTSA 402 OP 1805
SPEED
NHTSA 402 PT 18 04
DISTR
ACTED
DRIVING
NHTSA FESDDLE 1803
(405E)
PED
/BIKE
SAFETY
NHTSA FHLE 18 02
(405H)
TOTA
L
Barrington
$5,000.00
$8,000.00
$1,625.00
$5,000.00
$2,000.00
$21,625.00
Bristol
$5,000.00
$3,000.00
$1,417.00
$4,000.00
$2,000.00
$‐
$15,417.00
Burrillville
$10,000.00
$8,000.00
$1,400.00
$15,000.00
$‐
$‐
$34,400.00
Cen
tral Falls
$20,000.00
$18,000.00
$3,000.00
$28,800.00
$5,000.00
$5,000.00
$79,800.00
Charlestown
$1,500.00
$1,500.00
$1,000.00
$2,000.00
$1,000.00
$‐
$7,000.00
Coventry
$4,000.00
$3,000.00
$5,625.00
$5,000.00
$2,000.00
$2,000.00
$21,625.00
Cranston
$25,000.00
$20,000.00
$5,580.00
$35,000.00
$10,000.00
$10,000.00
$105,580.00
Cumberland
$2,500.00
$8,000.00
$3,000.00
$2,000.00
$2,000.00
$2,000.00
$19,500.00
East Green
wich
$2,500.00
$2,500.00
$1,000.00
$3,000.00
$2,000.00
$11,000.00
East Providen
ce
$1,000.00
$5,000.00
$1,000.00
$5,000.00
$2,000.00
$1,300.00
$15,300.00
Foster
$5,000.00
$3,000.00
$1,000.00
$5,000.00
$1,800.00
$‐
$15,800.00
Glocester
$1,500.00
$3,000.00
$‐
$2,500.00
$‐
$‐
$7,000.00
Hopkinton
$3,500.00
$6,000.00
$‐
$3,000.00
$‐
$‐
$12,500.00
Jamestown
$7,000.00
$5,000.00
$1,000.00
$3,000.00
$‐
$‐
$16,000.00
Johnston
$2,000.00
$3,000.00
$2,000.00
$5,000.00
$‐
$‐
$12,000.00
Lincoln
$4,000.00
$4,000.00
$1,000.00
$3,000.00
$‐
$2,000.00
$14,000.00
Little Compton
$1,000.00
$1,500.00
$1,500.00
$2,000.00
$‐
$‐
$6,000.00
Middletown
$3,000.00
$4,000.00
$1,745.00
$3,500.00
$3,000.00
$2,000.00
$17,245.00
Narragansett
$5,000.00
$4,000.00
$1,650.00
$8,000.00
$‐
$‐
$18,650.00
New
Shoreham
$1,000.00
$1,000.00
$1,000.00
$1,000.00
$4,000.00
New
port
$1,000.00
$1,000.00
$‐
$1,000.00
$1,000.00
$3,000.00
$7,000.00
North Kingstown
$3,000.00
$2,000.00
$500.00
$5,000.00
$10,500.00
North Providen
ce
$4,000.00
$4,000.00
$1,745.00
$2,500.00
$12,245.00
North Smithfield
$5,000.00
$5,000.00
$2,000.00
$1,000.00
$1,000.00
$14,000.00

Rhod
e Is
land
Hig
hway
Saf
ety
Plan
| FF
Y 20
18
16
8 Co
st S
umm
ary
DEP
ARTM
ENT
ALCOHOL
NHTSA M
5 HVE 1804
(405D)
CIOT
NHTSA 402 OP 18 04
CPS/SEATS/
TRAINING
NHTSA 402 OP 1805
SPEED
NHTSA 402 PT 18 04
DISTR
ACTED
DRIVING
NHTSA FESDDLE 1803
(405E)
PED
/BIKE
SAFETY
NHTSA FHLE 18 02
(405H)
TOTA
L
Paw
tucket
$10,000.00
$10,000.00
$3,000.00
$15,000.00
$2,000.00
$2,000.00
$42,000.00
Portsm
outh
$10,000.00
$2,800.00
$1,000.00
$4,000.00
$5,000.00
$22,800.00
Providen
ce
$15,000.00
$20,000.00
$2,000.00
$20,000.00
$15,000.00
$15,000.00
$87,000.00
Richmond
$5,000.00
$2,000.00
$1,500.00
$3,000.00
$2,500.00
$14,000.00
Scituate
$5,000.00
$2,000.00
$‐
$2,000.00
$2,000.00
$11,000.00
Smithfield
$8,000.00
$4,500.00
$5,745.00
$6,000.00
$2,000.00
$26,245.00
South Kingstown
$18,000.00
$7,500.00
$9,355.00
$12,750.00
$2,500.00
$50,105.00
Tiverton
$5,000.00
$3,000.00
$1,000.00
$3,000.00
$12,000.00
Warren
$2,000.00
$2,000.00
$1,000.00
$3,000.00
$2,000.00
$1,000.00
$11,000.00
Warwick
$30,000.00
$16,000.00
$5,500.00
$30,000.00
$20,000.00
$15,000.00
$116,500.00
West Green
wich
$5,000.00
$3,000.00
$1,000.00
$8,000.00
$2,000.00
$19,000.00
West Warwick
$9,000.00
$5,000.00
$1,350.00
$7,000.00
$2,000.00
$2,500.00
$26,850.00
Westerly
$9,000.00
$6,000.00
$2,540.00
$3,000.00
$2,500.00
$2,500.00
$25,540.00
Woonsocket
$5,000.00
$12,000.00
$2,000.00
$5,000.00
$2,500.00
$26,500.00
Total
$258,500.00
$219,300.00
$76,777.00
$271,050.00
$86,300.00
$76,800.00
$988,727.00

Rhode Island Highway Safety Plan | FFY 2018
169 Certifications and Assurances
Certifications and Assurances

Rhode Island Highway Safety Plan | FFY 2018
170 Certifications and Assurances

Rhode Island Highway Safety Plan | FFY 2018
171 Certifications and Assurances

Rhode Island Highway Safety Plan | FFY 2018
172 Certifications and Assurances

Rhode Island Highway Safety Plan | FFY 2018
173 Certifications and Assurances

Rhode Island Highway Safety Plan | FFY 2018
174 Certifications and Assurances

Rhode Island Highway Safety Plan | FFY 2018
175 Certifications and Assurances

Rhode Island Highway Safety Plan | FFY 2018
176 Certifications and Assurances

Rhode Island Highway Safety Plan | FFY 2018
177 Certifications and Assurances

Rhode Island Highway Safety Plan | FFY 2018
178 Certifications and Assurances

Rhode Island Highway Safety Plan | FFY 2018
179 Certifications and Assurances

Rhode Island Highway Safety Plan | FFY 2018
180 Certifications and Assurances

Rhode Island Highway Safety Plan | FFY 2018
181 Section 405 Grant Program
Section 405 Grant Program For FFY 2018, Rhode Island is applying for the following 405 incentive grants programs:
› Occupant Protection (23 U.S.C. 405(b)) (23 CFR23CFR 1300.21)
› State Traffic Safety Information System Improvements (23 U.S.C. 405(c)) (23CFR 1200.22)
› Impaired Driving Countermeasures (23 U.S.C. 405(d)) (23CFR 1300.23)
› Distracted Driving (23 U.S.C. 405(e) (23CFR 1300.24)
› Motorcyclist Safety (23 U.S.C. 405(f)) (23 CFR 1200.25)
› Graduated Driver Licensing (23 U.S.C. 405 (g)) (23CFR 1300.26)
› Non-Motorized Safety (23U.S.C. 405(h)) (23CFR 1300.27)
The 405 application, which is signed by the Governor of Rhode Island Representative for Highway Safety includes the completed sections of the Appendix B to Part 1300 – Certification and Assurances for National Priority Safety Program Grants and the accompanying documentation, will be sent separately to NHTSA.

Rhode Island Highway Safety Plan | FFY 2018
182 Section 405 Grant Program
This page intentionally left blank.