february 2017 company presentation - think up lks · 2 disclaimer • this document has been...
TRANSCRIPT
1
February 2017 Company Presentation
2
D ISCLAIMER
• This document has been prepared by CIE Automotive, S.A. ("CIE Automotive"), and is for information purposes only. No reliance may or should be placed for any purposes whatsoever on the information contained in this document or on its completeness, accuracy or fairness. This document and the information contained herein are strictly confidential and are being shown to you solely for your information. The information may not be copied, distributed, reproduced or passed on, directly or indirectly, in whole or in part, or disclosed by any recipient, to any other person (whether within or outside such person's organisation or firm) or published in whole or in part, for any purpose or under any circumstances.
• This document is an advertisement and not a prospectus for the purposes of applicable measures implementing EU Directive 2003/71/EC (such Directive, together with any applicable implementing measures in the relevant home Member State under such Directive, the "Prospectus Directive") and as such does not constitute or form part of any offer to sell or issue or invitation to purchase or subscribe for, or any solicitation of any offer to purchase or subscribe for, any securities of CIE Automotive or any of its affiliates or subsidiaries, nor shall it or any part of it nor the fact of its distribution form the basis of, or be relied on in connection with, any contract or investment decision. Investors should not subscribe for or purchase any securities referred to in this advertisement except on the basis of the information contained in any prospectus eventually published in accordance with the Prospectus Directive. The information and opinions contained in this document are provided as at the date of the document and are subject to change.
• This document is not an offer of securities for sale in the United States, Australia, Canada or Japan. The information contained herein does not constitute an offer of securities for sale in the United States, Australia, Canada or Japan. Securities may not be offered or sold in the United States unless they are registered or are exempt from registration. No money, securities or other consideration is being solicited and, if sent in response to the information contained herein, will not be accepted. Copies of this document are not being, and should not be, distributed or sent into the United States. This document does not constitute an offer of securities to the public in the United Kingdom or in any other jurisdiction. The distribution of this document in other jurisdictions may also be restricted by law and persons into whose possession this document comes should inform themselves about and observe any such restrictions.
• Certain financial and statistical information contained in this document is subject to rounding adjustments. Accordingly, any discrepancies between the totals and the sums of the amounts listed are due to rounding. Certain management financial measures included in this document have not been subject to a financial audit.
• The information and opinions contained in this document are provided as at the date of the document and are subject to verification, completion and change without notice. Neither CIE Automotive nor any of its parent or subsidiary undertakings, or the subsidiary undertakings of any such parent undertakings, or any of such person's respective directors, officers, employees, agents, affiliates or advisers, undertakes any obligation to amend, correct or update this document or to provide the recipient with access to any additional information that may arise in connection with it.

3
TABLE OF CONTENTS
1. What is CIE Automotive? 2. Automotive Project
3. Smart Innovation Project
7. CIE in Stock Exchange 6. Strategic Commitment: What is next?
4. Corporate Social Responsibility 5. Update on Results 30th Sept. 2016
4
1.0 What is CIE Automotive?
5
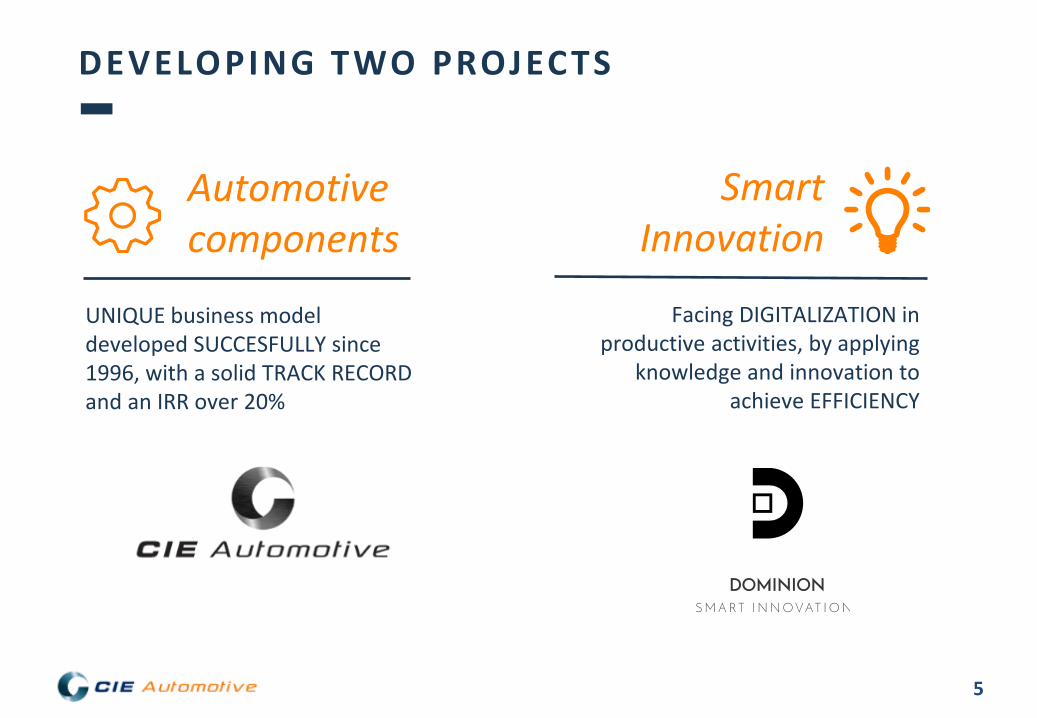
DEVELOPING TWO PROJECTS
UNIQUE business model developed SUCCESFULLY since 1996, with a solid TRACK RECORD and an IRR over 20%
Facing DIGITALIZATION in
productive activities, by applying knowledge and innovation to
achieve EFFICIENCY
Automotive components
Smart Innovation

6
WHAT IS C IE AUTOMOTIVE?
Integration, sum and management of processes in a sustainable, profitable and efficient way:
Automotive project carried forward in the context of the necessary consolidation of the TIER2 atomized sector.
Dominion project developed to challenge the status quo by applying Smart Innovation.
Succesful M&A track record: almost 70 M&A transactions since 1996, with 20.000 people integrated in Europe, Nafta, South America and Asia.
Strict acquisition discipline, requiring minimum ROI.
Mkt Cap: > 2,300M€
Employees ≈ 25,000
Sales 2015: 2,632 M€
EBITDA (*) 2015:
366 M€
(*) EBITDA: Net Operating Income + Depreciation.
7
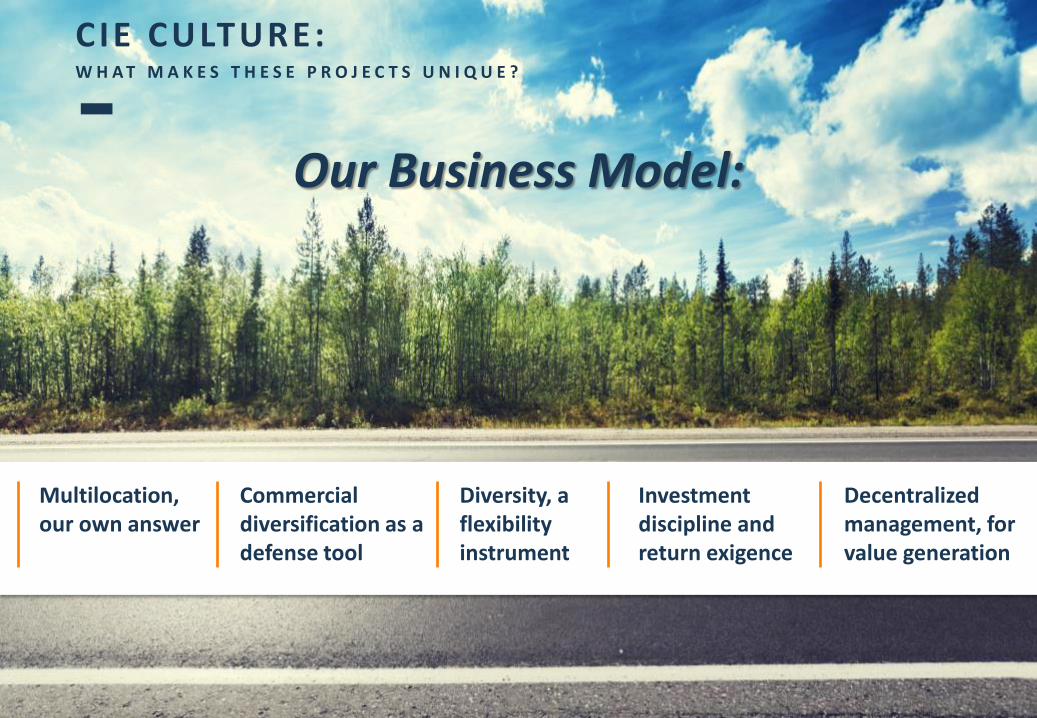
CIE CULTURE: W H A T M A K E S T H E S E P R O J E C T S U N I Q U E ?
Commercial diversification as a defense tool
Diversity, a flexibility instrument
Investment discipline and return exigence
Decentralized management, for value generation
Our Business Model:
Multilocation, our own answer

8
AN INTEGRATION AND SUM STORY. . .
9
WEST EUROPE
AFRICA
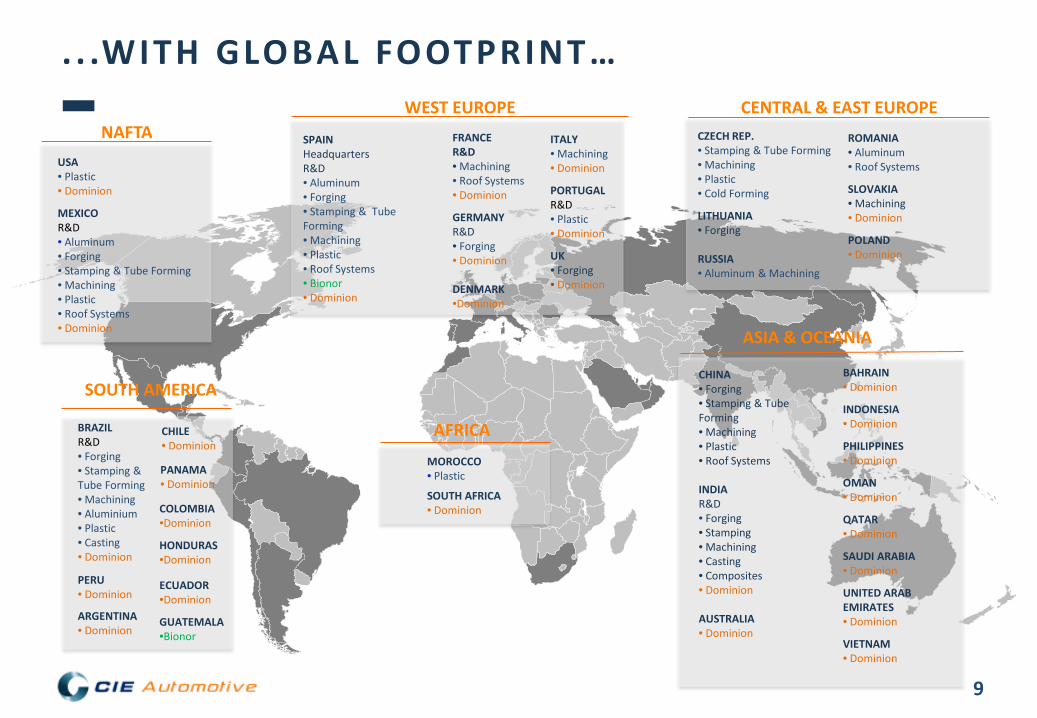
USA • Plastic • Dominion MEXICO R&D • Aluminum • Forging • Stamping & Tube Forming • Machining • Plastic • Roof Systems • Dominion
NAFTA
. . .WITH GLOBAL FOOTPRINT…
SPAIN Headquarters R&D • Aluminum • Forging • Stamping & Tube Forming • Machining • Plastic • Roof Systems • Bionor • Dominion
ITALY • Machining • Dominion PORTUGAL R&D • Plastic • Dominion UK • Forging • Dominion
FRANCE R&D • Machining • Roof Systems • Dominion GERMANY R&D • Forging • Dominion DENMARK •Dominion
CZECH REP. • Stamping & Tube Forming • Machining • Plastic • Cold Forming LITHUANIA • Forging
RUSSIA • Aluminum & Machining
ROMANIA • Aluminum • Roof Systems SLOVAKIA • Machining • Dominion POLAND • Dominion
CENTRAL & EAST EUROPE
BRAZIL R&D • Forging • Stamping & Tube Forming • Machining • Aluminium • Plastic • Casting • Dominion
SOUTH AMERICA
PERU • Dominion
ARGENTINA • Dominion
CHILE • Dominion
COLOMBIA •Dominion
HONDURAS •Dominion ECUADOR •Dominion
GUATEMALA •Bionor
MOROCCO • Plastic PANAMA
• Dominion SOUTH AFRICA • Dominion
ASIA & OCEANIA
CHINA • Forging • Stamping & Tube Forming • Machining • Plastic • Roof Systems INDIA R&D • Forging • Stamping • Machining • Casting • Composites • Dominion
AUSTRALIA • Dominion
BAHRAIN • Dominion
INDONESIA • Dominion
PHILIPPINES • Dominion
OMAN • Dominion
QATAR • Dominion
SAUDI ARABIA • Dominion
UNITED ARAB EMIRATES • Dominion
VIETNAM • Dominion
10
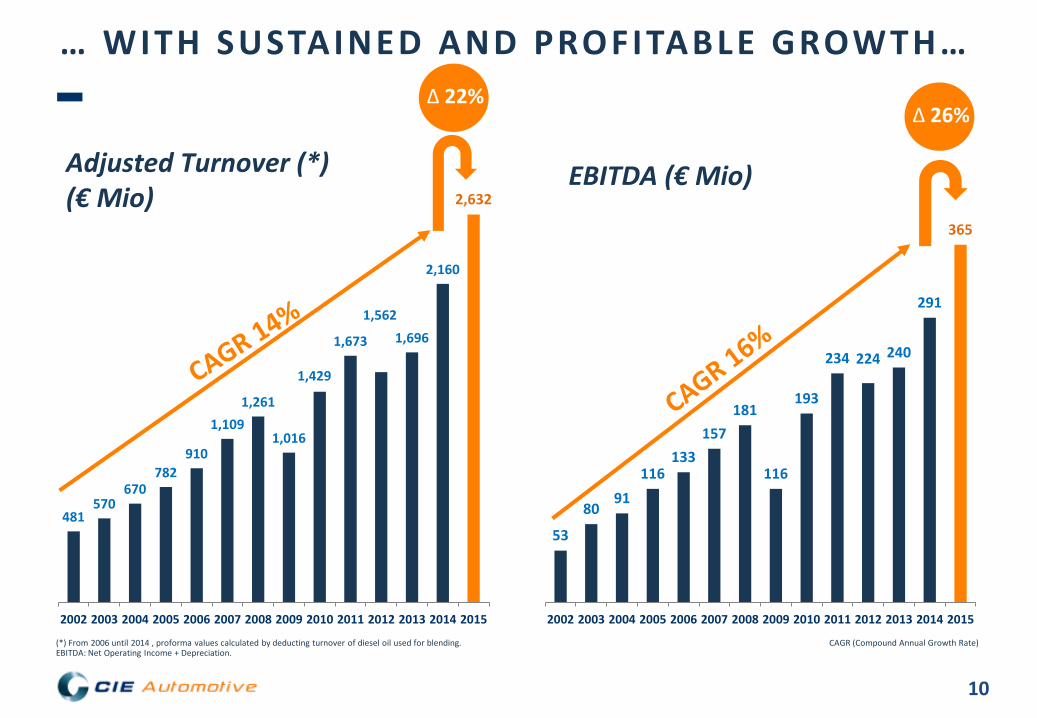
53
80 91
116 133
157 181
116
193
234 224 240
291
365
2002 2003 2004 2005 2006 2007 2008 2009 2010 2011 2012 2013 2014 2015
481 570
670 782
910
1,109 1,261
1,016
1,429
1,673
1,562 1,696
2,160
2,632
2002 2003 2004 2005 2006 2007 2008 2009 2010 2011 2012 2013 2014 2015
(*) From 2006 until 2014 , proforma values calculated by deducting turnover of diesel oil used for blending. CAGR (Compound Annual Growth Rate) EBITDA: Net Operating Income + Depreciation.
… WITH SUSTAINED AND PROFITABLE GROWTH…
Adjusted Turnover (*) (€ Mio)
EBITDA (€ Mio)
∆ 22% ∆ 26%
11
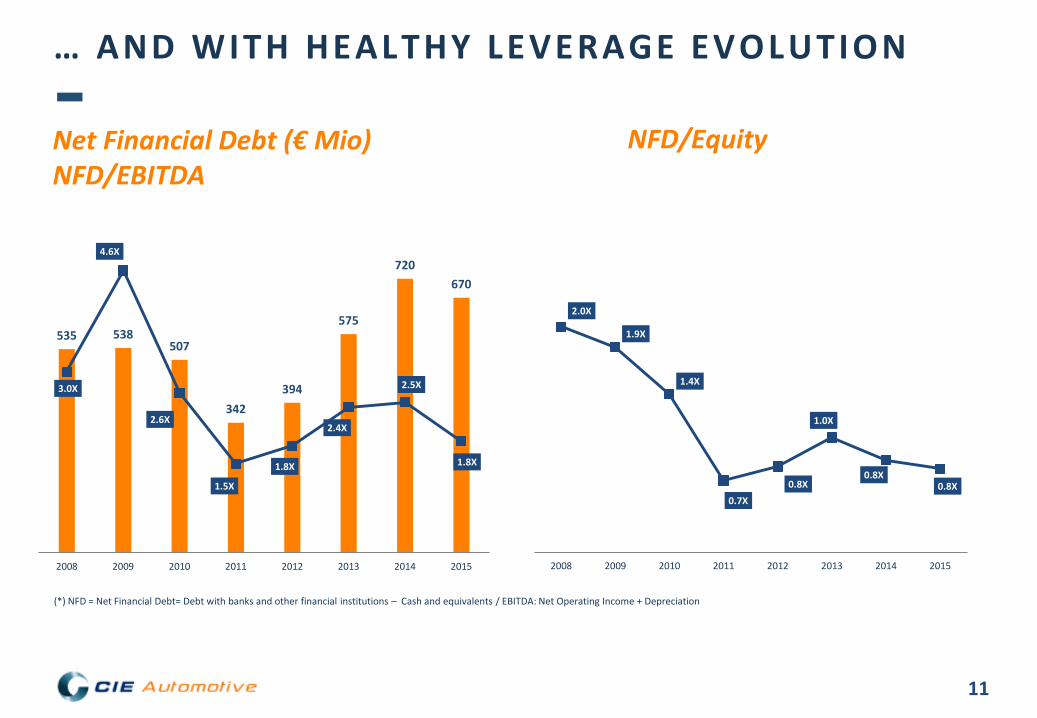
… AND WITH HEALTHY LEVERAGE EVOLUTION
(*) NFD = Net Financial Debt= Debt with banks and other financial institutions – Cash and equivalents / EBITDA: Net Operating Income + Depreciation
Net Financial Debt (€ Mio) NFD/EBITDA
NFD/Equity
535 538 507
342 394
575
720 670
3.0X
4.6X
2.6X
1.5X
1.8X
2.4X
2.5X
1.8X
2008 2009 2010 2011 2012 2013 2014 2015
2.0X
1.9X
1.4X
0.7X 0.8X
1.0X
0.8X 0.8X
2008 2009 2010 2011 2012 2013 2014 2015
12
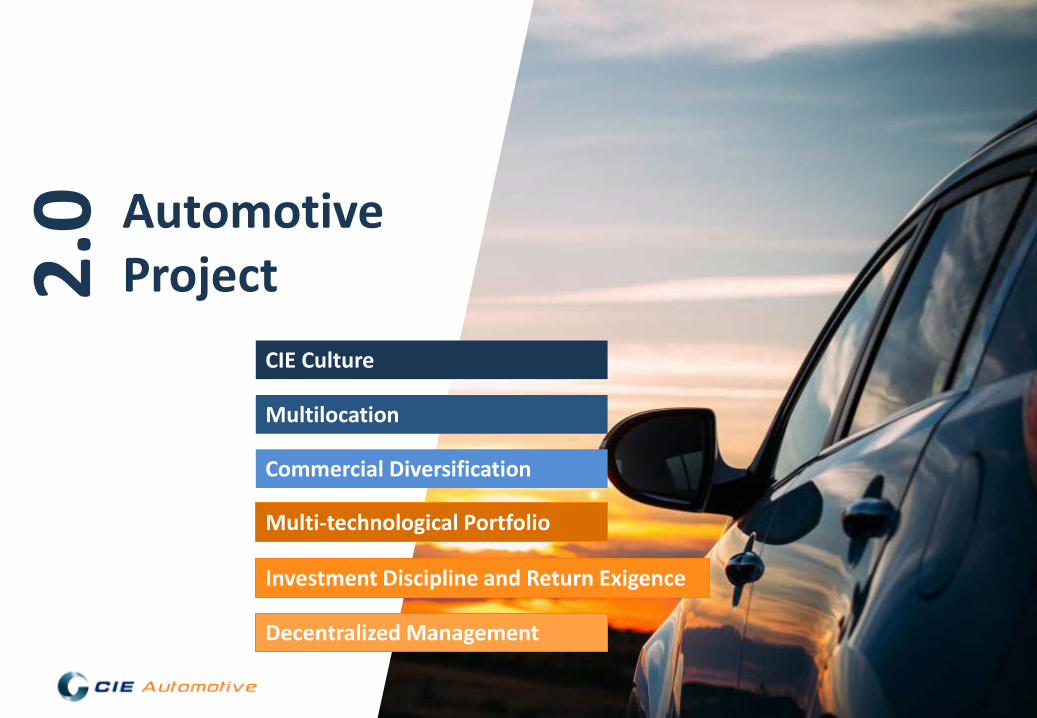
Automotive Project 2.
0
CIE Culture
Multilocation
Multi-technological Portfolio
Investment Discipline and Return Exigence
Commercial Diversification
Decentralized Management
13
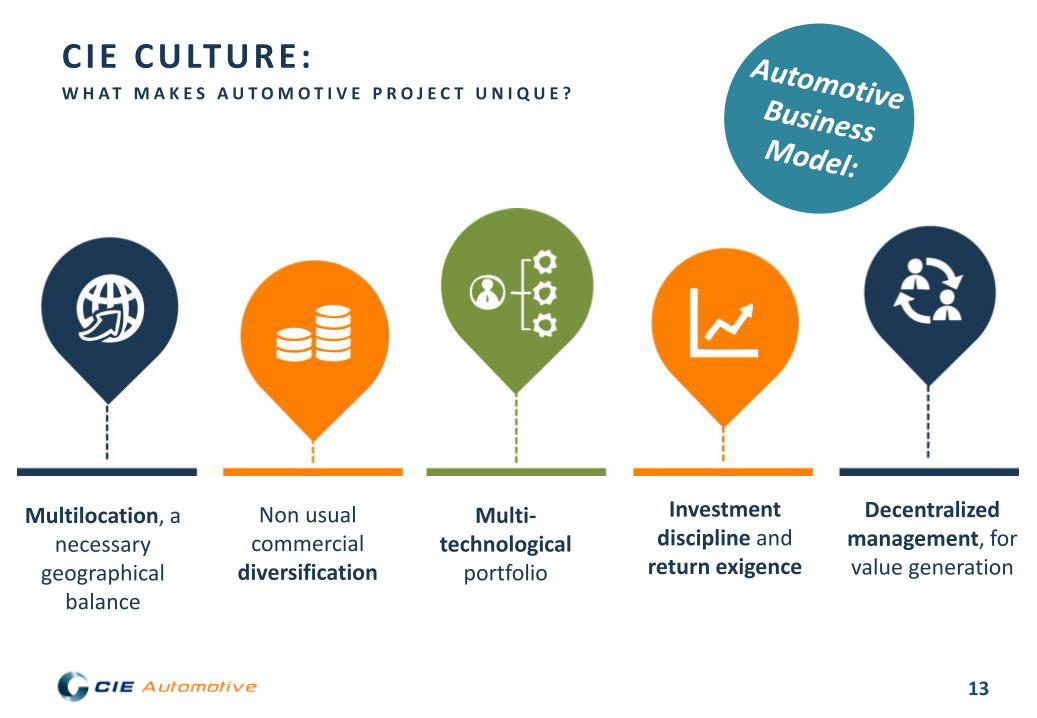
CIE CULTURE: W H A T M A K E S A U T O M O T I V E P R O J E C T U N I Q U E ?
Multilocation, a necessary
geographical balance
Non usual commercial
diversification
Multi-technological
portfolio
Decentralized management, for value generation
Investment discipline and
return exigence
14
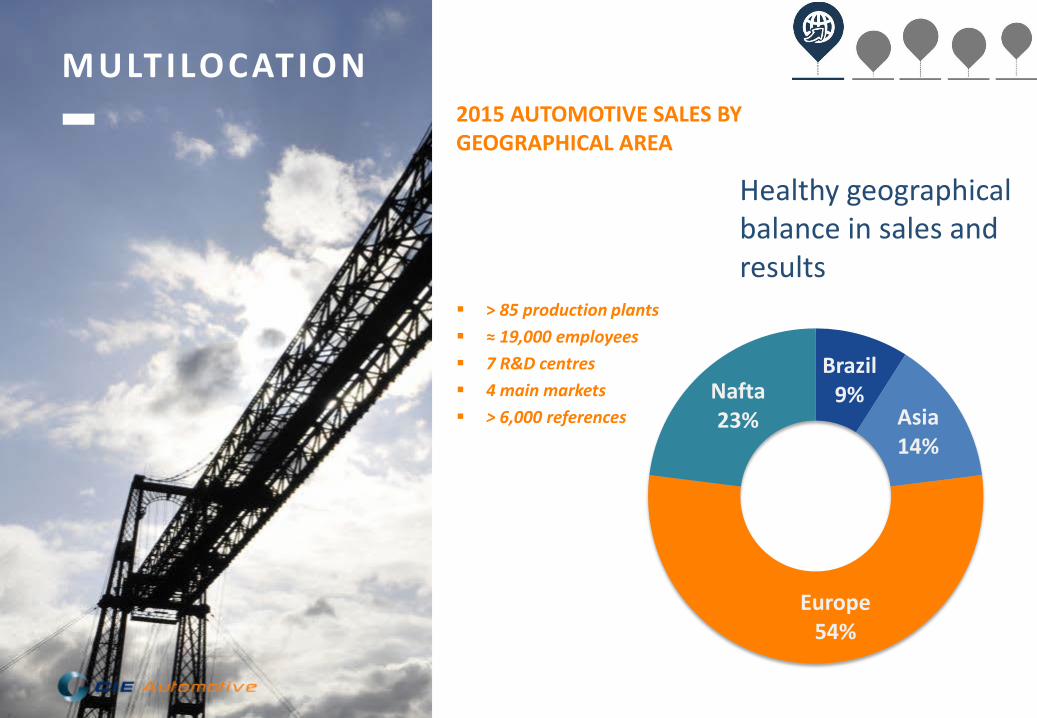
Healthy geographical balance in sales and results
2015 AUTOMOTIVE SALES BY GEOGRAPHICAL AREA
> 85 production plants ≈ 19,000 employees 7 R&D centres 4 main markets > 6,000 references
MULTILOCATION
Brazil 9%
Asia 14%
Europe 54%
Nafta 23%
15
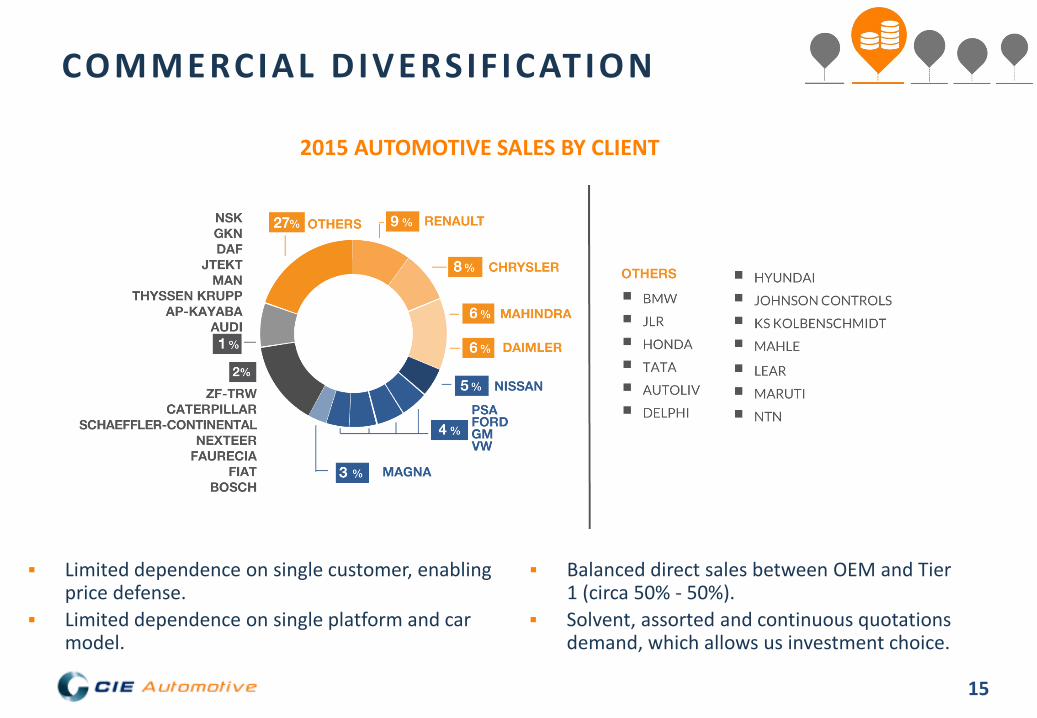
Limited dependence on single customer, enabling price defense.
Limited dependence on single platform and car model.
Balanced direct sales between OEM and Tier 1 (circa 50% - 50%).
Solvent, assorted and continuous quotations demand, which allows us investment choice.
COMMERCIAL DIVERSIF ICATION
2015 AUTOMOTIVE SALES BY CLIENT

16
Offering the integration of a whole range of different technologies in main Automotive geographical markets…
…Enabling the selection of the technology that fulfills better customers needs.
…Allowing CIE to focus investments on winning technology anytime.
…And at the same time projecting CIE as a Powertrain products worldwide leader.
MULTI-TECHNOLOGICAL PORTFOLIO
Process EU NAFTA Brazil India China
Forgings
Aluminum
Castings
Machining
Stampings
Plastics
Roof Systems
AUTOMOTIVE SALES BY TECHNOLOGY
TECHNOLOGY BY GEOGRAPHICAL AREA
Aluminium
HPDC 10%
Forging 26%
Stamping & Tube Forming
24%
Machining 16%
Plastic 15%
Iron Casting 4%
Roof Systems 5%

17
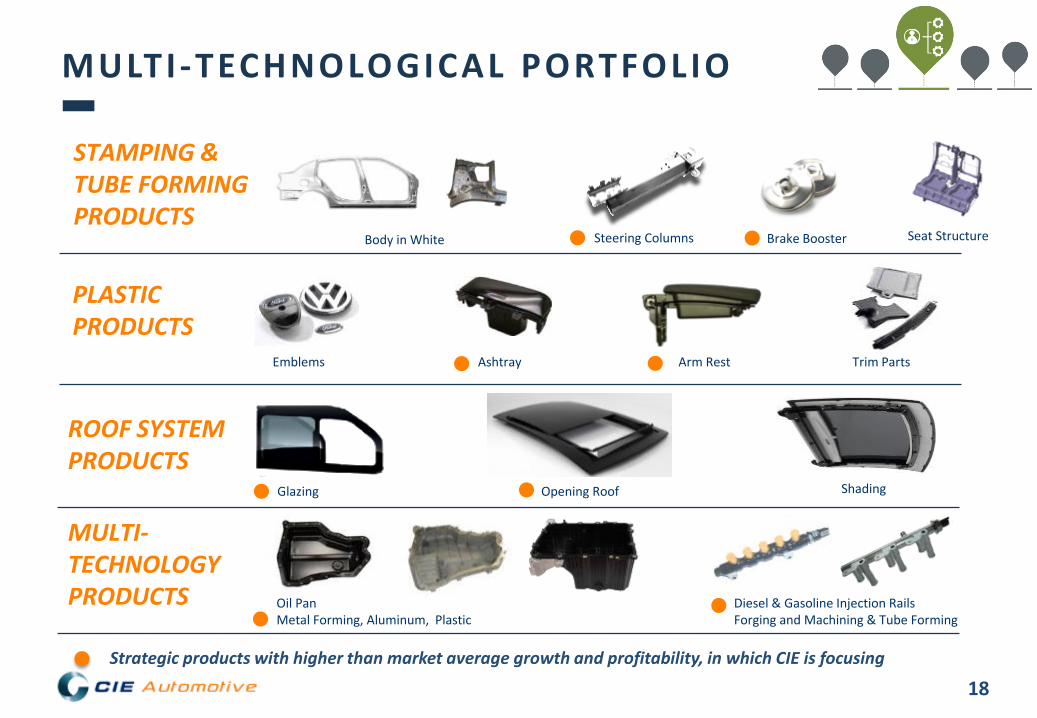
Strategic products with higher than market average growth and profitability, in which CIE is focusing
MULTI-TECHNOLOGICAL PORTFOLIO
FORGING PRODUCTS
Crankshaft CV- Joints Axle Shaft Axle Beam
ALUMINUM PRODUCTS
Gearbox Housing Clutch Housing Steering Housings Camshaft Cover
Brake Drum
CASTING PRODUCTS
Turbo Housing
Crankshaft Differential Housing
EPS component Flange
MACHINING PRODUCTS
Hubs, Outer Rings Differential Case
Ladder Frame
18
ROOF SYSTEM PRODUCTS
Glazing
Opening Roof Shading
MULTI- TECHNOLOGY PRODUCTS Oil Pan
Metal Forming, Aluminum, Plastic
Diesel & Gasoline Injection Rails Forging and Machining & Tube Forming
Strategic products with higher than market average growth and profitability, in which CIE is focusing
STAMPING & TUBE FORMING PRODUCTS
Body in White Brake Booster Seat Structure
PLASTIC PRODUCTS
Emblems Ashtray Arm Rest Trim Parts
MULTI -TECHNOLOGICAL PORTFOLIO
Steering Columns
19
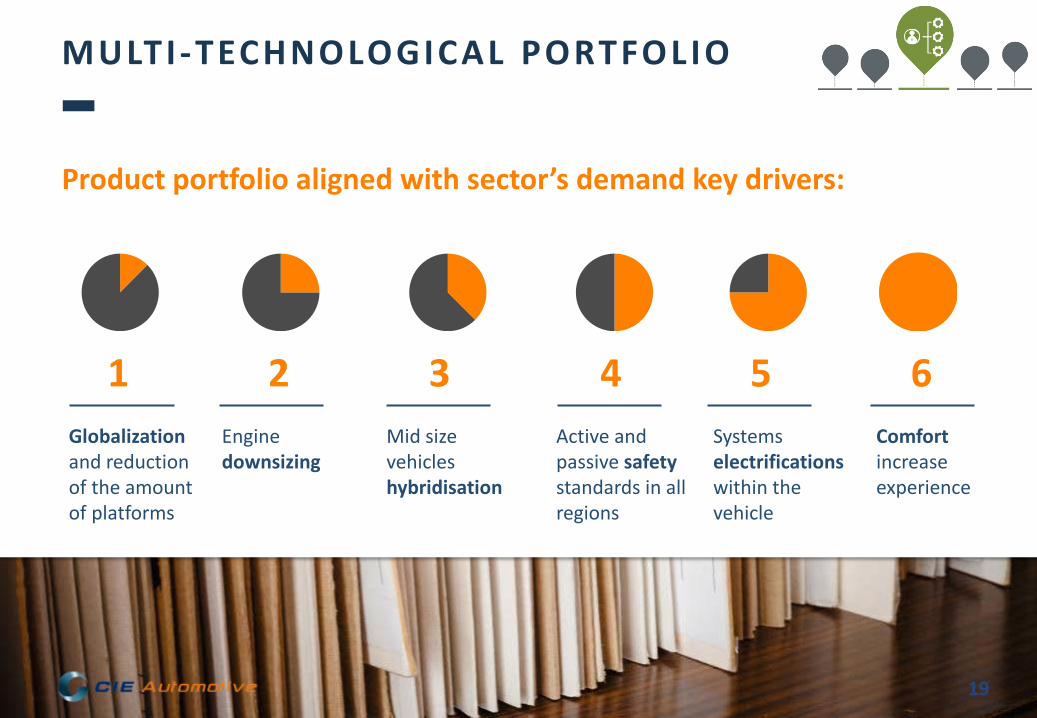
Product portfolio aligned with sector’s demand key drivers:
1 2 Globalization and reduction of the amount of platforms
Engine downsizing
3 Mid size vehicles hybridisation
4 Active and passive safety standards in all regions
5 Systems electrifications within the vehicle
6 Comfort increase experience
MULTI-TECHNOLOGICAL PORTFOLIO

20
STANDARD FLEXIBLE
MACHINERY
Valid to produce for different customers and platforms, allowing HIGH SATURATION of productive capacity. ≈4% recurrent investment level that allows maintenance and 2-3% organic growth.
STRICT INVESTMENT
DISCIPLINE
Investment analysis discipline, always requiring high returns. Capex ≥ 20% ROI. Operating Working Capital ≈0. M&A: EV/EBITDA ≤3 in 3 years.
EBITDA CONVERSION
INTO CASH
Optimization of productive capacity and investment control enables a higher than market average conversion of the EBITDA into Cash. ≈50% conversion level target.
INVESTMENT DISCIPL INE AND RETURN EXIGENCE
21
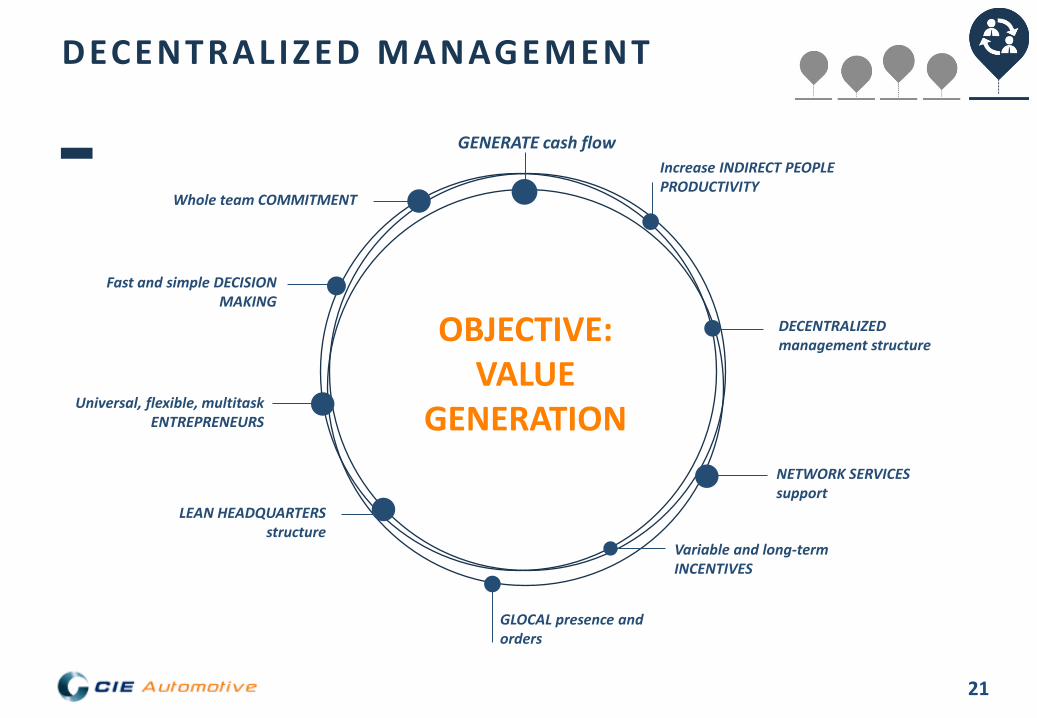
OBJECTIVE: VALUE
GENERATION
GENERATE cash flow Increase INDIRECT PEOPLE
PRODUCTIVITY
DECENTRALIZED management structure
NETWORK SERVICES support
Variable and long-term INCENTIVES
GLOCAL presence and orders
LEAN HEADQUARTERS structure
Universal, flexible, multitask ENTREPRENEURS
Fast and simple DECISION MAKING
Whole team COMMITMENT
DECENTRALIZED MANAGEMENT
22
Smart Innovation Project 3.
0

23
Workforce: ~25.000
Experts in process management
Facing DIGITALIZATION in productive activities by applying technology, knowledge and innovation to achieve EFFICIENCY in our clients´ processes
+
>50% Dominion Capital
Revenues(2): 2.632 M€
Ebitda(2): 366 M€
Workforce ~5,500
Revenues (1) >600 m€
Ebitda (1) >45 m€
Global >30 countries
Shared culture
Growth plan
Cash Flow Convers. >100% & above peers
(1) 2016E estimated data (2) 2015 data
24
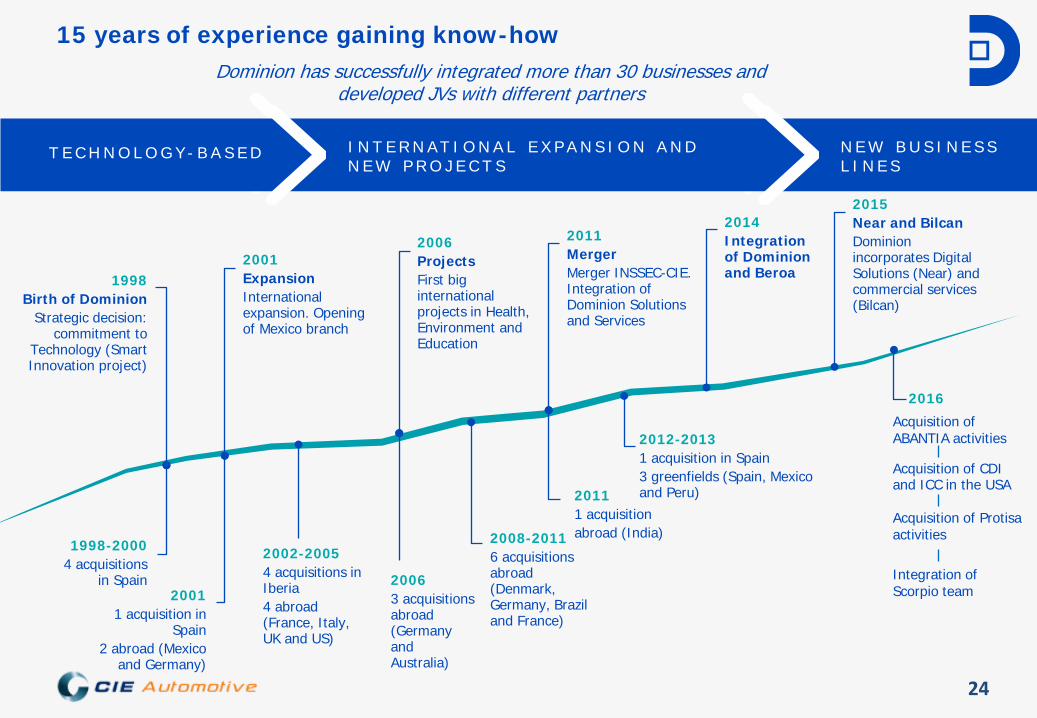
15 years of experience gaining know-how
1998 Birth of Dominion
Strategic decision: commitment to
Technology (Smart Innovation project)
2001 Expansion International expansion. Opening of Mexico branch
2006 Projects First big international projects in Health, Environment and Education
2011 Merger Merger INSSEC-CIE. Integration of Dominion Solutions and Services
2014 Integration of Dominion and Beroa
2015 Near and Bilcan Dominion incorporates Digital Solutions (Near) and commercial services (Bilcan)
1998-2000 4 acquisitions
in Spain 2001
1 acquisition in Spain
2 abroad (Mexico and Germany)
2002-2005 4 acquisitions in Iberia 4 abroad (France, Italy, UK and US)
2006 3 acquisitions abroad (Germany and Australia)
2008-2011 6 acquisitions abroad (Denmark, Germany, Brazil and France)
2011 1 acquisition abroad (India)
2012-2013 1 acquisition in Spain 3 greenfields (Spain, Mexico and Peru)
2016
Acquisition of ABANTIA activities Acquisition of CDI and ICC in the USA
Acquisition of Protisa activities
Integration of Scorpio team
T E C H N O L O G Y - B A S E D
I N T E R N A T I O N A L E X P A N S I O N A N D N E W P R O J E C T S
N E W B U S I N E S S L I N E S
Dominion has successfully integrated more than 30 businesses and developed JVs with different partners
25
Knowledge
Technology Innovation
Services We manage the process
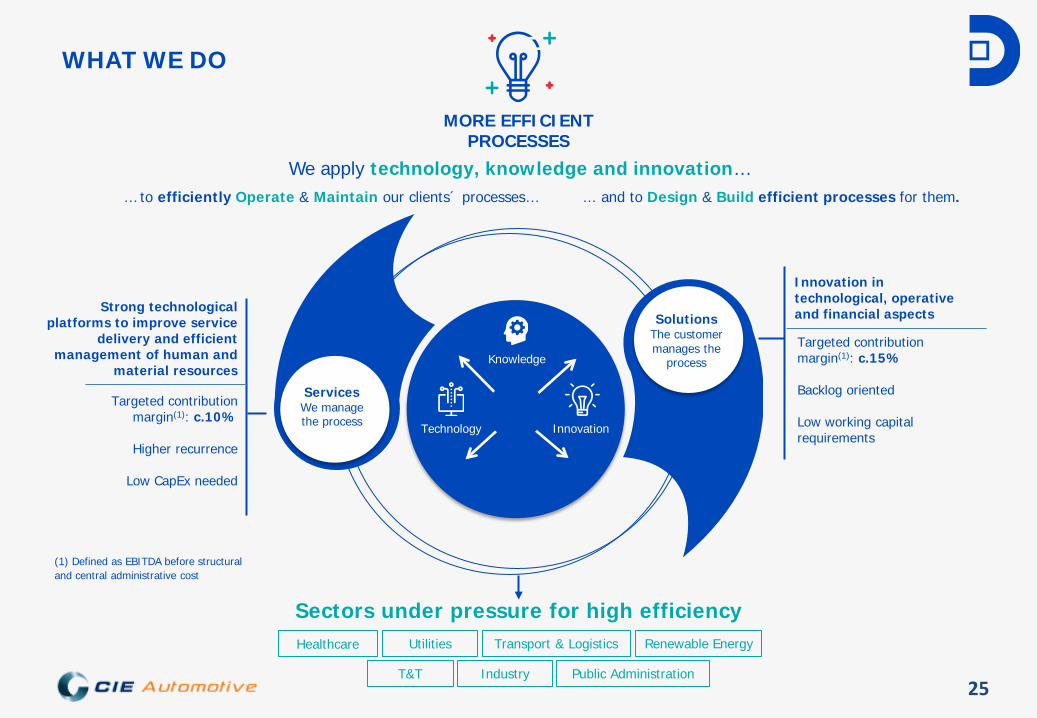
WHAT WE DO
MORE EFFICIENT PROCESSES
We apply technology, knowledge and innovation…
Strong technological platforms to improve service
delivery and efficient management of human and
material resources
Sectors under pressure for high efficiency
... and to Design & Build efficient processes for them.
Targeted contribution margin(1): c.10%
Higher recurrence
Low CapEx needed
T&T Industry
Healthcare Renewable Energy Transport & Logistics
Public Administration
Utilities
Solutions The customer manages the
process
Innovation in technological, operative and financial aspects
Targeted contribution margin(1): c.15%
Backlog oriented
Low working capital requirements
… to efficiently Operate & Maintain our clients´ processes…
(1) Defined as EBITDA before structural and central administrative cost
26
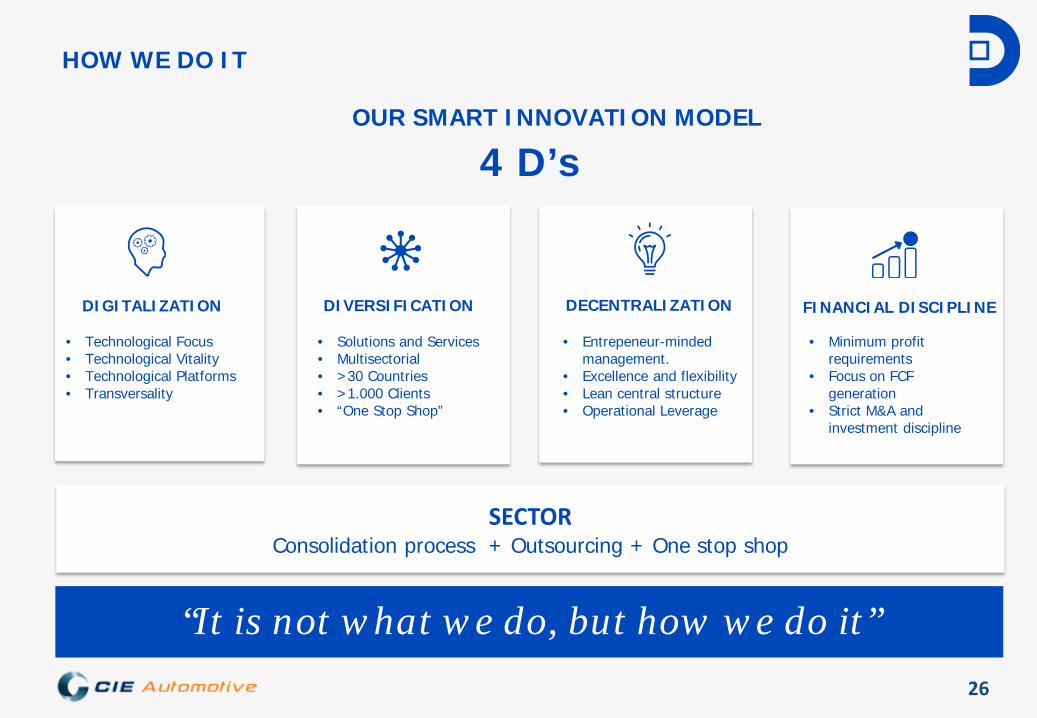
SECTOR Consolidation process + Outsourcing + One stop shop
“It is not what we do, but how we do it”
4 D’s
DIGITALIZATION
• Technological Focus • Technological Vitality • Technological Platforms • Transversality
DIVERSIFICATION
• Solutions and Services • Multisectorial • >30 Countries • >1.000 Clients • “One Stop Shop”
DECENTRALIZATION
• Entrepeneur-minded management.
• Excellence and flexibility • Lean central structure • Operational Leverage
FINANCIAL DISCIPLINE
HOW WE DO IT
OUR SMART INNOVATION MODEL
• Minimum profit requirements
• Focus on FCF generation
• Strict M&A and investment discipline
27
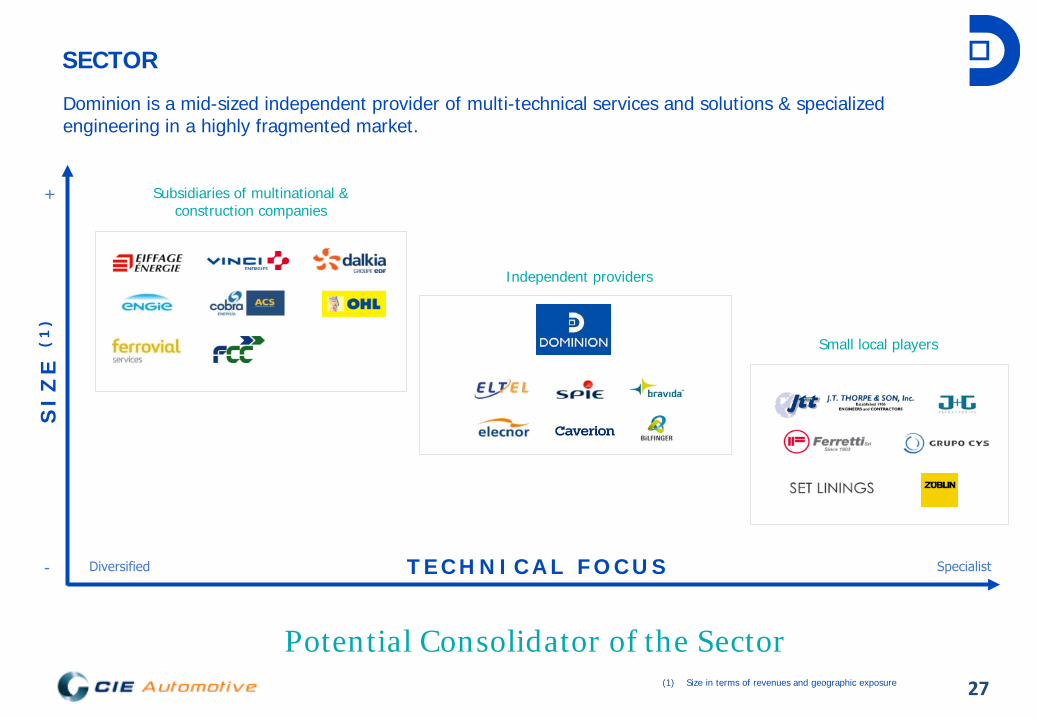
Dominion is a mid-sized independent provider of multi-technical services and solutions & specialized engineering in a highly fragmented market.
SECTOR
Subsidiaries of multinational & construction companies
Independent providers
Small local players
Potential Consolidator of the Sector
SI
ZE
T E C H N I C A L F O C U S
+
-
Small local players
SI
ZE
(1
)
(1) Size in terms of revenues and geographic exposure
28
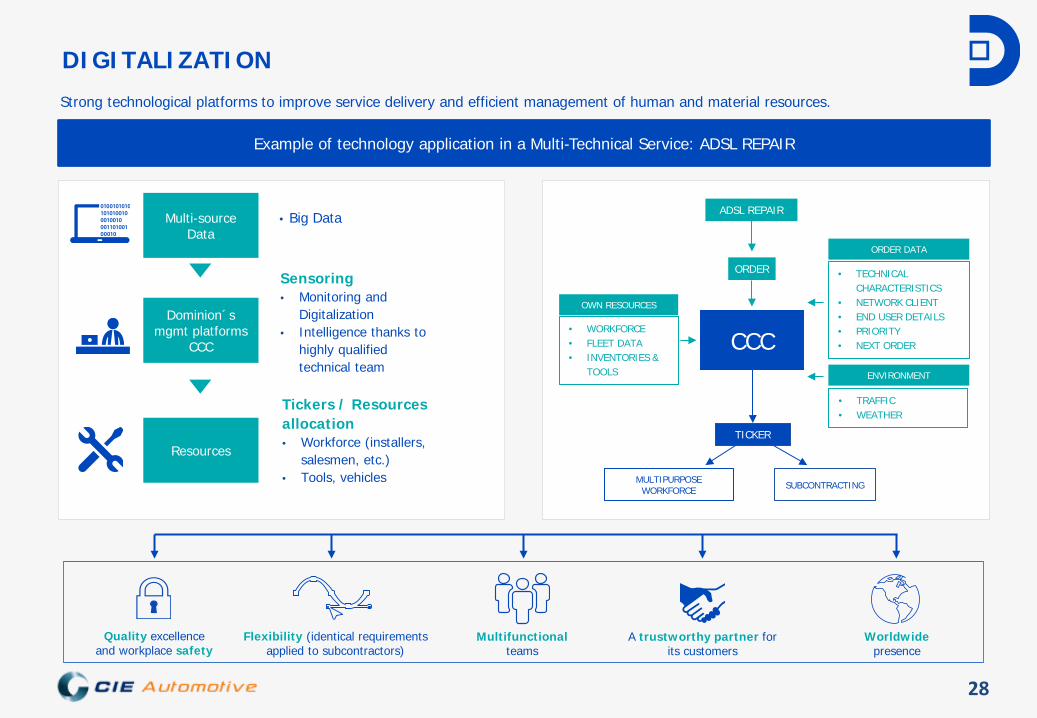
DIGITALIZATION
Multi-source Data
Example of technology application in a Multi-Technical Service: ADSL REPAIR
Dominion´s mgmt platforms
CCC
Resources
Sensoring • Monitoring and
Digitalization • Intelligence thanks to
highly qualified technical team
Tickers / Resources allocation • Workforce (installers,
salesmen, etc.) • Tools, vehicles
• Big Data ADSL REPAIR
ORDER
TICKER
• TECHNICAL CHARACTERISTICS
• NETWORK CLIENT • END USER DETAILS • PRIORITY • NEXT ORDER
ORDER DATA
• WORKFORCE • FLEET DATA • INVENTORIES &
TOOLS
OWN RESOURCES
MULTIPURPOSE WORKFORCE SUBCONTRACTING
• TRAFFIC • WEATHER
ENVIRONMENT
CCC
Quality excellence and workplace safety
Worldwide presence
Flexibility (identical requirements applied to subcontractors)
Multifunctional teams
A trustworthy partner for its customers
Strong technological platforms to improve service delivery and efficient management of human and material resources.

29
DIVERSIFICATION
A strong portfolio diversification(1)… … in several activity fields…(1)
…with a global footprint in more than 30 countries (1)… …and a wide client base…
Multi-Technical Services 57%
Solutions & Spec.
Engineering 43%
T&T 49% Industry
45%
Renewable Energy
6% T&T (49% REVENUES 15A)
INDUSTRY (45% revenues 15A)
RENEWABLE ENERGY (6% revenues 15A)
+1,000 clients
Asia & Oceanía: 12% Europa & Africa: 61% America: 27%
(1) 2016E estimated data. Revenue split

30
FINANCIAL DISCIPLINE
Focus on FCF generation
EBITDA Conversion into Cash R&D Investment Discipline Strict M&A Discipline
Target >60% EBITDA Maintain current RONA levels M&A: Target 3y-forward looking (including synergies) EV/EBITDA <=3x
• Limited CapEx requirements and WIP strict control
• Neutral WC model
• Strict R&D analysis and return exigency
• R&D projects developed under efficiency schemes
• Cash generation as the relevant valuation criteria
• Recurrent and thorough analysis of opportunities
• Strict screening and control on the integration of knowledge and companies to our “strategic carrier model”
• Post-acquisition strategy: digitalization/restructuring/internationalization
Value creation for shareholders
31
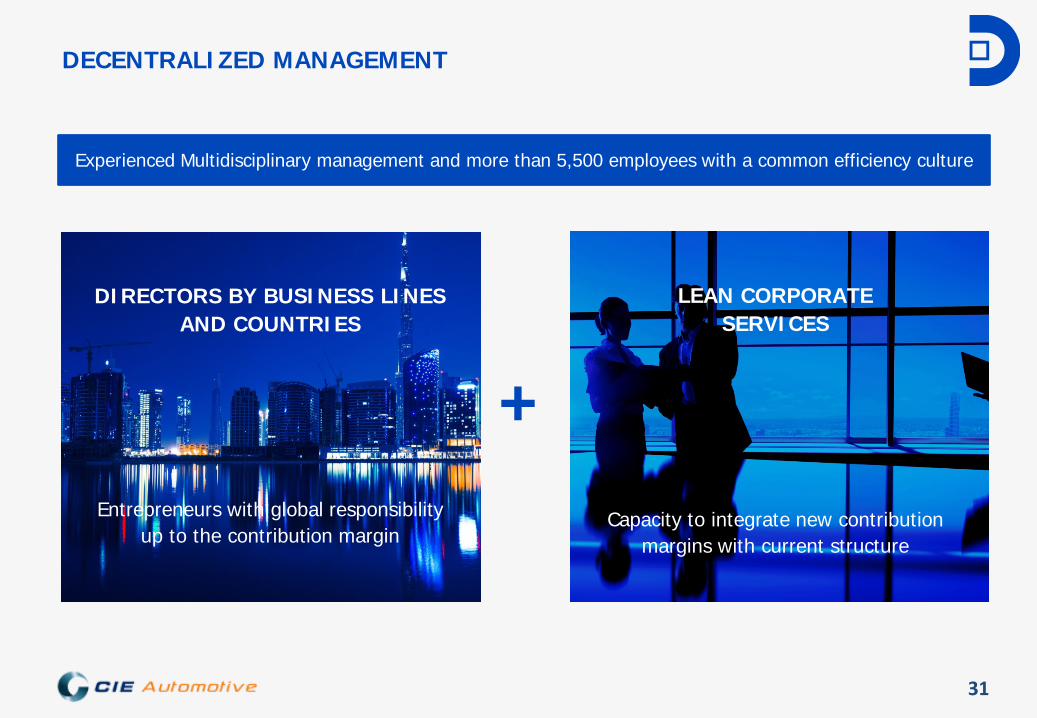
DECENTRALIZED MANAGEMENT
+
Experienced Multidisciplinary management and more than 5,500 employees with a common efficiency culture
DIRECTORS BY BUSINESS LINES AND COUNTRIES
Entrepreneurs with global responsibility up to the contribution margin
LEAN CORPORATE SERVICES
Capacity to integrate new contribution margins with current structure
32
Corporate Social
Responsibility
4.0
33
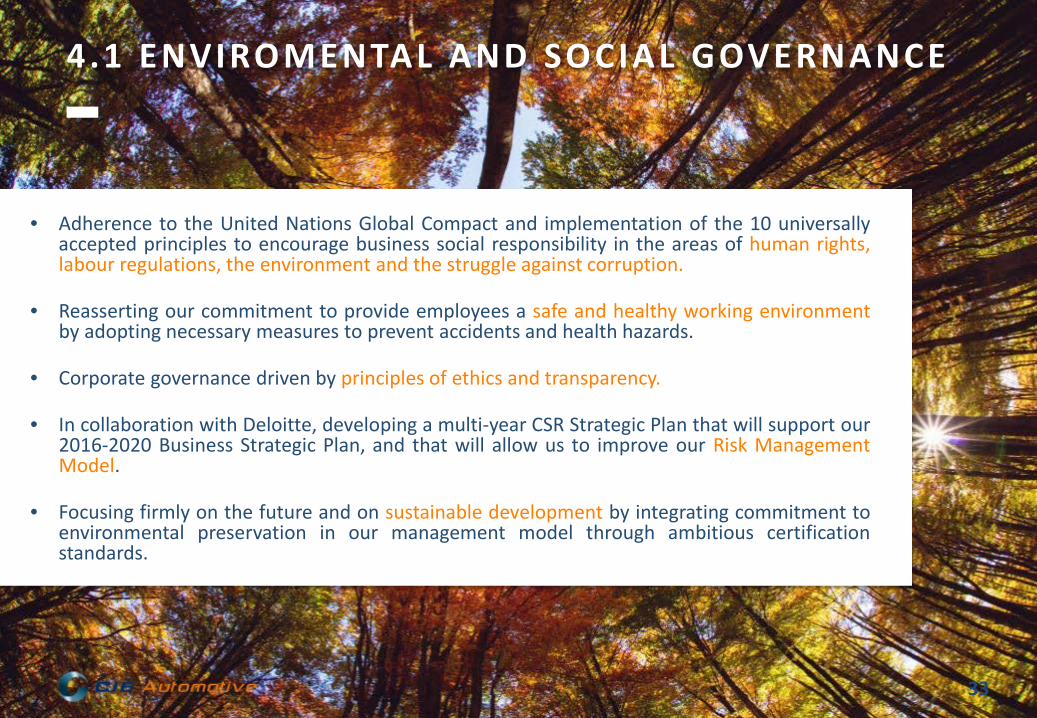
4.1 ENVIROMENTAL AND SOCIAL GOVERNANCE
• Adherence to the United Nations Global Compact and implementation of the 10 universally
accepted principles to encourage business social responsibility in the areas of human rights, labour regulations, the environment and the struggle against corruption.
• Reasserting our commitment to provide employees a safe and healthy working environment by adopting necessary measures to prevent accidents and health hazards.
• Corporate governance driven by principles of ethics and transparency.
• In collaboration with Deloitte, developing a multi-year CSR Strategic Plan that will support our 2016-2020 Business Strategic Plan, and that will allow us to improve our Risk Management Model.
• Focusing firmly on the future and on sustainable development by integrating commitment to environmental preservation in our management model through ambitious certification standards.
34
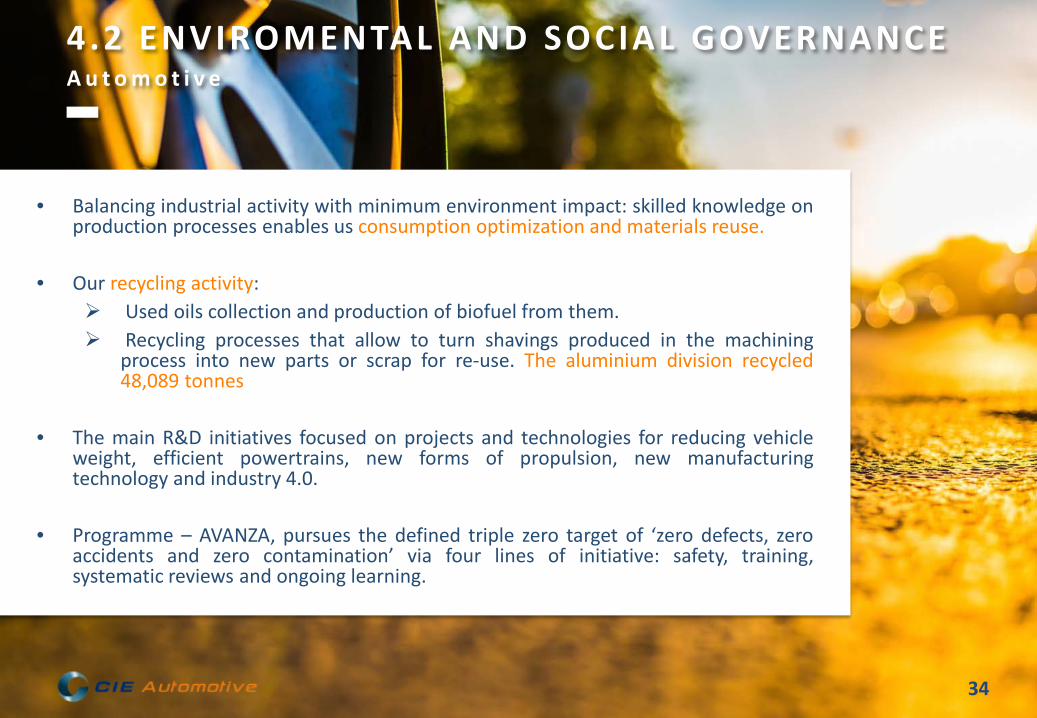
4.2 ENVIROMENTAL AND SOCIAL GOVERNANCE A u t o m o t i v e
• Balancing industrial activity with minimum environment impact: skilled knowledge on production processes enables us consumption optimization and materials reuse.
• Our recycling activity:
Used oils collection and production of biofuel from them. Recycling processes that allow to turn shavings produced in the machining
process into new parts or scrap for re-use. The aluminium division recycled 48,089 tonnes
• The main R&D initiatives focused on projects and technologies for reducing vehicle
weight, efficient powertrains, new forms of propulsion, new manufacturing technology and industry 4.0.
• Programme – AVANZA, pursues the defined triple zero target of ‘zero defects, zero
accidents and zero contamination’ via four lines of initiative: safety, training, systematic reviews and ongoing learning.
35
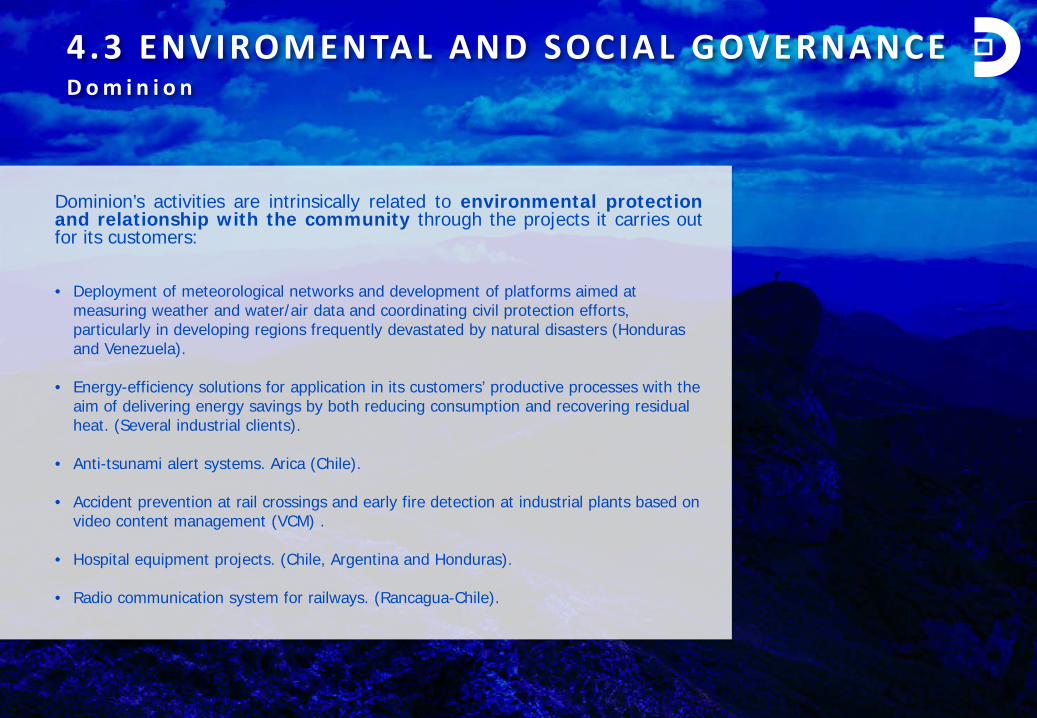
Dominion’s activities are intrinsically related to environmental protection and relationship with the community through the projects it carries out for its customers:
• Deployment of meteorological networks and development of platforms aimed at
measuring weather and water/air data and coordinating civil protection efforts, particularly in developing regions frequently devastated by natural disasters (Honduras and Venezuela).
• Energy-efficiency solutions for application in its customers’ productive processes with the
aim of delivering energy savings by both reducing consumption and recovering residual heat. (Several industrial clients).
• Anti-tsunami alert systems. Arica (Chile). • Accident prevention at rail crossings and early fire detection at industrial plants based on
video content management (VCM) . • Hospital equipment projects. (Chile, Argentina and Honduras). • Radio communication system for railways. (Rancagua-Chile).
4.3 ENVIROMENTAL AND SOCIAL GOVERNANCE D o m i n i o n
36
Update on results: 30th September 2016
5.0
Group Results September 2016
Balance Sheet
37
5.1 Group Results September 2016
38
Cifra de negocio (MM€)
EBITDA (*) (MM€)
30/09/2015
30/09/2016
Patrimonio Neto (MM€)
1,969.5
275.0
895.3
2,070.3
303.7
1,115.3
+5%
+10%
+26%
%
+25%
Resultado Neto (*) (MM€) 98.0 123.0
12.44
0.76 Beneficio por acción (€)
Cotización 30.06 (€/acción)
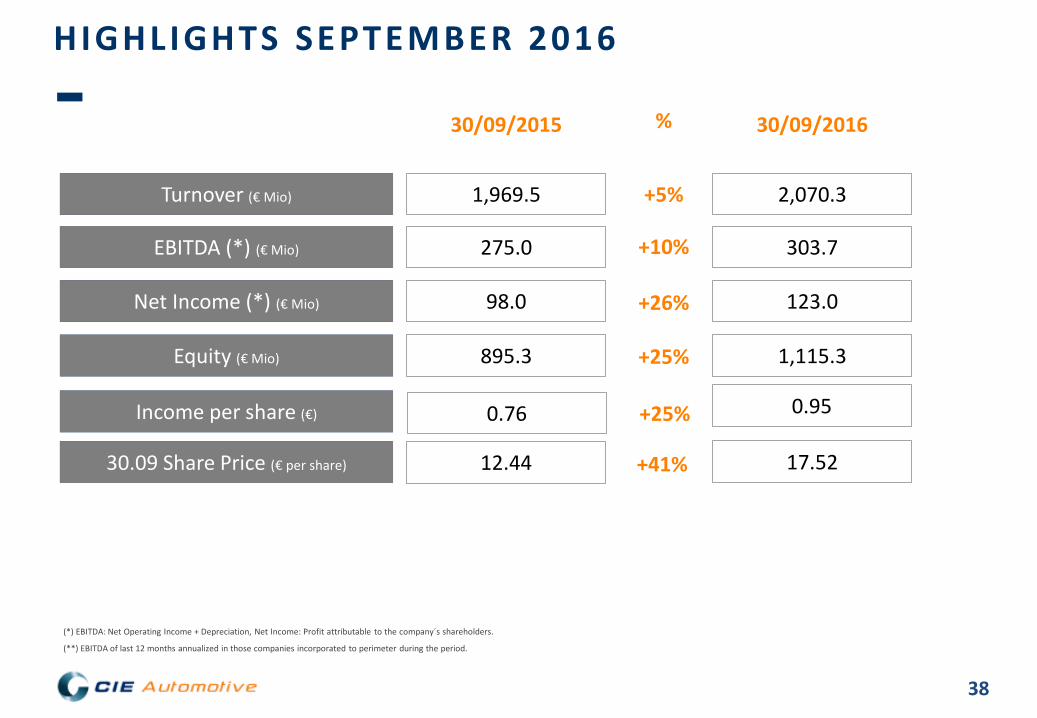
(*) EBITDA: Net Operating Income + Depreciation, Net Income: Profit attributable to the company´s shareholders.
(**) EBITDA of last 12 months annualized in those companies incorporated to perimeter during the period.
0.95
17.52 +41%
+25%
H IGHLIGHTS SEPTEMBER 2016
NFD/EBITDA (**)
Turnover (€ Mio)
EBITDA (*) (€ Mio)
Equity (€ Mio)
Net Income (*) (€ Mio)
Income per share (€)
30.09 Share Price (€ per share)
39
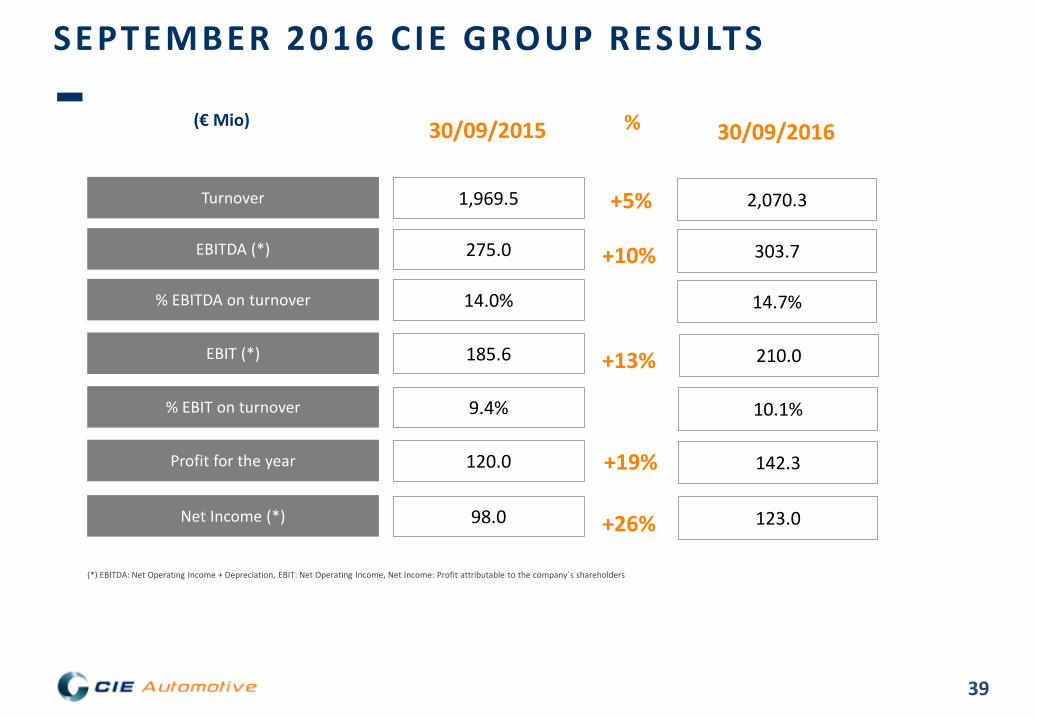
(*) EBITDA: Net Operating Income + Depreciation, EBIT: Net Operating Income, Net Income: Profit attributable to the company´s shareholders
SEPTEMBER 2016 CIE GROUP RESULTS
Turnover
30/09/2015
30/09/2016
% EBITDA on turnover
EBIT (*)
Profit for the year
Net Income (*)
1,969.5
14.0%
185.6
120.0
98.0
2,070.3
14.7%
210.0
142.3
123.0
% EBIT on turnover 9.4% 10.1%
EBITDA (*) 275.0 303.7 +10%
+13%
+26%
+5%
% (€ Mio)
+19%
40
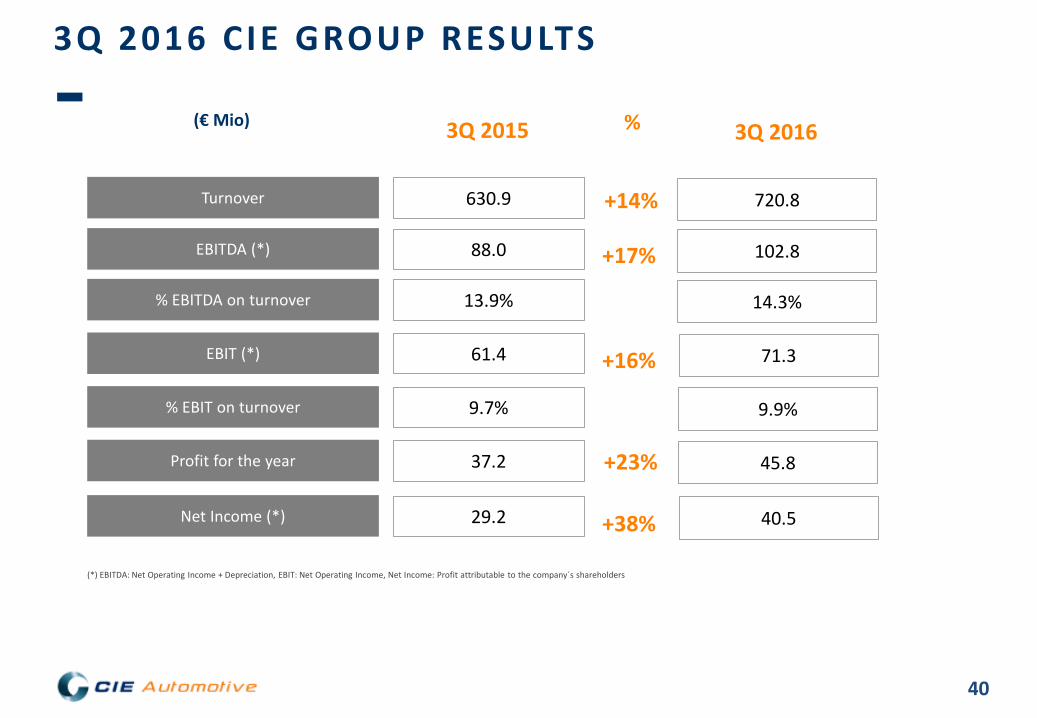
(*) EBITDA: Net Operating Income + Depreciation, EBIT: Net Operating Income, Net Income: Profit attributable to the company´s shareholders
3Q 2016 CIE GROUP RESULTS
Turnover
3Q 2015
3Q 2016
% EBITDA on turnover
EBIT (*)
Profit for the year
Net Income (*)
630.9
13.9%
61.4
37.2
29.2
720.8
14.3%
71.3
45.8
40.5
% EBIT on turnover 9.7% 9.9%
EBITDA (*) 88.0 102.8 +17%
+16%
+38%
+14%
% (€ Mio)
+23%

41
QUARTERLY EVOLUTION 2013/2014/2015/2016
Net Income (€ Mio)
Growing profit quarter after quarter Very significant growth of Net Income +25% vs September 2015, as a result of continuous improvement in operations’
margins.
17 16 13 14
19 20 21 21
31
38
29 31
37
45
41
1Q 2Q 3Q 4Q
2013 2014 2015 2016

42
(*) EBITDA: Net Operating Income + Depreciation, EBIT: Net Operating Income.
SEPTEMBER 2016 AUTOMOTIVE RESULTS
Turnover
30/09/2015 30/09/2016
% EBITDA on turnover
EBIT (*)
1,595.9
167.2
1,661.8
187.6
% EBIT on turnover
EBITDA (*) 247.6 271.7 +10%
+12%
+4%
% (€ Mio)
15.5% 16.3%
10.5% 11.3%
Net growth in sales of 4% mitigated by the exchange rate effect, by the pass through of raw material prices’ -2% drop into our selling prices
Excellent performance of margins in all regions, having reached EBIT margin 11.3%

43
3Q 2016 AUTOMOTIVE RESULTS
Turnover 491.5
3Q 2015 3Q 2016 % (€ Mio)
567.2
63.0
91.2 +17%
+16%
+15%
78.0
% EBITDA on turnover
EBIT (*)
% EBIT on turnover
EBITDA (*)
54.1
(*) EBITDA: Net Operating Income + Depreciation, EBIT: Net Operating Income.
15.9% 16.1%
11.0% 11.1%

44
(*) EBITDA: Net Operating Income + Depreciation, EBIT: Net Operating Income.
SEPTEMBER 2016 DOMINION RESULTS
Turnover
30/09/2015 30/09/2016
% EBITDA on turnover
EBIT (*)
373.5
18.3
408.5
22.5
% EBIT on turnover
EBITDA (*) 27.4 32.0 +17%
+22%
+9%
% (€ Mio)
7.3% 7.8%
4.9% 5.5%
Close to double-digit organic growth affected by an effect of exchange rate of -4%. +17% and +22% increase in EBITDA and EBIT respectively, supported by operating leverage and by last integrations
'margins improvement, following Dominion´s Smart Innovation business model

45
3Q 2016 DOMINION RESULTS
Turnover 139.4
3Q 2015 3Q 2016 % (€ Mio)
153.6
8.3
11.6 +16%
+14%
+10%
10.0
% EBITDA on turnover
EBIT (*)
% EBIT on turnover
EBITDA (*)
7.3
(*) EBITDA: Net Operating Income + Depreciation, EBIT: Net Operating Income.
7.2% 7.6%
5.2% 5.4%

46
7%
18%
26% 17%
12%
20% BrazilNAFTAEuropeMahindra EuropeAsia (India/China)Dominion
Turnover
5%
30%
31%
14%
10%
10%
BrazilNAFTAEuropeMahindra EuropeAsia (India/China)Dominion
EBITDA
EBITDA: Net Operating Income + Depreciation.
SEPTEMBER 2016 DIVIS IONS CONTRIBUTION
47
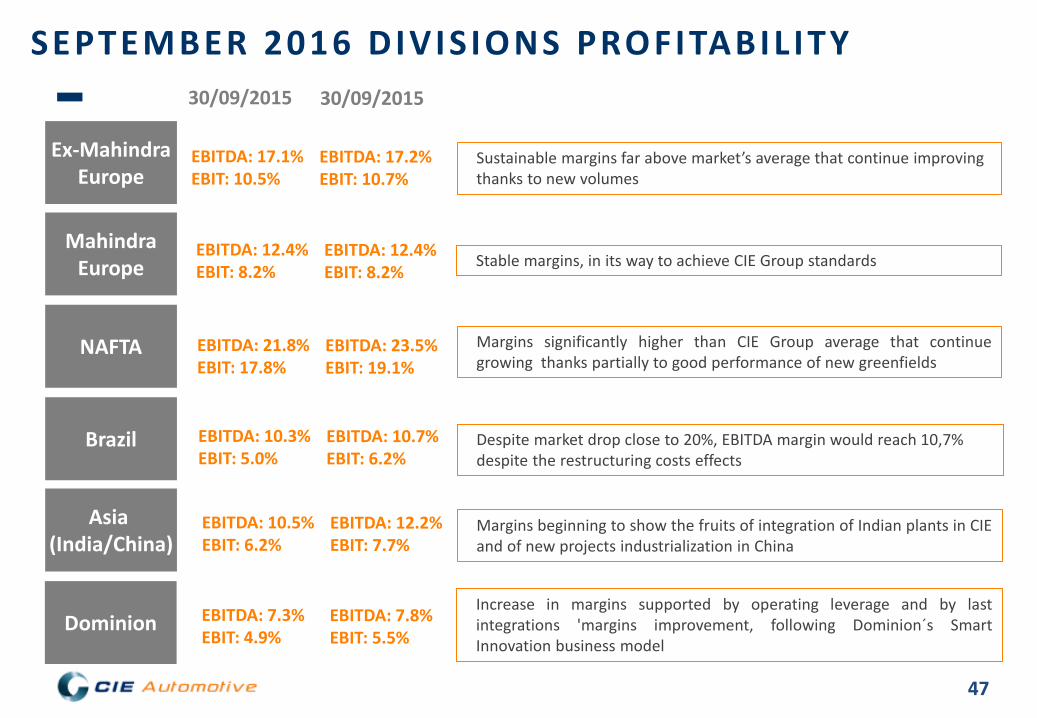
Sustainable margins far above market’s average that continue improving thanks to new volumes
EBITDA: 12.2% EBIT: 7.7%
EBITDA: 10.7% EBIT: 6.2%
EBITDA: 23.5% EBIT: 19.1%
EBITDA: 12.4% EBIT: 8.2%
EBITDA: 17.2% EBIT: 10.7%
Brazil
NAFTA
Ex-Mahindra Europe
Mahindra Europe
Asia (India/China)
Despite market drop close to 20%, EBITDA margin would reach 10,7% despite the restructuring costs effects
Margins significantly higher than CIE Group average that continue growing thanks partially to good performance of new greenfields
Stable margins, in its way to achieve CIE Group standards
Margins beginning to show the fruits of integration of Indian plants in CIE and of new projects industrialization in China
EBITDA: 17.1% EBIT: 10.5%
30/09/2015 30/09/2015
EBITDA: 12.4% EBIT: 8.2%
EBITDA: 21.8% EBIT: 17.8%
EBITDA: 10.3% EBIT: 5.0%
EBITDA: 10.5% EBIT: 6.2%
EBITDA: 7.8% EBIT: 5.5%
Dominion Increase in margins supported by operating leverage and by last integrations 'margins improvement, following Dominion´s Smart Innovation business model
EBITDA: 7.3% EBIT: 4.9%
SEPTEMBER 2016 DIVIS IONS PROFITABIL ITY
48
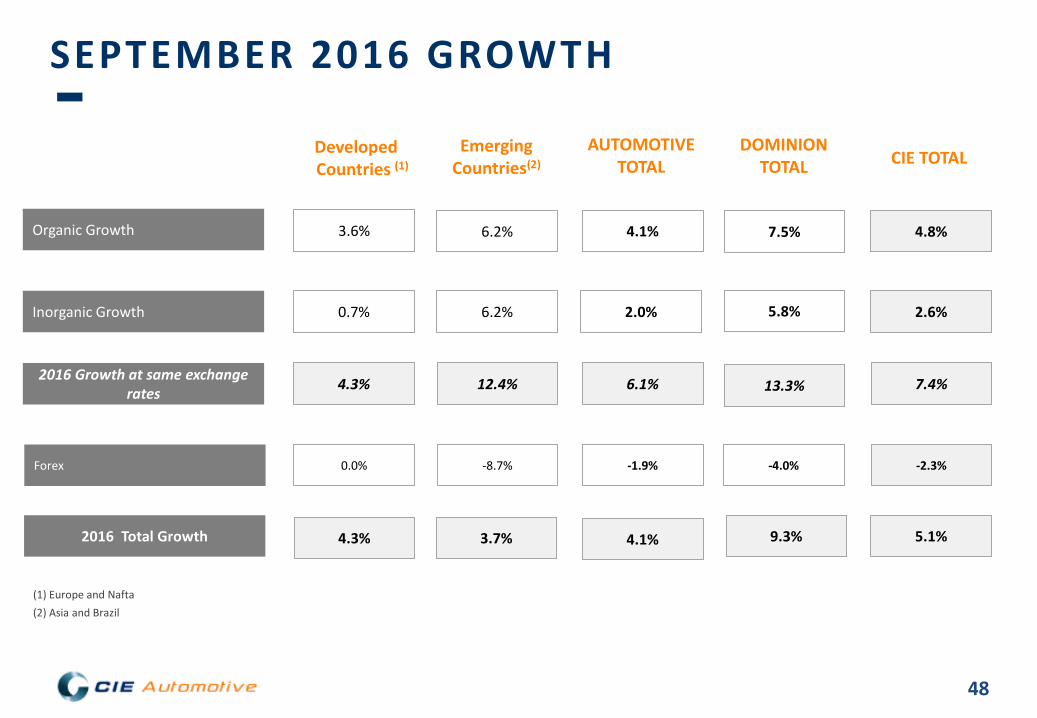
SEPTEMBER 2016 GROWTH
Inorganic Growth 0.7%
Organic Growth 3.6%
Forex 0.0%
Developed Countries (1)
6.2%
6.2%
-8.7%
Emerging Countries(2)
2.0%
4.1%
-1.9%
AUTOMOTIVE TOTAL
2016 Total Growth 4.3% 3.7% 4.1%
(1) Europe and Nafta (2) Asia and Brazil
5.8%
7.5%
-4.0%
DOMINION TOTAL
2.6%
4.8%
-2.3%
CIE TOTAL
9.3% 5.1%
2016 Growth at same exchange rates 4.3% 12.4% 6.1% 13.3% 7.4%
49
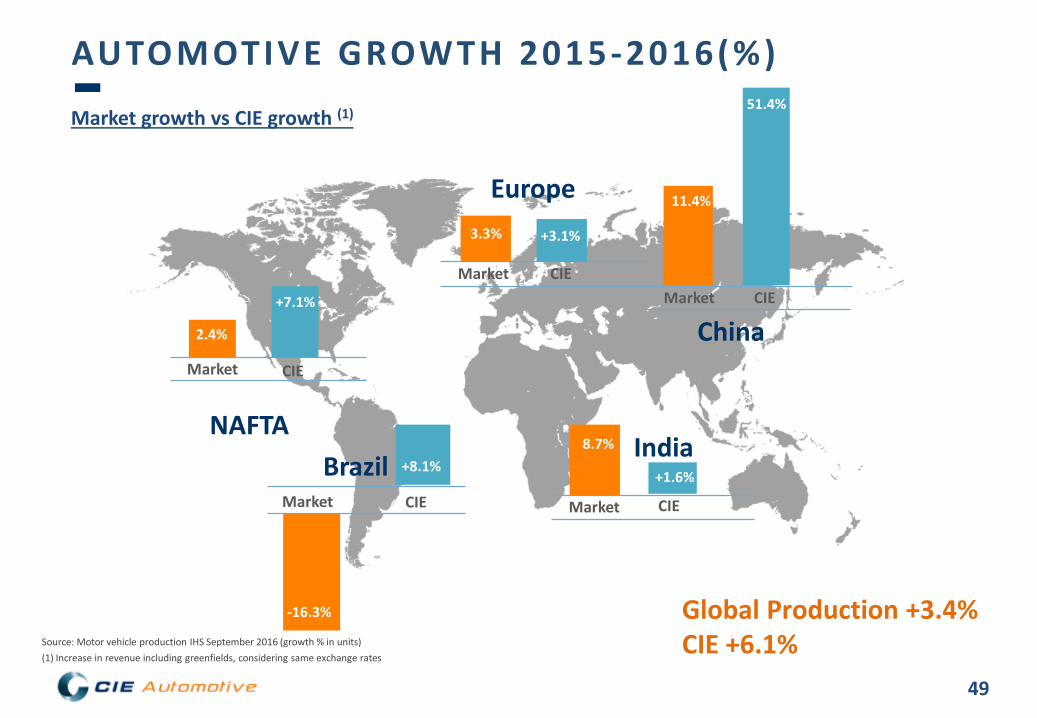
Market growth vs CIE growth (1)
NAFTA
2.4%
Market CIE
Brazil Market CIE
China Market CIE
Global Production +3.4% CIE +6.1%
-16.3%
Source: Motor vehicle production IHS September 2016 (growth % in units) (1) Increase in revenue including greenfields, considering same exchange rates
51.4%
AUTOMOTIVE GROWTH 2015-2016(%)
+7.1%
+8.1%
Europe 3.3%
Market CIE
+3.1%
India
Market CIE
+1.6%
8.7%
11.4%

50
51
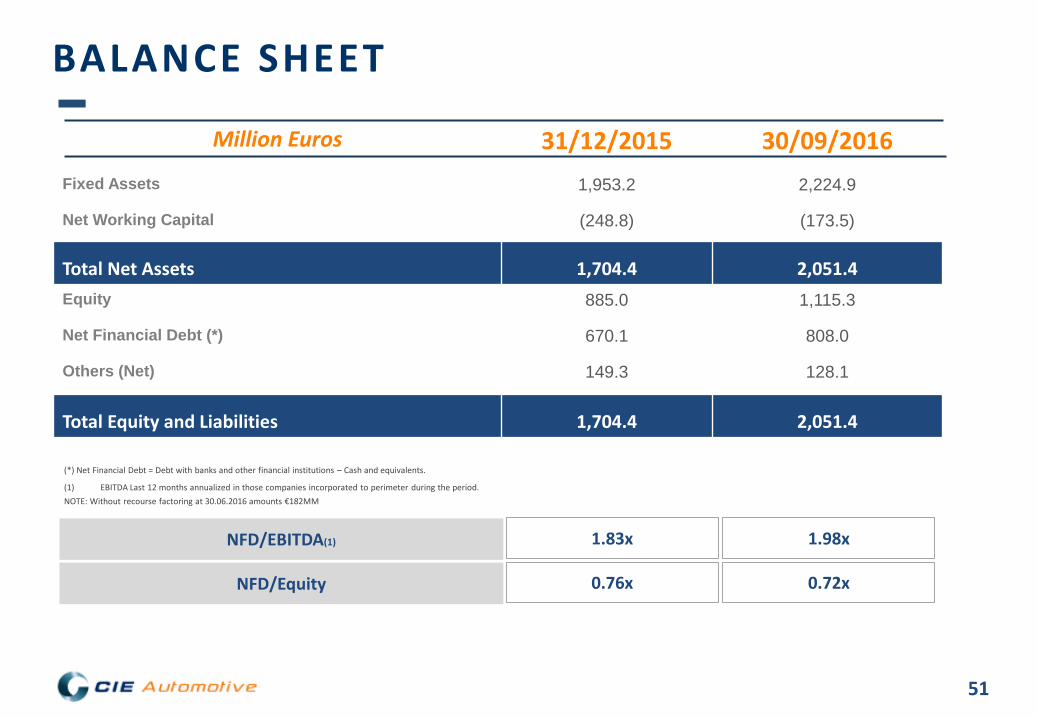
Million Euros 31/12/2015 30/09/2016 Fixed Assets 1,953.2 2,224.9
Net Working Capital (248.8) (173.5)
Total Net Assets 1,704.4 2,051.4 Equity 885.0 1,115.3
Net Financial Debt (*) 670.1 808.0
Others (Net) 149.3 128.1
Total Equity and Liabilities 1,704.4 2,051.4
BALANCE SHEET
(*) Net Financial Debt = Debt with banks and other financial institutions – Cash and equivalents.
(1) EBITDA Last 12 months annualized in those companies incorporated to perimeter during the period. NOTE: Without recourse factoring at 30.06.2016 amounts €182MM
NFD/EBITDA(1) 1.83x 1.98x
NFD/Equity 0.76x 0.72x

52
CAPEX DISCIPLINE
Maintenance investment accounts 80% of total depreciation of the Group
On the way of achieving the goal of reducing depreciation level from 5% to 4%
RONA
Continuous improvement towards the challenge of reaching 20% RONA
Investment analysis discipline, always requiring high returns
Capex ≥ 20% ROI. Net Working Capital ≈0 M&A: EV/EBITDA ≤3 in 3 years
EBITDA CONVERSION
INTO CASH
Operating Cash Flow reaching 50% of EBITDA, enabling the Group to ensure investment commitments
≈50% conversion level target EBITDA into Cash
INVESTMENT DISCIPL INE AND RETURN EXIGENCE
≈4% recurrent investment level that allows an organic growth of 2-3%

53
Strategic Commitments: What is next?
6.0

54
STRATEGIC TARGETS - ORGANIC
(1) EBIT: Net Operating Income.
(2) RONA = “Return on Net Assets”: EBIT/ Net Assets (Fixed Assets + Net Working Capital – Goodwill not associated to cash outs)
(3) Net Financial Debt= Debt with banks and other financial institutions – Cash and equivalents

55
Doubling Net Profit

56
STRATEGIC TARGETS - INORGANIC
Integrate strategical companies to consol idate CIE as one of the most important players in the world; with a very balanced account, achieving at the end of period, a NFD<2xEBITDA ratio

57
New market opportunities
STRATEGIC TARGETS - INORGANIC
700 Mio€ Automotive
addit ional sales
Aluminium

58
New market opportunities
STRATEGIC TARGETS - INORGANIC
300 Mio€ Dominion
addit ional sales
T&T
Renewable Energy Industry
59
CIE in Stock Exchange
7.0
60
CIE
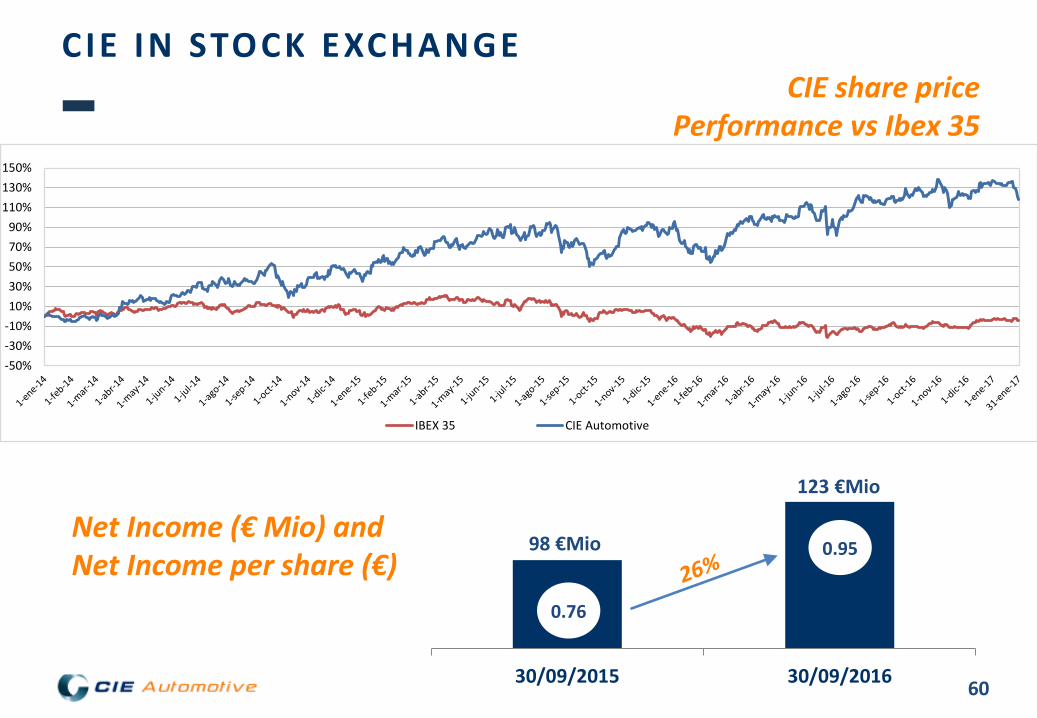
CIE IN STOCK EXCHANGE
Net Income (€ Mio) and Net Income per share (€)
CIE share price Performance vs Ibex 35
98 €Mio
123 €Mio
30/09/2015 30/09/2016
0.76
0.95
-50%-30%-10%10%30%50%70%90%
110%130%150%
IBEX 35 CIE Automotive
61
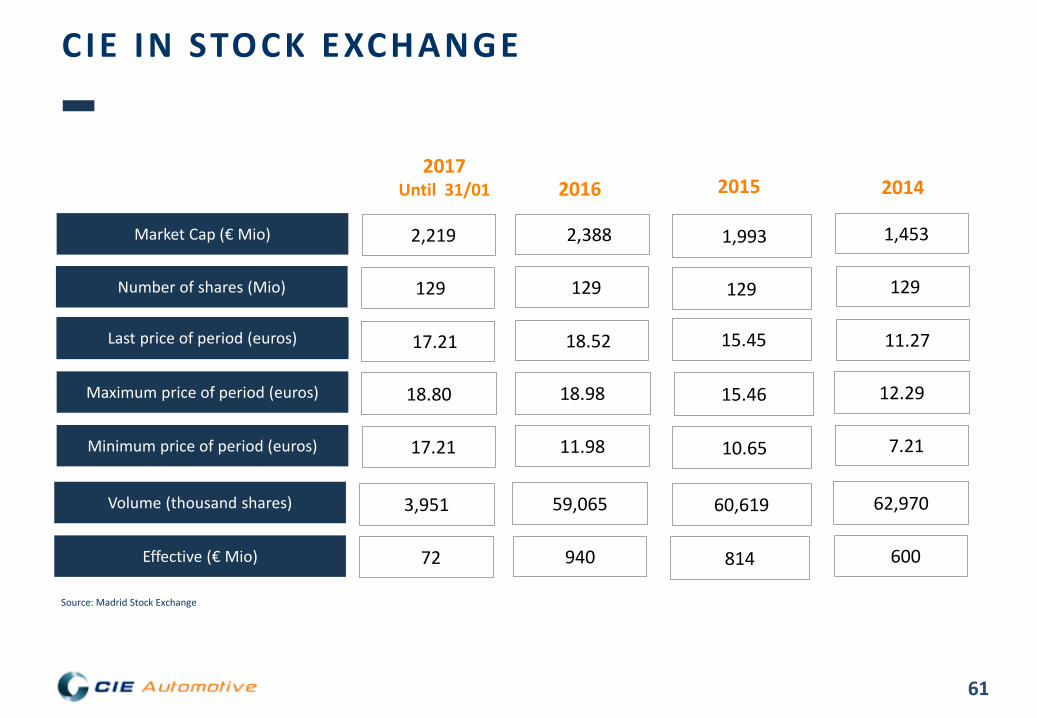
Market Cap (€ Mio)
2016
% EBITDA s/ cifra negocio ajustada
Maximum price of period (euros)
2,388 1,993
15.46
Minimum price of period (euros) 11.98 10.65
Last price of period (euros) 18.52
Number of shares (Mio) 129 129
18.98
1,453
7.21
11.27
129
12.29
Volume (thousand shares) 60,619
Effective (€ Mio) 940 814
59,065
600
62,970
2015 2014
Source: Madrid Stock Exchange
CIE IN STOCK EXCHANGE
15.45
2,219
17.21
17.21
129
18.80
72
3,951
2017 Until 31/01

62
Market Cap (€ Mio)
2016
% EBITDA s/ cifra negocio ajustada
Maximum price of period (euros)
2,388 1,993
15.46
Minimum price of period (euros) 11.98 10.65
Last price of period (euros) 18.52
Number of shares (Mio) 129 129
18.98
1,453
7.21
11.27
129
12.29
Volume (thousand shares) 60,619
Effective (€ Mio) 940 814
59,065
600
62,970
2015 2014
Source: Madrid Stock Exchange
CIE IN STOCK EXCHANGE
15.45
2,219
17.21
17.21
129
18.80
72
3,951
2017 Until 31/01
63
Thank you