features of excel pivottables generated by the …...2003/06/26 · features of excel pivottables...
TRANSCRIPT

Features of Excel PivotTables Generated by the QVR SystemFeatures of Excel PivotTables Generated by the QVR System
The QVR System produces severalstandard reports in
Excel PivotTable® Format
The QVR System produces severalstandard reports in
Excel PivotTable® Format
This tutorial describes:The relationship between some of the “Public Saved
Queries” and specific Standard Report outputs
Highlights the capabilities of the Excel PivotTablesthat are generated by the QVR System
This tutorial describes:The relationship between some of the “Public Saved
Queries” and specific Standard Report outputs
Highlights the capabilities of the Excel PivotTablesthat are generated by the QVR System
June 26, 2003June 26, 2003

Relationship Between Public Queries and Standard Reports
Relationship Between Public Queries and Standard Reports
There are four Standard Reports for which specific “Public Queries” have been prepared for your
convenience.
These Public Queries have pre-selected the search criteria that would logically match the corresponding
Standard Report.
The following image shows the linkage between these Public Queries and Standard Reports.
However, it is not required that you use these Public Queries to run the Standard Reports.

Relationship between“Public Queries—Budget”
andBudget Standard Reports
Relationship between“Public Queries—Budget”
andBudget Standard Reports

Highlights of the Capabilities of the Excel PivotTable Feature of the
QVR System
Highlights of the Capabilities of the Excel PivotTable Feature of the
QVR System

What is a PivotTable?What is a PivotTable?
A PivotTable is a summary of data that is contained in a database—in this case—data downloaded from IMPAC
and the Data Warehouse using the QVR system.
The name PivotTable is derived from the feature that data can be analyzed on different dimensions—thus
pivoted on different fields.
The PivotTable feature is dynamic in that the raw data can be manipulated and the data is re-summarized in the
PivotTable.

What Does the Standard Report—PivotTable Contain in QVR?
What Does the Standard Report—PivotTable Contain in QVR?
The Standard Report in QVR usually contains three pages or tabs (lower-left corner of the screen).
Report Criteria: This tab contains the search criteria used to generate the report as well as other pertinent information.Raw Data: This tab has all of the raw data that goes into the final PivotTable.Final: This tab is the PivotTable summary of all the data in the Standard Report.Navigating these tabs will be demonstrated in the example to follow.

Example SearchExample Search
IC = NIEHSExclude Reimbursable CANs
Use Frozen Pub2002 Data

Standard Report Selection ScreenStandard Report Selection Screen
(1)Select
IMPORTANT
(2)Select

Excel Report—CriteriaExcel Report—Criteria
Select
Note Suggestion
Report Criteria

Excel PivotTable—Raw DataExcel PivotTable—Raw Data
Select

Excel PivotTable—Raw DataExcel PivotTable—Raw Data
User can select any individual item in the
drop-down menuSelect
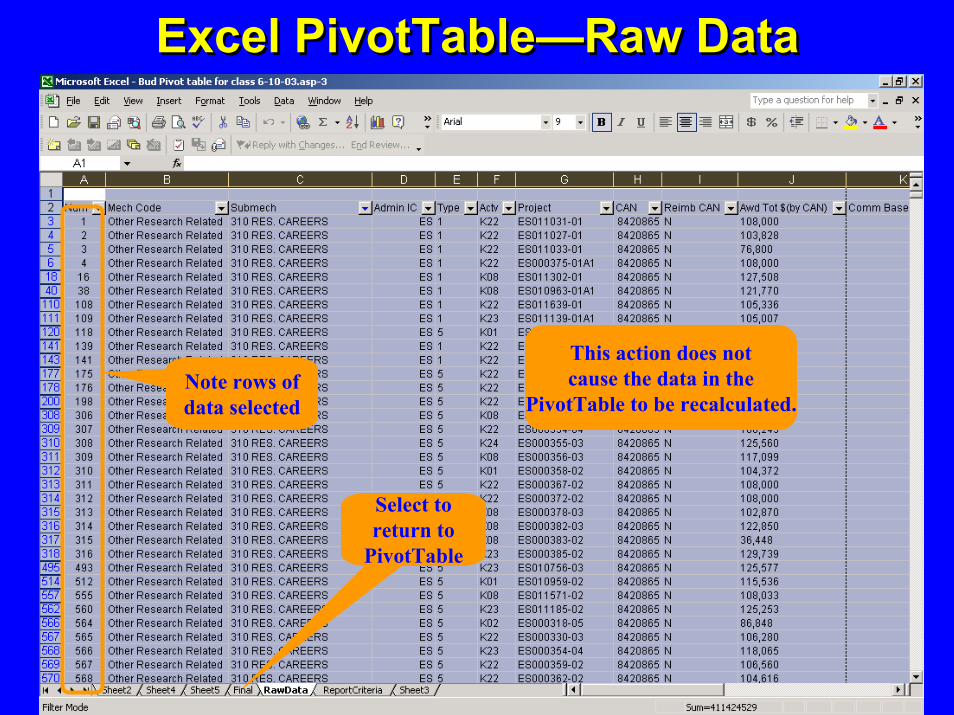
Excel PivotTable—Raw DataExcel PivotTable—Raw Data
Note rows of data selected
Select to return to
PivotTable
This action does notcause the data in the
PivotTable to be recalculated.

Excel PivotTableExcel PivotTable
To view a listing of all the data columns in the raw data
Select “View”—”Tool Bar”—PivotTable”— ”Field List”
Tool Bar

Excel PivotTable—Drill DownExcel PivotTable—Drill Down
Double-click data field to view Sheet of
data for that field

Excel PivotTable—Drill DownExcel PivotTable—Drill Down
Select to return to PivotTable
NOTEA new Sheet is createdeach time you double-
clickon a data field to view
the data making upthat item in the
PivotTable
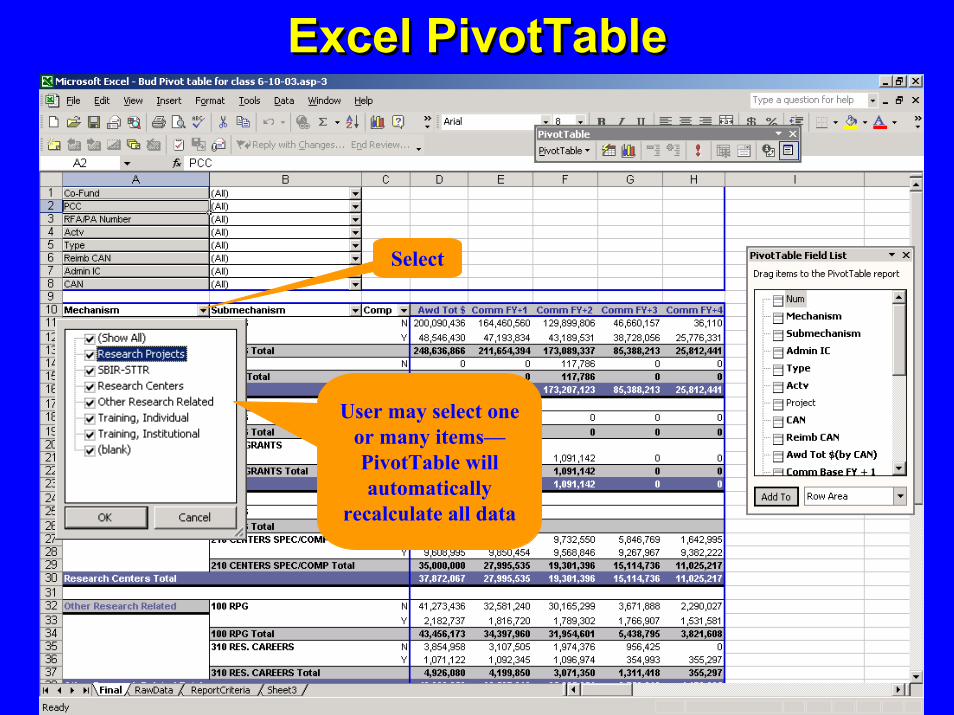
Excel PivotTableExcel PivotTable
Select
User may select one or many items—PivotTable will automatically
recalculate all data

Excel PivotTableExcel PivotTable
(2)Select
(1)Click cursor in boxes
to select/deselect items

Excel PivotTableExcel PivotTable
(2)Select
PivotTable is recalculated showing
only the items selected

Excel PivotTableExcel PivotTable
(1)Select “Show All to
return to the original PivotTable
(2)Select

Excel PivotTableExcel PivotTable
Select

Excel PivotTableExcel PivotTable
(1)Select
(2)Select

Excel PivotTableExcel PivotTable
Data automatically recalculated on the
basis of the criterion selected

Adding Field to Excel PivotTableAdding Field to Excel PivotTable
QVR users can add various levels of detail to the Standard Report PivotTable.
This section shows the process step-by-step.
In the PivotTable to follow (Budget—Total Award Frozen Data) only a few items are included in the
Standard Report PivotTable; however, the raw data contains may additional data items. In this example, a
user wants to include CAN in the Standard Report PivotTable.

Adding Field to Excel PivotTableAdding Field to Excel PivotTable
Click and drag any item into the PivotTable

Adding Item to Excel PivotTableAdding Item to Excel PivotTable
Note Column added to PivotTable and data is
automatically recalculated

Adding Sub-Field to Excel PivotTableAdding Sub-Field to Excel PivotTable
QVR users can modify the PivotTable to analyze data on a sub-field.
This section shows the process step by step.
In the PivotTable (Budget—Total Award Frozen Data) the user wants to analyze the data on the AIDS
category. The AIDS data is downloaded as part of the raw data but it is not one of the data items in the final
PivotTable.

Adding Sub-Field to Excel PivotTableAdding Sub-Field to Excel PivotTable
Click and drag any item into the Sub-Field
list

Adding Sub-Field to Excel PivotTableAdding Sub-Field to Excel PivotTable
Click to analyze on Sub-field

Adding Sub-Field to Excel PivotTableAdding Sub-Field to Excel PivotTable
(1)Select “Y” to analyze on projects that are
AIDS related
(2)Select

Adding Sub-Field to Excel PivotTableAdding Sub-Field to Excel PivotTable

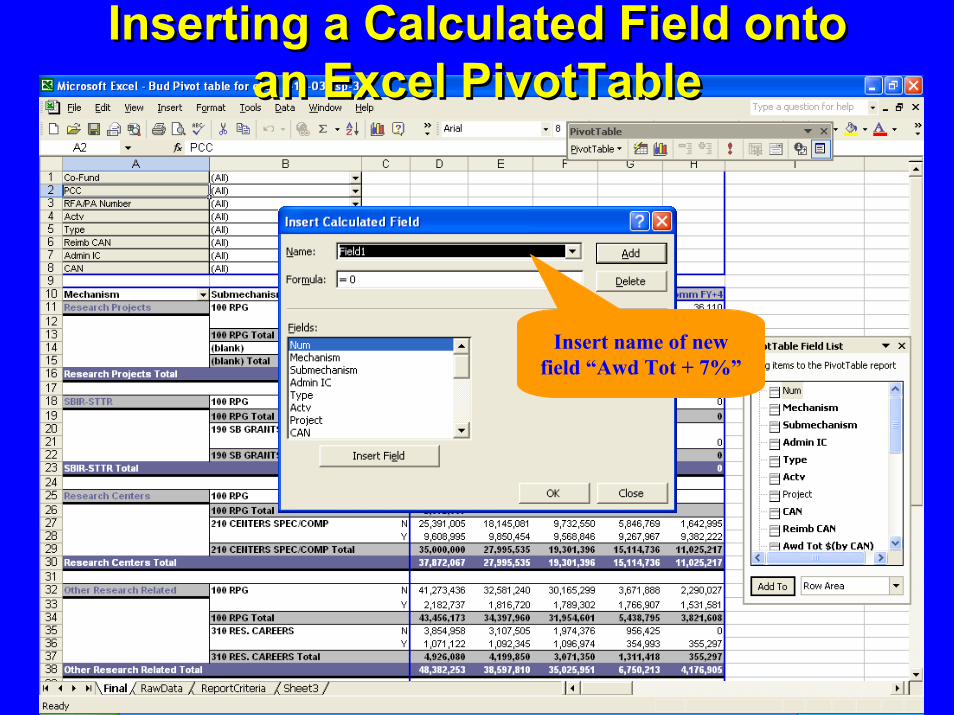
Inserting a Calculated Field onto an Excel PivotTable
Inserting a Calculated Field onto an Excel PivotTable
QVR users may want to insert calculated fields in the Standard Report PivotTables.
This section shows the process step by step.
In the following example, the user wants to make an estimate of what the total awarded funds would be for
each budget category if that column of data is incremented upwards by 7 percent.

Inserting a Calculated Field onto an Excel PivotTable
Inserting a Calculated Field onto an Excel PivotTable
To do this, you must first make sure thatMacros are disabled.
Note: When you generate a Standard Report in QVR, it is necessary to “Enable Macros” to achieve the proper formatting of the report. However, once the file is saved on your hard drive, the macros are no longer necessary.
1) Open the Budget PivotTable file used in the previous example.
2) A dialog box appears. Select Disable Macros.

Inserting a Calculated Field onto an Excel PivotTable
Inserting a Calculated Field onto an Excel PivotTable
Select

Inserting a Calculated Field onto an Excel PivotTable
Inserting a Calculated Field onto an Excel PivotTable
Increase this column by 7
percent

Inserting a Calculated Field onto an Excel PivotTable
Inserting a Calculated Field onto an Excel PivotTable
Click on any data field

Inserting a Calculated Field onto an Excel PivotTable
Inserting a Calculated Field onto an Excel PivotTable
Select “Insert”Select “Calculated
Field” from the dropdown menu
Inserting a Calculated Field onto an Excel PivotTable
Inserting a Calculated Field onto an Excel PivotTable
Insert name of new field “Awd Tot + 7%”

Inserting a Calculated Field onto an Excel PivotTable
Inserting a Calculated Field onto an Excel PivotTable
Scroll down to Award Total.

Inserting a Calculated Field onto an Excel PivotTable
Inserting a Calculated Field onto an Excel PivotTable
Select

Inserting a Calculated Field onto an Excel PivotTable
Inserting a Calculated Field onto an Excel PivotTable
Insert *1.07(Asterisk is the
symbol for multiply)

Inserting a Calculated Field onto an Excel PivotTable
Inserting a Calculated Field onto an Excel PivotTable
Select

Inserting a Calculated Field onto an Excel PivotTable
Inserting a Calculated Field onto an Excel PivotTable
The new column of data is calculated

Creating PivotTable on Different SheetsCreating PivotTable on Different Sheets
QVR users can create additional PivotTables on different sheets using the Standard Report PivotTables.
This section shows the process step by step.
In the following example, the user wants to make separate PivotTables for each PCC.

Creating PivotTable on Different SheetsCreating PivotTable on Different Sheets
1) Select “PivotTable”2) Select “Show Pages”

Creating PivotTable on Different SheetsCreating PivotTable on Different Sheets
2) Select
1) Select

Creating PivotTable on Different SheetsCreating PivotTable on Different Sheets
PivotTables are created
for each PCC

Adding a “Count” FieldAdding a “Count” Field
QVR users may add columns of data to a Standard Report Pivot Tables.
This section shows the process step by step.
In the following example, the user wants to add a column to the PivotTable that “counts” the number of
records in a particular column of data.

Adding a “Count” FieldAdding a “Count” Field
1) Select “Data”2) Select “PivotTable and Pivot
Chart Report”

Adding a “Count” FieldAdding a “Count” Field
Select

Adding a “Count” FieldAdding a “Count” Field
Select item and drag it into the list of columns

Adding a “Count” FieldAdding a “Count” Field
Select

Adding a “Count” FieldAdding a “Count” Field
Select

Adding a “Count” FieldAdding a “Count” Field
New Column added “Count of Projects”

Modifying DataModifying Data
QVR users may want to add, delete or change a record in the raw data and have that recalculated in the
Standard Report PivotTables.This section shows the process step by step.
In the following example, the user deletes two records from the Standard Report PivotTable.

Modifying DataModifying Data
Select

Modifying DataModifying Data
Delete thesetwo records

Modifying DataModifying Data
1) Click left box to select record
2) Hold down Control key and click second record
Note:The Shift key may be usedto select a range of records

Modifying DataModifying Data
1) Click “Edit”2) Click “delete”

Modifying DataModifying Data
Select

Modifying DataModifying Data
1) Select “Data”2) Select “Refresh Data”

Modifying DataModifying Data
Data is recalculated with the two projects deleted.
Grand Total is also recalculated.

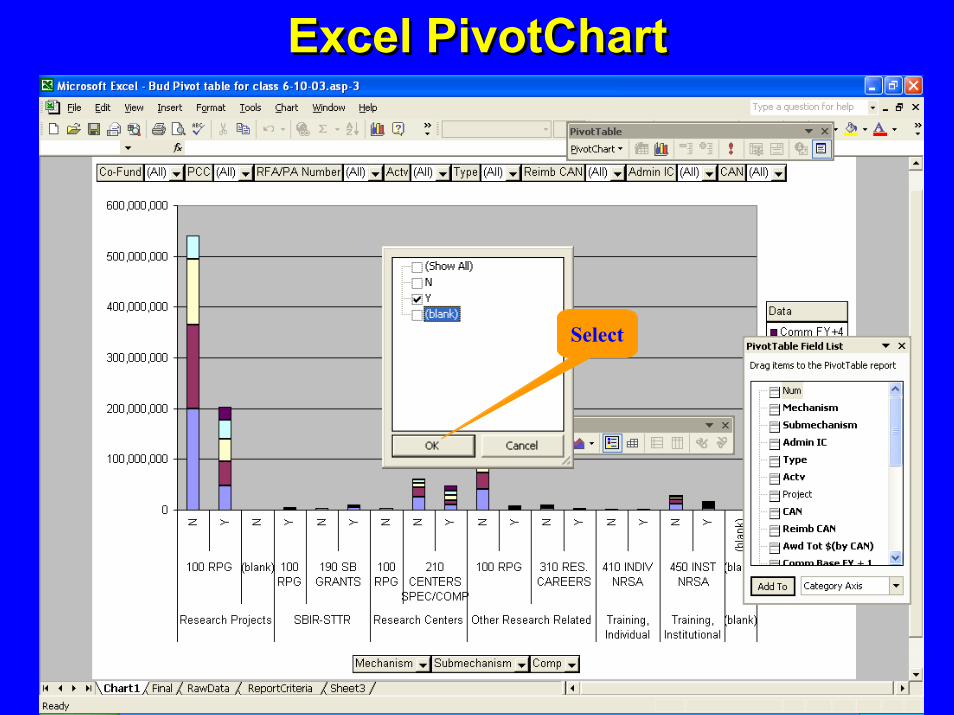
Creating Excel PivotChartCreating Excel PivotChart
QVR users can display data from a Standard Report PivotTable as a PivotChart.
This section shows the process step by step.
PivotCharts have many of the same data manipulation features found in PivotTables.
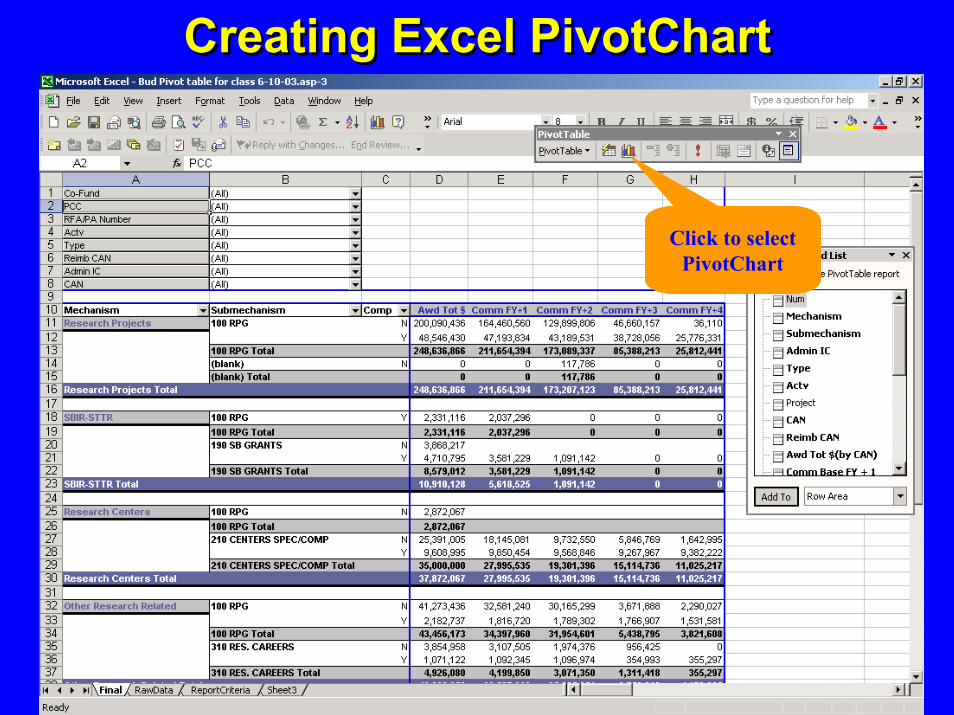
Creating Excel PivotChartCreating Excel PivotChart
Click to select PivotChart

Excel PivotChartExcel PivotChart
Select

Excel PivotChartExcel PivotChart
Un-check to show only “Non-
competing” projects
Excel PivotChartExcel PivotChart
Select

Excel PivotChartExcel PivotChart
PivotChart has similar features as PivotTable

Handy ReferencesHandy References
Microsoft Excel 2000 BibleJohn Walkenbach and Will Kelly
Wiley Publishing, Inc., 1999
Using Microsoft Excel 2000 Special EditionPatrick Blattner, Laurie Ulrich,Ken Cook and Timothy Dyck
Que Corp., 1999