feasibility study of real time parking information at metrorail
TRANSCRIPT

WASHINGTON METROPOLITAN AREA TRANSIT AUTHORITY600 FIFTH STREET, N. W. WASHINGTON, D.C. 20001
DRAFTJune 1, 2007
METRORAIL REVENUE VEHICLEFLEET MANAGEMENT PLAN
NOVEMBER 2006Revised May 2007
This Metrorail Revenue Vehicle Fleet Management Plan was developed by:
Office of Operations Planning and Administrative SupportWashington Metropolitan Area Transit Authority600 Fifth Street, N.W. Washington, D.C. 20001
Contributors
The following WMATA organizations contributed data and informationto this Fleet Management Plan:
Department of Metrorail Services:
Department of Planningand Joint Development:
METRORAIL REVENUE VEHICLE FLEET MANAGEMENT PLAN NOVEMBER 2006
Table of Contents Page i
CONTENTS
PAGE
SECTION ONE: INTRODUCTION . . . . . . . . . . . . . . . . . . . . . . . . . . . . . . . . . . . . . . . . . . 1Current Rail Car Fleet and Operating Practices . . . . . . . . . . . . . . . . . . . . . . . . . 4Organization of this Document . . . . . . . . . . . . . . . . . . . . . . . . . . . . . . . . . . . . . . 5
SECTION TWO: THE DEMAND FOR REVENUE VEHICLES . . . . . . . . . . . . . . . . . . . . . . . 7Quality of Service . . . . . . . . . . . . . . . . . . . . . . . . . . . . . . . . . . . . . . . . . . . . . . . . 7
SECTION 2A: ESTIMATION OF PASSENGER DEMAND
AND THE RESULTING PEAK VEHICLE REQUIREMENT . . . . . . . . . . . . . . . . . . . . . . . . . 8The Metrorail Service Planning Model . . . . . . . . . . . . . . . . . . . . . . . . . . . . . . . . 8Seasonal Variations in Passenger Demand . . . . . . . . . . . . . . . . . . . . . . . . . . . 11Peak Vehicle Requirement . . . . . . . . . . . . . . . . . . . . . . . . . . . . . . . . . . . . . . . . 11
Passenger Load Standards . . . . . . . . . . . . . . . . . . . . . . . . . . . . . . . . . . . . . . . 11The Importance of Passenger Load Standards . . . . . . . . . . . . . . . . . . . 11Current Metrorail Passenger Load Standards . . . . . . . . . . . . . . . . . . . . 12Load Standard Objectives . . . . . . . . . . . . . . . . . . . . . . . . . . . . . . . . . . . 12
Future Passenger Demand and Factors Influencing Peak Period Ridership . . 13General Ridership Growth . . . . . . . . . . . . . . . . . . . . . . . . . . . . . . . . . . . 13Events and Influencing Factors Accounted forin this Fleet Management Plan . . . . . . . . . . . . . . . . . . . . . . . . . . . . . . . 13
Future System Development: . . . . . . . . . . . . . . . . . . . . . . . . . . . . . . . . . . . . . . 13Dulles Corridor Extension . . . . . . . . . . . . . . . . . . . . . . . . . . . . . . . . . . . 13Other Service Solutions . . . . . . . . . . . . . . . . . . . . . . . . . . . . . . . . . . . . . 13
The Need for Gap Trains . . . . . . . . . . . . . . . . . . . . . . . . . . . . . . . . . . . . . . . . . 16
Scheduling and Operating Strategies Used to Reduce the In-Service Car Requirement . . . . . . . . . . . . . . . . . . . . . . . . 18

METRORAIL REVENUE VEHICLE FLEET MANAGEMENT PLAN NOVEMBER 2006
Page ii Table of Contents
Short Lining . . . . . . . . . . . . . . . . . . . . . . . . . . . . . . . . . . . . . . . . . . . . . 18Tripper Trains . . . . . . . . . . . . . . . . . . . . . . . . . . . . . . . . . . . . . . . . . . . . 20Drop Back Operators . . . . . . . . . . . . . . . . . . . . . . . . . . . . . . . . . . . . . . . 20Road Mechanics . . . . . . . . . . . . . . . . . . . . . . . . . . . . . . . . . . . . . . . . . . 20
Summary of Operating Peak Vehicle Requirements . . . . . . . . . . . . . . . . . . . . 20
SECTION 2B: ESTIMATION OF FLEET DEMAND
RESULTING FROM CAR MAINTENANCE REQUIREMENTS . . . . . . . . . . . . . . . . . . . . . . . 21
Scheduled Preventive Maintenance . . . . . . . . . . . . . . . . . . . . . . . . . . . . . . . . . 22
Train Failure Definitions and Actions . . . . . . . . . . . . . . . . . . . . . . . . . . . . . . . . 24Safety-Related Failures . . . . . . . . . . . . . . . . . . . . . . . . . . . . . . . . . . . . . 24Other Types of Failures . . . . . . . . . . . . . . . . . . . . . . . . . . . . . . . . . . . . . 24
Car Rehabilitation . . . . . . . . . . . . . . . . . . . . . . . . . . . . . . . . . . . . . . . . . . . . . 25Rail Cars Out of Service: The Operating Spare Ratio . . . . . . . . . . . . . . . . . . . 26The Disposition of Cars That Have Failed While in Passenger Service . . . . . . 27Environmental Conditions Affecting the Operating Spare Ratio . . . . . . . . . . . . 27
The Effect of Maintenance Policy on the Spare Ratio: A Summary of Maintenance Requirements . . . . . . . . . . . . . . . . . . . . . . . . . 28
Past Experience . . . . . . . . . . . . . . . . . . . . . . . . . . . . . . . . . . . . . . . . . . 28Current Spares Requirements . . . . . . . . . . . . . . . . . . . . . . . . . . . . . . . . 28
Rail Car Repair Shop Facilities . . . . . . . . . . . . . . . . . . . . . . . . . . . . . . . . . . . . 29Future Considerations of Repair Shop and Storage Facilities . . . . . . . . . . . . . 31
Maintenance Space . . . . . . . . . . . . . . . . . . . . . . . . . . . . . . . . . . . . . . . . 31Car Storage . . . . . . . . . . . . . . . . . . . . . . . . . . . . . . . . . . . . . . . . . . . . . . 33
SECTION THREE: THE SUPPLY OF REVENUE VEHICLES . . . . . . . . . . . . . . . . . . . . . . . 35
The Existing Metrorail Transit Car Fleet . . . . . . . . . . . . . . . . . . . . . . . . . . . . . . 35Ten-Year Capital Improvement Program . . . . . . . . . . . . . . . . . . . . . . . . . . . . . 35Planned Rail Car Procurement . . . . . . . . . . . . . . . . . . . . . . . . . . . . . . . . . . . . 36Adjustments to Vehicle Supply . . . . . . . . . . . . . . . . . . . . . . . . . . . . . . . . . . . . . 38
Accident-Damaged Vehicles . . . . . . . . . . . . . . . . . . . . . . . . . . . . . . . . . 38Revenue Collection Vehicles . . . . . . . . . . . . . . . . . . . . . . . . . . . . . . . . . 38
Fleet Spare Ratio . . . . . . . . . . . . . . . . . . . . . . . . . . . . . . . . . . . . . . . . . . . . . 38

METRORAIL REVENUE VEHICLE FLEET MANAGEMENT PLAN NOVEMBER 2006
Table of Contents Page iii
SECTION FOUR: REVENUE VEHICLE DEMAND / SUPPLY BALANCE . . . . . . . . . . . . . . 41
APPENDIX A: DULLES FEIS - LOAD ANALYSIS . . . . . . . . . . . . . . . . . . . . . . . . . . . . . . . 45
APPENDIX B: GAP TRAINS . . . . . . . . . . . . . . . . . . . . . . . . . . . . . . . . . . . . . . . . . . . . . . 57
APPENDIX C: PREVENTATIVE MAINTENANCE . . . . . . . . . . . . . . . . . . . . . . . . . . . . . 59
METRORAIL REVENUE VEHICLE FLEET MANAGEMENT PLAN NOVEMBER 2006
Page iv Table of Contents
LIST OF FIGURES
Figure 1-1: Metrorail System (map) . . . . . . . . . . . . . . . . . . . . . . . . . . . . . . . . . . . . . . . 2Figure 1-2: Metrorail Storage and Inspection Yard Locations (map) . . . . . . . . . . . . . . 3Figure 2-1: Maximum Load Point Ridership (graph) . . . . . . . . . . . . . . . . . . . . . . . . . . 10Figure 2-2: Passenger Demand for Revenue Vehicles (table) . . . . . . . . . . . . . . . . . . 15Figure 2-3: A-02 / C-02 and B-06 / E-06 Interlocking (diagrams) . . . . . . . . . . . . . . . . 17Figure 2-4: Metrorail Mid-Line Pocket Track Locations (map) . . . . . . . . . . . . . . . . . . 19Figure 2-5: Maintenance Demand for Revenue Vehicles (table) . . . . . . . . . . . . . . . . 23Figure 2-6 Calculation of the Operating Spare Ratio . . . . . . . . . . . . . . . . . . . . . . . . . 26Figure 2-7: Rail Car Repair Shop Facilities (table) . . . . . . . . . . . . . . . . . . . . . . . . . . . 29Figure 2-8: Metrorail Shop Locations (map) . . . . . . . . . . . . . . . . . . . . . . . . . . . . . . . . 30Figure 2-9: Summary of Rail Car Shop Space Requirements . . . . . . . . . . . . . . . . . . 32Figure 2-10: Rail Car Fleet Storage Capacity . . . . . . . . . . . . . . . . . . . . . . . . . . . . . . . 33Figure 3-1: Current Transit Car Fleet (table) . . . . . . . . . . . . . . . . . . . . . . . . . . . . . . . . 35Figure 3-2: 6000-Series Rail Car Procurement Schedule (table) . . . . . . . . . . . . . . . . 36Figure 3-3: Supply of Revenue Vehicles (table) . . . . . . . . . . . . . . . . . . . . . . . . . . . . . 37Figure 3-4: Calculation of the Fleet Spare Ratio . . . . . . . . . . . . . . . . . . . . . . . . . . . . . 39Figure 4-1: Vehicle Demand / Supply Balance (table) . . . . . . . . . . . . . . . . . . . . . . . . 43Figure C-1: Rail Car Preventative Maintenance Schedule . . . . . . . . . . . . . . . . . . . . . 59Figure C-2: Sub-system Delays (Greater than 3 minutes) . . . . . . . . . . . . . . . . . . . . . 63

Section One: Introduction Page 1
SECTION ONE
INTRODUCTION
WASHINGTON METROPOLITANAREA TRANSIT AUTHORITY
METRORAILREVENUE VEHICLEFLEET MANAGEMENTPLANNOVEMBER 2006
This document is a statement of the processes and practices bywhich WMATA establishes its current and projected Metrorailrevenue vehicle fleet size requirements and operating spare ratio. Itincludes a description of revenue service planned to accommodateMetrorail system extensions and growth in rail ridership, as well as anassessment and projection of needs for rail vehicle maintenance.This plan is a living document which is based on current realities andassumptions, and is therefore subject to future revision. The intent isto update the plan on a regular basis and to have the plan becomean input into the Authority’s capital and operating budget preparation.
The WMATA Metrorail system currently operates 106 miles of speed heavy rail rapid transit service, including 86 passenger stations, themajority of which include multi-modal transfer facilities. The system,as shown in Figure 1-1, includes five separate lines, Red, Blue,Orange, Yellow, and Green, which are in service for 18½ hoursMonday through Thursday, 21½ hours on Friday, 20 hours onSaturday, and 17 hours on Sunday. There are eight storage andinspection (S&I) yards and two heavy repair shops in service. Tripletail tracks outbound of the Largo station serves as an overnight carstorage location for a substantial number of cars. S&I yard locationsare depicted in Figure 1-2.

METRORAIL REVENUE VEHICLE FLEET MANAGEMENT PLAN NOVEMBER 2006
Page 2 Section One: Introduction
FIGURE 1-1 Metrorail System Map

METRORAIL REVENUE VEHICLE FLEET MANAGEMENT PLAN NOVEMBER 2006
Section One: Introduction Page 3
FIGURE 1-2

METRORAIL REVENUE VEHICLE FLEET MANAGEMENT PLAN NOVEMBER 2006
Page 4 Section One: Introduction
The system carried more than 932,000 unlinked passenger trips onan average weekday in FY 2006, and recorded 275 million unlinkedpassenger trips and nearly 1.6 billion passenger miles for the entirefiscal year.
Passenger fares consistently pay over 65 percent of Metrorail'sannual operating cost. In terms of route mileage, number of stations,and ridership, Metrorail ranks as the second largest heavy rail rapidtransit system in the United States. Operations are supported bystate-of-the-art automatic train control, automatic fare collection, andcommunications systems.
CURRENTRAIL CAR FLEETAND OPERATING
PRACTICES
The Authority’s rail revenue car fleet, as of July 1, 2006, consisted of948 vehicles, of which 292 (1000-series) were manufactured by RohrIndustries, 464 (2000, 3000, and 4000-series) were manufactured byBreda Construzioni Ferroviarie, 192 cars (5000 series) weremanufactured by Construcciones y Auxiliar de Ferrocarriles, S.A.(CAF) . Thirty eight of the Breda 2000 and 3000 series cars areundergoing mid-life renovation and are not available for service.
In addition to this fleet, the Authority is currently receiving 62 cars ofthe base buy (6000 series) with 122 option cars from Alstom tofollow. Fifty of the cars are scheduled to be in service delivery byDecember 2006 with the remainder is to be in service byDecember 2008. All Metrorail revenue cars operate in married pairs with an operatingcab at each end. Each pair of cars is fully automated, and has ahydraulic friction brake system, a static converter low voltage system,automatic HVAC control, electronic flip-dot or LED destination signs,and automatic couplers. As a result of these design features, the carsmust operate in married pairs; no car can be operated as a singleunit. Primary propulsion power is supplied by a 750 volt DC third railsystem.
Scheduled train consists can vary from four to eight cars dependingon the day of the week and the time of day. All Metrorail cars are 75feet long, and all Metrorail passenger station platforms measure 600feet in length. A station, therefore, can accommodate a maximum ofeight-car trains.
Rohr cars have 80 passenger seats and both Breda and CAF carshave 68 seats. The Alstom, 6000-series have 64 seats in the A-carand 66 seats in the B-car.

METRORAIL REVENUE VEHICLE FLEET MANAGEMENT PLAN NOVEMBER 2006
Section One: Introduction Page 5
ORGANIZATION OFTHIS DOCUMENT
Demand Analysis: In Section Two of this document the demand forrevenue vehicles is summarized. Demand is analyzed in twocomponents:
Passenger Demand, in which the process for developing peakvehicle requirements (PVR) is reviewed, including forecast peakperiod ridership, system extensions, ready reserve cars (gaptrains), and load factor policy, and
Maintenance Requirements, including the process which definescar requirements for both scheduled and unscheduledmaintenance, and for mid-life car rehabilitation.
Supply Analysis: Section Three addresses the supply of Metrorailrevenue vehicles. It accounts for total cars owned by fiscal year,showing authorized and anticipated procurements, and cars availablefor service net of accident damaged vehicles and vehicles in long-term revenue collection.
Demand/Supply Balance: In Section Four the balance of thedemand for vehicles and the supply of vehicles is discussed. Theplan is also summarized.
Fleet Tables: In this document, Figure 2-2: Passenger Demand forRevenue Vehicles; Figure 2-5: Maintenance Demand for RevenueVehicles; Figure 3-3: Supply of Revenue Vehicles; and Figure 4-1:Vehicle Demand / Supply Balance summarize the heart of the plan.Each table shows fleet status at the end of fiscal years 2006 through2015. This span of years was chosen in order that the time frame ofthis plan match that of the Ten Year Capital Improvement Programadopted by the WMATA Board of Directors.
METRORAIL REVENUE VEHICLE FLEET MANAGEMENT PLAN NOVEMBER 2006
Page 6 Section One: Introduction
*** This page intentionally blank ***

METRORAIL REVENUE VEHICLE FLEET MANAGEMENT PLAN NOVEMBER 2006
Section Two: The Demand For Revenue Vehicles Page 7
SECTION TWO
THE DEMAND FORREVENUE VEHICLES
QUALITY OFSERVICE
Quality of service is what ultimately determines the success of anytransit system. This is especially true for Metrorail since strongcommitments have been made in terms of the system's performance,and the public has come to expect a superior product in return for itsinvestment.
*”WMATA Rail PassengerSurvey 2002"
** Metropolitan WashingtonCouncil of Governments2002 Cordon Count
Service quality is also important because the system is still growingand the transit market is still being developed. A large segment ofWMATA’s marketplace is discretionary. According to a recentWMATA survey, 80 percent of daily rail riders are in households witha vehicle available, and therefore are “choice” riders.* Quality ofservice is key to retaining and growing ridership in this marketsegment.
According to the Metropolitan Washington Council of Governments,about 41 percent of commuter trips to the core area of Washington,D.C. are made using public transportation.** It would be necessary tobuild 30 additional highway lanes in the Washington transit zone inorder to match Metrorail’s people-moving capacity.
In order to maintain transit market share and to enhance itscontribution to mobility and accessibility, to improved air quality, toreduced traffic congestion and to serve increased regional growthand travel demands, the Authority has committed to doubling transitridership by 2025. Based on the outcome of the Core Capacity Studyand The Regional Bus Study, it is expected that 60 percent of thisgrowth will take place on the existing system, while 40 percent willcome from system expansion over the next quarter century.
In the Washington region, with its large number of “choice” transitriders, WMATA believes that the most significant factor influencingridership is quality of service.
Quality of service is considered to be a function of the followingfactors:
• Safety • Frequency• Speed • Comfort• Cleanliness • Service Reliability
Frequency, comfort, and service reliability are related primarily tofleet size.

METRORAIL REVENUE VEHICLE FLEET MANAGEMENT PLAN NOVEMBER 2006
Page 8 Section Two: The Demand for Revenue Vehicles
THE METRORAILSERVICE
PLANNINGMODEL
The process WMATA uses to develop fleet size requirementsincludes ongoing evaluations of ridership vs. system capacity, plusan expanded 10-year needs assessment tied to procurements of railvehicles. Fleet size requirements are updated on a periodic basisprompted by events such as opening of new rail segments, theimplementation of a major overhaul program, or the procurement ofnew rail cars. The Metrorail service planning model is a multi-stepprocess used by the Authority to develop its fleet size requirements.The elements are as follows:
Step One: Determine peak demand at the maximum load points byactual counts of present ridership and estimates of future demand.These demand estimates are made by WMATA professional staff.Passenger demand is projected 10 years into the future, and takesinto account regional growth estimates from the MetropolitanWashington Council of Governments (COG). In addition to theopening of new system segments, passenger demand is influencedby pricing (fares) and system access measures. Using FY2006 as abase year, regional forecasts estimated an average rate of growth oftwo to three percent per year through 2015.
The regional model uses several factors to estimate transit ridershipgrowth including regional population and employment growth as wellas historical growth in transit riders. Taking these factors intoconsideration the regional travel demand model estimates that 20year growth trends in transit ridership will average to nearly threepercent per year, which is consistent with WMATA’s average rate ofgrowth.
Between 2000 and 2006 Metrorail’s annual ridership increased from163 million riders to approximately 199.9 million, an average annualgrowth rate of 3.38% which is in line with projected growth rates usedin this plan. WMATA’s capacity is governed by crowding at ninemaximum load (max load) points on the five lines. Ridership throughthese points typically grew at a slower rate than the total systemgrowth. The table below shows the average annual growth rate forpeak period trips on each line’s max load point.
Line Location Growth(2000-06)Red Dupont Circle to Gallery Place 2.47%Blue Rosslyn to L’Enfant Plaza 2.93%Orange Court House to L’Enfant Plaza 2.83%Yellow Pentagon to L’Enfant Plaza 2.24%Green Mt. Vernon to Waterfront 2.26%
It should be noted that while these growth rates are lower than 3%,
SECTION 2AESTIMATION OF PASSENGER DEMAND ANDTHE RESULTING PEAK VEHICLE REQUIREMENT

METRORAIL REVENUE VEHICLE FLEET MANAGEMENT PLAN NOVEMBER 2006
Section Two: The Demand For Revenue Vehicles Page 9
higher growth in the peak period trips not going through a max loadpoint and growth in off-peak travel will result in systemwide growth ofapproximately 3%.
Methodologies developed for the WMATA 10-Year CapitalImprovement Plan outlined the procedure for monitoring passengerloading and managing those loads to ensure the fleet is capable ofsafely accommodating all passengers without leaving any leftstanding on the platform in the peak hour.
Step Two: Define and adopt passenger load standards. Thesestandards are a statement of the quality of service the Authoritywishes to provide to the public. Presumably, the more generous thestandard in terms of seating capacity per passenger, the moreattractive the service and therefore the higher the ridership. However,a more generous standard requires more rolling stock.
Step Three: Apply the adopted passenger load standards to theactual peak period ridership to derive the number of cars required atthe maximum load points during the peak period.
Step Four: Select headways and car consists that meet loadstandard criteria. Headways are the scheduled time intervalsbetween trains, and car consists are the number of cars per train.Because WMATA's cars are operated in married pairs, the scheduleis constrained to operate in four-car, six-car, or eight-car trains. Therequired number of cars can be provided by any combination ofheadways and consists. Current Metrorail passenger demandrequires headways of two to three minutes in downtown areas inpeak periods.
Step Five: Determine line requirements. The chosenheadway / consist mix and maximum load point requirements mustbe translated into line requirements. This recognizes other factorssuch as running time, put-in locations, and other operatingconstraints of the system.
Step Six: Determine the number of cars required for strategic gaptrains. One method of helping to ensure service reliability is throughthe deployment of standby gap trains in strategic positionsthroughout the system. When a train must be taken out of servicebecause of a mechanical malfunction or other operating problem, agap train can be used to replace it and maintain the regular schedule.The number of gap trains (and the resulting number of cars) dependson the reliability of regularly scheduled service and on reliabilityobjectives. This gap train requirement is discussed in greater detailon page 16 and in Appendix B.

METRORAIL REVENUE VEHICLE FLEET MANAGEMENT PLAN NOVEMBER 2006
Page 10 Section Two: The Demand for Revenue Vehicles
0
20
40
60
80
100
120
140
160
Jul Sep Nov Jan Mar May
FY2005
FY2006
*The average of severalobservations. A change inthe PVR is made only if aconsistent trend is detectedover a period of time.
Step Seven: Determine total operating peak vehicle requirement(PVR). This is the sum of peak car requirements for all lines in thesystem plus gap trains. The PVR on each line is the number of carsrequired to carry the observed average passenger load* past themaximum load point in the peak direction in the peak hour, asdetermined in Step Three, plus the gap trains assigned to that line.
Step Eight: Determine the operating spare factor necessary to meetthe total peak car requirement. This is usually expressed as apercentage of the scheduled fleet in excess of the daily schedulerequirements. It provides a sufficient number of cars to be availablefor routine maintenance, and also assumes that a certain number ofcars will be unavailable for service each day because of mechanicalproblems. Like gap trains, this factor also contributes to servicereliability.
Step Nine: Determine the number of rail cars that will be off site forrehabilitation. The major impact included in the Plan will be the formalBreda mid-life rehabilitation.
Step Ten: Determine the total fleet requirement. This is the sum ofthe number of cars required for peak scheduled service, gap trains,and spares.
FIGURE 2-1Metrorail Revenue Vehicle Fleet Management Plan

METRORAIL REVENUE VEHICLE FLEET MANAGEMENT PLAN NOVEMBER 2006
Section Two: The Demand For Revenue Vehicles Page 11
SEASONALVARIATIONS IN
PASSENGER DEMAND
*The arithmetic mean of all24 data points Is 133.
**The standard deviation isa measure of dispersion ofthe data. In this case thedispersion is slight - about3.45% above and below themean - indicating very littlevariation among the datapoints.
Figure 2-1 shows maximum load point passenger counts for eachmonth of fiscal years 2005 and 2006. The graph demonstrates thatthere is little seasonal variation in Metrorail’s peak period ridership.The two year average* peak-period one-hour system-wide passengerdemand during the period shown on the graph is about 133,000passengers. The statistical standard deviation** of that same data isabout 4,500 passengers.
In terms of planning in-service car requirements to meet this demand,the only adjustment the Authority usually makes is to reduce trainlength on weekends in the winter months and increase train lengthsduring the mid-day hours in the summer. Otherwise, in-service carrequirements remain stable throughout the year, especially in thepeak periods.
PEAK VEHICLEREQUIREMENT
The Peak Vehicle Requirement (PVR) is the total number of rail carsneeded simultaneously in the peak periods to satisfy passengerdemand while keeping per-car passenger loads at or below a pre-determined level (Step Seven of the Metrorail Service PlanningModel). On weekdays, the period of maximum ridership lasts forabout 75 minutes in the morning peak period and about 90 minutes inthe afternoon peak period. Passenger loads are measured at themaximum load points on each line, in the peak travel direction,throughout the entire peak period, and are evaluated in one hour andtrain level increments to determine appropriate headway and fleetrequirements.
PASSENGERLOAD STANDARDS
The passenger load standard is the desired number of passengersper car under maximum load conditions, determined in Step Two ofthe Metrorail Service Planning Model previously outlined.
The Importance of Passenger Load Standards: The passengerloading standard affects both passenger comfort and operatingefficiency, each of which is important in terms of the quality ofservice. In terms of comfort and convenience, the passenger loadstandard serves to determine:
• Ability to get on the first train going in the passenger's preferreddirection of travel from any station.
• General probability of getting a seat• General proximity to other standees
Operating efficiency is affected if insufficient capacity is provided tomeet demand. If trains become too crowded, doors become blocked,dwell time is lengthened, and it becomes impossible to adhere to theschedule.
A study by the Texas Transportation Institute indicates thatWashington, D.C.’s streets and highways are the third mostcongested in the country. Were the public to come to view Metrorail
METRORAIL REVENUE VEHICLE FLEET MANAGEMENT PLAN NOVEMBER 2006
Page 12 Section Two: The Demand for Revenue Vehicles
as an unattractive alternative to their cars, it would be prohibitivelyexpensive for the region’s state and local governments toaccommodate the resulting increased automobile travel demand.
LOAD FACTORS
In this document, rail carpassenger load factors areexpressed in terms of thenumber of passengers percar.
The current primary loadstandard is 120 passengersper car .Secondarystandards are 140 ppc forthe peak half-hour and 155ppc per trip.
An alternative loadingmeasure is passengers perseat.
Current Metrorail Passenger Load Standards: The currentMetrorail passenger load standards are as follows:
Peak Primary Standard: Not to exceed 120 passengers per car(ppc) average of all trains passing the maximum load point in thepeak direction in the peak one hour on each line.
Peak Secondary Standard: Not to exceed 140 ppc for the peakhalf-hour or 155 ppc on any single train passing the maximumload point on each line during the peak period.
The use of passenger load standards to evaluate service was begunby WMATA staff in 1982. The original standards and the evaluationprocess were reviewed by the Board of Directors at that time, andload standards have been employed at the Authority ever since. Theyhave been revised from time-to-time in the last 15 years to betterreflect the Authority's service policies and objectives.
Load Standard Objectives: The ideal quality situation would be toprovide a seat for every passenger in the peak periods. While thatobjective may not be financially achievable, an improved standard ofpassenger comfort is possible. To further the goal of attractinggreater Metrorail ridership by providing an improved quality ofservice, the Authority has established an objective of reducing itspassenger load standards over a period of years to below 120passengers per car in the peak hour. Experience following theopening of the Branch Avenue section of the Green Line taught usthat an average of 120 passengers per car is the point wherecustomers will refuse to board a train and will be left behind on theplatform. Passenger demand and our ability to accommodate thosedemands become unmanageable beyond a peak hour average of120 passengers per car.
Passenger counts can vary greatly throughout the peak period. Evenwhen reaching an objective of 120 ppc for the peak hour there can bea range of 60 to 160 ppc within a smaller time period or on a tripbasis. These variances also occur among the various rail lines. Whilethe Green, Orange and Red tend to have more crowded trains, thereare instances of crowding on the Blue and Yellow Lines also. InMarch 2001, the WMATA Board of Directors instructed the Authoritystaff to base future rail car deployments on ridership projections thatwould result in a passenger per car figure of less than 100.
In summary, the design standard used by WMATA planners is 120passengers per car. However the actual deployment of rail cars isbased on a WMATA Board established guideline of 100 ppc.

METRORAIL REVENUE VEHICLE FLEET MANAGEMENT PLAN NOVEMBER 2006
Section Two: The Demand For Revenue Vehicles Page 13
The plan presented in this document is structured to provide thenumber of cars necessary to achieve most of this reduction in peakpassenger loads, while striking a balance between that reduction andthe competing objectives of capital investment in revenue vehiclesand operating budget levels. The plan assumes the current practiceas the appropriate passenger loading level and that this level will becontinued in the future. The achievement of the reduced loadstandard is dependent on the financial capability (capital andoperating) of the Authority to obtain and operate the additionalvehicles required.
FUTUREPASSENGER
DEMAND ANDFACTORS
INFLUENCINGPEAK PERIOD
RIDERSHIP
Peak period ridership is the primary factor that determines PVR.Service demand changes over time and is particularly influenced byevents such as the opening of new segments of the Metrorail system.
General Ridership Growth: As stated earlier, the Authority relies onthe Council of Governments to project overall regional population andland use growth and transportation demand. This fleet managementplan needs to take into account at least some portion of that growthin projecting WMATA's future fleet size requirements, particularlygiven the extremely long period of time required to purchase anddeliver new rail cars. Hence the inclusion of general ridership growthas a factor influencing fleet size requirements. This plan assumes thecurrent ridership level as the base and assumes a future growth ofapproximately two to three percent per year.
Events and Influencing Factors Accounted for in this FleetManagement Plan: The car requirements shown on Line 1 of Figure2-2 reflect increasing passenger demand and future rail systemextensions. The beginning year figures shown for FY 2006 andFY 2007 are higher than the actual number of cars that were inservice due to a greater passenger demand and shortage of rail cars.
FUTURE SYSTEMDEVELOPMENT
Dulles Corridor Extension of the Orange Line: The Dulles CorridorExtension will add twenty-three miles and eleven stations in twophases to the Metrorail system, extending from a point inbound ofWest Falls Church Station through Tysons Corner, onto Reston-Herndon, through Dulles International Airport and into easternLoudoun County. The Phase I is a projected completion date of FY13and Phase II is projected to be complete in FY15.
As part of the Dulles FEIS a rail line load analysis was conducted byManual Padron & Associates. This report, summarized and includedas Appendix A, presents vehicle needs under the planned operatingscenario for the Orange/Dulles line.
METRORAIL REVENUE VEHICLE FLEET MANAGEMENT PLAN NOVEMBER 2006
Page 14 Section Two: The Demand for Revenue Vehicles
Other Service Solutions:The Authority is planning alternative solutions to improve its reliabilityand relieving overcrowding conditions. Ideas include:
• Restoring gap trains (cars borrowed for Largo extension)• Elimination of 4-car train operation in the peak period
Yellow Line to Fort Totten
Extends the Yellow Line from Mount Vernon to Fort Totten. The Board of Directors approved an eighteen month District of Columbiareimbursable project to extend the Yellow Line from Mount Vernon toFort Totten during off peak hours, beginning January 2007.
Red Line Turn Backs
Increase service between Shady Grove and Glenmont byeliminating turn backs at Grosvenor and Silver Spring. TheBoard of Directors approved an twenty one month Marylandreimbursable project to eliminate the Grosvenor Turnback duringthe off peak hours, beginning October 2006.
Blue Line Split
One half of Blue Line from Franconia Springfield would split fromthe current Blue Line at Pentagon and follow the Yellow andGreen Line routes until reaching Greenbelt. This service patternwould improve reliability at the Rosslyn Portal on the Orangeand Blue Lines.
Skip Stops
Eliminates stopping at certain stations providing faster servicefor majority of customers. Currently WMATA uses skip stopsduring the Washington Nationals’ home games to quickly clearthe platforms and transport customers to their destination.

METRORAIL REVENUE VEHICLE FLEET MANAGEMENT PLAN NOVEMBER 2006
Section Two: The Demand For Revenue Vehicles Page 15
FIG
UR
E 2
-2M
etro
rail
Rev
enue
Veh
icle
Fle
et M
anag
emen
t Pla
nP
AS
SE
NG
ER
DE
MA
ND
FO
R R
EV
EN
UE
VE
HIC
LES
FY 2
006
FY 2
007
FY 2
008
FY 2
009
FY 2
010
FY 2
011
FY 2
012
FY 2
013
FY 2
014
FY 2
015
Ope
ratin
g R
equi
rem
ents
1S
ched
uled
in P
asse
nger
Ser
vice
(Beg
inni
ng o
f Yea
r)77
479
481
483
485
487
289
090
898
099
8
1aS
yste
m G
row
th20
2020
2018
1818
1818
18
1bS
yste
m E
xpan
sion
*0
00
00
00
540
54
2S
ched
uled
in P
asse
nger
Ser
vice
(End
of Y
ear)
794
814
834
854
872
890
908
980
998
1070
3G
ap C
ars
4244
4648
5052
5656
5656
4P
eak
Veh
icle
Req
uire
men
t (P
VR
)83
685
888
090
292
294
296
210
3610
5411
26
* D
ulle
s P
hase
I in
FY
13 a
nd P
hase
II in
FY
15

METRORAIL REVENUE VEHICLE FLEET MANAGEMENT PLAN NOVEMBER 2006
Page 16 Section Two: The Demand for Revenue Vehicles
THE NEED FORGAP TRAINS
When a train fails in service and must be removed from the line, itleaves a gap equal to its scheduled headway plus the time requiredto troubleshoot the train, bypass the failed system, and offloadpassengers. When removing a malfunctioning train, it is not unusualfor the remaining interval (the gap) to be triple or more the scheduledheadway. While there is no way to mitigate the high passenger loadsin the immediate vicinity of the malfunction incident, it is crucial thatthe gap be filled as soon as possible; at least at the next turn back(preferably before), where a gap train is normally stored. TheAuthority sometimes uses a “skip stop” procedure for trains departinga terminal to reduce an especially large gap in service. Terminalsupervisors may also re-block trains and spread departure times tocompensate for gaps in service. These measures, when combinedwith the insertion of a gap train, can eliminate the effects of a serviceinterruption in less than one train trip.

METRORAIL REVENUE VEHICLE FLEET MANAGEMENT PLAN NOVEMBER 2006
Section Two: The Demand For Revenue Vehicles Page 17
FIGURE 2-3aMetrorail Revenue VehicleFleet Management Plan
FIGURE 2-3bMetrorail Revenue VehicleFleet Management Plan

METRORAIL REVENUE VEHICLE FLEET MANAGEMENT PLAN NOVEMBER 2006
Page 18 Section Two: The Demand for Revenue Vehicles
SCHEDULINGAND OPERATING
STRATEGIES USEDTO REDUCE THE
IN-SERVICE CAR
REQUIREMENT
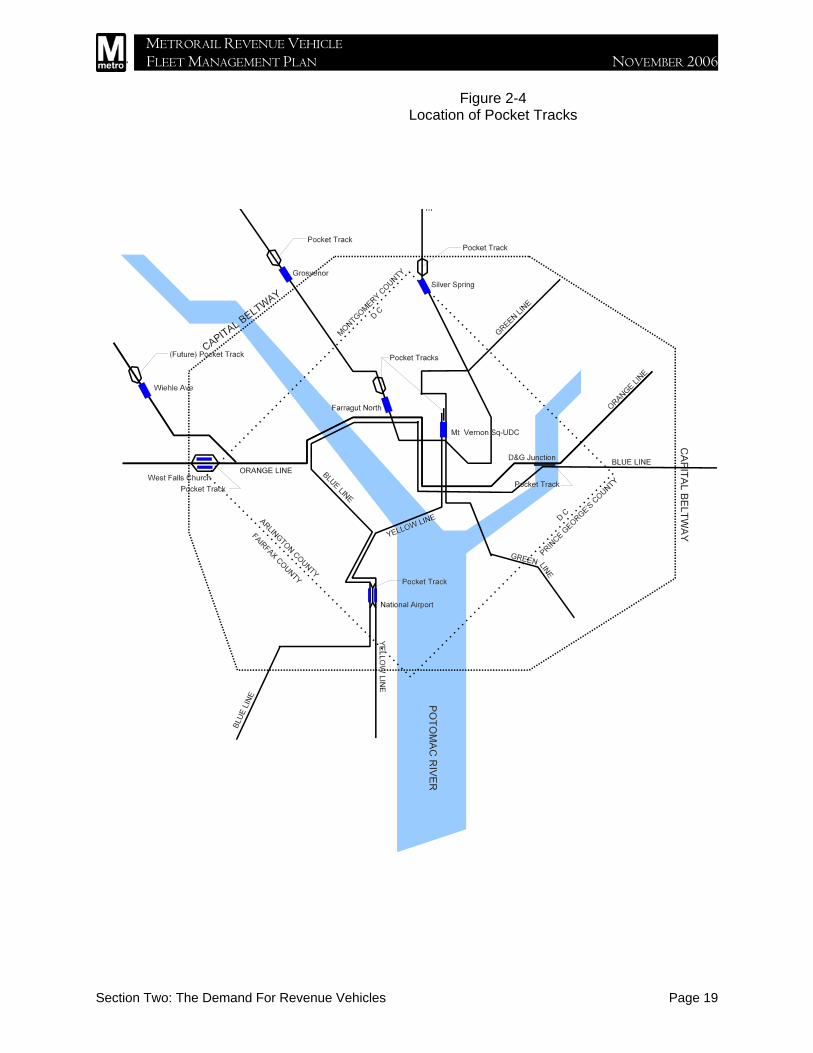
Short-Lining: The Authority attempts to take advantage of everyopportunity to minimize the number of cars required to run theschedule. Short-lining is one way that the schedule is constructed tominimize car requirements and to place service where it is neededmost. Seven mid-route turnbacks are built into Metrorail system andare available for short-lining. These turnbacks are constructed in theform of pocket or third tracks, each eight cars long, placed betweenthe two main line tracks. The seven mid-line pocket tracks in thesystem are located as follows:
Red Line: Silver Spring: just outbound of the stationRed Line: Farragut North: just outbound of the stationRed Line: Grosvenor: just outbound of the station
Blue / Orange Line: At the D&G Junction: about midway betweenStadium Armory and Minnesota Avenue stations
Orange Line: West Falls Church: at the station platform
Blue / Yellow Line: National Airport: at the station platform
Yellow / Green Line: Mt. Vernon Square - UDC: just outbound ofthe station
Figure 2-3a illustrates the third track at Farragut North and Figure 2-4shows the location of each mid-line pocket track. Our current studiesof potential future improvements to the existing Metrorail system areanalyzing the impact of adding additional pocket tracks andinterconductivity connections that would provide flexibility to addressvaried boarding patterns.
In the current peak period schedule, about half of the Red Line tripsoperate between Silver Spring and Grosvenor only. The bifurcation ofthe Blue and Orange lines at Stadium-Armory and Rosslyn enablesWMATA to provide a reduced level of service outbound of thosestations and greater service downtown. The same is true of the Blue-Yellow Line at Pentagon and King Street and of the Yellow-GreenLine L’Enfant Plaza. The Yellow Line’s northern terminus is at Mt.Vernon Square-UDC. Beginning in 2007, the off-peak terminus willbe shifted to Ft. Totten.
METRORAIL REVENUE VEHICLE FLEET MANAGEMENT PLAN NOVEMBER 2006
Section Two: The Demand For Revenue Vehicles Page 19
Figure 2-4Location of Pocket Tracks

METRORAIL REVENUE VEHICLE FLEET MANAGEMENT PLAN NOVEMBER 2006
Page 20 Section Two: The Demand for Revenue Vehicles
Tripper Trains: When there is an imbalance in passenger volumesbetween ends of an operating line (such as on the Orange and GreenLines), in addition to varying the car-consist on each end of the line,“tripper trains” are used to serve the passenger flow in the heavierdirection. Tripper trains are trains that operate only a single trip ineach of the two daily peak periods to accommodate high ridership onone end of a line. This approach is used extensively on the OrangeLine.
Drop Back Operators: In peak periods, when headway intervals areshort, the scheduled time between a train’s arrival and its nextdeparture is not sufficient to permit the operator to walk from arrivalend to departure end and depart on time. A scheduler cancompensate for this difficulty by scheduling additional train operatorsin the peak periods such that when each train arrives in a terminaland opens its doors, a second operator can board and take control ofthe train on the departure end. As soon as the operator on the arrivalend alights, the train is ready to depart. The arriving operator thenhas time to walk to the opposite end of the terminal platform wherehe in turn enters the trailing cab of the next train to arrive andbecomes its departure operator. This labor-intensive schedulingscheme is called “drop-back” operation. WMATA uses the drop-backscheduling technique extensively to maximize the use of limited fleetresources.
Road Mechanics: Metrorail employs “Road Mechanics” (AA-levelcar maintenance mechanics) to troubleshoot trains that experienceoperating degradation or failure while in passenger service. TheRoad Mechanics are assigned in shifts during all hours of passengerservice. They are stationed at strategic points throughout the system,and are in constant contact with the Metrorail Operations ControlCenter.
Every Metrorail Train Operator is taught how to recognize carbornesystem failures and how to bypass failed systems to enable amalfunctioning train to be removed from the main line. In addition, anew Vehicle Monitoring System designed to provide detailedinformation to the train operator on carborne system failures, wasinstalled in the 5000-series cars. The system is being installed in the2000 and 3000-series cars as they undergo their mid-liferehabilitation.
SUMMARY OFOPERATING
PEAK VEHICLEREQUIREMENTS
The forecast PVR is shown on Line 4 of Figure 2-2. Line 2 of thefigure shows the number of vehicles required to serve passengerdemand. The gap cars shown on line 3 are the strategic reservesnecessary to maintain a consistent and acceptable level of service.Line 4 is the total peak vehicle requirement.

METRORAIL REVENUE VEHICLE FLEET MANAGEMENT PLAN NOVEMBER 2006
Section Two: The Demand For Revenue Vehicles Page 21
SECTION 2BESTIMATION OF FLEET DEMAND RESULTING FROMCAR MAINTENANCE REQUIREMENTS
Metrorail’s 30 years of operating experience has presented atremendous challenge to WMATA’s Department of MetrorailServices. The combination of aging pains, system expansion andcontinuing ridership growth are major challenges now and for thefuture. In December 2000 a contract to perform mid-life rehabilitationon the aging Breda 2000 and 3000-series rail cars was awarded.This work is being performed in Hornell, NY by AlstomTransportation, Inc.
Two types of maintenance are performed on the rail car fleet:
• Operating Maintenance including:Scheduled (preventive) maintenanceUnscheduled (corrective) maintenance
• Car rehabilitation
Scheduled maintenance is done to keep equipment in good workingorder and to prevent in-service failures. Some car components areoverhauled on a schedule dictated by known failure rates and lifecycle expectations.
Scheduled preventive maintenance of rail transit vehicles is essentialto providing safe, reliable, and attractive service. Preventivemaintenance is especially critical to providing quality service at a timewhen capital funding programs are facing heavy scrutiny andreduction, and when operating budgets are being stretched. The railcar is a major capital investment that must be well maintained tomaximize its service life and to reduce capital and operatingexpenditures. To accomplish this task, a scheduled maintenanceprogram has been implemented by the Office of Rail CarMaintenance.
No matter how carefully the preventive maintenance program isconstructed and adhered to, however, and no matter howmeticulously car mechanics do their preventive maintenance tasks,the fact remains that cars will occasionally fail in service. Realitydemands, therefore, that WMATA plan for a certain portion of thefleet to be out of service because of unexpected failures of carbornesystems and components. Preventive maintenance reduces theunexpected in-service failure rate.

METRORAIL REVENUE VEHICLE FLEET MANAGEMENT PLAN NOVEMBER 2006
Page 22 Section Two: The Demand for Revenue Vehicles
SCHEDULEDPREVENTATIVEMAINTENANCE
Mid-life car rehabilitation is essential to extend the life of the vehicle.Without rehabilitation, the expected life of a heavy rail transit car is atleast 25 years. If a vehicle is renovated at its 15th to 20th year, itsexpected life will be extended more than 15 to 20 additional years.
Figure 2-5 shows the scheduled and unscheduled maintenancerequirements envisioned by the plan.
The Metrorail transit car scheduled maintenance program is designedto maintain car reliability by detecting potential defects and allowingthem to be corrected before they fail. It also permits servicing ofequipment requiring lubrication, measurement, and adjustment. Railcars are withdrawn from service at regular mileage-based intervals topermit the following preventive maintenance actions:
• Inspection of equipment to determine its condition compared withestablished standards.
• Routine service: lubricating, replacing filters, replenishing fluids,and making adjustments.
• Cleaning of exterior and interior surfaces and equipment.
• Scheduled replacement of electrical and mechanical equipment.
As shown on line 6 in Figure 2-5, the mid-life rehabilitation for the2000 and 3000 series rail cars continues until Fiscal Year 2010. Therehabilitation of the 4000 series is scheduled to begin in FY 2012.

METRORAIL REVENUE VEHICLE FLEET MANAGEMENT PLAN NOVEMBER 2006
Section Two: The Demand For Revenue Vehicles Page 23
FIG
UR
E 2
-5M
etro
rail
Rev
enue
Veh
icle
Fle
et M
anag
emen
t Pla
nM
AIN
TEN
AN
CE
DEM
AN
D F
OR
REV
ENU
E VE
HIC
LES
FY 2
006
FY 2
007
FY 2
008
FY 2
009
FY 2
010
FY 2
011
FY 2
012
FY 2
013
FY 2
014
FY 2
015
1P
eak
Veh
icle
Req
uire
men
t(PV
R)
836
858
880
902
922
942
962
1036
1054
1126
MA
INTE
NA
NC
E R
EQU
IREM
ENTS
Ope
ratin
g M
aint
enan
ce
2S
ched
uled
Mai
nten
ance
5656
5858
6062
6268
6874
3U
nsch
edul
ed M
aint
enan
ce
112
116
118
122
124
126
130
140
142
152
4S
ub-T
otal
: Ope
ratin
g M
aint
enan
ce16
817
217
618
018
418
819
220
821
022
6
5P
lann
ed O
pera
ting
Spa
re R
atio
(OS
R)
20.1
%20
.0%
20.0
%20
.0%
20.0
%20
.0%
20.0
%20
.1%
19.9
%20
.1%
6M
id-L
ife C
ar R
ehab
ilita
tion
3838
3838
380
3838
3838
7M
aint
enan
ce T
otal
206
210
214
218
222
188
230
246
248
264
8To
tal O
pera
ting
Dem
and
1004
1030
1056
1082
1106
1130
1154
1244
1264
1352
9To
tal F
leet
Dem
and
1042
1068
1094
1120
1144
1130
1192
1282
1302
1390
NO
TES
:Li
ne 5
: OS
R =
Lin
e 4
/ Lin
e 1
Line
8: T
otal
Ope
ratin
g D
eman
d =
Line
1 +
Lin
e 4
Line
9: T
otal
Fle
et D
eman
d =
Line
1 +
Lin
e 7

METRORAIL REVENUE VEHICLE FLEET MANAGEMENT PLAN NOVEMBER 2006
Page 24 Section Two: The Demand for Revenue Vehicles
TRAIN FAILUREDEFINITIONS
AND ACTIONS
Safety-Related Failures: A number of safety-related conditionsrequire that a train be removed from service. The Metrorail transit caris designed with a number of fail-safe system interlocks. This meansthat a failure or fault in a safety-critical carborne system (such asfriction brakes, propulsion, or automatic train control) causes the trainto go into fail-safe mode, which normally brings the train to a full stop.The train cannot be moved again until the fault is cleared or the failedsystem is bypassed. Moving a failed train with safety systemsbypassed requires that passengers be discharged and the trainremoved from service. Faults of the door control system, the frictionbrake system, propulsion/dynamic brake system, and automatic traincontrol system account for a majority of the carborne equipmentfailures that cause a train to be removed from service.
Safety is first in all operational decisions. Whenever there is anindication of a problem with safety-related carborne equipment, thecar is removed from service. This action eliminates all known risks topassengers and to the system, and is consistent with WMATA’sSystem Safety Program Plan.
*NON-MECHANICALFAILURES
As described in the sectiontitled “Maintaining ServiceReliability: Gap Trains”, theincidence of non-mechanical type failures isless than ten percent.
Other Types of Failures: In addition to safety-related conditions,WMATA removes trains from service as the result of a number ofother situations not specifically addressed by Metrorail's safety rulesand procedures. For example:
• If a train has a car or cars not producing sufficient HVAC coolingin summer weather, it will be removed from service as soon aspossible.
• If a train's automatic leveling bellows are malfunctioning suchthat the passenger door sills are above or below the platformedge or the platform gap exceeds a certain width tolerance, thetrain is removed from service as soon as possible.
• A train on which excessive vandalism or graffiti are discovered isremoved from service as soon as possible.*
• If a train's wheels have flat spots producing a rough, noisy ride, itwill be removed from service as soon as possible.
• If, at a station platform, a train's passenger doors are opened onthe wrong side of the train (the non-platform side), or if a train'spassenger doors are opened outside the limits of a stationplatform, the train normally will be removed from serviceimmediately and sent to a yard where it can be inspected. Whileincorrect door openings usually are the result of operator error,WMATA again takes the safest approach and verifies that thetrain is in good working order before placing it back into service.
• Trains are removed from service whenever they are involved in acollision incident with persons or objects, even though there maybe no apparent damage to the train. This permits the train to beinspected before being put back into service.

METRORAIL REVENUE VEHICLE FLEET MANAGEMENT PLAN NOVEMBER 2006
Section Two: The Demand For Revenue Vehicles Page 25
CARREHABILITATION
Car rehabilitation is the third maintenance component of this fleetmanagement plan. After 15 years of service life, a WMATA rail carwill have traveled nearly one million miles. Many critical parts willwear out and basic overhauls will not be enough to maintain theexpected performance. Many critical repair parts will not be availabledue to advances in technology. A rail car will not be maintainablewithout a mid-life rehabilitation or rehabilitation.
The 300 Rohr cars purchased from 1974 through 1978 had majorelements in the rehabilitation program completed in 1997. Othercritical components have been replaced or rehabilitated as part of theEmergency Rail Rehabilitation Program (ERRP).
The Rohr rail cars will reach thirty-five years of age between 2011and 2015. WMATA plans to conduct an economic/maintenanceanalysis of the Rohr fleet. The results of the analysis will helpdetermine the life span and replacement timetable of the vehicles.
The Authority's 2000-series and 3000-series Breda cars enteredservice between 1983 and 1988. They are now at mid-life, andsignificant rehabilitation of major systems is necessary to maintaintheir operational reliability. A contract was awarded in December2000 to Alstom Transportation, Inc. of Hornell, New York to renovatethese cars and restore them to like-new condition. Work involves thereplacement of interior liners, under-floor cabling, and other systemsand equipment such as: propulsion, lighting, communications,destination signs, friction brake hydraulic, pneumatic, and electroniccontrol equipment; heating, ventilation, and cooling equipment; semi-permanent couplers between married pairs; and door systemcomponents that are nearing the end of their useful lives. In addition,trucks and front-end couplers will undergo mid-life inspection andrehabilitation.
Rehabilitation work must be performed by an outside contractor off ofWMATA property since WMATA does not have the facilities tosupport this program. Figure 2-5, Line 6 shows how the rehabilitationprocess will affect the supply of vehicles during the period covered bythis Fleet Management Plan.
At full production, it is expected that a steady level of 38 cars will beunavailable for revenue service at any given time because they are:
• Undergoing preparation for removal from WMATA property to besent to the rehabilitation facility or entering the rehab process
• In production at the rehabilitation or rehab facility• Undergoing acceptance testing after being returned to WMATA
It is anticipated that vehicles entering the rehabilitation process willbe out of service for an average of four to seven months. This timeframe and car count are based on the procurement specificationsand the final contract.

METRORAIL REVENUE VEHICLE FLEET MANAGEMENT PLAN NOVEMBER 2006
Page 26 Section Two: The Demand for Revenue Vehicles
The 4000-series, which entered service between 1992 and 1994 willbe nearing their mid-life in the years 2009 to 2011. A specificdecision on the mid-life rehabilitation plan for this series will be madeat a future date; however, the same figure of 38 cars out of service isbeing used for the current program.
RAIL CARSOUT OF SERVICE:THE OPERATING
SPARE RATIO
FLEET SPARE RATIO
The Operating Spare Ratioexcludes cars which areaway from the property forrehabilitation, and thereforeare not “available” forservice. The Fleet SpareRatio, discussed in SectionThree of this document, is asimilar measure whichencompasses all vehicles inthe fleet, including thosewhich are away forrehabilitation.
* VEHICLE SHORTAGE
As will be seen in SectionFour, it is necessary also toinclude in the numerator ofthis equation the shortageof vehicles due to ademand for a given yearexceeding the supply. Thisimpact, discussed inSection 4, may show up asa reduced operating spareratio.
For planning purposes, WMATA uses a nominal operating spare ratioof 20 percent, calculated as follows:
FIGURE 2-6Metrorail Revenue Vehicle Fleet Management Plan
CALCULATION OF THE OPERATING SPARE RATIO (OSR)
As seen in Figure 2-5, the number of cars required for maintenancespares ranges from 168 in FY 2006 to 226 in FY 2015 if peak vehiclerequirements increase as projected. This results in a planned OSR ofabout 20 percent over the life of this fleet management plan.
Approximately one-third of the maintenance spares will be used tosupport scheduled maintenance programs. The approximately two-thirds required for unscheduled maintenance takes the married pairconfiguration into consideration. A failure on one car causes two carsto be removed from service. However, the reliability resulting from thescheduled maintenance programs makes the 20 percent OSRacceptable.
It should be noted that the lower fleet spare ratio reflects theincreasing rail car requirement driven by ridership growth duringthese years prior to the assumed delivery date of the next rail carpurchase. Although Figure 2-5 reflects rail car needs, due to theimpact on the spare factor, the needed level of service may not beable to be provided.

METRORAIL REVENUE VEHICLE FLEET MANAGEMENT PLAN NOVEMBER 2006
Section Two: The Demand For Revenue Vehicles Page 27
THE DISPOSITIONOF
CARS THAT HAVEFAILED WHILE IN
PASSENGER SERVICE
When a train is removed from peak service for a failure of any kind,the entire train is out of operation for a number of hours. Typically it issent back to the yard where it can be inspected and the failedcomponent can be identified. The Yardmaster can then break thetrain apart and reassemble the good order cars for return to servicein the next peak period. If the defective cars are returned to the yardquickly enough, it may be possible to repair them and return them toservice in the next peak period also.
If the bad order cars can be identified while the train is at a main lineterminal, it may be possible to break the train apart and place theremaining cars back into service, but this is the exception rather thanthe rule.
• The consist cut would require a spare train operator in theterminal to remove the cars left behind. No extra operators arescheduled and none are regularly available.
• The consist cut would consume several minutes of valuableterminal time, and would require a place to store the bad ordercars until they could be removed to a repair facility. Terminals areseverely restricted operating spaces in WMATA’s two-tracksystem.
• Requiring the Terminal Supervisor to direct such an ad hocoperation would distract from the timely execution of his othertrain dispatching duties.
It is most efficient and service-conscious to replace the entiremalfunctioning train with a gap train, if one is available, and return thebad order train to a yard where it can be repaired sooner and in amore orderly fashion. After a consist cut is made at a terminal, it ismost likely that the bad order cars would have to sit idle in theterminal (if a place were available in the tail tracks to store them) untilafter the peak period has ended, when personnel might becomeavailable to return them to the yard. Quickly transportingmalfunctioning cars to a yard aids in a more rapid return to service.
ENVIRONMENTALCONDITIONS
AFFECTING THEOPERATING
SPARE RATIO
The OSR is not adjusted to account for varying environmentalconditions. While changing weather conditions and seasonalvariations may affect operating reliability, the car maintenanceprogram attempts to compensate in ways other than by changing thespare ratio. Each fall Metrorail undergoes extensive winterization,and modifications have been made to the rail cars to reduce weather-related failures (eg. special screens have been installed over airintakes to prevent their becoming clogged with blowing snow, forexample). Operating procedures are also modified to compensate forcold weather and wet or icy conditions.
METRORAIL REVENUE VEHICLE FLEET MANAGEMENT PLAN NOVEMBER 2006
Page 28 Section Two: The Demand for Revenue Vehicles
THE EFFECT OFMAINTENANCEPOLICY ON THE
SPARE RATIO:A SUMMARY OFMAINTENANCE
REQUIREMENTS
In its 30-year history of operation, WMATA's rail car maintenanceprogram has resulted in one of the best maintained fleets of rail carsin North America. An aggressive cleaning program keeps interiorsand exteriors clean and graffiti free. No rail car is released for servicewith graffiti, and none are allowed to remain in service oncesignificant graffiti or vandalism are detected. The electrical andmechanical maintenance program is proactive.
Past Experience: The necessity of an adequate spare ratio washighlighted in late 1982 when the issue of car utilization was studied.New system segments had opened without a concomitant increase infleet size, and the maintenance spare factor had dropped to about 12percent. As a result, the in-service failure rate skyrocketed, servicequality deteriorated, and WMATA experienced first-hand the effect ofan inadequate fleet size. It was at that time that the 20 percentminimum operating spare factor policy was established.
Current Spares Requirements: To maintain the current level ofperformance requires that at least one-third of WMATA's rail carmaintenance effort be expended on scheduled maintenance andcomponent overhaul. A nominal operating spare ratio of about 20percent of the scheduled peak is required to run the total carmaintenance program. This results in approximately two-thirds of themaintenance spares being held out of service for unscheduledmaintenance.
To maintain this level of effort, WMATA’s maintenance program isplanned over seven days each week on three shifts each day. Sevenrepair shops are strategically located to support each rail line.Included in the six are two shops capable of performing heavy repairand overhauls. The other five are limited to inspections and runningmaintenance.

METRORAIL REVENUE VEHICLE FLEET MANAGEMENT PLAN NOVEMBER 2006
Section Two: The Demand For Revenue Vehicles Page 29
RAIL CARREPAIR SHOP
FACILITIES
There are currently seven Metrorail car maintenance repair facilitiesin operation. Figure 2-7 is a list of the shops with year opened,primary line supported, capacity, and function.
FIGURE 2-7Metrorail Revenue Vehicle Fleet Management Plan
RAIL CAR REPAIR SHOP FACILITIES
Shop LineYear
Opened Capacity Function
Alexandria BlueYellow
1981 20 Servicing,Inspection andRunning Repair
Branch Green 2002 8 Inspection andRunning Repair
Brentwood Red 1974/2009 40 Heavy Repair,Overhaul,Inspection andRunning Repair
Greenbelt Green 1996 22 Servicing,InspectionRunning Repair,Heavy Repair andOverhaul
NewCarrollton
BlueOrange
1978/2006 28 Servicing,Inspection andRunning Repair
ShadyGrove
Red 1983/2009 36 Servicing,Inspection andRunning Repair
West FallsChurch
Orange 1986 20 Servicing,Inspection andRunning Repair
Total Car Capacity 174Note: Glenmont yard does not have a shop.
Figure 2-8 depicts these facilities in their relative locations on theMetrorail system.

METRORAIL REVENUE VEHICLE FLEET MANAGEMENT PLAN NOVEMBER 2006
Page 30 Section Two: The Demand for Revenue Vehicles
FIGURE 2-8Metrorail Revenue Vehicle Fleet Management Plan

METRORAIL REVENUE VEHICLE FLEET MANAGEMENT PLAN NOVEMBER 2006
Section Two: The Demand For Revenue Vehicles Page 31
There are a total number of 174 repair spaces available which is lessthan the 180 cars projected to be out of service for operatingmaintenance during peak service in FY 2009. While not an idealcondition for expeditious maintenance turnaround, consideration isgiven to the fact that approximately 15 percent of running repairs canbe performed outside of the repair shop.
FUTURECONSIDERATIONS
OF REPAIR SHOPAND STORAGE
FACILITIES
The present capacity of Metro’s repair shop facilities is barelyadequate to service the existing rail car fleet. While temporarymeasures can be used to accommodate a short term deficiency, along term solution must be developed to address future needs. Inaddition, although there may be theoretical capacity to store most ofthe projected fleet, the available storage capacity is not necessarily inthe most efficient and appropriate location to serve the requiredoperations.
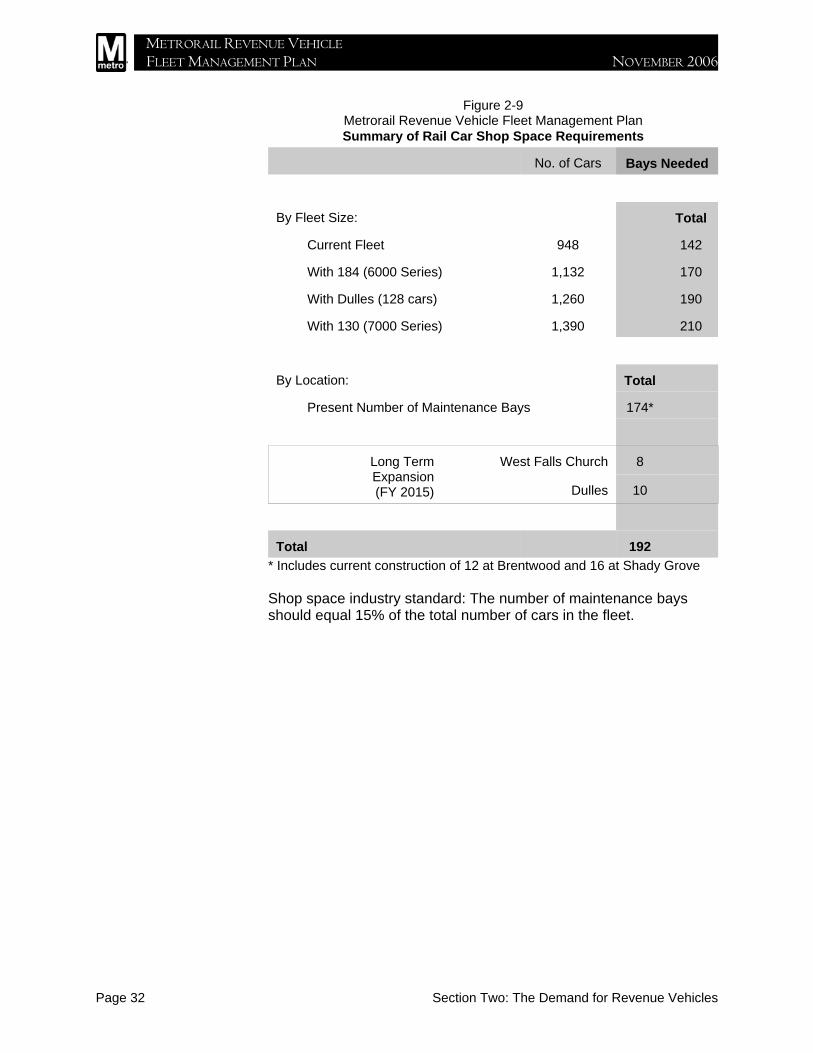
Maintenance Space: In addition to new rail cars, the CapitalImprovement Program calls for the addition of 18 new maintenancespaces in shops throughout the system, as follows:
West Falls Church: Eight additional maintenance spaces will beneeded in FY 2013 to bring the system total to 182.
Dulles: Ten additional maintenance spaces are required in FY2015 to bring the system total to 192.
Systemwide: A minimum of 210 maintenance spaces arerequired with the delivery of the 7000 series cars in FY 2014 andthe remainder of the Dulles cars in FY 2015. The Fleet Plan hasidentified the need for an additional 18 maintenance bays. Theexact yard expansion locations are not specifically located,although there is a proposed shop expansion at Alexandria Yard.This will be done as part of an overall fleet expansion and fundingagreement, similar to Metro Matters.
METRORAIL REVENUE VEHICLE FLEET MANAGEMENT PLAN NOVEMBER 2006
Page 32 Section Two: The Demand for Revenue Vehicles
Figure 2-9Metrorail Revenue Vehicle Fleet Management PlanSummary of Rail Car Shop Space Requirements
No. of Cars Bays Needed
By Fleet Size: Total
Current Fleet 948 142
With 184 (6000 Series) 1,132 170
With Dulles (128 cars) 1,260 190
With 130 (7000 Series) 1,390 210
By Location: Total
Present Number of Maintenance Bays 174*
Long TermExpansion(FY 2015)
West Falls Church 8
Dulles 10
Total 192* Includes current construction of 12 at Brentwood and 16 at Shady Grove
Shop space industry standard: The number of maintenance baysshould equal 15% of the total number of cars in the fleet.
METRORAIL REVENUE VEHICLE FLEET MANAGEMENT PLAN NOVEMBER 2006
Section Two: The Demand For Revenue Vehicles Page 33
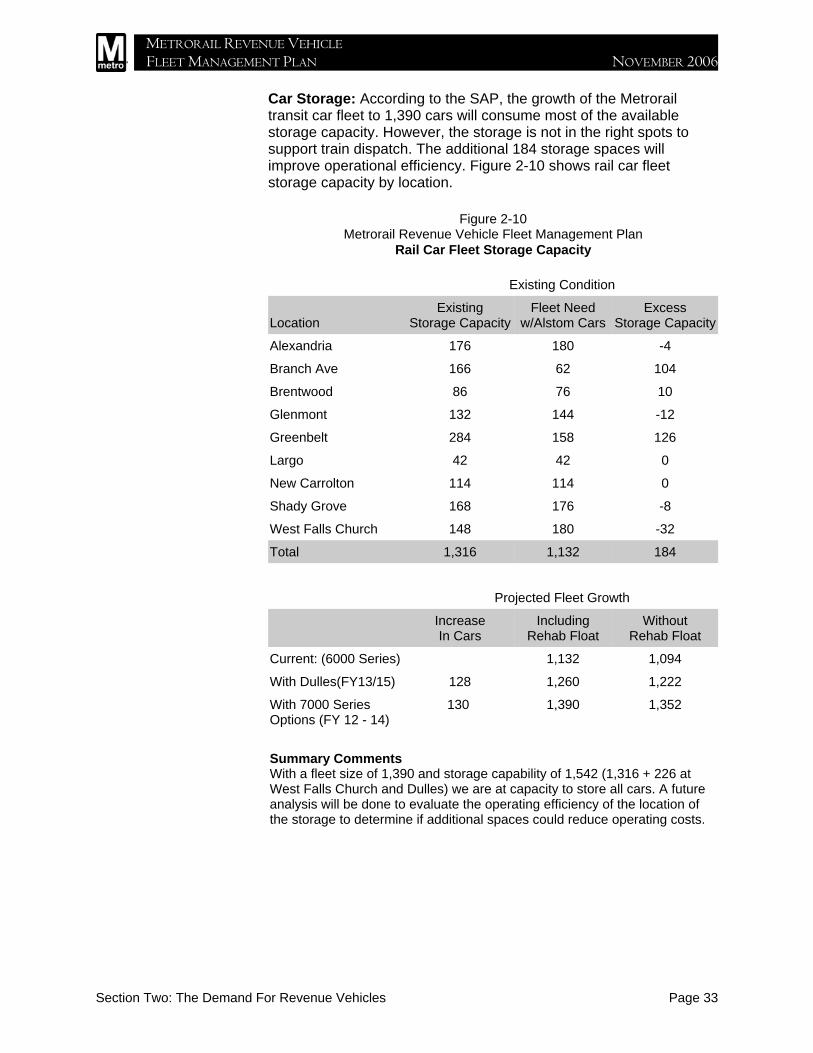
Car Storage: According to the SAP, the growth of the Metrorailtransit car fleet to 1,390 cars will consume most of the availablestorage capacity. However, the storage is not in the right spots tosupport train dispatch. The additional 184 storage spaces willimprove operational efficiency. Figure 2-10 shows rail car fleetstorage capacity by location.
Figure 2-10Metrorail Revenue Vehicle Fleet Management Plan
Rail Car Fleet Storage Capacity
Existing Condition
LocationExisting
Storage CapacityFleet Need
w/Alstom CarsExcess
Storage Capacity
Alexandria 176 180 -4
Branch Ave 166 62 104
Brentwood 86 76 10
Glenmont 132 144 -12
Greenbelt 284 158 126
Largo 42 42 0
New Carrolton 114 114 0
Shady Grove 168 176 -8
West Falls Church 148 180 -32
Total 1,316 1,132 184
Projected Fleet Growth
IncreaseIn Cars
IncludingRehab Float
WithoutRehab Float
Current: (6000 Series) 1,132 1,094
With Dulles(FY13/15) 128 1,260 1,222
With 7000 SeriesOptions (FY 12 - 14)
130 1,390 1,352
Summary CommentsWith a fleet size of 1,390 and storage capability of 1,542 (1,316 + 226 atWest Falls Church and Dulles) we are at capacity to store all cars. A futureanalysis will be done to evaluate the operating efficiency of the location ofthe storage to determine if additional spaces could reduce operating costs.

METRORAIL REVENUE VEHICLE FLEET MANAGEMENT PLAN NOVEMBER 2006
Page 34 Section Two: The Demand for Revenue Vehicles
*** This page intentionally blank ***

METRORAIL REVENUE VEHICLE FLEET MANAGEMENT PLAN NOVEMBER 2006
Section Three: The Supply of Revenue Vehicles Page 35
SECTION THREE
THE SUPPLY OFREVENUE VEHICLES
THE EXISTINGMETRORAIL
TRANSIT CARFLEET
As of July 1, 2006, the Metrorail transit car fleet consists of 948vehicles as shown in Figure 3-1. These are the Rohr, Breda, andCAF cars minus ten cars that are no longer in revenue service.
FIGURE 3-1Metrorail Revenue Vehicle Fleet Management Plan
CURRENT TRANSIT CAR FLEET
Manufacturer SeriesNumberOwned
YearsPurchased
Rohr Industries 1000 300 1974-1978
Breda ConstruzioniFerroviarie
2000 / 3000 366 1983-1988
4000 100 1992-1994
Construcciones y Auxiliar deFerrocarriles, S.A. (CAF)
5000 192 1998-2003
Alstom 6000 62/122 2006-2009
Total 1094Four Rohr cars were converted to revenue collection, four were accident destroyed (1982 and 1996).One Breda car and one Rohr car were destroyed in 2004.
TEN-YEARCAPITAL
IMPROVEMENTPROGRAM
One element of WMATA’s ten-year capital improvement program iscalled System Access and Capacity Program (SAP). The SAP callsfor the addition of 312 rail cars beyond those added for systemexpansion in order to address general growth in ridership. This fleetmanagement plan is intended to support and be in accord with theSAP.
Fleet Size: The Authority is currently in the process of deploying theinitial Alstom 6000 series cars. Prior to the arrival of the 6000 series,WMATA "borrowed" 14 rail cars from its gap car fleet in order toextend the Blue Line to Largo in December 2004. This procurementprovides 62 growth cars by 2007 and an additional 122 rail cars fromthe 6000 series options, bringing the service fleet total to 1,132 (1094plus the 38 rehabs) by December 2009.
An additional 128 cars for Dulles and 130 growth cars will be neededby 2015 to complete the car service fleet expansion program, takingthe fleet total to 1,390 cars. One objective of the SAP’s 300-cargrowth plan is to facilitate the operation of 75 percent of peak periodtrains as 8-car consists.

METRORAIL REVENUE VEHICLE FLEET MANAGEMENT PLAN NOVEMBER 2006
Page 36 Section Three: The Supply of Revenue Vehicles
PLANNED RAIL CAR PROCUREMENT
The purchase of additional transit cars is required to support bothsystem expansion and projected ridership growth. The procurementschedule for the 6000-series cars is shown in Figure 3-2, below.
FIGURE 3-2Metrorail Revenue Vehicle Fleet Management Plan
6000-SERIES RAIL CAR SCHEDULE
PROGRAM ELEMENTS DATE
Board Approval to Advertise April 2001
Bid Advertisement May 2001
Receive Proposals November 2001
Contract Award July 2002
Service Date - first 86 cars- additional 72 cars- remaining 26 cars
FY07FY08FY09
We expect the first 50 cars to be in service December 2006 andassume a delivery of 6 per month. This results is the first 86 carsplaced into service in FY07, 72 more cars placed into service duringFY08, and the remaining 26 cars of the 184 car procurement goinginto service in FY09. The 6000-series procurement, with the fulloption, will satisfy the Authority’s estimated fleet needs throughFY10.

METRORAIL REVENUE VEHICLE FLEET MANAGEMENT PLAN NOVEMBER 2006
Section Three: The Supply of Revenue Vehicles Page 37
FIG
UR
E 3
-3M
etro
rail
Rev
enue
Veh
icle
Man
agem
ent P
lan
SU
PP
LY O
F R
EV
EN
UE
VE
HIC
LES
FY 2
006
FY 2
007
FY 2
008
FY 2
009
FY 2
010
FY 2
011
FY 2
012
FY 2
013
FY 2
014
FY 2
015
1P
eak
Veh
icle
Req
uire
men
t (P
VR
)83
685
888
090
292
294
296
210
3610
5411
26
VE
HIC
LE S
UP
PLY
2V
ehic
les
Ow
ned
958
958
1044
1116
1142
1142
1142
1202
1292
1336
3P
lann
ed P
rocu
rem
ent*
086
7226
00
6090
4464
4S
ubto
tal:
Veh
icle
s O
wne
d95
810
4411
1611
4211
4211
4212
0212
9213
3614
40
Adj
ustm
ents
to V
ehic
le S
uppl
y
5A
ccid
ent D
amag
ed V
ehic
les
-6-6
-6-6
-6-6
-6-6
-6-6
6R
even
ue C
olle
ctio
n V
ehic
les
-4-4
-4-4
-4-4
-4-4
-4-4
7To
tal V
ehic
le S
uppl
y94
810
3411
0611
3211
3211
3211
9212
8213
2613
90
8Fl
eet S
pare
Rat
io (F
SR
)**
13.4
%20
.5%
25.7
%25
.5%
22.8
%20
.2%
23.9
%23
.7%
25.8
%23
.4%
* Li
ne 3
= 6
000
serie
s (1
84 c
ars
in F
Y06
- FY
08);
Dul
les
(64
cars
in F
Y13
and
64
cars
in F
Y15
); 70
00 s
erie
s (1
30 c
ars
in F
Y 1
2 - F
Y14
)**
Lin
e 8
= (L
ine
7 - L
ine
1)/ L
ine
1

METRORAIL REVENUE VEHICLE FLEET MANAGEMENT PLAN NOVEMBER 2006
Page 38 Section Three: The Supply of Revenue Vehicles
ADJUSTMENTS TOVEHICLE SUPPLY
Accident-Damaged Vehicles: Figure 3-3, Line 5 shows the impactof the accident-damaged vehicles to the fleet. Six rail cars sustaineddamage and are no longer in service . Inasmuch as they are notavailable for service, accident-damaged vehicles are subtracted fromthe fleet size before the spare ratio is calculated. They are notincluded in the spare ratio.
*MONEY TRAINMODIFICATION
Seats, carpets, wind screens,and stansion bars are removed,steel plates with tie-down ringsare fitted over the floors, bumprails are installed to keep cartsaway from interior liners, andshotgun racks are installed forthe use of security personnel.
The money carts are extremelyheavy, and can causeconsiderable damage to theinterior of a vehicle outfitted for
regular passenger service.
Revenue Collection Vehicles: The Metrorail system is designedsuch that transport of money and fare media between the passengerstations and the treasury building is best accomplished by train.Treasurer’s facilities are directly accessible by train, and the moneycarts (wheeled vaults) in each station are stored in lockers at theplatform level for easy access by money collection trains. Sincemoney distribution and collection is done during late evening revenuehours when passenger trains are still in service, safety and operatingconsiderations dictate that the money trains must have the sameoperating characteristics as the passenger trains among which theymust run.
In the past WMATA has wrestled with the issue of the most costeffective way to distribute and recover cash and fare media from theMetrorail stations. The following options have been considered by theWMATA Board of Directors:
• Armored trucks operating on surface streets• Rail cars built specifically for revenue transport• Regular rail passenger vehicles that have had their interiors
modified to accommodate the money carts.*
After a thorough cost-benefit analysis, it was concluded thatmodifying regular passenger cars to serve as revenue collectionvehicles would have the least impact on the Authority’s capital andoperating budgets. As a result of the analysis, the WMATA Board ofDirectors authorized the conversion of four Rohr cars for use asrevenue collection vehicles.
As the time approaches when more revenue collection vehicles arerequired, the Authority will review these options and conduct anothercost-benefit analysis of all options. For the purpose of this FleetManagement Plan, it is assumed that the same conclusion will bereached. The plan calls for the conversion of two additional Rohr carssometime beyond FY 2007.
FLEET SPARE RATIO Section Two of this document contains a discussion of the OperatingSpare Ratio (OSR), which is WMATA’s primary measure of theefficiency of fleet utilization. The OSR considers only vehicles thatare available for passenger service. All the cars undergoingrehabilitation at a location away from WMATA property are notimmediately available for service and therefore are specifically

METRORAIL REVENUE VEHICLE FLEET MANAGEMENT PLAN NOVEMBER 2006
Section Three: The Supply of Revenue Vehicles Page 39
excluded from the OSR calculation. Figure 2-5, Line 6 shows thenumber of cars undergoing rehabilitation for each year of this FleetManagement Plan.
Although the OSR reflects the efficiency of use of vehicles actuallyavailable for service, some regulatory and funding agencies areinterested in seeing calculated a second spare ratio, defined asfollows:
FIGURE 3-4Metrorail Revenue Vehicle Fleet Management Plan
CALCULATION OF THE FLEET SPARE RATIO (FSR)
In Figure 3-3, the Total Vehicle Supply shown on Line 7encompasses all cars in the fleet, including those in the rehabilitationprogram. (This figure, however, excludes the two categories of“Adjustments” discussed above.) This Total Vehicle Supply figure,minus the PVR, divided by the PVR, equals the Fleet Spare Ratio(FSR) shown on Line 8.

METRORAIL REVENUE VEHICLE FLEET MANAGEMENT PLAN NOVEMBER 2006
Page 40 Section Three: The Supply of Revenue Vehicles
*** This page intentionally blank ***

METRORAIL REVENUE VEHICLE FLEET MANAGEMENT PLAN NOVEMBER 2006
Section Four: Revenue Vehicle Demand / Supply Balance Page 41
SECTION FOUR
REVENUE VEHICLEDEMAND / SUPPLY BALANCE
Figure 4-1 is a summary showing the balance of demand for transitcars and the supply of cars for the period of this Metrorail RevenueVehicle Fleet Management Plan. As discussed in the foregoingsections, this fleet management plan is a snapshot of an ongoingplanning process. It takes into account the passenger demand forvehicles in revenue service and the demand that is placed on thefleet by scheduled and unscheduled maintenance requirements. Theplan ties these operating and maintenance requirements to thesupply of vehicles in both the present fleet and with the addition ofanticipated new vehicle procurements.
The plan anticipates that the peak period passenger servicerequirement will rise from 836 cars at the end of FY 2006 to 942 carsby FY 2011 and 1126 cars by FY 2015. It assumes that 42 cars willbe needed in FY06 to provide strategic gap trains and the length ofthe gap train will increase in proportionally to match the 8-car trainoperation. It assumes that the operating maintenance carrequirement will rise to 188 cars by FY 2011, and to 226 cars by FY2015. It assumes an aggressive mid-life car rehabilitation programthat will remove significant numbers of cars from service for extendedperiods of time.
On Line 17 of Figure 4-1, WMATA is shown to have a significantdeficiency in the number of vehicles available for passenger servicein the years FY 2006 - FY 2007. This deficiency reflects the need foradditional service to respond to the growth in ridership during thoseyears and the delays with the 6000 series fleet. The deficiency canbe addressed in one of two ways:
• Defer maintenance of the fleet and place the full complement ofcars into passenger service every day, or
• Continue to maintain the fleet as prescribed and operate fewercars than is indicated by passenger demand.

METRORAIL REVENUE VEHICLE FLEET MANAGEMENT PLAN NOVEMBER 2006
Page 42 Section Four: Revenue Vehicle Demand / Supply Balance
The Authority has chosen the latter course of action as being thewisest and most prudent. It does, however, result in higherpassenger loads and significant overcrowding. On the upside, properfleet maintenance assures a higher degree of reliability for the carsthat are placed into service. It is WMATA’s position that a reliablealbeit overcrowded service is preferable to a spacious but unreliableoperation.
The receipt and deployment of 6000 series cars beginning in FY2007 will represent a significant step toward satisfaction of theMetrorail fleet size requirement for the near future.

METRORAIL REVENUE VEHICLE FLEET MANAGEMENT PLAN NOVEMBER 2006
Section Four: Revenue Vehicle Demand / Supply Balance Page 43
FIG
UR
E 4
-1M
etro
rail
Rev
enue
Veh
icle
Fle
et M
anag
emen
t Pla
nVE
HIC
LE D
EMA
ND
/SU
PPLY
BA
LAN
CE
FY 2
006
FY 2
007
FY 2
008
FY 2
009
FY 2
010
FY 2
011
FY 2
012
FY 2
013
FY 2
014
FY 2
015
Ope
ratin
g R
equi
rem
ents
VEH
ICLE
DEM
AN
D1
Sch
edul
ed o
n Li
ne79
481
483
485
487
289
090
898
099
810
702
Gap
Car
s42
4446
4850
5254
5656
563
Pea
k V
ehic
le R
equi
rem
ent (
PV
R)
836
858
880
902
922
942
962
1036
1054
1126
Mai
nten
ance
Req
uire
men
tsO
pera
ting
Mai
nten
ance
4S
ched
uled
Mai
nten
ance
5656
5858
6062
6268
6874
5U
nsch
edul
ed M
aint
enan
ce11
211
611
812
212
412
613
014
014
215
26
Sub
-Tot
al O
pera
ting
Mai
nten
ance
168
172
176
180
184
188
192
208
210
226
7M
id-L
ife C
ar R
ehab
ilita
tion
3838
3838
380
3838
3838
8M
aint
enan
ce T
otal
206
210
214
218
222
188
230
246
248
264
9To
tal O
pera
ting
Dem
and
1004
1030
1056
1082
1106
1130
1154
1244
1264
1352
10To
tal F
leet
Dem
and
1042
1068
1094
1120
1144
1130
1192
1282
1302
1390
Vehi
cles
Ow
ned
VEH
ICLE
SU
PPLY
11R
even
ue V
ehic
les
Ow
ned
958
958
1044
1116
1142
1142
1142
1202
1292
1336
12P
roje
cted
Pro
cure
men
t0
8672
260
060
9044
6413
Sub
tota
l: V
ehic
les
Ow
ned
958
1044
1116
1142
1142
1142
1202
1292
1336
1400
14A
ccid
ent D
amag
ed V
ehic
les
-6-6
-6-6
-6-6
-6-6
-6-6
15R
even
ue C
olle
ctio
n V
ehic
les
-4-4
-4-4
-4-4
-4-4
-4-4
16To
tal V
ehic
le S
uppl
y94
810
3411
0611
3211
3211
3211
9212
8213
2613
9017
BA
LAN
CE:
-94
-34
1212
-12
20
024
018
Act
ual O
pera
ting
Spa
re R
atio
20.1
%20
.0%
20.0
%20
.0%
20.0
%20
.0%
20.0
%20
.1%
19.9
%20
.1%
19Fl
eet S
pare
Rat
io13
.4%
20.5
%25
.7%
25.5
%22
.8%
20.2
%23
.9%
23.7
%25
.8%
23.4
%S
ervi
ce s
how
n is
as
of th
e en
d of
the
Fisc
al Y
ear (
June
30)
Not
es:
Line
9: T
otal
Ope
ratin
g D
eman
d =
Line
3 +
Lin
e 6
Line
10:
Tot
al F
leet
Dem
and
= Li
ne 3
+ L
ine
8Li
ne 1
8: O
pera
ting
Spa
re R
atio
= (L
ine
6 +
Line
17)
÷ L
ine
3Li
ne 1
9: F
leet
Spa
re ra
tio =
(Lin
e 16
- Li
ne 3
) ÷ L
ine
3*
Ref
lect
s th
e 70
00 s
erie
s pr
ocur
emen
t of 5
0 ca
rs in
FY
2013
and
30
cars
in F
Y20
14 (1
256
+ 50
+ 3
0)

METRORAIL REVENUE VEHICLE FLEET MANAGEMENT PLAN NOVEMBER 2006
Page 44 Section Four: Revenue Vehicle Demand / Supply Balance
*** This page intentionally blank ***

METRORAIL REVENUE VEHICLE FLEET MANAGEMENT PLAN NOVEMBER 2006
Appendix A Page 45
APPENDIX A
DULLES FEISLOAD ANALYSIS

METRORAIL REVENUE VEHICLE FLEET MANAGEMENT PLAN NOVEMBER 2006
Page 46 Appendix A:
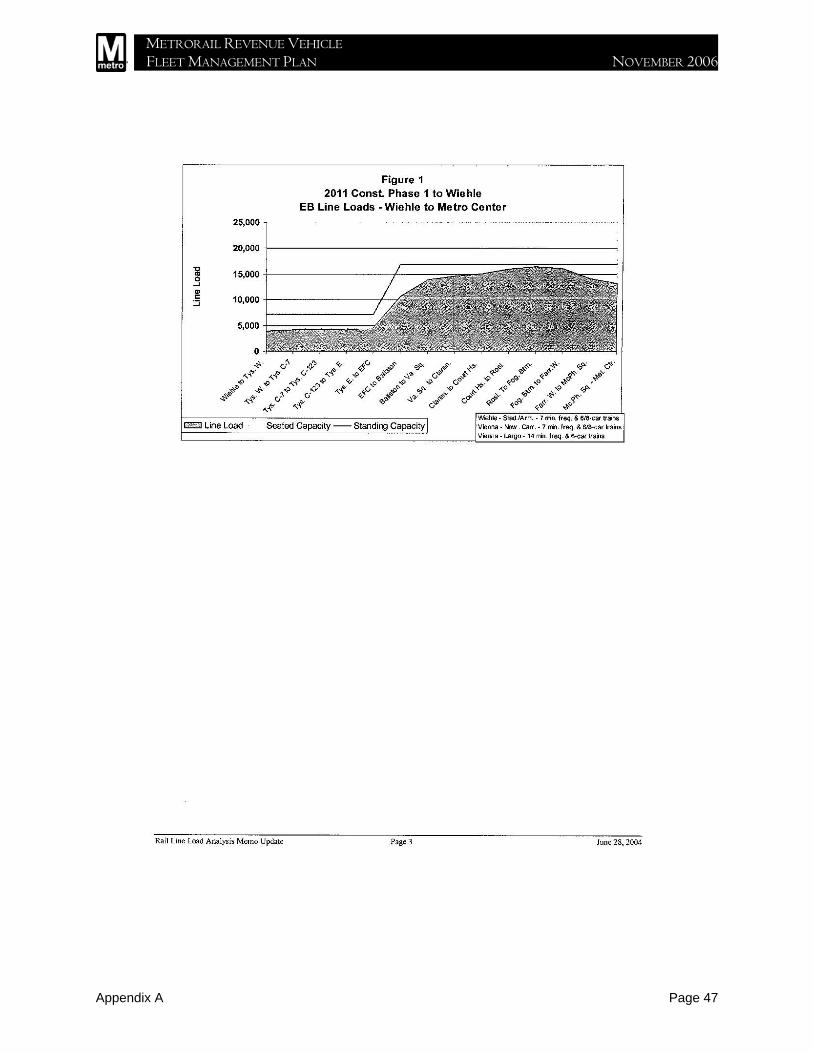
METRORAIL REVENUE VEHICLE FLEET MANAGEMENT PLAN NOVEMBER 2006
Appendix A Page 47
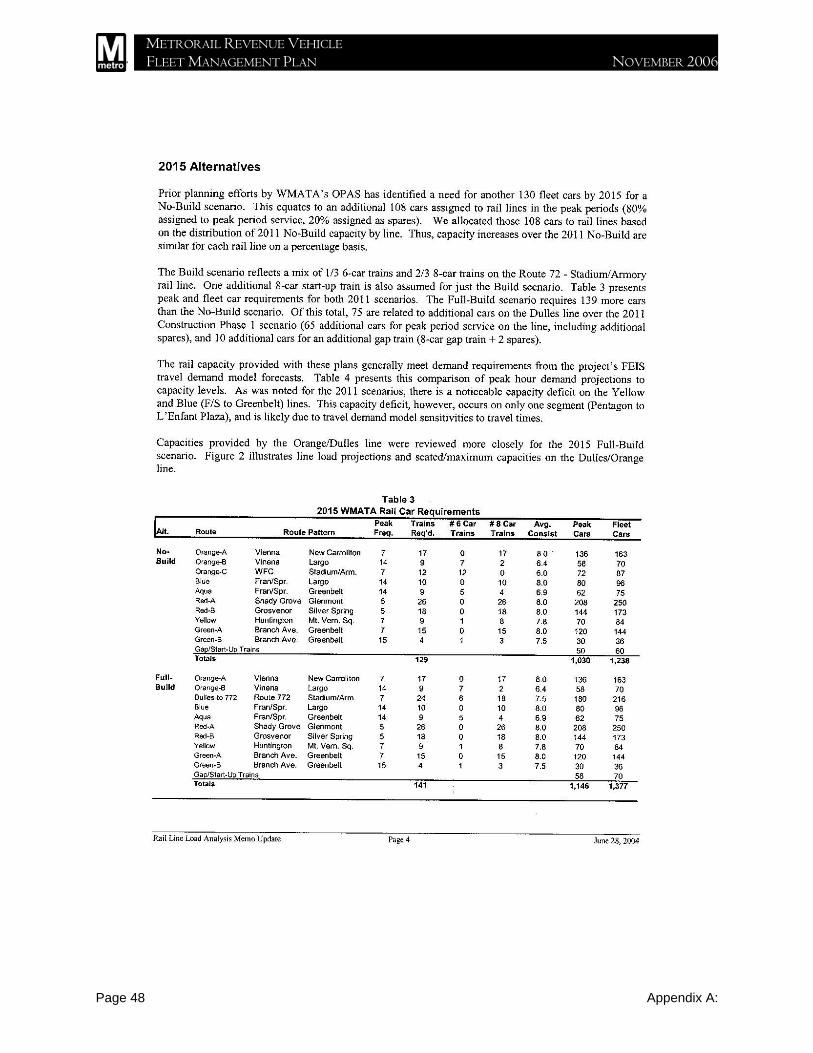
METRORAIL REVENUE VEHICLE FLEET MANAGEMENT PLAN NOVEMBER 2006
Page 48 Appendix A:
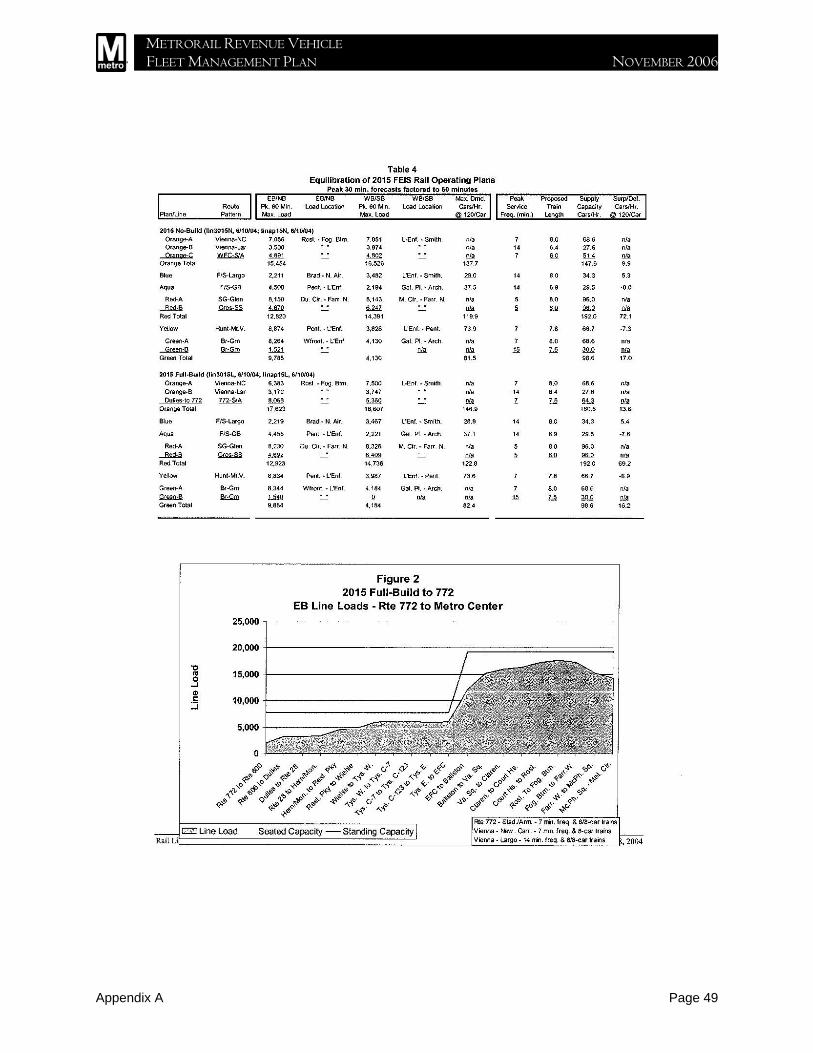
METRORAIL REVENUE VEHICLE FLEET MANAGEMENT PLAN NOVEMBER 2006
Appendix A Page 49

METRORAIL REVENUE VEHICLE FLEET MANAGEMENT PLAN NOVEMBER 2006
Page 50 Appendix A:

METRORAIL REVENUE VEHICLE FLEET MANAGEMENT PLAN NOVEMBER 2006
Appendix A Page 51
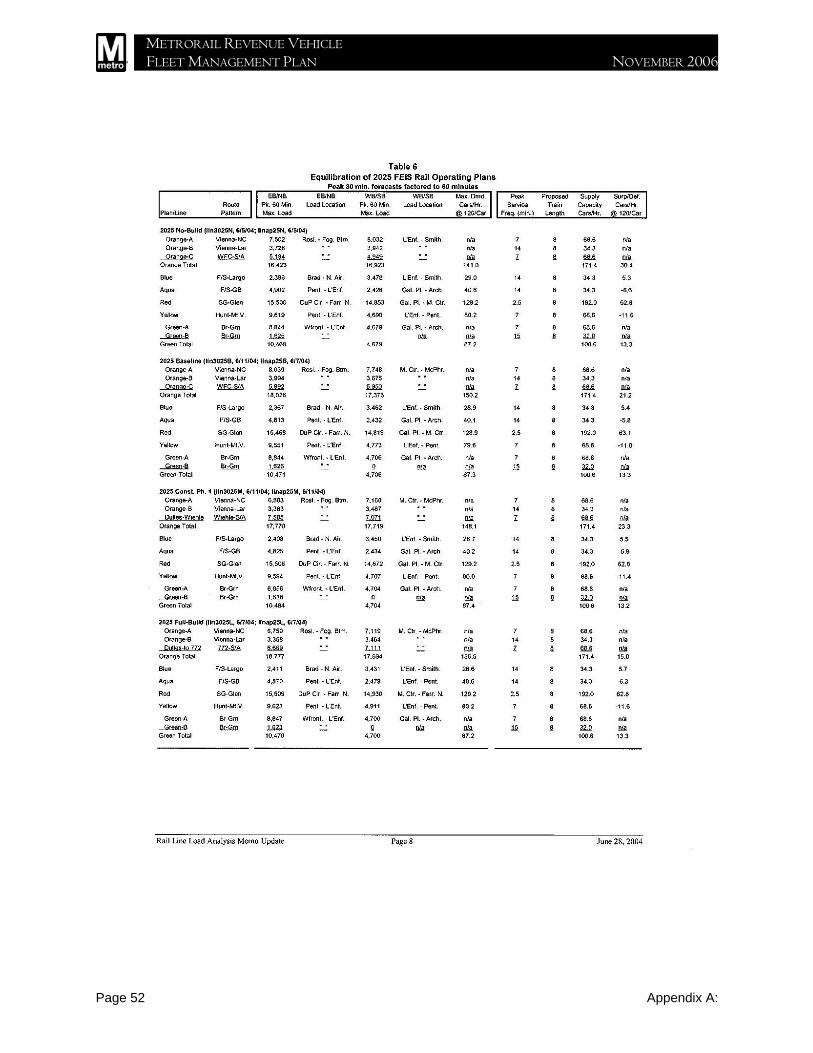
METRORAIL REVENUE VEHICLE FLEET MANAGEMENT PLAN NOVEMBER 2006
Page 52 Appendix A:

METRORAIL REVENUE VEHICLE FLEET MANAGEMENT PLAN NOVEMBER 2006
Appendix A Page 53

METRORAIL REVENUE VEHICLE FLEET MANAGEMENT PLAN NOVEMBER 2006
Page 54 Appendix A:

METRORAIL REVENUE VEHICLE FLEET MANAGEMENT PLAN NOVEMBER 2006
Appendix A Page 55

METRORAIL REVENUE VEHICLE FLEET MANAGEMENT PLAN NOVEMBER 2006
Page 56 Appendix A:
*** This page intentionally blank ***

METRORAIL REVENUE VEHICLE FLEET MANAGEMENT PLAN NOVEMBER 2006
Appendix B Page 57
APPENDIX B
GAPTRAINS
MAINTAINING SERVICE
RELIABILITY GAP TRAINS
This fleet’s missed trips seriously degrade customer service.Metrorail is a two-track system that does not permit easy recoveryfrom equipment failure. The weekday peak period headway is two tothree minutes on all lines in the downtown area. Maintaining thatshort headway interval is crucial to keeping passenger loads withinacceptable limits. The ripple effect of a peak period service delay caninconvenience many thousands of passengers on a line, whose tripsare lengthened, who experience crush loads, and who may beunable to board overcrowded trains. Crush loaded trains makeboarding and alighting difficult and thereby lengthen station dwelltimes, further exacerbating the delay in service. Minor serviceinterruptions can result in passenger loads that exceed the allowablestandard, and the feedback the Authority receives in the form ofpassenger complaints is immediate. Metrorail’s riders do not hesitateto let us know when the quality of service does not meet their highexpectations.
The average gap train use is about 346 incidents per month or about11 per day. Approximately 85 percent of all gap train deploymentsare to replace trains with mechanical problems. The remaining 15percent of gap train deployments are for non-mechanical problems,including:
• To relieve occasional unanticipated platform overcrowding.
• To maintain schedule under degraded operation conditions;especially those that sometimes remain even after amalfunctioning train has been replaced. As discussed in thesection titled “Train Failure Definitions and Actions”, in addition tohard failures, gap trains are used to replace trains that areexperiencing minor or intermittent malfunctions, but have notactually failed. In this case the gap train is used to avoid ananticipated failure and preserve passenger comfort andconvenience.
• To replace trains that have been vandalized or soiled by thepublic. A number of non-mechanical conditions are defined asfailures by WMATA. For example, a gap train may be used toreplace a train that has excessive graffiti or vandalism, or whichhas been soiled by a sick passenger and requires cleaningbefore it can be allowed to continue in service. This type of eventaccounts for about 42 percent of the non-mechanical uses.
METRORAIL REVENUE VEHICLE FLEET MANAGEMENT PLAN NOVEMBER 2006
Page 58 Appendix B:
It is conceivable that a gap train standing ready on one line could beused to fill a gap in service that has occurred on another line. Such ause is most likely to occur where two lines run on a common track: onthe southern end of the Blue-Yellow Line, the southern end of theYellow-Green Line, or the northern end of the Blue-Orange Line onthe eastern side of the city. It is also possible, but less likely, that gaptrains might be interlined between the Red and the Blue-OrangeLines via the C&A connector track, and between the Red and GreenLines via the B&E connector.
The schedule currently calls for a gap train at the end of most lines,staffed by an operator, and ready to be placed into service on shortnotice. This reserve ensures that no trips are missed when a train isremoved from service because of a mechanical failure or to aid in re-blocking when a line is delayed by other operational problems.
This Fleet Management Plan calls for 44 cars in FY07 to be used fordaily gap train service. This level will be increased to 56 cars (7 8-cartrains) by 2013.
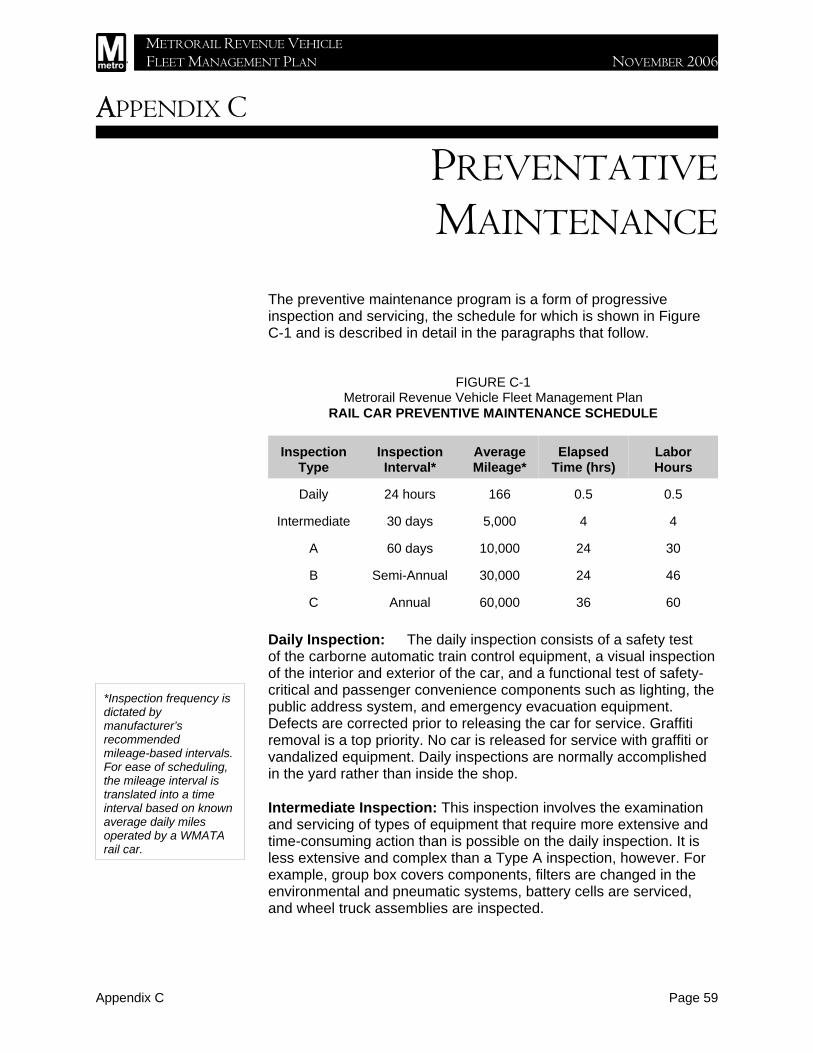
METRORAIL REVENUE VEHICLE FLEET MANAGEMENT PLAN NOVEMBER 2006
Appendix C Page 59
APPENDIX C
PREVENTATIVEMAINTENANCE
*Inspection frequency isdictated bymanufacturer’srecommendedmileage-based intervals.For ease of scheduling,the mileage interval istranslated into a timeinterval based on knownaverage daily milesoperated by a WMATArail car.
The preventive maintenance program is a form of progressiveinspection and servicing, the schedule for which is shown in FigureC-1 and is described in detail in the paragraphs that follow.
FIGURE C-1Metrorail Revenue Vehicle Fleet Management Plan
RAIL CAR PREVENTIVE MAINTENANCE SCHEDULE
InspectionType
InspectionInterval*
AverageMileage*
ElapsedTime (hrs)
LaborHours
Daily 24 hours 166 0.5 0.5
Intermediate 30 days 5,000 4 4
A 60 days 10,000 24 30
B Semi-Annual 30,000 24 46
C Annual 60,000 36 60
Daily Inspection: The daily inspection consists of a safety test of the carborne automatic train control equipment, a visual inspectionof the interior and exterior of the car, and a functional test of safety-critical and passenger convenience components such as lighting, thepublic address system, and emergency evacuation equipment.Defects are corrected prior to releasing the car for service. Graffitiremoval is a top priority. No car is released for service with graffiti orvandalized equipment. Daily inspections are normally accomplishedin the yard rather than inside the shop.
Intermediate Inspection: This inspection involves the examinationand servicing of types of equipment that require more extensive andtime-consuming action than is possible on the daily inspection. It isless extensive and complex than a Type A inspection, however. Forexample, group box covers components, filters are changed in theenvironmental and pneumatic systems, battery cells are serviced,and wheel truck assemblies are inspected.

METRORAIL REVENUE VEHICLE FLEET MANAGEMENT PLAN NOVEMBER 2006
Page 60 Appendix C:
Type A Inspection: Type A, B, and C inspections always take placewith the car inside the shop. Prior to technical inspection, under-carequipment is cleaned to enhance the quality of the inspection. Blowpits with compressed air hoses are provided at each service andinspection facility to blow carbon dust out of traction motors andgenerators. Blow pits also have hot water wash equipment to removegrease and dirt from mechanical components such as air conditioningcondenser coils, couplers and wheel trucks. Following the cleaningprocess, designated system components are inspected forserviceability and are functionally tested.
Type B Inspection: This includes all the requirements of the Type Ainspection. Additional tasks include but are not limited to a brakecaliper torque check, a detailed coupler and draft gear inspection,and other servicing and adjustments not required as frequently as inthe previous inspections.
Type C Inspection: This encompasses all the requirements of theprevious inspections, and adds routine overhaul of selected electricaland mechanical components. The equipment to be overhauled isremoved and replace in compliance with a schedule established bythe Office of Rail Maintenance Planning and Scheduling. Removedcomponents are sent to the overhaul shop.
Scheduled Component Overhaul: The scheduled overhaulprogram involves the pre-failure replacement of components basedon known and projected failure rates. Components are scheduled foroverhaul at regular intervals based on mileage or operating hourcriteria as appropriate. Overhauls are performed by the Brentwoodoverhaul shop or by outside vendors. Removal and replacement ofthe parts on the car performed by WMATA service and inspectionshop personnel. This includes replacement of worn or discoloredseat cushions, vinyl covers, replacement of worn carpet, andrefurbishment of exterior painted surfaces.
Scheduled Car Body Refurbishment: The carpeting and paintedsurfaces of the rail car body require periodic scheduled maintenanceor replacement to ensure that the car’s appearance is maintained.Keeping the carpet in good condition contributes to passenger safety.Carpeting is replaced every five years; requiring that 20 percent ofthe fleet be scheduled annually for carpet replacement. The exteriordecor panels at window level also require new paint and decals on afive year cycle. The painted fiberglass front end of the rail carrequires repair and painting every ten years. All of the car bodymaintenance programs are scheduled routinely to reduce the impacton peak service and to minimize staffing requirements.

METRORAIL REVENUE VEHICLE FLEET MANAGEMENT PLAN NOVEMBER 2006
Appendix C Page 61
Rail Cars Out of Service for Scheduled Maintenance:An average of 56 rail cars are needed to conduct the scheduledmaintenance program. Cars must be held out of service for thefollowing reasons:
Percent of CarsReason Out of Service Out of Service
Type A, B, and C Inspection . . . . . . . . . . . . . . . . . . . . . . . . 46% Intermediate Inspection . . . . . . . . . . . . . . . . . . . . . . . . . . . . 8%Carpet Replacement . . . . . . . . . . . . . . . . . . . . . . . . . . . . . . 15%Front-end & decor panel paint & decals . . . . . . . . . . . . . . . . 8%Major component replacement, sub-system
light overhaul, and modifications . . . . . . . . . . . . . . . . 23%TOTAL . . . . . . . . . . . . . . . . . . . . . . . . . . . . . . . . . . . . . . . 100%
Cleaning Program: This program consists of four levels of interiorand exterior cleaning, performed during off-peak and non-revenuehours as follows:
Level One: Daily trash and newspaper removal while the train is inservice. Car cleaning personnel are assigned to terminal stations toaccomplish this task. They also provide emergency spot cleaning, andalert the Terminal Supervisor to more extensive cleaning requirementsthat may warrant removing the train from service temporarily. Cars withserious graffiti or other vandalism are removed from serviceimmediately.
Exterior washing is accomplished daily by train operators taking theirtrains through the automatic car wash as they return to the yardfollowing passenger service.
Level Two: Performed daily in train storage yards. This task includestrash removal; spot cleaning of walls, windows, and seats; carpetvacuuming; and removal of minor graffiti. The Authority hasexperienced only a few incidents of major graffiti on rail cars, and itsremoval requires a major effort that is outside the scope of this routinecleaning program.
Level Three: This task is performed at 60 day intervals in conjunctionwith the Type A inspection. The interior of the car is thoroughlycleaned. The walls, ceiling, windows, light fixtures, and seats are handwashed with detergent, and the carpet is shampooed.
Level Four: This cleaning is performed bi-annually by an outsidecontractor. The unpainted aluminum body of WMATA’s Metrorail carsrequires professional cleaning to remove iron oxides and stains thtcannot be removed by normal car washing techniques.
PreventiveMaintenance
Program Monitoringand Support
WMATA’s Rail Car maintenance personnel are responsible for thedevelopment and revisions to the scheduled maintenance programs.All programs are reviewed annually for adequacy, applicability andnecessity. Manufacturer’s recommendations, historical data on railcar system performance and direct contact with car maintenanceemployees performing the work provide the foundation for evaluatingmaintenance program effectiveness.

METRORAIL REVENUE VEHICLE FLEET MANAGEMENT PLAN NOVEMBER 2006
Page 62 Appendix C:
The Quality Assurance Branch monitors fleet performance to ensurethat vehicle maintenance practices and procedures are effectivelysupporting the goal to provide the best in safe, reliable, cost effectiveand attractive rail transit services. Daily audits are performed withinthe various maintenance shops and on revenue lines to measure thequality of maintenance performed. The results of the audits arereported to the respective maintenance managers and the ChiefOperating Officer for the Department of Rail. Considerable time isspent auditing preventive maintenance in progress and immediatelyafter completion. Procedural problems and failure trends are reportedto the Vehicle Engineering Branch for further evaluation andcorrective action.
The current scheduled maintenance program is the result of over 30years of maintenance and operating experience. Rail car system andcomponent maintenance requirements change with age and usage.
Continuous monitoring of performance and physical evaluation ofequipment condition is required to determine the maintenancerequirements necessary to meet service and budgetary goals.
UNSCHEDULEDCORRECTIVE
MAINTENANCE
*For the purpose of thisdiscussion we assume onefailure per car, although thatis not always the case.
Equipment maintenance will be accomplished essentially at a fixedrate. It is not a question of whether a component will have to beserviced, overhauled, or replaced, but when. When preventivemaintenance is accomplished on a scheduled basis, plans can bemade to compensate for the absence of the equipment. Whenmaintenance is accomplished as a result of an in-service failure, onthe other hand, it is difficult (and more expensive) to compensate forits loss, and service quality suffers. Nonetheless, no matter how amaintenance organization tries to minimize in-service failure rates,the fact remains that unexpected failures will occur, even on newsystems and components. The objective of a preventive maintenanceprogram is to minimize the corrective maintenance requirement, andavoid the accompanying service quality degradation.
Failure Rate and Cars Out of Service: One hundred and fifty (150)component failures are reported to Metrorail car maintenance on anaverage weekday. Reported failures range from minor faults such asburned out light bulbs to major conditions such as shorted tractionmotors. A failure may occur while a car is in passenger service, or itmay be discovered during a daily inspection by a mechanic. Of the150 average daily component failures, 66 (44%) are repaired withouthaving to hold the car out of service.*

METRORAIL REVENUE VEHICLE FLEET MANAGEMENT PLAN NOVEMBER 2006
Appendix C Page 63
The remaining cars must be held out of service for the followingreasons:
Percent of CarsReason Out of Service Out of Service
System failure . . . . . . . . . . . . . . . . . . . . . . . . . . . . . . . . . . . . . . . . 93%Engineering evaluation
(repeat failure or unusual occurrence) . . . . . . . . . . . . . . . . . . 7%Total . . . . . . . . . . . . . . . . . . . . . . . . . . . . . . . . . . . . . . . . . . . . . . . 100%
Performance data are reviewed daily, weekly, and monthly for trends.When an unfavorable performance trend is detected, cars may beheld out of service for engineering evaluation. Sometimes systemscan be re-engineered to improve reliability.
Mean Time to Restore: The Mean Time to Restore (MTTR) variesgreatly as a result of the logistics involved in getting cars distributedamong the shops. The average labor time to complete a repair isthree hours. However, the elapsed time to return a car to revenueservice is six hours or more for major equipment problems. Thefollowing represents WMATA’s average daily turn-around time:
Percent of CarsTime Out of Service Out of Service
Less than one day . . . . . . . . . . . . . . . . . . . . . . . . . . . . . . . . . . . . . 52%Two Days . . . . . . . . . . . . . . . . . . . . . . . . . . . . . . . . . . . . . . . . . . . . 24%More than two days . . . . . . . . . . . . . . . . . . . . . . . . . . . . . . . . . . . . 24%Total . . . . . . . . . . . . . . . . . . . . . . . . . . . . . . . . . . . . . . . . . . . . . . . 100%
Sub-System Delays: Figure C-2 shows the delays of the majorindividual carborne sub-systems per million miles during the periodOctober 2001 to September 2006.
FIGURE C-2
SUB-SYSTEM DELAYS (Greater than 3 minutes)ATC Propulsion BRAKE DOOR HVAC TRUCK OTHER
Oct-05 4.9 0.2 5.8 6.2 0.0 0.2 3.5Nov-05 3.7 0.2 6.2 5.2 0.4 0.0 2.6Dec-05 4.8 0.7 5.5 5.5 0.0 0.4 2.7Jan-06 4.2 0.2 3.6 4.6 0.0 0.2 3.9Feb-06 3.2 1.0 5.5 4.3 0.2 0.0 4.5Mar-06 2.3 0.7 4.4 3.5 0.0 0.0 3.2Apr-06 3.5 0.9 4.5 3.1 0.0 0.0 1.6May-06 3.4 0.9 5.7 4.4 0.0 0.0 2.6Jun-06 2.9 0.2 5.6 5.6 0.2 0.2 2.7Jul-06 4.1 0.4 6.6 6.1 0.0 0.0 4.2Jul-06 3.7 0.4 4.4 7.2 0.4 0.0 5.3Aug-06 4.1 0.6 4.8 6.1 0.0 0.0 3.3Sep-06 3.7 0.5 5.2 5.2 0.1 0.1 3.3
Average % 20.6% 2.9% 28.7% 28.4% 0.6% 0.5% 18.4%Delays per million miles (DPMM) by Sub-System:
(Delays= All revenue service incidents that have >3 minutes train delay charged to CMNT)
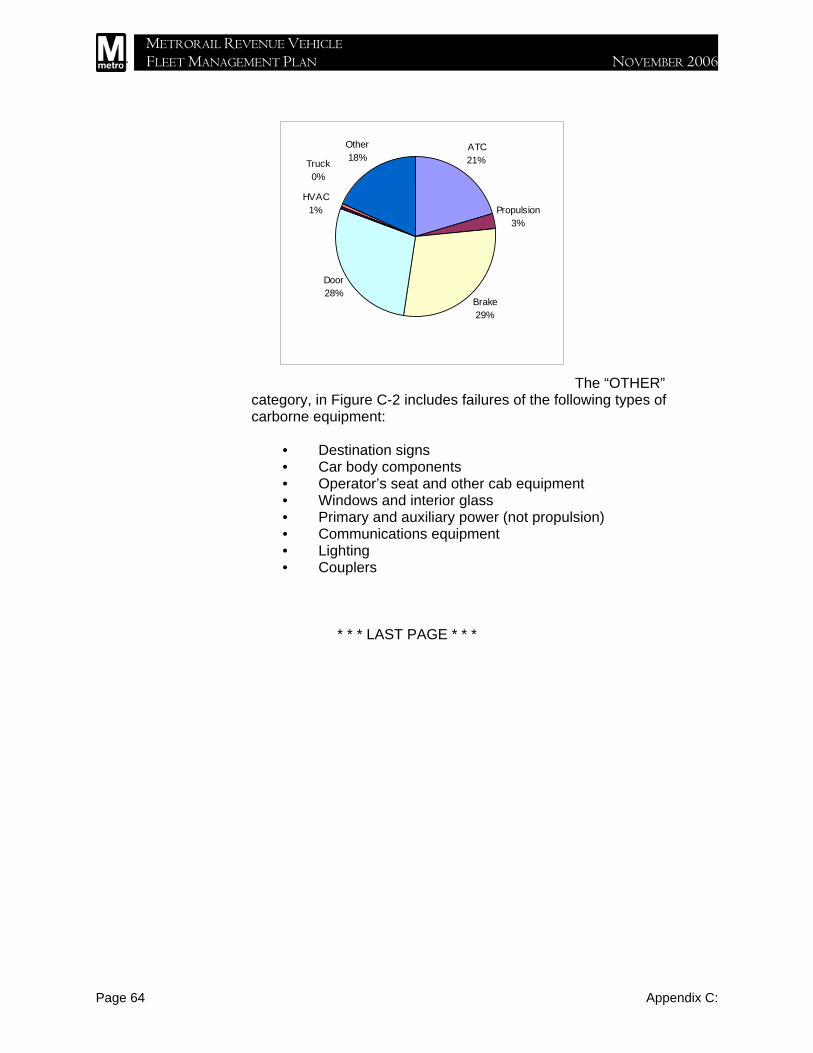
METRORAIL REVENUE VEHICLE FLEET MANAGEMENT PLAN NOVEMBER 2006
Page 64 Appendix C:
ATC21%
Propulsion3%
Brake29%
Door28%
HVAC1%
Truck0%
Other18%
The “OTHER”category, in Figure C-2 includes failures of the following types ofcarborne equipment:
• Destination signs• Car body components• Operator’s seat and other cab equipment• Windows and interior glass• Primary and auxiliary power (not propulsion)• Communications equipment• Lighting• Couplers
* * * LAST PAGE * * *