feasibility study for developing an energy park at hartsfield …€¦ · ·...
TRANSCRIPT
Feasibility Study for
Developing an Energy Park at
Hartsfield Jackson Atlanta International Airport
Final Report
Engineers for a Sustainable World – Georgia Institute of Technology
May 2012
2
Preface The city of Atlanta is striving to be one of the nation’s top tier sustainable cities.
Implementation of sustainable initiatives at Hartsfield Jackson Atlanta International Airport
(ATL) is essential to meet these goals. ATL seeks to fulfill the goals and objectives outlined in
the Sustainable Management Plan and the City of Atlanta’s Zero Waste Zone initiative.
As part of these initiatives, ATL has proposed the creation of a sustainable ‘Energy Park’
that would divert grease, compostables, yard trimmings, and FW from ATL and the Southern
Crescent community from landfills and turn them into energy and useful products. Determining
the best use of the products and the energy to supplement the Airport’s energy needs is the
desired end goal of this proposal. The designated location for the Energy Park is a 39 acre site
near the airport. The first stage of the design process is to evaluate the monetary, environmental,
and social costs and benefits of building the Energy Park.
As a first step towards the development of the proposed Energy Park, ATL has requested the
Engineers for a Sustainable World (ESW), a nonprofit student organization at the Georgia
Institute of Technology, to evaluate the costs and benefits of multiple technology options for the
Energy Park. Components of the Energy Park that are considered in this report include
anaerobic digestion (AD), enclosed composting, a combined heat and power plant, biofuel and
food crop production in greenhouses, and biodiesel generation. Also included is an analysis of
outsourcing some of these processes. An energy balance analysis has been performed for each
process to show the net energy gain of the proposed system.
We hope that this report sheds some light on different aspects of such a complex system and
helps the decision makers at ATL and the City of Atlanta in their sustainable initiatives and
strategic plans.
Soheil Shayegh
ESW-GT Vice President and Project Coordinator School of Industrial & Systems Engineering, Georgia Institute of Technology, Atlanta

3
Acknowledgements This research project would not have been possible without the support of many people.
ESW wishes to express its gratitude to its academic supervisor, Dr. Wayne Whiteman who was
abundantly helpful and offered invaluable assistance, support, and guidance. Deepest gratitude
is also due to Dr. Valerie Thomas, Dr. Steven Van Ginkel, and Dr. Spyros Pavlostathis from
Georgia Institute of Technology; without their knowledge and assistance, this study would not
have been successful.
Our thanks and appreciation also goes to Mr. Michael Cheyne, Director of Asset
Management and Sustainability, who trusted ESW-GT with such a significant project, and Ms.
Sharon Douglas for providing us with data and information from the airport. We also thank Ms.
Jean Pullen from the City of Atlanta who willingly introduced us to this project and the airport.

4 Table of Contents
Table of Contents Waste Management at ATL ............................................................................................. 9 1.
Introduction ............................................................................................................. 10 1.1.
Current Waste Statistics at ATL ............................................................................. 10 1.2.
Waste Collection Methods ...................................................................................... 11 1.3.
Disposal Procedures and Costs ............................................................................... 11 1.4.
Challenges associated with onsite waste management ........................................... 12 1.5.
Effective solutions for waste management at other airports ................................... 13 1.6.
Chicago Airports ............................................................................................................ 13
Los Angeles International Airport ................................................................................. 13
Oakland International Airport ........................................................................................ 13
London Gatwick Airport ................................................................................................ 14
Recommendations ................................................................................................... 14 1.7.
Training programs ......................................................................................................... 14
Self-Sorting Systems ..................................................................................................... 14
Waste Separation with Compostable Packaging ........................................................... 15
References ............................................................................................................... 16 1.8.
Anaerobic Digestion ....................................................................................................... 17 2.
Introduction ............................................................................................................. 18 2.1.
Anaerobic Digestion Parameters............................................................................. 19 2.2.
Maintaining anaerobic conditions .................................................................................. 19
pH value ......................................................................................................................... 19
Composition of the FW ................................................................................................. 19
Loading and CH4 production rates ................................................................................. 19
Solids retention time ...................................................................................................... 19
Operating Temperature .................................................................................................. 20
Classification of AD systems .................................................................................. 20 2.3.
Number of reactors used in series: ................................................................................. 21
Method of introducing the feed into the reactor: ........................................................... 21
Plug Flow Reactor (PFR)............................................................................................... 21
Single Stage ................................................................................................................... 22
5 Table of Contents
Double stage .................................................................................................................. 22
TPASBR and MTSASBR .............................................................................................. 23
CSBR ............................................................................................................................. 24
SEBAC .......................................................................................................................... 24
CSTR ............................................................................................................................. 24
DRANCO ...................................................................................................................... 25
UASB ............................................................................................................................. 25
Sizing and Methane Output .................................................................................... 26 2.4.
Conclusion .............................................................................................................. 26 2.5.
References ............................................................................................................... 28 2.6.
Combined Heat & Power ............................................................................................... 31 3.
Introduction ............................................................................................................. 32 3.1.
Reciprocating Engine CHP Systems ....................................................................... 33 3.2.
Gas Turbine CHP Systems...................................................................................... 35 3.3.
Cost Analysis .......................................................................................................... 36 3.4.
Stage 1: Qualifications ................................................................................................... 36
Stage 2: Feasibility Analysis at a High Level ................................................................ 36
Stage 3: Development .................................................................................................... 37
Stage 4: Procurement ..................................................................................................... 37
Stage 5: Operations and Maintenance ........................................................................... 37
Installation and O&M Costs ................................................................................... 37 3.5.
Appendix ................................................................................................................. 39 3.6.
References ............................................................................................................... 42 3.7.
Composting Systems ...................................................................................................... 43 4.
Introduction ............................................................................................................. 44 4.1.
Composting for ATL............................................................................................... 45 4.2.
Preprocessing ................................................................................................................. 45
Processing ...................................................................................................................... 48
Static Aerated Pile Composting .............................................................................. 48 4.3.
Equipment and Building Input ....................................................................................... 48
Labor Input .................................................................................................................... 48
6 Table of Contents
In-Vessel Composting ............................................................................................. 49 4.4.
Cost Considerations ....................................................................................................... 50
Cost Estimation .............................................................................................................. 50
Post Processing .............................................................................................................. 50
References ............................................................................................................... 51 4.5.
Offsite Composting ........................................................................................................ 52 5.
Introduction ............................................................................................................. 53 5.1.
Offsite Composting Options ................................................................................... 53 5.2.
Only paper waste is sent to the offsite composting facility ........................................... 54
All compostable waste could be redirected to an offsite composting facility ............... 54
Net Present Value (NPV) Analysis ......................................................................... 55 5.3.
Biofuel from Paper Waste .............................................................................................. 56 6.
Introduction ............................................................................................................. 57 6.1.
Hydrolysis, Fermentation, Distillation, Ethanol ..................................................... 57 6.2.
Gasification, Fischer-Tropsch synthesis, Diesel/Gasoline...................................... 59 6.3.
Conclusion .............................................................................................................. 60 6.4.
References ............................................................................................................... 61 6.5.
Greenhouse ..................................................................................................................... 62 7.
Introduction ............................................................................................................. 63 7.1.
Algae ....................................................................................................................... 63 7.2.
Cultivation of Algal Biomass ........................................................................................ 63
Algal Harvesting ............................................................................................................ 63
Cost analysis .................................................................................................................. 64
Conclusion ..................................................................................................................... 64
Camelina ................................................................................................................. 66 7.3.
Yield .............................................................................................................................. 66
Duckweed ............................................................................................................... 67 7.4.
Potential Uses ................................................................................................................ 67
Energy ............................................................................................................................ 67
Challenges ...................................................................................................................... 67
Yield .............................................................................................................................. 68
7 Table of Contents
Hydroponica ............................................................................................................ 69 7.5.
How it works .................................................................................................................. 69
Hydroponics Cost Efficiency ......................................................................................... 70
Density ........................................................................................................................... 70
Crop Harvest per Year ................................................................................................... 70
Temperature ................................................................................................................... 71
Light ............................................................................................................................... 71
Diseases ......................................................................................................................... 72
Other factors .................................................................................................................. 72
Vegetable Analysis ........................................................................................................ 72
Conclusion and Summary .............................................................................................. 76
Aquaponics ............................................................................................................. 78 7.6.
References ............................................................................................................... 81 7.7.
Biodiesel from Cooking Oil Waste ................................................................................ 83 8.
Introduction ............................................................................................................. 84 8.1.
Types of biodiesel ................................................................................................... 84 8.2.
Sources of biodiesel ................................................................................................ 84 8.3.
Applications of biodiesel ........................................................................................ 84 8.4.
Advantages of biodiesel .......................................................................................... 84 8.5.
Biodiesel Production ............................................................................................... 85 8.6.
Batch Process ................................................................................................................. 85
Ultrasonication ............................................................................................................... 85
Cost Comparison of Processes ................................................................................ 87 8.7.
Batch Process ................................................................................................................. 87
Continuous Process ........................................................................................................ 87
Ultrasonication ............................................................................................................... 88
References ............................................................................................................... 89 8.8.
Energy Analysis ............................................................................................................. 90 9.
Introduction ............................................................................................................. 91 9.1.
Waste Characterization ........................................................................................... 91 9.2.
Description of Proposed Energy Park ..................................................................... 92 9.3.
8 Table of Contents
Energy Production Train ......................................................................................... 93 9.4.
Gas Turbine CHP System .............................................................................................. 95
Reciprocating Engine CHP System ............................................................................... 96
Heat and Power Requirements of the Energy Park ................................................. 98 9.5.
Biodiesel Conversion Unit ...................................................................................... 99 9.6.
Waste-to-Energy Comparison ............................................................................... 100 9.7.
Conclusions ........................................................................................................... 100 9.8.
References ............................................................................................................. 101 9.9.
Conclusion & Recommendations ............................................................................. 102 10.
Upstream waste management programs ............................................................ 103 10.1.
Waste Treatment at the Energy Park ................................................................. 103 10.2.
Collective Treatment ................................................................................................... 103
Chain Treatment .......................................................................................................... 104
9 Waste Management at ATL
Waste Management at ATL 1.
Team members:
Inthirai Somasuntharam PhD student, Biomedical Engineering
Anna Mazzolini 2nd
year undergraduate student, Nuclear Engineering
Haley Cole 1st year undergraduate student, Industrial Engineering
Laurynas Bileisis 2nd
year undergraduate student, Mechanical Engineering
10 Waste Management at ATL
Introduction 1.1.As the first step towards proposing a sustainable approach for waste management at the
airport, this chapter deals with analyzing the input waste as well as understanding how waste is
handled at the airport which includes collection, separation, and processing activities. This
chapter extracts and summarizes useful information from reports provided to our organization by
the Airport on waste characterization, current waste management practices, and waste
disposal/recycling costs. It also addresses best sustainable waste management practices and
efforts from airports around the world towards accomplishing similar goals to that of ATL.
Finally, this section includes recommendations to the airport that contributes to sustainable waste
management initiatives. These recommendations closely follow the waste hierarchy of reduce,
reuse, recycle, energy recovery, and disposal.
Current Waste Statistics at ATL 1.2.ATL generates an estimated 25,500 tons of waste per year [1], averaging about 70 tons a
day. The majority of the solid waste generated is municipal solid waste (MSW), which consists
of ordinary garbage, including recyclable materials. Error! Not a valid bookmark self-
reference. shows the categories of MSW in 2005 and their composition. In 2005, food waste
(FW) accounted for 28.4% of the solid waste coming from the airport; recyclables accounted for
41%, with the largest component being paper (22%). Non-recyclables (Plastics, Rubber, Wood,
etc.) accounted for 31%. Although the FW% is significant, a large component of the FW is
melted ice and leftover beverages. It is unclear exactly what percentage of FW is actually water.
Yard trimmings are composted onsite, although they are minimal because of the impervious
surfaces at the airport. The organic fraction of MSW (OFMSW) accounts for about 60% of total
waste.

11 Waste Management at ATL
In 2005, approximately 7% of MSW (majority being paper and cardboard) was recycled
from about 40% recyclables. In 2011, ATL recycled over 1,400 tons of office paper and
cardboard, which accounted for about 95% of the recycled materials last year, with plastic
materials accounting for 4% and aluminum 1%. Similar to 2005, the percent recycled was 6.2%.
In addition, ATL generated around 60,000 gallons of cooking grease in 2005. However,
recent data from 2010 suggests that only 30,000 gallons were recycled from concessions and
picked up by a vendor. From the recycled cooking grease, 22,700 gallons were used for biofuel
production while about 7,300 were determined not suitable for biofuel production.
Currently, waste from the restaurants is combined with waste from the rest of the airport.
Any international waste is handled in Concourse E and is treated separately. Construction and
demolition waste is also handled independently, usually by a contractor.
Waste Collection Methods 1.3.Waste generated inside the airport along the concourses is collected multiple times per hour.
Bags of waste are collected from each gate's electric compactors. Waste from these electric
compactors is collected in larger carts, called "gooses". When full, airport staff carries the
compressed waste to large trash compactors located outside of each concourse. These are later
emptied and collected by Waste Pro, a company contracted by the airport through Atlanta
Airlines Terminal Corporation (AATC) to sort the waste and manage recyclables.
Waste originating from the aircraft cabins is put in dumpsters and is not compacted. This
waste consists primarily of newspapers, food containers, FW, magazines, and aluminum cans.
Cardboard is collected in different compactors on concourses A, D, and E and is processed
separately and handled by WastePro.
Food Waste 28%
Other Nonrecyclables 31%
Other Recyclables 2%
Cardboard 8%
Paper 22%
Recyclable Plastic 5% Glass
3%
Metal 2%
Recylables 41%
Figure 1. Categories of waste as percent composition of MSW (From table 2.6 [1])
12 Waste Management at ATL
The compactors are emptied on a routine schedule, once per evening, generally between
1:00AM and 5:00AM. In total, there are approximately 10 trash compactors, 5 cardboard
compactors (each ranging from 30-34 cubic feet), and 40 dumpsters (each ranging from 4-8
cubic feet) that are serviced by Waste Pro at varying intervals throughout the week.
Disposal Procedures and Costs 1.4.MSW disposal costs include landfill tipping fees, collection, and hauling costs. When
transporting the waste, hauling costs can be reduced by utilizing transfer stations, which use
large capacity trucks for more efficient transportation to remote landfills. There is a transfer
station located within five miles of the airport which would minimize increased hauling costs
should landfills near the airport reach full capacity.
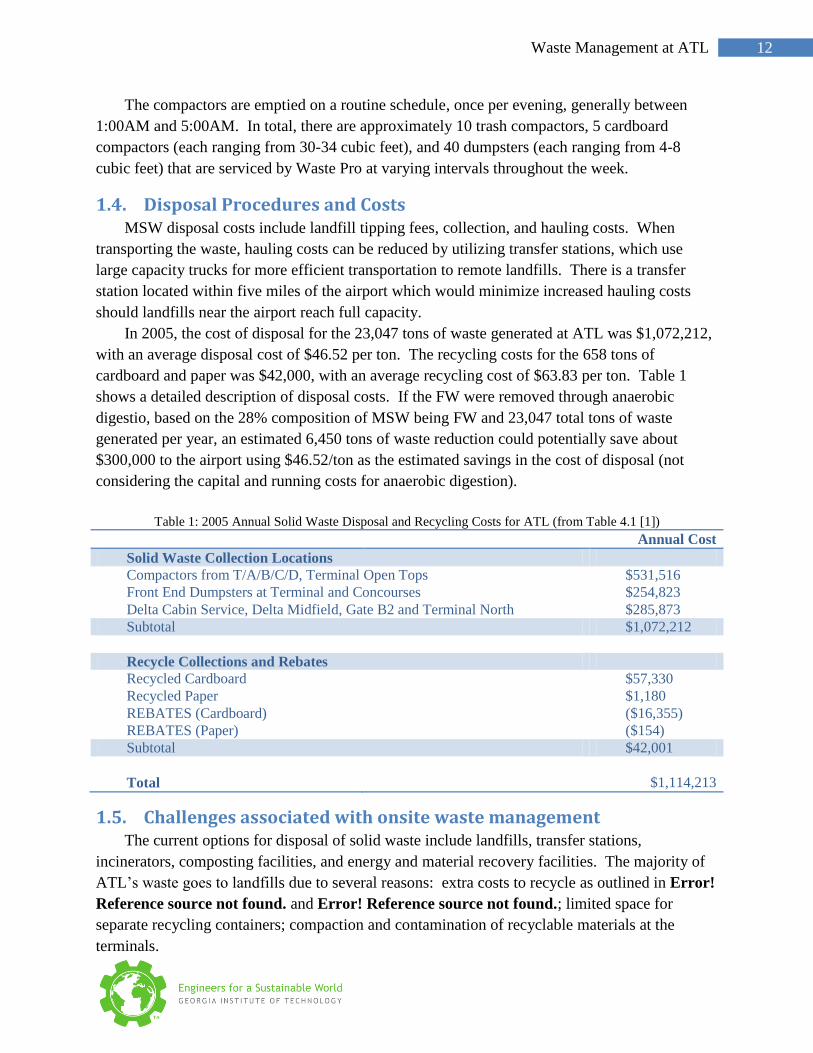
In 2005, the cost of disposal for the 23,047 tons of waste generated at ATL was $1,072,212,
with an average disposal cost of $46.52 per ton. The recycling costs for the 658 tons of
cardboard and paper was $42,000, with an average recycling cost of $63.83 per ton. Table 1
shows a detailed description of disposal costs. If the FW were removed through anaerobic
digestio, based on the 28% composition of MSW being FW and 23,047 total tons of waste
generated per year, an estimated 6,450 tons of waste reduction could potentially save about
$300,000 to the airport using $46.52/ton as the estimated savings in the cost of disposal (not
considering the capital and running costs for anaerobic digestion).
Table 1: 2005 Annual Solid Waste Disposal and Recycling Costs for ATL (from Table 4.1 [1])
Annual Cost
Solid Waste Collection Locations
Compactors from T/A/B/C/D, Terminal Open Tops $531,516
Front End Dumpsters at Terminal and Concourses $254,823
Delta Cabin Service, Delta Midfield, Gate B2 and Terminal North $285,873
Subtotal $1,072,212
Recycle Collections and Rebates
Recycled Cardboard $57,330
Recycled Paper $1,180
REBATES (Cardboard) ($16,355)
REBATES (Paper) ($154)
Subtotal $42,001
Total $1,114,213
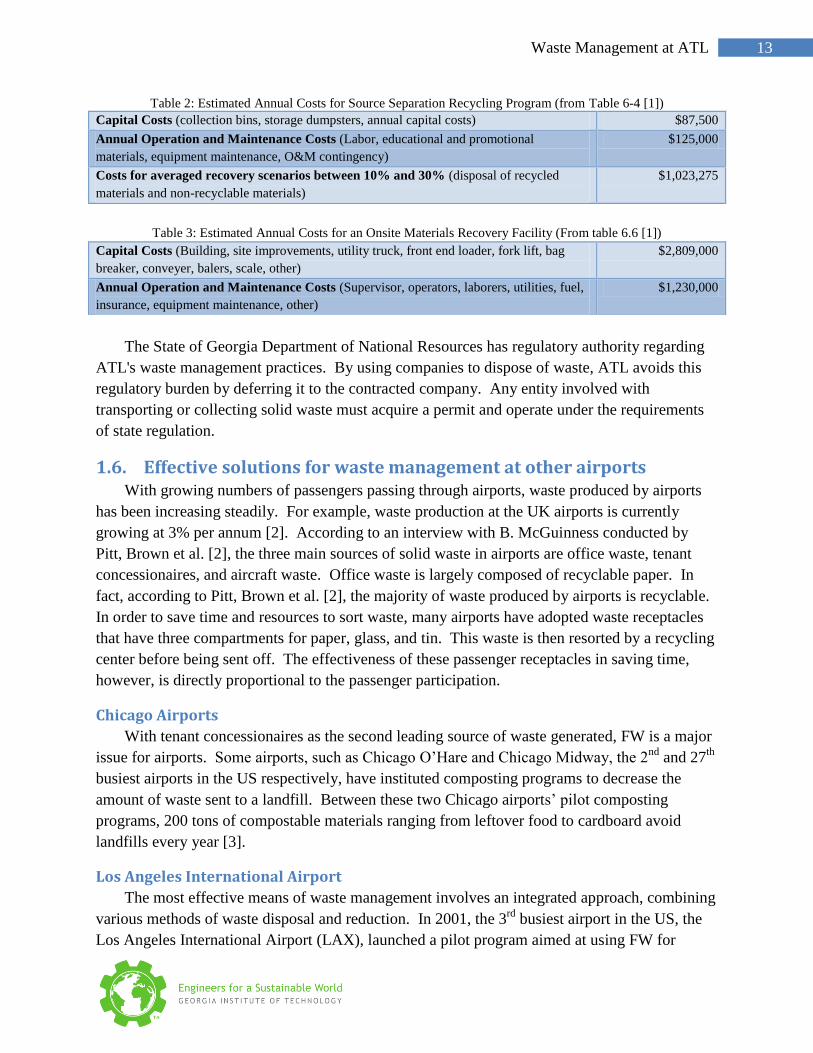
Challenges associated with onsite waste management 1.5.The current options for disposal of solid waste include landfills, transfer stations,
incinerators, composting facilities, and energy and material recovery facilities. The majority of
ATL’s waste goes to landfills due to several reasons: extra costs to recycle as outlined in Error!
Reference source not found. and Error! Reference source not found.; limited space for
separate recycling containers; compaction and contamination of recyclable materials at the
terminals.
13 Waste Management at ATL
Table 2: Estimated Annual Costs for Source Separation Recycling Program (from Table 6-4 [1])
Capital Costs (collection bins, storage dumpsters, annual capital costs) $87,500
Annual Operation and Maintenance Costs (Labor, educational and promotional
materials, equipment maintenance, O&M contingency)
$125,000
Costs for averaged recovery scenarios between 10% and 30% (disposal of recycled
materials and non-recyclable materials)
$1,023,275
Table 3: Estimated Annual Costs for an Onsite Materials Recovery Facility (From table 6.6 [1])
The State of Georgia Department of National Resources has regulatory authority regarding
ATL's waste management practices. By using companies to dispose of waste, ATL avoids this
regulatory burden by deferring it to the contracted company. Any entity involved with
transporting or collecting solid waste must acquire a permit and operate under the requirements
of state regulation.
Effective solutions for waste management at other airports 1.6.With growing numbers of passengers passing through airports, waste produced by airports
has been increasing steadily. For example, waste production at the UK airports is currently
growing at 3% per annum [2]. According to an interview with B. McGuinness conducted by
Pitt, Brown et al. [2], the three main sources of solid waste in airports are office waste, tenant
concessionaires, and aircraft waste. Office waste is largely composed of recyclable paper. In
fact, according to Pitt, Brown et al. [2], the majority of waste produced by airports is recyclable.
In order to save time and resources to sort waste, many airports have adopted waste receptacles
that have three compartments for paper, glass, and tin. This waste is then resorted by a recycling
center before being sent off. The effectiveness of these passenger receptacles in saving time,
however, is directly proportional to the passenger participation.
Chicago Airports
With tenant concessionaires as the second leading source of waste generated, FW is a major
issue for airports. Some airports, such as Chicago O’Hare and Chicago Midway, the 2nd
and 27th
busiest airports in the US respectively, have instituted composting programs to decrease the
amount of waste sent to a landfill. Between these two Chicago airports’ pilot composting
programs, 200 tons of compostable materials ranging from leftover food to cardboard avoid
landfills every year [3].
Los Angeles International Airport
The most effective means of waste management involves an integrated approach, combining
various methods of waste disposal and reduction. In 2001, the 3rd
busiest airport in the US, the
Los Angeles International Airport (LAX), launched a pilot program aimed at using FW for
Capital Costs (Building, site improvements, utility truck, front end loader, fork lift, bag
breaker, conveyer, balers, scale, other)
$2,809,000
Annual Operation and Maintenance Costs (Supervisor, operators, laborers, utilities, fuel,
insurance, equipment maintenance, other)
$1,230,000
14 Waste Management at ATL
electricity generation. The plan incorporated digesting waste to produce methane gas that could
be converted to electricity. Additionally, wastewater from the process would serve as irrigation,
and residual biosolids would be used to fertilize soil [4]. The pilot study found that digesting the
FW and disposing of residual biosolids was economically productive due to the high value of the
gas produced by the digestion. The pilot program can therefore be considered a success, leading
to economic gains for the airport [5].
Oakland International Airport
Since 2004, Oakland International Airport has incorporated a program involving the
composting of pre-consumer FW (coffee grounds, trimmings, etc) generated during the
preparation of food at various concessions throughout the airport. The FW collected is
transported to a local composting facility, and following several months of processing, converted
to a high-nutrient fertilizer. This, in turn, is then sold to local golf courses, wineries, and organic
growers. The City of Oakland also passed an ordinance prohibiting the use of polystyrene
containers in food service. The Oakland Airport is using this as an initiative to develop plans for
the collection of post-consumer waste as compostable material in the future [6].
London Gatwick Airport
London Gatwick Airport, the UK’s 2nd
busiest airport, developed an environmental policy
that involves the periodic review and auditing of a number of action plans relating to the
management and disposal of third party waste. These plans were implemented to help the airport
meet its long term goals of 70% recycling, zero waste diversion to landfills, and reducing waste
production per passenger. As stated in their most recent waste action plan for 2009-2011 [7], in
order to meet such long term goals, the Gatwick airport officials hope to impose measures that
encourage segregating biodegradable waste to divert and treat through anaerobic digestion or
even in-vessel composting. This waste action plan, which is designed to deal with short to
midterm length goals, was created with the idea of gradually fostering the airport towards the
accomplishment of their long-term environmental policy goals. Some of these measures include
simple measures such as development of guidelines on disposal and airport waste management
procedures, implementing and conducing annual reviews to assure sustainable waste
management practices, and deploying terminal bins for customer self-sorting by certain projected
deadlines.
Recommendations 1.7.
Training programs
Tenants within an airport facility can include airlines offices, rental car agencies, restaurants,
newsstands, and gift stores. Beginning a tenant education program can be an essential first step
to reducing the amount of waste and increasing recycling at the airport. Providing tenants with
the necessary materials needed for a successful recycling program and continually delivering
training to employees and managers can be instrumental in fostering a productive recycling
mindset at the airport.
15 Waste Management at ATL
In conjunction, the airport can implement a biannual program aimed at helping tenants to
dispose of some of their more bulky materials safely and effectively. The tenants can use these
events to break apart these bulky materials into disposable wood, metal, and plastics for
recycling. These events would only happen twice a year but would facilitate the idea that the
airport is encouraging more effective means of reducing waste at the airport.
Self-Sorting Systems
The airport has two main options to deal with sorting recyclables. The first is a system that
would promote sorting by the consumers, tenants, and airport staff. In Error! Reference source
not found., the estimated costs of a source separation system are outlined. Because of the large
amounts of recyclable materials coming out of the central passenger terminal, introducing
separate waste containers to encourage self-sorting could save the airport time and money in the
long run. No extra personnel would be required to pick up the sorted waste, as the airport
already employs workers to pick up trash from the terminals.
A second option would be an onsite materials recovery facility. Waste would be taken to
such a facility for sorting by workers. Unlike the source separation discussed above, an onsite
materials recovery facility would require a separate building and various equipment, thus
incurring greater capital costs, as shown in Error! Reference source not found.. In comparing
both options, the source separation system, if carried out properly, would be cost-efficient to the
Airport in the long run.
Waste Separation with Compostable Packaging
An ATL pilot program started in January of 2012 implemented a new process in which the
restaurants in the airport disposed of FW independently of other waste. This program
successfully separates FW from other concourse waste at its origination, allowing separation
from the source of waste rather than post-disposal sorting to extract the food components.
This pilot, if continued and implemented with compostable packaging, allows the back of
the house waste from the airport to be easily separated from other waste, facilitating the fueling
of any potential onsite anaerobic digesters or composting. Compostable packaging would create
a convenient opportunity to dispose of all compostable food separately, without the consumers
needing to separate their remaining food from its packaging. If the restaurants and kiosks were
required to use only compostable packaging, the airport could provide separate FW containers
that would provide an easy opportunity for self-sorted compostable materials to be collected and
sent directly to the anaerobic digesters.
16 Waste Management at ATL
References 1.8.1. Camp Dresser & McKee (CDM). 2006 Waste Characterization Report. Tech. Final ed. Atlanta,
Georgia. Print.
2. Pitt, M., A. Brown, et al. "Waste management at airports." Facilities. 2002. 20 (5/6): 198-207
3. Hilkevitch, Jon. "Green Initiatives Cleared for Takeoff at O'Hare, Midway Airports." Chicago Tribune.
01 Nov. 2011. Web. 15 Mar. 2012. <http://articles.chicagotribune.com/2011-11-01/news/ct-met-green-
airports-1101-20111101_1_alternative-fuels-solar-power-composting-program>.
4. Onorato, Danielle. "Los Angeles Airport Creates Energy from FW." Waste360. 01 July 2001. Web. 30
Mar. 2012. <http://waste360.com/mag/waste_los_angeles_airport>.
5. Hernandez, Gerald, Redd Kenneth, Wendy Wert, Min An, and Tim Haug. "Los Angeles Digesters
Produce Energy from Airport Food Residuals." BioCycle Jan. 2002. Print.
6. Composting at Oakland International Airport. Issue brief no. 17. Airports Council International, July
2007. Web. 15 Mar. 2012.
<http://www.aci.aero/aci/aci/file/ACI_Priorities/Environment/case%20study%20OAK_Food%20comp
osting.pdf>.
7. Waste Management Action Plan. Tech. London Gatwick Airport, 2009. Web.
<http://www.gatwickairport.com/Documents/business_and_community/Misc/Waste_Action_Plan_Fina
l.pdf>.
17 Anaerobic Digestion
Anaerobic Digestion 2.
Team members:
Angela Phung 2nd
year undergraduate student, Environmental Engineering
Jean Mullaney 3rd
year undergraduate student, Environmental Engineering
Gabe Park 1st year undergraduate student, Mechanical Engineering
18 Anaerobic Digestion
Introduction 2.1.Anaerobic digestion (AD) is a biological process that occurs in an enclosed reactor without
oxygen [19]. It occurs naturally in anaerobic niches such as marshes, sediments, wetlands, and
the digestive tracts of ruminants and certain species of insects [4]. Generally four main reactions
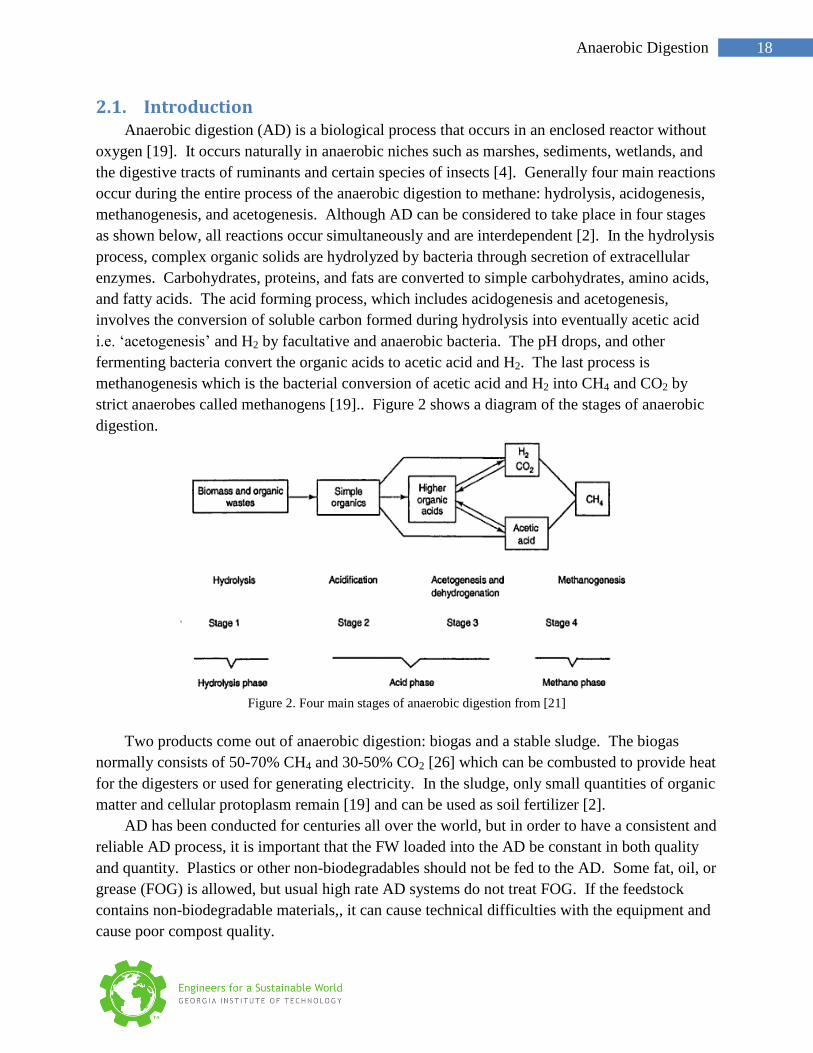
occur during the entire process of the anaerobic digestion to methane: hydrolysis, acidogenesis,
methanogenesis, and acetogenesis. Although AD can be considered to take place in four stages
as shown below, all reactions occur simultaneously and are interdependent [2]. In the hydrolysis
process, complex organic solids are hydrolyzed by bacteria through secretion of extracellular
enzymes. Carbohydrates, proteins, and fats are converted to simple carbohydrates, amino acids,
and fatty acids. The acid forming process, which includes acidogenesis and acetogenesis,
involves the conversion of soluble carbon formed during hydrolysis into eventually acetic acid
i.e. ‘acetogenesis’ and H2 by facultative and anaerobic bacteria. The pH drops, and other
fermenting bacteria convert the organic acids to acetic acid and H2. The last process is
methanogenesis which is the bacterial conversion of acetic acid and H2 into CH4 and CO2 by
strict anaerobes called methanogens [19].. Figure 2 shows a diagram of the stages of anaerobic
digestion.
Figure 2. Four main stages of anaerobic digestion from [21]
Two products come out of anaerobic digestion: biogas and a stable sludge. The biogas
normally consists of 50-70% CH4 and 30-50% CO2 [26] which can be combusted to provide heat
for the digesters or used for generating electricity. In the sludge, only small quantities of organic
matter and cellular protoplasm remain [19] and can be used as soil fertilizer [2].
AD has been conducted for centuries all over the world, but in order to have a consistent and
reliable AD process, it is important that the FW loaded into the AD be constant in both quality
and quantity. Plastics or other non-biodegradables should not be fed to the AD. Some fat, oil, or
grease (FOG) is allowed, but usual high rate AD systems do not treat FOG. If the feedstock
contains non-biodegradable materials,, it can cause technical difficulties with the equipment and
cause poor compost quality.
19 Anaerobic Digestion
Anaerobic Digestion Parameters 2.2.There are many important parameters that affect the anaerobic digestion of FWs.
Maintaining anaerobic conditions
One of the parameters includes maintaining anaerobic conditions so that methanogenesis can
occur. Anaerobic conditions are easily maintained since bacteria readily consume all the
oxygen. Reactors must be well sealed which allows the biogas to be collected for energy
conversion and eliminates odor and methane emissions during the AD process [4].
pH value
The pH value of the reacting material is a pivotal factor in the AD of FW. The importance
of the pH is due to the fact that methanogenic bacteria are very sensitive to low pH [2].
Alkalinity or pH buffering capacity is important to resist changes in pH. High carbohydrate
containing wastes will generate a low pH while protein containing wastes will raise the pH as the
ammonia released from protein degradation will help buffer against pH changes.
Composition of the FW
It is important to know if the composition of FW is variable throughout the year. As stated
above, a high carbohydrate containing waste may need added alkalinity to maintain a constant
pH. If the moisture content is high and pure FW is used, traditional AD technologies can be
used. There are new technologies that digest MSW including all biodegradable material such as
paper. This may be the best option if no sorting is desired or if the paper is contaminated with
FW. Reactors that digest FW and MSW are discussed below.
Loading and CH4 production rates
Organic loading rate (OLR) is a measure of the biological conversion capacity of the AD
system and is stoichiometrically related to the CH4 production rate. Typical AD can treat 10-20
kg of COD/m3 of reactor volume, where COD is the chemical oxygen demand - a measure of
how much oxygen is needed to combust or release the energy in the waste. Theoretically, 1 kg
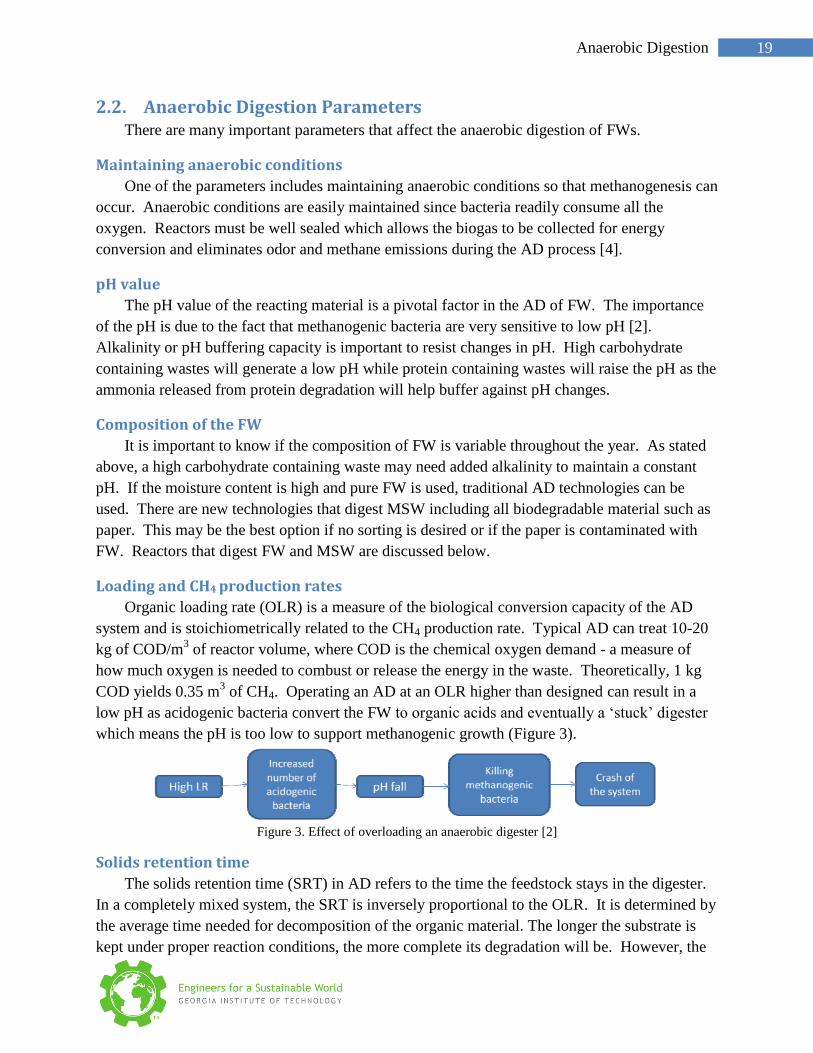
COD yields 0.35 m3 of CH4. Operating an AD at an OLR higher than designed can result in a
low pH as acidogenic bacteria convert the FW to organic acids and eventually a ‘stuck’ digester
which means the pH is too low to support methanogenic growth (Figure 3).
Figure 3. Effect of overloading an anaerobic digester [2]
Solids retention time
The solids retention time (SRT) in AD refers to the time the feedstock stays in the digester.
In a completely mixed system, the SRT is inversely proportional to the OLR. It is determined by
the average time needed for decomposition of the organic material. The longer the substrate is
kept under proper reaction conditions, the more complete its degradation will be. However, the
20 Anaerobic Digestion
rate of the reaction decreases with longer residence times, indicating that there is an optimal
retention time that will achieve the benefits of digestion in a cost effective way.
DeN
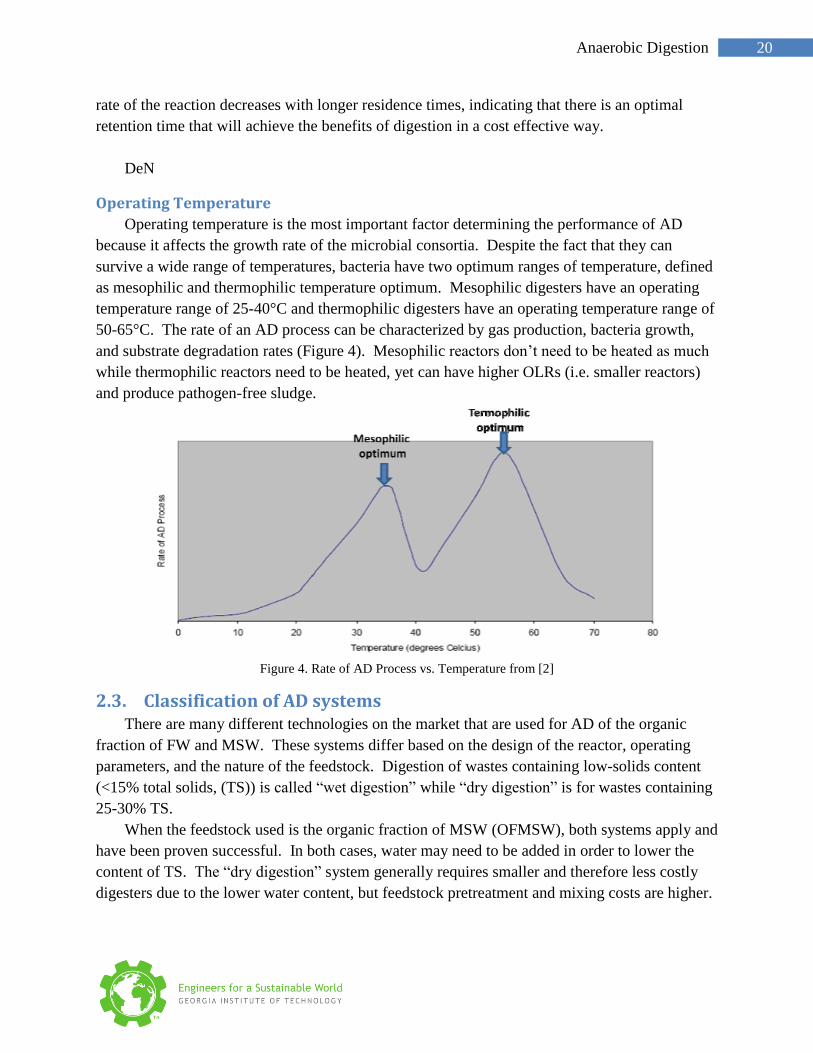
Operating Temperature
Operating temperature is the most important factor determining the performance of AD
because it affects the growth rate of the microbial consortia. Despite the fact that they can
survive a wide range of temperatures, bacteria have two optimum ranges of temperature, defined
as mesophilic and thermophilic temperature optimum. Mesophilic digesters have an operating
temperature range of 25-40°C and thermophilic digesters have an operating temperature range of
50-65°C. The rate of an AD process can be characterized by gas production, bacteria growth,
and substrate degradation rates (Figure 4). Mesophilic reactors don’t need to be heated as much
while thermophilic reactors need to be heated, yet can have higher OLRs (i.e. smaller reactors)
and produce pathogen-free sludge.
Figure 4. Rate of AD Process vs. Temperature from [2]
Classification of AD systems 2.3.There are many different technologies on the market that are used for AD of the organic
fraction of FW and MSW. These systems differ based on the design of the reactor, operating
parameters, and the nature of the feedstock. Digestion of wastes containing low-solids content
(<15% total solids, (TS)) is called “wet digestion” while “dry digestion” is for wastes containing
25-30% TS.
When the feedstock used is the organic fraction of MSW (OFMSW), both systems apply and
have been proven successful. In both cases, water may need to be added in order to lower the
content of TS. The “dry digestion” system generally requires smaller and therefore less costly
digesters due to the lower water content, but feedstock pretreatment and mixing costs are higher.
21 Anaerobic Digestion
Number of reactors used in series:
Single stage digester: All reactions take place in one reactor and environmental
conditions are maintained at levels that suit all types of bacteria. Therefore, operating
conditions for all stages are not optimal.
Multi-stage digesters physically separate the hydrolysis and acidogenesis reactions in
different reactor vessels. These systems can be more efficient since conditions can be
optimized for each reaction.
Method of introducing the feed into the reactor:
Continuous flow reactors have feed and discharge flows in a continuous or semi-
continuous manner. This is the most common form. These reactors can handle high
OLRs since conditions for the microbes are relatively constant. The flow coming out of
the reactor (the effluent) has the same composition as the reactor contents.
Batch reactors are loaded and allowed to react for a certain period (usually two weeks)
before settling the solids, decanting, and loading again with fresh waste. These reactors
are larger and have longer SRTs since conditions are not constant for the microbes.
However, effluent quality can be very good due to the long SRTs and allowing the solids
to settle before decanting the effluent [2].
Types of anaerobic digesters
Plug Flow Reactor (PFR)
A plug-flow reactor is arranged as one long reactor or many short reactors in a tube bank
with no radial variation in reaction rate (concentration), only concentration changes down the
length of the reactor [17]. An ideal plug-flow reactor has perfect mixing in the radial direction
and no mixing in the axial direction [8]. It is generally less technically complex than other
reactors. However, the wastes must be mixed and inoculated with the digested product [24].
Plug-flow reactors require high solids content. These systems can handle things such as rocks
that must be screened out with low solids systems. High solids processes can also handle higher
organic loading rates and generally uses less water when compared to low solids processes.
DRANCO, Kompogas, and Valorga are all single-stage thermophilic reactors (Valorga
sometimes uses mesophilic) with a retention time of 14-21 days [25]. These reactors have an
advantage in that they can handle all types of biodegradable MSW including paper. They also
don’t have any moving parts inside which allows for low maintenance costs.
The DRANCO reactor is a vertical plug-flow reactor. Matter to be digested is added to
the top and sludge is extracted from the bottom. Gravity aids this process [25].
The Kompogas process is a horizontal plug-flow reactor that best handles wastes with a
solids content of 23%; any lower, heavier particles may accumulate on the bottom; any
higher, the flow of materials may be affected [25].
The Valorga process utilizes a vertical cylindrical reactor. Undigested material enters
through an entry point on the bottom and moves upward and around a baffle until it
22 Anaerobic Digestion
discharges through an exit point on the top. Biogas is injected at the bottom of the
reactor to provide mixing. These injectors have added maintenance associated with them
[25]. One mesophilic Valorga Plant in the Netherlands takes in food and garden waste
and produces CH4 varying from 210 to 290 m3 per Mg of volatile solids. This variation is
most likely due to differences in feedstock [9].
A PFR operating off manure and FW (egg breakage waste, fish breading waste, crab meat
trimmings, and ravioli sauce waste) had a COD reduction of 68%. The FW substrate mixture
and the digester influent had CODs of 223 ± 24 g/L and 84±15 g/L, respectively. CH4
production was 0.37±0.05 m3 CH4/kg VS [12].
Single Stage
Single stage reactors are more conventional in that they use one reactor for both the
acidogenic phase and the methanogenic phase. They can be divided into classifications of low
solids and high solids [25].
Low solids reactors are very simple. Usage is well-established for use in the wastewater
industry. A common reactor that is single stage is the completely stirred tank reactor
(CSTR). For the solids percentage to be maintained, water must be added. This results
in higher reactor volumes and more energy required for heating[25].
High solids reactors have higher biogas yield when compared to low solids processes.
They require less water than low solids processes. An example of a high solids single
stage reactor is the plug-flow reactor. High solids reactors can generally handle higher
organic loading rates when compared to low solids processes [25].
Experiments conducted using single stage methods with feedstocks of general FW, potato
waste in a CSTR under thermophilic conditions, pineapple peel, and barley waste with combined
kitchen waste had a methane productivity of 0.35–0.44, 0.65–0.85, 0.67, and 0.36 L/g VS,
respectively. [11].
Double stage
Double stage processes separate acidogenesis and methanogenesis via physical barriers.
Generally, two reactors are used. The first reactor is for liquefaction or hydrolysis and
acidogenesis. The reaction rate in this tank is limited by the rate of hydrolysis of large polymers
of carbohydrates, proteins, etc. The second tank is used for methanogenesis and is limited by the
rate of microbial growth. This two reactor system allows for the different tanks to me optimized
for different processes.
Double stage processes may also be classified by high-solids and low-solids. There are
many similarities between low-solids processes that are single stage and double stage. The high-
solids processes of single stage and double stage also share similarities [25]. Double stage
experiments using cheese whey, fruit and vegetable waste, and general FW had methane yields
of 0.55 m3 /kg CODremoved, 0.320 m
3/kg COD, 0.21 m
3/kg VSadded, respectively. Double stage

23 Anaerobic Digestion
processes are more suitable for substrates with low pH, low buffering capacity, and high
concentrations of ammonia [11]. One study attempted to compare energy yields of single and
double stage reactors. Their findings showed the single stage reactor yielded slightly more
biogas (13.4%) than the double stage reactor. However, they state that optimization of the first
stage of the double stage process could improve biogas yield [18].
TPASBR and MTSASBR
Huge advances in thermophilic anaerobic digestion in the last decade have made these
systems the most efficient in terms of methane output (Figure 5). The food composition in
typical temperature-phased anaerobic sequencing batch reactors (TPASBR) is mostly sewage
sludge and FWs. Thus it is seen as a promising approach to the digestion of OFMSW. Due to
the organic composition of OFMSW, it will have high water content. Lab scale testing has been
done at the Slovak University of Technology in Bratislava that tests different types of food for
biogas yield and biodegradability. Results indicate that the thermophilic anaerobic process is
suitable for treating kitchen wastes [16]. A comparison study of co-digestion of FWs and
sewage sludge assesses the practicality of using TPASBR, using mesophilic two-stage anaerobic
sequencing batch reactors (MTSASBR) as a control. The most significant difference between
the two is the temperature at which they operate. Thermophilic anaerobic digesters typically
operate within the ranges of 50-65°C while mesophilic anaerobic digesters operate within the
ranges of 25-40°C [14]. The temperature of the thermophilic anaerobic digester in this particular
experiment is controlled using a water bath circulator, and a built in water jacket. The co-
substrate TPASBR system was able to obtain 44% VS removal. An experiment revealed that the
optimum ratio of sewage sludge to FW is 60:40 [14]. The result of this experiment verifies that
TPASBR enhances the treatment of OFMSW, at the same time, producing more biogas.
The advantages of using a thermophilic digester are shortened retention times and higher
loading rates resulting in higher methane production. In fact, a finding from a study of anaerobic
digestion of olive mill wastewater shows that the yield coefficient of methane is 28% greater in
thermophilic processes than in mesophilic processes [3]. The disadvantages are it is sensitive to
toxins and environmental changes. While the TPASBR seem to be the way to go, there are
benefits that come with the MTSASBR. They are more attractive to commercial plants because
they require much less investment costs, and they are also easier to operate and maintain.
Another advantage of MTSASBR is that it is much more stable because they tolerate greater
changes in the environment. As a result of the temperature of MTSASBR being lower than
TPASBR, the process has a longer retention time and lower biogas production [2].
24 Anaerobic Digestion
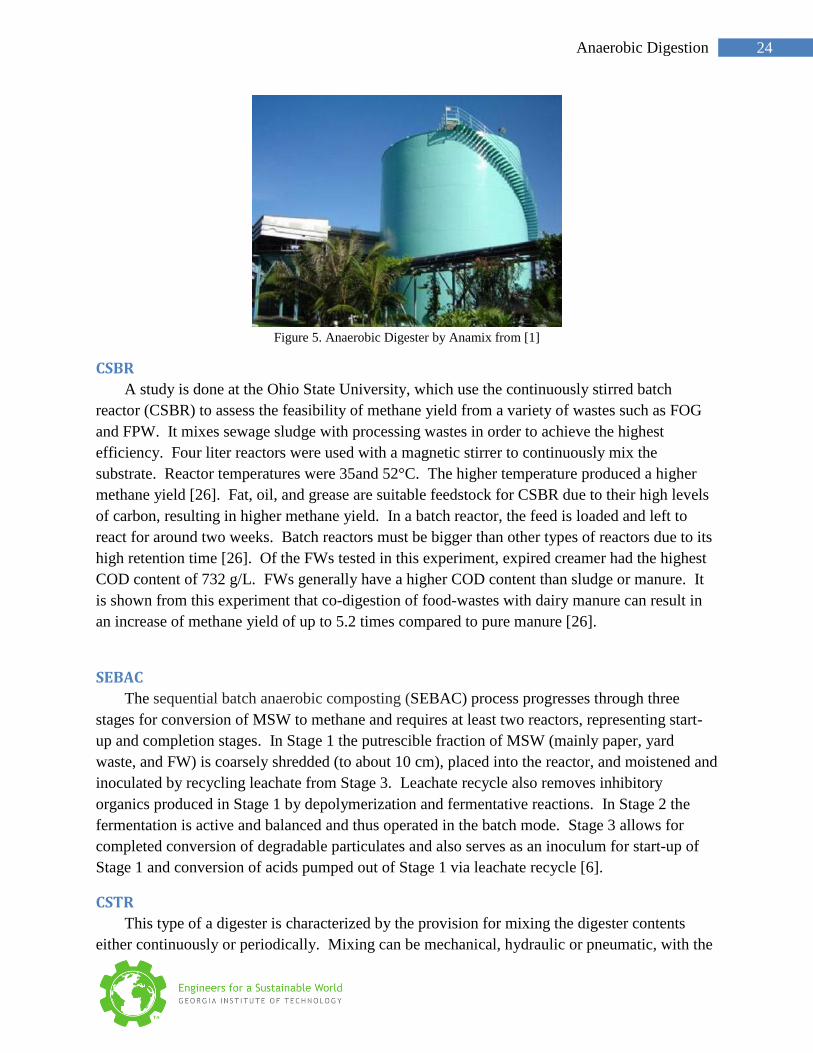
Figure 5. Anaerobic Digester by Anamix from [1]
CSBR
A study is done at the Ohio State University, which use the continuously stirred batch
reactor (CSBR) to assess the feasibility of methane yield from a variety of wastes such as FOG
and FPW. It mixes sewage sludge with processing wastes in order to achieve the highest
efficiency. Four liter reactors were used with a magnetic stirrer to continuously mix the
substrate. Reactor temperatures were 35and 52°C. The higher temperature produced a higher
methane yield [26]. Fat, oil, and grease are suitable feedstock for CSBR due to their high levels
of carbon, resulting in higher methane yield. In a batch reactor, the feed is loaded and left to
react for around two weeks. Batch reactors must be bigger than other types of reactors due to its
high retention time [26]. Of the FWs tested in this experiment, expired creamer had the highest
COD content of 732 g/L. FWs generally have a higher COD content than sludge or manure. It
is shown from this experiment that co-digestion of food-wastes with dairy manure can result in
an increase of methane yield of up to 5.2 times compared to pure manure [26].
SEBAC
The sequential batch anaerobic composting (SEBAC) process progresses through three
stages for conversion of MSW to methane and requires at least two reactors, representing start-
up and completion stages. In Stage 1 the putrescible fraction of MSW (mainly paper, yard
waste, and FW) is coarsely shredded (to about 10 cm), placed into the reactor, and moistened and
inoculated by recycling leachate from Stage 3. Leachate recycle also removes inhibitory
organics produced in Stage 1 by depolymerization and fermentative reactions. In Stage 2 the
fermentation is active and balanced and thus operated in the batch mode. Stage 3 allows for
completed conversion of degradable particulates and also serves as an inoculum for start-up of
Stage 1 and conversion of acids pumped out of Stage 1 via leachate recycle [6].
CSTR
This type of a digester is characterized by the provision for mixing the digester contents
either continuously or periodically. Mixing can be mechanical, hydraulic or pneumatic, with the
25 Anaerobic Digestion
latter being effected by compression and sparging of biogas. Gas mixing is preferred in large
digesters. The treatment efficiency of a CSTR is further enhanced by heating the digester
content with a proper temperature control system. The CSTRs are operated semicontiniously or
continuously, that is the wastewater is fed either periodically (semicontinuously) or continuously
to the digester. By insulating the digester and mixing the contents, it is possible to install
digesters of very large capacities, for example up to 5000 m3. CSTRs based on anaerobic
process have HRTs in the range of 15-20 d. They are particularly suited to animal wastes such
as piggery waste, dairy cattle manure, and silage waste [21].
DRANCO
The DRANCO technology consists of a thermophilic, one-phase anaerobic fermentation
step, which is followed by a short aerobic maturation phase. If necessary, mesophilic operation
can be applied for specific waste streams. During the anaerobic digestion phase, the organic
material is partially converted into biogas in an enclosed reactor for about 20 days. The digested
sludge is extracted from the digester and stabilized aerobically. The final product is a
hygienically safe and stabilized product. Combining anaerobic digestion and aerobic composting
produces energy, shortens the aerobic composting step and prevents wastewater production.
Wastewater can also be prevented by drying the sludge with the lost heat of the gas engines or by
adding shredded green waste to the sludge in the composting step. The advantages of the
DRANCO process include dry anaerobic digestion, vertical digester with conical outlet, one-
phase digestion, and mixingby gas injection in the digester.
Some characteristics of the process include a digester loading rate of 10 to 20 kg COD/m³
reactor per day; a temperature range of 48 to 57°C, if thermophilic, or 35 to 40°C, if mesophilic;
a retention time of 15 to 30 days; a biogas production of 100 to 200 m³ of biogas per ton of
waste; and electricity production of 220 to 440 kWh per ton of waste. This technology is suited
to OFMSW obtained through mechanical separation; biowaste and other source-separated
organic waste streams; dewatered sewage sludge; and other organic waste streams, including
non-recyclable paper, market waste, FW, and industrial waste [27].
UASB
Up-flow anaerobic sludge blanket (UASB) reactors are usually used in wastewater
treatment. In addition to usage in wastewater treatment they are used in the beverage, brewery,
food and tannery industries [13]. In UASB reactors, the active microbial biomass form very
dense granules, which are highly settleable. As a result, very high concentration of active
biomass is achievable per unit working volume of the digester. UASBs are operable at high
COD loading rates with adequate treatment. The feed enters through the bottom of the reactor
and flows upward. After passing through the active granular sludge, the treated wastewater
passes through a gas-liquid-solid separation device. This device separates solids (granules) from
the liquid effluent and also separates gas bubbles form the effluent. Only the liquid effluent
flows out of the reactor while the solid sludge settles back in the reactor and the gas is collected
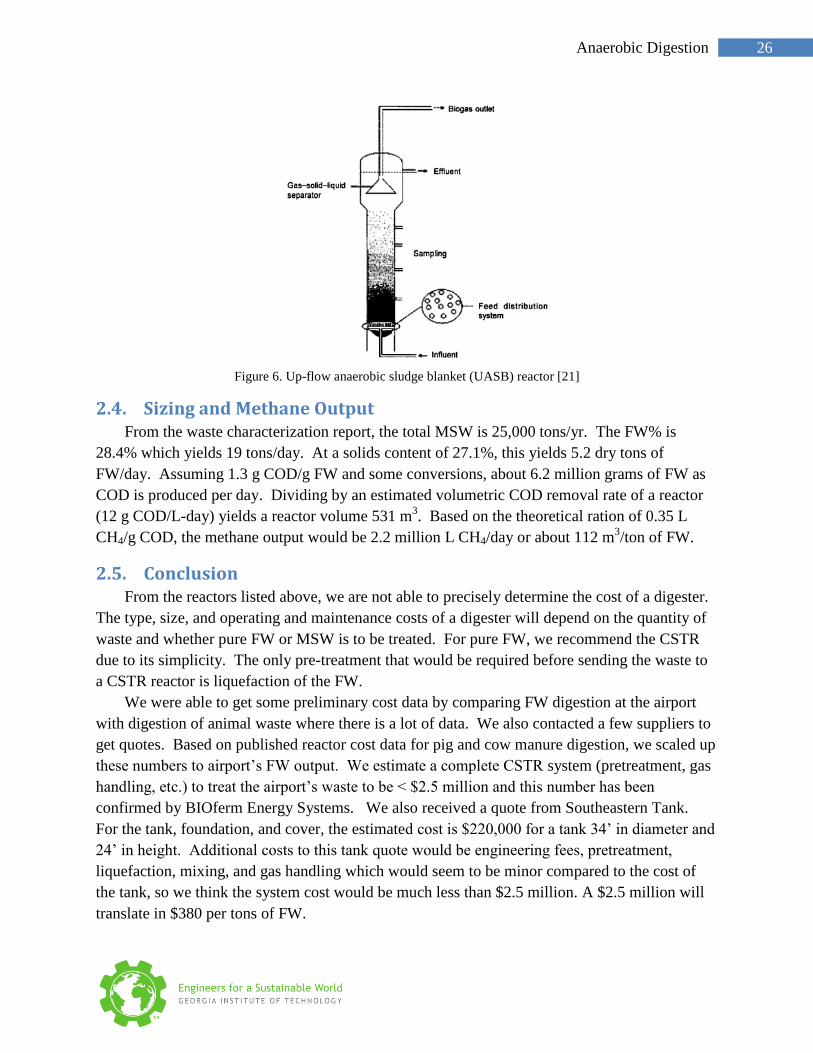
in the gas collector [21]. A diagram of the reactor is shown in Figure 6.
26 Anaerobic Digestion
Figure 6. Up-flow anaerobic sludge blanket (UASB) reactor [21]
Sizing and Methane Output 2.4.From the waste characterization report, the total MSW is 25,000 tons/yr. The FW% is
28.4% which yields 19 tons/day. At a solids content of 27.1%, this yields 5.2 dry tons of
FW/day. Assuming 1.3 g COD/g FW and some conversions, about 6.2 million grams of FW as
COD is produced per day. Dividing by an estimated volumetric COD removal rate of a reactor
(12 g COD/L-day) yields a reactor volume 531 m3. Based on the theoretical ration of 0.35 L
CH4/g COD, the methane output would be 2.2 million L CH4/day or about 112 m3/ton of FW.
Conclusion 2.5.From the reactors listed above, we are not able to precisely determine the cost of a digester.
The type, size, and operating and maintenance costs of a digester will depend on the quantity of
waste and whether pure FW or MSW is to be treated. For pure FW, we recommend the CSTR
due to its simplicity. The only pre-treatment that would be required before sending the waste to
a CSTR reactor is liquefaction of the FW.
We were able to get some preliminary cost data by comparing FW digestion at the airport
with digestion of animal waste where there is a lot of data. We also contacted a few suppliers to
get quotes. Based on published reactor cost data for pig and cow manure digestion, we scaled up
these numbers to airport’s FW output. We estimate a complete CSTR system (pretreatment, gas
handling, etc.) to treat the airport’s waste to be < $2.5 million and this number has been
confirmed by BIOferm Energy Systems. We also received a quote from Southeastern Tank.
For the tank, foundation, and cover, the estimated cost is $220,000 for a tank 34’ in diameter and
24’ in height. Additional costs to this tank quote would be engineering fees, pretreatment,
liquefaction, mixing, and gas handling which would seem to be minor compared to the cost of
the tank, so we think the system cost would be much less than $2.5 million. A $2.5 million will
translate in $380 per tons of FW.
27 Anaerobic Digestion
For a UASB, the reactors require low solids, such as municipal solids. The SEBAC reactor
may produce ammonia too quickly which will affect the pH because of its buffer capacity. With
the SEBAC reactor, the pH will need to be monitored closely or else the low pH will inhibit
methanogens from producing methane. With double stage reactors, one of the phases would
include an acid phase reactor which is similar to composting. Whether the reactor will be
mesophilic or thermophilic will depend on the FW. Even though thermophilic reactors have a
faster detention time and produce more methane, it may not be cost efficient to continue heating
the reactor at thermophilic temperatures.
For treating OFMSW in its entirety, including paper, we recommend the DRANCO or the
Valorga technologies. We received a quote from Dranco and are awaiting a quote from Valorga.
Dranco was recommended by the Lettinga Associate Foundation which is the leader in the
construction of UASBs. Valorga has more installations than Dranco. More study is needed to
decide which system is better. Dranco estimates to treat 25,000 tons of MSW/year, their reactor
cost would be 6 million Euros or $7.8 million. Since this system is ~3-4 times more expensive
than treating pure FW, this price may only be justified if paper wastes can’t be easily separated
from the FW or if the paper can’t be recycled due to contamination by FW. The estimated height
of their reactor is 30 meters.

28 Anaerobic Digestion
References 2.6.1. Anamix M Anaerobic Mixed Digester . N.d. Ovivo. N.p., n.d. Web. 31 Mar.
2012. <http://www.ovivowater.com/index.php?option=com_content&view=article&id=928&Itemid=33
826>.
2. Arsova, Ljupka. "Anaerobic digestion of FW: Current status, problems and an alternative product (May
2010): n. pag. Columbia Engineering. Web. 22 Mar. 2012.
<http://www.seas.columbia.edu/earth/wtert/sofos/arsova_thesis.pdf>.
3. Borja, R, et al. "A kinetic study of anaerobic digestion of olive mill wastewater at mesophilic and
thermophilic temperatures." Environ Pollut 88.1: 13+. PubMed. Web. 21 Mar. 2012.
<http://www.ncbi.nlm.nih.gov/pubmed/15091564>.
4. California. Department of Biological and Agricultural Engineering. University of California, Davis.
Current Anaerobic Digestion Technologies Used for Treatment of Municipal Organic Solid Waste. By
Joshua Rapport, Ruihong Zhang, Bryan M. Jenkins, and Robert B. Williams. Sacramento: Integrated
Waste Management Board, 2008. Web. 24 Mar. 2012.
<http://www.calrecycle.ca.gov/publications/organics/2008011.pdf>.
5. Cho, Jae Kyoung, Soon Chul Park, and Ho Nam Chang. "Biochemical Methane Potential and Solid
State Anaerobic Digestion of Korean FWs." Bioresource Technology 52.3 (1995): 245-53. Print.
6. Chynoweth, D. P., J. Owens, D. O'Keefe, J. F. K. Earle, G. Bosch, and R. Legrand. SEQUENTIAL
BATCH ANAEROBIC COMPOSTING OF THE ORGANIC FRACTION OF MUNICIPAL SOLID
WASTE. Rep. Vol. 25. Web. 24 Mar. 2012.
<http://www.iwaponline.com/wst/02507/0327/wst025070327.pdf>.
7. "Continuous Stirred Tank Reactors." College of Engineering Home. Web. 24 Mar. 2012.
<http://www.engin.umich.edu/~cre/asyLearn/bits/cstr/>.
8. "CVEN 5534: Wastewater Treatment." University of Colorado at Boulder Department of Civil,
Environmental, and Architechtural Engineering. University of Colorado at Boulder, n.d. Web. 19 Mar
2012. <http://civil.colorado.edu/~silverst/cven5534/IDEAL PLUG FLOW REACTOR.pdf>.
http://www.adelaide.edu.au/biogas/anaerobic_digestion/pvdv.pdf
9. De Laclos, Helene, Serge Desbois, and Claude Saint-Joly. "Anaerobic digestion of municipal solid
organic waste: Valorga full-scale plant in Tilburg, the Netherlands." Water Science and Technology.
36.6-7 (1997): 457-462. Web. 25 Mar. 2012.
<http://www.iwaponline.com.prx.library.gatech.edu/wst/03606/0457/036060457.pdf>.
10. Dearman, B., and R. H. Bentham. "Anaerobic Digestion of FW: Comparing Leachate Exchange Rates
in Sequential Batch Systems Digesting FW and Biosolids." Waste Management 27.12 (2007): 1792-99.
Print.
29 Anaerobic Digestion
11. Demirel, Burak, Paul Scherer, Orhan Yenigun, and Turgut Onay. "Production of Methane and
Hydrogen from Biomass through Conventional and High-Rate Anaerobic Digestion Processes." Critical
Reviews in Environmental Science and Technology. 40.2 (2010): 116-146. Web. 25 Mar. 2012.
<http://reventurepark.com/uploads/1_WTE_ART_29.pdf>.
12. Frear, Craig, et al. "Evaluation of Co-Digestion at a Commercial Dairy Anaerobic Digester." CLEAN
– Soil, Air, Water 39.7 (2011): 697-704. Print.
13. Karthikeyan, K., and J. Kandasamy. UPFLOW ANAEROBIC SLUDGE BLANKET (UASB)
REACTOR IN WASTEWATER TREATMENT. Rep. Encyclopedia of Life Support Systems(EOLSS).
Web. 24 Mar. 2012. <http://www.eolss.net/Sample-Chapters/C07/E6-144-19.pdf>
14. Kim, Hyun-Woo, Joo-Youn Nam, and Hang-Sik Shin. "A comparison study on the high-rate co-
digestion of sewage sludge and FW using a temperature-phased anaerobic sequencing batch reactor
system." Hydrolytic activities of extracellular enzymes in thermophilic and mesophilic anaerobic
sequencing-batch reactors treating organic fractions of municipal solid wastes (Feb. 2011): n.
pag. Science Direct. Web. 22 Mar. 2012.
<http://www.sciencedirect.com/science/article/pii/S0960852411006262>.
15. Latif, M. A., et al. "Effect of Temperature and Organic Loading Rate on Upflow Anaerobic Sludge
Blanket Reactor and Ch4 Production by Treating Liquidized FW." Environmental Progress &
Sustainable Energy 31.1 (2012): 114-21. Print.
16. Markoš, J. "Slovak Society of Chemical Engineering Institute of Chemical and Environmental
Engineering Slovak University of Technology in Bratislava." FW as Biodegradable Substrates for
Biogas Production (May 2010): n. pag. Department of Chemical and Environmental Engineering
Faculty of Chemical and Food Technology. Web. 23 Mar. 2012.
<http://kchbi.chtf.stuba.sk/cevoze/doc/pod9/poster/text/Food%20Waste%20as%20Biodegradable%20S
ubstrates%20for%20Biogas%20Production.pdf>.
17. "Plug Flow Reactors (PFRs)." College of Engineering Home. Web. 24 Mar. 2012.
<http://www.engin.umich.edu/~cre/asyLearn/bits/pfrfinal/index.htm>.
18. Siddiqui, Z, Horan, and Salter. "Energy optimisation from co-digested waste using a two-phase
process to generate hydrogen and methane." International Journal of Hydrogen Energy. 36.8 (2011):
4792-4799. Web. 25 Mar. 2012.
<http://www.sciencedirect.com.prx.library.gatech.edu/science/article/pii/S0360319910025036>.
19. "Sludge Treatment and Disposal." Environmental Engineering Principles. 1st ed. Boston: Pearson
Learning Solutions. 357-58. Print.
20. Spain. Departamento De Ingeniería Química. Tecnología De Alimentos Y Tecnologías Del Medio
Ambiente Facultad De Ciencias Del Mar Y Ambientales Universidad De Cádiz Campus Rio San Pedro.
30 Anaerobic Digestion
Composting Potential of Different Inoculum Sources in the Modified SEBAC System Treatment of
Municipal Solid Wastes. By T. Forster-Carneiro, M. Pérez, and L. I. Romero. Web. 24 Mar. 2012.
<http://www.cetesb.sp.gov.br/userfiles/file/mudancasclimaticas/biogas/file/docs/artigos_dissertacoes/4_
foster_perez_romero.pdf>.
21. Tasneem Abbasi, A.S.A. Renewable Energy Sources : Their Impact on Global Warming and
Pollution. Prentice-Hall Of India Pvt. Limited, 2010. Print.
22. Teixeira, Arthur A. Technologies for High Solids Biomass Reuse and Valorization. Publication.
University of Florida’s Institute of Food and Agricultural Sciences. Web. 24 Mar. 2012.
<http://www.bioenergy-lamnet.org/publications/source/chile/Plenary-2-1-LAMNET-Chile-1104-
Teixeira.pdf>.
23. Van Ginkel, Steven. "AD." Message to the author. 13 Mar. 2012. E-mail.
24. Vandevivere, P, Baere, and Verstraete. "Types of anaerobic digesters for solid wastes." The
University of Adelaide. The University of Adelaide, n.d. Web. 25 Mar 2012.
<http://www.adelaide.edu.au/biogas/anaerobic_digestion/pvdv.pdf>.
25. Verma, Shefali. "Anaerobic Digestion of Biodegradable Organics in Municipal Solid Wastes."
Columbia University Earth Engineering Center for Sustainable Waste Management. Columbia
University, May 2002. Web. 25 Mar 2012. <http://www.seas.columbia.edu/earth/vermathesis.pdf>.
26. Zhu, Danqi. "Co-digestion of Different Wastes for Enhanced Methane Production." Presented in
Partial Fulfillment of the Requirements for the Degree Master of Science in the Graduate School of The
Ohio State University (2010): n. pag. OhioLINK ETD Center. Web. 23 Mar. 2012.
<http://etd.ohiolink.edu/send-pdf.cgi/Zhu%20Danqi.pdf?osu1275498955>.
27. "OWS (Organic Waste Systems) - DRANCO." OWS. Web. 19 Apr. 2012.
<http://www.ows.be/pages/index.php?menu=85>.
31 Combined Heat & Power
Combined Heat & Power 3.
Team members:
Richard Dowdell 4th
year undergraduate student, Mechanical Engineering
Elena Joy 2nd
year undergraduate student, Mechanical Engineering
Sarina Basu 4th
year undergraduate student, Industrial Engineering
Warren Johnson 4th
year undergraduate student, Mechanical Engineering
32 Combined Heat & Power
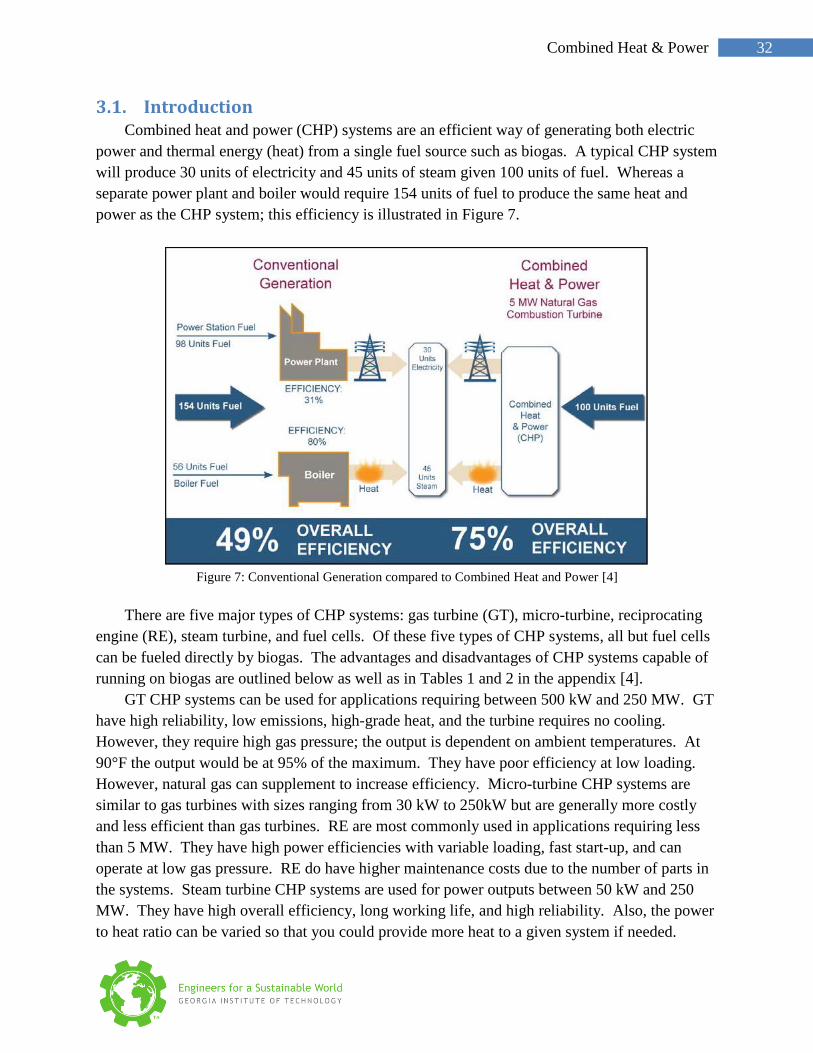
Introduction 3.1.Combined heat and power (CHP) systems are an efficient way of generating both electric
power and thermal energy (heat) from a single fuel source such as biogas. A typical CHP system
will produce 30 units of electricity and 45 units of steam given 100 units of fuel. Whereas a
separate power plant and boiler would require 154 units of fuel to produce the same heat and
power as the CHP system; this efficiency is illustrated in Figure 7.
Figure 7: Conventional Generation compared to Combined Heat and Power [4]
There are five major types of CHP systems: gas turbine (GT), micro-turbine, reciprocating
engine (RE), steam turbine, and fuel cells. Of these five types of CHP systems, all but fuel cells
can be fueled directly by biogas. The advantages and disadvantages of CHP systems capable of
running on biogas are outlined below as well as in Tables 1 and 2 in the appendix [4].
GT CHP systems can be used for applications requiring between 500 kW and 250 MW. GT
have high reliability, low emissions, high-grade heat, and the turbine requires no cooling.
However, they require high gas pressure; the output is dependent on ambient temperatures. At
90°F the output would be at 95% of the maximum. They have poor efficiency at low loading.
However, natural gas can supplement to increase efficiency. Micro-turbine CHP systems are
similar to gas turbines with sizes ranging from 30 kW to 250kW but are generally more costly
and less efficient than gas turbines. RE are most commonly used in applications requiring less
than 5 MW. They have high power efficiencies with variable loading, fast start-up, and can
operate at low gas pressure. RE do have higher maintenance costs due to the number of parts in
the systems. Steam turbine CHP systems are used for power outputs between 50 kW and 250
MW. They have high overall efficiency, long working life, and high reliability. Also, the power
to heat ratio can be varied so that you could provide more heat to a given system if needed.
33 Combined Heat & Power
However, steam turbines require up to one day for startup. With all of these technologies, gas
pretreatment would be required. A high-pressure water scrubbing system is necessary to
removal hydrogen sulfide at a cost of $0.06/MMBtu of biogas.
Out of the four technologies, we recommend either the GT or RE depending on power needs
at ATL. The RE will be most useful in situations where the required heat and power varies over
time. However, we assume that a CHP unit will be running continuously and the best use of the
heat is to heat the digester. If there is enough heat to make the digester thermophilic, we would
be able to reduce the size of the digester. The GT would be best if the power need was constant
at >10 MW. The biogas input could be supplemented with natural gas to achieve this output.
The relative benefits of the units as well as a cost analysis of each are discussed below.
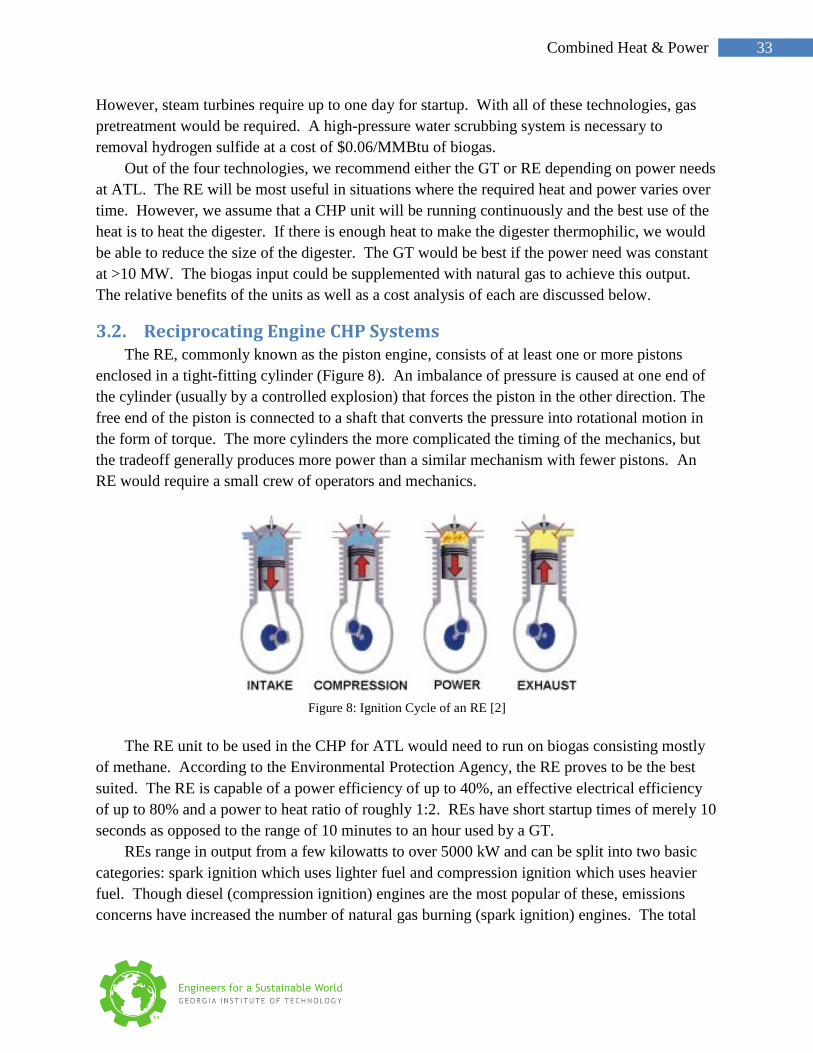
Reciprocating Engine CHP Systems 3.2.The RE, commonly known as the piston engine, consists of at least one or more pistons
enclosed in a tight-fitting cylinder (Figure 8). An imbalance of pressure is caused at one end of
the cylinder (usually by a controlled explosion) that forces the piston in the other direction. The
free end of the piston is connected to a shaft that converts the pressure into rotational motion in
the form of torque. The more cylinders the more complicated the timing of the mechanics, but
the tradeoff generally produces more power than a similar mechanism with fewer pistons. An
RE would require a small crew of operators and mechanics.
Figure 8: Ignition Cycle of an RE [2]
The RE unit to be used in the CHP for ATL would need to run on biogas consisting mostly
of methane. According to the Environmental Protection Agency, the RE proves to be the best
suited. The RE is capable of a power efficiency of up to 40%, an effective electrical efficiency
of up to 80% and a power to heat ratio of roughly 1:2. REs have short startup times of merely 10
seconds as opposed to the range of 10 minutes to an hour used by a GT.
REs range in output from a few kilowatts to over 5000 kW and can be split into two basic
categories: spark ignition which uses lighter fuel and compression ignition which uses heavier
fuel. Though diesel (compression ignition) engines are the most popular of these, emissions
concerns have increased the number of natural gas burning (spark ignition) engines. The total

34 Combined Heat & Power
installed costs range from between $1,130 to 2,700/kW. Maintenance may be less expensive due
to the similarities between reciprocating and automobile engines.
The four sources of heat recovered from REs are from the exhaust gas (30-40% of energy
input), engine jacket cooling water (30%), lube oil cooling water, and turbocharger cooling. The
recovered heat is in the form of low-pressure steam or hot water. If effectively harnessed, this
means roughly 70-80% of the engine’s energy input can be recovered in the outputs of electricity
or heat. Because exhaust gases are kept above temperatures that would allow condensation in
the engine components, the best use of engine exhaust is to heat water, which will in turn allow
for easier and lengthier transmission of the heat. Lube oil cooling and single-stage after-cooling
will also be integrated into the creation of hot water or steam.
Reciprocating engines are rated into three categories: low, medium, and high speed with
respective rpm ranges of 58-275, 275-1000, and 1000-3600. The rich-burn spark ignition engine
only operates in the high-speed range and can produce a power output ranging from 0.01 to 1.5
MW. The lean-burn spark ignition engine only operates in the medium and high-speed range
and produces 1.0-6.0 MW and 0.15-3.0MW, respectively. Dual-fuel and diesel engines
significantly increase power output on the order of 4 times that of the other choices per speed
range and at low speeds produce between 2 and 65MW.
The use of a turbo-charging system uses hot exhaust air to power a turbine connected to the
intake that will increase pressurization in the cylinders and boost engine output (Figure 9). This
increases electrical output and decreases heat output. Most engines above 300kW include turbo
charging to increase electrical output.
Figure 9: Turbo Charging System [1]
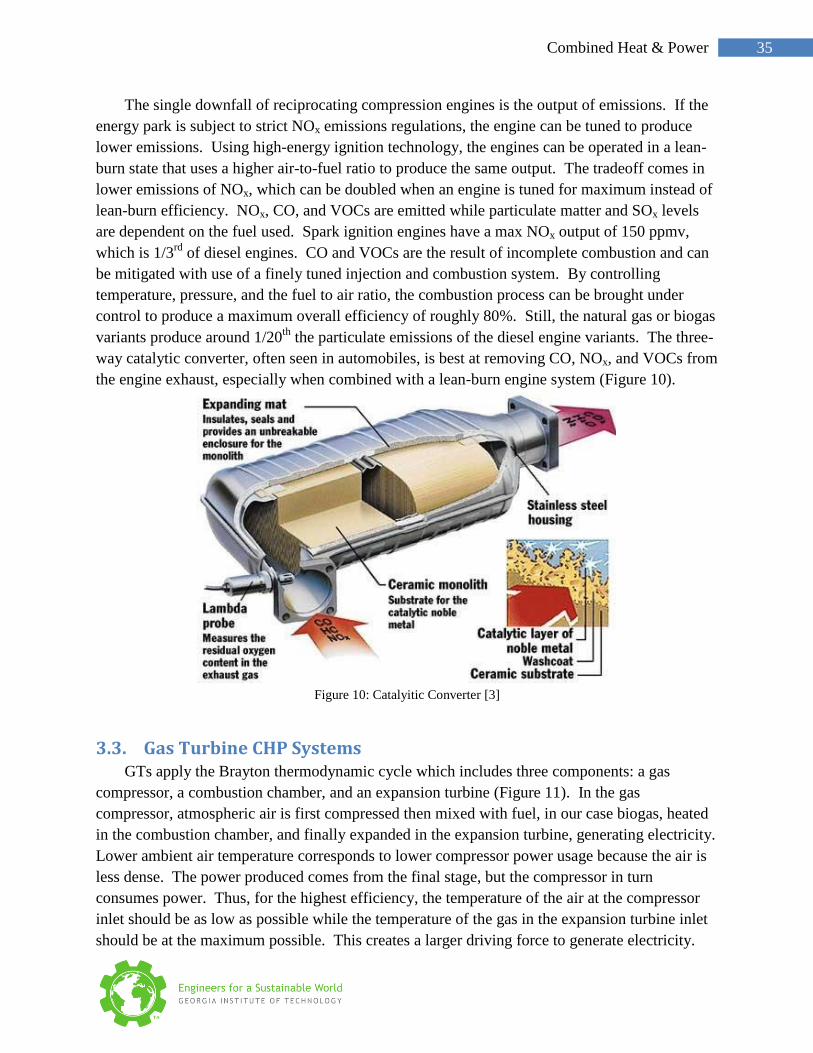
35 Combined Heat & Power
The single downfall of reciprocating compression engines is the output of emissions. If the
energy park is subject to strict NOx emissions regulations, the engine can be tuned to produce
lower emissions. Using high-energy ignition technology, the engines can be operated in a lean-
burn state that uses a higher air-to-fuel ratio to produce the same output. The tradeoff comes in
lower emissions of NOx, which can be doubled when an engine is tuned for maximum instead of
lean-burn efficiency. NOx, CO, and VOCs are emitted while particulate matter and SOx levels
are dependent on the fuel used. Spark ignition engines have a max NOx output of 150 ppmv,
which is 1/3rd
of diesel engines. CO and VOCs are the result of incomplete combustion and can
be mitigated with use of a finely tuned injection and combustion system. By controlling
temperature, pressure, and the fuel to air ratio, the combustion process can be brought under
control to produce a maximum overall efficiency of roughly 80%. Still, the natural gas or biogas
variants produce around 1/20th
the particulate emissions of the diesel engine variants. The three-
way catalytic converter, often seen in automobiles, is best at removing CO, NOx, and VOCs from
the engine exhaust, especially when combined with a lean-burn engine system (Figure 10).
Figure 10: Catalyitic Converter [3]
Gas Turbine CHP Systems 3.3.GTs apply the Brayton thermodynamic cycle which includes three components: a gas
compressor, a combustion chamber, and an expansion turbine (Figure 11). In the gas
compressor, atmospheric air is first compressed then mixed with fuel, in our case biogas, heated
in the combustion chamber, and finally expanded in the expansion turbine, generating electricity.
Lower ambient air temperature corresponds to lower compressor power usage because the air is
less dense. The power produced comes from the final stage, but the compressor in turn
consumes power. Thus, for the highest efficiency, the temperature of the air at the compressor
inlet should be as low as possible while the temperature of the gas in the expansion turbine inlet
should be at the maximum possible. This creates a larger driving force to generate electricity.

36 Combined Heat & Power
Although the cost of the gas turbine CHP increases when technological advancements are
applied to increase the pressure and temperature inside the chamber, the efficiency of power
created is increased to the point that the overall system provides a net economic benefit.
Figure 11: Gas Turbine CHP System
The heat from the expansion turbine exhaust can be used in various ways. If the fuel is pre-
heated with a regenerator from the exhaust, fuel consumption is decreased. If a heat recovery
steam generator (HRSG) is added, the steam created may be used to generate electricity through
a steam turbine. This system is called a combined-cycle gas turbine. The steam or hot water
created can be also used for any other application needed.
The type of GT pertinent to this project is the aero derivative version that is essentially a
stationary jet engine. These are suited for stationary power and the largest maintain a capacity of
40-50 MW though they can be much smaller. Though initially more expensive than their
industrial counterparts, power efficiency is greater to the point that for the airport’s use, they are
the more cost-effective option among GTs.
Cost Analysis 3.4.
Stage 1: Qualifications
Generally according to the EPA, if the cost of power is $0.07 kWh, the site is a good
candidate for hosting a CHP system
Stage 2: Feasibility Analysis at a High Level
At this stage, we designed a CHP system based on:
● Capacity
● Thermal application
● Operation
● Size of the system
● Complexity of the system
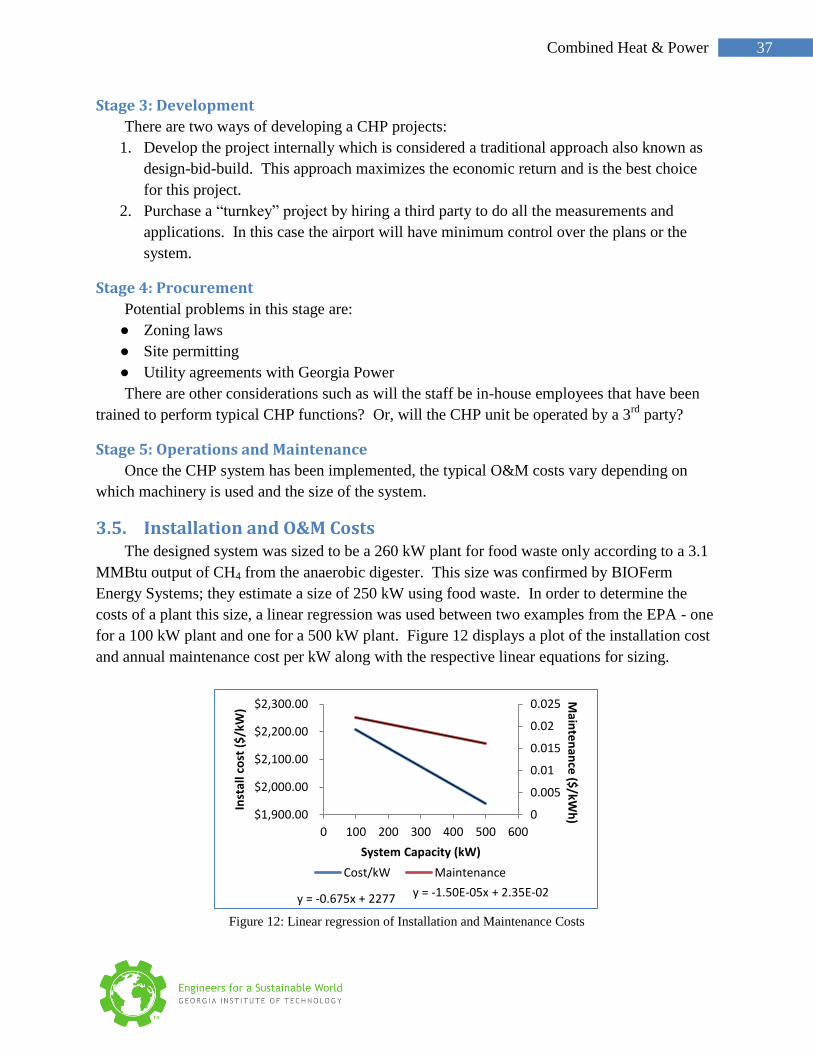
37 Combined Heat & Power
Stage 3: Development
There are two ways of developing a CHP projects:
1. Develop the project internally which is considered a traditional approach also known as
design-bid-build. This approach maximizes the economic return and is the best choice
for this project.
2. Purchase a “turnkey” project by hiring a third party to do all the measurements and
applications. In this case the airport will have minimum control over the plans or the
system.
Stage 4: Procurement
Potential problems in this stage are:
● Zoning laws
● Site permitting
● Utility agreements with Georgia Power
There are other considerations such as will the staff be in-house employees that have been
trained to perform typical CHP functions? Or, will the CHP unit be operated by a 3rd
party?
Stage 5: Operations and Maintenance
Once the CHP system has been implemented, the typical O&M costs vary depending on
which machinery is used and the size of the system.
Installation and O&M Costs 3.5.The designed system was sized to be a 260 kW plant for food waste only according to a 3.1
MMBtu output of CH4 from the anaerobic digester. This size was confirmed by BIOFerm
Energy Systems; they estimate a size of 250 kW using food waste. In order to determine the
costs of a plant this size, a linear regression was used between two examples from the EPA - one
for a 100 kW plant and one for a 500 kW plant. Figure 12 displays a plot of the installation cost
and annual maintenance cost per kW along with the respective linear equations for sizing.
Figure 12: Linear regression of Installation and Maintenance Costs
y = -0.675x + 2277 y = -1.50E-05x + 2.35E-02
0
0.005
0.01
0.015
0.02
0.025
$1,900.00
$2,000.00
$2,100.00
$2,200.00
$2,300.00
0 100 200 300 400 500 600
Main
ten
ance
($/kW
h)
Inst
all c
ost
($
/kW
)
System Capacity (kW)
Cost/kW Maintenance

38 Combined Heat & Power
Additional cost breakdown of the installation is displayed in Table 4 in the appendix where
the total installed cost of the system would be approximately $550,000 and the annual
maintenance would be approximately $44,640/year. Performing a Net Present Value (NPV)
analysis for a 10-year period gives the total cost of $407,000 or about $13.2 per tons of FW. If
we assume electricity price of $0.1/kWh the total benefit of generating electricity from a 260 kW
plant will be around $200,000 per year or $25.4 per tons of FW and therefore, the net benefit will
be $12.2 per tons of FW.
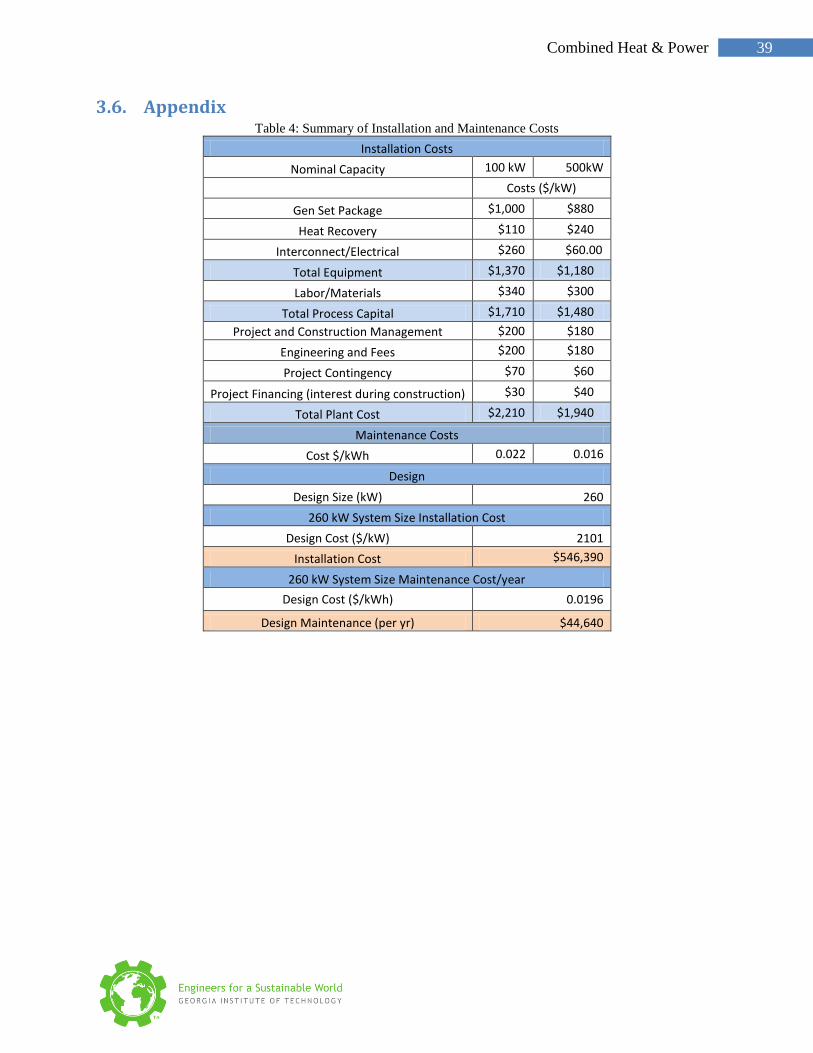
39 Combined Heat & Power
Appendix 3.6.Table 4: Summary of Installation and Maintenance Costs
Installation Costs
Nominal Capacity 100 kW 500kW
Costs ($/kW)
Gen Set Package $1,000 $880
Heat Recovery $110 $240
Interconnect/Electrical $260 $60.00
Total Equipment $1,370 $1,180
Labor/Materials $340 $300
Total Process Capital $1,710 $1,480
Project and Construction Management $200 $180
Engineering and Fees $200 $180
Project Contingency $70 $60
Project Financing (interest during construction) $30 $40
Total Plant Cost $2,210 $1,940
Maintenance Costs
Cost $/kWh 0.022 0.016
Design
Design Size (kW) 260
260 kW System Size Installation Cost
Design Cost ($/kW) 2101
Installation Cost $546,390
260 kW System Size Maintenance Cost/year
Design Cost ($/kWh) 0.0196
Design Maintenance (per yr) $44,640
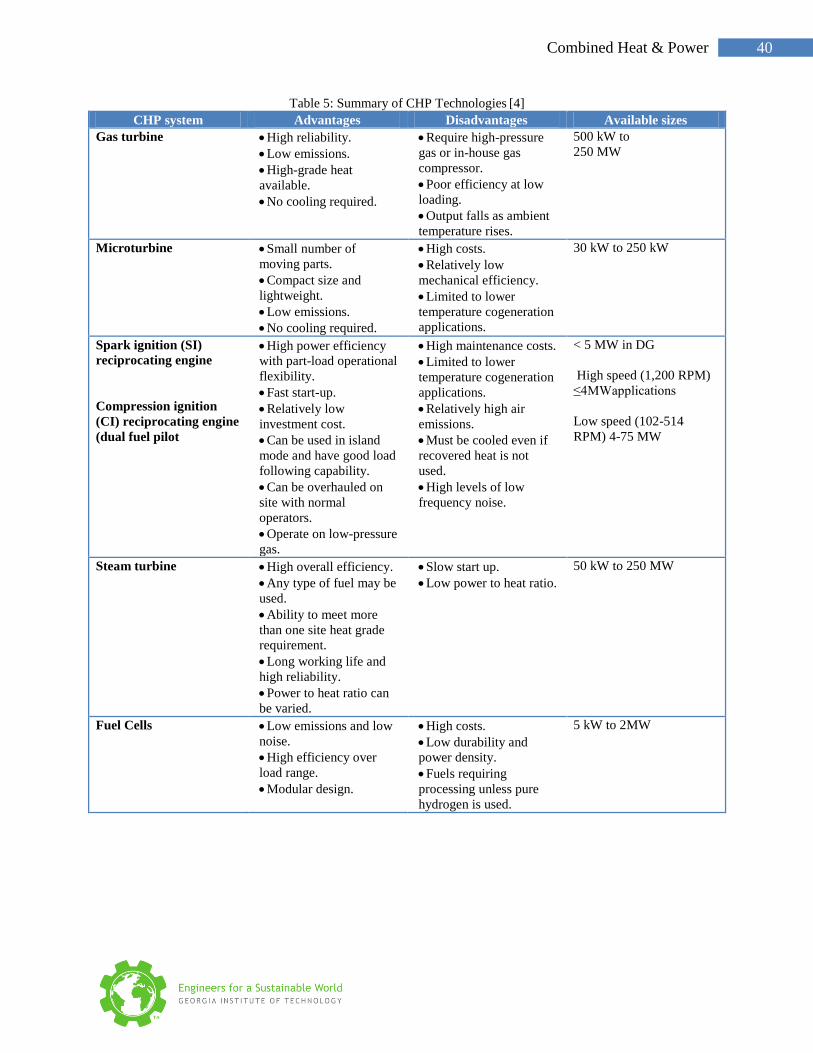
40 Combined Heat & Power
Table 5: Summary of CHP Technologies [4]
CHP system Advantages Disadvantages Available sizes
Gas turbine High reliability.
Low emissions.
High-grade heat
available.
No cooling required.
Require high-pressure
gas or in-house gas
compressor.
Poor efficiency at low
loading.
Output falls as ambient
temperature rises.
500 kW to
250 MW
Microturbine Small number of
moving parts.
Compact size and
lightweight.
Low emissions.
No cooling required.
High costs.
Relatively low
mechanical efficiency.
Limited to lower
temperature cogeneration
applications.
30 kW to 250 kW
Spark ignition (SI)
reciprocating engine
Compression ignition
(CI) reciprocating engine
(dual fuel pilot
High power efficiency
with part-load operational
flexibility.
Fast start-up.
Relatively low
investment cost.
Can be used in island
mode and have good load
following capability.
Can be overhauled on
site with normal
operators.
Operate on low-pressure
gas.
High maintenance costs.
Limited to lower
temperature cogeneration
applications.
Relatively high air
emissions.
Must be cooled even if
recovered heat is not
used.
High levels of low
frequency noise.
< 5 MW in DG
High speed (1,200 RPM)
≤4MWapplications
Low speed (102-514
RPM) 4-75 MW
Steam turbine High overall efficiency.
Any type of fuel may be
used.
Ability to meet more
than one site heat grade
requirement.
Long working life and
high reliability.
Power to heat ratio can
be varied.
Slow start up.
Low power to heat ratio.
50 kW to 250 MW
Fuel Cells Low emissions and low
noise.
High efficiency over
load range.
Modular design.
High costs.
Low durability and
power density.
Fuels requiring
processing unless pure
hydrogen is used.
5 kW to 2MW

41 Combined Heat & Power
Table 6: Summary Table of Typical Cost and Performance Characteristics by CHP Technology [4]
Technology Steam
Turbine1
Recip. Engine Gas Turbine Micro-
turbine
Fuel Cell
Power efficiency
(HHV)
15-38% 22-40% 22-36% 18-27% 30-63%
Overall efficiency
(HHV)
80% 70-80% 70-75% 65-75% 55-80%
Effective electrical
efficiency
75% 70-80% 50-70% 50-70% 55-80%
Typical capacity
(MWe)
0.5-250 0.01-5 0.5-250 0.03-0.25 0.005-2
Typical power to
heat ratio
0.1-0.3 0.5-1 0.5-2 0.4-0.7 1-2
Part-load ok ok poor ok good
CHP Installed costs
($/kWe)
430-1,100 1,100-2,200 970-1,300
(5-40 MW)
2,400-3,000 5,000-6,500
O&M costs
($/kWhe)
<0.005 0.009-0.022 0.004-0.011 0.012-0.025 0.032-0.038
Availability near 100% 92-97% 90-98% 90-98% >95%
Hours to overhauls >50,000 25,000-50,000 25,000-
50,000
20,000-
40,000
32,000-
64,000
Start-up time 1 hr - 1 day 10 sec 10 min - 1 hr 60 sec 3 hrs - 2 days
Fuel pressure (psig) n/a 1-45 100-500
(compressor)
50-80
(compressor)
0.5-45
Fuels all natural gas,
biogas, propane,
landfill gas
natural gas,
biogas,
propane,
oil
natural gas,
biogas,
propane,
oil
hydrogen,
natural
gas, propane,
methanol
Noise high high moderate moderate low
Uses for thermal
output
LP-HP steam hot water, LP
steam
heat, hot
water,
LP-HP steam
heat, hot
water,
LP steam
hot water, LP-
HP
steam
Power Density
(kW/m2)
>100 35-50 20-500 5-70 5-20
NOx ( lb/MMBtu)
(not including SCR)
Gas 0.1-.2
Wood 0.2-.5
Coal 0.3-1.2
0.013 rich burn 3-
way cat.
0.17 lean burn
0.036-0.05 0.015-0.036 0.0025-.0040
lb/MWhTotalOutput
(not including SCR)
Gas 0.4-0.8
Wood 0.9-1.4
Coal 1.2-5.0.
0.06 rich burn 3-
way cat.
0.8 lean burn
0.17-0.25 0.08-0.20 0.011-0.016
* Data are illustrative values for typically available systems; All costs are in 2007$ 1For steam turbine, not entire boiler package
42 Combined Heat & Power
References 3.7.1. B., Taylor. "Turbos in Car Engines - Engineerography Blog." Turbos in Car Engines - Engineerography
Blog. Engineerography Blog, 2 Apr. 2009. Web. Mar. 2012.
<http://engineerography.com/2009/04/turbos-in-car-engines/>.
2. "Gas-Fired Reciprocating Engines." AMO Industrial Distributed Energy:. U.S. Department of Energy.
Web. Mar. 2012. <http://www1.eere.energy.gov/manufacturing/distributedenergy/gas_fired.html>.
3. Motavalli, Jim. "The 20-Year Fight to Get the Lead Out." The Daily Green. 17 Dec. 2007. Web. Mar.
2012. <http://www.thedailygreen.com/living-green/blogs/cars-transportation/lead-gasoline-catalytic-
converters-pollution-461219>.
4. United States Environmental Protection Agency. www.epa.org. Dec. 2008. Web. Feb. 2012.
<http://www.epa.gov/chp/documents/catalog_chptech_full.pdf>
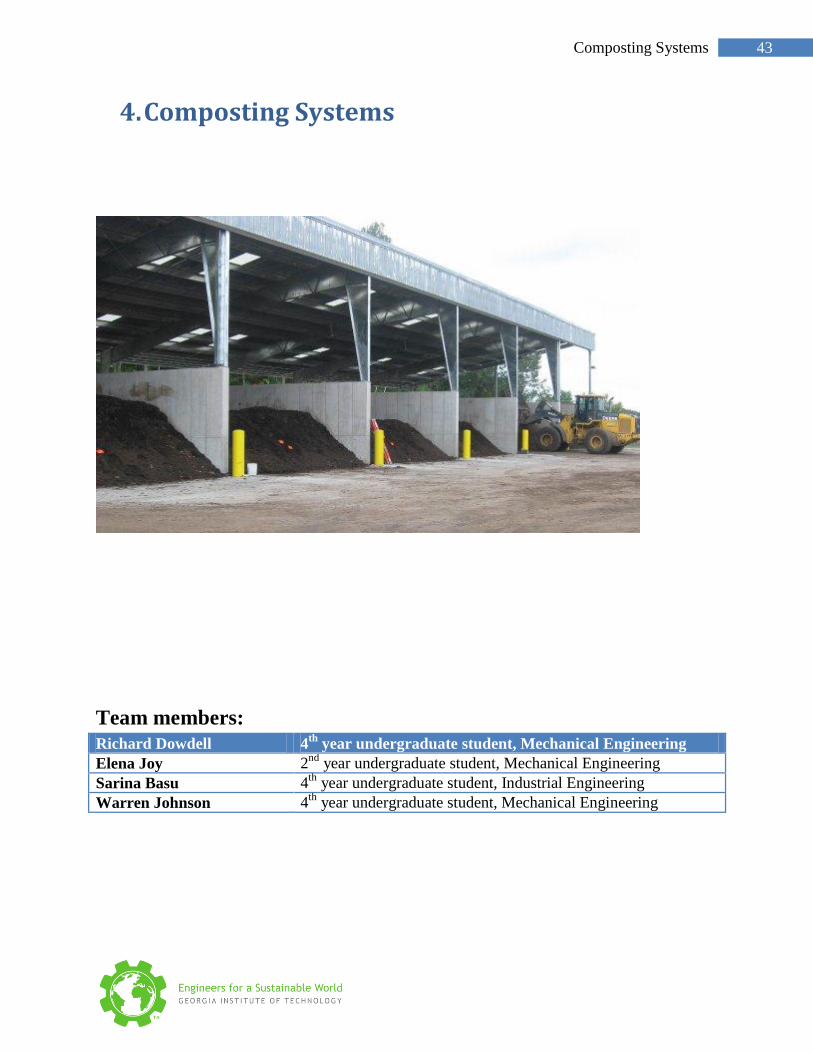
43 Composting Systems
Composting Systems 4.
Team members:
Richard Dowdell 4th
year undergraduate student, Mechanical Engineering
Elena Joy 2nd
year undergraduate student, Mechanical Engineering
Sarina Basu 4th
year undergraduate student, Industrial Engineering
Warren Johnson 4th
year undergraduate student, Mechanical Engineering
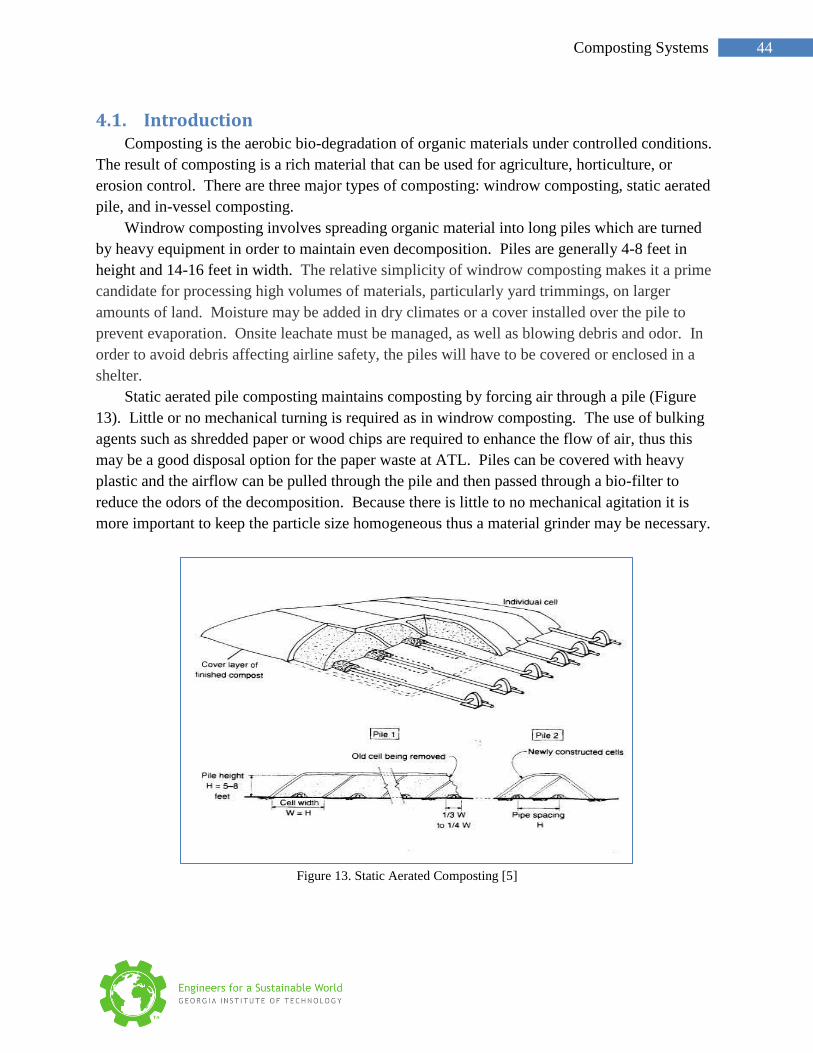
44 Composting Systems
Introduction 4.1.Composting is the aerobic bio-degradation of organic materials under controlled conditions.
The result of composting is a rich material that can be used for agriculture, horticulture, or
erosion control. There are three major types of composting: windrow composting, static aerated
pile, and in-vessel composting.
Windrow composting involves spreading organic material into long piles which are turned
by heavy equipment in order to maintain even decomposition. Piles are generally 4-8 feet in
height and 14-16 feet in width. The relative simplicity of windrow composting makes it a prime
candidate for processing high volumes of materials, particularly yard trimmings, on larger
amounts of land. Moisture may be added in dry climates or a cover installed over the pile to
prevent evaporation. Onsite leachate must be managed, as well as blowing debris and odor. In
order to avoid debris affecting airline safety, the piles will have to be covered or enclosed in a
shelter.
Static aerated pile composting maintains composting by forcing air through a pile (Figure
13). Little or no mechanical turning is required as in windrow composting. The use of bulking
agents such as shredded paper or wood chips are required to enhance the flow of air, thus this
may be a good disposal option for the paper waste at ATL. Piles can be covered with heavy
plastic and the airflow can be pulled through the pile and then passed through a bio-filter to
reduce the odors of the decomposition. Because there is little to no mechanical agitation it is
more important to keep the particle size homogeneous thus a material grinder may be necessary.
Figure 13. Static Aerated Composting [5]

45 Composting Systems
In-vessel composting occurs within a rigid enclosed container varying in size from 55-gallon
drums to a silo (Figure 14). Conditions inside the container must be closely regulated such as
temperature, moisture, and aeration to minimize leachate and odor production. Materials can be
ready in as little as 7-14 days though further curing is required. They have a high capital cost but
require less labor and land than static piles or windrows.
Figure 14. How Vertical In-Vessel Composting Works
Because ATL does not want to hire any more laborers and due to the complexity of odor
control, windrow composting is not an efficient method. However, static aerated pile
composting and in-vessel composting are both reasonable choices and each has their own pros
and cons.
Composting for ATL 4.2.The main goal of the composting facility at the airport is to create a high quality product that
can be used in ATL’s greenhouses. No matter which type of composting vessel is used, the
process is separated into three distinct sections: preprocessing, processing, and post processing.
Preprocessing
Preprocessing can be done in one of two ways. Unsorted material can bypass the
preprocessing step and go directly to the processing stage. Though this option saves time

46 Composting Systems
initially, skipping the preprocessing stage will result in a higher cost during the processing stage
and will yield a lower quality of product. The other option is to remove all non-compostable
items from ATL’s MSW. This preprocessing procedure incurs minimal cost and little labor,
especially when the materials are paper and other OFMSW.
Preprocessing paper simply means shredding the paper. This can be done with a small
household or office shredder or a large-scale shredder can be purchased. According to the
collected data, the airport accumulates 14.2 tons of paper per day. For this sizeable amount, a
large shredder should be purchased.
Suggested Shredder Specifications:
Brand: Intimus S16.50 Paper Shredder
Capacity: 350-450 sheets at one time
Shred Size: 1/4 inches
Input Width: 20 inches
Practical Capacity: 1800 pounds per hour
o 2000 lbs = 1 ton
o 14.2 tons = 28,420 lbs
o 1800 lbs = 1 hour
o 28,420 lbs per day = 15.78 hours per day
Weight: 1600 lbs
Dimensions (W” × D” × H”): 47.25 × 76.75 × 61
Accessories: Plastic Bags, Shred Box, Oiler
Table 7: Suggested Shredder Costs
Cost of Shredder $30,000
Shredder Bags (100 count) $90
Shredder Box $356
Automatic Oiler $499
Total $30,945
To sort yard trimmings, a laborer spreads out the incoming material and visually identifies
“large” pieces of wood, shrubbery, or other greens. The laborer manually picks these pieces out
and breaks them down into smaller pieces that can be more easily composted.
Preprocessing also involves all of the incoming material (with the exception of shredder
paper) to be reduced in size. After the laborer has taken care of the visually large pieces of yard
trimmings, all the material should be processed in machines called hammer mills and tub
grinders. This reduction in size is crucial for woody material mixed with other yard trimmings
because wood decomposes at a much slower rate and can therefore delay the development of the
compost end product.
A hammer mill is a steel drum containing a vertical or horizontal rotating shaft on which
hammers are mounted (Figure 15). The hammers swing on the ends of a cross or are fixed to the
central rotor. The rotor spins at a high speed inside the shaft while the input material is fed into a
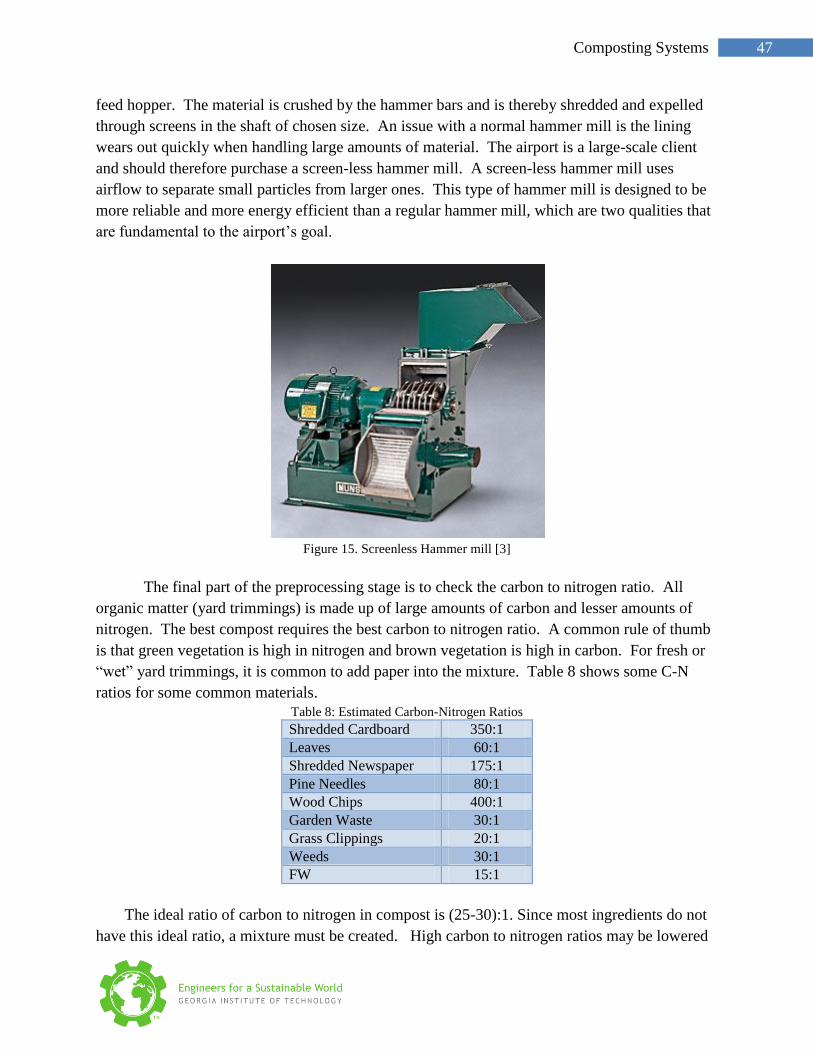
47 Composting Systems
feed hopper. The material is crushed by the hammer bars and is thereby shredded and expelled
through screens in the shaft of chosen size. An issue with a normal hammer mill is the lining
wears out quickly when handling large amounts of material. The airport is a large-scale client
and should therefore purchase a screen-less hammer mill. A screen-less hammer mill uses
airflow to separate small particles from larger ones. This type of hammer mill is designed to be
more reliable and more energy efficient than a regular hammer mill, which are two qualities that
are fundamental to the airport’s goal.
Figure 15. Screenless Hammer mill [3]
The final part of the preprocessing stage is to check the carbon to nitrogen ratio. All
organic matter (yard trimmings) is made up of large amounts of carbon and lesser amounts of
nitrogen. The best compost requires the best carbon to nitrogen ratio. A common rule of thumb
is that green vegetation is high in nitrogen and brown vegetation is high in carbon. For fresh or
“wet” yard trimmings, it is common to add paper into the mixture. Table 8 shows some C-N
ratios for some common materials.
Table 8: Estimated Carbon-Nitrogen Ratios
Shredded Cardboard 350:1
Leaves 60:1
Shredded Newspaper 175:1
Pine Needles 80:1
Wood Chips 400:1
Garden Waste 30:1
Grass Clippings 20:1
Weeds 30:1
FW 15:1
The ideal ratio of carbon to nitrogen in compost is (25-30):1. Since most ingredients do not
have this ideal ratio, a mixture must be created. High carbon to nitrogen ratios may be lowered
48 Composting Systems
by adding grass clippings and FW while low carbon to nitrogen ratios may be raised by adding
paper, dry leaves, or wood chips.
Processing
The second stage of the composting procedure is processing. There are a plethora of
techniques to choose from but given the airport’s needs and constraints, the two most reasonable
choices are static aerated piles or in-vessel composting.
Static Aerated Pile Composting 4.3.In aerated static pile composting, waste is mixed together in a large pile instead of in rows.
To aerate the pile, layers of loosely piled bulking agents (paper) are added so that air can pass
from the bottom to the top of the pile. There is no turning necessary to complete the composting
process.
In a more advanced technique, the piles can be placed over a network of pipes that deliver
air into or draw air out of the pile. For the bio-degradation to work evenly throughout the whole
pile it is very important that the temperature is even throughout the entire pile. Air blowers are
activated by a timer or by a temperature sensor [2]. When it is necessary to withdraw air from
the pile, the air can be filtrated with a bio-filter that is made from the finished compost [2]. The
bio-filter removes air pollution, thus also reducing odor. Using this method, the piles can be
fairly large which means they occupy less area.
The ideal weather for this method is a warm, arid climate. This is potentially problematic
since Atlanta is such a humid area. For this reason, aerated static piles are often located under a
shelter of some sort. During cold months, the core of the pile will retain its warm temperature.
However, aeration might be more difficult in the cold because this method involves passive air
flowing rather than active turning. Some aerated static piles are placed indoors with proper
ventilation [1].
Whenever a compost facility is implemented, odor control is always a concern. At a high
population area such as the airport, minimizing odor is extremely significant. Odor control can
be achieved by simply filtering the air pulled through the piles by the blowers through a bio-filter
made of already completed compost.
Equipment and Building Input
An aerated static pile composting facility requires an aeration system, including blowers,
pipes, aeration control, and temperature sensors. The aeration system can be as simple as
perforated pipes on the ground, or pipes embedded in the floor. Walls can be used for
containment. Other options include breathable fabric membranes or plastic sheets with holes [6].
Labor Input
Labor is required for mixing the material, loading and unloading the aerated composting
system, and monitoring temperatures. On an average yearly basis, relatively efficient large-scale
composting operations require one labor-hour for every 6 tons of incoming material, or
approximately one full-time worker per 10,000 tons, year in and year out [6]. Table 9 shows the
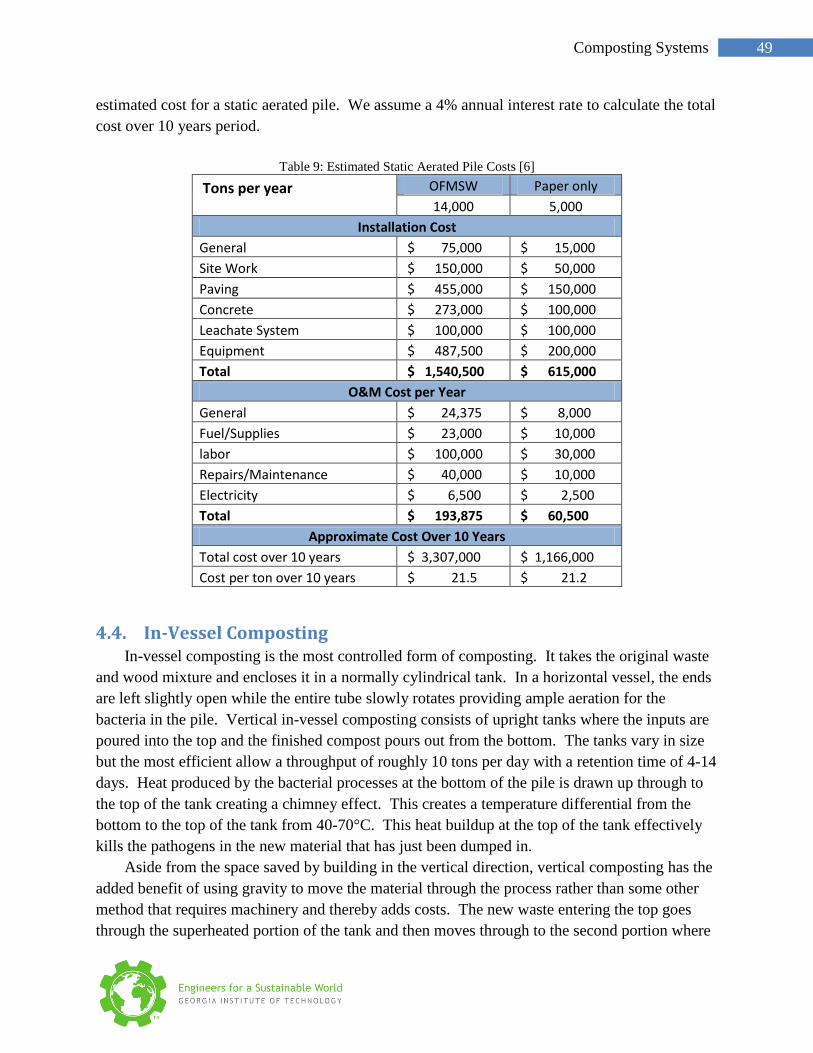
49 Composting Systems
estimated cost for a static aerated pile. We assume a 4% annual interest rate to calculate the total
cost over 10 years period.
Table 9: Estimated Static Aerated Pile Costs [6]
Tons per year
OFMSW Paper only
14,000 5,000
Installation Cost
General $ 75,000 $ 15,000
Site Work $ 150,000 $ 50,000
Paving $ 455,000 $ 150,000
Concrete $ 273,000 $ 100,000
Leachate System $ 100,000 $ 100,000
Equipment $ 487,500 $ 200,000
Total $ 1,540,500 $ 615,000
O&M Cost per Year
General $ 24,375 $ 8,000
Fuel/Supplies $ 23,000 $ 10,000
labor $ 100,000 $ 30,000
Repairs/Maintenance $ 40,000 $ 10,000
Electricity $ 6,500 $ 2,500
Total $ 193,875 $ 60,500
Approximate Cost Over 10 Years
Total cost over 10 years $ 3,307,000 $ 1,166,000
Cost per ton over 10 years $ 21.5 $ 21.2
In-Vessel Composting 4.4.In-vessel composting is the most controlled form of composting. It takes the original waste
and wood mixture and encloses it in a normally cylindrical tank. In a horizontal vessel, the ends
are left slightly open while the entire tube slowly rotates providing ample aeration for the
bacteria in the pile. Vertical in-vessel composting consists of upright tanks where the inputs are
poured into the top and the finished compost pours out from the bottom. The tanks vary in size
but the most efficient allow a throughput of roughly 10 tons per day with a retention time of 4-14
days. Heat produced by the bacterial processes at the bottom of the pile is drawn up through to
the top of the tank creating a chimney effect. This creates a temperature differential from the
bottom to the top of the tank from 40-70°C. This heat buildup at the top of the tank effectively
kills the pathogens in the new material that has just been dumped in.
Aside from the space saved by building in the vertical direction, vertical composting has the
added benefit of using gravity to move the material through the process rather than some other
method that requires machinery and thereby adds costs. The new waste entering the top goes
through the superheated portion of the tank and then moves through to the second portion where
50 Composting Systems
the lower heat is just enough to facilitate the natural breakdown of all the solid waste and wood
particles. As it passes into the third and final stage, the compost is in its final breakdown stages
and producing the most heat. The fresh air drawn up through the bottom accelerates the final
composting processes and readies the lower level for removal to make space for the next input.
This process doesn’t require bio-filtration, temperature or air control, or agitation. With the
near lack of moving parts, operating and maintenance costs are very low. Because the entire
process is sealed off, temperature and smell is automatically controlled and maintained.
Cost Considerations
ATL does not have to worry about land acquisition. In terms of equipment procurement
there will be a need for composting vessels, loading equipment, conveyors, air supply
equipment, and odor control equipment. Operation and maintenance labor will need to be
included as well as electrically powering the operation and treating the water supply.
Cost Estimation
Annual operation and maintenance is $200 per ton of processed waste. Fees for equipment,
maintenance, and fuel are estimated at around $450,000 per year. Given these assumptions, the
total cost of In-vessel composting would be around $192 per ton for a 10-year period.
Post Processing
The final stage of the composting procedure is post processing. This stage is optional;
however, it is often implemented to refine the compost into the end user’s specifications. The
same equipment used in the preprocessing stage can be used in the post processing stage. The
main purpose of the post processing procedure is to get the composted product into a uniform
size. Simply run the finished product through the hammer mill. The result is the finished
compost product.
51 Composting Systems
References 4.5.1. "Aerated Static Pile Composting." EPA. Environmental Protection Agency, 3 Nov. 2011. Web. 06 Apr.
2012. <http://www.epa.gov/osw/conserve/rrr/composting/static.htm>.
2. "Biosolids Technology Fact Sheet In-Vessel Composting of Biosolids." National Service Center for
Environmental Publications. Web. 06 Apr. 2012.
<http://nepis.epa.gov/Exe/ZyNET.exe/901U0V00.txt?ZyActionD=ZyDocument>.
3. "Hammer Mill Function." Web. 06 Apr. 2012. < http://diqky.blogspot.com/2009/11/hammer-mill-
function.html >.
4. Haaren, R.“Large scale aerobic composting of source separated organic wastes: A comparative study
of environmental impacts, costs, and contextual effects.” Earth Engineering Center, Columbia
University, <http://www.seas.columbia.edu/earth/wtert/sofos/haaren_thesis.pdf>
5. "Compost System and Training." Compostwerks.com. Web. 05 Apr. 2012.
<http://www.compostwerks.com/O2Compost_Compostwerks_Info_Packet.pdf>.
6. "Integration of Renewable Energy on Farms - Composting - Aerated Static Pile."
Composting-Aerated Static Pile. Integration of Renewable Energy Farms, 31 Mar. 2008. Web. 06 Apr.
2012. <http://www.farm-energy.ca/IReF/index.php?page=aerated-static-pile-ataglance>.
52 Offsite Composting
Offsite Composting 5.
Team members:
Sanjay Arora PhD student, Public Policy
Pratik Irudayaraj 4th
year undergraduate student, Industrial Engineering
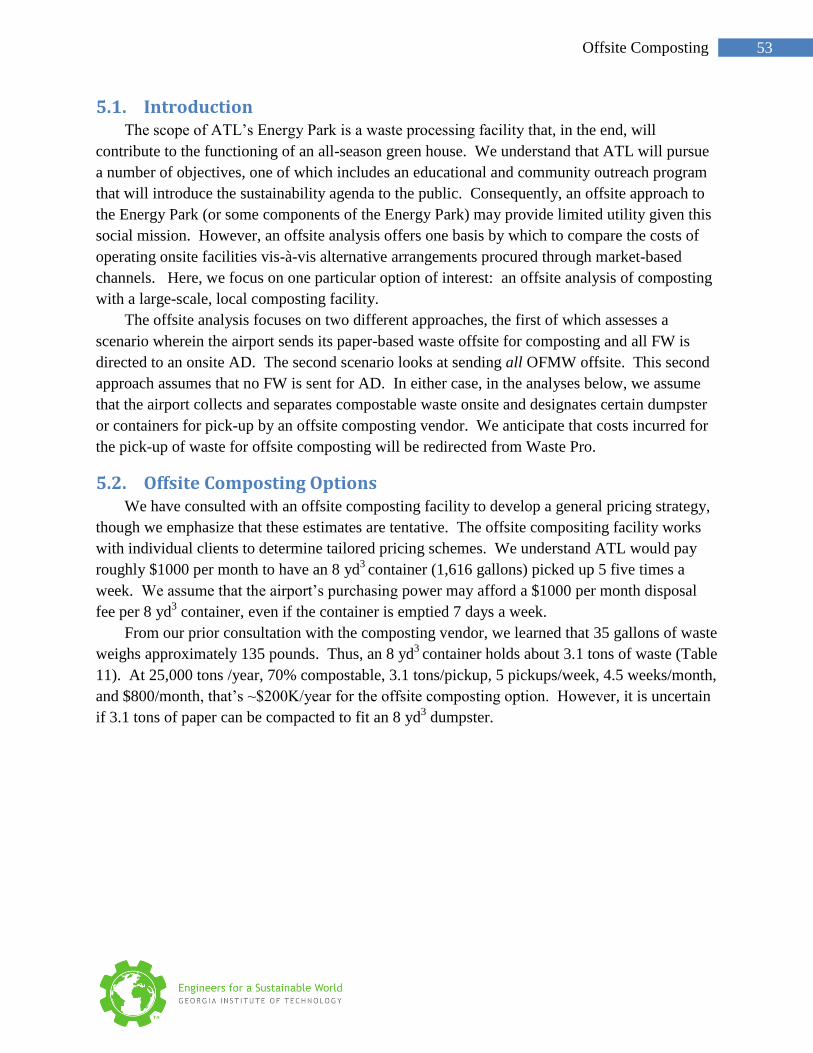
53 Offsite Composting
Introduction 5.1.The scope of ATL’s Energy Park is a waste processing facility that, in the end, will
contribute to the functioning of an all-season green house. We understand that ATL will pursue
a number of objectives, one of which includes an educational and community outreach program
that will introduce the sustainability agenda to the public. Consequently, an offsite approach to
the Energy Park (or some components of the Energy Park) may provide limited utility given this
social mission. However, an offsite analysis offers one basis by which to compare the costs of
operating onsite facilities vis-à-vis alternative arrangements procured through market-based
channels. Here, we focus on one particular option of interest: an offsite analysis of composting
with a large-scale, local composting facility.
The offsite analysis focuses on two different approaches, the first of which assesses a
scenario wherein the airport sends its paper-based waste offsite for composting and all FW is
directed to an onsite AD. The second scenario looks at sending all OFMW offsite. This second
approach assumes that no FW is sent for AD. In either case, in the analyses below, we assume
that the airport collects and separates compostable waste onsite and designates certain dumpster
or containers for pick-up by an offsite composting vendor. We anticipate that costs incurred for
the pick-up of waste for offsite composting will be redirected from Waste Pro.
Offsite Composting Options 5.2.We have consulted with an offsite composting facility to develop a general pricing strategy,
though we emphasize that these estimates are tentative. The offsite compositing facility works
with individual clients to determine tailored pricing schemes. We understand ATL would pay
roughly $1000 per month to have an 8 yd3
container (1,616 gallons) picked up 5 five times a
week. We assume that the airport’s purchasing power may afford a $1000 per month disposal
fee per 8 yd3 container, even if the container is emptied 7 days a week.
From our prior consultation with the composting vendor, we learned that 35 gallons of waste
weighs approximately 135 pounds. Thus, an 8 yd3
container holds about 3.1 tons of waste (Table
11). At 25,000 tons /year, 70% compostable, 3.1 tons/pickup, 5 pickups/week, 4.5 weeks/month,
and $800/month, that’s ~$200K/year for the offsite composting option. However, it is uncertain
if 3.1 tons of paper can be compacted to fit an 8 yd3 dumpster.
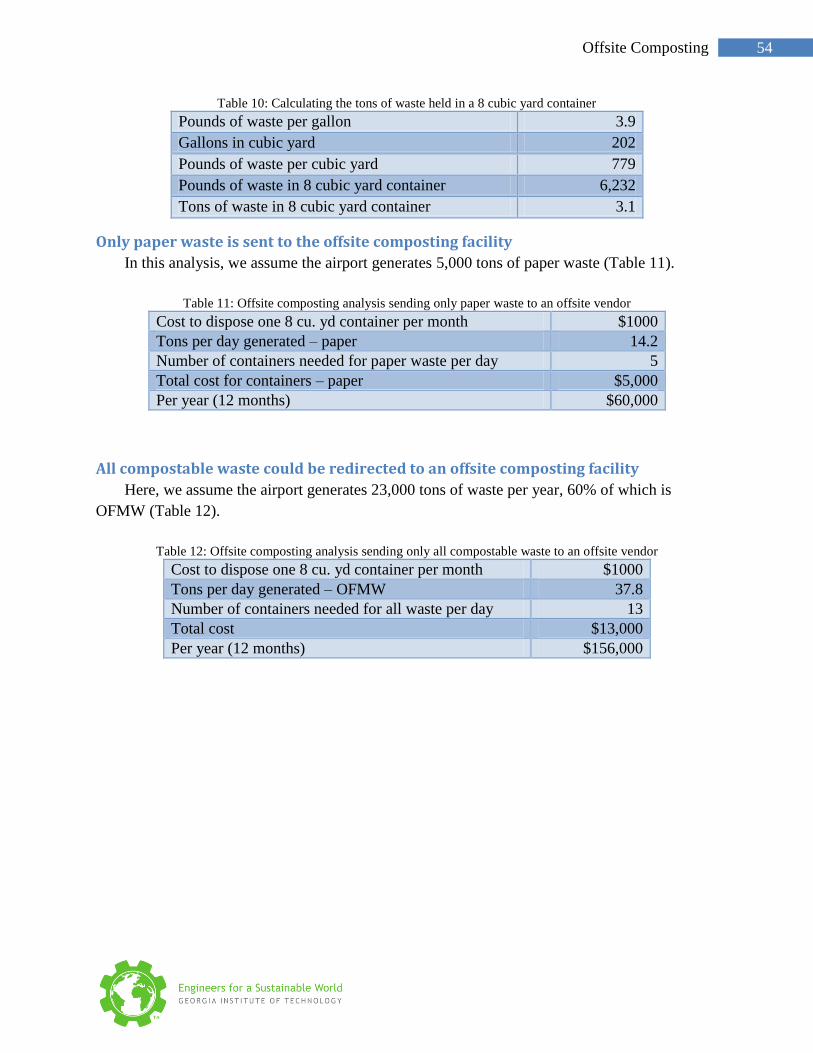
54 Offsite Composting
Table 10: Calculating the tons of waste held in a 8 cubic yard container
Pounds of waste per gallon 3.9
Gallons in cubic yard 202
Pounds of waste per cubic yard 779
Pounds of waste in 8 cubic yard container 6,232
Tons of waste in 8 cubic yard container 3.1
Only paper waste is sent to the offsite composting facility
In this analysis, we assume the airport generates 5,000 tons of paper waste (Table 11).
Table 11: Offsite composting analysis sending only paper waste to an offsite vendor
Cost to dispose one 8 cu. yd container per month $1000
Tons per day generated – paper 14.2
Number of containers needed for paper waste per day 5
Total cost for containers – paper $5,000
Per year (12 months) $60,000
All compostable waste could be redirected to an offsite composting facility
Here, we assume the airport generates 23,000 tons of waste per year, 60% of which is
OFMW (Table 12).
Table 12: Offsite composting analysis sending only all compostable waste to an offsite vendor
Cost to dispose one 8 cu. yd container per month $1000
Tons per day generated – OFMW 37.8
Number of containers needed for all waste per day 13
Total cost $13,000
Per year (12 months) $156,000
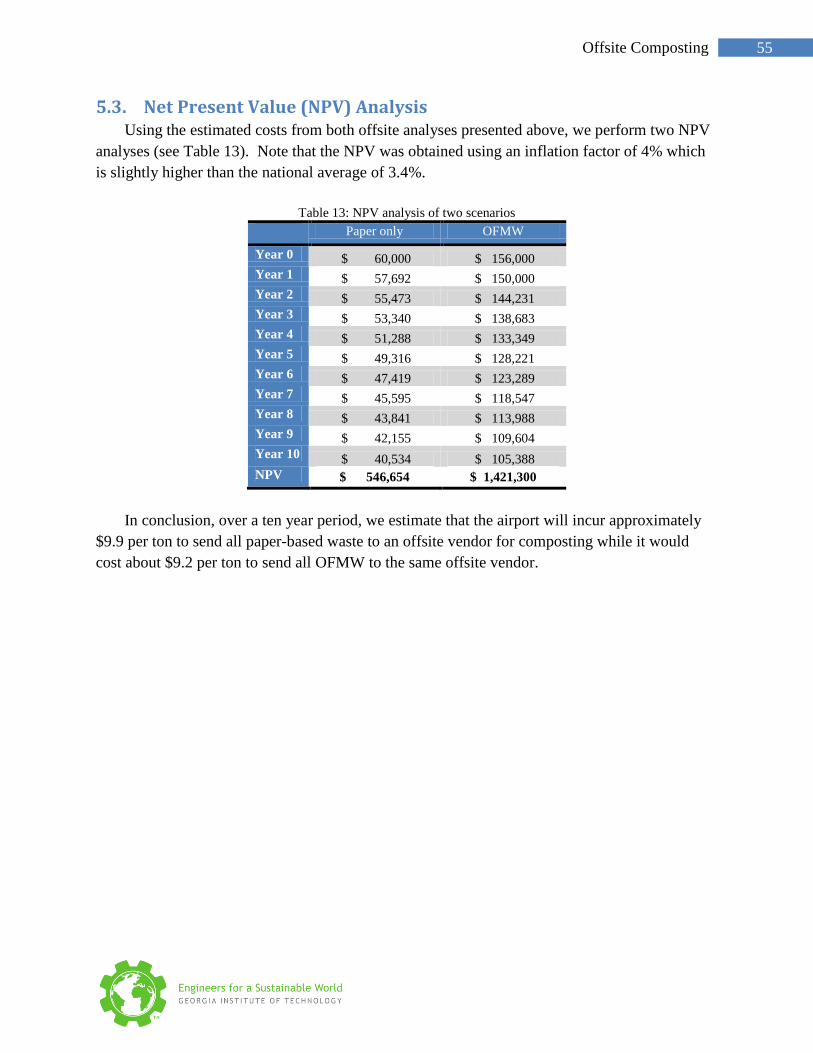
55 Offsite Composting
Net Present Value (NPV) Analysis 5.3.Using the estimated costs from both offsite analyses presented above, we perform two NPV
analyses (see Table 13). Note that the NPV was obtained using an inflation factor of 4% which
is slightly higher than the national average of 3.4%.
Table 13: NPV analysis of two scenarios
Paper only OFMW
Year 0 $ 60,000 $ 156,000
Year 1 $ 57,692 $ 150,000
Year 2 $ 55,473 $ 144,231
Year 3 $ 53,340 $ 138,683
Year 4 $ 51,288 $ 133,349
Year 5 $ 49,316 $ 128,221
Year 6 $ 47,419 $ 123,289
Year 7 $ 45,595 $ 118,547
Year 8 $ 43,841 $ 113,988
Year 9 $ 42,155 $ 109,604
Year 10 $ 40,534 $ 105,388
NPV $ 546,654 $ 1,421,300
In conclusion, over a ten year period, we estimate that the airport will incur approximately
$9.9 per ton to send all paper-based waste to an offsite vendor for composting while it would
cost about $9.2 per ton to send all OFMW to the same offsite vendor.
56 Biofuel from Paper Waste
Biofuel from Paper Waste 6.
Team member:
Christopher Capocasale 1st year undergraduate student, Mechanical Engineering
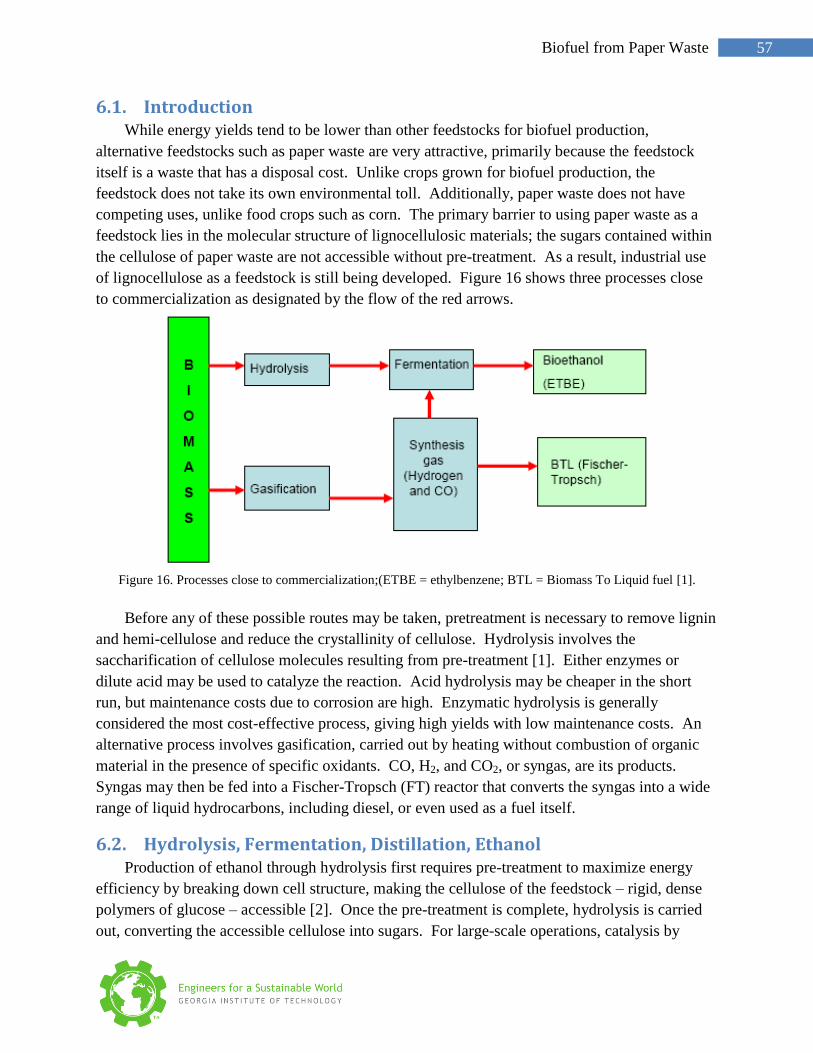
57 Biofuel from Paper Waste
Introduction 6.1.While energy yields tend to be lower than other feedstocks for biofuel production,
alternative feedstocks such as paper waste are very attractive, primarily because the feedstock
itself is a waste that has a disposal cost. Unlike crops grown for biofuel production, the
feedstock does not take its own environmental toll. Additionally, paper waste does not have
competing uses, unlike food crops such as corn. The primary barrier to using paper waste as a
feedstock lies in the molecular structure of lignocellulosic materials; the sugars contained within
the cellulose of paper waste are not accessible without pre-treatment. As a result, industrial use
of lignocellulose as a feedstock is still being developed. Figure 16 shows three processes close
to commercialization as designated by the flow of the red arrows.
Figure 16. Processes close to commercialization;(ETBE = ethylbenzene; BTL = Biomass To Liquid fuel [1].
Before any of these possible routes may be taken, pretreatment is necessary to remove lignin
and hemi-cellulose and reduce the crystallinity of cellulose. Hydrolysis involves the
saccharification of cellulose molecules resulting from pre-treatment [1]. Either enzymes or
dilute acid may be used to catalyze the reaction. Acid hydrolysis may be cheaper in the short
run, but maintenance costs due to corrosion are high. Enzymatic hydrolysis is generally
considered the most cost-effective process, giving high yields with low maintenance costs. An
alternative process involves gasification, carried out by heating without combustion of organic
material in the presence of specific oxidants. CO, H2, and CO2, or syngas, are its products.
Syngas may then be fed into a Fischer-Tropsch (FT) reactor that converts the syngas into a wide
range of liquid hydrocarbons, including diesel, or even used as a fuel itself.
Hydrolysis, Fermentation, Distillation, Ethanol 6.2.Production of ethanol through hydrolysis first requires pre-treatment to maximize energy
efficiency by breaking down cell structure, making the cellulose of the feedstock – rigid, dense
polymers of glucose – accessible [2]. Once the pre-treatment is complete, hydrolysis is carried
out, converting the accessible cellulose into sugars. For large-scale operations, catalysis by
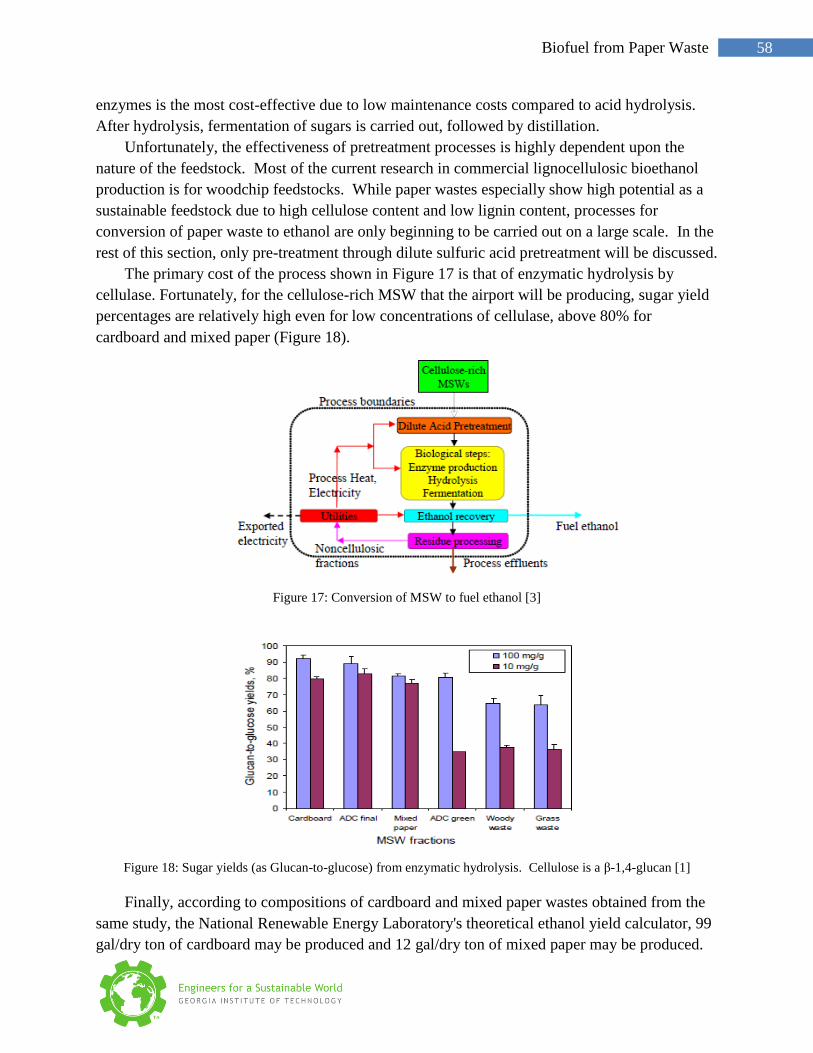
58 Biofuel from Paper Waste
enzymes is the most cost-effective due to low maintenance costs compared to acid hydrolysis.
After hydrolysis, fermentation of sugars is carried out, followed by distillation.
Unfortunately, the effectiveness of pretreatment processes is highly dependent upon the
nature of the feedstock. Most of the current research in commercial lignocellulosic bioethanol
production is for woodchip feedstocks. While paper wastes especially show high potential as a
sustainable feedstock due to high cellulose content and low lignin content, processes for
conversion of paper waste to ethanol are only beginning to be carried out on a large scale. In the
rest of this section, only pre-treatment through dilute sulfuric acid pretreatment will be discussed.
The primary cost of the process shown in Figure 17 is that of enzymatic hydrolysis by
cellulase. Fortunately, for the cellulose-rich MSW that the airport will be producing, sugar yield
percentages are relatively high even for low concentrations of cellulase, above 80% for
cardboard and mixed paper (Figure 18).
Figure 17: Conversion of MSW to fuel ethanol [3]
Figure 18: Sugar yields (as Glucan-to-glucose) from enzymatic hydrolysis. Cellulose is a β-1,4-glucan [1]
Finally, according to compositions of cardboard and mixed paper wastes obtained from the
same study, the National Renewable Energy Laboratory's theoretical ethanol yield calculator, 99
gal/dry ton of cardboard may be produced and 12 gal/dry ton of mixed paper may be produced.

59 Biofuel from Paper Waste
Assuming mixed paper to contain newspaper, magazines, office paper, and other paper, up to
1,364,551 gallons of ethanol per year may be produced, using numbers from Waste
Characterization Report [5].
While commercialization of the processes discussed is only beginning, the technologies
discussed show great potential. Combined with minimal costs of feedstock from the airport, this
process shows potential for profitability.
Gasification, Fischer-Tropsch synthesis, Diesel/Gasoline 6.3.Gasification is a multi-step process that any carbonaceous material may undergo (Figure
19). It involves partial combustion, usually at temperatures around 700°C where volatile
components react with one of several oxidants to form syngas, consisting mostly of CO, CO2 and
H2, and heat, while part the material remains solid. Air, steam, and oxygen, or some mixture of
these is generally used as an oxidant [1]. While oxygen is the most advantageous choice, it is
prohibitively expensive. Generally, some mix of oxygen and air is used. Steam, due to an
increased presence of hydrogen, may be used to create methane gas, which is not desirable for
FT synthesis. The primary advantage of gasification is that it allows production of syngas from
any carbonaceous material with only a slight variation in the process. In addition, gasification is
a commonly used industrial process and, as such, is well documented. While gasification
processes are many and varied, the most reliable gasification system for large-scale operations is
the fluidized bed gasifier [1], offering much quicker gasification than other processes.
Figure 19: Typical gasification-FT synthesis scheme [1]
The primary drawback of gasification processes is the necessity of gas cleaning. Residues
from the gasification reactions are present in the syngas, forming contaminant tars. One of
several methods, including scrubbers, may be used to cleanse the syngas of tars. A final cleaning
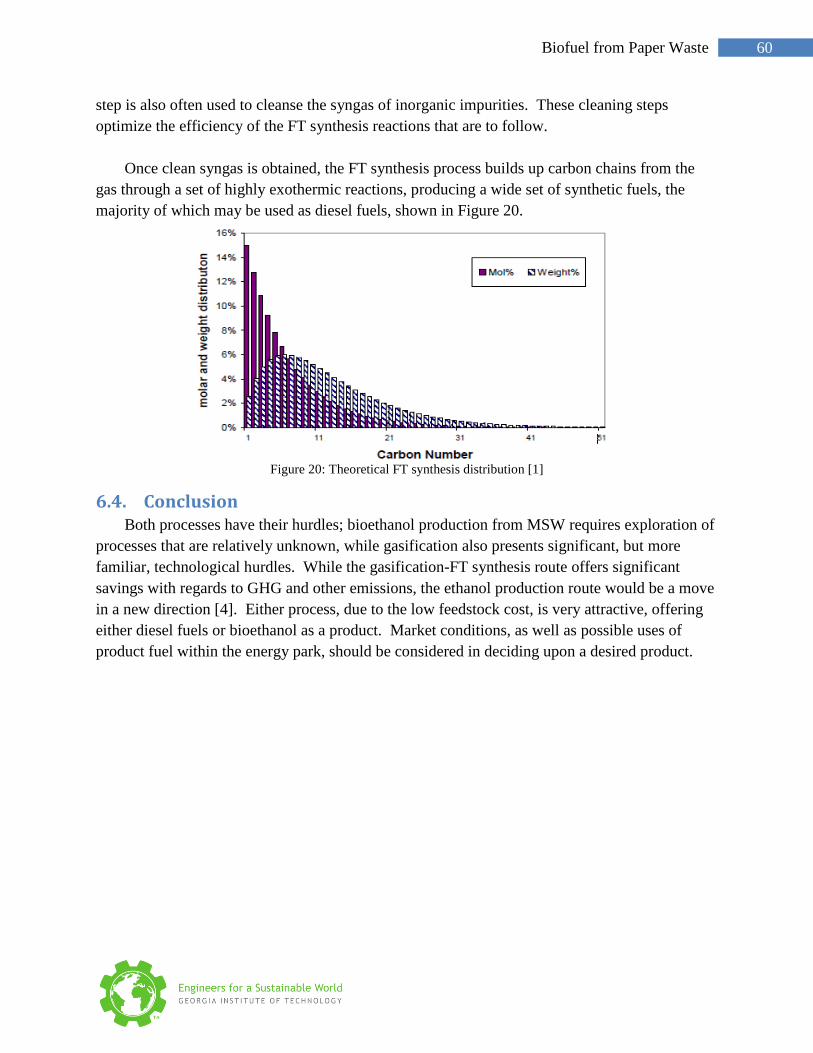
60 Biofuel from Paper Waste
step is also often used to cleanse the syngas of inorganic impurities. These cleaning steps
optimize the efficiency of the FT synthesis reactions that are to follow.
Once clean syngas is obtained, the FT synthesis process builds up carbon chains from the
gas through a set of highly exothermic reactions, producing a wide set of synthetic fuels, the
majority of which may be used as diesel fuels, shown in Figure 20.
Figure 20: Theoretical FT synthesis distribution [1]
Conclusion 6.4.Both processes have their hurdles; bioethanol production from MSW requires exploration of
processes that are relatively unknown, while gasification also presents significant, but more
familiar, technological hurdles. While the gasification-FT synthesis route offers significant
savings with regards to GHG and other emissions, the ethanol production route would be a move
in a new direction [4]. Either process, due to the low feedstock cost, is very attractive, offering
either diesel fuels or bioethanol as a product. Market conditions, as well as possible uses of
product fuel within the energy park, should be considered in deciding upon a desired product.
61 Biofuel from Paper Waste
References 6.5.1. Øyvind Vessia. “Biofuels from Lignocellulosic Material in the Norwegian Context 2010: Technology,
potential, and Costs.” Trondheim. 20 December 2005. <http://www.zero. no/transport/biodrivstoff/hva-
er-biodrivstoff/andregenerasjons-biodiesel/biofuels-from-lignocellulosic-material.pdf>.
2. Verma, Amrita, Santosh Kumar, and P.K. Jain. "Key Pretreatment Technologies on Cellulosic Ethanol
Production." Journal of Scientific Research 55 (2011): 57-63. Print.
3. Jian Shi, Mirvat Ebrik, Bin Yang, and Charles E. Wyman. “The Potential of Cellulosic Ethanol
Production from Municipal Solid Waste: A Technical and Economic Evaluation.” April 2009. Web.
<http://www.ucei.berkeley.edu/PDF/EDT_015.pdf>.
4. “Well-to-Wheels Analysis of Future Automotive Fuels and Powertrains In the European Context.”
Version 2c, March 2007. Web. <http://ies.jrc.ec.europa.eu/uploads/media/WTW_Re port_010307.pdf>.
5. Camp Dresser & McKee (CDM). 2006 Waste Characterization Report. Tech. Final ed. Atlanta,
Georgia. Print.
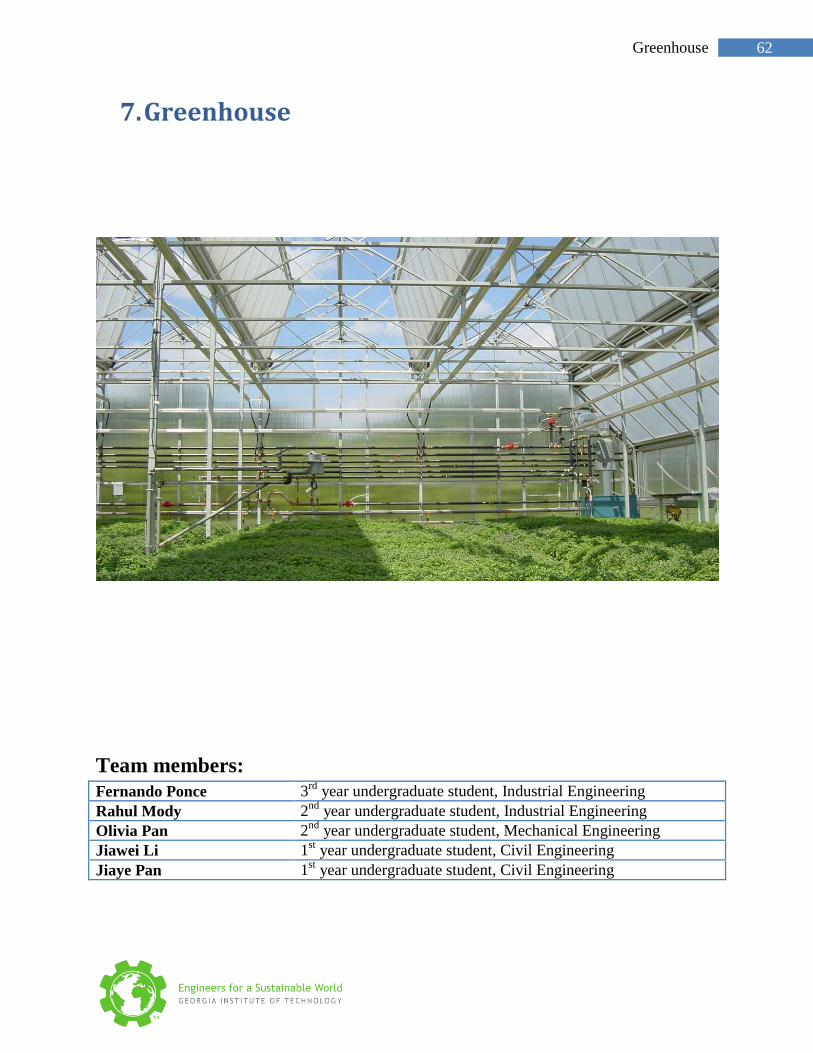
62 Greenhouse
Greenhouse 7.
Team members:
Fernando Ponce 3rd
year undergraduate student, Industrial Engineering
Rahul Mody 2nd
year undergraduate student, Industrial Engineering
Olivia Pan 2nd
year undergraduate student, Mechanical Engineering
Jiawei Li 1st year undergraduate student, Civil Engineering
Jiaye Pan 1st year undergraduate student, Civil Engineering
63 Greenhouse
Introduction 7.1.In this chapter different crop alternatives are evaluated to grow in greenhouses. Three
energy crops are considered and compared with growing non-energy crops using hydroponics
technology.
Algae 7.2.Algae are an attractive biofuel because of their fast growth rates and improved land use
efficiency when compared with ground-based crops. Converting algal biomass into energy
requires the following three distinct chronological processes: cultivating the algae, harvesting the
biomass, and converting the biomass into usable fuel.
Cultivation of Algal Biomass
The efficiency of algae biodiesel production is contingent on lipid productivity and the
growth rate of algae cells. The development of high lipid content appears to be triggered during
conditions of nutrient limitation, particularly nitrate. During these stressful periods, algae shift
biosynthetic pathways and produce lipids called triacylglycerols (TAGs), which accumulate in
the cytoplasm for the purpose of energy and carbon storage. However, intentionally cultivating
algae in stressful conditions inhibits cell division, which can lead to decreased overall lipid
productivity. Numerous cultivation systems designed to generate algal biofuel feedstocks have
been proposed, some are:
1. Wastewater Treatment Ponds
2. Raceway Ponds
3. Photobioreactors (PBRs)
Wastewater HRPs represent an inexpensive, low-technology approach to algal cultivation.
However, limited solar exposure resulting from increased operating depths results in lower cell
densities than are achievable with raceway ponds and PBR systems. Flat panel and tubular PBR
systems generate higher biomass concentrations, produce less evaporative losses, and prevent
contamination when compared with open ponds. It is also important to consider that the high
operating and construction cost of PBR systems may limit their application for large-scale
production of low value products, such as biofuel feedstocks. Providing elevated concentrations
of CO2 to algal cultures increases growth rates and it has been suggested that algal cultivation
operations be constructed in close proximity to coal-fired power plants, such that flue gas could
be used as a CO2 source.
Algal Harvesting
Harvesting algae is difficult because of their small size, low specific gravity, and negative
surface charges, which produce stable algal suspensions throughout the water column.
Techniques for recovering algal biomass are classified as either primary or secondary harvesting.
Primary harvesting refers to the separation of the algal cells from their growth media and can be
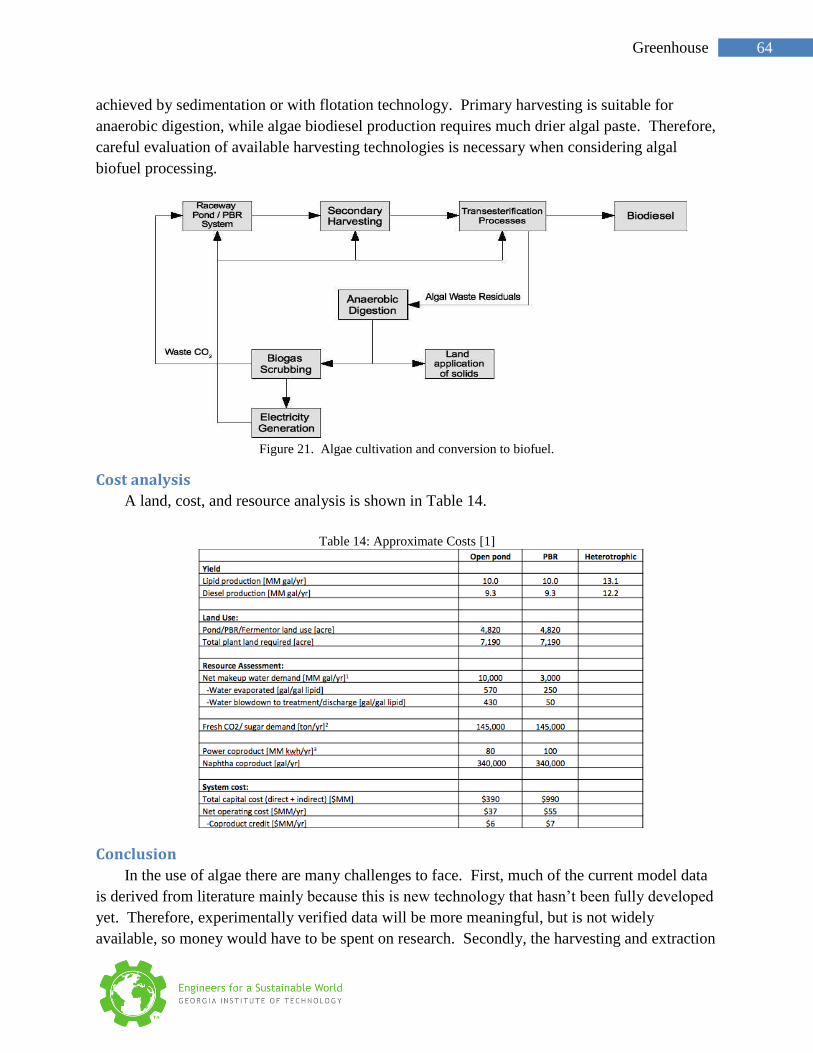
64 Greenhouse
achieved by sedimentation or with flotation technology. Primary harvesting is suitable for
anaerobic digestion, while algae biodiesel production requires much drier algal paste. Therefore,
careful evaluation of available harvesting technologies is necessary when considering algal
biofuel processing.
Figure 21. Algae cultivation and conversion to biofuel.
Cost analysis
A land, cost, and resource analysis is shown in Table 14.
Table 14: Approximate Costs [1]
Conclusion
In the use of algae there are many challenges to face. First, much of the current model data
is derived from literature mainly because this is new technology that hasn’t been fully developed
yet. Therefore, experimentally verified data will be more meaningful, but is not widely
available, so money would have to be spent on research. Secondly, the harvesting and extraction
65 Greenhouse
process unit operations possess high degree of uncertainty. Thirdly, there are many possible
combinations of process technology and configuration not currently modeled that would need to
be researched. Finally, the sustainability of the project (e.g. water and resource requirements) is
also an issue that needs to be taken into account.
The lower density of algal biomass present in wastewater ponds systems suggests that
anaerobic digestion is the most appropriate energy pathway. As these systems produce less
biomass than raceway ponds and PBR systems, it is unlikely that wastewater ponds will be used
for large-scale algae cultivation, so this one can be discarded as an option for the airport project.
Instead, these systems represent a low-technology, community-scale approach to algal biofuels.
If an algae pathway is taken, the most recommended option would be photobioreactors (PBR),
because even though they are more expensive than raceway ponds, as shown in the cost analysis
table, this technology is more suitable for large scale production than the later one.
66 Greenhouse
Camelina 7.3.Camelina is a new crop put in practice to produce biofuel. It is well tested at Montana State
University (MSU) and the biofuel it produces has gone through the test by United States Air
Force's Alternative Fuels Certification Division. Camelina plants are heavily branched, growing
to heights of one to three feet. They become woody as they mature. It is a short-seasoned (85-
100 day) crop, best adapted to cooler climates where excessive heat during flowering does not
occur. Camelina is a cool season crop that needs to be planted early to attain maximum yields.
In the case of Atlanta, the best season to plant camelina would be winter.
Camelina sativa was evaluated in a multi-species oilseed trial at the MSU Agricultural
Research Center in 2004. This trial included nine oilseed crops (sunflower, safflower, soybean,
rapeseed, mustard, flax, crambe, canola, and camelina). Evaluation parameters included input
costs, production costs, harvest costs, and yield. The net value of the crop was determined
utilizing current oil and meal prices. Camelina sativa was not the highest yielding crop but it
was the most economical crop to produce due to minimal input requirements. For example,
canola seed costs approximately $0.075/lb while Camelina sativa costs 0.015-0.025/lb [4].
Camelina biodiesel has been produced and evaluated by commercial biodiesel
manufacturers including Core IV, Wyoming Biodiesel, Peaks and Prairies, and Great Northern
Growers. Studies have shown camelina-based jet fuel to reduce net carbon emissions from jets
by about 80%. Camelina biodiesel performance appears to be equal in value and
indistinguishable from biodiesel produced from other oilseed crops such as soybean.
Yield
Camelina is well suited for marginal soils. According to MSU research, camelina has a
lower break-even cost than wheat and canola. The seed can be broadcast or drilled at 2.5 to 3
lbs/acre. The seeds are dense and small at 345,000 to 465,000 seeds per pound. Yields vary
depending on soils and rainfall. Camelina will average 1,800-2,200 lbs/acre under 16-18 inches
of rainfall. In other dryland research trials, camelina yields averaged 1,000-1,700 lbs/acre.
Yields drop with less rainfall and increase when using irrigation. MSU suggests including
camelina in a three- or four-year crop rotation [5], however if the need for crop rotation is due to
low nutrient content in the soil, camelina may be grown continuously if FW is used as a
fertilizer.
67 Greenhouse
Duckweed 7.4.Duckweed is very simple, lacking an obvious stem or leaves. They consist of a small
'thalloid' or plate-like structure that floats on or just under the water surface, with or without
simple rootlets. The plants are highly reduced from their earlier relatives in Araceae, a family of
flowering plants. Duckweed is an important high-protein food source for waterfowl and also is
eaten by humans in some parts of Southeast Asia. As it contains more protein than soybeans and
five to six times more starch than corn, it is sometimes cited as a significant potential food source
especially as a fish feed [6].
Potential Uses
The plants can provide up to 99% nitrate and phosphorus removal from wastewater streams.
They grow rapidly – doubling in mass about every 2-3 days. For these reasons they are touted as
water purifiers of untapped value. The Swiss Department of Water and Sanitation in Developing
Countries, SANDEC, associated with the Swiss Federal Institute for Environmental Science and
Technology, asserts that as well as the food and agricultural values, duckweed also may be used
for waste water treatment to capture toxins and for odor control, and, that if a mat of duckweed is
maintained during harvesting for removal of the toxins captured thereby, it prevents the
development of algae and controls the breeding of mosquitoes. Finally, duckweed cover may
also be used to conserve water by reducing evaporation rates [7].
Energy
Duckweed also has potential as a fuel due to high starch and low lignin content. While the
harvesting of the energy stored in Duckweed is not as simple as that from grains, duckweed has
much greater energy potential than most conventional biological energy sources. This potential
is increased due to duckweed’s extremely high growth rates. Growth may be accelerated by over
40% by increasing the CO2 concentration from 450-550 ppm. Exhaust gas from the CHP unit
could be used as this CO2 source.
After harvesting the duckweed, it is first homogenized using a poly-phasic separator. The
homogenized duckweed is then fed into a gasifier, where it is oxidized at high temperature,
producing char and the product gas, known as syngas, which consists mainly of CO, H2, and
CO2. Syngas may be burned directly as a natural gas or subject to various upgrading processes,
while the char may be used reused to fuel the gasifier.
Challenges
In order to maximize growth rates, still water environments with high nitrogen content are
necessary. The effluent from an anaerobic digester or ATL itself would be ideal for cultivating
duckweed. Duckweed requires still water with less than 1 m/s velocity [7]. To suppress algae
growth, odour, and mosquito breeding, complete surface cover is essential. Thus, it is
recommended that only 1/10th
of the surface area be harvested on a daily basis. In addition,
duckweed cultivation is water-intensive which may not be an issue if the wastewater from the
ATL were used as the source of water. Water level and acidity must be controlled. Finally, high
concentrations of fatty acids, oil, and grease are known to negatively affect duckweed growth by
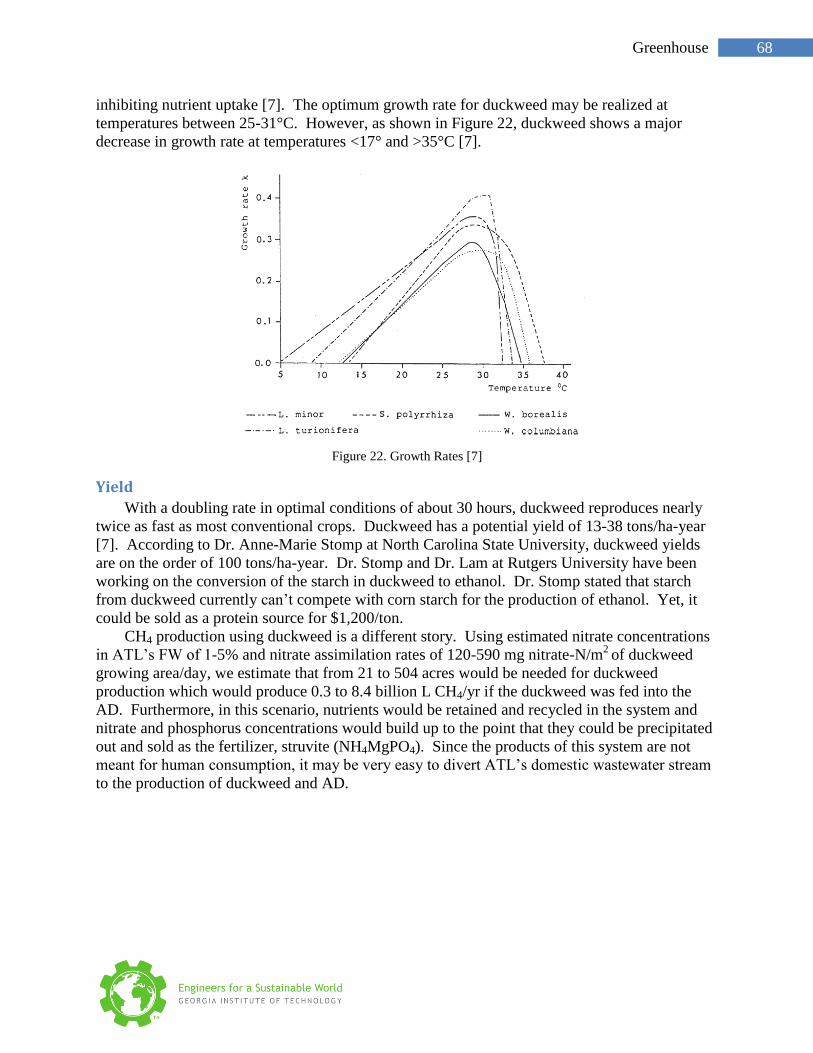
68 Greenhouse
inhibiting nutrient uptake [7]. The optimum growth rate for duckweed may be realized at
temperatures between 25-31°C. However, as shown in Figure 22, duckweed shows a major
decrease in growth rate at temperatures <17° and >35°C [7].
Figure 22. Growth Rates [7]
Yield
With a doubling rate in optimal conditions of about 30 hours, duckweed reproduces nearly
twice as fast as most conventional crops. Duckweed has a potential yield of 13-38 tons/ha-year
[7]. According to Dr. Anne-Marie Stomp at North Carolina State University, duckweed yields
are on the order of 100 tons/ha-year. Dr. Stomp and Dr. Lam at Rutgers University have been
working on the conversion of the starch in duckweed to ethanol. Dr. Stomp stated that starch
from duckweed currently can’t compete with corn starch for the production of ethanol. Yet, it
could be sold as a protein source for $1,200/ton.
CH4 production using duckweed is a different story. Using estimated nitrate concentrations
in ATL’s FW of 1-5% and nitrate assimilation rates of 120-590 mg nitrate-N/m2
of duckweed
growing area/day, we estimate that from 21 to 504 acres would be needed for duckweed
production which would produce 0.3 to 8.4 billion L CH4/yr if the duckweed was fed into the
AD. Furthermore, in this scenario, nutrients would be retained and recycled in the system and
nitrate and phosphorus concentrations would build up to the point that they could be precipitated
out and sold as the fertilizer, struvite (NH4MgPO4). Since the products of this system are not
meant for human consumption, it may be very easy to divert ATL’s domestic wastewater stream
to the production of duckweed and AD.

69 Greenhouse
Hydroponica 7.5.Hydroponics is the method of growing plants in water without soil. Hydroponics systems
have been featured in Times Magazine as the World’s Best Invention and provides up to 20
times the yield of normal crops with 8% of the water typically used [28]. Plants are grown in
gravel, clay, or no soil at all [9]. Nutrients are dissolved in water and are pumped to the plants.
This system gives you higher product yield, healthier plants, better taste, longer shelf life and
less cost per pound of produce in comparison to conventional field gardening [22]. ATL could
either dedicate the entire greenhouse space to growing produce, or split the space to also
cultivate biofuel algae, camelina, or duckweed.
Using local organic hydroponics gardening, ATL could directly sell premium, freshly-grown
produce to restaurant vendors located in airport terminals. The Airport would offer higher
quality vegetables at a lower price and still make a profit because of the cost efficiency of
hydroponic gardening. In an optimum scenario, hydroponics gardening gives 100 times field
yield in produce. Additionally, ATL would gain prominence in the community for embracing
local, urban farming and supporting sustainability initiatives.
How it works
In hydroponics, crops are grown in a medium, such as sand, gravel, Perlite, or Vermiculite,
for the roots to hold onto, or no medium at all. In media based systems, roots are periodically
soaked with a nutrient solution dissolved in water that is pumped to all the plants. This nutrient
solution is a selected blend of chemicals in the correct proportions for plant food. Table 15
shows the 15 elements considered essential for plant growth [12].
Table 15: Selected crops for plant growth
Element Atomic Symbol Atomic Weight % of dry plant tissue
Carbon C 12.01 45
Oxygen O 16.00 45
Hydrogen H 1.01 6
Nitrogen N 14.01 1.5
Potassium K 39.10 1.0
Calcium Ca 40.08 0.5
Magnesium Mg 24.30 0.2
Phosphorus P 30.97 0.2
Sulfur S 32.06 0.1
Chlorine Cl 35.45 0.01
Iron Fe 55.85 0.01
Manganese Mn 54.94 0.005
Boron B 10.81 0.002
Zinc Zn 65.38 0.002
Copper Cu 63.55 0.0006
Molybdenum Mo 95.94 0.00001
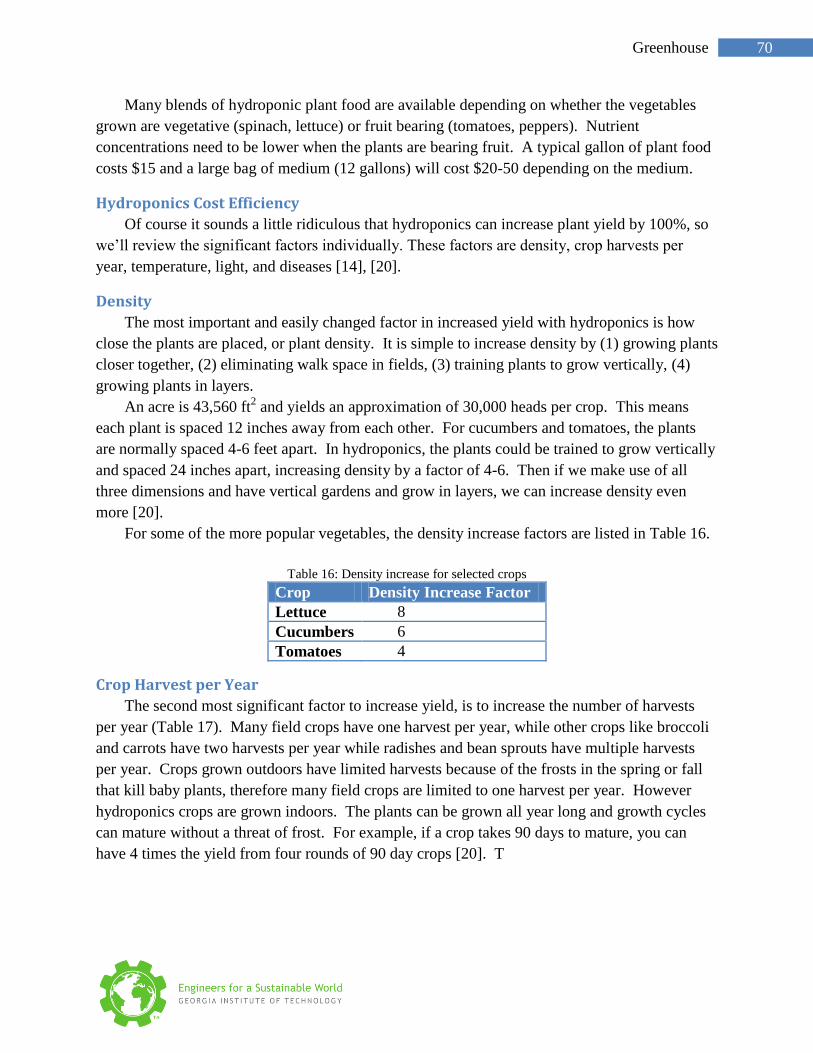
70 Greenhouse
Many blends of hydroponic plant food are available depending on whether the vegetables
grown are vegetative (spinach, lettuce) or fruit bearing (tomatoes, peppers). Nutrient
concentrations need to be lower when the plants are bearing fruit. A typical gallon of plant food
costs $15 and a large bag of medium (12 gallons) will cost $20-50 depending on the medium.
Hydroponics Cost Efficiency
Of course it sounds a little ridiculous that hydroponics can increase plant yield by 100%, so
we’ll review the significant factors individually. These factors are density, crop harvests per
year, temperature, light, and diseases [14], [20].
Density
The most important and easily changed factor in increased yield with hydroponics is how
close the plants are placed, or plant density. It is simple to increase density by (1) growing plants
closer together, (2) eliminating walk space in fields, (3) training plants to grow vertically, (4)
growing plants in layers.
An acre is 43,560 ft2 and yields an approximation of 30,000 heads per crop. This means
each plant is spaced 12 inches away from each other. For cucumbers and tomatoes, the plants
are normally spaced 4-6 feet apart. In hydroponics, the plants could be trained to grow vertically
and spaced 24 inches apart, increasing density by a factor of 4-6. Then if we make use of all
three dimensions and have vertical gardens and grow in layers, we can increase density even
more [20].
For some of the more popular vegetables, the density increase factors are listed in Table 16.
Table 16: Density increase for selected crops
Crop Density Increase Factor
Lettuce 8
Cucumbers 6
Tomatoes 4
Crop Harvest per Year
The second most significant factor to increase yield, is to increase the number of harvests
per year (Table 17). Many field crops have one harvest per year, while other crops like broccoli
and carrots have two harvests per year while radishes and bean sprouts have multiple harvests
per year. Crops grown outdoors have limited harvests because of the frosts in the spring or fall
that kill baby plants, therefore many field crops are limited to one harvest per year. However
hydroponics crops are grown indoors. The plants can be grown all year long and growth cycles
can mature without a threat of frost. For example, if a crop takes 90 days to mature, you can
have 4 times the yield from four rounds of 90 day crops [20]. T
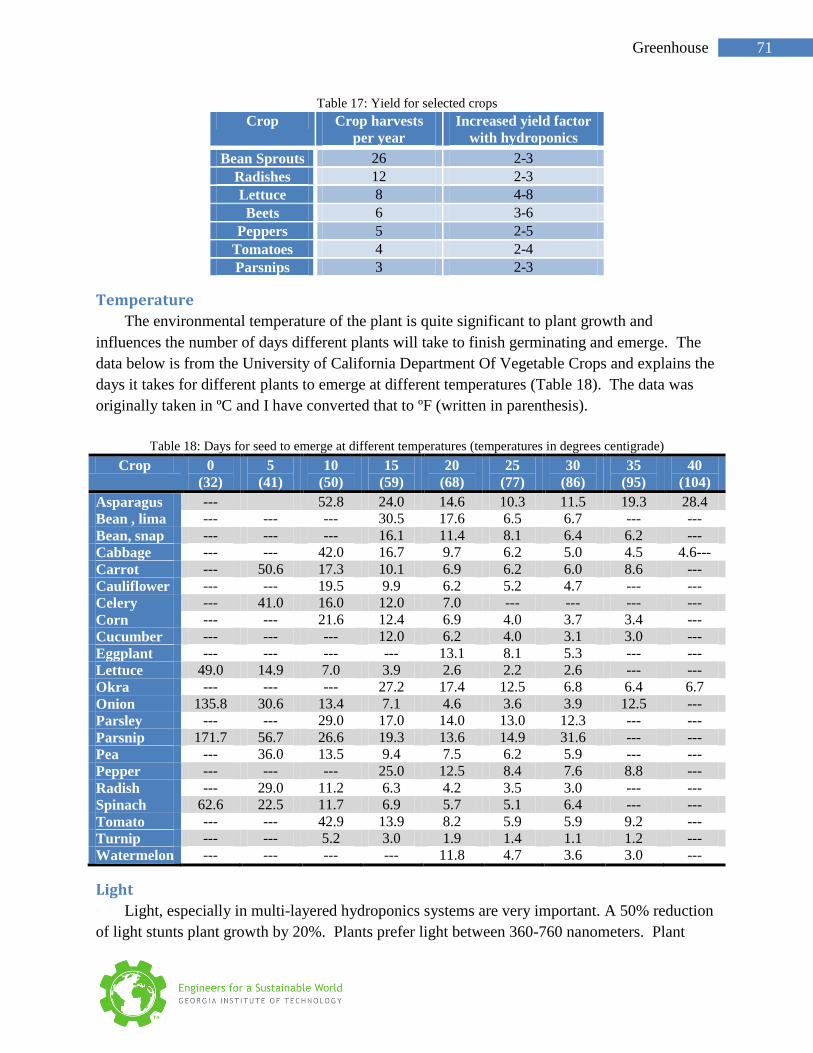
71 Greenhouse
Table 17: Yield for selected crops
Crop Crop harvests
per year
Increased yield factor
with hydroponics
Bean Sprouts 26 2-3
Radishes 12 2-3
Lettuce 8 4-8
Beets 6 3-6
Peppers 5 2-5
Tomatoes 4 2-4
Parsnips 3 2-3
Temperature
The environmental temperature of the plant is quite significant to plant growth and
influences the number of days different plants will take to finish germinating and emerge. The
data below is from the University of California Department Of Vegetable Crops and explains the
days it takes for different plants to emerge at different temperatures (Table 18). The data was
originally taken in ºC and I have converted that to ºF (written in parenthesis).
Table 18: Days for seed to emerge at different temperatures (temperatures in degrees centigrade)
Crop 0
(32)
5
(41)
10
(50)
15
(59)
20
(68)
25
(77)
30
(86)
35
(95)
40
(104)
Asparagus --- 52.8 24.0 14.6 10.3 11.5 19.3 28.4
Bean , lima --- --- --- 30.5 17.6 6.5 6.7 --- ---
Bean, snap --- --- --- 16.1 11.4 8.1 6.4 6.2 ---
Cabbage --- --- 42.0 16.7 9.7 6.2 5.0 4.5 4.6---
Carrot --- 50.6 17.3 10.1 6.9 6.2 6.0 8.6 ---
Cauliflower --- --- 19.5 9.9 6.2 5.2 4.7 --- ---
Celery --- 41.0 16.0 12.0 7.0 --- --- --- ---
Corn --- --- 21.6 12.4 6.9 4.0 3.7 3.4 ---
Cucumber --- --- --- 12.0 6.2 4.0 3.1 3.0 ---
Eggplant --- --- --- --- 13.1 8.1 5.3 --- ---
Lettuce 49.0 14.9 7.0 3.9 2.6 2.2 2.6 --- ---
Okra --- --- --- 27.2 17.4 12.5 6.8 6.4 6.7
Onion 135.8 30.6 13.4 7.1 4.6 3.6 3.9 12.5 ---
Parsley --- --- 29.0 17.0 14.0 13.0 12.3 --- ---
Parsnip 171.7 56.7 26.6 19.3 13.6 14.9 31.6 --- ---
Pea --- 36.0 13.5 9.4 7.5 6.2 5.9 --- ---
Pepper --- --- --- 25.0 12.5 8.4 7.6 8.8 ---
Radish --- 29.0 11.2 6.3 4.2 3.5 3.0 --- ---
Spinach 62.6 22.5 11.7 6.9 5.7 5.1 6.4 --- ---
Tomato --- --- 42.9 13.9 8.2 5.9 5.9 9.2 ---
Turnip --- --- 5.2 3.0 1.9 1.4 1.1 1.2 ---
Watermelon --- --- --- --- 11.8 4.7 3.6 3.0 ---
Light
Light, especially in multi-layered hydroponics systems are very important. A 50% reduction
of light stunts plant growth by 20%. Plants prefer light between 360-760 nanometers. Plant
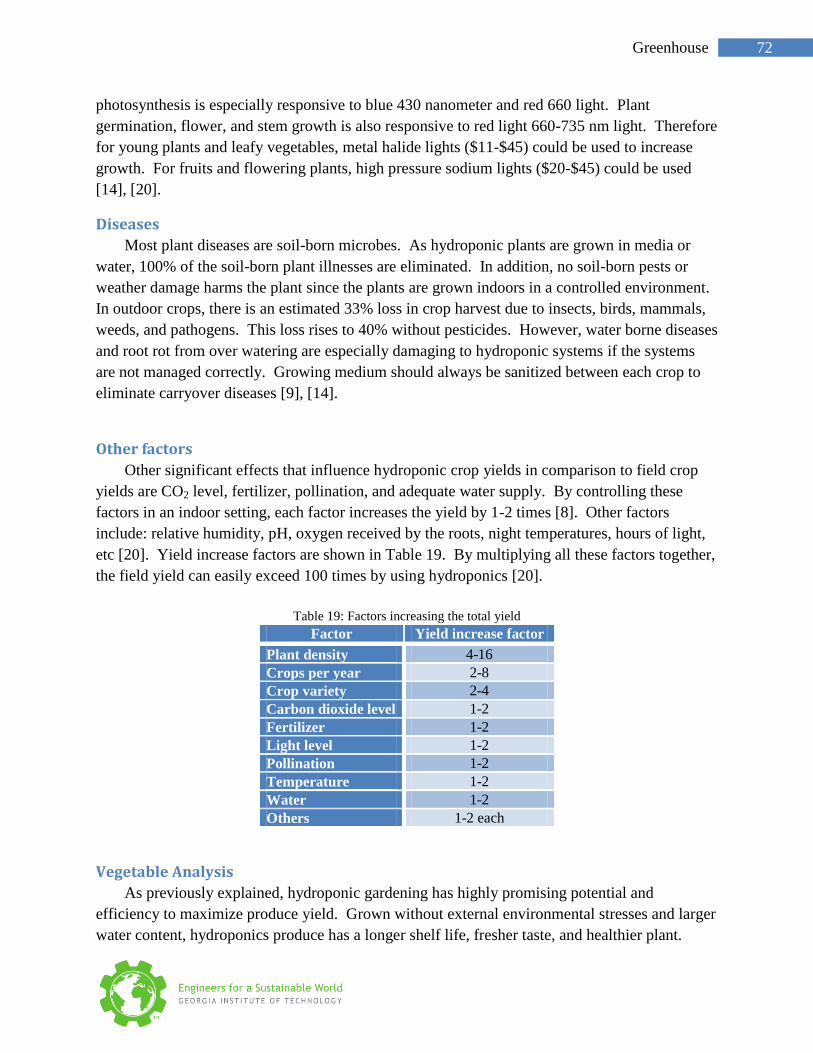
72 Greenhouse
photosynthesis is especially responsive to blue 430 nanometer and red 660 light. Plant
germination, flower, and stem growth is also responsive to red light 660-735 nm light. Therefore
for young plants and leafy vegetables, metal halide lights ($11-$45) could be used to increase
growth. For fruits and flowering plants, high pressure sodium lights ($20-$45) could be used
[14], [20].
Diseases
Most plant diseases are soil-born microbes. As hydroponic plants are grown in media or
water, 100% of the soil-born plant illnesses are eliminated. In addition, no soil-born pests or
weather damage harms the plant since the plants are grown indoors in a controlled environment.
In outdoor crops, there is an estimated 33% loss in crop harvest due to insects, birds, mammals,
weeds, and pathogens. This loss rises to 40% without pesticides. However, water borne diseases
and root rot from over watering are especially damaging to hydroponic systems if the systems
are not managed correctly. Growing medium should always be sanitized between each crop to
eliminate carryover diseases [9], [14].
Other factors
Other significant effects that influence hydroponic crop yields in comparison to field crop
yields are CO2 level, fertilizer, pollination, and adequate water supply. By controlling these
factors in an indoor setting, each factor increases the yield by 1-2 times [8]. Other factors
include: relative humidity, pH, oxygen received by the roots, night temperatures, hours of light,
etc [20]. Yield increase factors are shown in Table 19. By multiplying all these factors together,
the field yield can easily exceed 100 times by using hydroponics [20].
Table 19: Factors increasing the total yield
Factor Yield increase factor
Plant density 4-16
Crops per year 2-8
Crop variety 2-4
Carbon dioxide level 1-2
Fertilizer 1-2
Light level 1-2
Pollination 1-2
Temperature 1-2
Water 1-2
Others 1-2 each
Vegetable Analysis
As previously explained, hydroponic gardening has highly promising potential and
efficiency to maximize produce yield. Grown without external environmental stresses and larger
water content, hydroponics produce has a longer shelf life, fresher taste, and healthier plant.
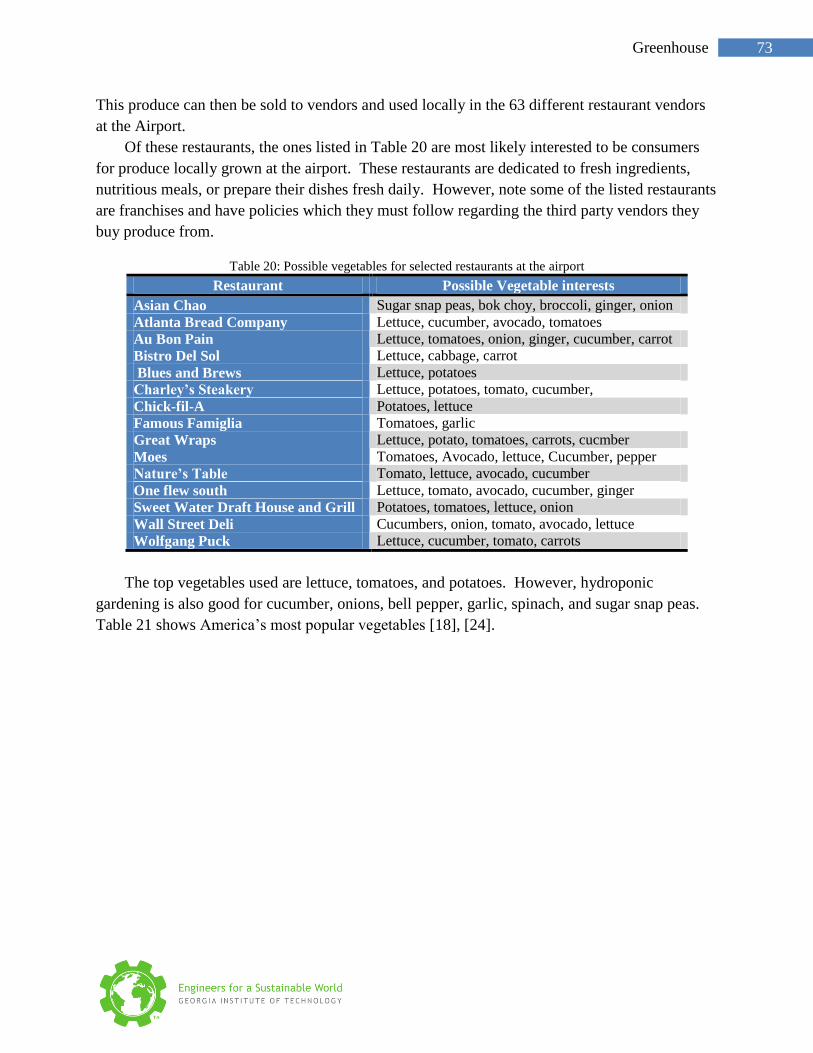
73 Greenhouse
This produce can then be sold to vendors and used locally in the 63 different restaurant vendors
at the Airport.
Of these restaurants, the ones listed in Table 20 are most likely interested to be consumers
for produce locally grown at the airport. These restaurants are dedicated to fresh ingredients,
nutritious meals, or prepare their dishes fresh daily. However, note some of the listed restaurants
are franchises and have policies which they must follow regarding the third party vendors they
buy produce from.
Table 20: Possible vegetables for selected restaurants at the airport
Restaurant Possible Vegetable interests
Asian Chao Sugar snap peas, bok choy, broccoli, ginger, onion
Atlanta Bread Company Lettuce, cucumber, avocado, tomatoes
Au Bon Pain Lettuce, tomatoes, onion, ginger, cucumber, carrot
Bistro Del Sol Lettuce, cabbage, carrot
Blues and Brews Lettuce, potatoes
Charley’s Steakery Lettuce, potatoes, tomato, cucumber,
Chick-fil-A Potatoes, lettuce
Famous Famiglia Tomatoes, garlic
Great Wraps Lettuce, potato, tomatoes, carrots, cucmber
Moes Tomatoes, Avocado, lettuce, Cucumber, pepper
Nature’s Table Tomato, lettuce, avocado, cucumber
One flew south Lettuce, tomato, avocado, cucumber, ginger
Sweet Water Draft House and Grill Potatoes, tomatoes, lettuce, onion
Wall Street Deli Cucumbers, onion, tomato, avocado, lettuce
Wolfgang Puck Lettuce, cucumber, tomato, carrots
The top vegetables used are lettuce, tomatoes, and potatoes. However, hydroponic
gardening is also good for cucumber, onions, bell pepper, garlic, spinach, and sugar snap peas.
Table 21 shows America’s most popular vegetables [18], [24].
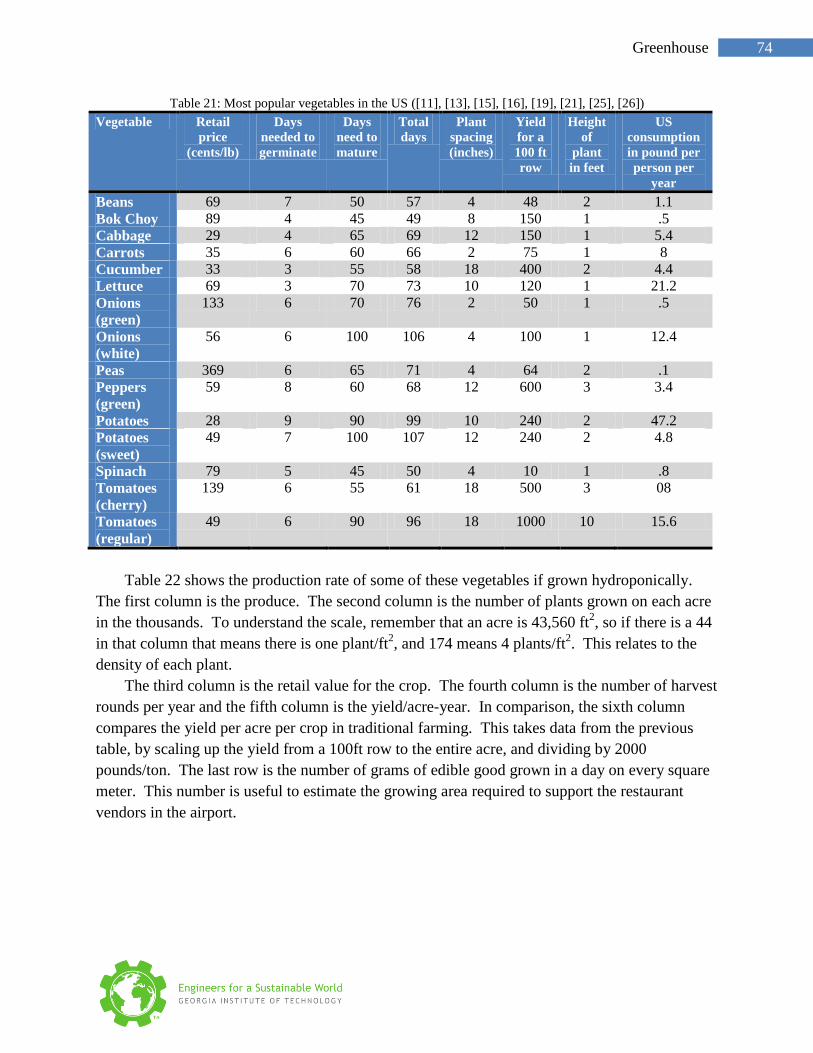
74 Greenhouse
Table 21: Most popular vegetables in the US ([11], [13], [15], [16], [19], [21], [25], [26])
Vegetable Retail
price
(cents/lb)
Days
needed to
germinate
Days
need to
mature
Total
days
Plant
spacing
(inches)
Yield
for a
100 ft
row
Height
of
plant
in feet
US
consumption
in pound per
person per
year
Beans 69 7 50 57 4 48 2 1.1
Bok Choy 89 4 45 49 8 150 1 .5
Cabbage 29 4 65 69 12 150 1 5.4
Carrots 35 6 60 66 2 75 1 8
Cucumber 33 3 55 58 18 400 2 4.4
Lettuce 69 3 70 73 10 120 1 21.2
Onions
(green)
133 6 70 76 2 50 1 .5
Onions
(white)
56 6 100 106 4 100 1 12.4
Peas 369 6 65 71 4 64 2 .1
Peppers
(green)
59 8 60 68 12 600 3 3.4
Potatoes 28 9 90 99 10 240 2 47.2
Potatoes
(sweet)
49 7 100 107 12 240 2 4.8
Spinach 79 5 45 50 4 10 1 .8
Tomatoes
(cherry)
139 6 55 61 18 500 3 08
Tomatoes
(regular)
49 6 90 96 18 1000 10 15.6
Table 22 shows the production rate of some of these vegetables if grown hydroponically.
The first column is the produce. The second column is the number of plants grown on each acre
in the thousands. To understand the scale, remember that an acre is 43,560 ft2, so if there is a 44
in that column that means there is one plant/ft2, and 174 means 4 plants/ft
2. This relates to the
density of each plant.
The third column is the retail value for the crop. The fourth column is the number of harvest
rounds per year and the fifth column is the yield/acre-year. In comparison, the sixth column
compares the yield per acre per crop in traditional farming. This takes data from the previous
table, by scaling up the yield from a 100ft row to the entire acre, and dividing by 2000
pounds/ton. The last row is the number of grams of edible good grown in a day on every square
meter. This number is useful to estimate the growing area required to support the restaurant
vendors in the airport.
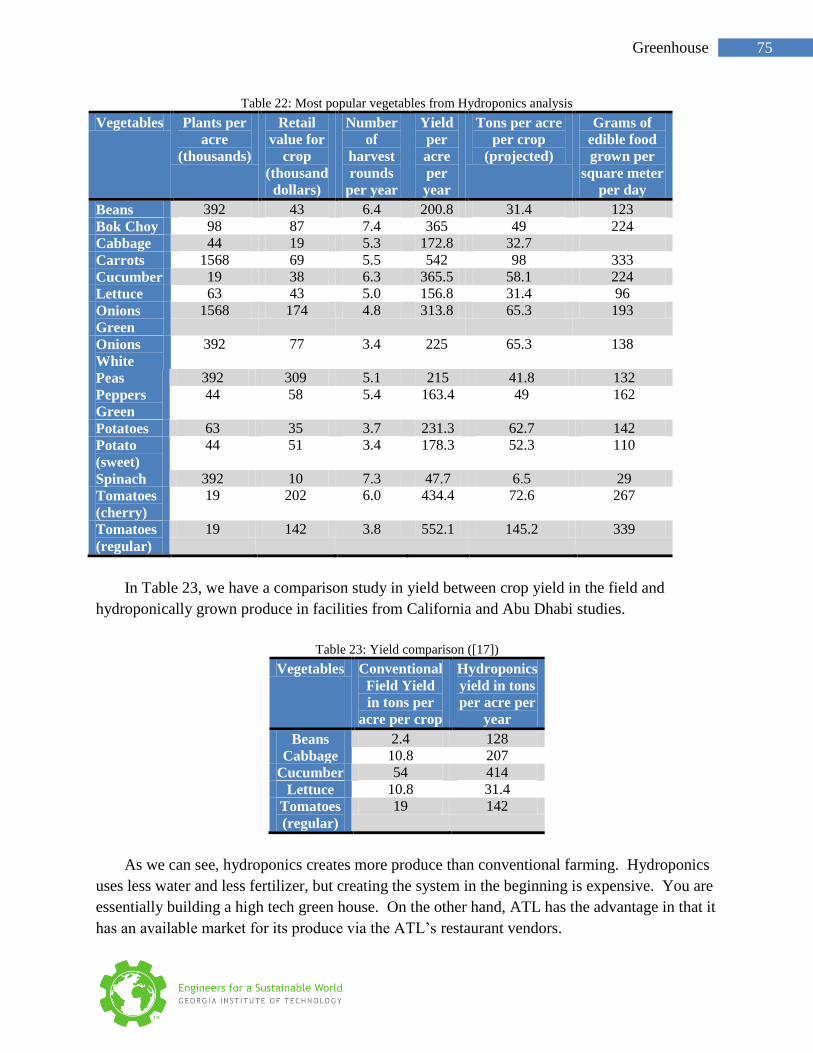
75 Greenhouse
Table 22: Most popular vegetables from Hydroponics analysis
Vegetables Plants per
acre
(thousands)
Retail
value for
crop
(thousand
dollars)
Number
of
harvest
rounds
per year
Yield
per
acre
per
year
Tons per acre
per crop
(projected)
Grams of
edible food
grown per
square meter
per day
Beans 392 43 6.4 200.8 31.4 123
Bok Choy 98 87 7.4 365 49 224
Cabbage 44 19 5.3 172.8 32.7
Carrots 1568 69 5.5 542 98 333
Cucumber 19 38 6.3 365.5 58.1 224
Lettuce 63 43 5.0 156.8 31.4 96
Onions
Green
1568 174 4.8 313.8 65.3 193
Onions
White
392 77 3.4 225 65.3 138
Peas 392 309 5.1 215 41.8 132
Peppers
Green
44 58 5.4 163.4 49 162
Potatoes 63 35 3.7 231.3 62.7 142
Potato
(sweet)
44 51 3.4 178.3 52.3 110
Spinach 392 10 7.3 47.7 6.5 29
Tomatoes
(cherry)
19 202 6.0 434.4 72.6 267
Tomatoes
(regular)
19 142 3.8 552.1 145.2 339
In Table 23, we have a comparison study in yield between crop yield in the field and
hydroponically grown produce in facilities from California and Abu Dhabi studies.
Table 23: Yield comparison ([17])
Vegetables Conventional
Field Yield
in tons per
acre per crop
Hydroponics
yield in tons
per acre per
year
Beans 2.4 128
Cabbage 10.8 207
Cucumber 54 414
Lettuce 10.8 31.4
Tomatoes
(regular)
19 142
As we can see, hydroponics creates more produce than conventional farming. Hydroponics
uses less water and less fertilizer, but creating the system in the beginning is expensive. You are
essentially building a high tech green house. On the other hand, ATL has the advantage in that it
has an available market for its produce via the ATL’s restaurant vendors.
76 Greenhouse
While there are a variety of hydroponic systems and kits available online. In Atlanta, the
company Pod Ponics has refitted shipping containers and grows lettuce using hydroponics. Each
shipping container grows 1.5 acres worth of lettuce. As they are already working with the ATL,
perhaps they can give advice for systems to buy and ways to set up multi-layered hydroponic
systems. Pod Ponics has perfected their system of hydroponics such that they guarantee the
exact amount of lettuce available to vendors [22].
Online, large scale kits and systems are priced at $300,000 dollars for a half acre system.
This includes testing equipment, growing supplies, piping, pumps, growing trays, stands, air
circulation, heaters, computerized environmental controls, electronic panels, cooling systems,
vent doors, and the structure itself [10]. Structures can be built to handle heavy snow loads and
high winds while maximizing the amount of light entering. Some models on the market have the
strength to withstand 90 mph winds and 12 lb snow load [10].
Another reputable model is the VertiCrop system which was mentioned in the Time
Magazine as 2009’s World’s Greatest Invention. This system has been used at England’s
Paignton Zoo to produce 11,000 heads of lettuce (and red chard and other vegetables) every 3-4
weeks to cut animal feed costs by over $150,000 annually and act as an educational tool for the
public. This computerized system uses a conveyor system to automatically irrigate plants. A
200 m2 unit costs $412,000. However VertiCrop has not finished creating a system for root
crops or big tomatoes [27], [28].
Conclusion and Summary
While the benefits have been clearly spelled out in this proposal and are very notable, the
disadvantages must be addressed as well. While hydroponics saves cost, saves resources (water
and nutrient use), maximizes yield and produces higher quality produce, the system has an
expensive upfront cost and will have an electricity bill to run the hydroponics system. Growing
medium and nutrients will also need to be bought continuously. Another popularly voiced
disadvantage to hydroponics is maintenance. While some systems need a lot of daily
maintenance, many systems (such as VertiCrop) are automated and need no maintenance at all.
The tradeoff is cost. Another disadvantage to keep in mind is that while hydroponics eliminates
all soil borne diseases and pests, waterborne diseases and pathogen attacks because of over
watering and over dampness will damage the entire plant system, so sanitation and watering
plants at the correct levels is important. Again, a computer automated system can take care of
the watering levels.
Therefore, the only disadvantage not canceled out by an automated computer controlled
hydroponics system is the cost. As explained in this proposal, the hydroponics systems create an
incredible amount of produce by maximizing crop yield and quality. However, looking at the
retail price of the crops and tons produced, the Airport could make a profit by matching the need
and selling directly to the restaurants located in the airport, as well as to the restaurants in the
Atlanta community. Since hydroponic gardening maximizes space so efficiently, in actuality
only a small amount of space would be needed to fill the need of airport restaurants. The
additional space could be saved for other sustainability projects, development, or more produce

77 Greenhouse
to sell to the community. Built on current technology, the hydroponics vegetable garden could
be the most feasible options for the green house space for the ATL.
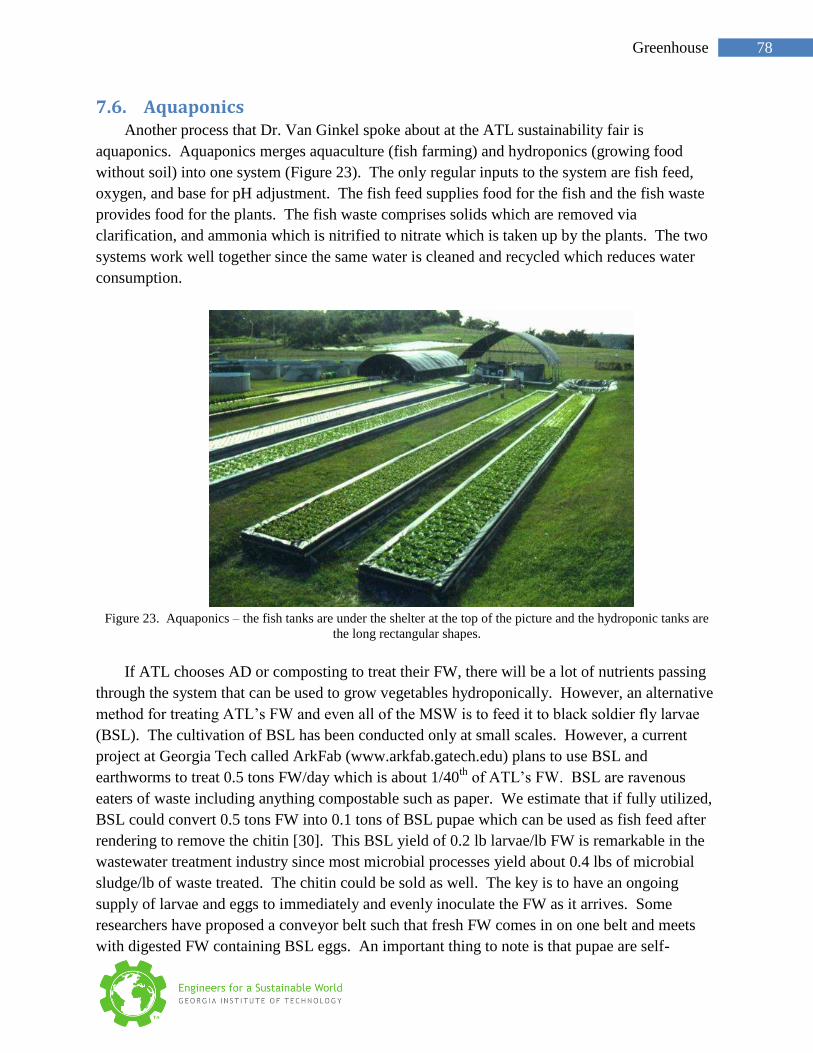
78 Greenhouse
Aquaponics 7.6.Another process that Dr. Van Ginkel spoke about at the ATL sustainability fair is
aquaponics. Aquaponics merges aquaculture (fish farming) and hydroponics (growing food
without soil) into one system (Figure 23). The only regular inputs to the system are fish feed,
oxygen, and base for pH adjustment. The fish feed supplies food for the fish and the fish waste
provides food for the plants. The fish waste comprises solids which are removed via
clarification, and ammonia which is nitrified to nitrate which is taken up by the plants. The two
systems work well together since the same water is cleaned and recycled which reduces water
consumption.
Figure 23. Aquaponics – the fish tanks are under the shelter at the top of the picture and the hydroponic tanks are
the long rectangular shapes.
If ATL chooses AD or composting to treat their FW, there will be a lot of nutrients passing
through the system that can be used to grow vegetables hydroponically. However, an alternative
method for treating ATL’s FW and even all of the MSW is to feed it to black soldier fly larvae
(BSL). The cultivation of BSL has been conducted only at small scales. However, a current
project at Georgia Tech called ArkFab (www.arkfab.gatech.edu) plans to use BSL and
earthworms to treat 0.5 tons FW/day which is about 1/40th
of ATL’s FW. BSL are ravenous
eaters of waste including anything compostable such as paper. We estimate that if fully utilized,
BSL could convert 0.5 tons FW into 0.1 tons of BSL pupae which can be used as fish feed after
rendering to remove the chitin [30]. This BSL yield of 0.2 lb larvae/lb FW is remarkable in the
wastewater treatment industry since most microbial processes yield about 0.4 lbs of microbial
sludge/lb of waste treated. The chitin could be sold as well. The key is to have an ongoing
supply of larvae and eggs to immediately and evenly inoculate the FW as it arrives. Some
researchers have proposed a conveyor belt such that fresh FW comes in on one belt and meets
with digested FW containing BSL eggs. An important thing to note is that pupae are self-
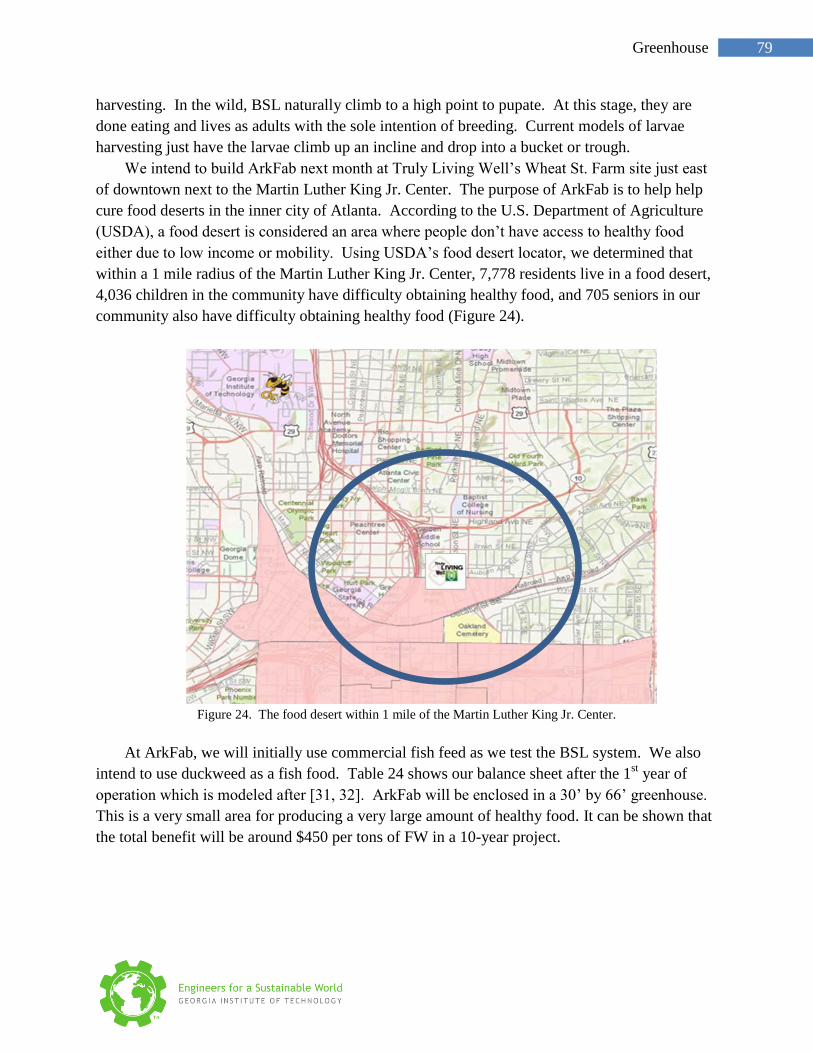
79 Greenhouse
harvesting. In the wild, BSL naturally climb to a high point to pupate. At this stage, they are
done eating and lives as adults with the sole intention of breeding. Current models of larvae
harvesting just have the larvae climb up an incline and drop into a bucket or trough.
We intend to build ArkFab next month at Truly Living Well’s Wheat St. Farm site just east
of downtown next to the Martin Luther King Jr. Center. The purpose of ArkFab is to help help
cure food deserts in the inner city of Atlanta. According to the U.S. Department of Agriculture
(USDA), a food desert is considered an area where people don’t have access to healthy food
either due to low income or mobility. Using USDA’s food desert locator, we determined that
within a 1 mile radius of the Martin Luther King Jr. Center, 7,778 residents live in a food desert,
4,036 children in the community have difficulty obtaining healthy food, and 705 seniors in our
community also have difficulty obtaining healthy food (Figure 24).
Figure 24. The food desert within 1 mile of the Martin Luther King Jr. Center.
At ArkFab, we will initially use commercial fish feed as we test the BSL system. We also
intend to use duckweed as a fish food. Table 24 shows our balance sheet after the 1st year of
operation which is modeled after [31, 32]. ArkFab will be enclosed in a 30’ by 66’ greenhouse.
This is a very small area for producing a very large amount of healthy food. It can be shown that
the total benefit will be around $450 per tons of FW in a 10-year project.
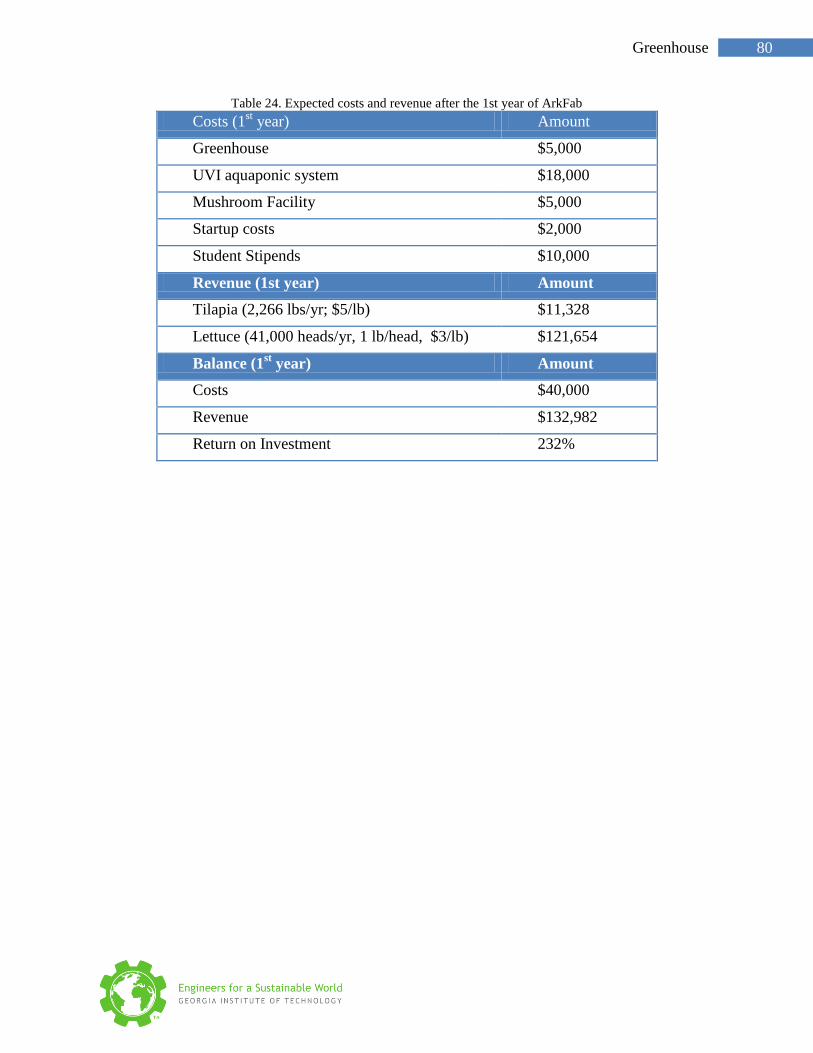
80 Greenhouse
Table 24. Expected costs and revenue after the 1st year of ArkFab
Costs (1st year) Amount
Greenhouse $5,000
UVI aquaponic system $18,000
Mushroom Facility $5,000
Startup costs $2,000
Student Stipends $10,000
Revenue (1st year) Amount
Tilapia (2,266 lbs/yr; $5/lb) $11,328
Lettuce (41,000 heads/yr, 1 lb/head, $3/lb) $121,654
Balance (1st year) Amount
Costs $40,000
Revenue $132,982
Return on Investment 232%
81 Greenhouse
References 7.7.1. Aden, Andy and Ray, Davis. "Algal Biofuel Pathway Baseline Costs." National Renewable Energy
Laboratory (2011). Web. Mar.12 2012 <http://www.nrel.gov/biomass/pdfs/algal_biofuels.pdf>
2. Wiley, Patrick, J. Elliott Campbell, and 2 McKuin^1. "Production of Biodiesel and Biogas from Algae:
A Review of Process Train Options." Water Environment Research (10614303), 83.4 (2011): 326-338.
3. THAYER, ANN. "Moving Forward on Algal Biofuels." Chemical & Engineering News, 88.29 (2010)
4. "The Scoop on Camelina Sativa." Biobased Products Institute - Montana State University (2008). Web.
Mar. 2012 <http://www.montana.edu/biobased/projects/CamelinaInfo.html>
5. Pilgeram A.L., Sands D. C., Boss D., Dale N., Wichman D., Lamb P., Lu C., Barrows R., Kirkpatrick
M., Thompson B., and Johnson D. L."Camelina sativa, A Montana Omega-3 and Fuel Crop" Issues in
new crops and new uses. (2007). Web. Mar. 2012
<http://www.hort.purdue.edu/newcrop/ncnu07/pdfs/pilgeram129-131.pdf>
6. Walsh, D. " Duckweed a possible solution to energy needs, researchers say " press of Atlantic City
(May 3, 2010). Web. Mar. 2012
<http://www.pressofatlanticcity.com/news/press/cumberland/article_4ae59e12-56f1-11df-a5d8-
001cc4c002e0.html>
7. Iqbal, S. "Duckweed Aquaculture" Dept. of Water & Sanitation in Developing Countries, SANDEC,
Swiss Federal Institute for Environmental Science & Technology, EAWAG, Ueberlandstrasse 133, CH-
8600 Duebendorf, Switzerland, (March 1999). Web. Mar.2012
<http://www.eawag.ch/forschung/sandec/publikationen/wra/dl/duckweed.pdf>
8. "Advanced Nutrients." Hydroponics Gardening. Web. 08 Apr. 2012.
<http://advancednutrients.com/hydroponics/articles/hydroponics-gardening/hydroponics-tips-for-
increasing-yield.php>.
9. "Advantages and Disadvantages of Hydroponics." Crescent Girls' School. Web. 08 Apr. 2012.
<http://www.crescent.edu.sg/ipw/2000/sec2/22g1-hydroponics/ad_dis.htm>.
10. "CropKing Green House Package: NFT System." CropKing. CropKing. Web. 8 Apr. 2012.
<http://www.cropking.com/sites/CropKing.com/files/pdfdocs/NFTPricing.pdf>.
11. D. Newcomb, 'The Backyard Vegetable Factory', Rodale Press, 1988.
12. F.B. Salisbury, C.Ross, "Plant Physiology", Wadsworth, 1969, p.194.
13. Fruit & Vegetable Facts & Pointers', United Fresh Fruit and Vegetable Association, Alexandria, Va.
14. "GreenCoast Hydroponics - Information." GreenCoast Hydroponics, Hydroponic Systems. Web. 08
Apr. 2012. <http://www.gchydro.com/information_introhydro.asp>.
15. Growing Vegetables in Home Gardens', USDA, USGPO.
16. Gurney's 1990 Spring Catalog.
82 Greenhouse
17. H.M. Resh, 'Hydroponic Food Production', Woodbridge Press, 1987.
18. "Hydroponic Plants: What to Grow." Hydroponic Gardening Simplified. Web. 08 Apr. 2012.
<http://www.hydroponics-simplified.com/hydroponic-plants.html>.
19. J.F.Harrington, Dept of Vegetable Crops, UC Davis, Agricultural Extension Leaflet, 1954.
20. "No Food = No Problem!" Hydroponics Gives 100 times Field Yields. Web. 08 Apr. 2012.
<http://www.androidworld.com/prod26.htm>.
21. O.A. Lorenz, D.N. Maynard, 'Knott's Handbook for Vegetable Growers', 2nd ed., John Wiley & Sons,
1980.
22. "PodPonics: The Future of Farming." PodPonics: The Future of Farming. Web. 09 Apr. 2012.
<http://www.podponics.com/>.
23. "Restaurants." Shop, Dine and Explore. Hartsfield-Hackson Atlanta International Airport. Web. 08
Apr. 2012. <http://www.atlanta-airport.com/Passenger/Shop/default.aspx>.
24. "The Best Vegetables to Grow Hydroponically." LIVESTRONG.COM. Web. 08 Apr. 2012.
<http://www.livestrong.com/article/217578-the-best-vegetables-to-grow-hydroponically/>.
25. S.E. Gebhardt, R.H. Mattews, 'Nutritive Value of Foods', USDA Home and Garden Bulletin #72,
USGPO, 1981.
26. 'Supply Guide', United Fresh Fruit and Vegetable Association, Alexandria, Va., 1989, compiled by
C.Magoon.
27. "Valcent Takes Vertical Farming to the Zoo | Fast Company." FastCompany.com. Web. 09 Apr.
2012. <http://www.fastcompany.com/blog/ariel-schwartz/sustainability/valcent-brings-vertical-farming-
zoo>.
28. “VertiCrop.” Verticrop. <www.verticrop.com>
29. "What Is Hydroponics?" Simply Hydroponics. Web. 08 Apr. 2012.
<http://www.simplyhydro.com/whatis.htm>.
30. Newton, L., Sheppard, C., Watson, D.W., Burtle, G., Dove, R. 2005. Using the black soldier fly,
Hermetia illucens, as a value-added tool for the management of swine manure. Animal and Poultry
Waste Management Center, North Carolina State University, Raleigh, NC.
31. Bondari, K. and Sheppard, C. 1987. Soldier fly, Hermetia illucens L., larvae as feed for channel
catfish, Ictalurus punctatus (Rafinesque), and blue tilapia, Oreochromis aureus (Steindachner).
Aquaculture and Fisheries Management, 18, 209-220.
32. Rakocy, J. 2006. Recirculating Aquaculture Tank Production Systems: Aquaponics—Integrating Fish
and Plant Culture. SRAC Publication No. 454
83 Biodiesel from Cooking Oil Waste
Biodiesel from Cooking Oil Waste 8.
Team members:
AliReza Khoshgoftar
Monfared
PhD student, Electrical Engineering
James Bourn III
Keith Wells
84 Biodiesel from Cooking Oil Waste
Introduction 8.1.Biodiesel is one of the most promising of the alternative fuels, which include bioethanol and
hydrogen. It is produced from vegetable oil using fairly simple chemistry. It is non-toxic and
rapidly biodegrades. It can be produced from either new or waste oil or offers good performance
together with a number of environmental benefits compared to ordinary petroleum diesel.
The conversion of waste vegetable oils (WVO) to biodiesel is a very cost friendly solution,
and the fact that it is made from renewable resources lowers our dependence on foreign oil and
helps our own economy. Biodiesel has also been shown to help reduce CO2 emissions, which
can help the global warming crisis. Biodiesel reduces net CO2 emissions by 78% compared to
petroleum diesel. This is due to biodiesel’s closed carbon cycle - the CO2 released into the
atmosphere when biodiesel is burned is recycled by growing plants, which later could be
processed into fuel.
Types of biodiesel 8.2.There are two different types of WVOs:
Brown grease: Brown grease is from stovetops and deep fryers. It is very thick, dark,
and filled with impurities. Brown grease production in the U.S./yr is 4-48 lbs/person and
3,000-24,000 lbs/restaurant. In terms of the biodiesel market, brown grease has little to
no value, although it could go to AD.
Yellow grease: Yellow grease is made up of the oils and animal fats that are used and
produced during cooking and deep-frying (Morea, Sept. 12). Its production range is 3-21
lbs/person-yr and 2,000-13,000 lbs/restaurant-year. This vegetable oil waste can be used
for rendering and has been established as a valuable commodity in the biodiesel market.
(http://www.nrel.gov/vehiclesandfuels)
Sources of biodiesel 8.3.Biodiesel has many sources. It can be made from virgin oil, produced mainly from soybeans
and rapeseed, waste vegetable oil, and animal fats like lard and tallow. Biodiesel can even be
made from the fatty acids found in algae.
Applications of biodiesel 8.4.As a fuel, biodiesel is very versatile; it can be applied to several different areas. An engine
that is designed to burn diesel fuel can be modified to burn pure biodiesel, known as B100. The
same diesel engine can burn an 80% diesel 20% biodiesel mixture with no modification at all,
known as B20. This is advantageous as it will help to keep emissions down and slightly increase
mileage. Pure Biodiesel, B100, can also be used as a replacement for home heating oil.
Advantages of biodiesel 8.5.One of the major differences between biodiesel and diesel is that biodiesel contains less
energy per gallon, but it burns more completely, making up for some of the loss due to the lower
energy density. Another advantage to biodiesel is its greater lubricating property than other

85 Biodiesel from Cooking Oil Waste
fuels. This can reduce wear and prolong the life for engine parts that require the fuel as a
lubricant, such as fuel injectors. Biodiesel also burns cleaner; tests have shown a reduction in
unburned hydrocarbons, carbon monoxide and sulfur emissions, but a very slight increase in
nitrogen oxides. The flash point of biodiesel, the temperature at which the vapors above the fuel
become flammable, is about 100°C higher than that of diesel fuel. The higher flashpoint makes
biodiesel safer to handle and transport. A negative attribute of biodiesel is its high cloud point.
The cloud point is the temperature when a liquid starts to thicken and gel, this makes it difficult
to use in a regular internal combustion engine (Advantages of using Biodiesel, 2008). In
addition, biodiesel is also an effective solvent (Storing Biodiesel Fuels, 2007).
Biodiesel Production 8.6.
Batch Process
There are several ways to produce biodiesel from WVO. The most widely used way is the
batch process. The incoming oil must be filtered to remove any solids while the levels of free
fatty acids and water are being monitored; too much of either can cause problems later in the
production process. The catalyst, lye (NaOH), is mixed with the methanol, and then the
alcohol/catalyst mix is charged into a closed reaction vessel. Then the oil is added. The system
from here on is totally closed to the atmosphere to prevent the loss of alcohol through
evaporation. The vessel is then heated to between 55-70º C in order to speed the reaction up.
After 1-8 hours of mixing/reacting the reacted liquid is separated, the heavier glycerin
byproducts will sink, either by gravity or by centrifuge. After separation, the excess alcohol is
distilled away or evaporated and recycled. The unused catalyst is recovered from the glycerin
byproduct and is recycled (Blair, 2005). The glycerin is stored as it is a valuable commodity.
Then the biodiesel is washed with warm water to remove any residual impurities.
Ultrasonication
Ultrasonication is a newer way to produce biodiesel. The methanol and catalyst are pre-
mixed like in the batch process; this mixture is combined with the oil. The mixture is usually
heated to 50-60°C, while being hit with ultrasonic sound waves. The sound waves cause a
phenomenon called cavitation, where bubbles are randomly created and imploded with incredible
frequency. These cavitations provide both enough mixing and the needed activation energy for
the transesterification (the conversion of fatty acids to biodiesel) to take place in a much shorter
time than the batch process. Then, the reacted mixture is phase separated, washed and stored as
before (Hielscher,). This process has several advantages: as it is a continuous process, it is much
more energy efficient than the batch process and it takes much less time to create an equivalent
amount of biodiesel (Gogate, Kelkar, and Pandit, 2005).
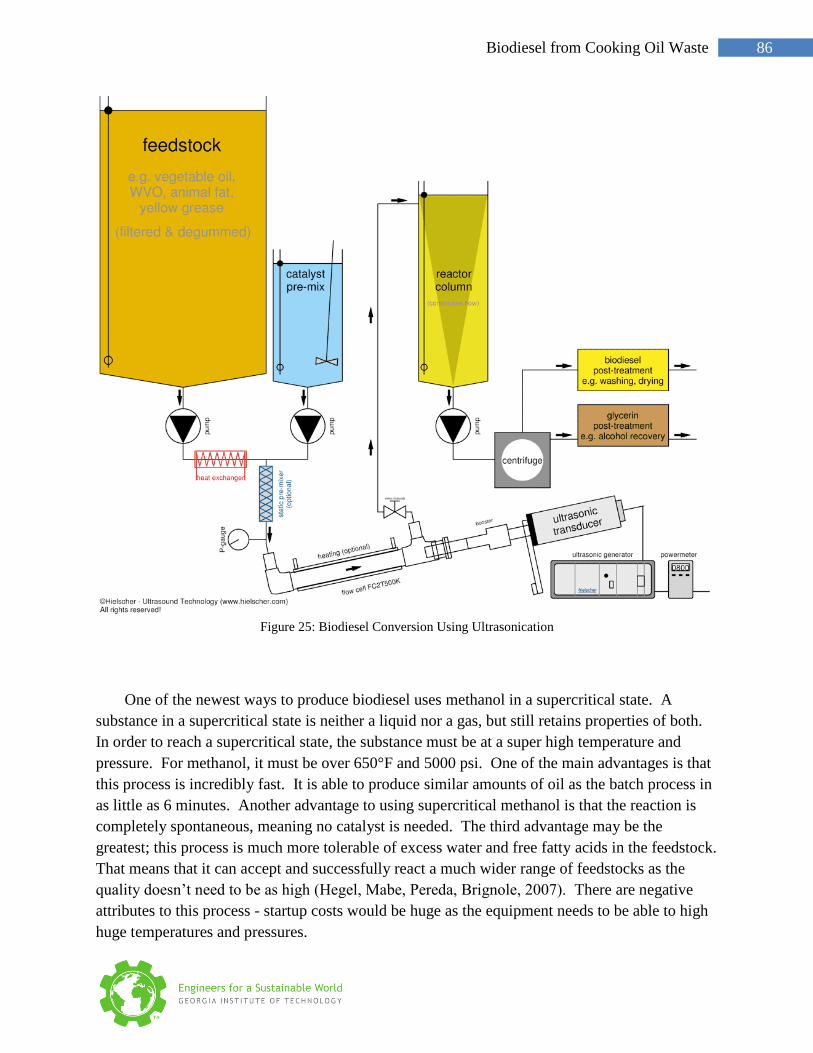
86 Biodiesel from Cooking Oil Waste
Figure 25: Biodiesel Conversion Using Ultrasonication
One of the newest ways to produce biodiesel uses methanol in a supercritical state. A
substance in a supercritical state is neither a liquid nor a gas, but still retains properties of both.
In order to reach a supercritical state, the substance must be at a super high temperature and
pressure. For methanol, it must be over 650°F and 5000 psi. One of the main advantages is that
this process is incredibly fast. It is able to produce similar amounts of oil as the batch process in
as little as 6 minutes. Another advantage to using supercritical methanol is that the reaction is
completely spontaneous, meaning no catalyst is needed. The third advantage may be the
greatest; this process is much more tolerable of excess water and free fatty acids in the feedstock.
That means that it can accept and successfully react a much wider range of feedstocks as the
quality doesn’t need to be as high (Hegel, Mabe, Pereda, Brignole, 2007). There are negative
attributes to this process - startup costs would be huge as the equipment needs to be able to high
huge temperatures and pressures.

87 Biodiesel from Cooking Oil Waste
Cost Comparison of Processes 8.7.
Batch Process
The batch process is the most widely known biodiesel conversion process because a
rudimentary system is relatively inexpensive, and easy to operate. This makes the batch process
ideal for the people who only wish to produce enough fuel for their own use. However, the
versatility of the “batch process” easily allows for a production increase, making it the perfect
biodiesel conversion process for small companies.
Startup-cost: The main benefit of the batch system is the extremely low start-up cost
compared to other, more complex systems. A pilot plant consisting of 3 tanks, 2 pumps and the
respective hoses and fittings can cost well under $2000. Larger tanks and more powerful pumps
can be used to increase the production capacity while still keeping the price well under $5000.
Production costs are also more inexpensive than other biodiesel systems. Prices for legal permits
and insurance are the same or lower than other processes that require higher temperatures and/or
pressures. Raw material prices are generally fixed, but companies usually give a discount when
buying in large quantities.
Maintenance: Maintenance for the batch system is minimal. It requires replacing parts that
malfunction, which are inexpensive to purchase and replace.
Upgradability: Upgrading the system to increase the production capacity is as simple as
increasing the tank size and/or adding more tanks. However, as more and more tanks are added,
space does become a concern.
Efficiency: A downside of the batch process is the low efficiency compared to other, more
expensive systems. One can expect efficiencies between 85-90% for the typical batch process.
A methanol recovery system can also be implemented to recover almost 85% of the methanol
used in the process.
Personnel Requirements: Because of the volatility of the chemicals used and the
temperature required for transesterification, personnel must be present at all times. An employee
is expected to use the pumps to transfer the WVO/biodiesel between tanks, add specific amount
of chemicals, and control the temperature of the heating element. Training for personnel is
relatively straightforward, as most of the work being done is simple. Personal responsibility is
more essential to the job than any unique skill set.
Continuous Process
This process is very similar to the batch process, but has a few major differences. These
differences include a methanol recovery system and more tanks for mixing and settling
Startup-cost: This process is more costly compared to the batch process. Though no single
part of the process is overly expensive, purchasing the quantity of tanks to setup a proper process
can get costly. Although the startup costs are higher in this process, the cost of operation is
rather low. The methanol recovery system featured in this process will save on the purchase of
raw methanol and therefore lower production.
88 Biodiesel from Cooking Oil Waste
Maintenance: Maintenance costs are low due to the simplicity of the system and with most
of the parts available at any local hardware store.
Safety: The process uses corrosive materials; therefore protective gloves and possibly a
face shield are required at some point during the process.
Upgradability: This process is very upgradable. Parts such as the mixing components,
pipes, pumps, and filters can all be upgraded at any time when convenient to increase
productivity.
Efficiency: The efficiency can be split into two sub‐categories; yield and time/capacity.
For yield, the process overall has a percent yield of around 85%. The time for a single batch will
be equal to that of the regular batch process; however when multiple batches are in process much
more can be produced than the original process in a day.
Personnel Requirements: This process needs slightly higher requirements. To keep up
with the process, the operator will need to be able to effectively transfer multiple batches at a
time and orchestrate them in the proper sequence. This process does not require any prior
knowledge of the system to operate and mostly involves the opening and closing of valves. Only
simple process training would be required to educate one to effectively run the process.
Ultrasonication
Start-up Cost: Startup costs for an ultrasonic setup can be very large, as much as $100K.
A combination of lots of expensive mechanical and electrical equipment drives the cost up. The
operating cost to run an ultrasonic process is much smaller than one would think at first. While
being a very complicated process with lots of complex machinery, it is very energy efficient and
the process requires little labor for operation.
Maintenance: Maintenance on an ultrasonic operation could be very great. There is a lot
of complex equipment running at high temperatures and pressures that would require a certified
technician to repair. Other processes that have more simple components require only basic skills
to repair.
Upgradability: The ultrasonic process is difficult to upgrade. Once the process is set in
place it would need to be disassembled and put back together with new part and components.
Some of the more important parts such as the ultrasonic transducer could be used for a greater
capacity, if it was capable.
Efficiency: Ultrasonication, while being expensive, is very efficient. The percent yields
from the process are often greater than 98%. Ultrasonication is also capable of accepting a
greater variety of raw materials, meaning the WVO does not have to be filtered as extensively.
The ultrasonic process is much faster and more energy efficient than most other processes
available today. Due to the unique method of driving the transesterification process,
ultrasonication uses half the energy of the average batch process. It is also much faster; the
process can produce the same amount of biodiesel product in less than a quarter of the time.
Personnel Requirements: The stress level for the employees in an ultrasonic plant would
be much lower than in other production plants. The system is mostly automated and does not
require a major input from the operators.

89 Biodiesel from Cooking Oil Waste
References 8.8.1.Albergaria, Nikolas, et al. 2009. Biodiesel Process Analysis for EPOCA, An Interactive Qualifying
Project Report. WORCESTER POLYTECHNIC INSTITUTE. 2009.
2.Balfour, Senators. Georgia Biodiesel Assembly. Senate Bill 568.
3.Hartwig, Erika and Moore, Travis . 2006. An Assessment of the Restaurant Grease Collection
and Rendering Industry in South Carolina. Department of Energy, The SC Energy Office.
2006.
4.Wisner, Robert. 2009. Biodiesel Tax Credit. June 2009.
90 Energy Analysis
Energy Analysis 9.
Team members:
Kelly Nicholson PhD student, Chemical Engineering
Brandon Gardiner Masers student, Building Construction
David Repp Masers student, Civil Engineering
Kari Beasley Masers student, Industrial Engineering
Ashwin Ravi Sankar PhD student, Chemical Engineering
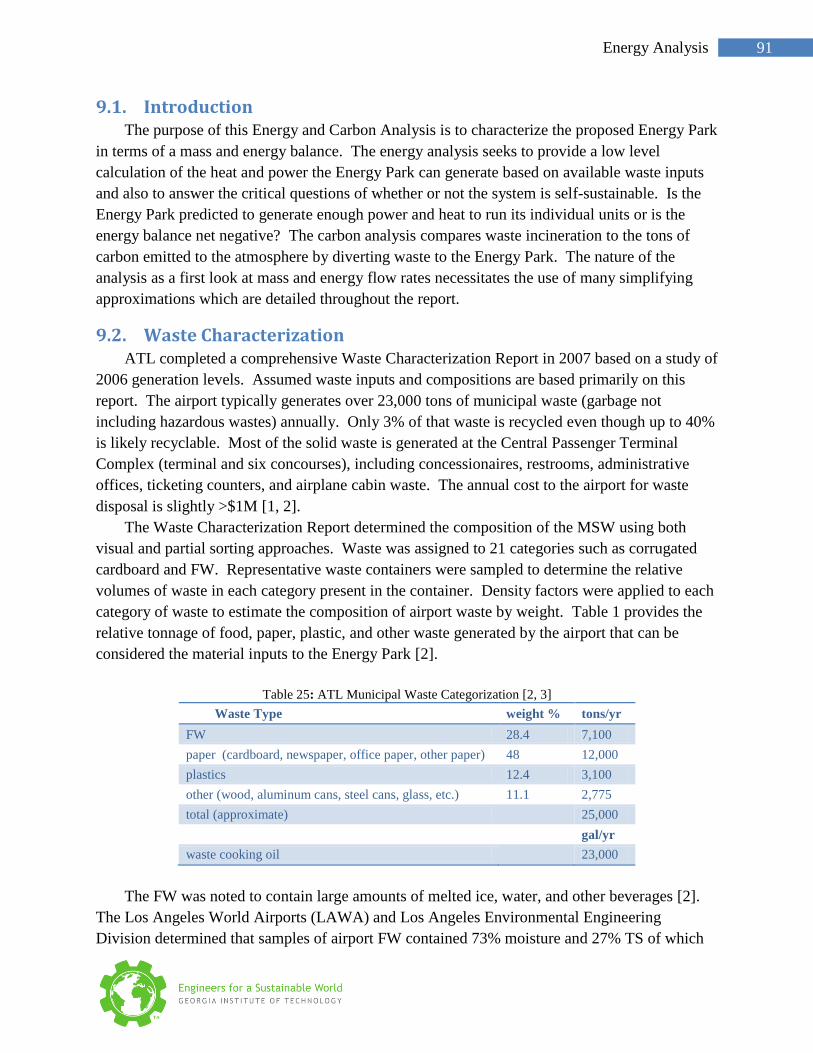
91 Energy Analysis
Introduction 9.1.The purpose of this Energy and Carbon Analysis is to characterize the proposed Energy Park
in terms of a mass and energy balance. The energy analysis seeks to provide a low level
calculation of the heat and power the Energy Park can generate based on available waste inputs
and also to answer the critical questions of whether or not the system is self-sustainable. Is the
Energy Park predicted to generate enough power and heat to run its individual units or is the
energy balance net negative? The carbon analysis compares waste incineration to the tons of
carbon emitted to the atmosphere by diverting waste to the Energy Park. The nature of the
analysis as a first look at mass and energy flow rates necessitates the use of many simplifying
approximations which are detailed throughout the report.
Waste Characterization 9.2.ATL completed a comprehensive Waste Characterization Report in 2007 based on a study of
2006 generation levels. Assumed waste inputs and compositions are based primarily on this
report. The airport typically generates over 23,000 tons of municipal waste (garbage not
including hazardous wastes) annually. Only 3% of that waste is recycled even though up to 40%
is likely recyclable. Most of the solid waste is generated at the Central Passenger Terminal
Complex (terminal and six concourses), including concessionaires, restrooms, administrative
offices, ticketing counters, and airplane cabin waste. The annual cost to the airport for waste
disposal is slightly >$1M [1, 2].
The Waste Characterization Report determined the composition of the MSW using both
visual and partial sorting approaches. Waste was assigned to 21 categories such as corrugated
cardboard and FW. Representative waste containers were sampled to determine the relative
volumes of waste in each category present in the container. Density factors were applied to each
category of waste to estimate the composition of airport waste by weight. Table 1 provides the
relative tonnage of food, paper, plastic, and other waste generated by the airport that can be
considered the material inputs to the Energy Park [2].
Table 25: ATL Municipal Waste Categorization [2, 3]
Waste Type weight % tons/yr
FW 28.4 7,100
paper (cardboard, newspaper, office paper, other paper) 48 12,000
plastics 12.4 3,100
other (wood, aluminum cans, steel cans, glass, etc.) 11.1 2,775
total (approximate)
25,000
gal/yr
waste cooking oil
23,000
The FW was noted to contain large amounts of melted ice, water, and other beverages [2].
The Los Angeles World Airports (LAWA) and Los Angeles Environmental Engineering
Division determined that samples of airport FW contained 73% moisture and 27% TS of which

92 Energy Analysis
94.9% were volatile (organic) solids [4]. It is assumed that ATL FW is equivalent to that of
LAWA. ATL concessionaires used over 60,000 gallons per year of cooking oil, but only 30,000
gallons were collected and recycled, of which only 23,000 gallons were actually suitable for
conversion to biodiesel. Thus, this report considers only 23,000 gallons/year of waste cooking
oil to be available for conversion to biodiesel in the Energy Park. However, improved collection
and recycling efforts at the airport could increase this substantially.
This report also does not consider conversion of plastics or “other” waste input streams for
processing in the Energy Park. The airport is currently working to improve recycling initiatives
which may resolve these waste streams. Thus, the total MSW input to the Energy Park is 19,100
tons/year and 23,000 gallons/year waste cooking oil.
Description of Proposed Energy Park 9.3.Figure 26 depicts the overall Energy Park flow sheet. Only major feed and output streams
are shown. The proposed Energy Park has five unit operations: transport, AD, CHP,
composting, biodiesel generation, and plant production (vegetables/energy crops). Of these, the
AD and CHP units are considered the Energy Production Train because the energy viability of
the park depends on the electricity and heat produced from these units being sufficient to sustain
operations of all other units. Sorting of the waste through mechanical or automated means is not
considered as a separate unit operation because much of this could be accomplished through
adjustments to airport waste collection practices and policies.
In the Energy Production Train (AD and CHP), FW is digested by bacteria in a low oxygen
environment producing biogas and sludge or organic residue. The biogas which is largely CH4
and CO2 is fed to the CHP to generate electricity and heat (as hot water or steam). This heat
stream is used to keep the AD system at the required temperature and also to heat the waste
cooking oil in the biodiesel conversion process. The electricity is used to run the Energy Park
mechanical equipment.
Paper waste is combined with the heavy organic residue from the AD process in a
composting unit. Here, the organic materials are bio-degraded under aerobic conditions to
produce nutrient-rich compost to be either sold or used for ATL landscaping needs. Waste
cooking oil, considered to be yellow grease, is converted to biodiesel in the biodiesel conversion
unit. The biodiesel can be either sold or used in airport vehicles. Glycerin is a heavy by-product
of the biodiesel conversion process and has uses in the food and personal products industry.
Currently the glycerin market is flooded and so this product will likely be viewed as a waste
stream. [5]
A myriad of technologies for each unit operation was reviewed with the exception of waste
transport. The following technologies were considered for this energy analysis:
AD: single stage continuously stirred reactor (CSTR) under mesophillic reaction
conditions
CHP: gas turbine with steam heat recovery system and reciprocating engine with hot
water heat recovery system
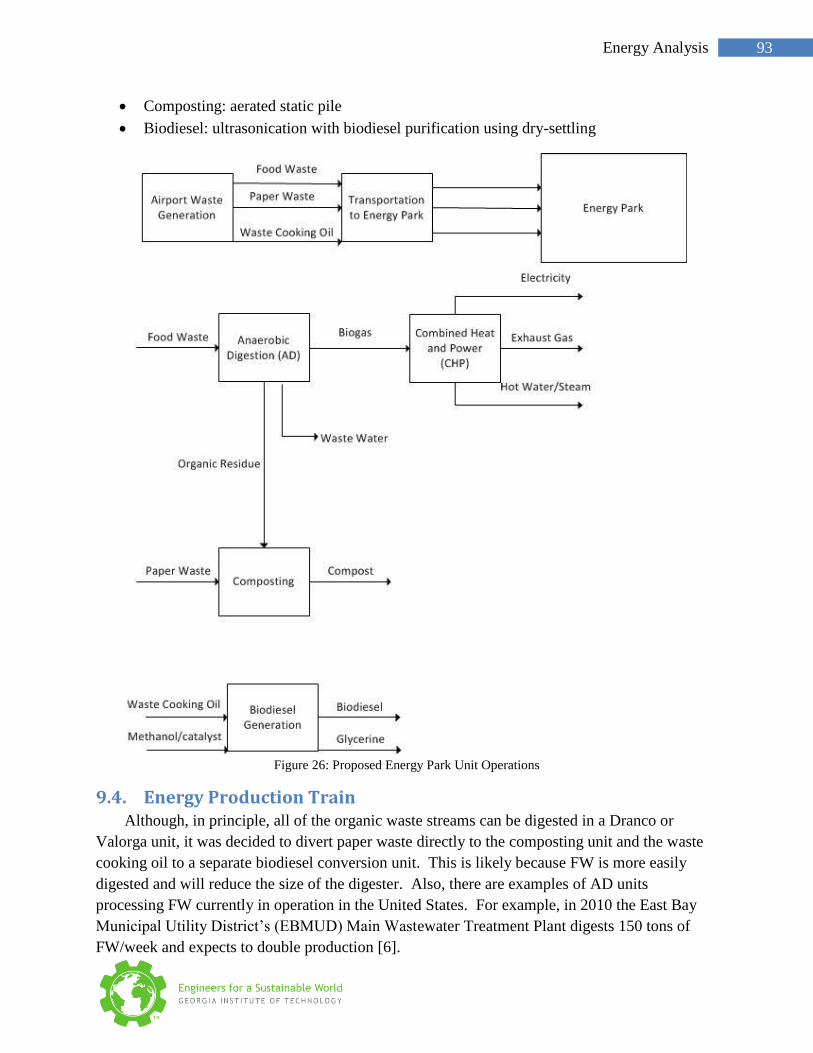
93 Energy Analysis
Composting: aerated static pile
Biodiesel: ultrasonication with biodiesel purification using dry-settling
Figure 26: Proposed Energy Park Unit Operations
Energy Production Train 9.4.Although, in principle, all of the organic waste streams can be digested in a Dranco or
Valorga unit, it was decided to divert paper waste directly to the composting unit and the waste
cooking oil to a separate biodiesel conversion unit. This is likely because FW is more easily
digested and will reduce the size of the digester. Also, there are examples of AD units
processing FW currently in operation in the United States. For example, in 2010 the East Bay
Municipal Utility District’s (EBMUD) Main Wastewater Treatment Plant digests 150 tons of
FW/week and expects to double production [6].
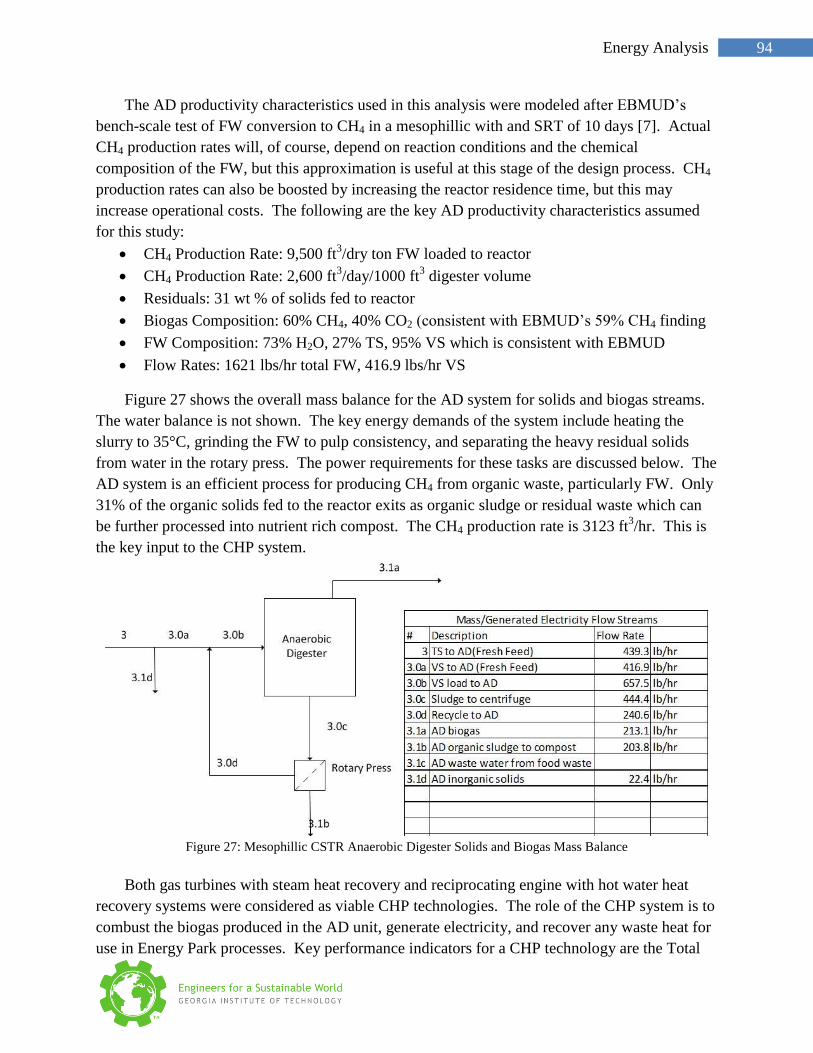
94 Energy Analysis
The AD productivity characteristics used in this analysis were modeled after EBMUD’s
bench-scale test of FW conversion to CH4 in a mesophillic with and SRT of 10 days [7]. Actual
CH4 production rates will, of course, depend on reaction conditions and the chemical
composition of the FW, but this approximation is useful at this stage of the design process. CH4
production rates can also be boosted by increasing the reactor residence time, but this may
increase operational costs. The following are the key AD productivity characteristics assumed
for this study:
CH4 Production Rate: 9,500 ft3/dry ton FW loaded to reactor
CH4 Production Rate: 2,600 ft3/day/1000 ft
3 digester volume
Residuals: 31 wt % of solids fed to reactor
Biogas Composition: 60% CH4, 40% CO2 (consistent with EBMUD’s 59% CH4 finding
FW Composition: 73% H2O, 27% TS, 95% VS which is consistent with EBMUD
Flow Rates: 1621 lbs/hr total FW, 416.9 lbs/hr VS
Figure 27 shows the overall mass balance for the AD system for solids and biogas streams.
The water balance is not shown. The key energy demands of the system include heating the
slurry to 35°C, grinding the FW to pulp consistency, and separating the heavy residual solids
from water in the rotary press. The power requirements for these tasks are discussed below. The
AD system is an efficient process for producing CH4 from organic waste, particularly FW. Only
31% of the organic solids fed to the reactor exits as organic sludge or residual waste which can
be further processed into nutrient rich compost. The CH4 production rate is 3123 ft3/hr. This is
the key input to the CHP system.
Figure 27: Mesophillic CSTR Anaerobic Digester Solids and Biogas Mass Balance
Both gas turbines with steam heat recovery and reciprocating engine with hot water heat
recovery systems were considered as viable CHP technologies. The role of the CHP system is to
combust the biogas produced in the AD unit, generate electricity, and recover any waste heat for
use in Energy Park processes. Key performance indicators for a CHP technology are the Total
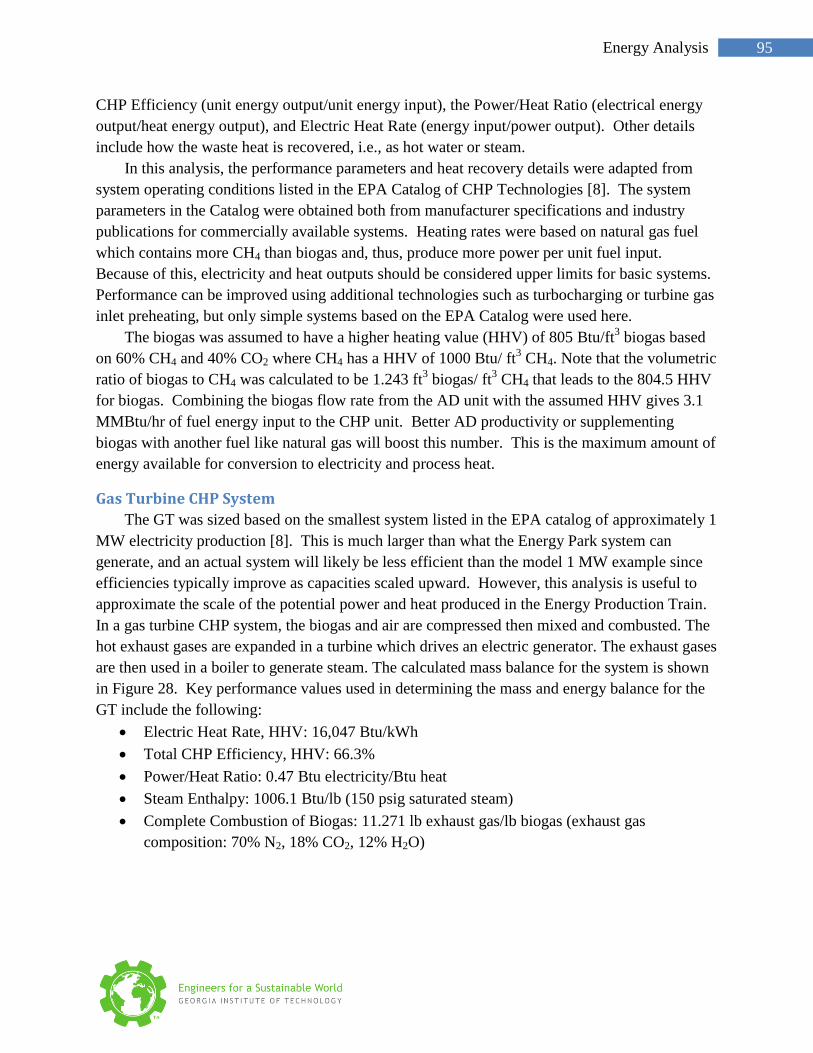
95 Energy Analysis
CHP Efficiency (unit energy output/unit energy input), the Power/Heat Ratio (electrical energy
output/heat energy output), and Electric Heat Rate (energy input/power output). Other details
include how the waste heat is recovered, i.e., as hot water or steam.
In this analysis, the performance parameters and heat recovery details were adapted from
system operating conditions listed in the EPA Catalog of CHP Technologies [8]. The system
parameters in the Catalog were obtained both from manufacturer specifications and industry
publications for commercially available systems. Heating rates were based on natural gas fuel
which contains more CH4 than biogas and, thus, produce more power per unit fuel input.
Because of this, electricity and heat outputs should be considered upper limits for basic systems.
Performance can be improved using additional technologies such as turbocharging or turbine gas
inlet preheating, but only simple systems based on the EPA Catalog were used here.
The biogas was assumed to have a higher heating value (HHV) of 805 Btu/ft3 biogas based
on 60% CH4 and 40% CO2 where CH4 has a HHV of 1000 Btu/ ft3 CH4. Note that the volumetric
ratio of biogas to CH4 was calculated to be 1.243 ft3 biogas/ ft
3 CH4 that leads to the 804.5 HHV
for biogas. Combining the biogas flow rate from the AD unit with the assumed HHV gives 3.1
MMBtu/hr of fuel energy input to the CHP unit. Better AD productivity or supplementing
biogas with another fuel like natural gas will boost this number. This is the maximum amount of
energy available for conversion to electricity and process heat.
Gas Turbine CHP System
The GT was sized based on the smallest system listed in the EPA catalog of approximately 1
MW electricity production [8]. This is much larger than what the Energy Park system can
generate, and an actual system will likely be less efficient than the model 1 MW example since
efficiencies typically improve as capacities scaled upward. However, this analysis is useful to
approximate the scale of the potential power and heat produced in the Energy Production Train.
In a gas turbine CHP system, the biogas and air are compressed then mixed and combusted. The
hot exhaust gases are expanded in a turbine which drives an electric generator. The exhaust gases
are then used in a boiler to generate steam. The calculated mass balance for the system is shown
in Figure 28. Key performance values used in determining the mass and energy balance for the
GT include the following:
Electric Heat Rate, HHV: 16,047 Btu/kWh
Total CHP Efficiency, HHV: 66.3%
Power/Heat Ratio: 0.47 Btu electricity/Btu heat
Steam Enthalpy: 1006.1 Btu/lb (150 psig saturated steam)
Complete Combustion of Biogas: 11.271 lb exhaust gas/lb biogas (exhaust gas
composition: 70% N2, 18% CO2, 12% H2O)
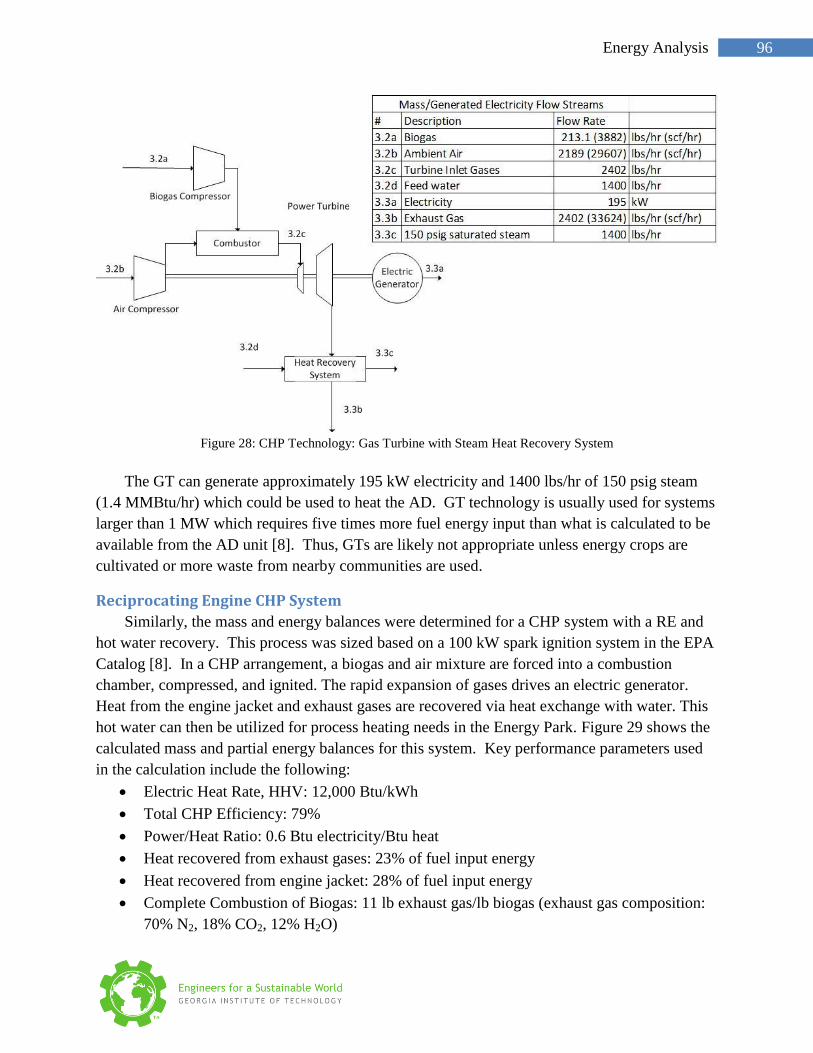
96 Energy Analysis
Figure 28: CHP Technology: Gas Turbine with Steam Heat Recovery System
The GT can generate approximately 195 kW electricity and 1400 lbs/hr of 150 psig steam
(1.4 MMBtu/hr) which could be used to heat the AD. GT technology is usually used for systems
larger than 1 MW which requires five times more fuel energy input than what is calculated to be
available from the AD unit [8]. Thus, GTs are likely not appropriate unless energy crops are
cultivated or more waste from nearby communities are used.
Reciprocating Engine CHP System
Similarly, the mass and energy balances were determined for a CHP system with a RE and
hot water recovery. This process was sized based on a 100 kW spark ignition system in the EPA
Catalog [8]. In a CHP arrangement, a biogas and air mixture are forced into a combustion
chamber, compressed, and ignited. The rapid expansion of gases drives an electric generator.
Heat from the engine jacket and exhaust gases are recovered via heat exchange with water. This
hot water can then be utilized for process heating needs in the Energy Park. Figure 29 shows the
calculated mass and partial energy balances for this system. Key performance parameters used
in the calculation include the following:
Electric Heat Rate, HHV: 12,000 Btu/kWh
Total CHP Efficiency: 79%
Power/Heat Ratio: 0.6 Btu electricity/Btu heat
Heat recovered from exhaust gases: 23% of fuel input energy
Heat recovered from engine jacket: 28% of fuel input energy
Complete Combustion of Biogas: 11 lb exhaust gas/lb biogas (exhaust gas composition:
70% N2, 18% CO2, 12% H2O)
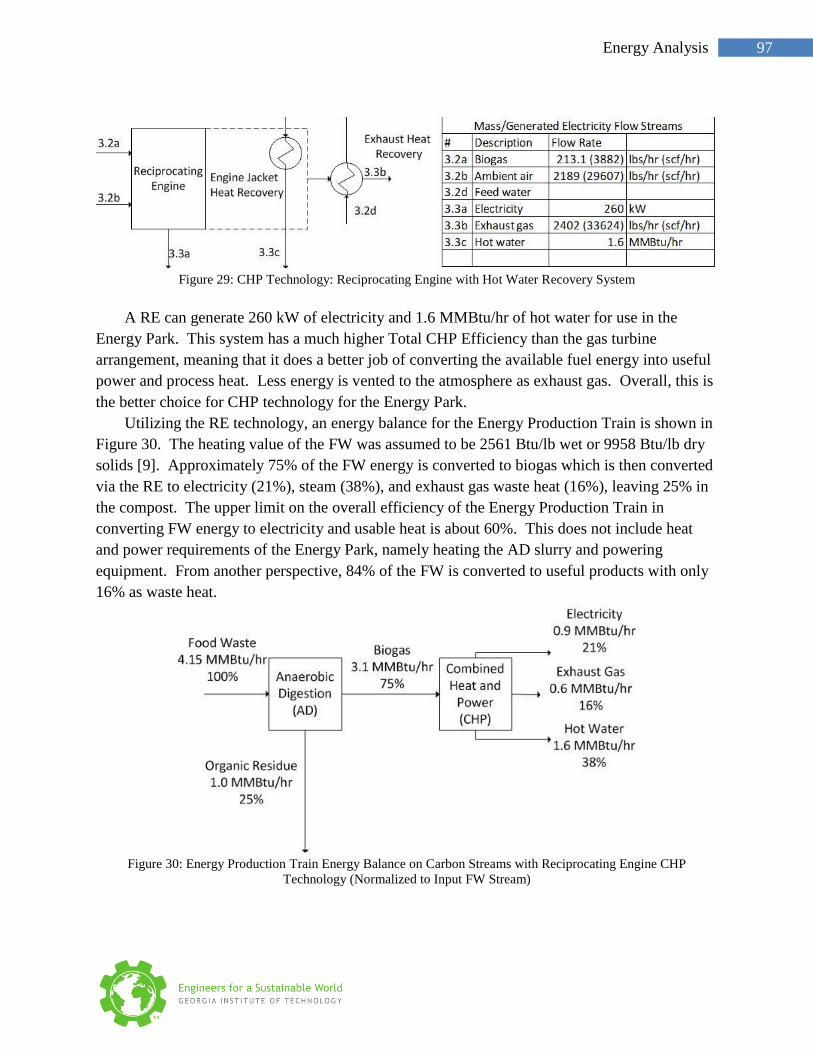
97 Energy Analysis
Figure 29: CHP Technology: Reciprocating Engine with Hot Water Recovery System
A RE can generate 260 kW of electricity and 1.6 MMBtu/hr of hot water for use in the
Energy Park. This system has a much higher Total CHP Efficiency than the gas turbine
arrangement, meaning that it does a better job of converting the available fuel energy into useful
power and process heat. Less energy is vented to the atmosphere as exhaust gas. Overall, this is
the better choice for CHP technology for the Energy Park.
Utilizing the RE technology, an energy balance for the Energy Production Train is shown in
Figure 30. The heating value of the FW was assumed to be 2561 Btu/lb wet or 9958 Btu/lb dry
solids [9]. Approximately 75% of the FW energy is converted to biogas which is then converted
via the RE to electricity (21%), steam (38%), and exhaust gas waste heat (16%), leaving 25% in
the compost. The upper limit on the overall efficiency of the Energy Production Train in
converting FW energy to electricity and usable heat is about 60%. This does not include heat
and power requirements of the Energy Park, namely heating the AD slurry and powering
equipment. From another perspective, 84% of the FW is converted to useful products with only
16% as waste heat.
Figure 30: Energy Production Train Energy Balance on Carbon Streams with Reciprocating Engine CHP
Technology (Normalized to Input FW Stream)

98 Energy Analysis
Heat and Power Requirements of the Energy Park 9.5.The Energy Park produces heat and power in the Energy Production Train. However, the
equipment requires some heat and power to sustain the process. The largest loads include
maintaining the AD slurry at temperatures suitable for digestion, grinding the FW to pulp,
grinding the paper waste and air blowers for the composting unit, separating water from heavy
solids in the AD system before sending the solids to compost, and heating of the waste cooking
oil in the Biodiesel Conversion unit. Other loads include transporting the waste to the Energy
Park, sorting of the waste, and purifying the biogas after the AD system before combustion in the
CHP system.
Because full sizing of equipment and determination of the loads are beyond this work,
comparisons are made to a 2011 study completed by Banks et al. in which the energy and mass
balances for a similar Energy Production Train were tracked for 426 days in 2007-2008 [10]. In
this unit, domestic FW (95.5%), commercial FW (2.9%), and grass cuttings (1.6%) were fed to
an AD to produce biogas and digestate. The biogas was sent to a CHP unit, and the digestate
was pasteurized for use on local farms. The overall capacity of the plant is about half of the size
of the proposed ATL Energy Park based on the plant’s FW throughput of 3,936 metric tons over
426 days. Although some of the operating parameters are different such as a higher operating
temperature of 42°C, lower solids loading rate, and larger biogas conversion rate, the key loads
are similar: raw waste shredder, macerators, feed pumps, compressor pumps, CHP and boiler
feed water pumps, belt press, air filtration and minor ancillary equipment such as conveyors. In
the study, 30% of the gross electrical output was used to power the plant and 30% of the
recovered heat in the CHP unit was used for process heating in the plant. Since the 2011 study
and the proposed Energy Park involve similar processes and similar scales of FW throughput,
these heat and power requirements are reasonable to apply to the proposed Energy Park Energy
Production Train as a first approximation.
However, the 2011 study did not include Biodiesel Conversion and Compost conversion
units. Some equipment for these includes grinders for the paper waste, an air blower for aerating
the compost, and heating mechanisms for the waste cooking oil. Scenario 1 for composting
assumes that only paper waste and sludge from the AD units are the mass input streams available
to the composting unit. Based on a 30 horsepower (hp) hammer mill for the paper waste, 23 kW
electricity will be required for the tonnage of paper waste supplied to the composting unit [11] .
An air blower will require only a few kW at most and is a minor consumer. Scenario 2 for
composting assumes that all compostable MSW is used. For a waste input stream to the
composting unit of approximately 20,000 tons/yr, the size of the hammer mill increases to
approximately 40 kW based on a 50 hp machine [11]. This would consume about 15% of the
electricity output from the reciprocating engine CHP calculated in this analysis.
Heating requirements for the biodiesel process will require further study, but is not expected
to be encumbering since the volume of waste cooking oil is much less than the volume of FW
and water in the AD unit which only requires 30% of the heat produced in the CHP unit.
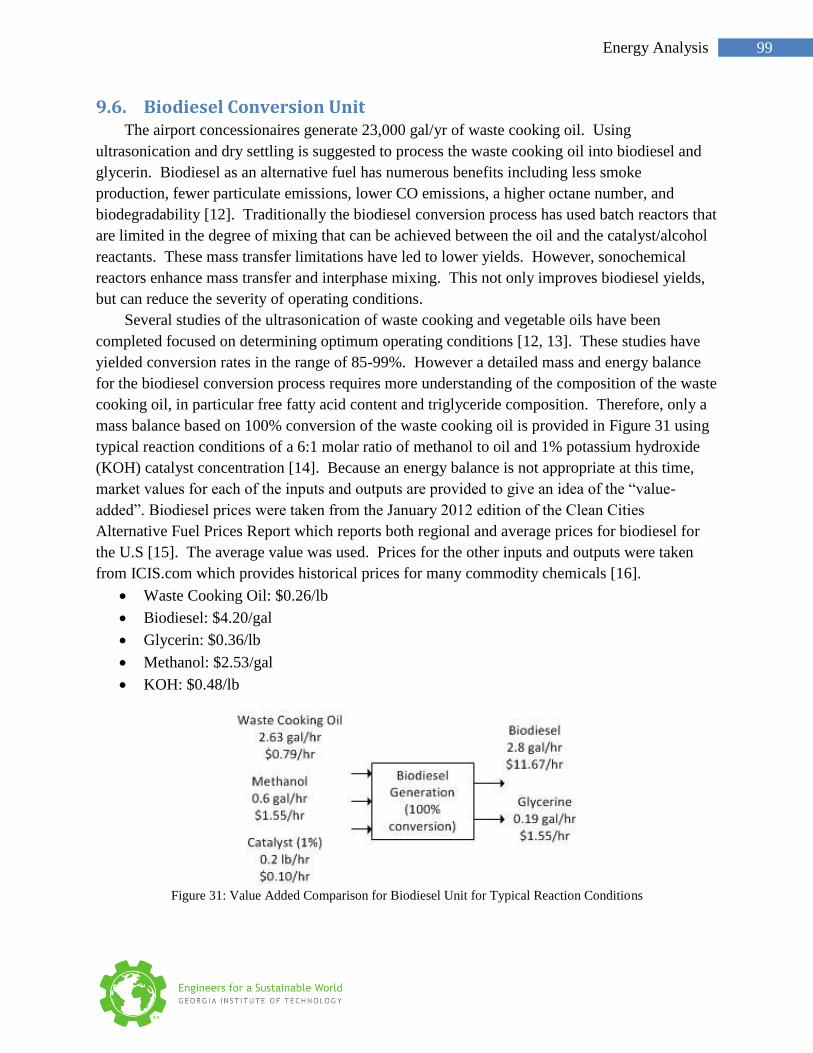
99 Energy Analysis
Biodiesel Conversion Unit 9.6.The airport concessionaires generate 23,000 gal/yr of waste cooking oil. Using
ultrasonication and dry settling is suggested to process the waste cooking oil into biodiesel and
glycerin. Biodiesel as an alternative fuel has numerous benefits including less smoke
production, fewer particulate emissions, lower CO emissions, a higher octane number, and
biodegradability [12]. Traditionally the biodiesel conversion process has used batch reactors that
are limited in the degree of mixing that can be achieved between the oil and the catalyst/alcohol
reactants. These mass transfer limitations have led to lower yields. However, sonochemical
reactors enhance mass transfer and interphase mixing. This not only improves biodiesel yields,
but can reduce the severity of operating conditions.
Several studies of the ultrasonication of waste cooking and vegetable oils have been
completed focused on determining optimum operating conditions [12, 13]. These studies have
yielded conversion rates in the range of 85-99%. However a detailed mass and energy balance
for the biodiesel conversion process requires more understanding of the composition of the waste
cooking oil, in particular free fatty acid content and triglyceride composition. Therefore, only a
mass balance based on 100% conversion of the waste cooking oil is provided in Figure 31 using
typical reaction conditions of a 6:1 molar ratio of methanol to oil and 1% potassium hydroxide
(KOH) catalyst concentration [14]. Because an energy balance is not appropriate at this time,
market values for each of the inputs and outputs are provided to give an idea of the “value-
added”. Biodiesel prices were taken from the January 2012 edition of the Clean Cities
Alternative Fuel Prices Report which reports both regional and average prices for biodiesel for
the U.S [15]. The average value was used. Prices for the other inputs and outputs were taken
from ICIS.com which provides historical prices for many commodity chemicals [16].
Waste Cooking Oil: $0.26/lb
Biodiesel: $4.20/gal
Glycerin: $0.36/lb
Methanol: $2.53/gal
KOH: $0.48/lb
Figure 31: Value Added Comparison for Biodiesel Unit for Typical Reaction Conditions
100 Energy Analysis
Although the waste cooking oil input is given a price here, ATL could consider this stream
to be free to the Biodiesel Conversion unit. The price shown is, rather, what the airport could
expect to get from selling the oil on the market. The oil, however, would likely need to be
filtered and cleaned for sale. Based on Figure 31, the value added from converting waste
cooking oil to biodiesel is large. Again, these numbers assume 100% conversion whereas typical
conversions of waste cooking oil are more on the order of 80-90%. This analysis should be
combined with a detailed accounting of the cost of the equipment outside the scope of this
analysis.
Waste-to-Energy Comparison 9.7.Another common use for solid waste is incinerating it to run a steam turbine and generate
electricity. These processes are only 15% efficient at converting input chemical energy to
electrical energy compared with about 30% for reciprocating engines [8, 17]. If all of the paper
and FW from the airport were combusted, about 11.3 MMBtu/hr of energy would be released.
This is based on the waste having a HHV of 1036 Btu/lb waste, calculated from the EPA’s Waste
Reduction Model for 1,950 tons/yr corrugated containers, 3,375 tons/yr newspaper, 7,100 tons/yr
food scraps, and 5,375 tons/yr mixed paper [18]. Converting this to electricity at 15% efficiency
generates about 500 kW of electricity. In theory, the waste heat could also be recovered.
In this scenario, however, about 1.3 tons/hr of carbon are emitted to the atmosphere (based
on 0.47 lb C/dry lb FW and 0.90 lb C/lb paper waste) [19, 20]. If carbon emissions from
composting are assumed to be zero in the Energy Park, approximately 0.06 tons/hr carbon are
emitted. While more power can be produced by incinerating the waste, emissions are a concern.
Since the Energy Park scenario is predicted to produce enough heat and electricity to sustain
itself with much fewer emissions from a carbon standpoint, the Energy Park is the preferable
option. Of course this does not include costs of construction, or labor.
Conclusions 9.8.The proposed ATL Energy Park is predicted to be self-sustainable from an energy balance
perspective, generating 260 kW of electricity and 1.6 MMBtu/hr of hot water heat (based on the
reciprocating engine CHP system scenario). Other AD/CHP plants consume about 30% of this
power and heat to run the load requirements of the plant, leaving 70% of the power and heat
available for other uses. Other demands will include heat and power to run the Composting and
Biodiesel Conversion units, but these are not expected to be high. The overall Energy
Production Train is predicted to be approximately 60% efficient in converting FW energy to
electricity and heat energy with only 16% released as waste exhaust gas energy and the balance
embodied in the heavy organic residuals sent to compost.
101 Energy Analysis
References 9.9.1. Airport, H.-J.A.I., Energy Park Information, 2011, Hartsfield-Jackson Atlanta International Airport:
Atlanta. p. 3.
2. Airport, H.-J.A.I., 2006 Waste Characterization Report, 2007, Hartsfield-Jackson Atlanta International
Airport: Atlanta.
3. General Questions to Hartsfield-Jackson Atlanta International Airport.
4. Hernandez, G., et al., Los Angeles digesters produce energy from airport food residuals. BioCycle,
2002. 43(1).
5. Lei, W.L. Focus: High inventory weighs on Asia refined glycerine market. ICIS news, 2012.
6. Kerr, D. EBMUD turns food scraps into electricity. OaklandNorth, 2010.
7. District, E.B.M.U., Anaerobic Digestion of FW: Final Report, 2008, U.S. Environmental Protection
Agency Region 9. p. 1-62.
8. Agency, U.S.E.P. and C.H.a.P. Partnership, Catalog of CHP Technologies, 2008.
9. Themelis, N.J., Y.H. Kim, and M.H. Brady, Energy recovery from New York City solid wastes. ISWA
Journal: Waste Managment and Research, 2002. 20: p. 223-233.
10. Banks, C.J., et al., Anaerobic digestion of source-segregated domestic FW: Performance assessment
by mass and energy balance. Bioresource Technology, 2011. 102(2): p. 612-620.
11. Stedman, Hammer Mills.
12. Hingu, S.M., P.R. Gogate, and V.K. Rathod, Synthesis of biodiesel from waste cooking oil using
sonochemical reactors. Ultrasonics Sonochemistry, 2010. 17(5): p. 827-832.
13. Singh, A.K., S.D. Fernando, and R. Hernandez, Base-Catalyzed Fast Transesterification of Soybean
Oil Using Ultrasonication. Energy & Fuels, 2007. 21(2): p. 1161-1164.
14. Van Gerpen, J., et al., Biodiesel Production Technology, 2004, National Renewable Energy
Laboratory.
15. Energy, C.C.U.S.D.o., Clean Cities Alternative Fuel Price Report, 2012. p. 1-17.
16. ICIS, Indicative Chemical Prices from 28 August 2006 issue of Chemical Market Reporter, 2006,
Reed Business Information Limited.
17. Morris, J., Recycling versus incineration: an energy conservation analysis. Journal of Hazardous
Materials, 1996. 47(1–3): p. 277-293.
18. Agency, U.S.E.P. Waste Reduction Model (WARM). 2012.
19. Zhang, R., et al., Anaerobic Phased Solids Digester Pilot Demonstration Project: Biodegradability
and Soil Amendment Potential ofAnaerobically Digested Residues, 2010, U.C. Davis.
20. Yen, H.-W. and D.E. Brune, Anaerobic co-digestion of algal sludge and waste paper to produce
methane. Bioresource Technology, 2007. 98(1): p. 130-134.

102 Conclusion & Recommendations
Conclusion & Recommendations 10.
103 Conclusion & Recommendations
In this chapter, we summarize the main findings and provide recommendations based on our
cost and energy analysis. These recommendations can be divided in two main parts:
Upstream waste management programs 10.1.These are initiatives aim to reduce waste generation and disposal at the airport terminals and
concessionaires. These programs include:
Training programs
Self-Sorting Systems
Compostable Packaging
These recommendations are mainly discussed in the first chapter of this report. They are
important in a sense that if fully implemented, can significantly reduce the need for additional
investment in the Energy Park. However due to the complex nature of interactions between
airport, tenants, and passengers inside the airport, the effect of implementing such initiatives are
not easy to predict. These programs will vary depending on the final MSW disposal method.
Waste Treatment at the Energy Park 10.2.A second set of recommendations are concerned with the idea of developing an Energy Park
next to the airport where the waste from the airport and potentially neighboring residential areas
can be collected and processed to produce useful energy and offset a portion of the airport energy
demand. There are two main feasible approaches to waste management at the Energy Park:
Collective Treatment
In this scenario, it is assumed that compostable waste is being collected without further
separation and therefore the proposed methods treat waste as a combination of paper, food, and
other compostable materials. In this case, composting can be done onsite or offsite. In case of
onsite composting, the recommended method would be static aeration composting. Static
aeration composting provides cost effective composting without the use of large turning
machinery as would be needed in standard windrow composting. Odor from the composting
process can also easily be controlled by using a negative pressure system and filtering the air
through already processed compost with a 95% reduction of the odors. Composting would take
place in large concrete bins with pipes below the compost or perforated flooring where a
negative pressure could be used to pull air through the compost pile thus aerating it increasing
the rate of composting. Over a 10 year period the average cost to compost a ton of waste would
be around $21/ton. However, if the airport sends all compostable waste to the offsite vendor the
cost will be ~ $10/ton. Therefore offsite composting is economically beneficial in the long run.
Another common use for solid waste is incinerating it to run a steam turbine and generate
electricity. Since this process emits about 20 times more GHG than the Chain Treatment, it is
not recommend as a sustainable option.
104 Conclusion & Recommendations
Chain Treatment
Chain treatment starts from separation of waste based on paper, cooking oil, and other
compostable materials. Here are our recommendations for each type of waste:
I) Paper waste:
Paper can be composted offsite with the cost of around $10/ton or onsite with the cost of
around $21/ton. Alternatively, paper waste can be used in a Gasification-to-Diesel process
which will contribute as fuel input to CHP unit. This is a preferred way of treating paper
which needs further investigation.
II) Cooking oil waste:
The airport concessionaires generate 23,000 gal/yr of waste cooking oil. Using
ultrasonication and dry settling is suggested to process the waste cooking oil into biodiesel
and glycerin.
III) FW and OMFW:
The proposed process for waste treatment consists of three stages: AD, CHP, and
greenhouses.
Based on estimated composition and consistency of the FW, the CSTR or the DRANCO
technology would be the best choice for the AD. The size of reactor will be estimated to be
about 540 m3 with the CH4 output of around 105 m
3 per hour. The only pre-treatment that
would be required before sending the waste to the CSTR reactor is liquifying the FW. The
cost of AD treatment would be around $380 per tons of input FW.
The recommended form of CHP system is a RE due to the small size and ease of use.
With the estimated outputs of the anaerobic digester gas turbine CHPs which were the other
suggested CHP system for use at the Energy park would have to be supplemented with
additional natural gas due to the larger base size of gas turbine CHP’s. With a biogas input
of 3.1 MMBtu/hr a reciprocating CHP system would output 260.2 kW and 1.6 MMBtu/hr of
heat energy in the form of hot water. A reciprocating engine that could handle an output of
260.2 kW would have a net estimated benefit of $12.2 per tons of input FW.
As for the greenhouse, different energy crops were evaluated but none of them seem to be
at commercial scale yet. Duckweed and struvite may be viable options to increase power
production and recover nutrients, respectively. Similarly, aqua- and hydroponics systems can
be operated with nutrients from the FW and create an incredible amount of produce. Since
hydroponic gardening maximizes space so efficiency, only a small amount of space would be
needed to fill the need of airport restaurants. The additional space could be saved for other
sustainability projects, development, or more produce to sell in the community. This system
can use the exhausted water from AD and CHP. However, an additional step to purify the
water before it feeds into the hydroponic system might be required. If Aquaponics system is
adopted it can generate up to $450 per tons of input FW in revenues.

105 Conclusion & Recommendations
In conclusion and through this preliminary study we can state that the main cost of waste
treatment at the energy Park comes from the Anaerobic Digestion which can be offset by the
benefit from generating electricity in CHP plant and growing fresh vegetables in the
greenhouse. Therefore, the net value of investment in this project is tightly dependent on the
choice of AD system and also the appropriate technology employed for the greenhouse.