feasibility of commercial instant noodle production … · facility to produce and market instant...
TRANSCRIPT
FEASIBILITY OF COMMERCIAL INSTANT NOODLE PRODUCTION IN ARGENTINA: A JOURNEY TO A FASCINATING VALUE-
ADDED PRODUCT
by
JUAN FINELLI
B.R.A., Universidad Tecnologica Nacional, 2009
A THESIS
Submitted in partial fulfillment of the requirements
for the degree
MASTER OF AGRIBUSINESS
Department of Agricultural Economics
College of Agriculture
KANSAS STATE UNIVERSITY
Manhattan, Kansas
2013
Approved by:
Major Professor
Dr. Vincent Amanor-Boadu

ABSTRACT
There is an opportunity to develop an instant noodle manufacturing plant in
Argentina to manufacture and market branded and private-label instant noodles. This
opportunity has arisen from a number of factors. First, the increasing time compression
that confronts consumers has created an emergence of consumers who are looking for
quick meals that are also healthy. Second, the growing incomes that are being experienced
across all income classes have created a demand for processed food products across all
consumer markets. Third, potential competitors are not seeing the market trends and, thus,
create an opportunity to gain a first mover advantage in this burgeoning market. Finally,
the policies that are being developed by the government have created an import-
replacement mentality that presents significant opportunities to build specific strategic
alliances to seize an opportunity such as this one.
This thesis presents the feasibility of seizing this opportunity to build a
manufacturing facility to produce and market instant noodles in Argentina. It assesses the
technical and economic dimensions of the feasibility process and presents financial
analyses of the potential outcome for investors. The researcher is leading the project and
participating in the investment process. Therefore, the outcome of this thesis has direct
implications for the wellbeing of the researcher beyond partial fulfillment of degree
requirements.
The results show that the opportunity is credible and profitable over a 20-year
period. The Net Present Value of the investment is positive and its Internal Rate of Return
of 26 percent is higher than the company’s hurdle rate of 15 percent. To this end, it
suggested that the investment must go ahead. However, the sensitivity analysis shows that
at the initial production level of 60,000 packets per shift, the project is very sensitive to the
number of shifts that are run per day. Indeed, if the company runs one shift for the first
three years instead of the first two years and two shifts for the next three years instead of
Years 3 and 4, the project is not economically feasible. On the other hand, building a larger
plant, one that produces 120,000 packets per shift, protects the plant from this vulnerability.
The internal rate of return is 40 percent and the NPV is in excess of $5 million over 20
years. Therefore, the recommendation is to build the larget plant and enhance the
robustness of the plant.

iv
TABLE OF CONTENTS
List of Figures .......................................................................................................................... v
List of Tables .......................................................................................................................... vi
Acknowledgments ................................................................................................................. vii
Chapter I: Introduction ......................................................................................................... 1
1.1 Research Problem ......................................................................................................... 3
1.2 Project Objectives ......................................................................................................... 3
1.3 The Importance of this Research ................................................................................. 4
1.4 Layout of the Research ................................................................................................. 4
Chapter II: Literature Review .............................................................................................. 6
2.1 Argentina: The People and the Market ........................................................................ 6
2.2 My Search for Opportunity .......................................................................................... 8
2.3 Methodological Literature .......................................................................................... 11
2.4 Product Literature ....................................................................................................... 14
2.5 Migration to the West and the Rest of the World ...................................................... 17
2.6 Convenience, time constraint, demographics and food technology ........................ 17
Chapter III: Methods ........................................................................................................... 19
3.1 Assumptions Underlying the Analyses ...................................................................... 19
3.1.1 Market Assumptions ......................................................................................... 19 3.1.2 Production Assumptions ................................................................................... 22 3.1.3 Organizational Assumptions ............................................................................. 24
3.2 Scenario and Sensitivity Analysis .............................................................................. 26
Chapter IV: Results .............................................................................................................. 28
4.1 Base Scenario Results ................................................................................................ 28
4.2 Scenario 1 Results ...................................................................................................... 35
4.3 Scenario 2 ................................................................................................................... 36
Chapter V: Conclusion ......................................................................................................... 39
References .............................................................................................................................. 43

v
LIST OF FIGURES
Figure 2.1 Argentina Official Inflation Rate ....................................................................... 1
Figure 2.2: Argentina's Population Trend .......................................................................... 7
Figure 2.3: Distribution of Argentinian Population by Age Cohorts in 2013 ................. 8
Figure 2.4 Noodle Soup ........................................................................................................ 14
Figure 3.1: Immigration patterns of Europeans in the 19th and 20th Centuries ......... 21
Figure 4.1: Total Annual Output, Revenue and Cost of Goods in Million Packets or
Cups and Million Dollars ..................................................................................................... 29
Figure 4.2: Distribution of Selling and General Expenses for Year 1 of Operation .... 31
Figure 4.3: Sensitivity of NPV and IRR to Manufacturer's Selling Price ..................... 32
Figure 4.4: Sensitivity of NPV to Number of Batches ...................................................... 33
Figure 4.5: Total Annual Output, Revenue and Cost of Goods in Million Packets or
Cups and Million Dollars under Scenario 1 ...................................................................... 35
Figure 4.6: Sensitivity of NPV to Manufacturer's Selling Price under Scenario 1 ...... 36
Figure 4.7: Revenue, Cost of Goods and Gross Margin in Million Dollars under
Scenario 2 ............................................................................................................................... 37
Figure 4.8: Sensitivity of NPV to Manufacturer's Selling Price under Scenario 2 ...... 38

vi
LIST OF TABLES
Table 2.3: Consumption Trends for Instant Noodles by Selected Country (in Million
Packets (Bags/Cups) ............................................................................................................. 16
Table 3.1: Production Requirements for the 60 and 120 Thousand Packets per Shift
Production Capacity Equipment ........................................................................................ 23
Figure 3.2: Typical Layout and and Plant Floor of an Instant Noodle Facility Line .. 25
Table 4.1: Summary Financial Statement of the Investment ($Million) ....................... 34

vii
ACKNOWLEDGMENTS
I thank my wife and my family for their unfailing support. I thank my adviser, Dr.
Vincent, for being constantly available to help me think through this and other ideas that I
have been thinking about while working on this project and for his friendship. To Deborah
and Mary for their professionalism and unfailing encouragement to me and my fellow
MAB students I will be eternally grateful. I also thank my committee members, Dr. Arlo
Biere and Dr. Christine Wilson, for being patient with me throughout this research process
and accommodating my busy schedule and last-minute delivery of reports. Finally, I thank
my MAB classmates and all the MAB faculty for helping make my journey more exciting
and more fascinating.
1
CHAPTER I: INTRODUCTION
Argentina is the second largest country in South America, after Brazil and also the
largest Spanish-speaking country in the world by land mass. Its 41 million people make it
the fourth largest Spanish-speaking country in the world. Because its Gross National
Income (GNI) per capita was $9,740 in 2011, the World Bank classifies Argentina as an
upper-middle income country. According to the World Bank, countries with Gross
National Income per capita between $4,036 and $12,475 are upper middle income.1
Argentina suffers from “high inflation syndrome,” implying that the country seems unable
to decrease and sustain lower inflation rates. While inflation has been estimated to be
officially around 9 percent since 2006, the private estimates put it somewhere closer to 30
percent (Bermúdez, 2012).2
Figure 2.1 Argentina Official Inflation Rate
The high inflation environment has contributed to weakening the Argentine
economy, stunting growth for decades. Early this year, the IMF warned Argentina for
1 The GNI/capita of low income countries is $1,025 or less; lower middle income is $1,026 to $4,035;
and high income is $12,476 or more. 2 Ismael Bermúdez, I. (2012-06-05). "La inflación se proyecta al 30% annual," 2012. Available at
http://www.ieco.clarin.com/economia/inflacion-proyecta-anual_0_713328717.html.
2
failing to meet its standards for reporting its economic data. They pointed out to review the
inaccuracy of the country’s inflation and GDP data, no later than September 29th. The
country replied back with a new index after 4th quarter, but clouds of doubts are arising,
especially when in October the country will be immersed in congressional elections.
There is also the problem of corruption in Argentina, ranked 100th out of 178 countries in
the Transparency International's Corruption Perceptions Index for 2011
(http://www.transparency.org/cpi2011/results/). The problem encompasses government
corruption and lack of judicial independence. The populists and depressing taxes and
tariffs that are imposed on business as well as the uncertain yet constant regulatory
interference in virtually all segments of the economy contribute to the corrupt environment
and damage the productive atmosphere.
Despite its upper-middle income status, it is important to recognize that income
disparity in Argentina is very high. This disparity is higher between urban and rural areas
in the country and also among ethnic groups even in the urban areas (IMF, undated).
Despite this income inequality, there is increasing evidence that overall consumption of
value-added food products is increasing across the country, among all economic classes.
One product experiencing rapid growth in consumption is instant noodles. This
growth is a result of increasing affluence and time compression, which is making
consumers search for convenience foods that may also be perceived as healthy. However,
there is no production facility in the country. The products are currently being imported
from Brazil and the U.S. Given the changing demographic environment in the country,
there is reason to believe that this product category will continue to grow for years to come.
Additionally, the tax and regulatory policies being pursued by the government create an

3
economic arena that could provide significant incentives for import replacement. This is
especially true in the area of access to foreign exchange that is used to support these
imports. Assuming the continuation of these monetary and fiscal policies in the country,
the instant noodle market presents some interesting opportunities that need to be
investigated.
1.1 Research Problem
It is very important to investigate the technical and economic feasibility of the
instant noodle opportunity in Argentina because of the market, macroeconomic and
political environment confronting businesses in the country. The primary research
problem, then, is to determine the conditions under which developing a manufacturing
facility to produce and market instant noodles in Argentina would be technically and
economically feasible.
1.2 Project Objectives
The overall objective of this research is to conduct a technical and economic
feasibility analysis of the manufacture and marketing of instant noodles in Argentina in
response to the opportunity created by the increasing demand of this product that is
currently being imported into the country. The specific objectives are as follows:
1. Develop a framework for assessing the instant noodle opportunity in Argentina
using the changing demographic characteristics of the country as the foundation.
2. Assess the technological and operational conditions that facilitate technical
feasibility of manufacturing instant noodles in Argentina
3. Evaluate the economic feasibility of manufacturing and marketing instant noodles
in Argentina pursuing a Blue Ocean strategy

4
1.3 The Importance of this Research
This research is important because as an entrepreneur, my focus is always on
identifying opportunities that can be exploited. However, the traditional approach I have
used for most of my entrepreneurial life is going with my gut feelings about opportunities.
Participating in the Master of Agribusiness Program at Kansas State University has
provided me with new and systematic tools that could help me to become more astute in
my selection of opportunities.
This research project facilitates my careful employment of economic, financial and
management tools to carefully assess the market situation, the economic environment and
the technical realities of entering the market for instant noodles in Argentina. It allows for
an ex-ante evaluation of effective opportunities to create a Blue Ocean and, thus, avoid, the
risks of potentially entering into price and other competition environments with the
incumbents in the market for the product.
1.4 Layout of the Research
The rest of the research is laid out as follows. In the next section, an overview of
the literature on instant noodles production and consumption is provided. This overview
encompasses the history and global situation of instant noodles, assessing its characteristics
that have made it a popular product in many countries. The chapter also provides an
overview of the demographic dynamics in Argentina that support the credibility of the
instant noodle opportunity. These two assessments contribute to addressing the first
objective of the project. Chapter III presents the methodological approaches that are used
to conduct the feasibility assessment. The chapter is organized into two broad sections:
technical feasibility assessment methods; and economic feasibility assessment methods.
The first section presents the framework for assessing technical feasibility – equipment and

5
technology, raw material sourcing, human resource capacity and availability, etc. Under
the second section, the economic and financial data and their sources are presented and
discussed. Along with these are the specific assumptions that drive both the technical and
economic analyses. The results of the analyses are presented in Chapter IV. The
conditions for both technical and economic feasibility are discussed and the resulting net
present value, internal rate of return, and similar relevant indicators that are presented. The
final chapter discusses the strategies that will be pursued to achieve the desired results
while avoiding risks of Red Ocean competition.
6
CHAPTER II: LITERATURE REVIEW
This chapter presents the demographic and technical conditions that support the
instant noodle opportunity in Argentina. The chapter is divided into two broad segments.
The first segment covers the Argentinian economy, demographics and the demand for food
across the country. It lays the foundation for evaluating the size of the opportunity and
provides the framework for assessing the potential market that is available to be seized.
The second segment covers the technical aspects of producing instant noodles, including
the history of the production of instant noodles.
2.1 Argentina: The People and the Market
As indicated in the introductory chapter, Argentina is the second largest country in
South America, and the largest Spanish-speaking country in the world by land mass. The
population is predominantly (97 percent) white with Spanish and Italian ancestry. By
religion, 92 percent of Argentinians are Catholic. The trend in Argentina’s population and
its population density for the last decade is presented in Figure 2.1. Total population has
been growing at about 1.04 percent per annum over the past decade and that is principally a
result of natural growth. Natural growth is the difference between death and births. Net
migrations into Argentina have been essentially zero over the period under investigation.
Between 2012 and 2013, the natural growth effect was equivalent to adding about 416,309
people to the population. The population density (number of people per square kilometer)
has also been growing near linearly over the period. At about 16 people per square
kilometer, Argentina is not a densely populated country. That means it has land resources
that can be used in the production of food. And part of this research is assessing the
opportunities that this presents.

7
Figure 2.2: Argentina's Population Trend
Source: U.S. Census Bureau: International Programs (http://www.census.gov/population/international/data).
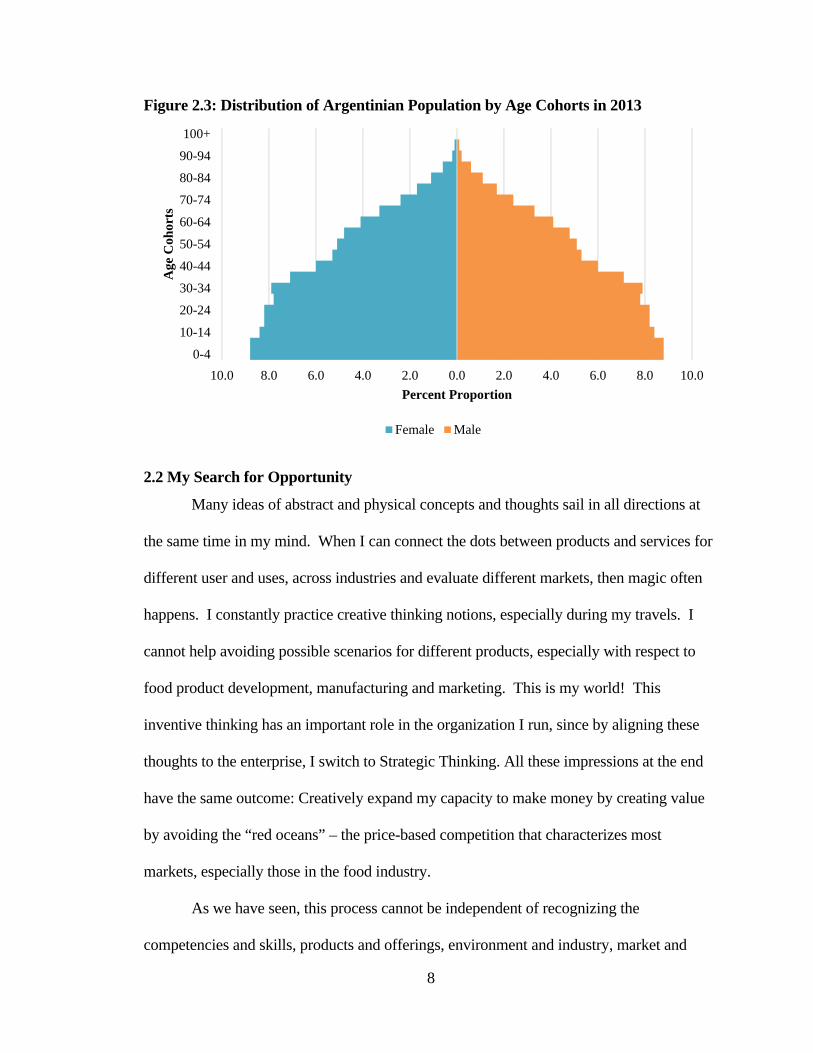
The distribution of the population by age group is important in helping understand
the potential size of the instant noodle market going forward. Figure 2.2 shows the
distribution of the Argentinian population by age group in 2013. The figure shows that the
composition of the population would support a business that is focused on addressing the
convenience and time constraints facing families and individuals. The 20-34 years old
cohorts together make the largest group in 2013. This means that over the next 20 years,
this group will provide a strong foundation for the domestic consumer market, increasing
earnings and incomes, building families and seeking leisure, making their need for
convenience foods, stronger.
36
37
38
39
40
41
42
43
2000 2001 2002 2003 2004 2005 2006 2007 2008 2009 2010 2011 2012 201312.0
12.5
13.0
13.5
14.0
14.5
15.0
15.5
16.0
Pop
ula
tion
(M
illi
on)
Year
Pop
ula
tion
Den
sity
(P
eop
le/K
m S
q)
Density Population
8
Figure 2.3: Distribution of Argentinian Population by Age Cohorts in 2013
2.2 My Search for Opportunity
Many ideas of abstract and physical concepts and thoughts sail in all directions at
the same time in my mind. When I can connect the dots between products and services for
different user and uses, across industries and evaluate different markets, then magic often
happens. I constantly practice creative thinking notions, especially during my travels. I
cannot help avoiding possible scenarios for different products, especially with respect to
food product development, manufacturing and marketing. This is my world! This
inventive thinking has an important role in the organization I run, since by aligning these
thoughts to the enterprise, I switch to Strategic Thinking. All these impressions at the end
have the same outcome: Creatively expand my capacity to make money by creating value
by avoiding the “red oceans” – the price-based competition that characterizes most
markets, especially those in the food industry.
As we have seen, this process cannot be independent of recognizing the
competencies and skills, products and offerings, environment and industry, market and
10.0 8.0 6.0 4.0 2.0 0.0 2.0 4.0 6.0 8.0 10.0
0-4
10-14
20-24
30-34
40-44
50-54
60-64
70-74
80-84
90-94
100+
Percent Proportion
Age
Coh
orts
Female Male

9
customers and competitors and substitutes within the product space that is being pursued
CFAR, 2001).
Current government policy in Argentina is creating both a favorable environment as
well as a “dangerous” environment for entrepreneurs. For example, the government is
currently imposing exports duties on raw materials, such as raw grains or cattle or minerals,
are often higher. Its objective is to create a domestic economy that is self-sufficient in food
production. However, this is also creating challenges for entrepreneurs who see
opportunities in expanding their markets beyond Argentina. The government is also
placing significant duties on all imports, discouraging importation of food, food products
and many other goods. This creates an opportunity to engage in businesses that have the
potential to replace imports and at the same time engender significant domestic demand.
So, I look and think: How can I benefit from this public policy environment? This
is the beginning of the journey that this research describes.
My family operates farms and processes food products. My special job and
responsibility is to run the components of our business dealing with designing, creating,
installing and establishing small and medium size commercial feed and flour mills, and oil
extraction plants. The family business is therefore fully integrated: We produce the raw
material, and then we add value by milling or processing our raw materials into consumer-
ready products. We have a show room that helps us promote our products to buyers from
different segments of the supply chain, providing us with some degree of control over
commodity prices.
An advantage of this integrated system is illustrated below. When a company
exports wheat, it pays export duties of 24 percent. Exporting flour reduces this tax to 14
10
percent. Exporting higher value processed products made from the flour – e.g., pasta –
results in an export duty of only 5 percent.3
So, how can we enhance the value of our wheat and minimize our exposure to the
changing regulations on exports? How do we differentiate ourselves in the marketplace?
We could produce the typical Italian pasta products but this would involve direct
competition in an already saturated market with numerous businesses. Furthermore, the
equipment for the production of pasta require significant upfront investment – up to
EUR4.2 million. Imports also attract import duties, tariffs and shipping that may be up to
60 percent. This makes such an investment into a “traditional” product market very
difficult to justify.
In my early trips to China about 10 years ago, I was introduced to a light meal
called Instant Noodles, very popular in Asian countries. These products are almost in every
shelf or desk, in offices and served by food service providers in airplanes and other
locations. People consume it for lunch and for dinner and as a snack. The product really
shocked me at first glance, since it really works and you keep going, is very affordable, and
comes in many tastes. Right away, I searched for that technology and found that was
originated in Japan, developed by one Mr. Momofuko Ando in 1958 (MIT). The
technological innovation regarding these instant noodles involved a precooking and flash
drying process. The consumer would just rehydrate the noodles and flavor it with the
desired flavorings and . . . voila . . . you have a meal in about three minutes. Mr. Ando’s
company branded its invention to Nissin Food Products Co, making it one of the biggest
one in the world.
3 Exporters of value-added products get 2 percent of any export duties paid returned after about year or 18 months. The process to collect this can be very difficult for most small businesses.

11
And so I thought: Could we do this in Argentina? Would it be successful in a
country that consumes significant amounts of pasta? Would consumers like it? By
beginning to look around, I saw that there were some instant noodle products on some
shelves in retail stores. But they were all imported. And they were relatively expensive. I
told myself that given the public policy environment, there is an opportunity to
manufacture this product in Argentina with a special Argentine flavor to match the palates
of the domestic consumer. This is how I started this journey.
2.3 Methodological Literature
This study assesses the feasibility by using two common financial indicators such
as net present value (NPV) and internal rate-of-return (IRR). The net present value and
internal rate-of-return methods are theoretically and empirically more acceptable than the
accounting rate-of-return and net payback period methods in that they explicitly consider
the cost of capital and the time value of money.
NPV is the discounted value of future cash flows that provides a current value of an
investment recognizing the effect of time on money. This concept of time effect is based
on the natural tendency for inflation and other factors to “erode” the value of money over
time. It is presented mathematically as follows:
t
t0
CFNPV
(1 K)
N
t
I
where K is the appropriate discount rate
NPV analysis is sensitive to the reliability of future cash inflows that a project like
this would yield. However, one of the limitations is the discount rate used. Another is the
“useful” life of the project that is being assessed. For example, 12 years ago, Argentina
emerged from a difficult economic environment. And looking forward from then would

12
have suggested some semblance of an emerging stability. However, in the last few years,
Argentina has started sinking back into another round of economic uncertainty. Inflation,
for example, has started climbing up and Reuters is estimating it at 25% per year (Reuters
2013).
The IRR is that discount rate which equates the discounted cash flows from a
project to the initial investment.
t
0
CFNPV I
(1 IRR)
N
tt
,
where CFt = cash flow (positive or negative) in period t
I = initial investment,
N = the life of the project.
The IRR is then compared with the cost of capital of the firm or its investment
hurdle rate to determine whether the project will return benefits greater than its total
economic cost.
Inflation has a major impact upon all financial decisions of the firm mainly because
tax deductibility of depreciation, is based upon historical costs. Nelson (Nelson 1976)
defines five areas in which inflation has influence on capital budgeting decisions:
a. The ideal amount of capital investment will naturally decline as the rate of inflation
increases. The greater the rate of inflation, the higher the discount rate, therefore the
poorer the marginal present value for the following dollars capitalized.
b. Elevated rates of inflation outcome lower capital/labor ratios and consequently
impact on the firm’s choice of seeking technology. The “price” of labor does not
rest on the rate of inflation, while the “price” of investment is a contingency of
13
inflation. Consequently the level of inflation matches to diverse price ratios among
labor and capital, and affects the chosen amount of each factor.
c. Inflation has a direct effect on estimating depreciation given that depreciation rates
are grounded on historical costs and the spreading of these charges over the life
span of the projects defines the net present value.
d. In the face of high inflation, projects with shorter life spans will be preferred over
those with longer projected lives since shorter lived projects will be required to
recoup their investment costs more quickly than longer-lived projects.
e. When inflation rates are high, replacement costs may be higher than anticipated,
increasing the overall costs facing the firm in its estimation of economic or
financial feasibility.
A weakness of both IRR and the NPV is that they do not obviously clarify the risk
of the project. Furthermore, the IRR and NPV can yield contradictory accept/reject
judgments. For this motive, the model will include (and weight) the risks associated,
specially those related to politics. To address this, the discount rate may be increased to
reflect the prevailing conditions in the market in which the investment is being made.
Additionally, the analyst may incorporate significant levels of contingency costs into the
planning so that it accounts for the uncertainty of future direction of prices. When dealt
with accurately, the decision-maker is able to position the investment in ways that increases
the likelihood of success despite the uncertainty. The effectiveness of these solutions may
be tested by conducting sensitivity analysis on critical variables to see how the results
withstand changes in their values.
14
2.4 Product Literature
The idea of introducing new products to any market may benefit a conversation
between Po and his father in the Dreamworks/Disney movie, Kung Fu Panda (Po June 6,
2008 (USA)):
Po’s Father: Po, I think it’s time I told you something I should have told you
a long time ago…The secret ingredient of my secret ingredient soup…The secret ingredient
is…Nothing.
Po: Huh?
Father: You heard me. Nothing! There is no secret ingredient!
Po: Wait, wait, it’s just plain old Noodle Soup? You don’t add some kind of special
sauce or something?
Father: Don’t have to, to make something special, you just have to believe it’s
special.
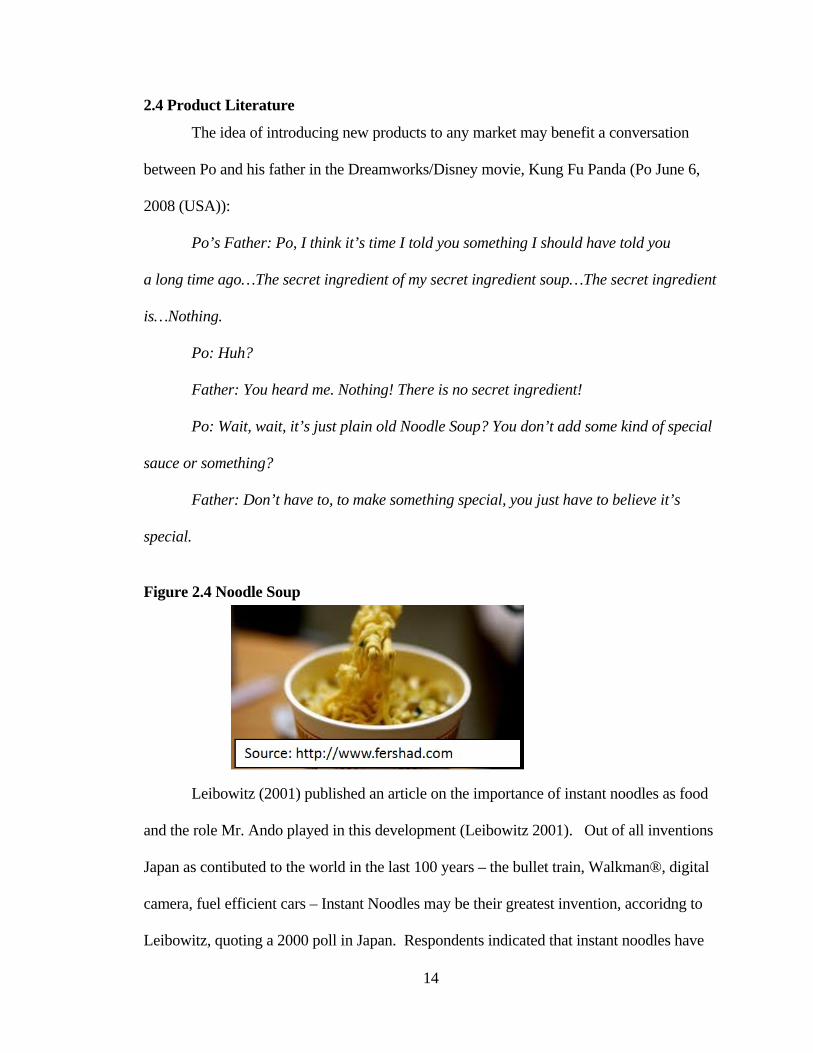
Figure 2.4 Noodle Soup
Leibowitz (2001) published an article on the importance of instant noodles as food
and the role Mr. Ando played in this development (Leibowitz 2001). Out of all inventions
Japan as contibuted to the world in the last 100 years – the bullet train, Walkman®, digital
camera, fuel efficient cars – Instant Noodles may be their greatest invention, accoridng to
Leibowitz, quoting a 2000 poll in Japan. Respondents indicated that instant noodles have
15
helped literally millions of people, especially during natural disasters and economic crises.
On August 16, 1945, the day the Allies were in charge finally and Mr Ando was
walking outside Osaka watching the damages and left overs of that war, he spotted a group
of people behind ruins near the city’s train station where an improvised ramen stall was in
the center of the scene handing people something to eat. Shortage of food went on for years
and spread over Japan after World War II, and Mr Ando reached the conclusion that that
hunger was the most tenacious concern at that time. He was a true believer that when all the
people have enough to eat, peace will come to the world.
After the war he became a bank president, but after this venture failed Ando was
jobless, so he embarked in the journey to end with his nation’s suffering. He argued that the
perfect food should be:
Tasty
Ready in less than 3 minutes
Nonperishable
Safe and healthy
Mr. Ando remembered the satisfaction of people when their hunger was solved
with a dish of noodles on the street, so he started working on that, targeting the workers of
a revamping nation. He spent almost a year with try and error, but could not nail the right
texture, until almost by accident, he threw some noodles in the oil his wife was using in
frying tempura for dinner. He discovered that frying not only dehydrated the noodles but
also created tiny perforations while the water was leaving the dough, that made them cook
faster. That flash drying process of almost instaneously evaporating the water led to the
most important food product of the century, and the number one food consumed in the
16
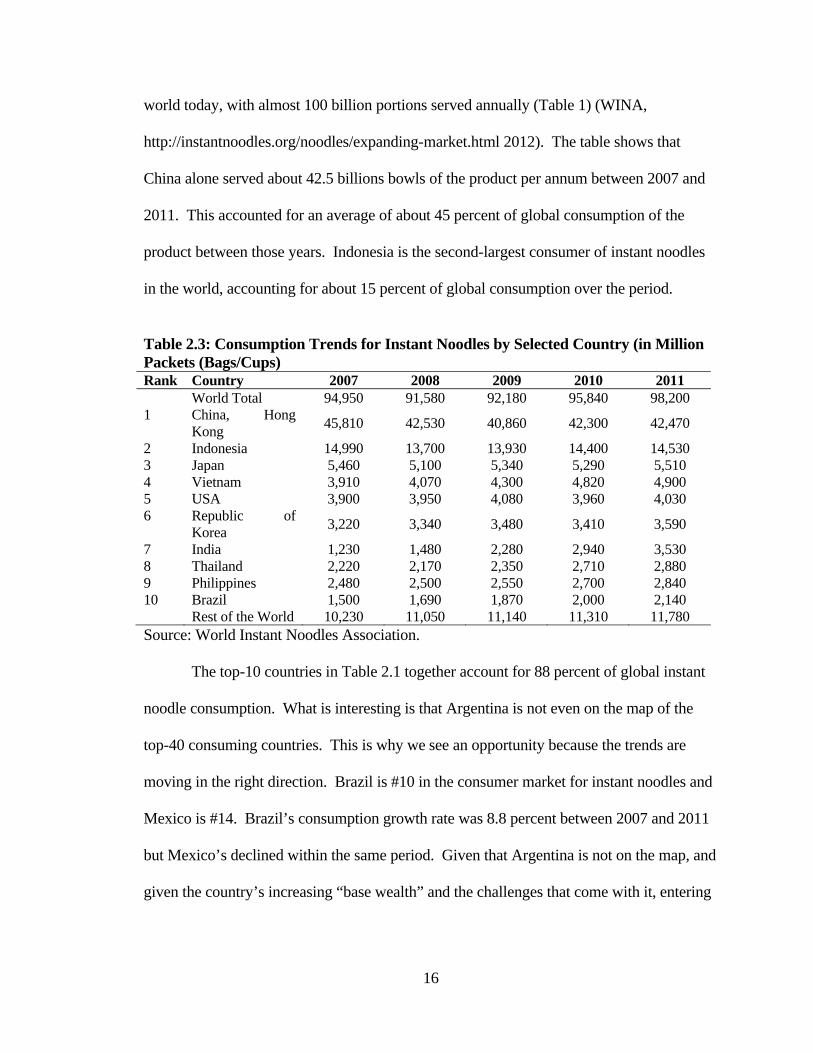
world today, with almost 100 billion portions served annually (Table 1) (WINA,
http://instantnoodles.org/noodles/expanding-market.html 2012). The table shows that
China alone served about 42.5 billions bowls of the product per annum between 2007 and
2011. This accounted for an average of about 45 percent of global consumption of the
product between those years. Indonesia is the second-largest consumer of instant noodles
in the world, accounting for about 15 percent of global consumption over the period.
Table 2.3: Consumption Trends for Instant Noodles by Selected Country (in Million Packets (Bags/Cups) Rank Country 2007 2008 2009 2010 2011 World Total 94,950 91,580 92,180 95,840 98,200 1 China, Hong
Kong 45,810 42,530 40,860 42,300 42,470
2 Indonesia 14,990 13,700 13,930 14,400 14,530 3 Japan 5,460 5,100 5,340 5,290 5,510 4 Vietnam 3,910 4,070 4,300 4,820 4,900 5 USA 3,900 3,950 4,080 3,960 4,030 6 Republic of
Korea 3,220 3,340 3,480 3,410 3,590
7 India 1,230 1,480 2,280 2,940 3,530 8 Thailand 2,220 2,170 2,350 2,710 2,880 9 Philippines 2,480 2,500 2,550 2,700 2,840 10 Brazil 1,500 1,690 1,870 2,000 2,140 Rest of the World 10,230 11,050 11,140 11,310 11,780 Source: World Instant Noodles Association.
The top-10 countries in Table 2.1 together account for 88 percent of global instant
noodle consumption. What is interesting is that Argentina is not even on the map of the
top-40 consuming countries. This is why we see an opportunity because the trends are
moving in the right direction. Brazil is #10 in the consumer market for instant noodles and
Mexico is #14. Brazil’s consumption growth rate was 8.8 percent between 2007 and 2011
but Mexico’s declined within the same period. Given that Argentina is not on the map, and
given the country’s increasing “base wealth” and the challenges that come with it, entering
17
the instant noodle market at this time could be very profitable. However, it has to be an
economically feasible venture.
When he was 48 years, Mr Ando sail on his third and final career: to become Mr.
Noodle. As the New York Times stated, he deserves an eternal place in the phanteon of
human achievement (2007) . His goal was to create a satisfying ramen, that could be eaten
anywhere, anytime. In 1958, Mr Ando created Chikin Ramen (Chiken Ramen (Nissin n.d.))
and when it hit the shelves, it was considered a luxury good, since it cost more than just
made soup at the local ramen store. With time, consumers picked up the novelty and pretty
soon 10 other competitors entered the market with similar products.
2.5 Migration to the West and the Rest of the World
As instant noodles became a staple food in Japan, Mr Ando focused on developing
new markets internationally. He visited the U.S. in 1966 and on that trip discovered the
idea of using styrofoam cups for the noodles instead of plastic cups (Nissin History n.d.).
He captured this idea when he observed coffee being served in styrofoam cups in a Los
Angeles supermarket. Transferring the continers from plastic to styrofoam took more than
five years, with the introduction of the new product containers in 1971. Mr. Ando also
developed Space Ram, made specially for Japanese astronaut Soichi Noguchi in the Space
Shuttle Discovery in 2005 (WINA, Development of ramen for space 2005).
When Momofuku Ando died in 2007, a baseball stadium full of mourners came and
said goodbye, including two previous prime ministers of Japan. His ramen creation has
become a amalgamating symbol of nourishment around the globe.
2.6 Convenience, time constraint, demographics and food technology
Instant noodles are this popular due an unbeatible statement: convenience (Sergell
2011). The remarkable pace of modern lifestyle, accelerating urbanization, migrations,

18
fueled by increased working time (if we account travelling to and from work), awarness of
healthier workouts and existency, people are seeking to do more with their free time they
have at hand, demanding more convenience food and ready-to-eat meals. Traditionally,
Argentinian women have not worked outside the home. However, that is changing rapidly,
leading to the the experience of the same time compressions that are being observed in
countries such the U.S. and Europe. These changed have affected the diet, making
products such as the instant noodle attractive in populations that a generation ago would
have considered it an impossible product.
The shift to ready-to-eat foods has increased as many households barely cooking
from primary ingredients. The importance of processed food and the food processor have
increased significantly in viturally all homes regardless of income (Ray 2007). But the
effect is even stronger in households with rising incomes. There is also a school of thought
that argues that people just do not know how to cook anymore (Pollan, 2013). Nutrition is
also becoming important as obesity and similar health challenges rear their heads in
people’s lives. So, food is increasingly taking on more than just a source of energy and
becoming a health product, a statement of status and a solution to time challenges. At the
same time, quick service because of the aforementioned time constraints is becoming
important for most consumers (GIA 2011). This phenomenom is not isolated to instant
noodles, but also to powdered soups, cooking pastes and purees, instant pasta and ready-to-
eat meals. (ET Bureau 2011).

19
CHAPTER III: METHODS
This chapter lays out the assumptions that are made to facilitate the feasibility
analysis. In doing this, it presents the data and tools that underlie the financial and
technical assessment of the feasibility of the project. The chapter also presents the
scenarios that are evaluated and the sensitivity variables that are considered.
3.1 Assumptions Underlying the Analyses
The assumptions are divided into three groups: (1) Market assumptions; (2)
Production assumptions; and (3) Organizational assumptions. These assumptions are now
itemized here to ensure that they are visible and can be subjected to challenges to make the
model better and help the robustness of the results that are obtained from the analyses.
3.1.1 Market Assumptions
The assumptions driving our understanding of the Argentinian market are presented
here to frame the ensuing analysis.
1. Although current demand is low, it is assumed that this is so because of low public
awareness about the product. Thus, it is assumed that once this awareness is build,
demand will grow rapidly. This is already being seen in small areas of the market
that are importing the product into the country.
2. The rising demand resulting from improved product awareness will lead to new
entrants into the market. It is assumed that most of these new entrants will be
importing the product from the U.S., China or Brazil. Given the public policy
environment that is doing everyhting to discourage imports, it is assumed that these
importers will have higher prices in the domestic market.
3. The integrated nature of our operations allows us to control commodity price
effects by transferring flour from the flour market into our value-added production
20
processes, giving us the opportunity to ride the changing cost environment facing
the industry.
4. Our knowledge of the flour-products supply chain provides us with a strong
advantage in entering some of the principal distribution channels downstream to
reach large consumer markets.
5. To succeed in our entry into the market with little entry costs, we intend to develop
a strategic alliance with major grocery retailers to manufacture private-labelled
products for them. Additionally, we will work with boarding schools, colleges and
universities to provide them with instant noodles for distribution in cafeterias and
dinning halls.
6. The Argentine palate is different from most palates. Therefore, seasonings will be
developed in house to give our products their unique Argentine flavor and taste.
This should help differenitate our products from imports and provide us with a
competitive advantage in the domestic markets. These flavors will be protected by
trade secret to avoid duplication by competitors.
7. There is also a large segment of Argentine population that have European roots,
specifically Spanish and Italian roots. For this “older” generation, specific flavors
of the “old country” will be developed to meet their unique needs. See Figure 3.1
for the immigration patterns in Argentina in the 19th and 20th Centuries.
8. The net profit margin is high enough to use price as retaliation for new entrants.
9. For fast market penetration, first main target will be university students due to their
budgetary constraints, and young professionals. This will create a benefitial critical
mass of new adopters.

21
10. The retail price in Brazil is $0.49 per pack of 80 grams. The retail price in
Argentina, for products imported from Brazil, is going for $1.18 per pack of 80
grams. Products imported from the U.S. are being retailed at $1.40 per pack of 80
grams. Assuming a retailer markup of 50 percent, this means that the product can
be wholesaled in Argentina for $0.59. Assuming a 25 percent ex warehouse
markup for wholesalers, the product can be sold by the company at $0.44 per 80
grams packet.
Figure 3.1: Immigration patterns of Europeans in the 19th and 20th Centuries
Source: http://en.wikipedia.org/wiki/Argentine_people.
11. The cost of flour, starch and other commodity ingredients account for about 15.5
percent of total cost per unit produced while the container, film and packaging
account for the remaining 84.5 percent. The total cost per unit is estimated at about
$0.151.
12. An extra 50 percent is built into this cost to provide a cushion for inflation and other
uncertainties.
22
3.1.2 Production Assumptions
1. The manufacturing process demand some specifically stated assumptions. These
are now described in this section.
2. The analysis evaluates two production capacity operations: (1) 60,000 thousand
packages per shift; and (2) 120,000 packages per shift. This is to allow us to
evaluate the advantages of economies of scale but also assess the challenges of
dealing with marketing a new product in the Argentinian market. The base
assumptions for the two production capacity operations are presented in Table 3.1.
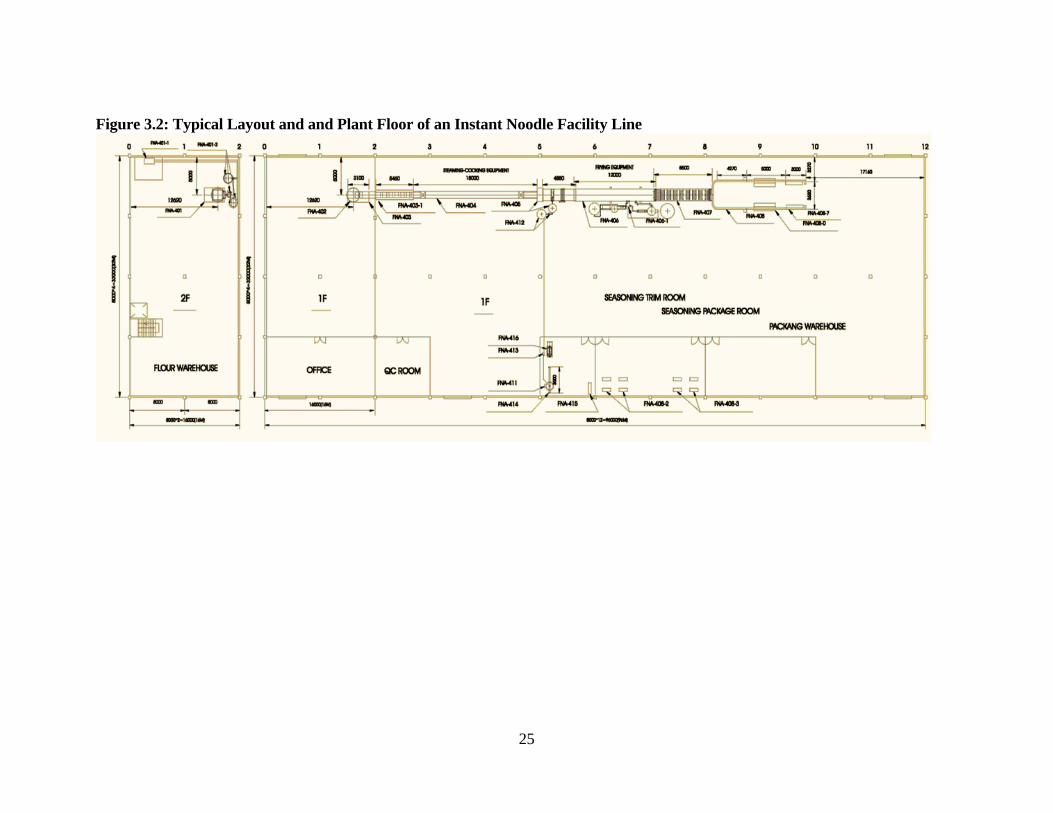
3. The manufacturing process (Figure 3.2) involves the mixing of flour and other dry
and wet ingredients to produce the dough in a specific texture and tensile quality;
followed by the the cutting of the dough, cooking, frying, cooling, seasoning and
packing.
4. The whole process for each batch is assumed to take no more than 30 minutes.
5. The average wage of production line employees is $900 per month plus 60 percent
fringe benefits. This is a total of $1,440/month.
6. The average salary for a plant manager is $1,500/month plus 60 percent fringe
benefits. The total for a plant manager is $2,400/month.
7. Office staff wages and benefits are assumed at $1,200/month.
8. Number of operating days per year is 300 days

23
Table 3.1: Production Requirements for the 60 and 120 Thousand Packets per Shift Production Capacity Equipment4
Production Plant Requirements L 80m × W 8m
(60,000 Packets/Shift)L 95m × W 12m
(120,000 Packets/Shift) Production Staff 3 people per shift 3 people per shift Packing Staff 2 People 4 People Hourly power consumption 68KW 85KW Hourly Water consumption 200 Liters 380 Liters Hourly fuel consumption: 0.105T 0.21T Boiler Capacity 1.5T 2T Production per batch (kg) 200 400 Installation machinery costs USD 529.400 USD 844.350
Administration Staff 3 People (1 manager and
2 support staff) 3 People (1 manager and 2
support staff) Land 1 ha 1 ha
9. Number of shifts will be as follows:
a. One shift per day: Year 1 and Year 2
b. Two shifts per day: Year 3 to Year 4
c. Three shifts per day: After Year 4
10. In the first phase of the project – from Year 1 to Year 10 – the product that will be
produced will be essentially fried-type noodles. The second phase will produce
both the fried-type and the steamed-type noodles. This assumes that the original
product would have succeeded and the market can be segmented to meet the needs
of health-conscious consumers.
11. The whole operation will have back-up electircity generator as well as a borehole to
ensure electricity and water interruptions do not adversely affect production.
12. All manufacturing equipment will be imported from China because they have the
desired operational quality and cost less than a third the price of similar machines
from Europe.
4 A shift is eight hours.
24
3.1.3 Organizational Assumptions
1. The plant will be managed by a general manager with expertise in the field of
making pasta. To ensure this managers effectiveness in producing excellent
products, he would also be required to understand the instant noodle manufacturing
process. If we find a “good” person who does not have this knowledge, we will
train by sending him/her to China to a supplier’s plant to learn the process.
2. A plant supervisor with stationary engineering skills will be hired to ensure the
smooth operations in the whole plant. A plant manager with similar background
will be preferred.
3. The primary marketing effort will be working directly with major retailers, such as
Wal-Mart, Carrefour and the Coto Group, to not only develop the company’s
products but also for us to develop strategic alliances with them to produce their
own private-labeled products for them to carry in their stores. The Coto Group is a
locally-owned company that enjoys a 17 percent market share across the country.
However, in areas such as Buenos Aires, its market share is estimated to be around
28 percent. It has 95 supermarkets, 16 hypermarkets and five shopping malls. A
secured relationship with this organization can make our entry into the market a lot
easier and fluid.
4. The company will be governed by an independent board of directors with
experience in the distribution of food products and consumer packaged goods. We
will search for and recruit retail executives and similarly skilled people to help us
succeed.
25
Figure 3.2: Typical Layout and and Plant Floor of an Instant Noodle Facility Line

26
3.2 Scenario and Sensitivity Analysis
The base scenario evaluates the feasibility under conditions of 60,000 packet per
shift production line. This is structured on the confidence that the total output from this
production can be sold in Argentina easily. With this production, the annual consumption
per capita, assuming our production is distributed evenly across the whole country, will be
less than 0.5 cup in the first two years and less than 1.3 cups by Year 20. This compares
with China’s current conumption per capita of about 33 cups per year. Even if 20 percent
of the total Argentine population consumes our product, the maximum per capita
consumption by this group will be less than seven cups per annum. Thus, the production
level under the Base Scenario is not outrageously optimistic. If anything, it is very
conservative.
Scenario 1 assumes that growth is slower than expected under the Base Scenario.
Hence, instead of two years of one shift and two years of two shifts, we had three years of
one shift and two shifts each. This meant that instead of the third shift being implemented
in the fifth year, it started in the seventh year. This implied that annual average production
volumes were lower in Scenario 1 than in the Base Scenario.
Scenario 2 evaluated a more optimistic environment, where demand increased
much more rapidly and resulted in the need to increase production to a second line. In
anticipation of this scenario, the 120,000 packet per shift line is installed. However, the
production strategy for this is organized differently. The first seven years involves the
production of the fried-type product to help with market entry and development of
awareness across the country. Thereafter, the company introduces a higher valued
steamed-type product that is aimed at a smaller segment of the consuming market.
The sensitivty analyses are performed on two variables:
27
1. Product price. This is determined on the basis of wholesale mark-up even though
the plan calls for selling the product directly to retailers without using any
intermediaries. This is originally set at 25 percent of production cost. The
sensitivty analysis evaluates its impact on NPV and IRR for rates ranging from 10
percent to 40 percent with 5 percent increments.
2. The number of batches produced per shift depends on machines working as
expected. Sometimes, these machines break down and so average batches
produced per annum would be lower than estimated. The sensitivty of economic
feasibilty to batches produced per shift is evaluated as deviations from its base rate
of 22 from 10 batches per shift to the maximum of 22 at two batch intervals.
28
CHAPTER IV: RESULTS
The results from the analyses are presented in this chapter. They are presented as
follows. First, the base results are presented. These encompass the technical and economic
feasibility analyses. The second part presents the results of the different scenarios and
conducts the sensitivity analyses on these results.
4.1 Base Scenario Results
The base scenario involved the development of a 60,000 packet per shift operation.
Based on all the assumptions in Chapter 3, it was determined that there are equipment
manufacturers in China who are willing to supply this line and help set up everything. The
cost of the line is $295,000 and there is a 60 percent import duty, tariffs, shipping. The line
itself includes the mixing line, preparation, cooking, frying, cooling and packaging
equipment. There is also installation cost assumed at 20 percent of base cost and land and
building which are assumed to cost $450,000. The total capital cost is approximately
$981,000 for this 60,000 packet line. It is assumed that the project is financed by debt at 15
percent interest rate and it borrows $2 million which is repaid over six years. It is further
assumed that there is a moratorium on principal payment in the first two years and the loan
repayments are ballooned in the last four years.
Total production based on the 22 batches per shift and 300 days of annual operation
and the assumptions underlying the number of shifts is presented in Figure 4.1. The figure
shows that output increases from 17.84 million cups/packets in the first year of full
operation to 53.52 million packets/cups by the 20th year. The number of shifts is one in the
first two years, two in the next two years and three shifts for the rest of time. This is
technically feasible in that the plant is able to produce the product in the quality that is
desired and expected and produce it in quantities that are expected.

29
Figure 4.1: Total Annual Output, Revenue and Cost of Goods in Million Packets or Cups and Million Dollars
Recall that the selling price per unit is assumed to be $0.283 per packet or cup of
100 grams. Figure 4.1 also presents the revenue and cost of goods stream over the next 20
years. It is realized that based on the assumptions about prices and costs, the revenue
stream lies above the cost of good stream, throughout the 20 years. This implies that the
gross margin from this production activity is positive throughout the whole period. It is in
fact about $1.08 million in the first year and increases to about $3.03 million by the 20th
year.
The selling and general administrative costs encompass the following:
1. Marketing & Sales: These are assumed at 3 percent of total revenue in the first five
years and 0.5 percent of total revenues thereafter. This is because it is assumed that
by the fifth year, the product will have strong consumer awareness and would not
need high levels of marketing costs to push through the marketing chain.
0.0
10.0
20.0
30.0
40.0
50.0
60.0
Tot
al O
utp
ut
(Pac
ket
s/C
ups
per
Yea
r)
Production Year
Output Revenue Cost of Goods

30
2. Insurance: This is a function of the total cost of equipment and building and was
estimated at 2 percent of these costs.
3. Payroll Expense: Based on the assumptions presented in Chapter 3, total payroll
cost in the first year is $100,895 and it is assumed to grow at 2 percent per annum
real rate.5
4. Professional Fees: These are fees to support such services as legal, accounting and
intermediaries to help move product to their destination or facilitate imports when
needed. They are assumed to be a base rate of $10,000.
5. Repairs/Maintenance: To ensure machines and equipment are operating at their
best, the industry standard repairs and maintenance rate of 10 percent of initial cost
is recognized.
6. Office Supplies & Other: These are miscellaneous supplies – paper, printer toners,
telephone, internet service supply, etc. A $1,000 per month allocation is provided
for this.
7. Travel: A $20,000 per year allocation is made for traveling to meet customers and
potential suppliers of inputs.
The distribution of these selling and general expenses is presented in Figure 4.2.
The figure shows that marketing and sales account for the largest share of selling, general
and administrative expenses. Payroll and repairs and maintenance are second in and third
respectively. Close to a third of these expenses are allocated to marketing and sales while
more than a quarter is allocated to payroll.
5 All growth rates in this analysis are real rates. The expectation is that nominal rate increases resulting from inflation will be translated into all prices and costs.

31
Figure 4.2: Distribution of Selling and General Expenses for Year 1 of Operation
The net earnings from operations prior to interest, depreciation and taxes
(EBITDA) along with the cost of goods, and net profit are presented in Table 4.1. It shows
that first year EBITDA is $501,492 and increases to about $1.7 million by Year 20. This
includes a 30 percent contingency based on the total selling, general and administrative
expenses. The project contributes about $600,000 in taxes by the end of the 20th year
posting a net earnings of about $1.11 million by that time.
Using this net earnings and a discount rate of 25 percent, the net present value from
the investment is estimated at $120,069. This is positive and, thus, by the NPV decision
rule, the project is feasible. The IRR is 26 percent under the foregoing conditions. Since it
covers the hurdle rate of the company, it was concluded that the investment is financially
feasible. However, the closeness of the IRR to the discount rate suggests a careful
assessment of the critical bottlenecks of the project. These have been identified as
Marketing & Sales32%
Insurance5%
Payroll Expense26%
Professional Fees3%
Repairs/Maint.25%
Office Supplies & Other3%
Travel6%
32
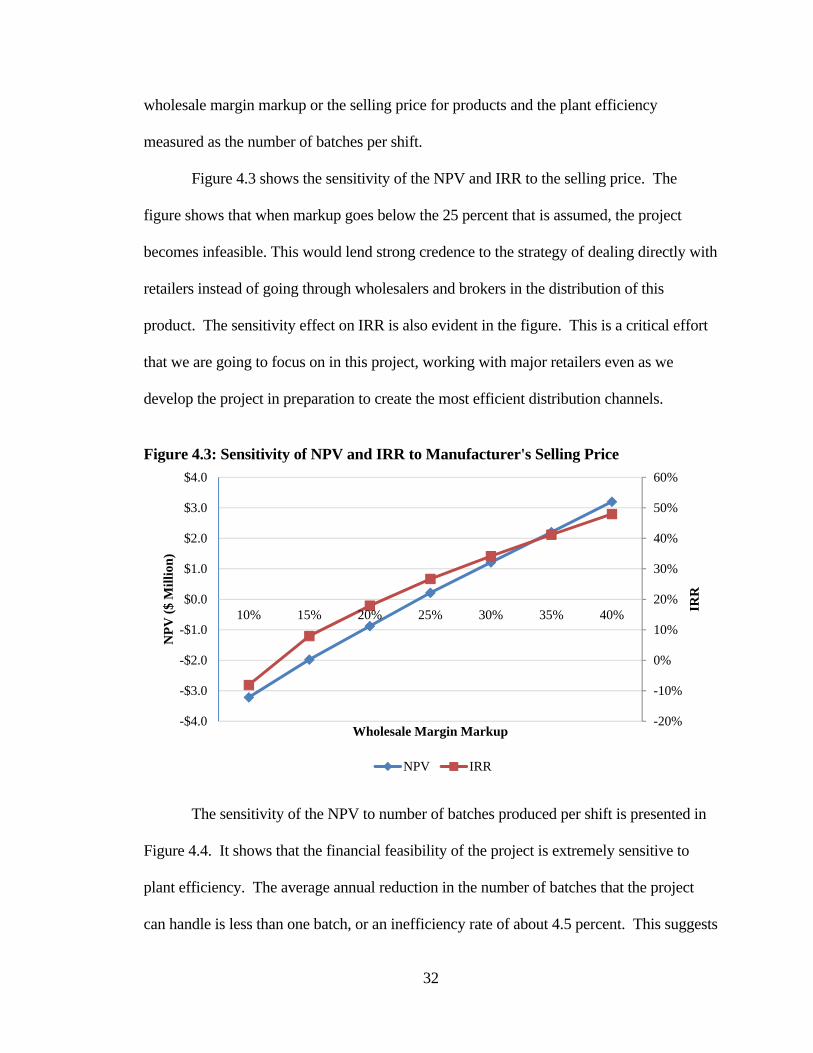
wholesale margin markup or the selling price for products and the plant efficiency
measured as the number of batches per shift.
Figure 4.3 shows the sensitivity of the NPV and IRR to the selling price. The
figure shows that when markup goes below the 25 percent that is assumed, the project
becomes infeasible. This would lend strong credence to the strategy of dealing directly with
retailers instead of going through wholesalers and brokers in the distribution of this
product. The sensitivity effect on IRR is also evident in the figure. This is a critical effort
that we are going to focus on in this project, working with major retailers even as we
develop the project in preparation to create the most efficient distribution channels.
Figure 4.3: Sensitivity of NPV and IRR to Manufacturer's Selling Price
The sensitivity of the NPV to number of batches produced per shift is presented in
Figure 4.4. It shows that the financial feasibility of the project is extremely sensitive to
plant efficiency. The average annual reduction in the number of batches that the project
can handle is less than one batch, or an inefficiency rate of about 4.5 percent. This suggests
-20%
-10%
0%
10%
20%
30%
40%
50%
60%
-$4.0
-$3.0
-$2.0
-$1.0
$0.0
$1.0
$2.0
$3.0
$4.0
10% 15% 20% 25% 30% 35% 40%
IRR
NP
V (
$ M
illi
on)
Wholesale Margin Markup
NPV IRR

33
that managers must focus intently on keeping all equipment in great shape and working the
whole operations as efficiently as the estimated capacity that is used in the base
assumption, which is about 90 percent of total line capacity.
Figure 4.4: Sensitivity of NPV to Number of Batches
-$2.5
-$2.0
-$1.5
-$1.0
-$0.5
$0.0
$0.5
10 12 14 16 18 20 22
NP
V (
in $
Mil
lion
Number of Batches/Shift

34
Table 4.1: Summary Financial Statement of the Investment ($Million) 0 1 2 3 4 5 6 7 8 9 10 11 12 13 14 15 16 17 18 19 20
Revenue 5.04 5.04
10.09
10.09
15.13
15.13
15.13
15.13
15.13
15.13
15.13
15.13
15.13
15.13
15.13
15.13
15.13
15.13
15.13
15.13
Cost of
Goods 4.04 4.04 8.07 8.07
12.11
12.11
12.11
12.11
12.11
12.11
12.11
12.11
12.11
12.11
12.11
12.11
12.11
12.11
12.11
12.11
Gross
Margin 1.01 1.01 2.02 2.02 3.03 3.03 3.03 3.03 3.03 3.03 3.03 3.03 3.03 3.03 3.03 3.03 3.03 3.03 3.03 3.03
Contingency 0.12 0.12 0.19 0.19 0.26 0.27 0.27 0.27 0.27 0.28 0.28 0.28 0.29 0.29 0.29 0.29 0.30 0.30 0.30 0.31
Total 0.51 0.51 0.82 0.83 1.14 1.16 1.17 1.18 1.19 1.20 1.21 1.22 1.24 1.25 1.26 1.27 1.29 1.30 1.31 1.33
EBITDA 0.50 0.50 1.20 1.19 1.88 1.87 1.86 1.85 1.84 1.83 1.82 1.80 1.79 1.78 1.77 1.75 1.74 1.73 1.71 1.70
Total
(0.00)
(0.01) 0.69 0.75 1.51 1.58 1.66 1.65 1.64 1.63 1.82 1.80 1.79 1.78 1.77 1.75 1.74 1.73 1.71 1.70
Tax - - 0.24 0.26 0.53 0.55 0.58 0.58 0.57 0.57 0.64 0.63 0.63 0.62 0.62 0.61 0.61 0.60 0.60 0.60
Net
Earnings -2.0
(0.00)
(0.01) 0.45 0.49 0.98 1.03 1.08 1.07 1.06 1.06 1.18 1.17 1.16 1.16 1.15 1.14 1.13 1.12 1.11 1.11
35
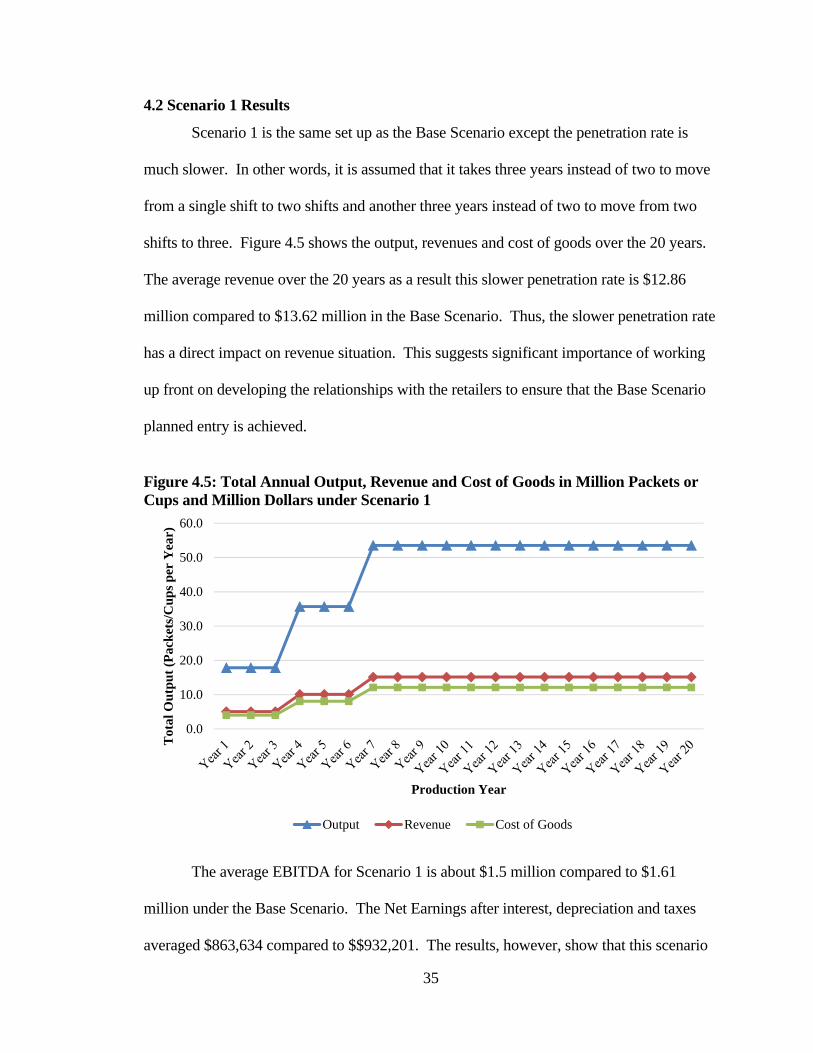
4.2 Scenario 1 Results
Scenario 1 is the same set up as the Base Scenario except the penetration rate is
much slower. In other words, it is assumed that it takes three years instead of two to move
from a single shift to two shifts and another three years instead of two to move from two
shifts to three. Figure 4.5 shows the output, revenues and cost of goods over the 20 years.
The average revenue over the 20 years as a result this slower penetration rate is $12.86
million compared to $13.62 million in the Base Scenario. Thus, the slower penetration rate
has a direct impact on revenue situation. This suggests significant importance of working
up front on developing the relationships with the retailers to ensure that the Base Scenario
planned entry is achieved.
Figure 4.5: Total Annual Output, Revenue and Cost of Goods in Million Packets or Cups and Million Dollars under Scenario 1
The average EBITDA for Scenario 1 is about $1.5 million compared to $1.61
million under the Base Scenario. The Net Earnings after interest, depreciation and taxes
averaged $863,634 compared to $$932,201. The results, however, show that this scenario
0.0
10.0
20.0
30.0
40.0
50.0
60.0
Tot
al O
utp
ut
(Pac
ket
s/C
ups
per
Yea
r)
Production Year
Output Revenue Cost of Goods
36
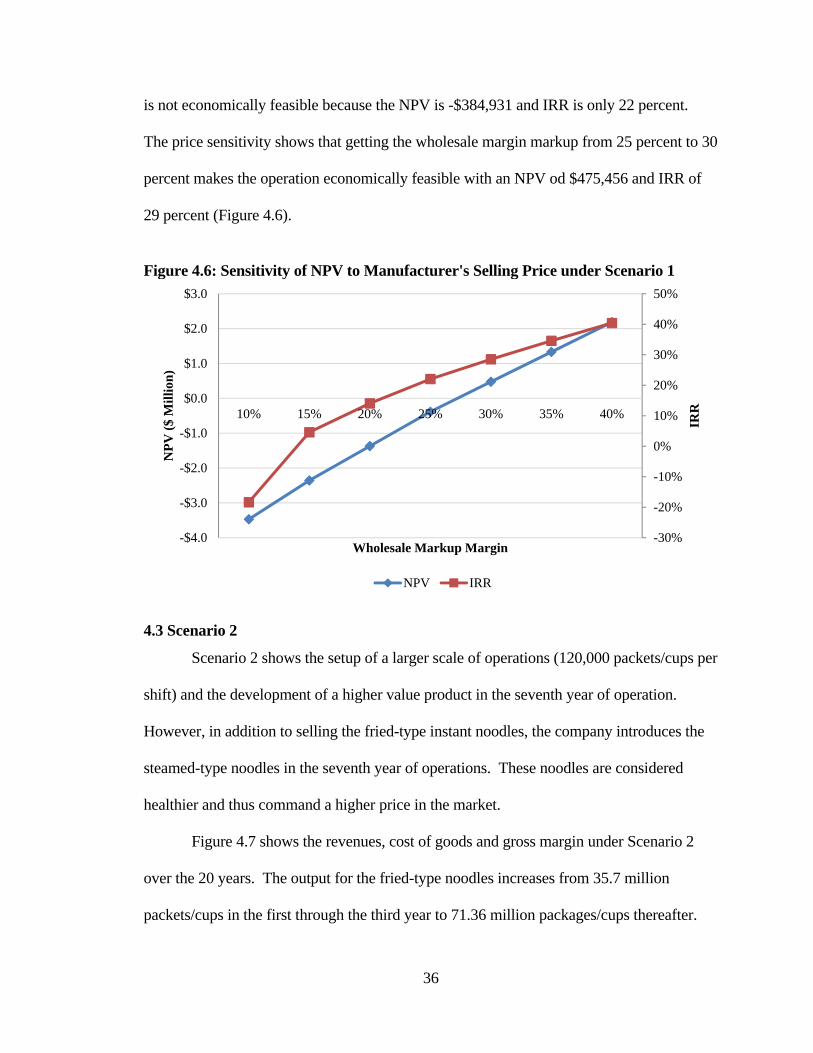
is not economically feasible because the NPV is -$384,931 and IRR is only 22 percent.
The price sensitivity shows that getting the wholesale margin markup from 25 percent to 30
percent makes the operation economically feasible with an NPV od $475,456 and IRR of
29 percent (Figure 4.6).
Figure 4.6: Sensitivity of NPV to Manufacturer's Selling Price under Scenario 1
4.3 Scenario 2
Scenario 2 shows the setup of a larger scale of operations (120,000 packets/cups per
shift) and the development of a higher value product in the seventh year of operation.
However, in addition to selling the fried-type instant noodles, the company introduces the
steamed-type noodles in the seventh year of operations. These noodles are considered
healthier and thus command a higher price in the market.
Figure 4.7 shows the revenues, cost of goods and gross margin under Scenario 2
over the 20 years. The output for the fried-type noodles increases from 35.7 million
packets/cups in the first through the third year to 71.36 million packages/cups thereafter.
-30%
-20%
-10%
0%
10%
20%
30%
40%
50%
-$4.0
-$3.0
-$2.0
-$1.0
$0.0
$1.0
$2.0
$3.0
10% 15% 20% 25% 30% 35% 40%
IRR
NP
V (
$ M
illi
on)
Wholesale Markup Margin
NPV IRR
37
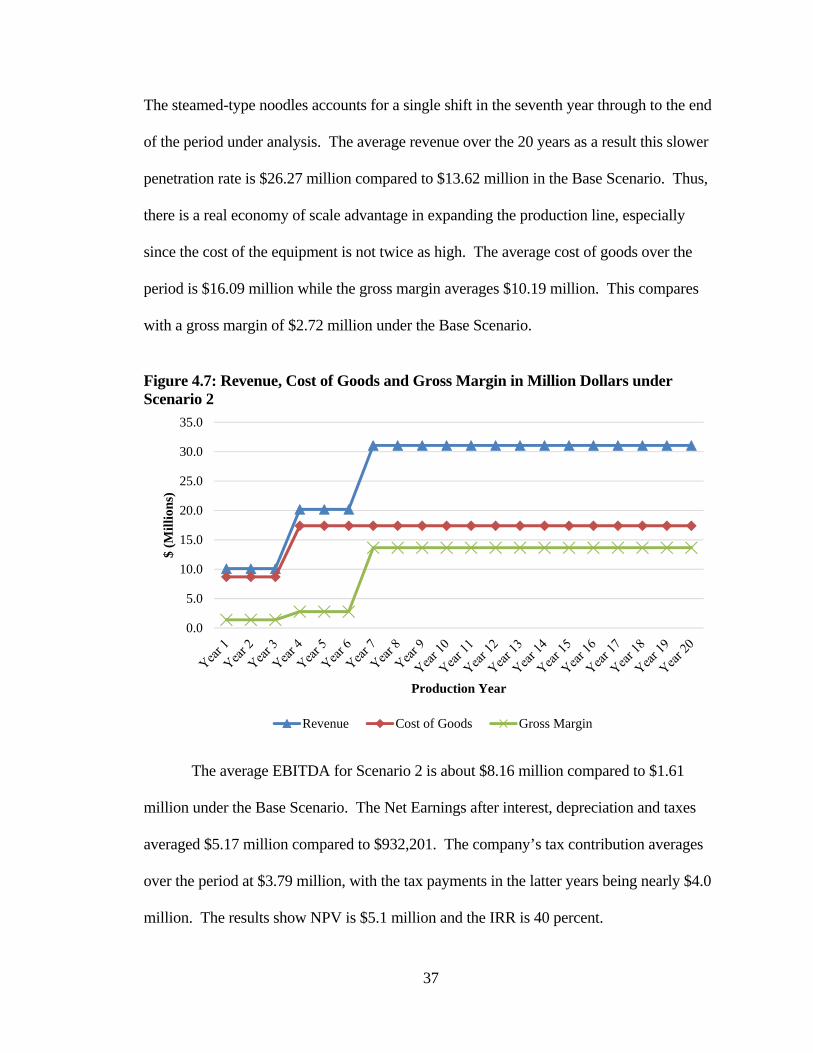
The steamed-type noodles accounts for a single shift in the seventh year through to the end
of the period under analysis. The average revenue over the 20 years as a result this slower
penetration rate is $26.27 million compared to $13.62 million in the Base Scenario. Thus,
there is a real economy of scale advantage in expanding the production line, especially
since the cost of the equipment is not twice as high. The average cost of goods over the
period is $16.09 million while the gross margin averages $10.19 million. This compares
with a gross margin of $2.72 million under the Base Scenario.
Figure 4.7: Revenue, Cost of Goods and Gross Margin in Million Dollars under Scenario 2
The average EBITDA for Scenario 2 is about $8.16 million compared to $1.61
million under the Base Scenario. The Net Earnings after interest, depreciation and taxes
averaged $5.17 million compared to $932,201. The company’s tax contribution averages
over the period at $3.79 million, with the tax payments in the latter years being nearly $4.0
million. The results show NPV is $5.1 million and the IRR is 40 percent.
0.0
5.0
10.0
15.0
20.0
25.0
30.0
35.0
$ (M
illi
ons)
Production Year
Revenue Cost of Goods Gross Margin
38
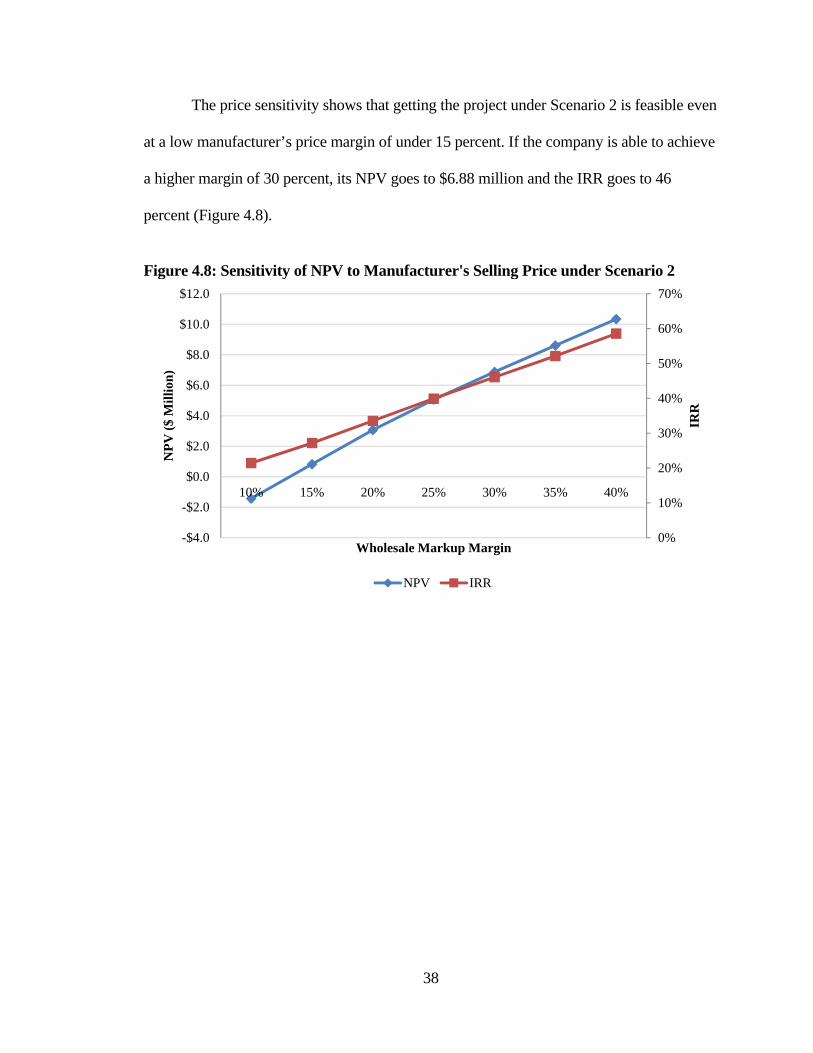
The price sensitivity shows that getting the project under Scenario 2 is feasible even
at a low manufacturer’s price margin of under 15 percent. If the company is able to achieve
a higher margin of 30 percent, its NPV goes to $6.88 million and the IRR goes to 46
percent (Figure 4.8).
Figure 4.8: Sensitivity of NPV to Manufacturer's Selling Price under Scenario 2
0%
10%
20%
30%
40%
50%
60%
70%
-$4.0
-$2.0
$0.0
$2.0
$4.0
$6.0
$8.0
$10.0
$12.0
10% 15% 20% 25% 30% 35% 40%
IRR
NP
V (
$ M
illi
on)
Wholesale Markup Margin
NPV IRR
39
CHAPTER V: CONCLUSION
This research was motivated by recognition of an opportunity in the instant noodle
market and the changes that are going on in the macroeconomic environment in Argentina.
Incomes of Argentinians are increasing and they are experiencing the time compression
challenges that confront all societies that experience income growth. However, the threat
of rapid inflation is causing the government to institute certain policies that offer
opportunities to consider businesses that address the needs of the domestic consumer. For
example, the government is imposing relatively large taxes on imports of consumer-ready
products and raw material exports, such as wheat. As a wheat producing and flour milling
family business, this presented an opportunity to integrate forward into the consumer-ready
market and instant noodles offer an opportunity to make this transition smoothly.
The factors supporting the opportunity are reflected by the increasing consumption
of the instant noodle product that is being imported from Brazil and elsewhere after
applying those high tariffs and people are still buying. The argument we made is this: If
people are buying this imported product at such high prices, then if it can be produced in
the domestic market at very competitive prices, it will be very successful venture. But how
do we know that it will pay to this project?
This is the primary rational for this project – to address the question of is this
economically feasible project to invest in. The project also sought to identify the
conditions under which such an investment will be insulated from some of the vagaries of
the Argentinian market and provide very robust outcomes. The conditions of robustness
are two variables: product selling price to wholesalers (even though the strategy is to sell
directly to retailers); and the level of utilization of the productive capacity of the plant to
ensure good performance. To this end, the economic feasibility analyses were conducted

40
under two principal scenarios in addition to the base scenario. The base scenario may be
described as the most like scenario. Scenario I is described as the most pessimistic scenario
where sales are assumed to not take off as fast as envisaged under the base scenario.
Scenario II is the optimistic scenario because it explored the effect of economies of scale
and the opportunity to sell high volumes of the product to retailers in Argentina. It also
explored the opportunity to sell a higher value product at a higher price into a special
market segment that is seeking high consciousness.
The results indicated that at 25 percent discount rate, the Base Scenario was
feasible, returning a net present value of about $120,000 and an internal rate of return of 26
percent. Given that the hurdle of 15 percent, this provides an ample return for risk. It is
also important to note that all cost and revenue analyses have been conducted in the more
stable U.S. dollar because regardless of how bad the Argentinian economy gets, prices will
always be translated into the U.S. dollar from the local pesos.
Scenario I is not economically feasible, with an NPV of -$384,931 and IRR of 22
percent. Although the hurdle rate was exceeded, the negative NPV suggests that this
condition is very unfavorable to be pursued. This suggested that growing at the rate
envisaged under the Base Scenario is critical for success. Scenario I assumed that the
processing plant will produce at one-third its capacity for one more year than under the
Base Scenario and at two-thirds its capacity for one more year. Thus, it does not reach full
capacity until the seventh year after initial production compared to the fifth year under the
Base Scenario. While these two scenarios used a plant producing 60,000 packets or cups
per shift, Scenario II was assumed to produce 120,000 packets or cups per shift. This
scenario was found to be economically feasible even when the production run at one-third
41
and two-thirds the plant’s capacity for three years respectively. In the seventh year, when
the plant is at full capacity utilization of three shifts per day, the plant dedicated one shift to
the production of higher value steam-dried instant noodle. The results showed an NPV of
$5.1 million and an IRR is 40 percent. This scenario was also more robust to price and
operational capacity challenges. This showed that it makes more economic sense to
consider operating the larger plant.
Therefore, this is the recommendation to my family: build a 120,000 packet or cup
instant noodle facility in Argentina. To ensure a product pull strategy, we will begin
working on our networks in the retail industry to manufacture the product for them as a
private label product so that we will get the marketing and sales support without making
direct investments in them. Additionally, we plan to work with other channels – hotels,
schools and other institutions, such as hospitals and the military – to drive up sales of the
company’s own branded product. This avoids competition with the primary clients even as
it pushes more products rapidly into the market.
Having determined a robust feasible technical and economic solution, the next step
will be to develop a detailed business plan to provide a road map to the implementation of
an instant noodle production and marketing business in Argentina. This plan will clearly
lay out the organizational structure that we need to put in place to ensure the appropriate
governance system is implemented and the organizational format to ensure the business is
managed properly. The business plan will also define the structure of the financing of the
project so that equity and debt holders are adequately compensated for the risks they
assume in participating in the business. Finally, the business plan will allow for a clear

42
definition of a broader production and marketing plan to ensure that growth is accelerated
and returns are maximized.
43
REFERENCES
Abel, A. and B. Bernanke. 2005. Macroeconomics 5th ed. Pearson.
AFP RELAXNEWS. 2012. http://www.nydailynews.com. May 23. http://www.nydailynews.com/life-style/eats/china-eats-noodles-article-1.1083364.
Massachusetts Institute of Technology. Inventor of the Week Archive. Momofuku Ando. Available at http://web.mit.edu/invent/iow/ando.html.
Nissin Company. Annual Report, 2012. Available at http://www.nissinfoods-holdings.co.jp/english/ir/library/annual/pdf/anr_1203_01.pdf.
Pao de Acucar. Massas e Molhos. Available at http://www.paodeacucar.com.br/busca/nissin/F_C303.
Center for Applied Research. “What is Strategic Thinking?” Briefing Notes. 2001.
Valdes, C., Lopes, I.V. and M. de Rezende Lopes. “Brazil’s Changing Food Demand Challenges the Farm Sector. Choices Magazine. Available at http://www.choicesmagazine.org/magazine/article.php?article=79.
Baker, H.K. and P. English (eds). 2011. Capital Budgeting Valuation: Financial Analysis for Today's Investment Projects. Wiley.
ET Bureau. 2011. http://articles.economictimes.indiatimes.com/2011-03-16/news/28698081_1_instant-noodles-market-cg-foods-wai-wai/2.
Global Industry Analysts, Inc. 2012. Instant Noodles: A Global Strategic Report. March 2012.
Leibowitz, K.. 2001. "Mission St. Food." Lucky Peach (McSweeney's).
Nelson, C.R. 1976. “Inflation and Capital Budgeting,” Journal of Finance: 31(3): 923-931.
Nissin Company. Company History. n.d. Available at http://www.nissinfoods-holdings.co.jp/english/about/history/index.html.
Nissin. n.d. http://www.nissinfoods.com/about.php.
Nomura. 2012. http://www.scribd.com/doc/89541031/Nomura-Global-Economic-Outlook-Monthly-9-4-12-GEOM-04-2012. April 4.
June 6, 2008 (USA). Kung Fu Panda. Directed by Mark Osborne John Wayne Stevenson. Performed by Tigress, Msater Shifu, Characters from famous actors Po.
Ray, S.. 2007. 2012. “A Study of Consumer Acceptability for
44
Noodles in Siliguri Market,” ABHINAV, 1(9): 57-70. Available at http://www.abhinavjournal.com/images/Commerce_&_Management/Sep12/7.pdf.
Reuters. 2013. http://www.buenosairesherald.com/article/124899/sizzling-prices-heat-up-wage-talks-in-argentina. February 24.
Sergell. 2011. Slurping The Healthy Way (Tale of the Instant Noodles). http://iamsergell.hubpages.com/hub/Slurping-The-Healthy-Way-Tale-of-the-Instant-Noodles.
World Instant Noodle Association (WINA). 2005. Development of Ramen for Space. Availanble at http://instantnoodles.org/noodles/history.html.