feasibility investigation of direct laser cutting process of
TRANSCRIPT
Page 1 of 31
Feasibility Investigation of Direct Laser Cutting Process of
Metal Foam with High Pore Density
Yangxu Liu 1, Wei Zhou 1*, Xuyang Chu 1, Shaoyu Liu 1, Kwan San Hui 2
1 Department of Mechanical & Electrical Engineering, Xiamen University, Xiamen 361005, China
2 School of Mathematics, University of East Anglia, Norwich, NR4 7TJ, United Kingdom
Abstract:To avoid damage to the pore structure of metal foam, a laser cutting process
for efficiently and directly cutting metal foam into regular shapes is proposed. After
analyzing the proposed laser cutting process, its effects when applied to three different
types of metal material (copper, ferroalloy, and nickel) and two levels of pore density,
namely 90 and 110 pores per inch (PPI), were investigated. The results show that
metal foam with a good surface quality can be obtained without damaging the pore
structure by using the proposed laser cutting process. Of the three metal types
considered, the highest material removal rate (MRR) and material oxidation rate
(MOR) were observed for ferroalloy foam. Of the two pore densities, metal foam of
90 PPI showed a larger material removal rate than metal foam of 110 PPI. The MRR
and MOR increased with an increase in the laser output power and decrease in the
scanning speed. Using a central composite experimental design method, optimized
processing parameters of 26 W laser output power and 475 mm/s scanning speed were
adopted to cut the metal foam with a high pore density.
Keywords: Metal foam; Laser cutting; Material removal rate; Material oxidation rate
*Corresponding author. Tel.: 86-592-2188698; Fax: 86-592-2186383
E-mail address: [email protected] (Wei Zhou).

Page 2 of 31
1 Introduction
During the last three decades, different types of metal foam with a high pore
density and three-dimensional pore structure have been developed using different
manufacturing methods. The many outstanding properties of metal foam, such as its
low density, high gas permeability, high specific surface area, good energy absorption
characteristics, and high thermal conductivity, make it an attractive material for use in
various industrial applications. Some types of metal foam, including copper foam,
ferroalloy foam, nickel foam, and aluminum foam, are fabricated at a large scale with
different characteristics. For example, copper foam has high thermal conductivity,
which can be used as a thermally conductive material [1]. Ferroalloy foam has a high
impact resistance and good energy absorbing characteristics, and has been used in the
transportation industry as a damping material [2]. Nickel foam has good
electromagnetic shielding properties, and has been used as an electromagnetic
shielding material [3]. These metal foam types are considered preferred materials for
catalyst supports because their highly specific surface area provides more
opportunities for contact with gas or liquids as catalysts in a microreactor.
Microreactors with metal foam as a catalyst support have also been studied, such as in
the steam reforming of methanol [4], mass-transfer characterization, and catalyst
loading method [5, 6]. In addition, metal foam can be used as a type of bio-material,
and its various 3D porous surfaces or structures that are able to be created can
enhance the biological fixation on orthopedic implants [7].
Based on the pore structure, metal foam can be divided into two types:
Page 3 of 31
closed-cell [8] and open-cell [9] types. For closed-cell metal foam, the pores are not
connected to each other. However, each pore is connected with each other in open-cell
metal foam. The typical porosity of metal foam with an open cell ranges from 80% to
90%. Furthermore, the cell size of metal foam is commonly given in pores per linear
inch (PPI), which are typically used to characterize the porosity [10]. Metal foam
have been developed using different manufacturing methods, the most common of
which is a foaming method [11]. Other fabrication methods of metal foam are also
used, including the metallurgy process [12, 13], deposition [14], and permeation [15].
A large number of studies have been conducted on the development and establishment
of fabrication processes to produce metal foam at low cost. However, owing to its
wide range of applications, extensive requirements for metal foam with a regular
shape and accurate size are necessary. The greatest challenge to generating metal
foam is the follow-up process used to control the cell structure. A traditional cutting
method can cause a pore collapse, plastic deformation, and/or interface stripping,
which limit a high degree of freedom in the engineering design and prospective
application of the metal foam [16].
Recently, there have been a few studies focusing on electrical discharge
machining (EDM) for the cutting of metal foam. For example, Scott et al. [17] used
EDM to cut both Fe-Cr-Al alloy foam and 316 stainless steel foam, and investigated
the effects of the feeding speed and spark on-time ratio on the material removal rate
(MRR). Their results show that the MRR is positively correlated with the feed speed
and discharge duration, and is inversely related to the discharge cycle. Alexander et al.

Page 4 of 31
[18] investigated the influence of the mesostructured parameters of aluminum foam
on the EDM process. The results show that very fast feed speeds can be achieved
through good flushing conditions and a low relative density of the material. Extensive
experiments using EDM were conducted on solid stainless steel and porous stainless
steel with different pore sizes [19]. MRR and the tool wear ratio were used to evaluate
the machining performance of micro EDM. The relationship between the pore size
and machining performance of EDM was revealed experimentally and through a
numerical analysis. In summary, we found that EDM can effectively cut metal foam
without causing a collapse or fracture of the pore structure, and can reduce the surface
roughness by adjusting the processing parameters. However, the cutting speed of
EDM is relatively slow and the cost is quite high. Moreover, a cooling liquid should
be added for the machining process of EDM, in which the pores are easily blocked
with residual impurities, which are difficult to clean.
From the above research results, we can see that a new cutting technology for
metal foam urgently needs to be developed to meet the demands of different
applications. In this study, a new direct laser cutting technology is proposed to rapidly
cut metal foam of different materials and PPI. The direct laser cutting mechanism for
metal foam is analyzed, and the effects of the laser processing parameters such as the
laser output power and scanning speed on the MRR and the material oxidation rate
(MOR), are further discussed. Finally, a central composite design (CCD) experiment
conducted to optimize the laser processing parameters is described.

Page 5 of 31
2 Experimental Methods and Devices
Two levels of experiments were conducted to study the direct laser cutting
process of metal foam: a single factor experiment and an experiment based on the
CCD method. The influences of the laser output power and scanning speed on the
MRR and MOR were investigated using a single factor experiment. The optimized
laser processing parameters for metal foam were obtained using CCD.
Single factor experiment. The specific processing and testing process of metal
foam are as follows: First, the metal foam was completely cut using a laser, and a
series of rectangular metal foam shapes were obtained with a size of 30 mm × 15 mm
× 3 mm. The topography of the cutting section of the metal foam was analyzed using
a scanning electron microscope (SEM), and compared to traditional machining
(milling process using a lathe). Second, three processing times (5, 10, and 15 s) were
preset for the different metal foam. Using various laser cutting parameters, different
kerfs were fabricated on the surface of the metal foam. The depths of the kerfs were
then measured to calculate the MRR of the metal foam. Finally, the cutting sections of
the metal foam were analyzed using energy dispersive spectroscopy (EDS) to
determine the MOR. A schematic of the cutting and detection process of metal foam is
shown in Fig. 1. Using the same laser cutting parameters, the average oxygen mole
ratio of three regions of the metal foam was considered as the MOR. In this paper, the
MRR is defined as the processing depth of the kerfs per unit of time, which can be
used to estimate the cut-off time of the metal foam. The MOR is defined as the

Page 6 of 31
difference in oxygen mole ratio before and after processing, which can be calculated
through the following equations:
T
DRM (1)
bao -CCR (2)
where D is the depth of the kerf, T is the laser processing time, and Ca and Cb are the
oxygen mole ratios of foam metal after and before the laser processing, respectively.
Controller
Controller head
Reference surface
Working table Laser cut marks Foam metal
Cutting section
Electron microscope
SEMRegion 1
Region 3
Region 2
(1) Completely cut (2) Cutting by time (3)Electron microscopy detect
Focusing lens
Fiber Laser
Fig. 1 Schematic of cutting and detection process of metal foam
Laser processing devices. The system is composed of a fiber laser, scanning
galvanometer, focusing lens, computer-controlled system, power equipment, and
worktable. In this study, a prototype pulsed fiber laser (IPG, No.
YLP-1-100-20-20-CN, Germany) was used as the fabrication laser. The laser was set
to produce 100 ns pulses with a 1064 nm central emission wavelength at a repetition
rate of 20 kHz. The specifications of the characteristic parameters of the fiber laser
system used are given in Table 1. The pulse energy (Epulse) and peak power (Ppeak) can
be calculated as [20]
Page 7 of 31
repetition
average
pulseF
PE (3)
durationrepetition
average
peak TF
PP (4)
where Paverage is the output power given by the laser source at a fixed frequency,
Frepetion is the repetition rate, and Tduration is the pulse duration.
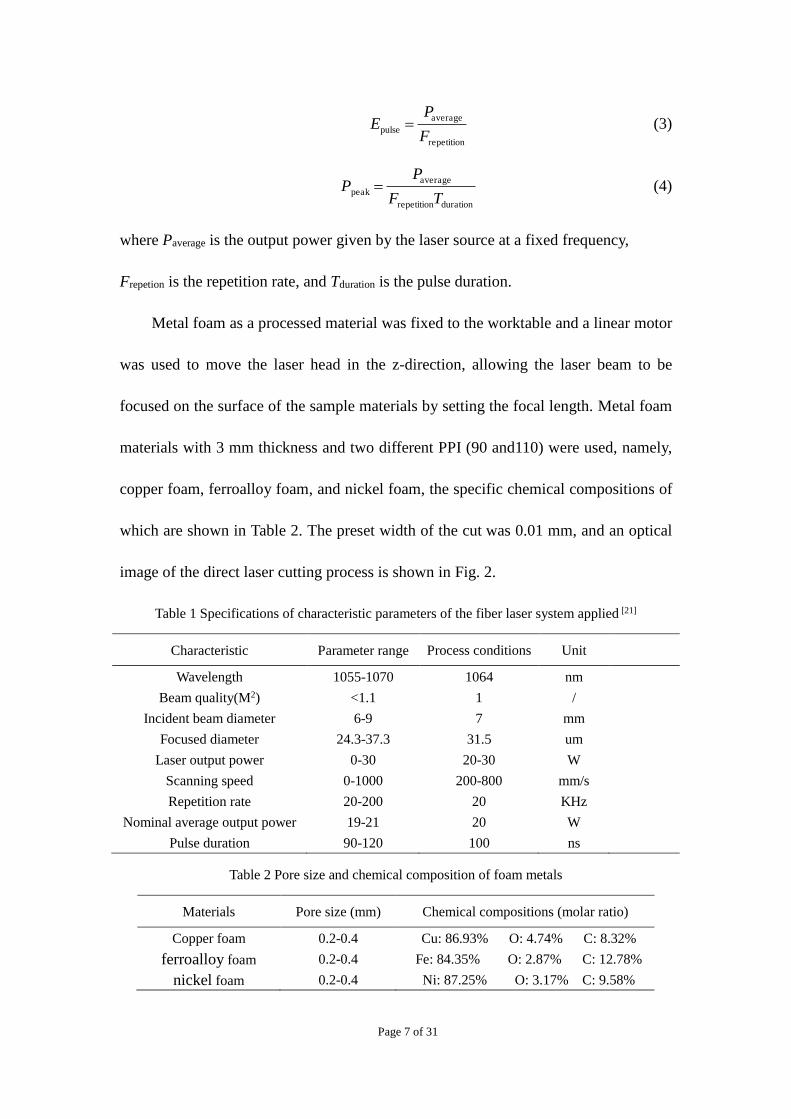
Metal foam as a processed material was fixed to the worktable and a linear motor
was used to move the laser head in the z-direction, allowing the laser beam to be
focused on the surface of the sample materials by setting the focal length. Metal foam
materials with 3 mm thickness and two different PPI (90 and110) were used, namely,
copper foam, ferroalloy foam, and nickel foam, the specific chemical compositions of
which are shown in Table 2. The preset width of the cut was 0.01 mm, and an optical
image of the direct laser cutting process is shown in Fig. 2.
Table 1 Specifications of characteristic parameters of the fiber laser system applied [21]
Characteristic Parameter range Process conditions Unit
Wavelength
Beam quality(M2)
Incident beam diameter
Focused diameter
Laser output power
Scanning speed
Repetition rate
Nominal average output power
Pulse duration
1055-1070
<1.1
6-9
24.3-37.3
0-30
0-1000
20-200
19-21
90-120
1064
1
7
31.5
20-30
200-800
20
20
100
nm
/
mm
um
W
mm/s
KHz
W
ns
Table 2 Pore size and chemical composition of foam metals
Materials Pore size (mm) Chemical compositions (molar ratio)
Copper foam
ferroalloy foam
nickel foam
0.2-0.4
0.2-0.4
0.2-0.4
Cu: 86.93% O: 4.74% C: 8.32%
Fe: 84.35% O: 2.87% C: 12.78%
Ni: 87.25% O: 3.17% C: 9.58%

Page 8 of 31
Pressing block Washer
Working table
Foam metal
Laser beam
Fig. 2 Optical image of laser direct cutting process of metal foam
Central composite experiment design (CCD). The scanning speed and laser
output power are independent variables, and the MRR and MOR are the targets.
Regression equations can be established through the CCD to obtain the optimal
parameters. The control factors and their levels are listed in Table 3. These
experiments can be divided into three types: two level experiments of the axial points
, experiments of asterisk , and zero horizontal experiments of the center , as
shown in Fig. 3.
Table 3 Parameters of central composite experimental design
Symbols Factors Level 1 Level 2
P
S
Laser output power
Scanning speed
20 w
200 mm/s
30 w
800 mm/s

Page 9 of 31
(20w,800mm/s )
(20w,200mm/s)
(20w,500mm/s)
(30w,500mm/s)
(30w,200mm/s)
(30w,800mm/s)
(25w,200mm/s)
(25w,800mm/s)
(25w,500mm/s)
P
S
Fig. 3 Schematic of the central composite experimental design
3 Results and Discussion
3.1 Laser cutting process of metal foam
A schematic of the laser cutting process of metal foam is shown in Fig. 4. The
laser cutting process of metal foam has the following three stages. In the initial stage
of the cutting process, when the laser starts to radiate the surface of the metal foam,
the majority of laser energy is absorbed by the foam. Later, the surface temperature of
the metal foam increases quickly but the walls are not molten or gasified. As time
goes on, the temperature reaches the melting point of the metal foam, and the walls of
the metal foam begin to melt. A molten pool is formed in the area radiated by the laser.
When the laser radiation period is further increased, the surfaces of the metal foam are
gasified and plasma of a higher ionization is formed. The removal capability is greatly
enhanced. In this way, the surface of the metal foam is successfully cut, as shown in
Fig. 4(a). During the middle stage of the cutting process, with an increasing depth of

Page 10 of 31
the kerf, the removal efficiency is decreased because of the shielding of the laser
beam. However, metal foam made using a foaming method has a porous structure,
low density, impurities, and a rough surface. These characteristics give the metal foam
a stronger laser absorption rate [22] and transmittance [23] than solid metal.
Consistent with solid metal, the kerf surface of metal foam is affected by the laser
cutting process, which is mainly reflected in the pits, wave stripes, and falling
particles on the surface of the kerf [24, 25], as shown in Fig. 4(b). As the processing
continues, the metal foam can be cut off during the final stage of the cutting process,
as shown in Fig. 4(c). A kerf with a trapezoid shape can be obtained.
Falling particles Pits Wave stripes
(a) Initial stage of cutting
(b) Middle stage of cutting (c) Final stage of cutting
Metal pool
Gaseous metal
Plasma
Laser beam T °C
Fig.4 Schematic of laser cutting process of metal foam
Page 11 of 31
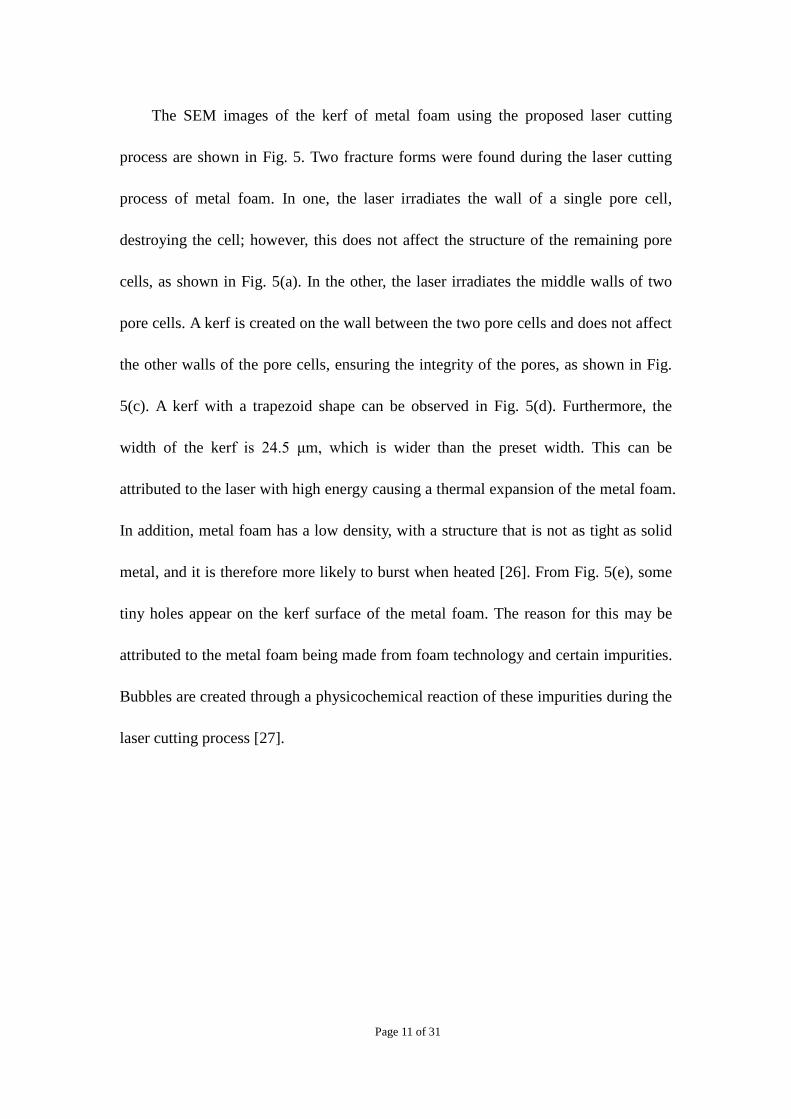
The SEM images of the kerf of metal foam using the proposed laser cutting
process are shown in Fig. 5. Two fracture forms were found during the laser cutting
process of metal foam. In one, the laser irradiates the wall of a single pore cell,
destroying the cell; however, this does not affect the structure of the remaining pore
cells, as shown in Fig. 5(a). In the other, the laser irradiates the middle walls of two
pore cells. A kerf is created on the wall between the two pore cells and does not affect
the other walls of the pore cells, ensuring the integrity of the pores, as shown in Fig.
5(c). A kerf with a trapezoid shape can be observed in Fig. 5(d). Furthermore, the
width of the kerf is 24.5 μm, which is wider than the preset width. This can be
attributed to the laser with high energy causing a thermal expansion of the metal foam.
In addition, metal foam has a low density, with a structure that is not as tight as solid
metal, and it is therefore more likely to burst when heated [26]. From Fig. 5(e), some
tiny holes appear on the kerf surface of the metal foam. The reason for this may be
attributed to the metal foam being made from foam technology and certain impurities.
Bubbles are created through a physicochemical reaction of these impurities during the
laser cutting process [27].

Page 12 of 31
24.5um
Holes
Kerfs
Cell2
Cell1
Kerfs
The single cell
a b c
de
Fig.5 SEM images of a kerf in metal foam using a laser cutting process: (a) kerf passing through a
single cell, (b) shape of the kerf with 35X magnification, (c) kerf created on the wall between two
cells, (d) shape of the kerf with 2000X magnification, and (e) the surface of the kerf.
3.2 Cutting sections and appearance of metal foams
SEM images of cut sections of metal foam using different methods are shown in
Fig. 6. From Fig. 6(a), the unprocessed metal foam exhibits a clear porous structure
with a uniform distribution. The pore cells have a variety of shapes that are dominated
by polygons [28]. A section cut using traditional machining is shown in Fig. 6(b).
When the tool is fed from the upper surface to the bottom surface of the metal foam,
the walls of the pore cells easily bend or break, and pore structures are destroyed
owing to the mechanical stress of the tool. Next, when the cutting tool approaches the
worktable, the pore cell walls and pore structure of the metal foam are collapsed and
glued together, blocking the pores. With the laser cutting process, the pore shape
maintains the original polygon and the structure is nearly unchanged.

Page 13 of 31
The difference is that there are some smooth sections on the laser cut surface of the
cell walls, as shown in Fig. 6(c)—6(e).
(a) Unprocessed (b) Traditional machining
(c) Laser processing (d) Appearance single cell (e) Microstructure of section
Smoothsections
Structures of cells
Walls collap se
And Pores block
Cracked walls and
Destroyed poresPolygonal cells
Fig.6 SEM images of cut section of unprocessed metal foam, and using traditional machining and
laser cutting
Fig.7 shows SEM images of the cutting depths of copper foam cut with different
laser output powers of 20, 25, and 30, a scanning speed of 500 mm/s, and a pulse
frequency of 20 kHz. It was found that the cutting depth and kerf width increase with
the increase in laser output power. Fig. 8 shows SEM images of the cutting depths,
which vary with the scanning speed, using a 30 W laser output power and a pulse
frequency of 20 kHz. The cutting depth and kerf width were increased with the
decrease in the scanning speed. This is attributed to the increase in the cutting time
used to enhance the material removability with a lower scanning speed. Meanwhile,
the longer stay time of the thermal and the influence of thermal region can lead to a

Page 14 of 31
more obvious increase in the kerf width [29].
(a)30W-500mm/s-20KHz (b)25W-500mm/s-20KHz (c)20W-500mm/s-20KHz
Fig. 7 SEM images of cutting depth of copper foam with different laser output powers
(a)30W-200mm/s-20KHz (b)30W-500mm/s-20KHz (c)30W-800mm/s-20KHz
Fig. 8 SEM images of cutting sections of copper foam with different scanning speeds
The various appearances of copper foam cut using different laser output powers
and scanning speeds are shown in Fig. 9. With an increase in laser output power and a
decrease in scanning speed, the laser cutting process improves the cutting depth for
copper foam, although such improvement will gradually decrease. Adversely, it
causes a greater heating effect and wider kerf, which increase the MRR and MOR.
Thus, the selection of reasonable processing parameters is critical when cutting metal
foam.

Page 15 of 31
Top
Bottom
Lateral
(a)20W-800mm/s-20KHz (b)25W-500mm/s-20KHz (c)30W-200mm/s-20KHz
Fig.9 Varying appearances of copper foam with different laser output powers and scanning speeds
3.3 Effects of processing parameters on material removal rate
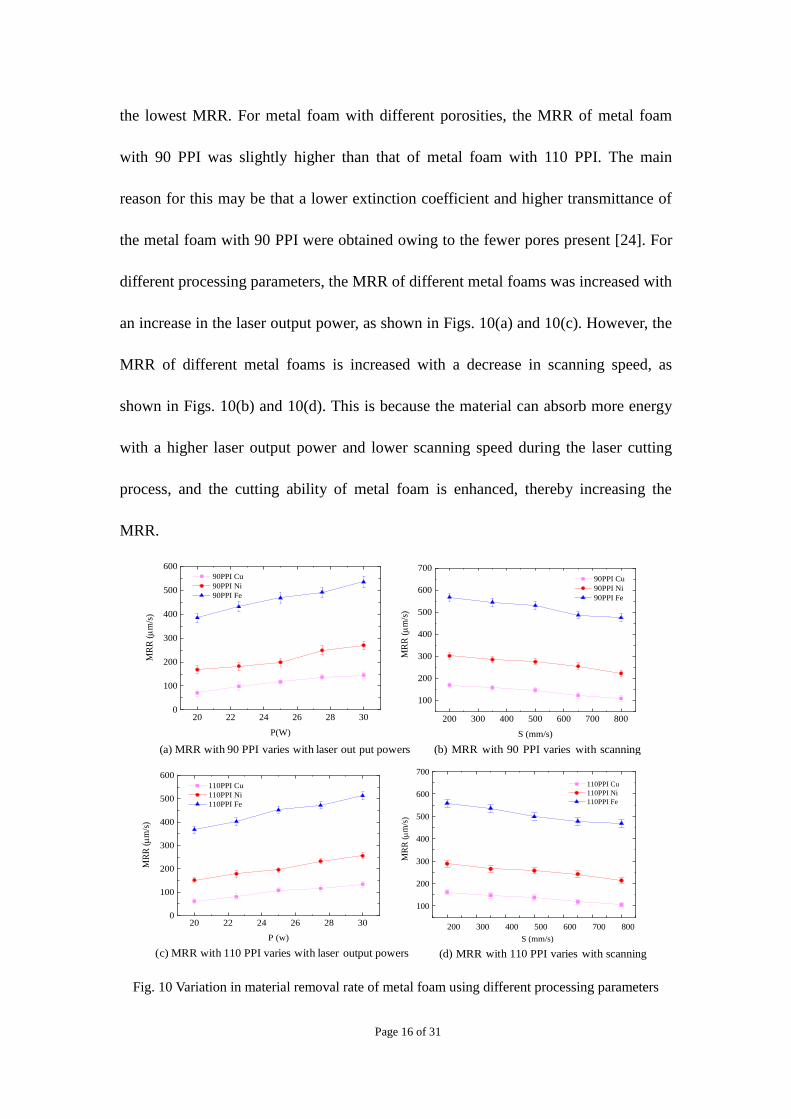
Fig. 10 shows the MRR of metal foam using different processing parameters. For
metal foam with different materials, the largest MRR was obtained for ferroalloy
foam, and the smallest was obtained for copper foam. Thus, we determined that
ferroalloy foam is easy to cut. This is attributed to the absorbance of the different
materials. The absorbance of copper is the lowest during the laser cutting process,
whereas that of ferroalloy metal is the highest. A lower MRR was obtained with a
lower absorbance [30]. Moreover, copper foam has higher thermal conductivity,
which makes the material difficult to remove [31]. Hence, the copper foam exhibited
Page 16 of 31
the lowest MRR. For metal foam with different porosities, the MRR of metal foam
with 90 PPI was slightly higher than that of metal foam with 110 PPI. The main
reason for this may be that a lower extinction coefficient and higher transmittance of
the metal foam with 90 PPI were obtained owing to the fewer pores present [24]. For
different processing parameters, the MRR of different metal foams was increased with
an increase in the laser output power, as shown in Figs. 10(a) and 10(c). However, the
MRR of different metal foams is increased with a decrease in scanning speed, as
shown in Figs. 10(b) and 10(d). This is because the material can absorb more energy
with a higher laser output power and lower scanning speed during the laser cutting
process, and the cutting ability of metal foam is enhanced, thereby increasing the
MRR.
20 22 24 26 28 300
100
200
300
400
500
600
MR
R (
m/s
)
P(W)
90PPI Cu
90PPI Ni
90PPI Fe
200 300 400 500 600 700 800
100
200
300
400
500
600
700
MR
R (
m/s
)
S (mm/s)
90PPI Cu
90PPI Ni
90PPI Fe
20 22 24 26 28 300
100
200
300
400
500
600
MR
R (
m/s
)
P (w)
110PPI Cu
110PPI Ni
110PPI Fe
200 300 400 500 600 700 800
100
200
300
400
500
600
700
MR
R (
m/s
)
S (mm/s)
110PPI Cu
110PPI Ni
110PPI Fe
(a) MRR with 90 PPI varies with laser out put powers (b) MRR with 90 PPI varies with scanning
speeds
(c) MRR with 110 PPI varies with laser output powers (d) MRR with 110 PPI varies with scanning
speeds
Fig. 10 Variation in material removal rate of metal foam using different processing parameters

Page 17 of 31
3.4 Effects of processing parameters on material oxidation rate
Figs. 11 and 12 show the material oxidation rate of various types of metal foam
with 110 PPI using different laser output powers and scanning speeds. On the whole,
the ferroalloy foam exhibited the highest MOR, followed by copper foam and nickel
foam. It could be that the ferroalloy foam was more easily oxidized at high
temperature than the other metal foams. However, some stable metal oxide films are
produced during the oxidization process of nickel foam, which can inhibit the nickel
foam surface from being oxidized further. Thus, the MOR of nickel foam is the lowest.
For the different processing parameters, the MOR of different metal foams was
increased with an increase in the laser output power and decrease in the scanning
speed, which can be attributed to the temperature increase and extended time of the
thermal effects occurring from such changes. In addition, we found that the MOR for
90 PPI is almost as high as for 110 PPI when applying the same type of materials and
laser process parameters. Thus, the MOR is not clearly affected by the PPI of the
metal foam.
20.0 22.5 25.0 27.5 30.00
10
20
30
40
50
MO
R (
%)
P (W)
PPI110Fe
PPI110Ni
PPI110Cu
Fig. 11 MOR of 110 PPI metal foam using different laser output powers

Page 18 of 31
200 350 500 650 8000
10
20
30
40
50
MO
R (
%)
S (mm/s)
PPI110Fe
PPI110Ni
PPI110Cu
Fig. 12 MOR of 110 PPI metal foam using different scanning speeds
4 Optimization for processing parameters
4.1 Regression equation
It is assumed that there are m experiment factors, which are independent
variables xj, where j = 1, 2, 3...m, and the experiment targets are set to yn. The general
form of the quadratic regression equation can be expressed as follows:
)(1,...3,2,1y 2
11
jj0 kjmkxbxxbxbb j
m
j
jjj
jk
kkj
m
j
n
(5)
In this experiment, m is 2.
Based on the above method, copper foam of 110 PPI was selected as the sample
material for the laser cutting process. The optimization method of the other metal
foam types is similar to the one described here. Based on the CCD, nine experiments
were carried out. The MRR and MOR are the experimental targets, which are
represented by y1 and y2, respectively. The experimental results are shown in Table 4.

Page 19 of 31
Table 4 Experimental results of central composite experimental design
Experiments Material removal rate (um/s) Material oxidation rate (%)
Numbers Symbols y1 y2
1 P-1S-1 65 21.67
2 P-1S1 55 17.61
3 P1S-1 156 45.28
4 P1S1 102 26.42
5 P0S-1 117 35.83
6 P0S1 81 23.54
7 P1S0 134 36.83
8 P-1S0 62 21.59
9 P0S0 108 29.63
The quadratic regression equations can be established based on the results of the
CCD experiments, and the parameters of Eq. (5) can be calculated using the
following:
k
kj
k
kkj
jx
yx
b2 (6)
)( jixx
yxx
b
k
kjki
k
kkjki
ij
(7)
k
N
k
kjkj
k
k
N
k
kjkj
jj
xN
x
yxN
x
b2
22
22
1-
1-
(8)
k
kj
j
jj xbN
yb2
m
1
0
1- (9)
where N is the total number of experiments, and is the average value of nine
experimental results.
Thus, the quadratic regression equations of MRR and MOR can be expressed as
y

Page 20 of 31
follows:
22
1 059000.025333.033007.0-0.1870323.3333306.481ˆ SPPSSPy (10)
22
2 100001.0-0.05733-0.00247-0.052755.68866-68.9593ˆ SPPSSPy (11)
Statistical Analysis. 3D surface plots of MRR and MOR can be established by
combining regression Eqs. (10) and (11), as shown in Fig. 13. The MRR increases
with an increment in the laser output power and a decrement in the scanning speed.
The same variation was also observed for the MOR. Therefore, the single optimum
condition is the one that provides a higher MRR with an improved MOR.
Summarizing the results from Fig. 13, it was found that the laser output power has a
more significant effect on the MRR, and the scanning speed has a more significant
effect on the MOR.
Analysis of variance (ANOVA) results for the MRR and MOR are shown in
Table 5. A statistical analysis of each response was conducted for a 95% confidence
level, where the R2 of each response is 97%, which indicates that these models have
a high level of statistical significance and a good degree of fitting. From Table 5
(MRR), the p-values for all factors are smaller than 0.05 except for the last one, S2.
This shows that the laser output power and the scanning speed significantly affect
both the MRR and the interaction P*S. In addition, the p-values for S are smaller than
for P. This shows that the laser output power has a greater effect than the scanning
speed for the MRR, which is consistent with the above conclusion. As indicated in
Table 5 (MOR), the p-values for all factors are smaller than 0.05, and the p-value for

Page 21 of 31
S is smaller than that for P. These results clearly show that the main parameter
affecting the MOR is the scanning speed.
(a) 3D surface plot of MMR (b) 3D surface plot of MOR
Fig. 13 Material removal rate and material oxidation rate of 3D surface varying with
different laser processing parameters
Table 5 ANOVA results for material removal and material oxidation rates
Source t Stat p-value Source t Stat p-value
MRR MOR
P 6.171664 0.008968 P 5.512937 0.011753
S 6.018875 0.009191 S 6.322404 0.007999
P*S -8.16538 0.003842 P*S -10.2289 0.001992
P2 -3.32431 0.044909 P2 -2.79942 0.067886
S2 -1.87338 0.157724 S2 -2.80193 0.067744
Note: F=246.82, R2=0.9975 Note: F=265.53, R2=0.9977
F0.01(6,2)=10.92, t0.05(6)=1.943, t0.1(6)=1.440
Optimized parameters. For optimum efficiency, the MRR is expected to
increase quickly with a slow increase in the MOR, and using contour plots of the
MRR and MOR, as shown in Fig. 14. As Fig. 14(a) indicates, the MRR increases
more efficiently with a laser output power of below 26 W. For example, when the
laser output power increases from 22 to 26 W, the MRR increases from about 90 to
130 mm/s. However, when the laser output power increases from 26 to 30 W, the

Page 22 of 31
MRR increases from about 130 to 150 mm/s. It seems that the influence of the laser
output power diminishes the softening effect above this point. Thus, the optimum
laser output power is considered to be around 26 W. As shown in Fig. 14(b), the MOR
decreases more efficiently with a scanning speed above 400 mm/s at a laser output
power of 26 W. However, the MOR decreases slowly with a rapid drop in the MRR at
a scanning speed of above 500 mm/s. Comparing the scanning speed of 200 to 500
mm/s with that of 500 to 800 mm/s, the increase in the MRR declines by about 3-fold.
Thus, the optimized parameters can be confirmed as an laser output power of around
26 W and a scanning speed ranging from 400 to 500 mm/s.
(a) Contour plots of MRR (b) Contour plots of MOR
Fig. 14 Contour plots of (a) MRR and (b) MOR with varying laser processing parameters
4.2 Processing metal foam samples using optimized parameters
The optimization parameters for the laser processing of metal foam are
confirmed to be a laser output power of 26 W and a scanning speed of 475 mm/s.
Copper foam of 110 PPI with a Ø40 mm diameter and 40 × 70 mm2 rectangular shape
was selected as the processing sample. These metal foam samples with different
shapes can be used in a methanol reforming hydrogen reactor as catalyst carriers [32,
33]. Owing to the larger surfaces of these samples than those of the previous

Page 23 of 31
experimental samples, the kerf width was set to 0.1 mm. The appearance of the
processed copper foam samples using the proposed laser cutting process and the
optimized parameters are shown in Fig. 15. It was found that copper foam with a
regular shape such as a circle or rectangle can be successfully cut using a short
processing time (about 5 min) when applying the optimized parameters.
(a) Circle sample (b) Rectanglar sample
(a) circle sample (b) rectangle sample
Fig. 15 Appearance of processed copper foam samples using proposed laser cutting process and
optimized parameters
5 Conclusions
A laser cutting process was used to efficiently and directly cut metal foam into
regular shapes. After the laser cutting process of metal foam was analyzed, the effects
of the different materials and PPI on the cutting process were investigated in detail.
The main conclusions are as follows:
(1) Metal foam made of copper, ferroalloy, or nickel can be effectively formed into
regular shapes using the proposed direct laser cutting process. The laser cutting
method can produce a good cutting section without distortion, bending, or collapse of
the pore structure.

Page 24 of 31
(2) Of the three types of foam, the highest MRR and MOR were observed for
ferroalloy foam. Of the two different PPI considered, metal foam of 90 PPI showed a
much larger MRR than that of 110 PPI. The MRR and MOR were increased with an
increase in laser output power and decrease in scanning speed.
(3) The laser cutting parameters were optimized using the CCD method. When a laser
output power of 26 W and a scanning speed of 475 mm/s were selected, copper foam
with a good cutting section and a regular shape was obtained.
Acknowledgements
This work was supported by the National Natural Science Foundation of China (No.
51475397) and the Natural Science Foundation of Fujian Province of China
(No.2017J06015). In addition, support from the Fundamental Research Funds for
Central Universities, Xiamen University (No. 20720160079), and the Collaborative
Innovation Center of High-End Equipment Manufacturing in Fujian are also
acknowledged.
References
[1] Jin H, Fan L, Zhu Z, Yu Z (2017) A pore-scale visualized study of melting heat
transfer of a paraffin wax saturated in a copper foam: Effects of the pore size.
International Journal of Heat and Mass Transfer 112: 39-44.
[2] Castro G, Nutt SR (2012) Synthesis of syntactic steel foam using mechanical
pressure infiltration. Materials Science and Engineering 535: 274-280.

Page 25 of 31
[3] Ji K, Zhao H, Zhang J, Chen J, Dai Z (2014) Fabrication and electromagnetic
interference shielding performance of open-cell foam of a Cu-Ni alloy integrated with
CNTs. Applied Surface Science 311: 351-356.
[4] Shen CC, Jian TY, Wang YT (2013) Steam Reforming of Methanol in a compact
Copper Microchannel Foam Reactor. Fuel Cells 13(6): 965-970.
[5] Giani L, Groppi G, Tronconi E (2005) Mass-Transfer Characterization of
Metallic Foams as Supports for Structured Catalysts. I&EC research 44(14):
4993-5002.
[6] Aartun I, Silberova B, Venvik H, Pfeifer P, Gorke O, Schubert K, Holmen A
(2005) Hydrogen production from propane in Rh-impregnated metallic microchannel
reactors and alumina foams. Catalysis Today 105(3-4): 469-478.
[7] Muth J, Poggie M, Kulesha G, Michael RM (2013) Novel highly porous metal
technology in artificial hip and knee replacement: processing methodologies and
clinical applications. Journal of Metals 65: 318-325.
[8] Song Z, Kishimoto S (2006) The cell size effect of closed cellular materials
fabricated by pulse current assisted hot isostatic pressing on the compressive behavior.
Scripta Materialia 54(8): 1531-1535.
[9] Wang M, Pan N (2008) Modeling and prediction of the effective thermal
conductivity of random open-cell porous foams. International Journal of Heat and
Mass Transfer 51: 1325-1331.
[10] Billiet M, Schanmpheleire SD, Huisseune H, Paepe MD (2015) Influence of
Orientation and Radiative Heat Transfer on Aluminum Foams in Buoyancy-Induced

Page 26 of 31
Convection. Materials 8: 6792-6805.
[11] Raj ER, Daniel BSS (2008) Manufacturing challenges in obtaining tailor-made
closed-cell structures in metallic foams. The International Journal of Advanced
Manufacturing Technology 38: 605-612.
[12] Han GL, Li WD (2009) Processing and mechanical properties of magnesium
foams. Journal of Porous Materials 16: 251-256.
[13] Ozan S, Bilhan S (2008) Effect of fabrication parameters on the pore
concentration of the aluminum metal foam, manufactured by powder metallurgy. The
International Journal of Advanced Manufacturing Technology 39(3-4): 257-260.
[14] Tian Q, Guo X (2011) Manufacturing Microporous Foam Zinc Materials with
High Porosity By Electrodeposition. Journal of Wuhan University of
Technology-Materials Science Edition 26(5): 843-846.
[15] Banhart J (2001) Manufacture, characterization and application of cellular
metals and metal foams. Prog. Mater. Sci 46: 559-632.
[16] Kwon YJ, Shigematsu I, Saito N (2008) A novel surface modification process
for porous metals using friction phenomena. Materials Letters 62: 4458-4460.
[17] Scott MF, Albert SJ, Jun Q (2004) Investigation of the spark cycle on material
removal rate in wire electrical discharge machining of advanced materials.
International Journal of Machine Tool & Manufacture 44: 391-400.
[18] Alexander MM, Dennis K, Norbert J, Kai O (2016) Machining of Metal Foams
with varying mesostructure using Wire EDM. Procedia CIRP 42: 263-267.
[19] Zou R, Yu Z, Liu W, Guo M, Li J (2016) Influence of porous structure on the

Page 27 of 31
machining performance of micro EDM. Journal of Materials Processing Technology
232: 43-51.
[20] Cai C, Tao W, Li L, Chen Y (2015) Weld bead formation and corrosion
behavior of pulsed laser welded zirconium alloy. The international Journal of
Advanced Manufacturing Technology 77: 621-628.
[21] Zhou W, Ling W, Liu W, Peng Y, Peng, J (2015) Laser direct micromilling of
copper-based bioelectrode with surface microstructure array. Optics and Lasers in
Engineering 73: 7-15.
[22] Ke W, Zhu D, Cai G (2010) Simulation and Analysis of Spectral Emissivity of
Metals. Acta Aeronautica et Astronautica Sinica 31(11): 2139-2145.
[23] Zhao CY, Lu TJ, Hodson HP (2004) Thermal radiation in ultralight metal
foams with open cells. International Journal of Heat and Mass Transfer 47:
2927-2939.
[24] Zhang B, Dembinski L, Coddet C (2013) The study of the laser parameters and
environment variables effect on mechanical properties of high compact parts
elaborated by selective laser melting 316L powder. Materials Science & Engineering
A 584: 21-31.
[25] Peirovi S, Pourasghar M, Nejad Farokhi A, Hassan MA (2017) A study on the
different finite element approaches for laser cutting of aluminum alloy sheet. The
international Journal of Advanced Manufacturing Technology 93: 1399-1413.
[26] Lacroix M., Nguyen P., Schweich D, Pham HC, Savin PS, Edouard D (2007)
Pressure drop measurements and modeling on SiC foams. Chemical Engineering

Page 28 of 31
Science 62: 3259-3267.
[27] Li X, Chen J, Liu F, Li X, Zhang Q (2010) PMMA microlens array preparation
using carbon dioxide laser. Acta Optica Sinica S1: s100104.
[28] Kaya AC, Fleck C (2014) Deformation behavior of open-cell stainless steel
foams. Materials Science & Engineering A 615: 447-456.
[29] Nisar S, Sheikh MA, Lin L, Safdar S (2010) The effect of material thickness,
laser power and cutting speed on cut path deviation in high-power diode laser
chip-free cutting of glass. Optics & Laser Technology 42(6): 1022-1031.
[30] Lin X, Shao T (2001) Lumped Method for the Measurement of Laser
Absorptance of Materials. Acta Physica Sinica 50(5): 856-859.
[31] Adrian HAL, Alessandro A, Alessandro F, Luca R (2018) Long-pulse
quasi-CW lasercutting of metals. The international Journal of Advanced
Manufacturing Technology 94: 155-162.
[32] Zhou W, Ke Y, Wang Q, Wan S, Lind J, Zhang J, Huie KS (2017) Development
of cylindrical laminated methanol steam reforming microreactor with cascading metal
foams as catalyst support. Fuel 191:46-53.
[33] Yu H, Chen H, Pan M, Tang Y, Zeng K, Peng F, Wang H (2007) Effect of the
metal foam materials on the performance of methanol steam micro-reformer for fuel
cells. Applied Catalysis A: General 327(1): 106-113.
Page 29 of 31
Figure captions
Fig. 1 Schematic of cutting and detection process of metal foam
Fig. 2 Optical image of laser direct cutting process of metal foam
Fig. 3 Schematic of the central composite experimental design
Fig. 4 Schematic of laser cutting process of metal foam: (a) initial stage of cutting, (b)
middle stage of cutting, and (c) final stage of cutting
Fig. 5 SEM images of a kerf in metal foam using a laser cutting process: (a) kerf
passing through a single cell, (b) shape of the kerf with 35X magnification, (c) kerf
created on the wall between two cells, (d) shape of the kerf with 2000X magnification,
and (e) the surface of the kerf
Fig. 6 SEM images of cut section of unprocessed metal foam, and using traditional
machining and laser cutting: (a) unprocessed, (b) traditional machining, (c) laser
processing, (d) appearance of a single cell, and (e) microstructure of a section
Fig. 7 SEM images of cutting depth of copper foam with different laser output powers:
30 W, 500 mm/s, 20 KHz, (b) 25 W, 500 mm/s, 20 KHz, (c) 20 W, 500 mm/s, 20 KHz
Fig. 8 SEM images of cutting sections of copper foam with different scanning speeds:
(a) 30 W, 200 mm/s, 20 KHz, (b) 30 W, 500 mm/s, 20 KHz, (c) 30 W, 800 mm/s,
20KHz
Fig. 9 Varying appearances of copper foam with different laser output powers and
scanning speeds: (a) 20 W, 800 mm/s, 20 KHz, (b) 25 W, 500 mm/s, 20 KHz, (c) 30 W,
200 mm/s, 20 KHz
Fig. 10 Variation in material removal rate of metal foam using different processing

Page 30 of 31
parameters: (a) MRR with 90 PPI varying with laser out power, (b) MRR with 90 PPI
varying with scanning speed, (c) MRR with 110 PPI varying with laser out power, and
(d) MRR with 110 PPI
varying with scanning speed
Fig. 11 MOR of 110 PPI metal foam using different laser output powers
Fig. 12 MOR of 110 PPI metal foam using different scanning speeds
Fig. 13 Material removal rate and material oxidation rate of 3D surface varying with
different laser processing parameters: (a) 3D surface plot of MMR, (b) 3D surface
plot of MOR
Fig. 14 Contour plots of (a) MRR and (b) MOR with varying laser processing
parameters
Fig. 15 Appearance of processed copper foam samples using proposed laser cutting
process and optimized parameters: (a) circle sample, (b) rectangle sample

Page 31 of 31
Table captions
Table 1 Specifications of characteristic parameters of the fiber laser system applied
Table 2 Pore size and chemical composition of foam metals
Table 3 Parameters of central composite experimental design
Table 4 Experimental results of central composite experimental design
Table 5 ANOVA results for material removal and material oxidation rates