fear: a software package for frontier efficiency...
TRANSCRIPT

FEAR: A Software Package for
Frontier Efficiency Analysis with R
Paul W. Wilson
The John E. Walker Department of Economics, 222 Sirrine Hall, Clemson
University, Clemson, South Carolina 29634 USA
Abstract
This paper describes a software package for computing nonparametric efficiency es-timates, making inference, and testing hypotheses in frontier models. Commands areprovided for bootstrapping as well as computation of some new, robust estimatorsof efficiency, etc.
JEL classification: C14; C15; C44
Key words: nonparametric; DEA; efficiency; software; benchmarking
1 Introduction
An extensive literature on measurement of efficiency in production has evolvedfrom the pioneering work of Debreu [1] and Farrell [2]. A large part of thisliterature uses linear-programming based measures of efficiency along the linesof Charnes et al. [3] and Fare et al. [4]; these methods have been termed DataEnvelopment Analysis (DEA).
Email address: [email protected] (Paul W. Wilson).URL: //http://www.clemson.edu/faculty/wilson (Paul W. Wilson).
Preprint submitted to Elsevier 4 December 2006

Gattoufi et al. [5] cite more than 1,800 articles on DEA published in morethan 490 refereed journals. DEA and similar non-parametric estimators of-fer numerous advantages, the most obvious being that one need not specifya (potentially erroneous) functional relationship between production inputsand outputs. Until very recently the nonparametric efficiency literature hasignored statistical issues such as inference, hypothesis testing, etc. However,statistical inference and hypothesis testing are now possible with DEA andother nonparametric efficiency estimators due to results surveyed by Simarand Wilson ([6], [7]).
Standard software packages (e.g., LIMDEP, STATA, TSP) used by econome-tricians do not include procedures for DEA or other nonparametric efficiencyestimators. Several specialized, commercial software packages are available, aswell as a small number of non-commercial, free-ware programs; these have beenreviewed by Hollingsworth ([8], [9], [10]), and Barr [11]. Academic versions ofthe commercial packages range in price from about US$280 to US$1500 atcurrent exchange rates.
To varying degrees, the existing packages perform well the tasks they weredesigned for. Each includes facilities for reading data into the program, insome cases in a variety of formats, and procedures for estimating models thatthe authors have programmed into their software. A common complaint heardamong practitioners, however, runs along the lines of “package XYZ will notlet me estimate the model I want!” The existing packages are designed forease of use (again, with varying degrees of success), but at a cost inflexibility,limiting the user to models and procedures the authors have explicitly madeavailable. Moreover, none of the existing packages include procedures for sta-tistical inference. Although the asymptotic distribution of DEA estimators isnow known (see Kneip et al., 2003, for details) for the general case with p
inputs and q outputs, bootstrap methods remain the only useful approachfor inference. Yet, none of the existing packages include procedures for boot-strapping in frontier models. Similarly, none of the existing packages provideprocedures for the newly-developed robust alternatives to DEA surveyed inSimar and Wilson [7].
FEAR consists of a software library that can be linked to the general-purposestatistical package R. The routines included in FEAR allow the user to com-pute DEA estimates of technical, allocative, and overall efficiency while as-suming either variable, non-increasing, or constant returns to scale. The rou-tines are highly flexible, allowing measurement of efficiency of one group ofobservations relative to a technology defined by a second, reference group ofobservations. Consequently, the routines can be used to compute estimates ofMalmquist indices and their components in any of the decompositions thathave been proposed, scale efficiency measures, super-efficiency scores alongthe lines of Andersen and Petersen [12], and other measures that might be of
2

interest.
Commands are also included to facilitate implementation of the bootstrapmethods described by Simar and Wilson ([13], [14]); in particular, FEAR’sboot.sw98 command can be used to implement the homogeneous bootstrapalgorithm described by Simar and Wilson [13]; some programming using com-mands in FEAR and R are is required when using the current version of FEAR
to implement the heterogeneous bootstrap algorithm described by Simar andWilson [14]. Commands in FEAR can also be combined to implement sta-tistical tests for irrelevant inputs and outputs or aggregation possibilities asdescribed in Simar and Wilson [15], statistical tests of constant returns toscale versus non-increasing or varying returns to scale as described in Simarand Wilson [16], or the iterated bootstrap procedure described in Simar andWilson [17]. 1 A routine for maximum likelihood estimation of a truncatedregression model is included for regressing DEA efficiency estimates on envi-ronmental variables as described in Simar and Wilson [21]. In addition, FEAR
includes commands to estimate Malmquist indices are various decompositionsof Malmquist indices, with an implementation of the bootstrap algorithm fordescribed by Simar and Wilson [22]; to compute free-disposal hull (FDH) ef-ficiency estimates (Deprins et al. [23]); to perform outlier analysis using themethods of Wilson [24]; to compute the new, robust, root-n consistent order-m efficiency estimators described by Cazals et al. [25]; and to compute DEAestimates of cost, revenue, and profit efficiency. A number of these featuresare unavailable in existing software packages.
2 Where to Get FEAR and R
R is a language and environment for statistical computing graphics. It is animplementation of the S language developed at Bell Laboratories, but unlikethe commercial version of S marketed as S-Plus by Lucent Technologies, R isfreely available under the Free Software Foundation’s GNU General Public Li-cense. According to the R project’s web pages (http://www.r-project.org),
“R provides a wide variety of statistical... and graphical techniques, and
1 The statistical tests described by Simar and Wilson ([15], [16]) do not depend ondubious assumptions of distributions of efficiency scores. Banker [18] and Bankerand Natarajan [19] proposed statistics for testing various hypotheses in DEA ap-plications, with critical values chosen either from F -distributions, but the results ofKneip et al. [20] make clear that the statistics proposed by Banker cannot have F
distributions. Banker [18] and Banker and Natarajan [19] also proposed KolmogorovSmirnov tests based on DEA efficiency estimates, but without taking into accountthe dependence among these estimates discussed by Simar and Wilson [21].
3

is highly extensible.... One of R’s strengths is the ease with which well-designed publication-quality plots can be produced, including mathematicalsymbols and formulae where needed.... R is an integrated suite of softwarefacilities for data manipulation, calculation and graphical display. It includes(i) an effective data handling and storage facility; (ii) a suite of operatorsfor calculations on arrays, in particular matrices; (iii) a large, coherent,integrated collection of intermediate tools for data analysis; (iv) graphicalfacilities for data analysis and display either on-screen or on hard copy;and (v) a well-developed, simple and effective programming language whichincludes conditionals, loops, user-defined recursive functions and input andoutput facilities.”
R includes an on-line help facility and extensive documentation in the form ofmanuals included with the package. In addition, several books describing usesof R are available (eg., Dalgaard [26]; Venables and Ripley [27]; and Verzani[28]); see also the recent review by Racine and Hyndman [29]. The current ver-sion of R can be downloaded from http://lib.stat.cmu.edu/R/CRAN. Pre-compiled binary versions are available for a variety of platforms; at present,however, FEAR is being made available only for the Microsoft Windows (XPand later) operating systems running on Intel (and clone) machines.
After downloading and installing R, FEAR can be downloaded from the fol-lowing URL:
http://www.economics.clemson.edu/faculty/wilson/
Software/FEAR/fear.html
A Command Reference and User’s Guide can also be downloaded from thissite; the User’s Guide gives instructions for installing FEAR into R, as well asa number of examples illustrating some of the capabilities of FEAR. The website also contains licensing information; while use of FEAR is free for academicpurposes, potential government, commercial, or other users outside an educa-tional institution should contact the author before using the FEAR software.The current version of FEAR (at the time of this writing) is 1.0; as featuresare added and modifications are made, new versions will be released (withhigher version numbers). Every attempt will be made to maintain backward-compatibility with earlier versions of FEAR, and versions prior to the currentrelease will remain available for some time.
3 Using FEAR and R
Once R and FEAR have been downloaded and installed, R’s graphical userinterface (GUI) can be started by clicking on the desktop R icon; commands
4

are typed at a prompt in the “RConsole” window contained within the RGuiwindow. After installing FEAR, R’s on-line help facility can be used to finddocumentation on the commands implemented in FEAR, as shown in Figure1. Clicking on a command name displays a page giving details on use of thecommand, including arguments that must be passed, optional arguments andany defaults, etc., as well as a detailed description of what is returned by thecommand.
FEAR includes data that can be used to illustrate the library’s capabilities.First, the command library(FEAR) must be typed in the RConsole window toload the FEAR library, as shown in Figure 2. One might then type help(ccr)to learn that the Charnes et al. [30] data contain 5 inputs used to produce 3outputs among 70 schools. The following commands load these data and thenorganize the input vectors in a (5 × 70) matrix and the output vectors in a(3× 70) matrix:
data(ccr)x=t(matrix(c(ccr$x1,ccr$x2,ccr$x3,ccr$x4,ccr$x5),
nrow=70,ncol=5))y=t(matrix(c(ccr$y1,ccr$y2,ccr$y3),nrow=70,ncol=5))
The following commands reproduce the outlier analysis in Wilson [24]:
tmp=ap(x,y,NDEL=12)windows()ap.plot(RATIO=tmp$ratio)
The resulting plot is shown in Figure 4.
Next, Shephard [31] output-distance function estimates can be computed:
d.out=dea(x,y,ORIENTATION=2)
R’s summary command
summary(d.out)
gives summary statistics on the estimates. Alternatively, the summary com-mand can be combined with the ifelse statement to obtain summary statis-tics on the distance function estimates that are different from unity:
summary(ifelse(d.out==1,NA,d.out))
as shown in Figure 3. FEAR’s show.dens command can be used to produceplots of kernel density estimates for the distance function estimates containedin d.in and d.out; the necessary bandwidth parameters can be obtained withFEAR’s eff.bw command:
5

h=eff.bw(d.out)show.dens(dist=d.out,bw=h,
XLAB="output distance function estimates")
The resulting plots are shown in Figure 5; here, they have been drawn onthe user’s screen, but alternatively, R’s postscript command can be usedto write postscript code for the plots to a file for inclusion in a manuscript,etc. The show.dens command uses a reflection method to avoid inconsistencyproblems for the kernel density estimator and the lower (upper) boundary 1for the input (output) efficiency estimates.
The command boot.sw98 implements the bootstrap algorithm described bySimar and Wilson [13]; this command can be used to estimate 95-percentconfidence intervals for the input distance functions corresponding to eachobservation in the Charnes et al. [30] data by typing
result=boot.sw98(XOBS=x,YOBS=y,DHAT=d.out,ORIENTATION=2)
The following command will produce LATEX code for a table displaying resultsfrom the last command; the first column contains the observation number,the second column contains the input distance function estimates, while thethird and fourth columns contain the lower and upper bounds of the estimatedconfidence intervals:
tmp=paste(c(1:70),"&",d.in,"&",result$conf.int[,1],"&",result$conf.int[,2],"\\",sep=" ")
4 Concluding Remarks
FEAR is a very flexible, extensible package unlike any currently available forestimation of productivity and efficiency. The cost of this flexibility is that theuser must type commands at a command-line prompt; for some, this may beunsatisfactory. For others, however, FEAR will be a useful tool, allowing oneto estimate quantities that have not been explicitly programmed into otherpackages, and that have perhaps not been anticipated by this or other authors.
In addition to the commands illustrated above, the current version FEAR
includes commands to compute DEA estimates of cost, revenue, and profit ef-ficiency, Malmquist indices and various decompositions, and order-m efficiencyestimates.
6

References
[1] G. Debreu, The coefficient of resource utilization, Econometrica 19 (1951) 273–292.
[2] M. Farrell, The measurement of productive efficiency, Journal of the RoyalStatistical Society A 120 (1957) 253–281.
[3] A. Charnes, W. Cooper, E. Rhodes, Measuring the inefficiency of decisionmaking units, European Journal of Operational Research 2 (1978) 429–444.
[4] R. Fare, S. Grosskopf, C. Lovell, The Measurement of Efficiency of Production,Kluwer-Nijhoff Publishing, Boston, 1985.
[5] S. Gattoufi, M. Oral, A. Reisman, Data envelopment analysis literature: Abibliography update (1951–2001), Socio-Economic Planning Sciences 38 (2004)159–229.
[6] L. Simar, P. Wilson, Statistical inference in nonparametric frontier models: Thestate of the art, Journal of Productivity Analysis 13 (2000) 49–78.
[7] L. Simar, P. Wilson, Statistical inference in nonparametric frontier models:Recent developments and perspectives, in: H. Fried, C. Lovell, S. Schmidt(Eds.), The Measurement of Productive Efficiency, 2nd Edition, OxfordUniversity Press, Oxford, 2007, Ch. 4, forthcoming.
[8] B. Hollingsworth, A review of data envelopment analysis software, EconomicJournal 107 (1997) 1268–1270.
[9] B. Hollingsworth, Data envelopment analysis and productivity analysis: Areview of the options, Economic Journal 109 (1999) F458–F462.
[10] B. Hollingsworth, Non parametric efficiency measurement, Economic Journal114 (2004) F307–F311.
[11] R. Barr, DEA software tools and technology, in: W. Cooper, L. Seiford, J. Zhu(Eds.), Handbook on Data Envelopment Analysis, Kluwer Academic Publishers,Boston, 2004, pp. 539–566.
[12] P. Andersen, N. Petersen, A procedure for ranking efficient units in dataenvelopment analysis, Management Science 39 (1993) 1261–1264.
[13] L. Simar, P. Wilson, Sensitivity analysis of efficiency scores: How to bootstrapin nonparametric frontier models, Management Science 44 (1998) 49–61.
[14] L. Simar, P. Wilson, A general methodology for bootstrapping in non-parametric frontier models, Journal of Applied Statistics 27 (2000) 779–802.
[15] L. Simar, P. Wilson, Testing restrictions in nonparametric efficiency models,Communications in Statistics 30 (2001) 159–184.
[16] L. Simar, P. Wilson, Nonparametric tests of returns to scale, European Journalof Operational Research 139 (2001) 115–132.
7

[17] L. Simar, P. Wilson, Performance of the bootstrap for DEA estimators anditerating the principle, in: W. Cooper, L. Seiford, J. Zhu (Eds.), Handbookon Data Envelopment Analysis, Kluwer Academic Publishers, Inc., New York,2004, Ch. 10, pp. 265–298.
[18] R. Banker, Hypothesis tests using data envelopment analysis, Journal ofProductivity Analysis 7 (1996) 139–159.
[19] R. Banker, R. Natarajan, Statistical tests based on dea efficiency scores, in:W. Cooper, L. Seiford, J. Zhu (Eds.), Handbook on Data Envelopment Analysis,Kluwer Academic Publishers, Inc., New York, 2004, Ch. 11, pp. 265–298.
[20] A. Kneip, L. Simar, P. Wilson, Asymptotics for DEA estimators innonparametric frontier models, discussion paper #0317, Institut de Statistique,Universite Catholique de Louvain, Louvain-la-Neuve, Belgium (2003).
[21] L. Simar, P. Wilson, Estimation and inference in two-stage, semi-parametricmodels of productive efficiency, Journal of Econometrics 136 (2007) 31–64.
[22] L. Simar, P. Wilson, Estimating and bootstrapping Malmquist indices,European Journal of Operational Research 115 (1999) 459–471.
[23] D. Deprins, L. Simar, H. Tulkens, Measuring labor inefficiency in post offices, in:M. M. P. Pestieau, H. Tulkens (Eds.), The Performance of Public Enterprises:Concepts and Measurements, North-Holland, Amsterdam, 1984, pp. 243–267.
[24] P. Wilson, Detecting outliers in deterministic nonparametric frontier modelswith multiple outputs, Journal of Business and Economic Statistics 11 (1993)319–323.
[25] C. Cazals, J. Florens, L. Simar, Nonparametric frontier estimation: A robustapproach, Journal of Econometrics 106 (2002) 1–25.
[26] P. Dalgaard, Introductory Statistics with R, Springer-Verlag, Inc., New York,2002.
[27] W. Venables, B. Ripley, Modern Applied Statistics with S, Springer-Verlag,Inc., New York, 2002.
[28] J. Verzani, Using R for Introductory Statistics, Chapman and Hall, London,2004.
[29] J. Racine, R. Hyndman, Using R to teach econometrics, Journal of AppliedEconometrics 17 (2002) 175–189.
[30] A. Charnes, W. Cooper, E. Rhodes, Evaluating program and managerialefficiency: An application of data envelopment analysis to program followthrough, Management Science 27 (1981) 668–697.
[31] R. Shephard, Theory of Cost and Production Functions, Princeton UniversityPress, Princeton, 1970.
8

Paul W. Wilson (“FEAR: A Software Package for Frontier Efficiency Analysis
with R”) is Professor of Economics, Department of Economics, Clemson University,
Clemson, South Carolina. He is an Editor of the Journal of Productivity Analysis
and has held visiting positions at the Federal Reserve Bank of St. Louis and the In-
stitut de Statistique, Universite Catholique de Louvain, Louvain-la-Neuve, Belgium.
He receive a Ph.D. in Economics from Brown University. Prof. Wilson’s research
interests include econometrics (both theoretical and applied), banking, health care,
and urban transportation. His work has appeared in a variety of journals, including
Journal of Econometrics, Review of Economics and Statistics, Journal of Applied
Econometrics, Journal of Monetary Economics, Econometric Thoery, Management
Science, and Journal of Urban Economics.
9

Fig. 1. List of commands in the FEAR package
10
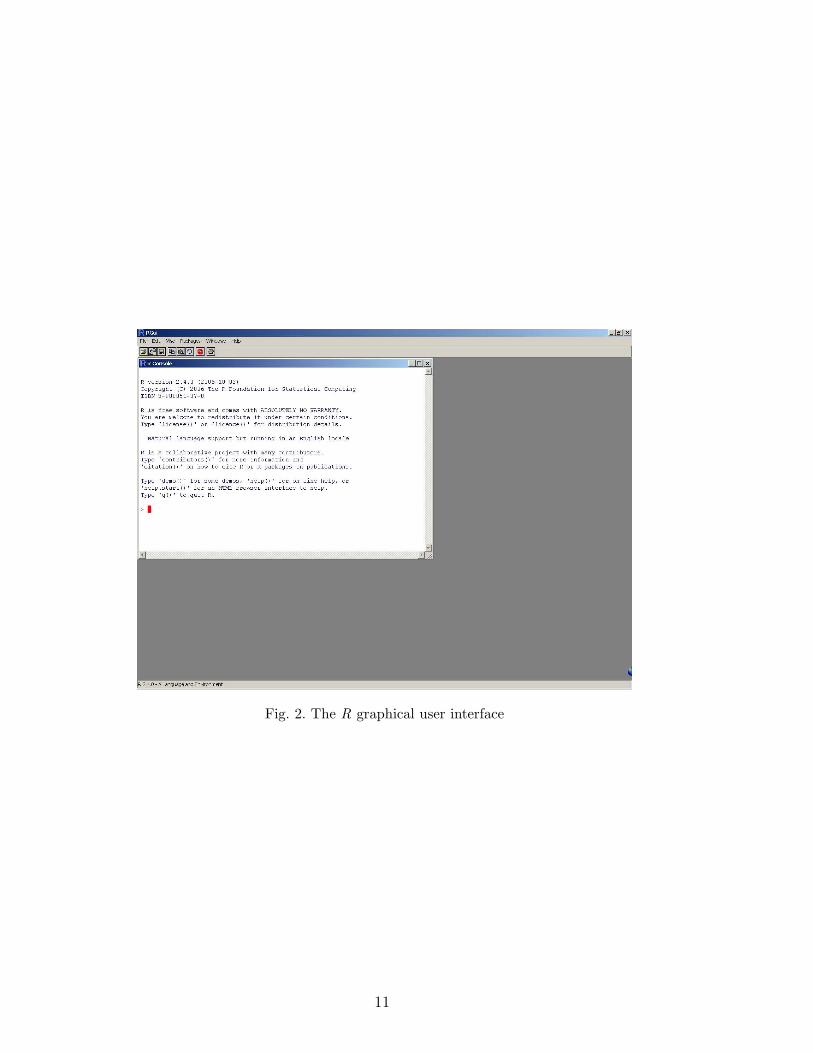
Fig. 2. The R graphical user interface
11
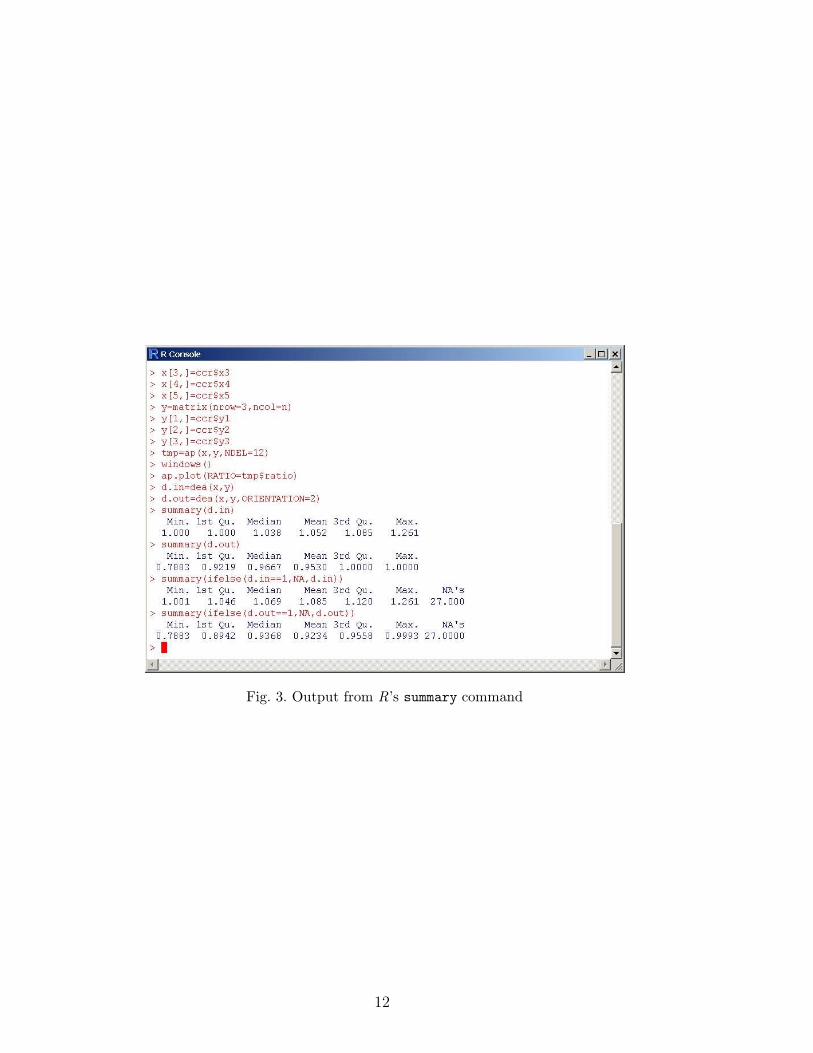
Fig. 3. Output from R’s summary command
12

Fig. 4. Plots produced by the ap.plot command
13

Fig. 5. Kernel density plots produced by the show.dens command
14