fdic quarterly fourth quarter 2010€¦ · financial reporting in 2010. 1. the new accounting rules...
TRANSCRIPT

FDIC Quarterly
Quarterly Banking Profile:Fourth Quarter 2010
Microenterprise Development: A Primer
2011, Volume 5, Number 1

Chairman Sheila C. Bair
Director, Division of Insurance Arthur J. Murton and Research
Executive Editors Rae-Ann Miller Maureen E. Sweeney
Managing Editors Richard A. Brown Diane L. Ellis Paul H. Kupiec Christopher J. Newbury
Editor Kathy Zeidler
Publication Manager Lynne Montgomery
Media Inquiries (202) 898-6993
The FDIC Quarterly is published by the Division of Insurance and Research of the Federal Deposit Insurance Corporation and contains a comprehensive summary of the most current financial results for the banking industry. Feature articles appearing in the FDIC Quarterly range from timely analysis of economic and banking trends at the national and regional level that may affect the risk exposure of FDIC-insured institutions to research on issues affecting the banking system and the development of regulatory policy.
Single copy subscriptions of the FDIC Quarterly can be obtained through the FDIC Public Informa-tion Center, 3501 Fairfax Drive, Room E-1002, Arlington, VA 22226. E-mail requests should be sent to [email protected]. Change of address information also should be submitted to the Public Information Center.
The FDIC Quarterly is available online by visiting the FDIC Web site at www.fdic.gov. To receive e-mail notification of the electronic release of the FDIC Quarterly and the individual feature articles,subscribe at www.fdic.gov/about/subscriptions/index.html.
2011, Volume 5, Number 1
FDIC Quarterly
The views expressed are those of the authors and do not necessarily reflect official positions of the Federal Deposit Insurance Corporation. Some of the information used in the preparation of this publication was obtained from publicly available sources that are considered reliable. However, the use of this information does not constitute an endorsement of its accuracy by the Federal Deposit Insurance Corporation. Articles may be reprinted or abstracted if the publication and author(s) are credited. Please provide the FDIC’s Division of Insurance and Research with a copy of any publications containing reprinted material.
Quarterly Banking Profile: Fourth Quarter 2010FDIC-insured institutions reported an aggregate profit of $21.7 billion in the fourth quarter of 2010, a $23.5 billion improvement from the $1.8 billion net loss the industry reported in the fourth quarter of 2009. This is the sixth consecutive quarter that earnings registered a year-over-year increase. Almost two-thirds of all institu-tions (62 percent) reported improvements in their quarterly net income from a year ago. The average return on assets (ROA) rose to 0.65 percent, from negative 0.06 percent a year ago. See page 1.
Insurance Fund IndicatorsEstimated insured deposits (based on $250,000 coverage) increased by 14.7 percent during the fourth quarter of 2010. The Deposit Insurance Fund reserve ratio was -0.12 percent on December 31, 2010, up from -0.15 percent on September 30, 2010, and -0.39 percent one year earlier. Thirty FDIC-insured institutions failed during the quarter. See page 15.
Temporary Liquidity Guarantee ProgramAs of December 31, 2010, approximately $114 billion in non-interest-bearing transaction accounts was guaranteed under the Transaction Account Guarantee Program, and $267 billion in senior unsecured debt, issued by 66 entities and guaranteed under the Debt Guarantee Program, was outstanding. Both TLGP programs have ended. All noninterest-bearing transaction deposit accounts are temporarily insured under the Dodd-Frank Wall Street Reform and Consumer Protection Act. See page 21.
Microenterprise Development: A Primer This article begins with a background on small busi nesses, small business lending, and the challenges small companies face in the current economic environment. It then focuses on the poverty alleviation aspect of entrepreneurship through microenterprise development—helping a segment of underserved small business owners create or expand their business. The article describes the scope of microenterprise development and the benefits to small business owners and their communities and includes case studies of organizations that participate in microenterprise development activities. It also describes the benefits to banks that participate in these activities. See page 33.

FDIC Quarterly 1 2011, Volume 5, No. 1
Quarterly Banking Profile Fourth Quarter 2010
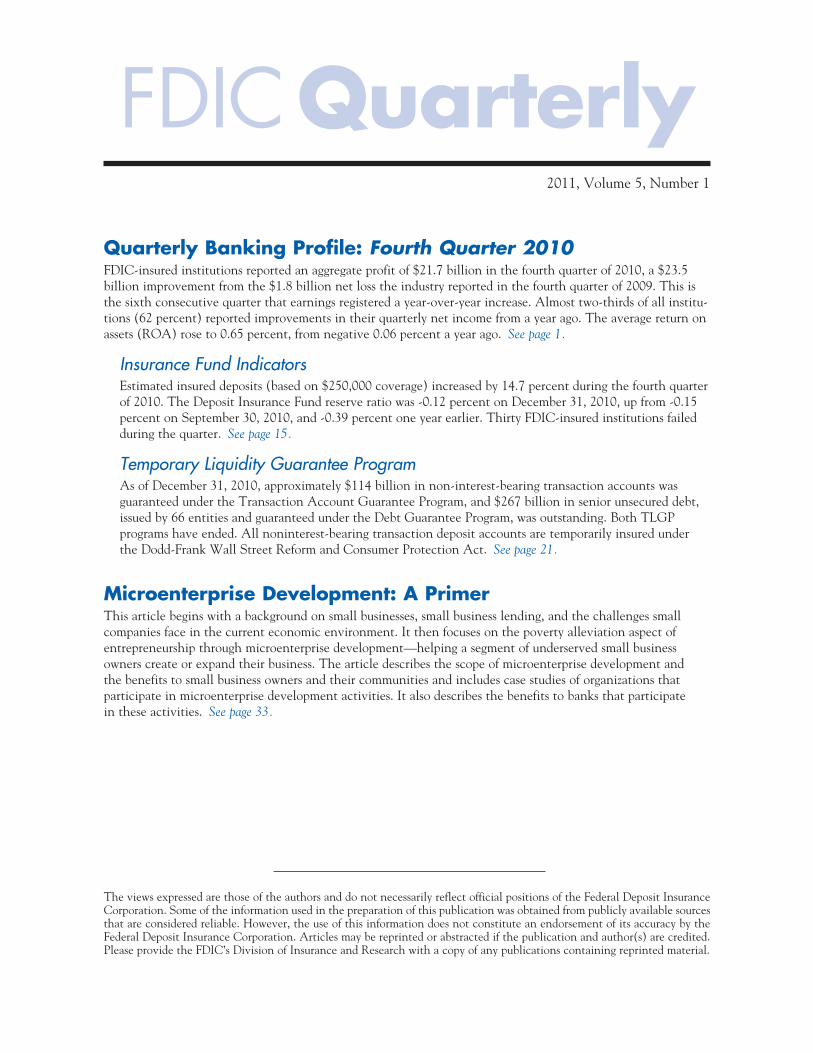
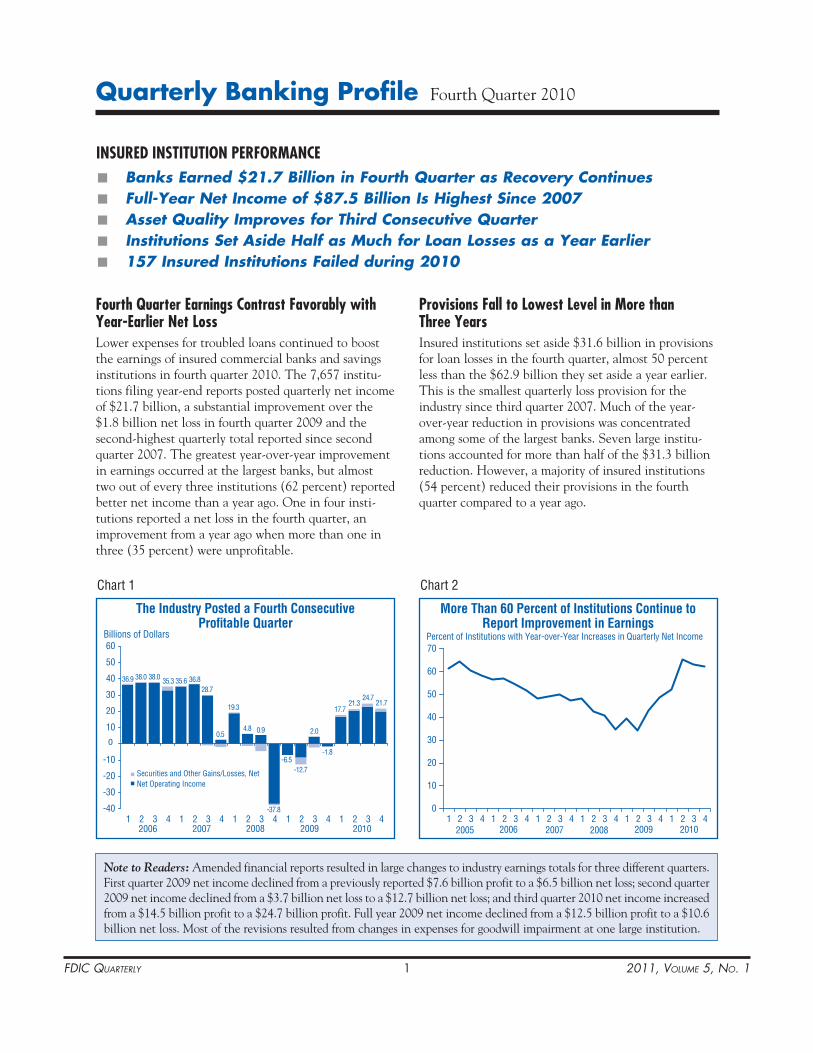
Fourth Quarter Earnings Contrast Favorably with Year-Earlier Net LossLower expenses for troubled loans continued to boost the earnings of insured commercial banks and savings institutions in fourth quarter 2010. The 7,657 institu-tions filing year-end reports posted quarterly net income of $21.7 billion, a substantial improvement over the $1.8 billion net loss in fourth quarter 2009 and the second-highest quarterly total reported since second quarter 2007. The greatest year-over-year improvement in earnings occurred at the largest banks, but almost two out of every three institutions (62 percent) reported better net income than a year ago. One in four insti-tutions reported a net loss in the fourth quarter, an improvement from a year ago when more than one in three (35 percent) were unprofitable.
Provisions Fall to Lowest Level in More than Three YearsInsured institutions set aside $31.6 billion in provisions for loan losses in the fourth quarter, almost 50 percent less than the $62.9 billion they set aside a year earlier. This is the smallest quarterly loss provision for the industry since third quarter 2007. Much of the year-over-year reduction in provisions was concentrated among some of the largest banks. Seven large institu-tions accounted for more than half of the $31.3 billion reduction. However, a majority of insured institutions (54 percent) reduced their provisions in the fourth quarter compared to a year ago.
■ Banks Earned $21.7 Billion in Fourth Quarter as Recovery Continues■ Full-Year Net Income of $87.5 Billion Is Highest Since 2007■ Asset Quality Improves for Third Consecutive Quarter■ Institutions Set Aside Half as Much for Loan Losses as a Year Earlier■ 157 Insured Institutions Failed during 2010
INSURED INSTITUTION PERFORMANCE
The Industry Posted a Fourth ConsecutivePro�table Quarter
Billions of Dollars
-40
-30
-20
-10
0
10
20
30
40
50
60
1 2 3 4 1 2 3 4 1 2 3 4 1 2 3 4 1 2 3 4
Securities and Other Gains/Losses, NetNet Operating Income
36.9 38.0 38.0 35.3 35.6 36.828.7
0.5
19.3
4.8 0.9
-37.8
-6.5-12.7
2006 2007 2008 2009
2.0
-1.8
2010
17.721.3
24.721.7
Chart 1 Chart 2
0
10
20
30
40
50
60
70
1 2 3 4 1 2 3 4 1 2 3 4 1 2 3 4 1 2 3 4 1 2 3 4
More Than 60 Percent of Institutions Continue toReport Improvement in Earnings
Percent of Institutions with Year-over-Year Increases in Quarterly Net Income
2005 2006 2007 2008 2009 2010
Note to Readers: Amended financial reports resulted in large changes to industry earnings totals for three different quarters. First quarter 2009 net income declined from a previously reported $7.6 billion profit to a $6.5 billion net loss; second quarter 2009 net income declined from a $3.7 billion net loss to a $12.7 billion net loss; and third quarter 2010 net income increased from a $14.5 billion profit to a $24.7 billion profit. Full year 2009 net income declined from a $12.5 billion profit to a $10.6 billion net loss. Most of the revisions resulted from changes in expenses for goodwill impairment at one large institution.
FDIC Quarterly 2 2011, Volume 5, No. 1
Chart 4
3.81
3.70
2.5
3.0
3.5
4.0
4.5
1 2 3 4 1 2 3 4 1 2 3 4 1 2 3 4 1 2 3 4 1 2 3 4
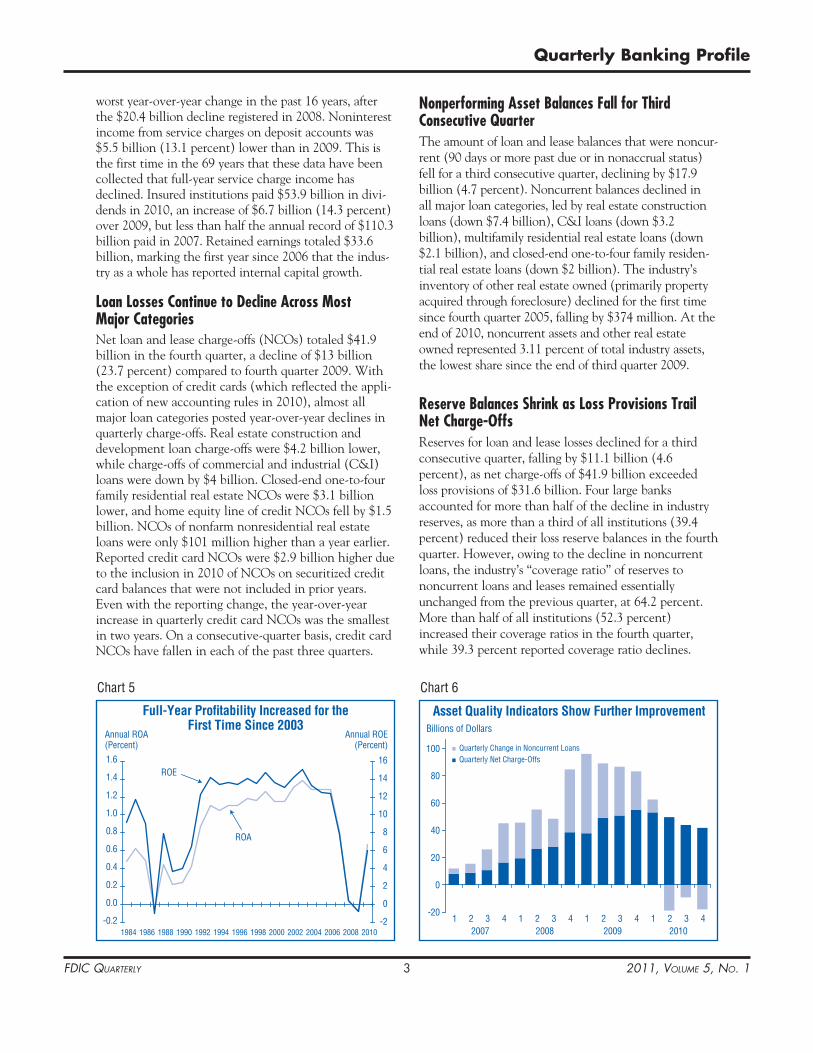
Margins Shrank Slightly in the Fourth QuarterQuarterly Net Interest Margin(Percent)
2005 2006 2007 2008 2009 2010
Assets > $1 Billion
Assets < $1 Billion
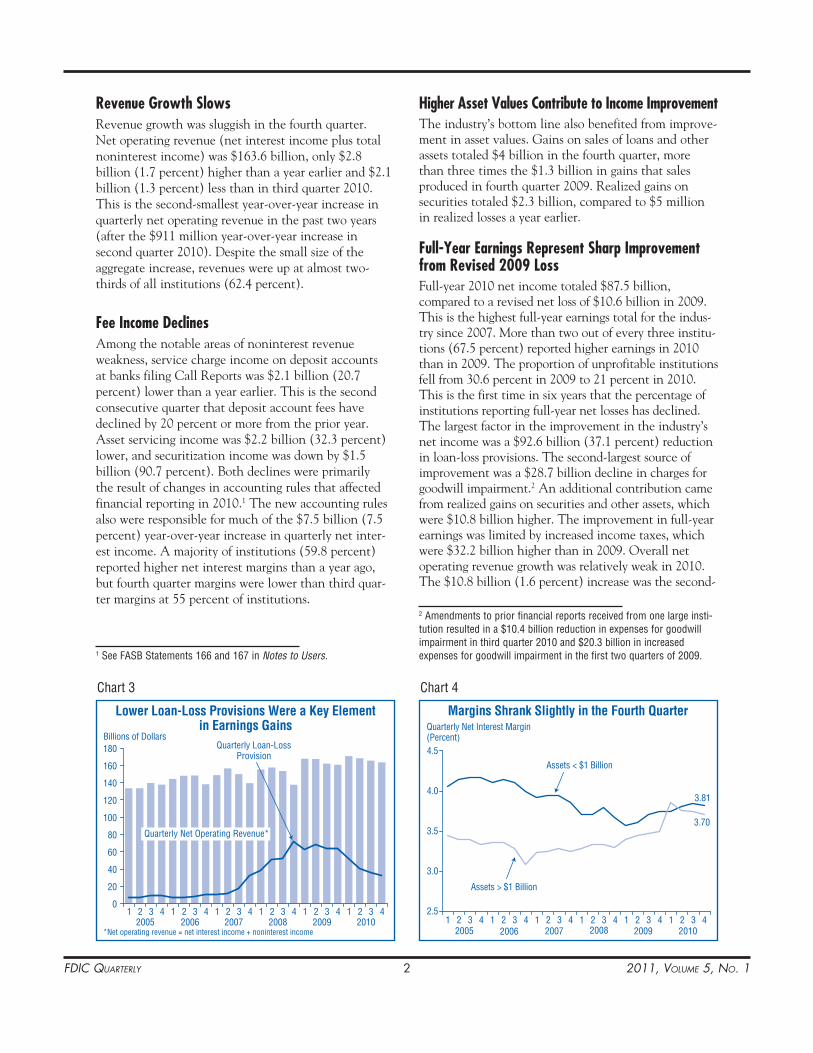
Revenue Growth SlowsRevenue growth was sluggish in the fourth quarter. Net operating revenue (net interest income plus total noninterest income) was $163.6 billion, only $2.8 billion (1.7 percent) higher than a year earlier and $2.1 billion (1.3 percent) less than in third quarter 2010. This is the second-smallest year-over-year increase in quarterly net operating revenue in the past two years (after the $911 million year-over-year increase in second quarter 2010). Despite the small size of the aggregate increase, revenues were up at almost two-thirds of all institutions (62.4 percent).
Fee Income DeclinesAmong the notable areas of noninterest revenue weakness, service charge income on deposit accounts at banks filing Call Reports was $2.1 billion (20.7 percent) lower than a year earlier. This is the second consecutive quarter that deposit account fees have declined by 20 percent or more from the prior year. Asset servicing income was $2.2 billion (32.3 percent) lower, and securitization income was down by $1.5 billion (90.7 percent). Both declines were primarily the result of changes in accounting rules that affected financial reporting in 2010.1 The new accounting rules also were responsible for much of the $7.5 billion (7.5 percent) year-over-year increase in quarterly net inter-est income. A majority of institutions (59.8 percent) reported higher net interest margins than a year ago, but fourth quarter margins were lower than third quar-ter margins at 55 percent of institutions.
1 See FASB Statements 166 and 167 in Notes to Users.
Higher Asset Values Contribute to Income ImprovementThe industry’s bottom line also benefited from improve-ment in asset values. Gains on sales of loans and other assets totaled $4 billion in the fourth quarter, more than three times the $1.3 billion in gains that sales produced in fourth quarter 2009. Realized gains on securities totaled $2.3 billion, compared to $5 million in realized losses a year earlier.
Full-Year Earnings Represent Sharp Improvement from Revised 2009 LossFull-year 2010 net income totaled $87.5 billion, compared to a revised net loss of $10.6 billion in 2009. This is the highest full-year earnings total for the indus-try since 2007. More than two out of every three institu-tions (67.5 percent) reported higher earnings in 2010 than in 2009. The proportion of unprofitable institutions fell from 30.6 percent in 2009 to 21 percent in 2010. This is the first time in six years that the percentage of institutions reporting full-year net losses has declined. The largest factor in the improvement in the industry’s net income was a $92.6 billion (37.1 percent) reduction in loan-loss provisions. The second-largest source of improvement was a $28.7 billion decline in charges for goodwill impairment.2 An additional contribution came from realized gains on securities and other assets, which were $10.8 billion higher. The improvement in full-year earnings was limited by increased income taxes, which were $32.2 billion higher than in 2009. Overall net operating revenue growth was relatively weak in 2010. The $10.8 billion (1.6 percent) increase was the second-
2 Amendments to prior financial reports received from one large insti-tution resulted in a $10.4 billion reduction in expenses for goodwill impairment in third quarter 2010 and $20.3 billion in increased expenses for goodwill impairment in the first two quarters of 2009.
Chart 3
Lower Loan-Loss Provisions Were a Key Elementin Earnings Gains
Billions of Dollars
0
20
40
60
80
100
120
140
160
180
1 2 3 4 1 2 3 4 1 2 3 4 1 2 3 4 1 2 3 4 1 2 3 42005 2006 2007 2008 2009 2010
*Net operating revenue = net interest income + noninterest income
Quarterly Net Operating Revenue*
Quarterly Loan-LossProvision
FDIC Quarterly 3 2011, Volume 5, No. 1
Quarterly Banking Profile
Nonperforming Asset Balances Fall for Third Consecutive QuarterThe amount of loan and lease balances that were noncur-rent (90 days or more past due or in nonaccrual status) fell for a third consecutive quarter, declining by $17.9 billion (4.7 percent). Noncurrent balances declined in all major loan categories, led by real estate construction loans (down $7.4 billion), C&I loans (down $3.2 billion), multifamily residential real estate loans (down $2.1 billion), and closed-end one-to-four family residen-tial real estate loans (down $2 billion). The industry’s inventory of other real estate owned (primarily property acquired through foreclosure) declined for the first time since fourth quarter 2005, falling by $374 million. At the end of 2010, noncurrent assets and other real estate owned represented 3.11 percent of total industry assets, the lowest share since the end of third quarter 2009.
Reserve Balances Shrink as Loss Provisions Trail Net Charge-OffsReserves for loan and lease losses declined for a third consecutive quarter, falling by $11.1 billion (4.6 percent), as net charge-offs of $41.9 billion exceeded loss provisions of $31.6 billion. Four large banks accounted for more than half of the decline in industry reserves, as more than a third of all institutions (39.4 percent) reduced their loss reserve balances in the fourth quarter. However, owing to the decline in noncurrent loans, the industry’s “coverage ratio” of reserves to noncurrent loans and leases remained essentially unchanged from the previous quarter, at 64.2 percent. More than half of all institutions (52.3 percent) increased their coverage ratios in the fourth quarter, while 39.3 percent reported coverage ratio declines.
worst year-over-year change in the past 16 years, after the $20.4 billion decline registered in 2008. Noninterest income from service charges on deposit accounts was $5.5 billion (13.1 percent) lower than in 2009. This is the first time in the 69 years that these data have been collected that full-year service charge income has declined. Insured institutions paid $53.9 billion in divi-dends in 2010, an increase of $6.7 billion (14.3 percent) over 2009, but less than half the annual record of $110.3 billion paid in 2007. Retained earnings totaled $33.6 billion, marking the first year since 2006 that the indus-try as a whole has reported internal capital growth.
Loan Losses Continue to Decline Across Most Major CategoriesNet loan and lease charge-offs (NCOs) totaled $41.9 billion in the fourth quarter, a decline of $13 billion (23.7 percent) compared to fourth quarter 2009. With the exception of credit cards (which reflected the appli-cation of new accounting rules in 2010), almost all major loan categories posted year-over-year declines in quarterly charge-offs. Real estate construction and development loan charge-offs were $4.2 billion lower, while charge-offs of commercial and industrial (C&I) loans were down by $4 billion. Closed-end one-to-four family residential real estate NCOs were $3.1 billion lower, and home equity line of credit NCOs fell by $1.5 billion. NCOs of nonfarm nonresidential real estate loans were only $101 million higher than a year earlier. Reported credit card NCOs were $2.9 billion higher due to the inclusion in 2010 of NCOs on securitized credit card balances that were not included in prior years. Even with the reporting change, the year-over-year increase in quarterly credit card NCOs was the smallest in two years. On a consecutive-quarter basis, credit card NCOs have fallen in each of the past three quarters.
Chart 5
-0.2
0.0
0.2
0.4
0.6
0.8
1.0
1.2
1.4
1.6
1984 1986 1988 1990 1992 1994 1996 1998 2000 2002 2004 2006 2008 2010-2
0
2
4
6
8
10
12
14
16
Annual ROE (Percent)
Full-Year Profitability Increased for theFirst Time Since 2003
Annual ROA(Percent)
ROE
ROA
Chart 6
Asset Quality Indicators Show Further ImprovementBillions of Dollars
Quarterly Change in Noncurrent LoansQuarterly Net Charge-Offs
-20
0
20
40
60
80
100
1 2 3 4 1 2 3 4 1 2 3 4 1 2 3 42007 2008 2009 2010
FDIC Quarterly 4 2011, Volume 5, No. 1
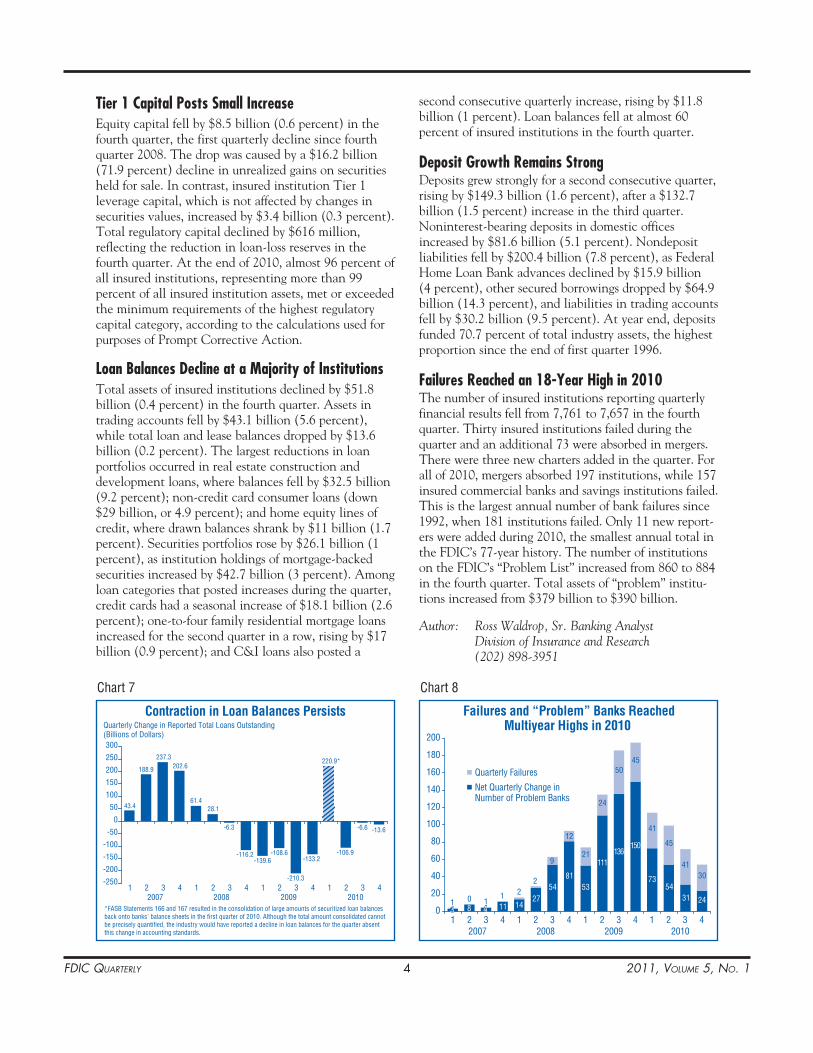
second consecutive quarterly increase, rising by $11.8 billion (1 percent). Loan balances fell at almost 60 percent of insured institutions in the fourth quarter.
Deposit Growth Remains StrongDeposits grew strongly for a second consecutive quarter, rising by $149.3 billion (1.6 percent), after a $132.7 billion (1.5 percent) increase in the third quarter. Noninterest-bearing deposits in domestic offices increased by $81.6 billion (5.1 percent). Nondeposit liabilities fell by $200.4 billion (7.8 percent), as Federal Home Loan Bank advances declined by $15.9 billion (4 percent), other secured borrowings dropped by $64.9 billion (14.3 percent), and liabilities in trading accounts fell by $30.2 billion (9.5 percent). At year end, deposits funded 70.7 percent of total industry assets, the highest proportion since the end of first quarter 1996.
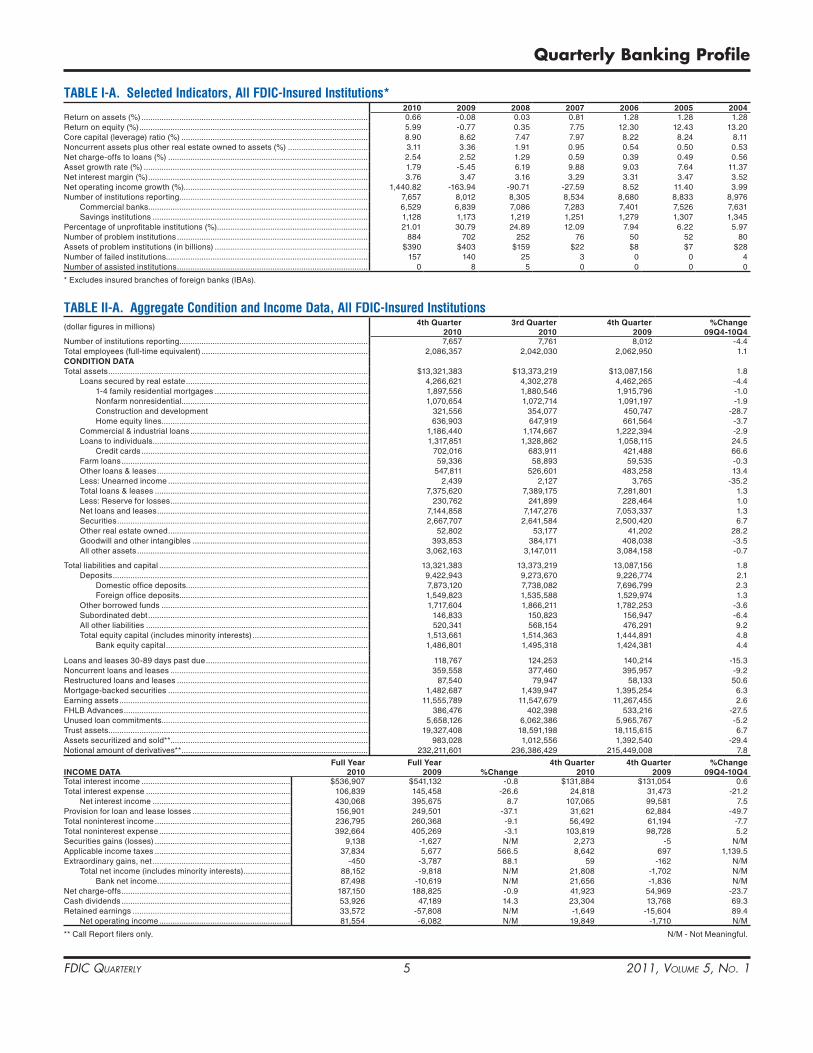
Failures Reached an 18-Year High in 2010The number of insured institutions reporting quarterly financial results fell from 7,761 to 7,657 in the fourth quarter. Thirty insured institutions failed during the quarter and an additional 73 were absorbed in mergers. There were three new charters added in the quarter. For all of 2010, mergers absorbed 197 institutions, while 157 insured commercial banks and savings institutions failed. This is the largest annual number of bank failures since 1992, when 181 institutions failed. Only 11 new report-ers were added during 2010, the smallest annual total in the FDIC’s 77-year history. The number of institutions on the FDIC’s “Problem List” increased from 860 to 884 in the fourth quarter. Total assets of “problem” institu-tions increased from $379 billion to $390 billion.
Author: Ross Waldrop, Sr. Banking Analyst Division of Insurance and Research (202) 898-3951
Tier 1 Capital Posts Small IncreaseEquity capital fell by $8.5 billion (0.6 percent) in the fourth quarter, the first quarterly decline since fourth quarter 2008. The drop was caused by a $16.2 billion (71.9 percent) decline in unrealized gains on securities held for sale. In contrast, insured institution Tier 1 leverage capital, which is not affected by changes in securities values, increased by $3.4 billion (0.3 percent). Total regulatory capital declined by $616 million, reflecting the reduction in loan-loss reserves in the fourth quarter. At the end of 2010, almost 96 percent of all insured institutions, representing more than 99 percent of all insured institution assets, met or exceeded the minimum requirements of the highest regulatory capital category, according to the calculations used for purposes of Prompt Corrective Action.
Loan Balances Decline at a Majority of InstitutionsTotal assets of insured institutions declined by $51.8 billion (0.4 percent) in the fourth quarter. Assets in trading accounts fell by $43.1 billion (5.6 percent), while total loan and lease balances dropped by $13.6 billion (0.2 percent). The largest reductions in loan portfolios occurred in real estate construction and development loans, where balances fell by $32.5 billion (9.2 percent); non-credit card consumer loans (down $29 billion, or 4.9 percent); and home equity lines of credit, where drawn balances shrank by $11 billion (1.7 percent). Securities portfolios rose by $26.1 billion (1 percent), as institution holdings of mortgage-backed securities increased by $42.7 billion (3 percent). Among loan categories that posted increases during the quarter, credit cards had a seasonal increase of $18.1 billion (2.6 percent); one-to-four family residential mortgage loans increased for the second quarter in a row, rising by $17 billion (0.9 percent); and C&I loans also posted a
Chart 7
Contraction in Loan Balances Persists
43.4
188.9
237.3202.6
61.428.1
-6.3
-116.2-139.6
-108.6
-210.3
-133.2-106.9
-6.6 -13.6
220.9*
-250
-200
-150
-100
-50
0
50
100
150
200
250
300
1 2 3 4 1 2 3 4 1 2 3 4 1 2 3 4
Quarterly Change in Reported Total Loans Outstanding(Billions of Dollars)
2007 2008 2009 2010*FASB Statements 166 and 167 resulted in the consolidation of large amounts of securitized loan balances back onto banks' balance sheets in the first quarter of 2010. Although the total amount consolidated cannot be precisely quantified, the industry would have reported a decline in loan balances for the quarter absent this change in accounting standards.
Chart 8
Failures and “Problem” Banks ReachedMultiyear Highs in 2010
33 8 11 1427
5481
53
111136
150
7354
31 24
9
12
21
24
5045
41
45
4130
441 0 1
1 22
0
20
40
60
80
100
120
140
160
180
200
1 2 3 4 1 2 3 4 1 2 3 4 1 2 3 42007 2008 2009 2010
Quarterly Failures
Net Quarterly Change in Number of Problem Banks
FDIC Quarterly 5 2011, Volume 5, No. 1
Quarterly Banking Profile
TABLE I-A. Selected Indicators, All FDIC-Insured Institutions*2010 2009 2008 2007 2006 2005 2004
Return on assets (%) ������������������������������������������������������������������������������������������������������ 0�66 -0�08 0�03 0�81 1�28 1�28 1�28Return on equity (%) ������������������������������������������������������������������������������������������������������� 5�99 -0�77 0�35 7�75 12�30 12�43 13�20Core capital (leverage) ratio (%) ������������������������������������������������������������������������������������ 8�90 8�62 7�47 7�97 8�22 8�24 8�11Noncurrent assets plus other real estate owned to assets (%) ������������������������������������ 3�11 3�36 1�91 0�95 0�54 0�50 0�53Net charge-offs to loans (%) ������������������������������������������������������������������������������������������ 2�54 2�52 1�29 0�59 0�39 0�49 0�56Asset growth rate (%) ����������������������������������������������������������������������������������������������������� 1�79 -5�45 6�19 9�88 9�03 7�64 11�37Net interest margin (%) ��������������������������������������������������������������������������������������������������� 3�76 3�47 3�16 3�29 3�31 3�47 3�52Net operating income growth (%)����������������������������������������������������������������������������������� 1,440�82 -163�94 -90�71 -27�59 8�52 11�40 3�99Number of institutions reporting ������������������������������������������������������������������������������������� 7,657 8,012 8,305 8,534 8,680 8,833 8,976 Commercial banks ��������������������������������������������������������������������������������������������������� 6,529 6,839 7,086 7,283 7,401 7,526 7,631 Savings institutions ������������������������������������������������������������������������������������������������� 1,128 1,173 1,219 1,251 1,279 1,307 1,345Percentage of unprofitable institutions (%) �������������������������������������������������������������������� 21�01 30�79 24�89 12�09 7�94 6�22 5�97Number of problem institutions �������������������������������������������������������������������������������������� 884 702 252 76 50 52 80Assets of problem institutions (in billions) ��������������������������������������������������������������������� $390 $403 $159 $22 $8 $7 $28Number of failed institutions������������������������������������������������������������������������������������������� 157 140 25 3 0 0 4Number of assisted institutions �������������������������������������������������������������������������������������� 0 8 5 0 0 0 0
* Excludes insured branches of foreign banks (IBAs)�
TABLE II-A. Aggregate Condition and Income Data, All FDIC-Insured Institutions(dollar figures in millions) 4th Quarter
20103rd Quarter
20104th Quarter
2009%Change
09Q4-10Q4Number of institutions reporting ������������������������������������������������������������������������������������� 7,657 7,761 8,012 -4�4Total employees (full-time equivalent) ��������������������������������������������������������������������������� 2,086,357 2,042,030 2,062,950 1�1CONDITION DATATotal assets ��������������������������������������������������������������������������������������������������������������������� $13,321,383 $13,373,219 $13,087,156 1�8 Loans secured by real estate ���������������������������������������������������������������������������������� 4,266,621 4,302,278 4,462,265 -4�4 1-4 family residential mortgages ��������������������������������������������������������������������� 1,897,556 1,880,546 1,915,796 -1�0 Nonfarm nonresidential������������������������������������������������������������������������������������ 1,070,654 1,072,714 1,091,197 -1�9 Construction and development 321,556 354,077 450,747 -28�7 Home equity lines ��������������������������������������������������������������������������������������������� 636,903 647,919 661,564 -3�7 Commercial & industrial loans �������������������������������������������������������������������������������� 1,186,440 1,174,667 1,222,394 -2�9 Loans to individuals ������������������������������������������������������������������������������������������������� 1,317,851 1,328,862 1,058,115 24�5 Credit cards ������������������������������������������������������������������������������������������������������ 702,016 683,911 421,488 66�6 Farm loans ��������������������������������������������������������������������������������������������������������������� 59,336 58,893 59,535 -0�3 Other loans & leases ����������������������������������������������������������������������������������������������� 547,811 526,601 483,258 13�4 Less: Unearned income ������������������������������������������������������������������������������������������ 2,439 2,127 3,765 -35�2 Total loans & leases ������������������������������������������������������������������������������������������������ 7,375,620 7,389,175 7,281,801 1�3 Less: Reserve for losses ����������������������������������������������������������������������������������������� 230,762 241,899 228,464 1�0 Net loans and leases ����������������������������������������������������������������������������������������������� 7,144,858 7,147,276 7,053,337 1�3 Securities ����������������������������������������������������������������������������������������������������������������� 2,667,707 2,641,584 2,500,420 6�7 Other real estate owned ������������������������������������������������������������������������������������������ 52,802 53,177 41,202 28�2 Goodwill and other intangibles ������������������������������������������������������������������������������� 393,853 384,171 408,038 -3�5 All other assets �������������������������������������������������������������������������������������������������������� 3,062,163 3,147,011 3,084,158 -0�7
Total liabilities and capital ���������������������������������������������������������������������������������������������� 13,321,383 13,373,219 13,087,156 1�8 Deposits ������������������������������������������������������������������������������������������������������������������� 9,422,943 9,273,670 9,226,774 2�1 Domestic office deposits���������������������������������������������������������������������������������� 7,873,120 7,738,082 7,696,799 2�3 Foreign office deposits������������������������������������������������������������������������������������� 1,549,823 1,535,588 1,529,974 1�3 Other borrowed funds ��������������������������������������������������������������������������������������������� 1,717,604 1,866,211 1,782,253 -3�6 Subordinated debt ��������������������������������������������������������������������������������������������������� 146,833 150,823 156,947 -6�4 All other liabilities ���������������������������������������������������������������������������������������������������� 520,341 568,154 476,291 9�2 Total equity capital (includes minority interests) ���������������������������������������������������� 1,513,661 1,514,363 1,444,891 4�8 Bank equity capital ������������������������������������������������������������������������������������������� 1,486,801 1,495,318 1,424,381 4�4
Loans and leases 30-89 days past due ������������������������������������������������������������������������� 118,767 124,253 140,214 -15�3Noncurrent loans and leases ����������������������������������������������������������������������������������������� 359,558 377,460 395,957 -9�2Restructured loans and leases �������������������������������������������������������������������������������������� 87,540 79,947 58,133 50�6Mortgage-backed securities ������������������������������������������������������������������������������������������ 1,482,687 1,439,947 1,395,254 6�3Earning assets ���������������������������������������������������������������������������������������������������������������� 11,555,789 11,547,679 11,267,455 2�6FHLB Advances �������������������������������������������������������������������������������������������������������������� 386,476 402,398 533,216 -27�5Unused loan commitments ��������������������������������������������������������������������������������������������� 5,658,126 6,062,386 5,965,767 -5�2Trust assets��������������������������������������������������������������������������������������������������������������������� 19,327,408 18,591,198 18,115,615 6�7Assets securitized and sold**����������������������������������������������������������������������������������������� 983,028 1,012,556 1,392,540 -29�4Notional amount of derivatives** ������������������������������������������������������������������������������������ 232,211,601 236,386,429 215,449,008 7�8
INCOME DATAFull Year
2010Full Year
2009 %Change4th Quarter
20104th Quarter
2009%Change
09Q4-10Q4Total interest income ������������������������������������������������������������������� $536,907 $541,132 -0�8 $131,884 $131,054 0�6Total interest expense ����������������������������������������������������������������� 106,839 145,458 -26�6 24,818 31,473 -21�2 Net interest income �������������������������������������������������������������� 430,068 395,675 8�7 107,065 99,581 7�5Provision for loan and lease losses �������������������������������������������� 156,901 249,501 -37�1 31,621 62,884 -49�7Total noninterest income ������������������������������������������������������������� 236,795 260,368 -9�1 56,492 61,194 -7�7Total noninterest expense ����������������������������������������������������������� 392,664 405,269 -3�1 103,819 98,728 5�2Securities gains (losses) ������������������������������������������������������������� 9,138 -1,627 N/M 2,273 -5 N/MApplicable income taxes ������������������������������������������������������������� 37,834 5,677 566�5 8,642 697 1,139�5Extraordinary gains, net �������������������������������������������������������������� -450 -3,787 88�1 59 -162 N/M Total net income (includes minority interests) ��������������������� 88,152 -9,818 N/M 21,808 -1,702 N/M Bank net income ������������������������������������������������������������ 87,498 -10,619 N/M 21,656 -1,836 N/MNet charge-offs ���������������������������������������������������������������������������� 187,150 188,825 -0�9 41,923 54,969 -23�7Cash dividends ���������������������������������������������������������������������������� 53,926 47,189 14�3 23,304 13,768 69�3Retained earnings ����������������������������������������������������������������������� 33,572 -57,808 N/M -1,649 -15,604 89�4 Net operating income ����������������������������������������������������������� 81,554 -6,082 N/M 19,849 -1,710 N/M
** Call Report filers only� N/M - Not Meaningful�
FDIC Quarterly 6 2011, Volume 5, No. 1
TABLE III-A. Full Year 2010, All FDIC-Insured InstitutionsAsset Concentration Groups*
Full YEAr (The way it is...)
All Insured Institutions
Credit Card
BanksInternational
BanksAgricultural
BanksCommercial
lendersMortgage lenders
Consumer lenders
Other Specialized <$1 Billion
All Other <$1 Billion
All Other >$1 Billion
Number of institutions reporting ����������������������� 7,657 22 4 1,559 4,087 716 73 315 813 68 Commercial banks ������������������������������������� 6,529 18 4 1,555 3,640 182 59 287 730 54 Savings institutions ����������������������������������� 1,128 4 0 4 447 534 14 28 83 14Total assets (in billions) ������������������������������������ $13,321�4 $705�2 $3,038�1 $199�9 $4,098�8 $788�9 $114�4 $43�1 $132�3 $4,200�8 Commercial banks ������������������������������������� 12,067�6 677�8 3,038�1 199�3 3,632�2 235�3 49�7 37�5 109�3 4,088�4 Savings institutions ����������������������������������� 1,253�8 27�4 0�0 0�5 466�6 553�6 64�7 5�6 23�0 112�5Total deposits (in billions) ��������������������������������� 9,422�9 297�2 2,009�5 165�9 3,147�8 543�9 91�1 33�6 110�3 3,023�7 Commercial banks ������������������������������������� 8,514�3 281�4 2,009�5 165�5 2,822�3 132�2 38�2 29�5 91�8 2,943�9 Savings institutions ����������������������������������� 908�7 15�8 0�0 0�4 325�5 411�7 52�9 4�1 18�5 79�8Bank net income (in millions) ��������������������������� 87,498 12,041 21,828 1,920 10,077 5,332 1,430 623 936 33,311 Commercial banks ������������������������������������� 79,166 10,940 21,828 1,917 7,599 2,702 923 363 989 31,905 Savings institutions ����������������������������������� 8,332 1,101 0 3 2,478 2,629 508 259 -53 1,406 Performance ratios (%)Yield on earning assets ������������������������������������ 4�70 13�57 3�42 5�22 4�89 4�36 5�80 3�79 4�98 3�96Cost of funding earning assets ������������������������ 0�93 1�48 0�71 1�30 1�13 1�34 1�37 0�98 1�24 0�67 Net interest margin ������������������������������������ 3�76 12�09 2�71 3�93 3�76 3�02 4�43 2�81 3�73 3�28Noninterest income to assets ��������������������������� 1�79 2�98 2�00 0�65 1�28 0�76 1�88 6�64 1�03 2�18Noninterest expense to assets ������������������������� 2�97 4�63 2�82 2�69 3�05 1�78 2�78 7�23 3�26 2�92Loan and lease loss provision to assets ���������� 1�19 6�32 0�62 0�46 1�23 0�75 1�29 0�22 0�38 0�88Net operating income to assets ����������������������� 0�62 1�76 0�64 0�97 0�19 0�67 1�28 1�28 0�69 0�79Pretax return on assets ������������������������������������ 0�95 2�73 0�95 1�13 0�39 1�08 2�01 1�94 0�86 1�14Return on assets ����������������������������������������������� 0�66 1�81 0�72 0�99 0�25 0�69 1�28 1�48 0�72 0�80Return on equity ����������������������������������������������� 5�99 11�81 8�08 8�92 2�18 6�97 11�93 9�10 6�41 6�70Net charge-offs to loans and leases ���������������� 2�54 10�83 2�29 0�58 1�89 1�14 2�31 0�64 0�56 1�87Loan and lease loss provision to net charge-offs ������������������������������������������
83�84
69�06
75�96
122�11
95�62
109�93
74�31
124�35
118�94
91�43
Efficiency ratio �������������������������������������������������� 57�22 31�89 65�16 62�60 64�40 49�17 44�95 77�77 70�01 57�26% of unprofitable institutions ���������������������������� 21�01 9�09 0�00 6�67 30�49 15�64 5�48 14�29 11�07 8�82% of institutions with earnings gains ���������������� 67�52 100�00 75�00 66�07 68�46 72�49 83�56 50�48 64�82 75�00 Condition ratios (%)Earning assets to total assets �������������������������� 86�75 88�78 84�36 91�61 88�76 93�53 96�17 90�97 91�73 84�21Loss allowance to: Loans and leases �������������������������������������� 3�13 8�19 3�96 1�56 2�46 1�44 2�50 1�84 1�51 2�70 Noncurrent loans and leases �������������������� 64�18 372�36 62�79 85�19 56�78 33�65 173�47 87�79 68�61 43�73Noncurrent assets plus other real estate owned to assets ������������� 3�11 1�90 2�38 1�61 3�72 2�92 1�22 0�81 1�69 3�48Equity capital ratio �������������������������������������������� 11�16 14�96 8�93 10�87 11�44 10�06 11�02 16�32 11�04 12�04Core capital (leverage) ratio ���������������������������� 8�90 12�75 6�96 9�93 9�63 9�38 10�52 14�68 10�58 8�69Tier 1 risk-based capital ratio ��������������������������� 12�71 14�24 11�87 13�99 12�62 19�17 14�15 34�62 17�75 11�81Total risk-based capital ratio ���������������������������� 15�29 16�91 15�03 15�14 14�62 20�23 15�32 35�66 18�89 14�95Net loans and leases to deposits ��������������������� 75�82 188�43 50�17 74�86 86�26 84�64 92�75 33�84 65�80 69�73Net loans to total assets ���������������������������������� 53�63 79�42 33�18 62�15 66�25 58�35 73�86 26�41 54�85 50�19Domestic deposits to total assets �������������������� 59�10 37�92 33�27 83�03 75�38 68�85 79�51 76�71 83�37 60�98
Structural Changes New charters ��������������������������������������������� 11 0 0 0 6 1 0 2 0 2 Institutions absorbed by mergers ������������� 197 0 0 35 119 28 0 0 6 9 Failed institutions �������������������������������������� 157 0 0 3 143 6 1 1 2 1
PrIOr Full YEArS (The way it was...)
Number of institutions ����������������������������� 2009 8,012 23 4 1,568 4,453 766 83 289 770 56 ������������������������������������� 2007 8,534 27 5 1,592 4,773 784 109 373 815 56 ������������������������������������� 2005 8,833 33 4 1,685 4,617 886 125 425 995 63
Total assets (in billions) ��������������������������� 2009 $13,087�2 $501�6 $3,107�1 $182�0 $4,546�9 $810�1 $96�5 $38�1 $116�1 $3,688�8 ������������������������������������� 2007 13,033�9 479�2 2,784�4 157�5 4,619�0 1,328�1 94�9 37�8 110�4 3,422�7 ������������������������������������� 2005 10,879�3 359�1 1,851�2 142�3 4,257�3 1,647�2 117�3 47�7 128�7 2,328�5
Return on assets (%) ������������������������������� 2009 -0�08 -4�50 0�08 0�81 -0�42 0�65 0�33 0�74 0�80 0�51 ������������������������������������� 2007 0�81 3�35 0�58 1�20 0�83 0�03 1�26 2�56 1�03 0�88 ������������������������������������� 2005 1�28 2�90 0�86 1�27 1�36 1�07 1�55 2�18 1�09 1�34
Net charge-offs to loans & leases (%) ���� 2008 2�52 9�77 3�07 0�65 2�02 1�24 2�74 0�78 0�54 2�19 ������������������������������������� 2006 0�59 3�95 0�77 0�22 0�35 0�40 0�87 0�29 0�22 0�39 ������������������������������������� 2004 0�49 4�64 0�87 0�18 0�23 0�12 1�44 0�26 0�23 0�24
Noncurrent assets plus OREO to assets (%) ������������������������� 2009 3�36 2�40 2�75 1�55 3�87 3�17 1�45 0�69 1�34 3�66 ������������������������������������� 2007 0�95 1�54 0�68 0�83 1�10 1�52 1�64 0�23 0�65 0�68 ������������������������������������� 2005 0�50 1�32 0�46 0�61 0�48 0�56 0�51 0�24 0�54 0�39
Equity capital ratio (%)����������������������������� 2009 10�88 21�50 8�75 10�95 10�48 9�48 11�15 17�74 11�27 11�95 ������������������������������������� 2007 10�34 21�26 8�01 11�17 11�00 8�38 12�62 19�98 11�46 10�32 ������������������������������������� 2005 10�28 21�51 8�30 10�55 10�83 9�40 10�11 19�47 10�83 9�52
* See Table IV-A (page 8) for explanations�
FDIC Quarterly 7 2011, Volume 5, No. 1
Quarterly Banking Profile
TABLE III-A. Full Year 2010, All FDIC-Insured Institutions Asset Size Distribution Geographic regions*
Full YEAr (The way it is...)
All Insured Institutions
less than $100
Million
$100 Million to $1 Billion
$1 Billion to
$10 Billion
Greater than
$10 Billion New York Atlanta ChicagoKansas
City DallasSan
FranciscoNumber of institutions reporting ����������������������������� 7,657 2,622 4,368 560 107 948 1,022 1,602 1,825 1,601 659 Commercial banks ������������������������������������������� 6,529 2,325 3,694 424 86 492 905 1,320 1,728 1,484 600 Savings institutions ����������������������������������������� 1,128 297 674 136 21 456 117 282 97 117 59Total assets (in billions) ������������������������������������������ $13,321�4 $148�5 $1,291�7 $1,431�7 $10,449�5 $2,695�0 $2,930�6 $2,950�5 $1,686�4 $789�3 $2,269�5 Commercial banks ������������������������������������������� 12,067�6 131�9 1,058�6 1,090�4 9,786�6 2,027�0 2,807�3 2,825�2 1,635�6 694�9 2,077�7 Savings institutions ����������������������������������������� 1,253�8 16�5 233�1 341�3 662�9 667�9 123�4 125�3 50�8 94�4 191�8Total deposits (in billions) ��������������������������������������� 9,422�9 125�2 1,068�7 1,102�4 7,126�6 1,809�1 2,128�2 2,033�9 1,245�4 637�6 1,568�7 Commercial banks ������������������������������������������� 8,514�3 112�0 884�0 841�9 6,676�3 1,338�0 2,036�0 1,939�9 1,206�2 561�4 1,432�8 Savings institutions ����������������������������������������� 908�7 13�2 184�7 260�5 450�3 471�1 92�2 94�0 39�2 76�2 135�9Bank net income (in millions) ��������������������������������� 87,498 479 4,236 3,423 79,361 20,501 10,987 17,909 14,232 5,499 18,370 Commercial banks ������������������������������������������� 79,166 465 3,550 2,015 73,137 16,381 10,909 18,061 14,004 4,729 15,081 Savings institutions ����������������������������������������� 8,332 14 686 1,408 6,224 4,120 78 -152 227 769 3,289
Performance ratios (%)Yield on earning assets ������������������������������������������ 4�70 5�18 5�17 4�90 4�60 5�40 4�39 3�80 5�77 4�90 4�55Cost of funding earning assets ������������������������������ 0�93 1�30 1�38 1�24 0�82 1�12 0�88 0�79 0�82 1�00 1�03 Net interest margin ������������������������������������������ 3�76 3�89 3�79 3�65 3�77 4�28 3�51 3�01 4�95 3�91 3�52Noninterest income to assets ��������������������������������� 1�79 1�28 0�97 1�27 1�97 1�67 1�65 2�02 2�28 1�39 1�61Noninterest expense to assets ������������������������������� 2�97 3�90 3�21 2�95 2�93 2�86 2�91 3�03 3�51 3�19 2�62Loan and lease loss provision to assets ���������������� 1�19 0�53 0�82 1�16 1�24 1�42 1�23 0�88 1�77 0�85 0�93Net operating income to assets ����������������������������� 0�62 0�29 0�27 0�21 0�72 0�75 0�30 0�52 0�88 0�66 0�79Pretax return on assets ������������������������������������������ 0�95 0�42 0�47 0�50 1�08 1�13 0�56 0�83 1�27 0�92 1�16Return on assets ����������������������������������������������������� 0�66 0�33 0�33 0�24 0�77 0�77 0�37 0�61 0�86 0�70 0�81Return on equity ����������������������������������������������������� 5�99 2�72 3�23 2�17 6�87 6�23 3�26 6�92 7�43 6�65 7�00Net charge-offs to loans and leases ���������������������� 2�54 0�77 1�08 1�79 2�93 3�57 2�42 2�02 2�88 1�27 2�29Loan and lease loss provision to net charge-offs ������������������������������������������������
83�84
113�70
114�07
101�19
80�20
71�54
90�32
90�03
90�00
102�77
79�57
Efficiency ratio �������������������������������������������������������� 57�22 80�51 71�49 62�12 54�82 51�17 61�13 64�64 50�72 64�27 55�07% of unprofitable institutions ���������������������������������� 21�01 22�04 20�44 22�32 12�15 15�30 42�95 19�41 14�30 13�62 35�66% of institutions with earnings gains ���������������������� 67�52 62�97 69�55 71�07 77�57 75�63 64�38 68�60 66�58 62�59 72�69
Condition ratios (%)Earning assets to total assets ��������������������������������� 86�75 91�11 91�59 90�63 85�55 87�33 84�50 86�50 87�48 90�35 87�47Loss allowance to: Loans and leases ��������������������������������������������� 3�13 1�70 1�88 2�26 3�49 3�30 3�07 3�15 3�47 2�18 3�06 Noncurrent loans and leases ��������������������������� 64�18 65�13 52�74 50�44 67�33 93�53 50�67 57�57 64�54 58�92 71�87Noncurrent assets plus other real estate owned to assets �������������������� 3�11 2�37 3�43 3�62 3�02 2�14 3�93 2�98 4�25 3�14 2�54Equity capital ratio ��������������������������������������������������� 11�16 11�75 10�21 11�24 11�26 12�59 11�62 8�72 11�34 10�57 12�11Core capital (leverage) ratio ����������������������������������� 8�90 11�32 9�70 9�85 8�63 9�89 8�29 7�17 9�13 9�51 10�35Tier 1 risk-based capital ratio ���������������������������������� 12�71 17�77 14�16 14�47 12�24 14�42 11�51 10�71 11�29 13�63 15�89Total risk-based capital ratio ����������������������������������� 15�29 18�89 15�38 15�80 15�16 16�70 14�67 13�91 13�77 15�34 17�56Net loans and leases to deposits ���������������������������� 75�82 70�10 78�05 80�62 74�85 80�42 75�41 66�84 89�15 77�67 71�40Net loans to total assets ����������������������������������������� 53�63 59�11 64�58 62�08 51�05 53�99 54�76 46�08 65�84 62�74 49�35Domestic deposits to total assets ��������������������������� 59�10 84�33 82�66 76�44 53�45 59�39 63�90 54�42 67�97 80�30 44�68
Structural Changes New charters ��������������������������������������������������� 11 2 2 6 1 2 3 1 2 2 1 Institutions absorbed by mergers ������������������� 197 69 108 18 2 22 44 17 43 52 19 Failed institutions �������������������������������������������� 157 36 102 18 1 14 56 25 18 7 37
PrIOr Full YEArS (The way it was…)Number of institutions ����������������������������������� 2009 8,012 2,848 4,492 565 107 986 1,121 1,647 1,879 1,660 719 ��������������������������������������������2007 8,534 3,440 4,424 551 119 1,043 1,221 1,763 1,986 1,742 779 ��������������������������������������������2005 8,833 3,864 4,339 512 118 1,110 1,227 1,874 2,070 1,791 761
Total assets (in billions) ��������������������������������� 2009 $13,087�2 $158�9 $1,354�4 $1,461�6 $10,112�3 $2,567�4 $3,427�4 $2,934�4 $1,145�6 $784�9 $2,227�5 ��������������������������������������������2007 13,033�9 181�9 1,308�8 1,422�0 10,121�2 2,441�0 3,329�6 2,842�5 976�3 738�3 2,706�3 ��������������������������������������������2005 10,879�3 200�8 1,247�6 1,394�3 8,036�7 2,769�2 2,683�9 2,505�8 803�7 607�7 1,508�9
Return on assets (%) ������������������������������������� 2009 -0�08 -0�05 -0�10 -0�36 -0�04 -0�83 -0�01 0�18 0�77 0�35 -0�25 ��������������������������������������������2007 0�81 0�74 0�97 0�96 0�77 0�77 0�81 0�86 1�46 1�00 0�52 ��������������������������������������������2005 1�28 0�99 1�24 1�28 1�29 1�21 1�36 0�99 1�62 1�19 1�60
Net charge-offs to loans & leases (%) ���������� 2008 2�52 0�88 1�25 1�90 2�87 2�76 2�29 2�36 2�40 1�34 3�44 ������������������������������������������� 2006 0�59 0�24 0�25 0�42 0�68 0�90 0�33 0�47 0�78 0�30 0�77 ������������������������������������������� 2004 0�49 0�20 0�19 0�24 0�60 0�80 0�23 0�33 0�56 0�24 0�70
Noncurrent assets plus OREO to assets (%) ������������������������������� 2009 3�36 2�24 3�29 3�58 3�36 2�33 4�16 3�20 4�28 3�04 3�19 ��������������������������������������������2007 0�95 0�96 1�07 1�09 0�92 0�81 0�81 0�94 1�37 1�00 1�12 ��������������������������������������������2005 0�50 0�69 0�52 0�44 0�50 0�44 0�30 0�54 0�86 0�73 0�59
Equity capital ratio (%)����������������������������������� 2009 10�88 11�96 9�86 10�73 11�03 12�53 11�66 8�59 10�70 10�30 11�11 ��������������������������������������������2007 10�34 13�73 10�49 11�34 10�12 12�06 10�30 9�23 9�74 10�22 10�24 ��������������������������������������������2005 10�28 12�16 10�20 10�66 10�18 10�53 9�80 9�23 10�45 10�17 12�40
* See Table IV-A (page 9) for explanations�
FDIC Quarterly 8 2011, Volume 5, No. 1
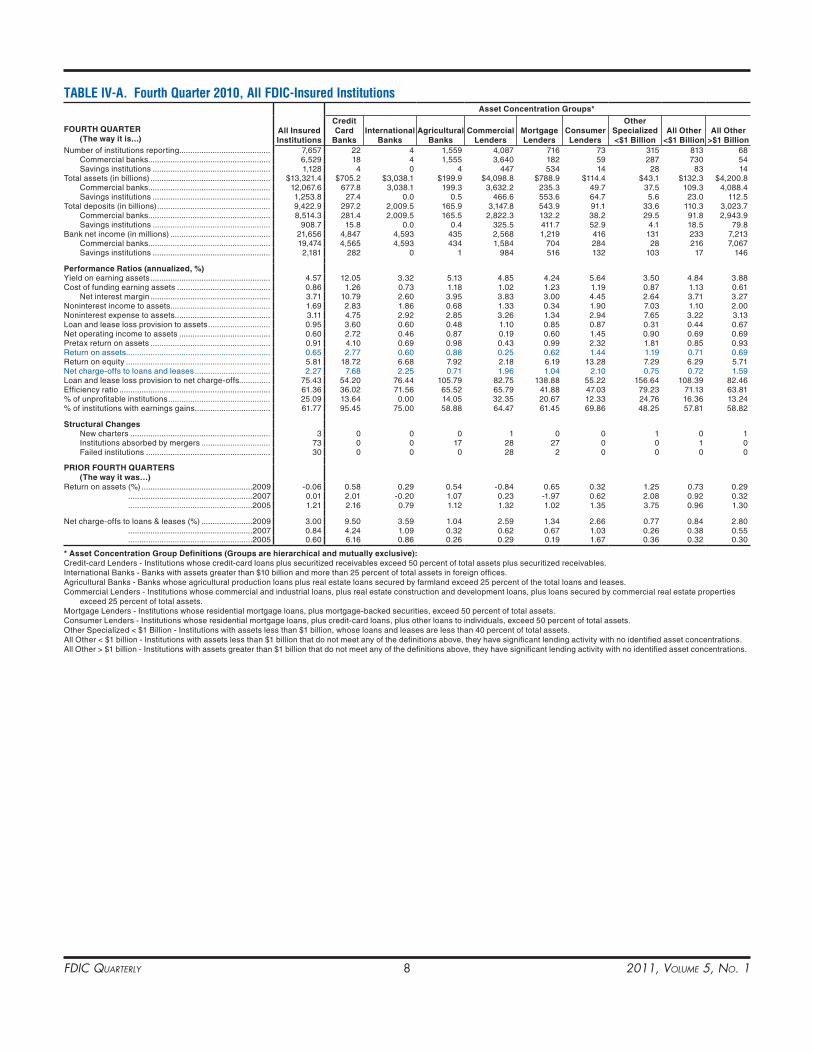
TABLE IV-A. Fourth Quarter 2010, All FDIC-Insured InstitutionsAsset Concentration Groups*
FOurTh QuArTEr (The way it is...)
All Insured Institutions
Credit Card
BanksInternational
BanksAgricultural
BanksCommercial
lendersMortgage lenders
Consumer lenders
Other Specialized <$1 Billion
All Other <$1 Billion
All Other >$1 Billion
Number of institutions reporting ����������������������������������������� 7,657 22 4 1,559 4,087 716 73 315 813 68 Commercial banks ������������������������������������������������������� 6,529 18 4 1,555 3,640 182 59 287 730 54 Savings institutions ����������������������������������������������������� 1,128 4 0 4 447 534 14 28 83 14Total assets (in billions) ������������������������������������������������������ $13,321�4 $705�2 $3,038�1 $199�9 $4,098�8 $788�9 $114�4 $43�1 $132�3 $4,200�8 Commercial banks ������������������������������������������������������� 12,067�6 677�8 3,038�1 199�3 3,632�2 235�3 49�7 37�5 109�3 4,088�4 Savings institutions ����������������������������������������������������� 1,253�8 27�4 0�0 0�5 466�6 553�6 64�7 5�6 23�0 112�5Total deposits (in billions) ��������������������������������������������������� 9,422�9 297�2 2,009�5 165�9 3,147�8 543�9 91�1 33�6 110�3 3,023�7 Commercial banks ������������������������������������������������������� 8,514�3 281�4 2,009�5 165�5 2,822�3 132�2 38�2 29�5 91�8 2,943�9 Savings institutions ����������������������������������������������������� 908�7 15�8 0�0 0�4 325�5 411�7 52�9 4�1 18�5 79�8Bank net income (in millions) ��������������������������������������������� 21,656 4,847 4,593 435 2,568 1,219 416 131 233 7,213 Commercial banks ������������������������������������������������������� 19,474 4,565 4,593 434 1,584 704 284 28 216 7,067 Savings institutions ����������������������������������������������������� 2,181 282 0 1 984 516 132 103 17 146
Performance ratios (annualized, %)Yield on earning assets ������������������������������������������������������ 4�57 12�05 3�32 5�13 4�85 4�24 5�64 3�50 4�84 3�88Cost of funding earning assets ������������������������������������������ 0�86 1�26 0�73 1�18 1�02 1�23 1�19 0�87 1�13 0�61 Net interest margin ������������������������������������������������������ 3�71 10�79 2�60 3�95 3�83 3�00 4�45 2�64 3�71 3�27Noninterest income to assets ��������������������������������������������� 1�69 2�83 1�86 0�68 1�33 0�34 1�90 7�03 1�10 2�00Noninterest expense to assets ������������������������������������������� 3�11 4�75 2�92 2�85 3�26 1�34 2�94 7�65 3�22 3�13Loan and lease loss provision to assets ���������������������������� 0�95 3�60 0�60 0�48 1�10 0�85 0�87 0�31 0�44 0�67Net operating income to assets ����������������������������������������� 0�60 2�72 0�46 0�87 0�19 0�60 1�45 0�90 0�69 0�69Pretax return on assets ������������������������������������������������������ 0�91 4�10 0�69 0�98 0�43 0�99 2�32 1�81 0�85 0�93Return on assets ����������������������������������������������������������������� 0�65 2�77 0�60 0�88 0�25 0�62 1�44 1�19 0�71 0�69Return on equity ����������������������������������������������������������������� 5�81 18�72 6�68 7�92 2�18 6�19 13�28 7�29 6�29 5�71Net charge-offs to loans and leases ���������������������������������� 2�27 7�68 2�25 0�71 1�96 1�04 2�10 0�75 0�72 1�59Loan and lease loss provision to net charge-offs�������������� 75�43 54�20 76�44 105�79 82�75 138�88 55�22 156�64 108�39 82�46Efficiency ratio �������������������������������������������������������������������� 61�36 36�02 71�56 65�52 65�79 41�88 47�03 79�23 71�13 63�81% of unprofitable institutions ���������������������������������������������� 25�09 13�64 0�00 14�05 32�35 20�67 12�33 24�76 16�36 13�24% of institutions with earnings gains ���������������������������������� 61�77 95�45 75�00 58�88 64�47 61�45 69�86 48�25 57�81 58�82
Structural Changes New charters ��������������������������������������������������������������� 3 0 0 0 1 0 0 1 0 1 Institutions absorbed by mergers ������������������������������� 73 0 0 17 28 27 0 0 1 0 Failed institutions �������������������������������������������������������� 30 0 0 0 28 2 0 0 0 0
PrIOr FOurTh QuArTErS (The way it was…)Return on assets (%) ��������������������������������������������������2009 -0�06 0�58 0�29 0�54 -0�84 0�65 0�32 1�25 0�73 0�29 ��������������������������������������������������������2007 0�01 2�01 -0�20 1�07 0�23 -1�97 0�62 2�08 0�92 0�32 ��������������������������������������������������������2005 1�21 2�16 0�79 1�12 1�32 1�02 1�35 3�75 0�96 1�30
Net charge-offs to loans & leases (%) �����������������������2009 3�00 9�50 3�59 1�04 2�59 1�34 2�66 0�77 0�84 2�80 ��������������������������������������������������������2007 0�84 4�24 1�09 0�32 0�62 0�67 1�03 0�26 0�38 0�55 ��������������������������������������������������������2005 0�60 6�16 0�86 0�26 0�29 0�19 1�67 0�36 0�32 0�30
* Asset Concentration Group Definitions (Groups are hierarchical and mutually exclusive):Credit-card Lenders - Institutions whose credit-card loans plus securitized receivables exceed 50 percent of total assets plus securitized receivables�International Banks - Banks with assets greater than $10 billion and more than 25 percent of total assets in foreign offices�Agricultural Banks - Banks whose agricultural production loans plus real estate loans secured by farmland exceed 25 percent of the total loans and leases�Commercial Lenders - Institutions whose commercial and industrial loans, plus real estate construction and development loans, plus loans secured by commercial real estate properties
exceed 25 percent of total assets�Mortgage Lenders - Institutions whose residential mortgage loans, plus mortgage-backed securities, exceed 50 percent of total assets�Consumer Lenders - Institutions whose residential mortgage loans, plus credit-card loans, plus other loans to individuals, exceed 50 percent of total assets�Other Specialized < $1 Billion - Institutions with assets less than $1 billion, whose loans and leases are less than 40 percent of total assets�All Other < $1 billion - Institutions with assets less than $1 billion that do not meet any of the definitions above, they have significant lending activity with no identified asset concentrations�All Other > $1 billion - Institutions with assets greater than $1 billion that do not meet any of the definitions above, they have significant lending activity with no identified asset concentrations�

FDIC Quarterly 9 2011, Volume 5, No. 1
Quarterly Banking Profile
TABLE IV-A. Fourth Quarter 2010, All FDIC-Insured InstitutionsAsset Size Distribution Geographic regions*
FOurTh QuArTEr (The way it is...)
All Insured Institutions
less than $100 Million
$100 Million to
$1 Billion
$1 Billion to
$10 Billion
Greater than
$10 Billion New York Atlanta ChicagoKansas
City DallasSan
FranciscoNumber of institutions reporting ��������������������� 7,657 2,622 4,368 560 107 948 1,022 1,602 1,825 1,601 659 Commercial banks ����������������������������������� 6,529 2,325 3,694 424 86 492 905 1,320 1,728 1,484 600 Savings institutions ��������������������������������� 1,128 297 674 136 21 456 117 282 97 117 59Total assets (in billions) ���������������������������������� $13,321�4 $148�5 $1,291�7 $1,431�7 $10,449�5 $2,695�0 $2,930�6 $2,950�5 $1,686�4 $789�3 $2,269�5 Commercial banks ����������������������������������� 12,067�6 131�9 1,058�6 1,090�4 9,786�6 2,027�0 2,807�3 2,825�2 1,635�6 694�9 2,077�7 Savings institutions ��������������������������������� 1,253�8 16�5 233�1 341�3 662�9 667�9 123�4 125�3 50�8 94�4 191�8Total deposits (in billions) ������������������������������� 9,422�9 125�2 1,068�7 1,102�4 7,126�6 1,809�1 2,128�2 2,033�9 1,245�4 637�6 1,568�7 Commercial banks ����������������������������������� 8,514�3 112�0 884�0 841�9 6,676�3 1,338�0 2,036�0 1,939�9 1,206�2 561�4 1,432�8 Savings institutions ��������������������������������� 908�7 13�2 184�7 260�5 450�3 471�1 92�2 94�0 39�2 76�2 135�9Bank net income (in millions) ������������������������� 21,656 11 502 581 20,561 6,215 1,132 4,144 4,256 1,173 4,735 Commercial banks ����������������������������������� 19,474 13 297 273 18,891 4,963 1,105 4,287 4,226 1,006 3,888 Savings institutions ��������������������������������� 2,181 -2 204 308 1,671 1,252 28 -143 30 167 847
Performance ratios (annualized, %)Yield on earning assets ���������������������������������� 4�57 5�06 5�05 4�84 4�46 5�08 4�32 3�72 5�59 4�83 4�52Cost of funding earning assets ���������������������� 0�86 1�17 1�25 1�11 0�77 1�05 0�75 0�76 0�75 0�90 0�96 Net interest margin ���������������������������������� 3�71 3�89 3�80 3�73 3�69 4�03 3�57 2�96 4�84 3�93 3�56Noninterest income to assets ������������������������� 1�69 1�29 1�06 1�34 1�83 1�69 1�40 2�05 2�32 0�93 1�43Noninterest expense to assets ����������������������� 3�11 4�12 3�38 3�16 3�06 2�97 3�27 3�15 3�62 2�80 2�78Loan and lease loss provision to assets �������� 0�95 0�63 0�92 1�13 0�93 0�92 1�04 0�89 1�34 0�85 0�69Net operating income to assets ��������������������� 0�60 0�01 0�11 0�14 0�72 0�95 0�03 0�42 1�07 0�59 0�79Pretax return on assets ���������������������������������� 0�91 0�11 0�29 0�44 1�06 1�27 0�26 0�76 1�51 0�83 1�10Return on assets ��������������������������������������������� 0�65 0�03 0�16 0�16 0�79 0�92 0�15 0�56 1�02 0�59 0�83Return on equity ��������������������������������������������� 5�81 0�26 1�51 1�44 6�98 7�32 1�33 6�32 8�91 5�58 6�94Net charge-offs to loans and leases �������������� 2�27 0�98 1�30 1�95 2�50 2�96 2�16 1�95 2�51 1�40 2�10Loan and lease loss provision to net charge-offs ���������������������������������������������� 75�43 105�85 107�20 91�44 70�62 55�73 85�78 95�04 78�13 94�64 65�29Efficiency ratio ������������������������������������������������ 61�36 84�56 73�24 63�72 59�39 55�14 69�88 67�24 52�65 61�74 60�46% of unprofitable institutions �������������������������� 25�09 29�29 23�17 22�68 13�08 20�25 45�69 22�10 19�84 20�17 33�84% of institutions with earnings gains �������������� 61�77 55�87 64�40 66�25 75�70 62�03 59�39 64�61 59�34 59�96 69�35
Structural Changes New charters ������������������������������������������� 3 1 0 2 0 1 0 0 2 0 0 Institutions absorbed by mergers ����������� 73 18 52 3 0 8 7 4 13 35 6 Failed institutions ������������������������������������ 30 9 20 1 0 3 12 3 5 1 6
PrIOr FOurTh QuArTErS (The way it was…)Return on assets (%) ����������������������������� 2009 -0�06 -0�50 -0�67 -0�55 0�10 0�17 -0�44 0�06 0�79 0�17 -0�38 ����������������������������������� 2007 0�01 0�44 0�68 0�60 -0�16 0�12 0�10 0�60 0�98 0�55 -1�26 ����������������������������������� 2005 1�21 0�80 1�25 1�18 1�22 1�09 1�30 0�96 1�49 1�11 1�58
Net charge-offs to loans & leases (%) �� 2009 3�00 1�23 1�98 2�42 3�32 2�96 2�78 2�98 2�71 1�61 4�28 ����������������������������������� 2007 0�84 0�37 0�46 0�63 0�95 1�00 0�56 0�75 1�11 0�51 1�13 ����������������������������������� 2005 0�60 0�31 0�26 0�28 0�73 0�89 0�26 0�44 0�61 0�33 0�95
* regions:New York - Connecticut, Delaware, District of Columbia, Maine, Maryland, Massachusetts, New Hampshire, New Jersey, New York, Pennsylvania, Puerto Rico, Rhode Island, Vermont,
U�S� Virgin Islands Atlanta - Alabama, Florida, Georgia, North Carolina, South Carolina, Virginia, West VirginiaChicago - Illinois, Indiana, Kentucky, Michigan, Ohio, WisconsinKansas City - Iowa, Kansas, Minnesota, Missouri, Nebraska, North Dakota, South DakotaDallas - Arkansas, Colorado, Louisiana, Mississippi, New Mexico, Oklahoma, Tennessee, TexasSan Francisco - Alaska, Arizona, California, Hawaii, Idaho, Montana, Nevada, Oregon, Pacific Islands, Utah, Washington, Wyoming
FDIC Quarterly 10 2011, Volume 5, No. 1
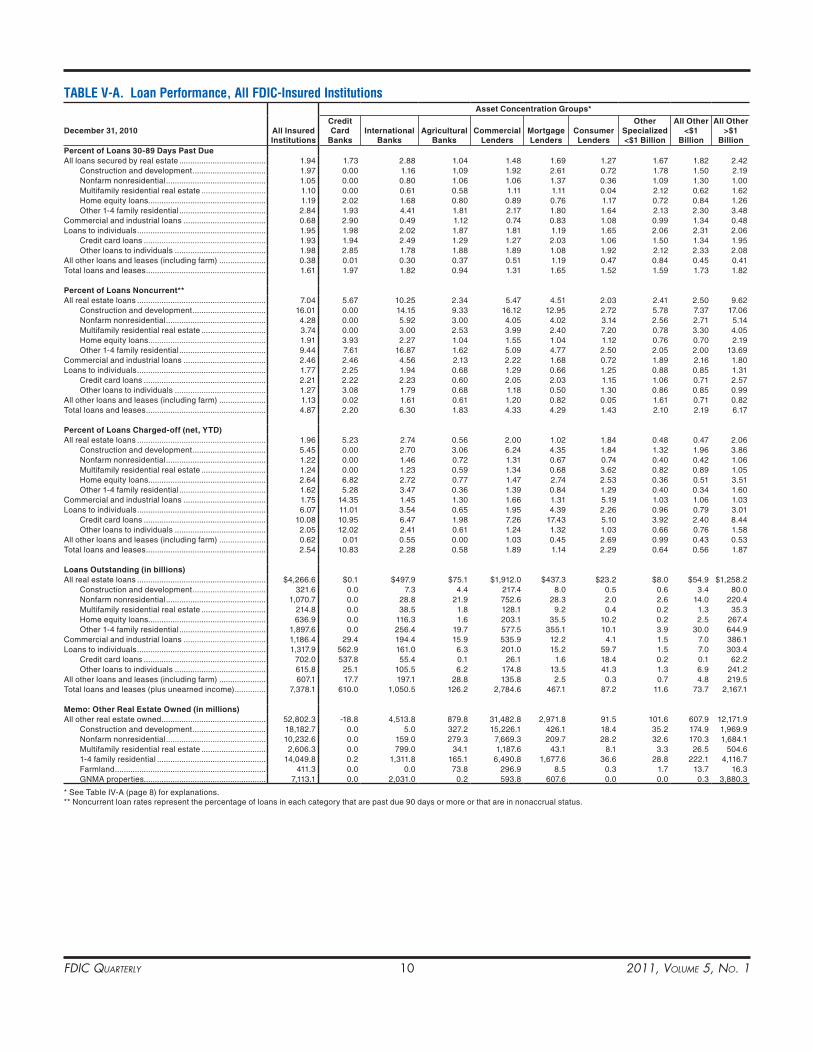
TABLE V-A. Loan Performance, All FDIC-Insured InstitutionsAsset Concentration Groups*
December 31, 2010 All Insured Institutions
Credit Card
BanksInternational
BanksAgricultural
BanksCommercial
lendersMortgage lenders
Consumer lenders
Other Specialized <$1 Billion
All Other <$1
Billion
All Other >$1
BillionPercent of loans 30-89 Days Past DueAll loans secured by real estate ��������������������������������������� 1�94 1�73 2�88 1�04 1�48 1�69 1�27 1�67 1�82 2�42 Construction and development ��������������������������������� 1�97 0�00 1�16 1�09 1�92 2�61 0�72 1�78 1�50 2�19 Nonfarm nonresidential ��������������������������������������������� 1�05 0�00 0�80 1�06 1�06 1�37 0�36 1�09 1�30 1�00 Multifamily residential real estate ����������������������������� 1�10 0�00 0�61 0�58 1�11 1�11 0�04 2�12 0�62 1�62 Home equity loans����������������������������������������������������� 1�19 2�02 1�68 0�80 0�89 0�76 1�17 0�72 0�84 1�26 Other 1-4 family residential ��������������������������������������� 2�84 1�93 4�41 1�81 2�17 1�80 1�64 2�13 2�30 3�48Commercial and industrial loans ������������������������������������� 0�68 2�90 0�49 1�12 0�74 0�83 1�08 0�99 1�34 0�48Loans to individuals ���������������������������������������������������������� 1�95 1�98 2�02 1�87 1�81 1�19 1�65 2�06 2�31 2�06 Credit card loans ������������������������������������������������������� 1�93 1�94 2�49 1�29 1�27 2�03 1�06 1�50 1�34 1�95 Other loans to individuals ����������������������������������������� 1�98 2�85 1�78 1�88 1�89 1�08 1�92 2�12 2�33 2�08All other loans and leases (including farm) ��������������������� 0�38 0�01 0�30 0�37 0�51 1�19 0�47 0�84 0�45 0�41Total loans and leases ������������������������������������������������������ 1�61 1�97 1�82 0�94 1�31 1�65 1�52 1�59 1�73 1�82
Percent of loans Noncurrent**All real estate loans ���������������������������������������������������������� 7�04 5�67 10�25 2�34 5�47 4�51 2�03 2�41 2�50 9�62 Construction and development ��������������������������������� 16�01 0�00 14�15 9�33 16�12 12�95 2�72 5�78 7�37 17�06 Nonfarm nonresidential ��������������������������������������������� 4�28 0�00 5�92 3�00 4�05 4�02 3�14 2�56 2�71 5�14 Multifamily residential real estate ����������������������������� 3�74 0�00 3�00 2�53 3�99 2�40 7�20 0�78 3�30 4�05 Home equity loans����������������������������������������������������� 1�91 3�93 2�27 1�04 1�55 1�04 1�12 0�76 0�70 2�19 Other 1-4 family residential ��������������������������������������� 9�44 7�61 16�87 1�62 5�09 4�77 2�50 2�05 2�00 13�69Commercial and industrial loans ������������������������������������� 2�46 2�46 4�56 2�13 2�22 1�68 0�72 1�89 2�16 1�80Loans to individuals ���������������������������������������������������������� 1�77 2�25 1�94 0�68 1�29 0�66 1�25 0�88 0�85 1�31 Credit card loans ������������������������������������������������������� 2�21 2�22 2�23 0�60 2�05 2�03 1�15 1�06 0�71 2�57 Other loans to individuals ����������������������������������������� 1�27 3�08 1�79 0�68 1�18 0�50 1�30 0�86 0�85 0�99All other loans and leases (including farm) ��������������������� 1�13 0�02 1�61 0�61 1�20 0�82 0�05 1�61 0�71 0�82Total loans and leases ������������������������������������������������������ 4�87 2�20 6�30 1�83 4�33 4�29 1�43 2�10 2�19 6�17
Percent of loans Charged-off (net, YTD)All real estate loans ���������������������������������������������������������� 1�96 5�23 2�74 0�56 2�00 1�02 1�84 0�48 0�47 2�06 Construction and development ��������������������������������� 5�45 0�00 2�70 3�06 6�24 4�35 1�84 1�32 1�96 3�86 Nonfarm nonresidential ��������������������������������������������� 1�22 0�00 1�46 0�72 1�31 0�67 0�74 0�40 0�42 1�06 Multifamily residential real estate ����������������������������� 1�24 0�00 1�23 0�59 1�34 0�68 3�62 0�82 0�89 1�05 Home equity loans����������������������������������������������������� 2�64 6�82 2�72 0�77 1�47 2�74 2�53 0�36 0�51 3�51 Other 1-4 family residential ��������������������������������������� 1�62 5�28 3�47 0�36 1�39 0�84 1�29 0�40 0�34 1�60Commercial and industrial loans ������������������������������������� 1�75 14�35 1�45 1�30 1�66 1�31 5�19 1�03 1�06 1�03Loans to individuals ���������������������������������������������������������� 6�07 11�01 3�54 0�65 1�95 4�39 2�26 0�96 0�79 3�01 Credit card loans ������������������������������������������������������� 10�08 10�95 6�47 1�98 7�26 17�43 5�10 3�92 2�40 8�44 Other loans to individuals ����������������������������������������� 2�05 12�02 2�41 0�61 1�24 1�32 1�03 0�66 0�76 1�58All other loans and leases (including farm) ��������������������� 0�62 0�01 0�55 0�00 1�03 0�45 2�69 0�99 0�43 0�53Total loans and leases ������������������������������������������������������ 2�54 10�83 2�28 0�58 1�89 1�14 2�29 0�64 0�56 1�87
loans Outstanding (in billions)All real estate loans ���������������������������������������������������������� $4,266�6 $0�1 $497�9 $75�1 $1,912�0 $437�3 $23�2 $8�0 $54�9 $1,258�2 Construction and development ��������������������������������� 321�6 0�0 7�3 4�4 217�4 8�0 0�5 0�6 3�4 80�0 Nonfarm nonresidential ��������������������������������������������� 1,070�7 0�0 28�8 21�9 752�6 28�3 2�0 2�6 14�0 220�4 Multifamily residential real estate ����������������������������� 214�8 0�0 38�5 1�8 128�1 9�2 0�4 0�2 1�3 35�3 Home equity loans����������������������������������������������������� 636�9 0�0 116�3 1�6 203�1 35�5 10�2 0�2 2�5 267�4 Other 1-4 family residential ��������������������������������������� 1,897�6 0�0 256�4 19�7 577�5 355�1 10�1 3�9 30�0 644�9Commercial and industrial loans ������������������������������������� 1,186�4 29�4 194�4 15�9 535�9 12�2 4�1 1�5 7�0 386�1Loans to individuals ���������������������������������������������������������� 1,317�9 562�9 161�0 6�3 201�0 15�2 59�7 1�5 7�0 303�4 Credit card loans ������������������������������������������������������� 702�0 537�8 55�4 0�1 26�1 1�6 18�4 0�2 0�1 62�2 Other loans to individuals ����������������������������������������� 615�8 25�1 105�5 6�2 174�8 13�5 41�3 1�3 6�9 241�2All other loans and leases (including farm) ��������������������� 607�1 17�7 197�1 28�8 135�8 2�5 0�3 0�7 4�8 219�5Total loans and leases (plus unearned income) �������������� 7,378�1 610�0 1,050�5 126�2 2,784�6 467�1 87�2 11�6 73�7 2,167�1
Memo: Other real Estate Owned (in millions)All other real estate owned ����������������������������������������������� 52,802�3 -18�8 4,513�8 879�8 31,482�8 2,971�8 91�5 101�6 607�9 12,171�9 Construction and development ��������������������������������� 18,182�7 0�0 5�0 327�2 15,226�1 426�1 18�4 35�2 174�9 1,969�9 Nonfarm nonresidential ��������������������������������������������� 10,232�6 0�0 159�0 279�3 7,669�3 209�7 28�2 32�6 170�3 1,684�1 Multifamily residential real estate ����������������������������� 2,606�3 0�0 799�0 34�1 1,187�6 43�1 8�1 3�3 26�5 504�6 1-4 family residential ������������������������������������������������� 14,049�8 0�2 1,311�8 165�1 6,490�8 1,677�6 36�6 28�8 222�1 4,116�7 Farmland �������������������������������������������������������������������� 411�3 0�0 0�0 73�8 296�9 8�5 0�3 1�7 13�7 16�3 GNMA properties������������������������������������������������������� 7,113�1 0�0 2,031�0 0�2 593�8 607�6 0�0 0�0 0�3 3,880�3
* See Table IV-A (page 8) for explanations� ** Noncurrent loan rates represent the percentage of loans in each category that are past due 90 days or more or that are in nonaccrual status�
FDIC Quarterly 11 2011, Volume 5, No. 1
Quarterly Banking Profile
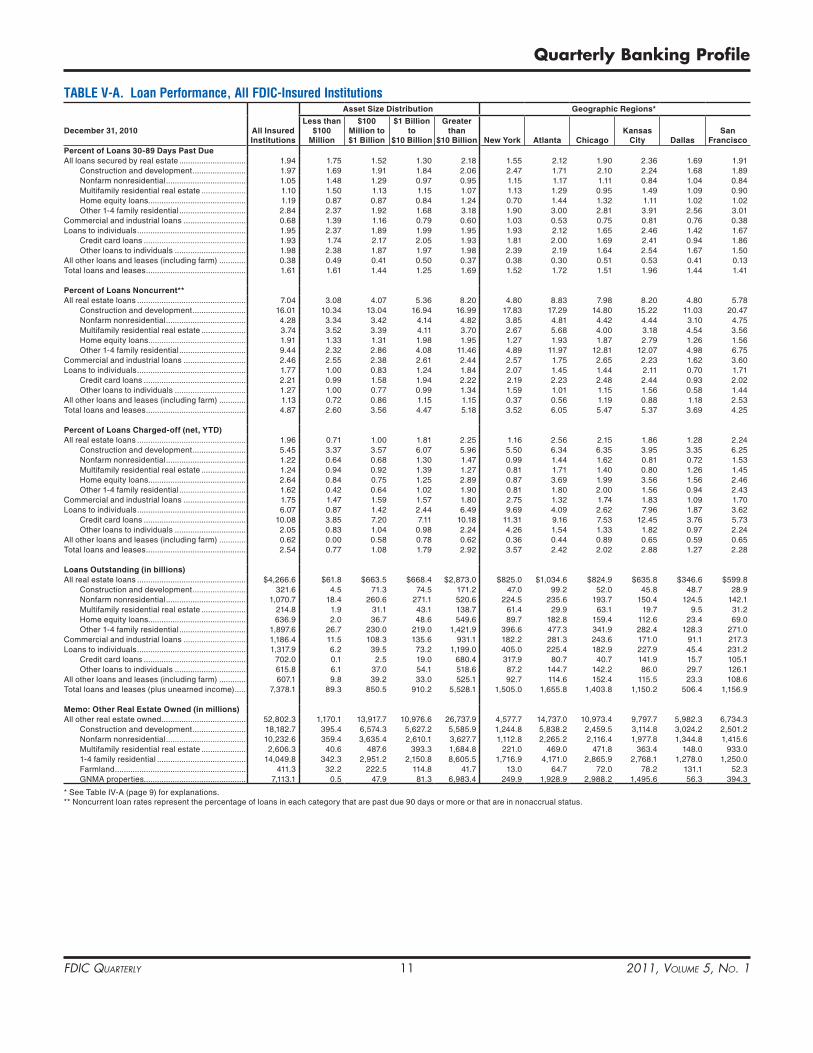
TABLE V-A. Loan Performance, All FDIC-Insured InstitutionsAsset Size Distribution Geographic regions*
December 31, 2010 All Insured Institutions
less than $100
Million
$100 Million to $1 Billion
$1 Billion to
$10 Billion
Greater than
$10 Billion New York Atlanta ChicagoKansas
City DallasSan
FranciscoPercent of loans 30-89 Days Past Due All loans secured by real estate ������������������������������ 1�94 1�75 1�52 1�30 2�18 1�55 2�12 1�90 2�36 1�69 1�91 Construction and development ������������������������ 1�97 1�69 1�91 1�84 2�06 2�47 1�71 2�10 2�24 1�68 1�89 Nonfarm nonresidential ������������������������������������ 1�05 1�48 1�29 0�97 0�95 1�15 1�17 1�11 0�84 1�04 0�84 Multifamily residential real estate �������������������� 1�10 1�50 1�13 1�15 1�07 1�13 1�29 0�95 1�49 1�09 0�90 Home equity loans�������������������������������������������� 1�19 0�87 0�87 0�84 1�24 0�70 1�44 1�32 1�11 1�02 1�02 Other 1-4 family residential ������������������������������ 2�84 2�37 1�92 1�68 3�18 1�90 3�00 2�81 3�91 2�56 3�01Commercial and industrial loans ���������������������������� 0�68 1�39 1�16 0�79 0�60 1�03 0�53 0�75 0�81 0�76 0�38Loans to individuals ������������������������������������������������� 1�95 2�37 1�89 1�99 1�95 1�93 2�12 1�65 2�46 1�42 1�67 Credit card loans ���������������������������������������������� 1�93 1�74 2�17 2�05 1�93 1�81 2�00 1�69 2�41 0�94 1�86 Other loans to individuals �������������������������������� 1�98 2�38 1�87 1�97 1�98 2�39 2�19 1�64 2�54 1�67 1�50All other loans and leases (including farm) ������������ 0�38 0�49 0�41 0�50 0�37 0�38 0�30 0�51 0�53 0�41 0�13Total loans and leases ��������������������������������������������� 1�61 1�61 1�44 1�25 1�69 1�52 1�72 1�51 1�96 1�44 1�41
Percent of loans Noncurrent** All real estate loans ������������������������������������������������� 7�04 3�08 4�07 5�36 8�20 4�80 8�83 7�98 8�20 4�80 5�78 Construction and development ������������������������ 16�01 10�34 13�04 16�94 16�99 17�83 17�29 14�80 15�22 11�03 20�47 Nonfarm nonresidential ������������������������������������ 4�28 3�34 3�42 4�14 4�82 3�85 4�81 4�42 4�44 3�10 4�75 Multifamily residential real estate �������������������� 3�74 3�52 3�39 4�11 3�70 2�67 5�68 4�00 3�18 4�54 3�56 Home equity loans�������������������������������������������� 1�91 1�33 1�31 1�98 1�95 1�27 1�93 1�87 2�79 1�26 1�56 Other 1-4 family residential ������������������������������ 9�44 2�32 2�86 4�08 11�46 4�89 11�97 12�81 12�07 4�98 6�75Commercial and industrial loans ���������������������������� 2�46 2�55 2�38 2�61 2�44 2�57 1�75 2�65 2�23 1�62 3�60Loans to individuals ������������������������������������������������� 1�77 1�00 0�83 1�24 1�84 2�07 1�45 1�44 2�11 0�70 1�71 Credit card loans ���������������������������������������������� 2�21 0�99 1�58 1�94 2�22 2�19 2�23 2�48 2�44 0�93 2�02 Other loans to individuals �������������������������������� 1�27 1�00 0�77 0�99 1�34 1�59 1�01 1�15 1�56 0�58 1�44All other loans and leases (including farm) ������������ 1�13 0�72 0�86 1�15 1�15 0�37 0�56 1�19 0�88 1�18 2�53Total loans and leases ��������������������������������������������� 4�87 2�60 3�56 4�47 5�18 3�52 6�05 5�47 5�37 3�69 4�25
Percent of loans Charged-off (net, YTD) All real estate loans ������������������������������������������������� 1�96 0�71 1�00 1�81 2�25 1�16 2�56 2�15 1�86 1�28 2�24 Construction and development ������������������������ 5�45 3�37 3�57 6�07 5�96 5�50 6�34 6�35 3�95 3�35 6�25 Nonfarm nonresidential ������������������������������������ 1�22 0�64 0�68 1�30 1�47 0�99 1�44 1�62 0�81 0�72 1�53 Multifamily residential real estate �������������������� 1�24 0�94 0�92 1�39 1�27 0�81 1�71 1�40 0�80 1�26 1�45 Home equity loans�������������������������������������������� 2�64 0�84 0�75 1�25 2�89 0�87 3�69 1�99 3�56 1�56 2�46 Other 1-4 family residential ������������������������������ 1�62 0�42 0�64 1�02 1�90 0�81 1�80 2�00 1�56 0�94 2�43Commercial and industrial loans ���������������������������� 1�75 1�47 1�59 1�57 1�80 2�75 1�32 1�74 1�83 1�09 1�70Loans to individuals ������������������������������������������������� 6�07 0�87 1�42 2�44 6�49 9�69 4�09 2�62 7�96 1�87 3�62 Credit card loans ���������������������������������������������� 10�08 3�85 7�20 7�11 10�18 11�31 9�16 7�53 12�45 3�76 5�73 Other loans to individuals �������������������������������� 2�05 0�83 1�04 0�98 2�24 4�26 1�54 1�33 1�82 0�97 2�24All other loans and leases (including farm) ������������ 0�62 0�00 0�58 0�78 0�62 0�36 0�44 0�89 0�65 0�59 0�65Total loans and leases ��������������������������������������������� 2�54 0�77 1�08 1�79 2�92 3�57 2�42 2�02 2�88 1�27 2�28
loans Outstanding (in billions) All real estate loans ������������������������������������������������� $4,266�6 $61�8 $663�5 $668�4 $2,873�0 $825�0 $1,034�6 $824�9 $635�8 $346�6 $599�8 Construction and development ������������������������ 321�6 4�5 71�3 74�5 171�2 47�0 99�2 52�0 45�8 48�7 28�9 Nonfarm nonresidential ������������������������������������ 1,070�7 18�4 260�6 271�1 520�6 224�5 235�6 193�7 150�4 124�5 142�1 Multifamily residential real estate �������������������� 214�8 1�9 31�1 43�1 138�7 61�4 29�9 63�1 19�7 9�5 31�2 Home equity loans�������������������������������������������� 636�9 2�0 36�7 48�6 549�6 89�7 182�8 159�4 112�6 23�4 69�0 Other 1-4 family residential ������������������������������ 1,897�6 26�7 230�0 219�0 1,421�9 396�6 477�3 341�9 282�4 128�3 271�0Commercial and industrial loans ���������������������������� 1,186�4 11�5 108�3 135�6 931�1 182�2 281�3 243�6 171�0 91�1 217�3Loans to individuals ������������������������������������������������� 1,317�9 6�2 39�5 73�2 1,199�0 405�0 225�4 182�9 227�9 45�4 231�2 Credit card loans ���������������������������������������������� 702�0 0�1 2�5 19�0 680�4 317�9 80�7 40�7 141�9 15�7 105�1 Other loans to individuals �������������������������������� 615�8 6�1 37�0 54�1 518�6 87�2 144�7 142�2 86�0 29�7 126�1All other loans and leases (including farm) ������������ 607�1 9�8 39�2 33�0 525�1 92�7 114�6 152�4 115�5 23�3 108�6Total loans and leases (plus unearned income) ����� 7,378�1 89�3 850�5 910�2 5,528�1 1,505�0 1,655�8 1,403�8 1,150�2 506�4 1,156�9
Memo: Other real Estate Owned (in millions) All other real estate owned �������������������������������������� 52,802�3 1,170�1 13,917�7 10,976�6 26,737�9 4,577�7 14,737�0 10,973�4 9,797�7 5,982�3 6,734�3 Construction and development ������������������������ 18,182�7 395�4 6,574�3 5,627�2 5,585�9 1,244�8 5,838�2 2,459�5 3,114�8 3,024�2 2,501�2 Nonfarm nonresidential ������������������������������������ 10,232�6 359�4 3,635�4 2,610�1 3,627�7 1,112�8 2,265�2 2,116�4 1,977�8 1,344�8 1,415�6 Multifamily residential real estate �������������������� 2,606�3 40�6 487�6 393�3 1,684�8 221�0 469�0 471�8 363�4 148�0 933�0 1-4 family residential ���������������������������������������� 14,049�8 342�3 2,951�2 2,150�8 8,605�5 1,716�9 4,171�0 2,865�9 2,768�1 1,278�0 1,250�0 Farmland ����������������������������������������������������������� 411�3 32�2 222�5 114�8 41�7 13�0 64�7 72�0 78�2 131�1 52�3 GNMA properties���������������������������������������������� 7,113�1 0�5 47�9 81�3 6,983�4 249�9 1,928�9 2,988�2 1,495�6 56�3 394�3
* See Table IV-A (page 9) for explanations� ** Noncurrent loan rates represent the percentage of loans in each category that are past due 90 days or more or that are in nonaccrual status�
FDIC Quarterly 12 2011, Volume 5, No. 1
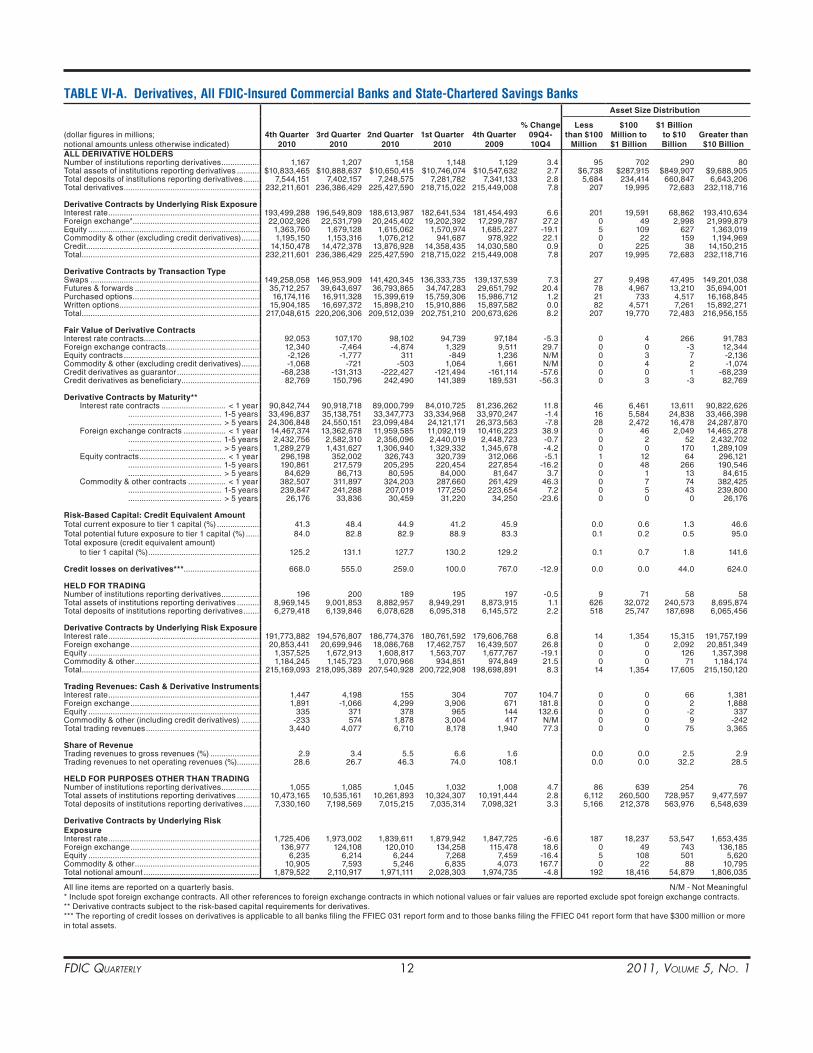
TABLE VI-A. Derivatives, All FDIC-Insured Commercial Banks and State-Chartered Savings BanksAsset Size Distribution
(dollar figures in millions; notional amounts unless otherwise indicated)
4th Quarter2010
3rd Quarter2010
2nd Quarter 2010
1st Quarter 2010
4th Quarter 2009
% Change 09Q4- 10Q4
less than $100
Million
$100 Million to $1 Billion
$1 Billion to $10 Billion
Greater than $10 Billion
All DErIVATIVE hOlDErS Number of institutions reporting derivatives ����������������� 1,167 1,207 1,158 1,148 1,129 3�4 95 702 290 80Total assets of institutions reporting derivatives ���������� $10,833,465 $10,888,637 $10,650,415 $10,746,074 $10,547,632 2�7 $6,738 $287,915 $849,907 $9,688,905Total deposits of institutions reporting derivatives ������� 7,544,151 7,402,157 7,248,575 7,281,782 7,341,133 2�8 5,684 234,414 660,847 6,643,206Total derivatives ������������������������������������������������������������� 232,211,601 236,386,429 225,427,590 218,715,022 215,449,008 7�8 207 19,995 72,683 232,118,716
Derivative Contracts by underlying risk Exposure Interest rate �������������������������������������������������������������������� 193,499,288 196,549,809 188,613,987 182,641,534 181,454,493 6�6 201 19,591 68,862 193,410,634Foreign exchange*��������������������������������������������������������� 22,002,926 22,531,799 20,245,402 19,202,392 17,299,787 27�2 0 49 2,998 21,999,879Equity ����������������������������������������������������������������������������� 1,363,760 1,679,128 1,615,062 1,570,974 1,685,227 -19�1 5 109 627 1,363,019Commodity & other (excluding credit derivatives) �������� 1,195,150 1,153,316 1,076,212 941,687 978,922 22�1 0 22 159 1,194,969Credit ������������������������������������������������������������������������������ 14,150,478 14,472,378 13,876,928 14,358,435 14,030,580 0�9 0 225 38 14,150,215Total �������������������������������������������������������������������������������� 232,211,601 236,386,429 225,427,590 218,715,022 215,449,008 7�8 207 19,995 72,683 232,118,716
Derivative Contracts by Transaction Type Swaps ���������������������������������������������������������������������������� 149,258,058 146,953,909 141,420,345 136,333,735 139,137,539 7�3 27 9,498 47,495 149,201,038Futures & forwards �������������������������������������������������������� 35,712,257 39,643,697 36,793,865 34,747,283 29,651,792 20�4 78 4,967 13,210 35,694,001Purchased options ��������������������������������������������������������� 16,174,116 16,911,328 15,399,619 15,759,306 15,986,712 1�2 21 733 4,517 16,168,845Written options ��������������������������������������������������������������� 15,904,185 16,697,372 15,898,210 15,910,886 15,897,582 0�0 82 4,571 7,261 15,892,271Total �������������������������������������������������������������������������������� 217,048,615 220,206,306 209,512,039 202,751,210 200,673,626 8�2 207 19,770 72,483 216,956,155
Fair Value of Derivative Contracts Interest rate contracts���������������������������������������������������� 92,053 107,170 98,102 94,739 97,184 -5�3 0 4 266 91,783Foreign exchange contracts ������������������������������������������ 12,340 -7,464 -4,874 1,329 9,511 29�7 0 0 -3 12,344Equity contracts ������������������������������������������������������������� -2,126 -1,777 311 -849 1,236 N/M 0 3 7 -2,136Commodity & other (excluding credit derivatives) �������� -1,068 -721 -503 1,064 1,661 N/M 0 4 2 -1,074Credit derivatives as guarantor ������������������������������������� -68,238 -131,313 -222,427 -121,494 -161,114 -57�6 0 0 1 -68,239Credit derivatives as beneficiary ����������������������������������� 82,769 150,796 242,490 141,389 189,531 -56�3 0 3 -3 82,769
Derivative Contracts by Maturity** Interest rate contracts ����������������������������� < 1 year 90,842,744 90,918,718 89,000,799 84,010,725 81,236,262 11�8 46 6,461 13,611 90,822,626 ������������������������������������������ 1-5 years 33,496,837 35,138,751 33,347,773 33,334,968 33,970,247 -1�4 16 5,584 24,838 33,466,398 ������������������������������������������ > 5 years 24,306,848 24,550,151 23,099,484 24,121,171 26,373,563 -7�8 28 2,472 16,478 24,287,870 Foreign exchange contracts ������������������� < 1 year 14,467,374 13,362,678 11,959,585 11,092,119 10,416,223 38�9 0 46 2,049 14,465,278 ������������������������������������������ 1-5 years 2,432,756 2,582,310 2,356,096 2,440,019 2,448,723 -0�7 0 2 52 2,432,702 ������������������������������������������ > 5 years 1,289,279 1,431,627 1,306,940 1,329,332 1,345,678 -4�2 0 0 170 1,289,109 Equity contracts ��������������������������������������� < 1 year 296,198 352,002 326,743 320,739 312,066 -5�1 1 12 64 296,121 ������������������������������������������ 1-5 years 190,861 217,579 205,295 220,454 227,854 -16�2 0 48 266 190,546 ������������������������������������������ > 5 years 84,629 86,713 80,595 84,000 81,647 3�7 0 1 13 84,615 Commodity & other contracts ����������������� < 1 year 382,507 311,897 324,203 287,660 261,429 46�3 0 7 74 382,425 ������������������������������������������ 1-5 years 239,847 241,288 207,019 177,250 223,654 7�2 0 5 43 239,800 ������������������������������������������ > 5 years 26,176 33,836 30,459 31,220 34,250 -23�6 0 0 0 26,176
risk-Based Capital: Credit Equivalent Amount Total current exposure to tier 1 capital (%) ������������������� 41�3 48�4 44�9 41�2 45�9 0�0 0�6 1�3 46�6Total potential future exposure to tier 1 capital (%) ������ 84�0 82�8 82�9 88�9 83�3 0�1 0�2 0�5 95�0Total exposure (credit equivalent amount) to tier 1 capital (%) �������������������������������������������������� 125�2 131�1 127�7 130�2 129�2 0�1 0�7 1�8 141�6
Credit losses on derivatives*** ���������������������������������� 668�0 555�0 259�0 100�0 767�0 -12�9 0�0 0�0 44�0 624�0
hElD FOr TrADING Number of institutions reporting derivatives ����������������� 196 200 189 195 197 -0�5 9 71 58 58Total assets of institutions reporting derivatives ���������� 8,969,145 9,001,853 8,882,957 8,949,291 8,873,915 1�1 626 32,072 240,573 8,695,874Total deposits of institutions reporting derivatives ������� 6,279,418 6,139,846 6,078,628 6,095,318 6,145,572 2�2 518 25,747 187,698 6,065,456
Derivative Contracts by underlying risk Exposure Interest rate �������������������������������������������������������������������� 191,773,882 194,576,807 186,774,376 180,761,592 179,606,768 6�8 14 1,354 15,315 191,757,199Foreign exchange ���������������������������������������������������������� 20,853,441 20,699,946 18,086,768 17,462,757 16,439,507 26�8 0 0 2,092 20,851,349Equity ����������������������������������������������������������������������������� 1,357,525 1,672,913 1,608,817 1,563,707 1,677,767 -19�1 0 0 126 1,357,398Commodity & other �������������������������������������������������������� 1,184,245 1,145,723 1,070,966 934,851 974,849 21�5 0 0 71 1,184,174Total �������������������������������������������������������������������������������� 215,169,093 218,095,389 207,540,928 200,722,908 198,698,891 8�3 14 1,354 17,605 215,150,120
Trading revenues: Cash & Derivative Instruments Interest rate �������������������������������������������������������������������� 1,447 4,198 155 304 707 104�7 0 0 66 1,381Foreign exchange ���������������������������������������������������������� 1,891 -1,066 4,299 3,906 671 181�8 0 0 2 1,888Equity ����������������������������������������������������������������������������� 335 371 378 965 144 132�6 0 0 -2 337Commodity & other (including credit derivatives) �������� -233 574 1,878 3,004 417 N/M 0 0 9 -242Total trading revenues ��������������������������������������������������� 3,440 4,077 6,710 8,178 1,940 77�3 0 0 75 3,365
Share of revenue Trading revenues to gross revenues (%) ���������������������� 2�9 3�4 5�5 6�6 1�6 0�0 0�0 2�5 2�9Trading revenues to net operating revenues (%) ���������� 28�6 26�7 46�3 74�0 108�1 0�0 0�0 32�2 28�5
hElD FOr PurPOSES OThEr ThAN TrADING Number of institutions reporting derivatives ����������������� 1,055 1,085 1,045 1,032 1,008 4�7 86 639 254 76Total assets of institutions reporting derivatives ���������� 10,473,165 10,535,161 10,261,893 10,324,307 10,191,444 2�8 6,112 260,500 728,957 9,477,597Total deposits of institutions reporting derivatives ������� 7,330,160 7,198,569 7,015,215 7,035,314 7,098,321 3�3 5,166 212,378 563,976 6,548,639
Derivative Contracts by underlying risk Exposure Interest rate �������������������������������������������������������������������� 1,725,406 1,973,002 1,839,611 1,879,942 1,847,725 -6�6 187 18,237 53,547 1,653,435Foreign exchange ���������������������������������������������������������� 136,977 124,108 120,010 134,258 115,478 18�6 0 49 743 136,185Equity ����������������������������������������������������������������������������� 6,235 6,214 6,244 7,268 7,459 -16�4 5 108 501 5,620Commodity & other �������������������������������������������������������� 10,905 7,593 5,246 6,835 4,073 167�7 0 22 88 10,795Total notional amount ���������������������������������������������������� 1,879,522 2,110,917 1,971,111 2,028,303 1,974,735 -4�8 192 18,416 54,879 1,806,035
All line items are reported on a quarterly basis� N/M - Not Meaningful* Include spot foreign exchange contracts� All other references to foreign exchange contracts in which notional values or fair values are reported exclude spot foreign exchange contracts�** Derivative contracts subject to the risk-based capital requirements for derivatives�*** The reporting of credit losses on derivatives is applicable to all banks filing the FFIEC 031 report form and to those banks filing the FFIEC 041 report form that have $300 million or more in total assets�
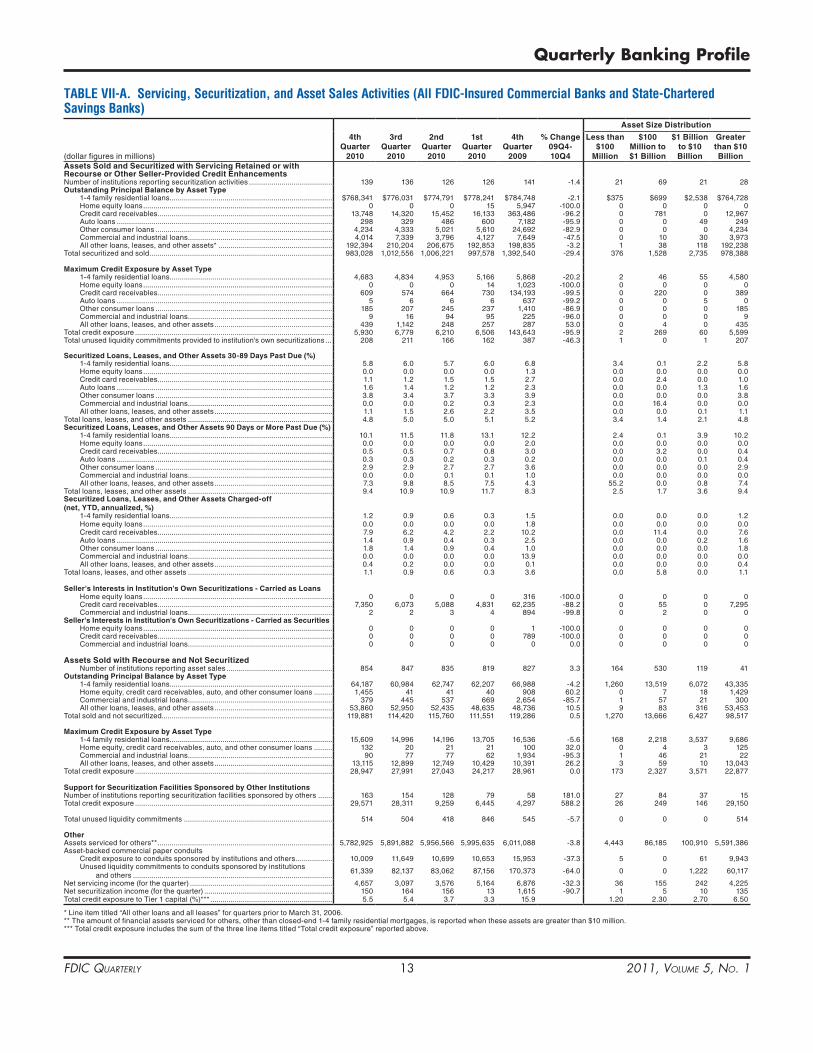
FDIC Quarterly 13 2011, Volume 5, No. 1
Quarterly Banking Profile
TABLE VII-A. Servicing, Securitization, and Asset Sales Activities (All FDIC-Insured Commercial Banks and State-Chartered Savings Banks)
Asset Size Distribution
(dollar figures in millions)
4th Quarter
2010
3rd Quarter
2010
2nd Quarter
2010
1st Quarter
2010
4th Quarter
2009
% Change 09Q4- 10Q4
less than $100
Million
$100 Million to $1 Billion
$1 Billion to $10 Billion
Greater than $10 Billion
Assets Sold and Securitized with Servicing retained or with recourse or Other Seller-Provided Credit Enhancements Number of institutions reporting securitization activities ����������������������������������������� 139 136 126 126 141 -1�4 21 69 21 28Outstanding Principal Balance by Asset Type 1-4 family residential loans �������������������������������������������������������������������������������� $768,341 $776,031 $774,791 $778,241 $784,748 -2�1 $375 $699 $2,538 $764,728 Home equity loans ��������������������������������������������������������������������������������������������� 0 0 0 15 5,947 -100�0 0 0 0 0 Credit card receivables�������������������������������������������������������������������������������������� 13,748 14,320 15,452 16,133 363,486 -96�2 0 781 0 12,967 Auto loans ���������������������������������������������������������������������������������������������������������� 298 329 486 600 7,182 -95�9 0 0 49 249 Other consumer loans ��������������������������������������������������������������������������������������� 4,234 4,333 5,021 5,610 24,692 -82�9 0 0 0 4,234 Commercial and industrial loans ����������������������������������������������������������������������� 4,014 7,339 3,796 4,127 7,649 -47�5 0 10 30 3,973 All other loans, leases, and other assets* �������������������������������������������������������� 192,394 210,204 206,675 192,853 198,835 -3�2 1 38 118 192,238Total securitized and sold ������������������������������������������������������������������������������������������ 983,028 1,012,556 1,006,221 997,578 1,392,540 -29�4 376 1,528 2,735 978,388
Maximum Credit Exposure by Asset Type 1-4 family residential loans �������������������������������������������������������������������������������� 4,683 4,834 4,953 5,166 5,868 -20�2 2 46 55 4,580 Home equity loans ��������������������������������������������������������������������������������������������� 0 0 0 14 1,023 -100�0 0 0 0 0 Credit card receivables�������������������������������������������������������������������������������������� 609 574 664 730 134,193 -99�5 0 220 0 389 Auto loans ���������������������������������������������������������������������������������������������������������� 5 6 6 6 637 -99�2 0 0 5 0 Other consumer loans ��������������������������������������������������������������������������������������� 185 207 245 237 1,410 -86�9 0 0 0 185 Commercial and industrial loans ����������������������������������������������������������������������� 9 16 94 95 225 -96�0 0 0 0 9 All other loans, leases, and other assets ���������������������������������������������������������� 439 1,142 248 257 287 53�0 0 4 0 435Total credit exposure ������������������������������������������������������������������������������������������������� 5,930 6,779 6,210 6,506 143,643 -95�9 2 269 60 5,599Total unused liquidity commitments provided to institution's own securitizations ��� 208 211 166 162 387 -46�3 1 0 1 207
Securitized loans, leases, and Other Assets 30-89 Days Past Due (%) 1-4 family residential loans �������������������������������������������������������������������������������� 5�8 6�0 5�7 6�0 6�8 3�4 0�1 2�2 5�8 Home equity loans ��������������������������������������������������������������������������������������������� 0�0 0�0 0�0 0�0 1�3 0�0 0�0 0�0 0�0 Credit card receivables�������������������������������������������������������������������������������������� 1�1 1�2 1�5 1�5 2�7 0�0 2�4 0�0 1�0 Auto loans ���������������������������������������������������������������������������������������������������������� 1�6 1�4 1�2 1�2 2�3 0�0 0�0 1�3 1�6 Other consumer loans ��������������������������������������������������������������������������������������� 3�8 3�4 3�7 3�3 3�9 0�0 0�0 0�0 3�8 Commercial and industrial loans ����������������������������������������������������������������������� 0�0 0�0 0�2 0�3 2�3 0�0 16�4 0�0 0�0 All other loans, leases, and other assets ���������������������������������������������������������� 1�1 1�5 2�6 2�2 3�5 0�0 0�0 0�1 1�1Total loans, leases, and other assets ����������������������������������������������������������������������� 4�8 5�0 5�0 5�1 5�2 3�4 1�4 2�1 4�8Securitized loans, leases, and Other Assets 90 Days or More Past Due (%) 1-4 family residential loans �������������������������������������������������������������������������������� 10�1 11�5 11�8 13�1 12�2 2�4 0�1 3�9 10�2 Home equity loans ��������������������������������������������������������������������������������������������� 0�0 0�0 0�0 0�0 2�0 0�0 0�0 0�0 0�0 Credit card receivables�������������������������������������������������������������������������������������� 0�5 0�5 0�7 0�8 3�0 0�0 3�2 0�0 0�4 Auto loans ���������������������������������������������������������������������������������������������������������� 0�3 0�3 0�2 0�3 0�2 0�0 0�0 0�1 0�4 Other consumer loans ��������������������������������������������������������������������������������������� 2�9 2�9 2�7 2�7 3�6 0�0 0�0 0�0 2�9 Commercial and industrial loans ����������������������������������������������������������������������� 0�0 0�0 0�1 0�1 1�0 0�0 0�0 0�0 0�0 All other loans, leases, and other assets ���������������������������������������������������������� 7�3 9�8 8�5 7�5 4�3 55�2 0�0 0�8 7�4Total loans, leases, and other assets ����������������������������������������������������������������������� 9�4 10�9 10�9 11�7 8�3 2�5 1�7 3�6 9�4Securitized loans, leases, and Other Assets Charged-off (net, YTD, annualized, %) 1-4 family residential loans �������������������������������������������������������������������������������� 1�2 0�9 0�6 0�3 1�5 0�0 0�0 0�0 1�2 Home equity loans ��������������������������������������������������������������������������������������������� 0�0 0�0 0�0 0�0 1�8 0�0 0�0 0�0 0�0 Credit card receivables�������������������������������������������������������������������������������������� 7�9 6�2 4�2 2�2 10�2 0�0 11�4 0�0 7�6 Auto loans ���������������������������������������������������������������������������������������������������������� 1�4 0�9 0�4 0�3 2�5 0�0 0�0 0�2 1�6 Other consumer loans ��������������������������������������������������������������������������������������� 1�8 1�4 0�9 0�4 1�0 0�0 0�0 0�0 1�8 Commercial and industrial loans ����������������������������������������������������������������������� 0�0 0�0 0�0 0�0 13�9 0�0 0�0 0�0 0�0 All other loans, leases, and other assets ���������������������������������������������������������� 0�4 0�2 0�0 0�0 0�1 0�0 0�0 0�0 0�4Total loans, leases, and other assets ����������������������������������������������������������������������� 1�1 0�9 0�6 0�3 3�6 0�0 5�8 0�0 1�1
Seller's Interests in Institution's Own Securitizations - Carried as loans Home equity loans ��������������������������������������������������������������������������������������������� 0 0 0 0 316 -100�0 0 0 0 0 Credit card receivables�������������������������������������������������������������������������������������� 7,350 6,073 5,088 4,831 62,235 -88�2 0 55 0 7,295 Commercial and industrial loans ����������������������������������������������������������������������� 2 2 3 4 894 -99�8 0 2 0 0Seller's Interests in Institution's Own Securitizations - Carried as Securities Home equity loans ��������������������������������������������������������������������������������������������� 0 0 0 0 1 -100�0 0 0 0 0 Credit card receivables�������������������������������������������������������������������������������������� 0 0 0 0 789 -100�0 0 0 0 0 Commercial and industrial loans ����������������������������������������������������������������������� 0 0 0 0 0 0�0 0 0 0 0
Assets Sold with recourse and Not Securitized Number of institutions reporting asset sales ���������������������������������������������������� 854 847 835 819 827 3�3 164 530 119 41Outstanding Principal Balance by Asset Type 1-4 family residential loans �������������������������������������������������������������������������������� 64,187 60,984 62,747 62,207 66,988 -4�2 1,260 13,519 6,072 43,335 Home equity, credit card receivables, auto, and other consumer loans ��������� 1,455 41 41 40 908 60�2 0 7 18 1,429 Commercial and industrial loans ����������������������������������������������������������������������� 379 445 537 669 2,654 -85�7 1 57 21 300 All other loans, leases, and other assets ���������������������������������������������������������� 53,860 52,950 52,435 48,635 48,736 10�5 9 83 316 53,453Total sold and not securitized������������������������������������������������������������������������������������ 119,881 114,420 115,760 111,551 119,286 0�5 1,270 13,666 6,427 98,517
Maximum Credit Exposure by Asset Type 1-4 family residential loans �������������������������������������������������������������������������������� 15,609 14,996 14,196 13,705 16,536 -5�6 168 2,218 3,537 9,686 Home equity, credit card receivables, auto, and other consumer loans ��������� 132 20 21 21 100 32�0 0 4 3 125 Commercial and industrial loans ����������������������������������������������������������������������� 90 77 77 62 1,934 -95�3 1 46 21 22 All other loans, leases, and other assets ���������������������������������������������������������� 13,115 12,899 12,749 10,429 10,391 26�2 3 59 10 13,043Total credit exposure ������������������������������������������������������������������������������������������������� 28,947 27,991 27,043 24,217 28,961 0�0 173 2,327 3,571 22,877
Support for Securitization Facilities Sponsored by Other Institutions Number of institutions reporting securitization facilities sponsored by others ������� 163 154 128 79 58 181�0 27 84 37 15Total credit exposure ������������������������������������������������������������������������������������������������� 29,571 28,311 9,259 6,445 4,297 588�2 26 249 146 29,150
Total unused liquidity commitments ������������������������������������������������������������������������� 514 504 418 846 545 -5�7 0 0 0 514
OtherAssets serviced for others** �������������������������������������������������������������������������������������� 5,782,925 5,891,882 5,956,566 5,995,635 6,011,088 -3�8 4,443 86,185 100,910 5,591,386Asset-backed commercial paper conduits Credit exposure to conduits sponsored by institutions and others ������������������ 10,009 11,649 10,699 10,653 15,953 -37�3 5 0 61 9,943 Unused liquidity commitments to conduits sponsored by institutions and others ��������������������������������������������������������������������������������������������������
61,339 82,137 83,062 87,156 170,373 -64�0 0 0 1,222 60,117
Net servicing income (for the quarter) ���������������������������������������������������������������������� 4,657 3,097 3,576 5,164 6,876 -32�3 36 155 242 4,225Net securitization income (for the quarter) ��������������������������������������������������������������� 150 164 156 13 1,615 -90�7 1 5 10 135Total credit exposure to Tier 1 capital (%)*** ������������������������������������������������������������ 5�5 5�4 3�7 3�3 15�9 1�20 2�30 2�70 6�50
* Line item titled “All other loans and all leases” for quarters prior to March 31, 2006� ** The amount of financial assets serviced for others, other than closed-end 1-4 family residential mortgages, is reported when these assets are greater than $10 million� *** Total credit exposure includes the sum of the three line items titled “Total credit exposure” reported above�
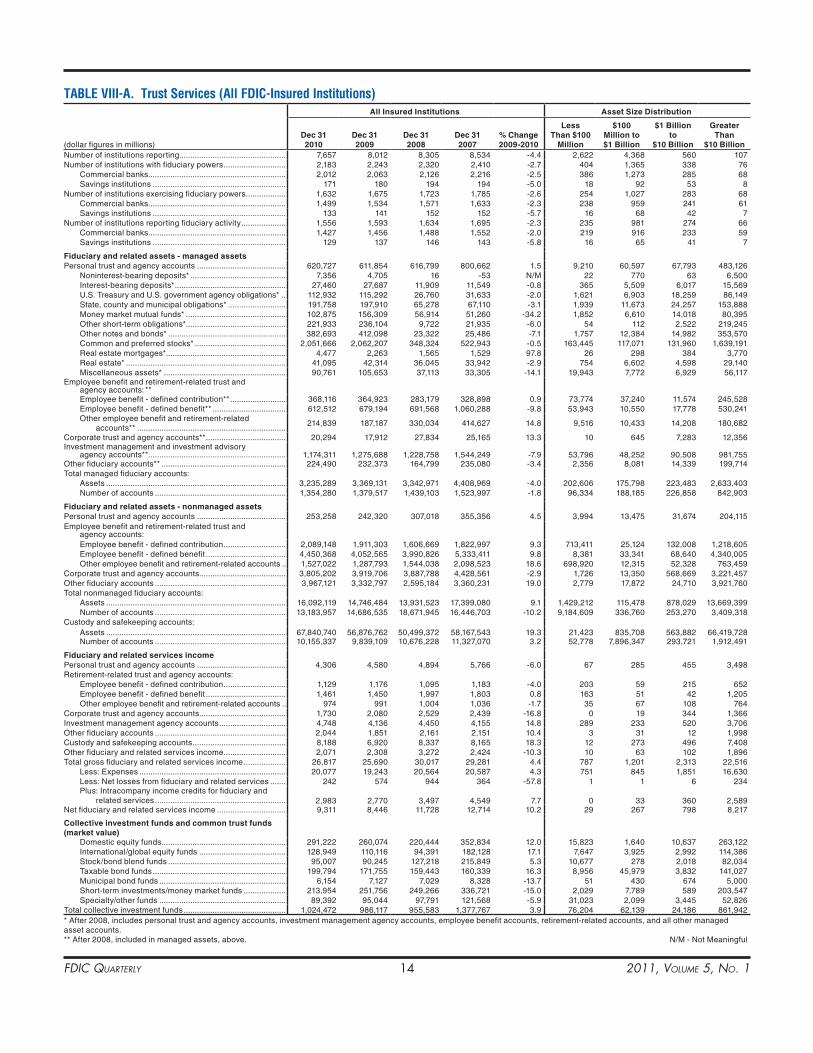
FDIC Quarterly 14 2011, Volume 5, No. 1
TABLE VIII-A. Trust Services (All FDIC-Insured Institutions)All Insured Institutions Asset Size Distribution
(dollar figures in millions)Dec 31 2010
Dec 31 2009
Dec 31 2008
Dec 31 2007
% Change 2009-2010
less Than $100
Million
$100 Million to $1 Billion
$1 Billion to
$10 Billion
Greater Than
$10 BillionNumber of institutions reporting ������������������������������������������������ 7,657 8,012 8,305 8,534 -4�4 2,622 4,368 560 107Number of institutions with fiduciary powers ���������������������������� 2,183 2,243 2,320 2,410 -2�7 404 1,365 338 76 Commercial banks �������������������������������������������������������������� 2,012 2,063 2,126 2,216 -2�5 386 1,273 285 68 Savings institutions ������������������������������������������������������������ 171 180 194 194 -5�0 18 92 53 8Number of institutions exercising fiduciary powers ������������������ 1,632 1,675 1,723 1,785 -2�6 254 1,027 283 68 Commercial banks �������������������������������������������������������������� 1,499 1,534 1,571 1,633 -2�3 238 959 241 61 Savings institutions ������������������������������������������������������������ 133 141 152 152 -5�7 16 68 42 7Number of institutions reporting fiduciary activity �������������������� 1,556 1,593 1,634 1,695 -2�3 235 981 274 66 Commercial banks �������������������������������������������������������������� 1,427 1,456 1,488 1,552 -2�0 219 916 233 59 Savings institutions ������������������������������������������������������������ 129 137 146 143 -5�8 16 65 41 7
Fiduciary and related assets - managed assets Personal trust and agency accounts ���������������������������������������� 620,727 611,854 616,799 800,662 1�5 9,210 60,597 67,793 483,126 Noninterest-bearing deposits* ������������������������������������������� 7,356 4,705 16 -53 N/M 22 770 63 6,500 Interest-bearing deposits* �������������������������������������������������� 27,460 27,687 11,909 11,549 -0�8 365 5,509 6,017 15,569 U�S� Treasury and U�S� government agency obligations* �� 112,932 115,292 26,760 31,633 -2�0 1,621 6,903 18,259 86,149 State, county and municipal obligations* �������������������������� 191,758 197,910 65,278 67,110 -3�1 1,939 11,673 24,257 153,888 Money market mutual funds* ��������������������������������������������� 102,875 156,309 56,914 51,260 -34�2 1,852 6,610 14,018 80,395 Other short-term obligations* ��������������������������������������������� 221,933 236,104 9,722 21,935 -6�0 54 112 2,522 219,245 Other notes and bonds* ����������������������������������������������������� 382,693 412,098 23,322 25,486 -7�1 1,757 12,384 14,982 353,570 Common and preferred stocks* ����������������������������������������� 2,051,666 2,062,207 348,324 522,943 -0�5 163,445 117,071 131,960 1,639,191 Real estate mortgages* ������������������������������������������������������ 4,477 2,263 1,565 1,529 97�8 26 298 384 3,770 Real estate* ������������������������������������������������������������������������ 41,095 42,314 36,045 33,942 -2�9 754 6,602 4,598 29,140 Miscellaneous assets* ������������������������������������������������������� 90,761 105,653 37,113 33,305 -14�1 19,943 7,772 6,929 56,117Employee benefit and retirement-related trust and agency accounts: ** Employee benefit - defined contribution** ������������������������� 368,116 364,923 283,179 328,898 0�9 73,774 37,240 11,574 245,528 Employee benefit - defined benefit** ��������������������������������� 612,512 679,194 691,568 1,060,288 -9�8 53,943 10,550 17,778 530,241 Other employee benefit and retirement-related accounts** �������������������������������������������������������������������
214,839 187,187 330,034 414,627 14�8 9,516 10,433 14,208 180,682
Corporate trust and agency accounts** ������������������������������������ 20,294 17,912 27,834 25,165 13�3 10 645 7,283 12,356Investment management and investment advisory agency accounts**�������������������������������������������������������������� 1,174,311 1,275,688 1,228,758 1,544,249 -7�9 53,796 48,252 90,508 981,755Other fiduciary accounts** �������������������������������������������������������� 224,490 232,373 164,799 235,080 -3�4 2,356 8,081 14,339 199,714Total managed fiduciary accounts: Assets ��������������������������������������������������������������������������������� 3,235,289 3,369,131 3,342,971 4,408,969 -4�0 202,606 175,798 223,483 2,633,403 Number of accounts ����������������������������������������������������������� 1,354,280 1,379,517 1,439,103 1,523,997 -1�8 96,334 188,185 226,858 842,903
Fiduciary and related assets - nonmanaged assets Personal trust and agency accounts ���������������������������������������� 253,258 242,320 307,018 355,356 4�5 3,994 13,475 31,674 204,115Employee benefit and retirement-related trust and agency accounts: Employee benefit - defined contribution ���������������������������� 2,089,148 1,911,303 1,606,669 1,822,997 9�3 713,411 25,124 132,008 1,218,605 Employee benefit - defined benefit ������������������������������������ 4,450,368 4,052,565 3,990,826 5,333,411 9�8 8,381 33,341 68,640 4,340,005 Other employee benefit and retirement-related accounts �� 1,527,022 1,287,793 1,544,038 2,098,523 18�6 698,920 12,315 52,328 763,459Corporate trust and agency accounts ��������������������������������������� 3,805,202 3,919,706 3,887,788 4,428,561 -2�9 1,726 13,350 568,669 3,221,457Other fiduciary accounts ����������������������������������������������������������� 3,967,121 3,332,797 2,595,184 3,360,231 19�0 2,779 17,872 24,710 3,921,760Total nonmanaged fiduciary accounts: Assets ��������������������������������������������������������������������������������� 16,092,119 14,746,484 13,931,523 17,399,080 9�1 1,429,212 115,478 878,029 13,669,399 Number of accounts ����������������������������������������������������������� 13,183,957 14,686,535 18,671,945 16,446,703 -10�2 9,184,609 336,760 253,270 3,409,318Custody and safekeeping accounts: Assets ��������������������������������������������������������������������������������� 67,840,740 56,876,762 50,499,372 58,167,543 19�3 21,423 835,708 563,882 66,419,728 Number of accounts ����������������������������������������������������������� 10,155,337 9,839,109 10,676,228 11,327,070 3�2 52,778 7,896,347 293,721 1,912,491
Fiduciary and related services income Personal trust and agency accounts ���������������������������������������� 4,306 4,580 4,894 5,766 -6�0 67 285 455 3,498Retirement-related trust and agency accounts: Employee benefit - defined contribution ���������������������������� 1,129 1,176 1,095 1,183 -4�0 203 59 215 652 Employee benefit - defined benefit ������������������������������������ 1,461 1,450 1,997 1,803 0�8 163 51 42 1,205 Other employee benefit and retirement-related accounts �� 974 991 1,004 1,036 -1�7 35 67 108 764Corporate trust and agency accounts ��������������������������������������� 1,730 2,080 2,529 2,439 -16�8 0 19 344 1,366Investment management agency accounts ������������������������������ 4,748 4,136 4,450 4,155 14�8 289 233 520 3,706Other fiduciary accounts ����������������������������������������������������������� 2,044 1,851 2,161 2,151 10�4 3 31 12 1,998Custody and safekeeping accounts ������������������������������������������ 8,188 6,920 8,337 8,165 18�3 12 273 496 7,408Other fiduciary and related services income ���������������������������� 2,071 2,308 3,272 2,424 -10�3 10 63 102 1,896Total gross fiduciary and related services income ������������������� 26,817 25,690 30,017 29,281 4�4 787 1,201 2,313 22,516 Less: Expenses ������������������������������������������������������������������ 20,077 19,243 20,564 20,587 4�3 751 845 1,851 16,630 Less: Net losses from fiduciary and related services ������� 242 574 944 364 -57�8 1 1 6 234 Plus: Intracompany income credits for fiduciary and related services ����������������������������������������������������������� 2,983 2,770 3,497 4,549 7�7 0 33 360 2,589Net fiduciary and related services income ������������������������������� 9,311 8,446 11,728 12,714 10�2 29 267 798 8,217
Collective investment funds and common trust funds (market value) Domestic equity funds �������������������������������������������������������� 291,222 260,074 220,444 352,834 12�0 15,823 1,640 10,637 263,122 International/global equity funds ��������������������������������������� 128,949 110,116 94,391 182,128 17�1 7,647 3,925 2,992 114,386 Stock/bond blend funds ����������������������������������������������������� 95,007 90,245 127,218 215,849 5�3 10,677 278 2,018 82,034 Taxable bond funds ������������������������������������������������������������ 199,794 171,755 159,443 160,339 16�3 8,956 45,979 3,832 141,027 Municipal bond funds ��������������������������������������������������������� 6,154 7,127 7,029 8,328 -13�7 51 430 674 5,000 Short-term investments/money market funds ������������������� 213,954 251,756 249,266 336,721 -15�0 2,029 7,789 589 203,547 Specialty/other funds ��������������������������������������������������������� 89,392 95,044 97,791 121,568 -5�9 31,023 2,099 3,445 52,826Total collective investment funds ���������������������������������������������� 1,024,472 986,117 955,583 1,377,767 3�9 76,204 62,139 24,186 861,942* After 2008, includes personal trust and agency accounts, investment management agency accounts, employee benefit accounts, retirement-related accounts, and all other managed asset accounts� ** After 2008, included in managed assets, above� N/M - Not Meaningful
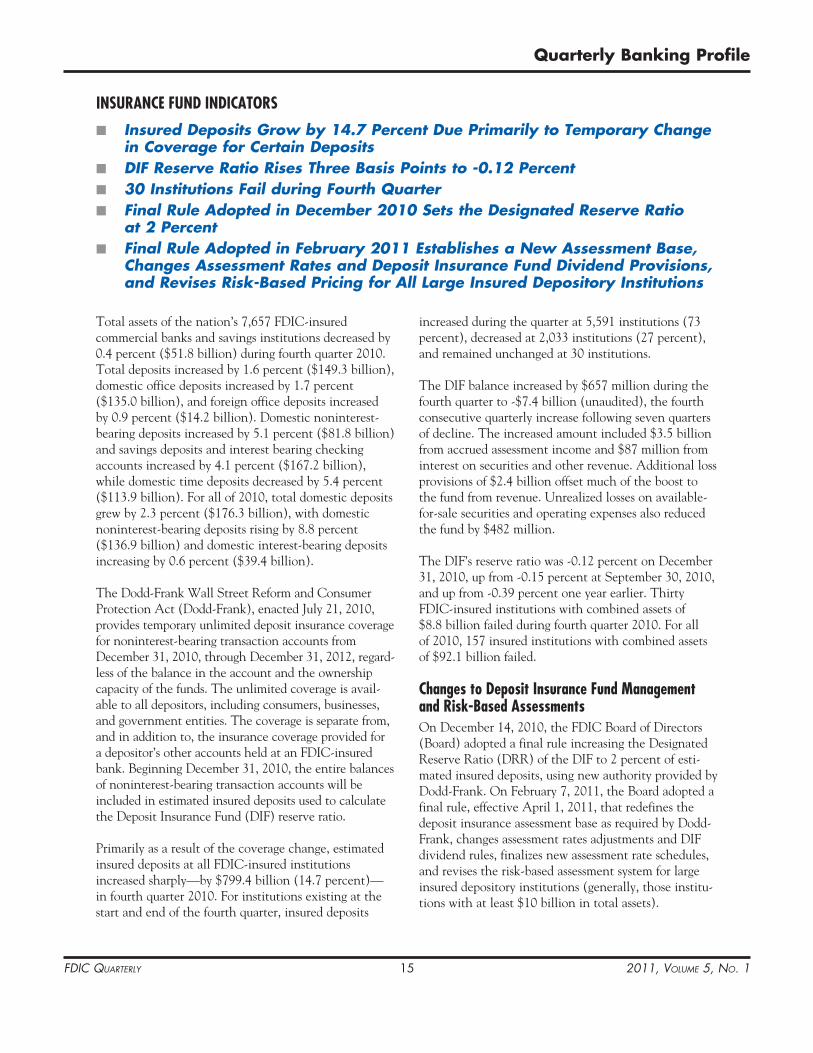
FDIC Quarterly 15 2011, Volume 5, No. 1
Quarterly Banking Profile
Total assets of the nation’s 7,657 FDIC-insured commercial banks and savings institutions decreased by 0.4 percent ($51.8 billion) during fourth quarter 2010. Total deposits increased by 1.6 percent ($149.3 billion), domestic office deposits increased by 1.7 percent ($135.0 billion), and foreign office deposits increased by 0.9 percent ($14.2 billion). Domestic noninterest-bearing deposits increased by 5.1 percent ($81.8 billion) and savings deposits and interest bearing checking accounts increased by 4.1 percent ($167.2 billion), while domestic time deposits decreased by 5.4 percent ($113.9 billion). For all of 2010, total domestic deposits grew by 2.3 percent ($176.3 billion), with domestic noninterest-bearing deposits rising by 8.8 percent ($136.9 billion) and domestic interest-bearing deposits increasing by 0.6 percent ($39.4 billion).
The Dodd-Frank Wall Street Reform and Consumer Protection Act (Dodd-Frank), enacted July 21, 2010, provides temporary unlimited deposit insurance coverage for noninterest-bearing transaction accounts from December 31, 2010, through December 31, 2012, regard-less of the balance in the account and the ownership capacity of the funds. The unlimited coverage is avail-able to all depositors, including consumers, businesses, and government entities. The coverage is separate from, and in addition to, the insurance coverage provided for a depositor’s other accounts held at an FDIC-insured bank. Beginning December 31, 2010, the entire balances of noninterest-bearing transaction accounts will be included in estimated insured deposits used to calculate the Deposit Insurance Fund (DIF) reserve ratio.
Primarily as a result of the coverage change, estimated insured deposits at all FDIC-insured institutions increased sharply—by $799.4 billion (14.7 percent)— in fourth quarter 2010. For institutions existing at the start and end of the fourth quarter, insured deposits
increased during the quarter at 5,591 institutions (73 percent), decreased at 2,033 institutions (27 percent), and remained unchanged at 30 institutions.
The DIF balance increased by $657 million during the fourth quarter to -$7.4 billion (unaudited), the fourth consecutive quarterly increase following seven quarters of decline. The increased amount included $3.5 billion from accrued assessment income and $87 million from interest on securities and other revenue. Additional loss provisions of $2.4 billion offset much of the boost to the fund from revenue. Unrealized losses on available-for-sale securities and operating expenses also reduced the fund by $482 million.
The DIF’s reserve ratio was -0.12 percent on December 31, 2010, up from -0.15 percent at September 30, 2010, and up from -0.39 percent one year earlier. Thirty FDIC-insured institutions with combined assets of $8.8 billion failed during fourth quarter 2010. For all of 2010, 157 insured institutions with combined assets of $92.1 billion failed.
Changes to Deposit Insurance Fund Management and Risk-Based AssessmentsOn December 14, 2010, the FDIC Board of Directors (Board) adopted a final rule increasing the Designated Reserve Ratio (DRR) of the DIF to 2 percent of esti-mated insured deposits, using new authority provided by Dodd-Frank. On February 7, 2011, the Board adopted a final rule, effective April 1, 2011, that redefines the deposit insurance assessment base as required by Dodd-Frank, changes assessment rates adjustments and DIF dividend rules, finalizes new assessment rate schedules, and revises the risk-based assessment system for large insured depository institutions (generally, those institu-tions with at least $10 billion in total assets).
■ Insured Deposits Grow by 14.7 Percent Due Primarily to Temporary Change in Coverage for Certain Deposits
■ DIF Reserve Ratio Rises Three Basis Points to -0.12 Percent■ 30 Institutions Fail during Fourth Quarter■ Final Rule Adopted in December 2010 Sets the Designated Reserve Ratio
at 2 Percent■ Final Rule Adopted in February 2011 Establishes a New Assessment Base,
Changes Assessment Rates and Deposit Insurance Fund Dividend Provisions, and Revises Risk-Based Pricing for All Large Insured Depository Institutions
INSURANCE FUND INDICATORS
FDIC Quarterly 16 2011, Volume 5, No. 1
Table 1 compares the distribution of the current and estimated new assessment bases by institution asset size, using data as of December 31, 2010. The new assess-ment base, which will take effect April 1, 2011, will require collection of some data not yet available. The table therefore provides only an estimate of what the assessment base would be if it were in effect as of December 31, 2010.
Dodd-Frank requires that, for at least five years, the FDIC must make available to the public the reserve ratio and the DRR using both estimated insured deposits and the new assessment base. As explained in the footnotes to Table 1, the new assessment base will require some changes in reporting, so only an estimate is available at this time. As of December 31, 2010, the FDIC reserve ratio would have been -0.06 percent using the new assessment base (compared to -0.12 percent using estimated insured deposits), and the 2 percent DRR based on estimated insured deposits would have been 1.0 percent using the estimated new assessment base.
Adjustments to Assessment RatesThe current assessment rate schedule incorporates adjustments for types of funding that either pose height-ened risk to the DIF or that help offset risk to the DIF. Because the magnitude of these adjustments is cali-brated to a domestic deposit assessment base, the final rule recalibrates the unsecured debt and brokered deposit adjustments, and eliminates the secured liability adjustment.2 The final rule also adds a depository insti-tution debt adjustment for institutions that hold the long-term unsecured debt of other insured depository
2 The final rule changes the assessment rate reduction for long-term unsecured liabilities so that the effect of the assessment system on an institution’s cost of borrowing long-term unsecured debt will remain unchanged. The final rule changes the cap on the adjustment from 5 basis points to the lesser of 5 basis points or 50 percent of an institution’s initial base assessment rate to ensure that no institution’s assessment rate is zero or close to zero. In addition, the final rule removes Qualified Tier 1 capital from the definition of long-term unse-cured liabilities for small institutions, since it is already deducted from the assessment base. The final rule also eliminates debt that is redeemable within one year of the reporting date from qualifying as long-term, since such a redemption option negates the benefit to the DIF of long-term debt. The final rule retains the brokered deposit adjustment of 25 basis points times the ratio of brokered deposits in excess of 10 percent of domestic deposits to the new assessment base. For small institutions, the adjustment would continue to apply only to institutions in Risk Categories II, III, and IV. For large institu-tions, the final rule provides an exemption from the adjustment for institutions that are well-capitalized and have a composite CAMELS rating of 1 or 2. The final rule maintains the 10 basis points cap on the brokered deposit adjustment.
Designated Reserve RatioThe FDIC must set a DRR each year. Dodd-Frank raised the minimum DRR to 1.35 percent from 1.15 percent of estimated insured deposits. It also removed the upper limit (formerly 1.5 percent) on the DRR. In December 2010, the Board adopted a final rule setting the DRR at 2 percent. The FDIC views this target as a long-term minimum goal for the fund. An analysis conducted by FDIC staff found that a 2 percent target would significantly improve the chances that the FDIC could maintain stable, moderate insurance assessment rates through economic or banking cycles while also maintaining a positive DIF balance even during a seri-ous economic or banking downturn.
Change in the Assessment BaseDodd-Frank required the FDIC to amend its regulations to define the assessment base as average consolidated total assets minus average tangible equity, rather than total domestic deposits (the assessment base, with minor adjust-ments, that has been in place since 1935). The final rule requires that all insured depository institutions report aver-age daily balances of consolidated total assets during the quarter. However, existing institutions with assets of less than $1 billion may report average weekly balances, unless they choose to report daily averages. Once an institution reports using daily averages, however, it would have to continue to do so. Under the final rule, Tier 1 capital is the measure for tangible equity. Institutions will report the average of month-end balances of Tier 1 capital, but existing institutions with less than $1 billion in average consolidated total assets could report the end-of-quarter amount of Tier 1 capital. As allowed by Dodd-Frank, the final rule deducts low-risk, liquid assets from the assess-ment base for banker’s banks and custodial banks.1
1 A banker’s bank could deduct the sum of its average balances due from Federal Reserve Banks (reserve balances) plus its average federal funds sold. The amount of this deduction, however, could not exceed the sum of the bank’s average deposit liabilities from commercial banks and other depository institutions in the United States plus its average federal funds purchased. Funds resulting from government capital infusion programs, FDIC stock ownership, and employee compensation plan stock owner-ship will not disqualify a bank from being considered a banker’s bank. The final rule defines a custodial bank as an insured depository institu-tion having previous calendar year-end fiduciary account and custody and safekeeping account assets of at least $50 billion or an insured depository institution deriving at least 50 percent of its revenue from fiduciary accounts and custody and safekeeping accounts over the previ-ous calendar year. Low-risk assets would be assets with a Basel risk weighting of 0 percent, regardless of maturity, plus 50 percent of those assets with a Basel risk weighting of 20 percent, again regardless of maturity, subject to the limitation that the value of these assets could not exceed the daily or weekly average value of those deposits classified as transaction accounts and identified by the institution as being directly linked to a fiduciary or custody and safekeeping account.
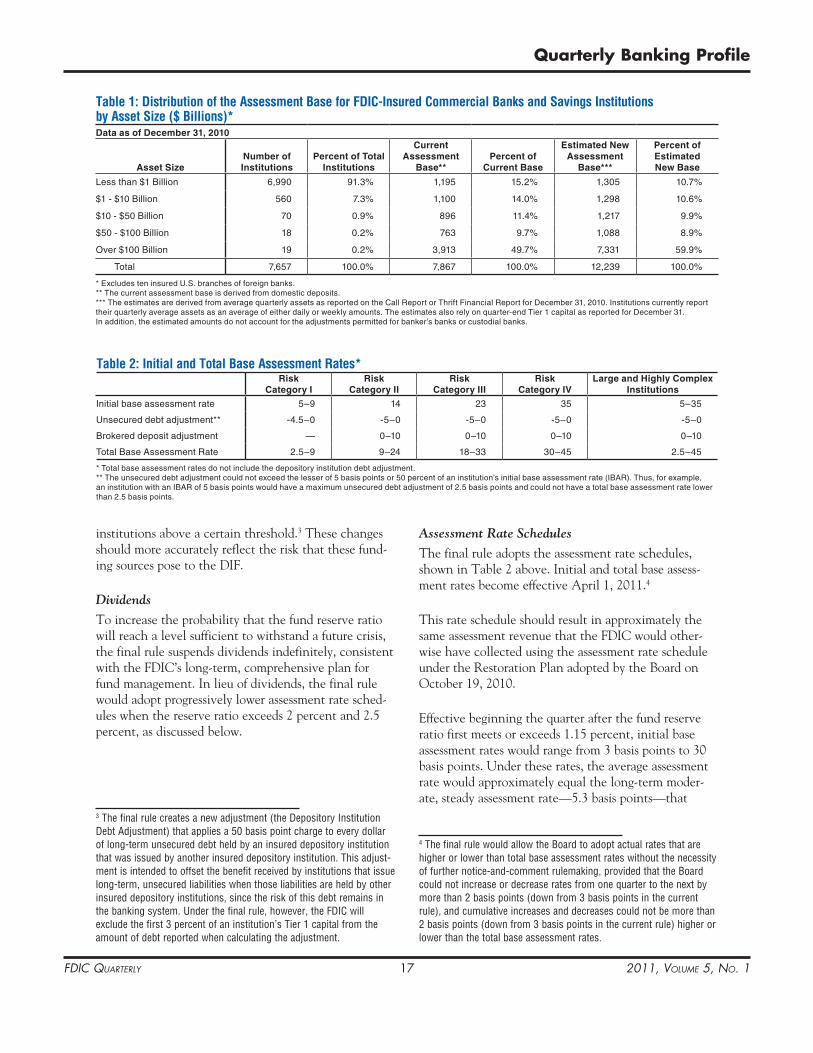
FDIC Quarterly 17 2011, Volume 5, No. 1
Quarterly Banking Profile
Assessment Rate SchedulesThe final rule adopts the assessment rate schedules, shown in Table 2 above. Initial and total base assess-ment rates become effective April 1, 2011.4
This rate schedule should result in approximately the same assessment revenue that the FDIC would other-wise have collected using the assessment rate schedule under the Restoration Plan adopted by the Board on October 19, 2010.
Effective beginning the quarter after the fund reserve ratio first meets or exceeds 1.15 percent, initial base assessment rates would range from 3 basis points to 30 basis points. Under these rates, the average assessment rate would approximately equal the long-term moder-ate, steady assessment rate—5.3 basis points—that
4 The final rule would allow the Board to adopt actual rates that are higher or lower than total base assessment rates without the necessity of further notice-and-comment rulemaking, provided that the Board could not increase or decrease rates from one quarter to the next by more than 2 basis points (down from 3 basis points in the current rule), and cumulative increases and decreases could not be more than 2 basis points (down from 3 basis points in the current rule) higher or lower than the total base assessment rates.
institutions above a certain threshold.3 These changes should more accurately reflect the risk that these fund-ing sources pose to the DIF.
DividendsTo increase the probability that the fund reserve ratio will reach a level sufficient to withstand a future crisis, the final rule suspends dividends indefinitely, consistent with the FDIC’s long-term, comprehensive plan for fund management. In lieu of dividends, the final rule would adopt progressively lower assessment rate sched-ules when the reserve ratio exceeds 2 percent and 2.5 percent, as discussed below.
3 The final rule creates a new adjustment (the Depository Institution Debt Adjustment) that applies a 50 basis point charge to every dollar of long-term unsecured debt held by an insured depository institution that was issued by another insured depository institution. This adjust-ment is intended to offset the benefit received by institutions that issue long-term, unsecured liabilities when those liabilities are held by other insured depository institutions, since the risk of this debt remains in the banking system. Under the final rule, however, the FDIC will exclude the first 3 percent of an institution’s Tier 1 capital from the amount of debt reported when calculating the adjustment.
Table 1: Distribution of the Assessment Base for FDIC-Insured Commercial Banks and Savings Institutions by Asset Size ($ Billions)*Data as of December 31, 2010
Asset SizeNumber of Institutions
Percent of Total Institutions
Current Assessment
Base**Percent of
Current Base
Estimated New Assessment
Base***
Percent of Estimated New Base
Less than $1 Billion 6,990 91�3% 1,195 15�2% 1,305 10�7%
$1 - $10 Billion 560 7�3% 1,100 14�0% 1,298 10�6%
$10 - $50 Billion 70 0�9% 896 11�4% 1,217 9�9%
$50 - $100 Billion 18 0�2% 763 9�7% 1,088 8�9%
Over $100 Billion 19 0�2% 3,913 49�7% 7,331 59�9%
Total 7,657 100�0% 7,867 100�0% 12,239 100�0%
* Excludes ten insured U�S� branches of foreign banks�** The current assessment base is derived from domestic deposits� *** The estimates are derived from average quarterly assets as reported on the Call Report or Thrift Financial Report for December 31, 2010� Institutions currently report their quarterly average assets as an average of either daily or weekly amounts� The estimates also rely on quarter-end Tier 1 capital as reported for December 31� In addition, the estimated amounts do not account for the adjustments permitted for banker’s banks or custodial banks�
Table 2: Initial and Total Base Assessment Rates*risk
Category Irisk
Category IIrisk
Category IIIrisk
Category IVlarge and highly Complex
Institutions
Initial base assessment rate 5–9 14 23 35 5–35
Unsecured debt adjustment** -4�5–0 -5–0 -5–0 -5–0 -5–0
Brokered deposit adjustment — 0–10 0–10 0–10 0–10
Total Base Assessment Rate 2�5–9 9–24 18–33 30–45 2�5–45
* Total base assessment rates do not include the depository institution debt adjustment� ** The unsecured debt adjustment could not exceed the lesser of 5 basis points or 50 percent of an institution’s initial base assessment rate (IBAR)� Thus, for example, an institution with an IBAR of 5 basis points would have a maximum unsecured debt adjustment of 2�5 basis points and could not have a total base assessment rate lower than 2�5 basis points�
FDIC Quarterly 18 2011, Volume 5, No. 1
Large Bank PricingThe final rule eliminates risk categories for large institu-tions.5 In addition, as required by Dodd-Frank, the final rule no longer uses long-term debt issuer ratings to calculate assessment rates for large institutions. The new large bank pricing rule combines CAMELS ratings and certain forward-looking financial measures into two scorecards—one for most large institutions and another for the remaining very large institutions that are struc-turally and operationally complex or that pose unique challenges and risks in case of failure (highly complex institutions).6 The FDIC retains its ability to take addi-tional information into account to make a limited adjustment to an institution’s total score (the large bank adjustment), which will be used to determine an institution’s initial base assessment rate.
Author: Kevin Brown, Sr. Financial Analyst Division of Insurance and Research (202) 898-6817
5 Generally, these are institutions with at least $10 billion in assets.6 In general, a highly complex institution is an institution (other than a credit card bank) with more than $50 billion in total assets that is controlled by a parent or intermediate parent company with more than $500 billion in total assets or a processing bank or trust company with total fiduciary assets of $500 billion or more.
would have been needed to maintain a positive fund balance throughout past crises.
The final rule also sets out two assessment rate schedules that would take effect without further action by the Board when the fund reserve ratio meets or exceeds 2 percent and 2.5 percent. Historical analysis by FDIC staff revealed that reducing the 5.3 basis point weighted average assessment rate by 25 percent when the reserve ratio reached 2 percent and by 50 percent when the reserve ratio reached 2.5 percent would have allowed the fund to remain positive during prior bank-ing crises and would have successfully limited rate volatility.
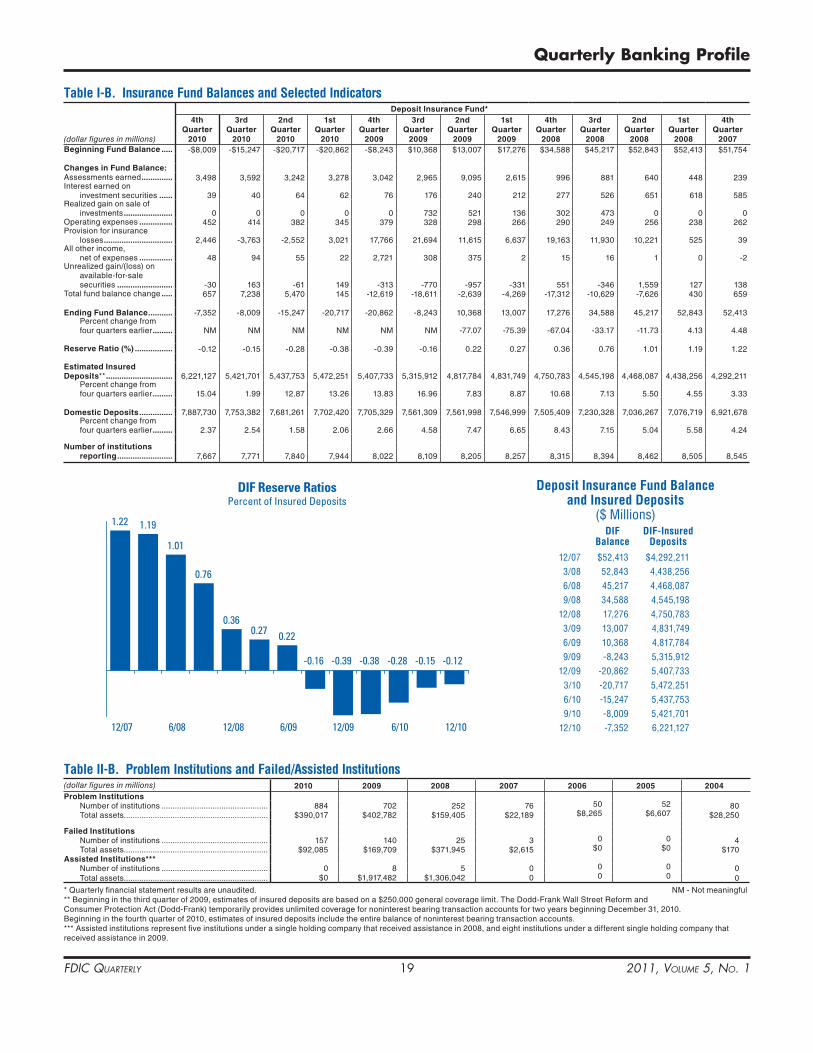
FDIC Quarterly 19 2011, Volume 5, No. 1
Quarterly Banking Profile
DIF Reserve RatiosPercent of Insured Deposits
1.22 1.19
1.01
0.76
0.360.27 0.22
-0.16 -0.39 -0.38 -0.28 -0.15 -0.12
12/07 6/08 12/08 6/09 12/09 6/10 12/10
Table I-B. Insurance Fund Balances and Selected Indicators
(dollar figures in millions)
Deposit Insurance Fund*4th
Quarter 2010
3rd Quarter
2010
2nd Quarter
2010
1st Quarter
2010
4th Quarter
2009
3rd Quarter
2009
2nd Quarter
2009
1st Quarter
2009
4th Quarter
2008
3rd Quarter
2008
2nd Quarter
2008
1st Quarter
2008
4th Quarter
2007Beginning Fund Balance ..... -$8,009 -$15,247 -$20,717 -$20,862 -$8,243 $10,368 $13,007 $17,276 $34,588 $45,217 $52,843 $52,413 $51,754
Changes in Fund Balance:Assessments earned .............. 3,498 3,592 3,242 3,278 3,042 2,965 9,095 2,615 996 881 640 448 239Interest earned on investment securities ...... 39 40 64 62 76 176 240 212 277 526 651 618 585Realized gain on sale of investments ...................... 0 0 0 0 0 732 521 136 302 473 0 0 0Operating expenses ............... 452 414 382 345 379 328 298 266 290 249 256 238 262Provision for insurance losses ............................... 2,446 -3,763 -2,552 3,021 17,766 21,694 11,615 6,637 19,163 11,930 10,221 525 39All other income, net of expenses ............... 48 94 55 22 2,721 308 375 2 15 16 1 0 -2Unrealized gain/(loss) on available-for-sale securities ......................... -30 163 -61 149 -313 -770 -957 -331 551 -346 1,559 127 138Total fund balance change ..... 657 7,238 5,470 145 -12,619 -18,611 -2,639 -4,269 -17,312 -10,629 -7,626 430 659
Ending Fund Balance ........... -7,352 -8,009 -15,247 -20,717 -20,862 -8,243 10,368 13,007 17,276 34,588 45,217 52,843 52,413 Percent change from four quarters earlier ......... NM NM NM NM NM NM -77�07 -75�39 -67�04 -33�17 -11�73 4�13 4�48
reserve ratio (%) ................. -0�12 -0�15 -0�28 -0�38 -0�39 -0�16 0�22 0�27 0�36 0�76 1�01 1�19 1�22
Estimated Insured Deposits** .............................. 6,221,127 5,421,701 5,437,753 5,472,251 5,407,733 5,315,912 4,817,784 4,831,749 4,750,783 4,545,198 4,468,087 4,438,256 4,292,211 Percent change from four quarters earlier ......... 15�04 1�99 12�87 13�26 13�83 16�96 7�83 8�87 10�68 7�13 5�50 4�55 3�33
Domestic Deposits ............... 7,887,730 7,753,382 7,681,261 7,702,420 7,705,329 7,561,309 7,561,998 7,546,999 7,505,409 7,230,328 7,036,267 7,076,719 6,921,678 Percent change from four quarters earlier ......... 2�37 2�54 1�58 2�06 2�66 4�58 7�47 6�65 8�43 7�15 5�04 5�58 4�24
Number of institutions reporting ......................... 7,667 7,771 7,840 7,944 8,022 8,109 8,205 8,257 8,315 8,394 8,462 8,505 8,545
Deposit Insurance Fund Balance and Insured Deposits
($ Millions)DIF
BalanceDIF-Insured
Deposits
12/07 $52,413 $4,292,2113/08 52,843 4,438,2566/08 45,217 4,468,0879/08 34,588 4,545,198
12/08 17,276 4,750,7833/09 13,007 4,831,7496/09 10,368 4,817,7849/09 -8,243 5,315,912
12/09 -20,862 5,407,7333/10 -20,717 5,472,2516/10 -15,247 5,437,7539/10 -8,009 5,421,701
12/10 -7,352 6,221,127
Table II-B. Problem Institutions and Failed/Assisted Institutions(dollar figures in millions) 2010 2009 2008 2007 2006 2005 2004Problem Institutions Number of institutions ������������������������������������������������ 884 702 252 76 50 52 80 Total assets ����������������������������������������������������������������� $390,017 $402,782 $159,405 $22,189 $8,265 $6,607 $28,250
Failed Institutions Number of institutions ������������������������������������������������ 157 140 25 3 0 0 4 Total assets ����������������������������������������������������������������� $92,085 $169,709 $371,945 $2,615 $0 $0 $170Assisted Institutions*** Number of institutions ������������������������������������������������ 0 8 5 0 0 0 0 Total assets ����������������������������������������������������������������� $0 $1,917,482 $1,306,042 0 0 0 0
* Quarterly financial statement results are unaudited� NM - Not meaningful** Beginning in the third quarter of 2009, estimates of insured deposits are based on a $250,000 general coverage limit� The Dodd-Frank Wall Street Reform and Consumer Protection Act (Dodd-Frank) temporarily provides unlimited coverage for noninterest bearing transaction accounts for two years beginning December 31, 2010� Beginning in the fourth quarter of 2010, estimates of insured deposits include the entire balance of noninterest bearing transaction accounts�*** Assisted institutions represent five institutions under a single holding company that received assistance in 2008, and eight institutions under a different single holding company that received assistance in 2009�
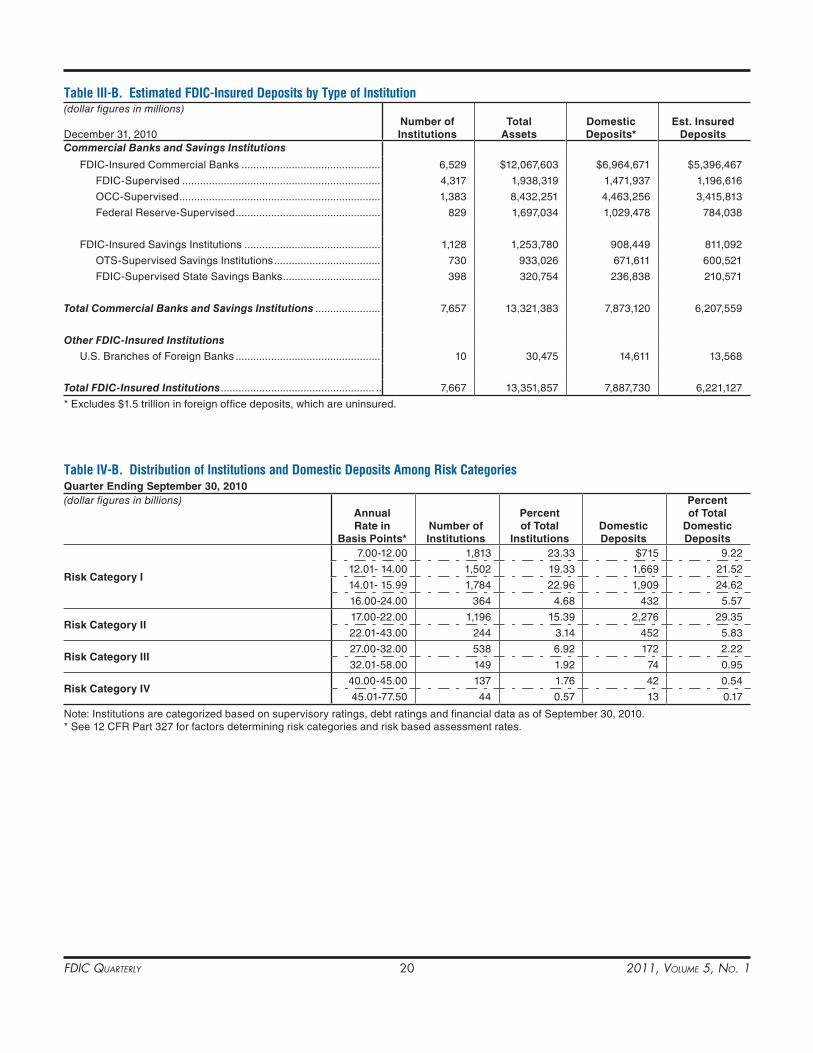
FDIC Quarterly 20 2011, Volume 5, No. 1
Table III-B. Estimated FDIC-Insured Deposits by Type of Institution(dollar figures in millions)
December 31, 2010Number of Institutions
Total Assets
Domestic Deposits*
Est. Insured Deposits
Commercial Banks and Savings Institutions
FDIC-Insured Commercial Banks ����������������������������������������������� 6,529 $12,067,603 $6,964,671 $5,396,467
FDIC-Supervised ������������������������������������������������������������������� 4,317 1,938,319 1,471,937 1,196,616
OCC-Supervised �������������������������������������������������������������������� 1,383 8,432,251 4,463,256 3,415,813
Federal Reserve-Supervised ������������������������������������������������� 829 1,697,034 1,029,478 784,038
FDIC-Insured Savings Institutions ���������������������������������������������� 1,128 1,253,780 908,449 811,092
OTS-Supervised Savings Institutions ������������������������������������ 730 933,026 671,611 600,521
FDIC-Supervised State Savings Banks ��������������������������������� 398 320,754 236,838 210,571
Total Commercial Banks and Savings Institutions ���������������������� 7,657 13,321,383 7,873,120 6,207,559
Other FDIC-Insured Institutions
U�S� Branches of Foreign Banks ������������������������������������������������� 10 30,475 14,611 13,568
Total FDIC-Insured Institutions ���������������������������������������������������� �� 7,667 13,351,857 7,887,730 6,221,127
* Excludes $1�5 trillion in foreign office deposits, which are uninsured�
Table IV-B. Distribution of Institutions and Domestic Deposits Among Risk CategoriesQuarter Ending September 30, 2010(dollar figures in billions)
Annual rate in
Basis Points*Number of Institutions
Percent of Total
InstitutionsDomestic Deposits
Percent of Total
Domestic Deposits
risk Category I
7�00-12�00 1,813 23�33 $715 9�22
12�01- 14�00 1,502 19�33 1,669 21�52
14�01- 15�99 1,784 22�96 1,909 24�62
16�00-24�00 364 4�68 432 5�57
risk Category II 17�00-22�00 1,196 15�39 2,276 29�35
22�01-43�00 244 3�14 452 5�83
risk Category III 27�00-32�00 538 6�92 172 2�22
32�01-58�00 149 1�92 74 0�95
risk Category IV 40�00-45�00 137 1�76 42 0�54
45�01-77�50 44 0�57 13 0�17
Note: Institutions are categorized based on supervisory ratings, debt ratings and financial data as of September 30, 2010� * See 12 CFR Part 327 for factors determining risk categories and risk based assessment rates�
FDIC Quarterly 21 2011, Volume 5, No. 1
Quarterly Banking Profile
FDIC Responds to Market Disruptions with TLGPThe FDIC Board of Directors (Board) approved the Temporary Liquidity Guarantee Program (TLGP) on October 13, 2008, as major disruptions in credit markets blocked access to liquidity for financial institutions.1 The TLGP improved access to liquidity through two programs: the Transaction Account Guarantee Program (TAGP), which fully guarantees noninterest-bearing transaction deposit accounts above $250,000, regardless of dollar amount; and the Debt Guarantee Program (DGP), which guarantees eligible senior unsecured debt issued by eligible institutions.
All insured depository institutions were eligible to participate in the TAGP. Institutions eligible to partici-pate in the DGP were insured depository institutions, U.S. bank holding companies, certain U.S. savings and loan holding companies, and other affiliates of insured depository institutions that the FDIC designated as eligible entities.
FDIC Extends Guarantee ProgramsAlthough financial markets improved significantly in the first half of 2009, portions of the industry were still affected by the recent economic turmoil. To facilitate the orderly phase-out of the TLGP, and to continue access to FDIC guarantees where they were needed, the Board extended both the DGP and TAGP.
On March 17, 2009, the Board voted to extend the deadline for issuance of guaranteed debt from June 30, 2009, to October 31, 2009, and to extend the expira-tion date of the guarantee to the earlier of maturity of the debt or December 31, 2012, from June 30, 2012. The Board adopted a final rule on October 20, 2009, that allowed the DGP to expire on October 31, 2009.2
1 The FDIC invoked the systemic risk exception pursuant to section 141 of the Federal Deposit Improvement Act of 1991, 12 U.S.C 1823(c)(4) on October 13, 2008. For further information on the TLGP, see http://www.fdic.gov/regulations/resources/TLGP/index.html. 2 See http://www.fdic.gov/regulations/laws/federal/2009/09final AD37Oct23.pdf.
A final rule extending the TAGP six months, to June 30, 2010, was adopted on August 26, 2009. On June 22, 2010, the Board adopted a final rule extending the TAGP for another six months, through December 31, 2010.
Noninterest-Bearing Transaction Accounts Fully Insured under Dodd-Frank Reform BillAccording to the Dodd-Frank Wall Street Reform and Consumer Protection Act, noninterest-bearing transaction accounts at all FDIC-insured institutions will be fully insured for two years. This amendment became effective on December 31, 2010. Coverage of noninterest-bearing transaction accounts is separate from the regular insurance limit of $250,000. Assess-ments for noninterest-bearing transaction accounts will be included in the regular assessments for insured institutions.3
Program Funded by Industry Fees and AssessmentsThe TLGP did not rely on taxpayer funding or the Deposit Insurance Fund. Both the TAGP and the DGP were paid for by direct user fees. As of March 31, 2010, fees totaling $10.4 billion had been assessed under the DGP. A total of $1.1 billion in fees had been collected under the TAGP by December 31, 2010.
A Majority of Eligible Entities Chose to Participate in the TLGPAbout 74 percent of FDIC-insured institutions opted in to the TAGP extension through December 31, 2010. More than half of all eligible entities opted in to the DGP. Lists of institutions that opted out of the guarantee programs are posted at http://www.fdic.gov/regulations/resources/TLGP/optout.html.
3 See http://www.fdic.gov/regulations/reform/summary.html.
■ Debt Guarantee Program Ended October 31, 2009■ Transaction Account Guarantee Program Ended December 31, 2010■ All Noninterest-Bearing Transaction Deposit Accounts Insured under
Dodd-Frank Reform Bill■ $267 Billion Outstanding in Debt Guarantee Program
TEMPORARY LIQUIDITY GUARANTEE PROGRAM
FDIC Quarterly 22 2011, Volume 5, No. 1
Debt outstanding at December 31, 2010, had longer terms at issuance, compared with debt outstanding at year-end 2008. Over 90 percent matures more than two years after issuance, compared with 39 percent at December 31, 2008. Among types of debt instruments, 92 percent was in medium-term notes, compared with 44 percent at year-end 2008. The share of outstanding debt in commercial paper fell to 0 percent from 43 percent at year-end 2008.
Author: Katherine Wyatt Chief, Financial Analysis Section Division of Insurance and Research (202) 898-6755
$114 Billion in Transaction Accounts over $250,000 GuaranteedAccording to fourth quarter 2010 Call and Thrift Financial Reports, insured institutions participating in the TAGP reported an average of 198,361 noninterest-bearing transaction accounts over $250,000 during the quarter. The average deposit balances in these accounts totaled $164 billion, of which $114 billion was guaran-teed under the TAGP. More than 5,100 FDIC-insured institutions reported TAGP accounts.4
$267 Billion in FDIC-Guaranteed Debt Was Outstanding at December 31, 2010Sixty-six financial entities—39 insured depository insti-tutions and 27 bank and thrift holding companies and nonbank affiliates—had $267 billion in guaranteed debt outstanding at the end of fourth quarter 2010. Some banking groups issued FDIC-guaranteed debt at both the subsidiary and holding company level, but most guaranteed debt was issued by holding companies or nonbank affiliates of depository institutions. Bank and thrift holding companies and nonbank affiliates issued 85 percent of FDIC-guaranteed debt outstanding at December 31, 2010.
4 Insured institutions participating in the TAGP reported the average daily amount in TAGP accounts and the average daily number of TAGP accounts in their September 30, 2010, and December 31, 2010, Call and Thrift Financial Reports.
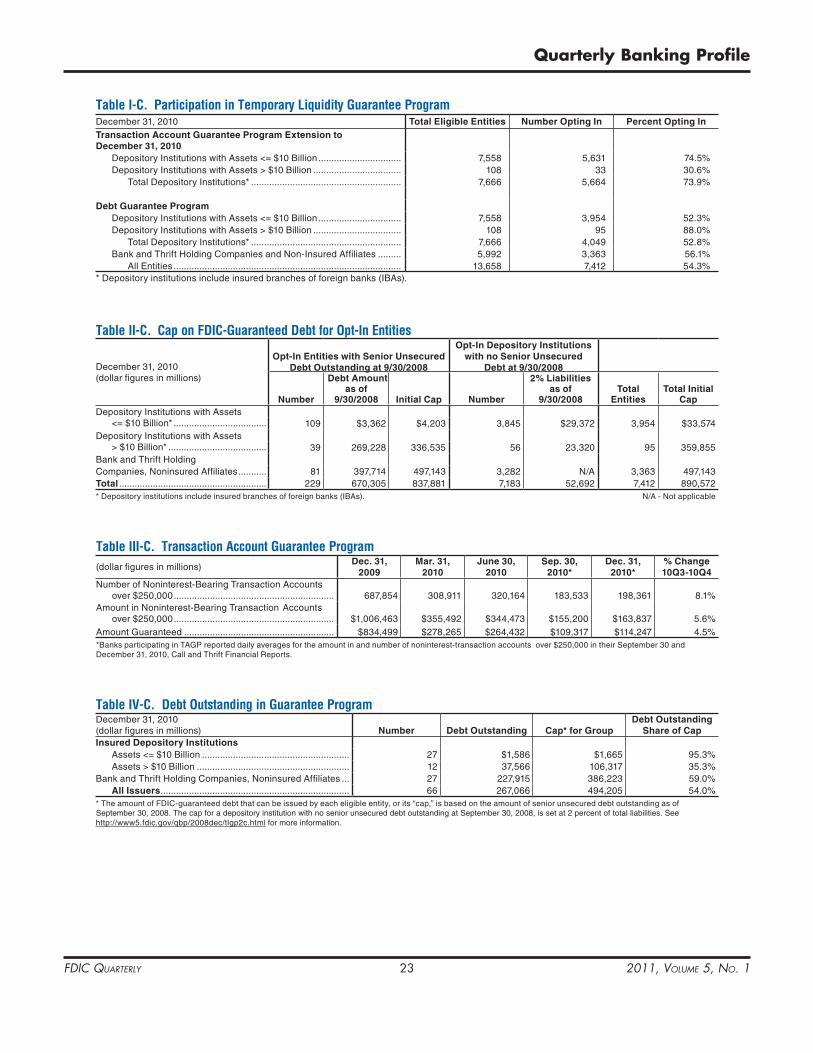
FDIC Quarterly 23 2011, Volume 5, No. 1
Quarterly Banking Profile
Table I-C. Participation in Temporary Liquidity Guarantee ProgramDecember 31, 2010 Total Eligible Entities Number Opting In Percent Opting InTransaction Account Guarantee Program Extension to December 31, 2010
Depository Institutions with Assets <= $10 Billion �������������������������������� 7,558 5,631 74�5%Depository Institutions with Assets > $10 Billion ���������������������������������� 108 33 30�6%
Total Depository Institutions* ���������������������������������������������������������� 7,666 5,664 73�9%
Debt Guarantee ProgramDepository Institutions with Assets <= $10 Billion �������������������������������� 7,558 3,954 52�3%Depository Institutions with Assets > $10 Billion ���������������������������������� 108 95 88�0%
Total Depository Institutions* ���������������������������������������������������������� 7,666 4,049 52�8%Bank and Thrift Holding Companies and Non-Insured Affiliates ��������� 5,992 3,363 56�1%
All Entities ���������������������������������������������������������������������������������������� 13,658 7,412 54�3%* Depository institutions include insured branches of foreign banks (IBAs)�
Table IV-C. Debt Outstanding in Guarantee Program December 31, 2010(dollar figures in millions) Number Debt Outstanding Cap* for Group
Debt Outstanding Share of Cap
Insured Depository InstitutionsAssets <= $10 Billion ��������������������������������������������������������� 27 $1,586 $1,665 95�3%Assets > $10 Billion ����������������������������������������������������������� 12 37,566 106,317 35�3%
Bank and Thrift Holding Companies, Noninsured Affiliates ��� 27 227,915 386,223 59�0%All Issuers ������������������������������������������������������������������������� 66 267,066 494,205 54�0%
* The amount of FDIC-guaranteed debt that can be issued by each eligible entity, or its “cap,” is based on the amount of senior unsecured debt outstanding as of September 30, 2008� The cap for a depository institution with no senior unsecured debt outstanding at September 30, 2008, is set at 2 percent of total liabilities� See http://www5�fdic�gov/qbp/2008dec/tlgp2c�html for more information�
Table III-C. Transaction Account Guarantee Program(dollar figures in millions)
Dec. 31, 2009
Mar. 31, 2010
June 30, 2010
Sep. 30, 2010*
Dec. 31, 2010*
% Change 10Q3-10Q4
Number of Noninterest-Bearing Transaction Accounts over $250,000 �������������������������������������������������������������� 687,854 308,911 320,164 183,533 198,361 8�1%
Amount in Noninterest-Bearing Transaction Accounts over $250,000 �������������������������������������������������������������� $1,006,463 $355,492 $344,473 $155,200 $163,837 5�6%
Amount Guaranteed ���������������������������������������������������������� $834,499 $278,265 $264,432 $109,317 $114,247 4�5%*Banks participating in TAGP reported daily averages for the amount in and number of noninterest-transaction accounts over $250,000 in their September 30 and December 31, 2010, Call and Thrift Financial Reports�
Table II-C. Cap on FDIC-Guaranteed Debt for Opt-In Entities
December 31, 2010 (dollar figures in millions)
Opt-In Entities with Senior unsecured Debt Outstanding at 9/30/2008
Opt-In Depository Institutions with no Senior unsecured
Debt at 9/30/2008
Number
Debt Amount as of
9/30/2008 Initial Cap Number
2% liabilities as of
9/30/2008Total
EntitiesTotal Initial
Cap Depository Institutions with Assets
<= $10 Billion* ������������������������������������ 109 $3,362 $4,203 3,845 $29,372 3,954 $33,574Depository Institutions with Assets
> $10 Billion* �������������������������������������� 39 269,228 336,535 56 23,320 95 359,855Bank and Thrift Holding Companies, Noninsured Affiliates ����������� 81 397,714 497,143 3,282 N/A 3,363 497,143Total ��������������������������������������������������������� 229 670,305 837,881 7,183 52,692 7,412 890,572* Depository institutions include insured branches of foreign banks (IBAs)� N/A - Not applicable
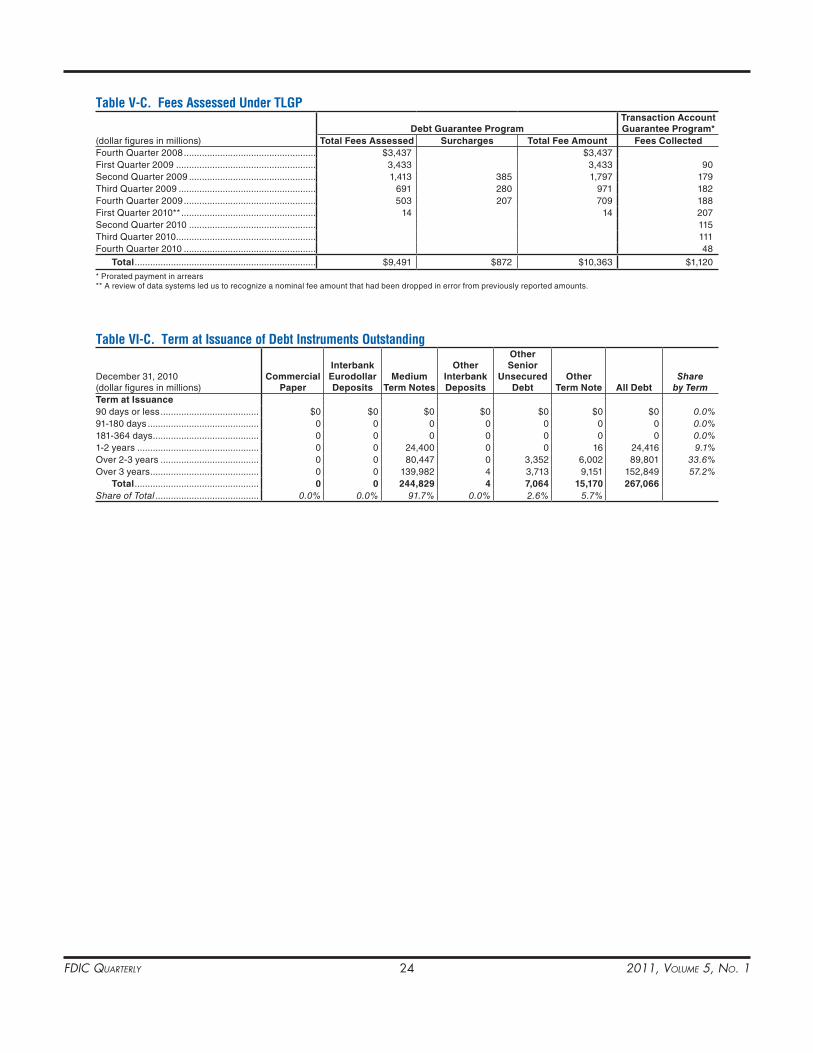
FDIC Quarterly 24 2011, Volume 5, No. 1
Table V-C. Fees Assessed Under TLGP
(dollar figures in millions)Debt Guarantee Program
Transaction Account Guarantee Program*
Total Fees Assessed Surcharges Total Fee Amount Fees CollectedFourth Quarter 2008 ��������������������������������������������������� $3,437 $3,437First Quarter 2009 ������������������������������������������������������ 3,433 3,433 90Second Quarter 2009 ������������������������������������������������� 1,413 385 1,797 179Third Quarter 2009 ����������������������������������������������������� 691 280 971 182Fourth Quarter 2009 ��������������������������������������������������� 503 207 709 188First Quarter 2010** ���������������������������������������������������� 14 14 207Second Quarter 2010 ������������������������������������������������� 115Third Quarter 2010 ������������������������������������������������������ 111Fourth Quarter 2010 ��������������������������������������������������� 48 Total ���������������������������������������������������������������������� $9,491 $872 $10,363 $1,120
* Prorated payment in arrears** A review of data systems led us to recognize a nominal fee amount that had been dropped in error from previously reported amounts�
Table VI-C. Term at Issuance of Debt Instruments Outstanding
December 31, 2010 (dollar figures in millions)
Commercial Paper
InterbankEurodollarDeposits
Medium Term Notes
Other Interbank Deposits
Other Senior
unsecured Debt
Other Term Note All Debt
Share by Term
Term at Issuance90 days or less �������������������������������������� $0 $0 $0 $0 $0 $0 $0 0.0%91-180 days ������������������������������������������� 0 0 0 0 0 0 0 0.0%181-364 days ����������������������������������������� 0 0 0 0 0 0 0 0.0%1-2 years ����������������������������������������������� 0 0 24,400 0 0 16 24,416 9.1%Over 2-3 years �������������������������������������� 0 0 80,447 0 3,352 6,002 89,801 33.6%Over 3 years ������������������������������������������ 0 0 139,982 4 3,713 9,151 152,849 57.2% Total ������������������������������������������������ 0 0 244,829 4 7,064 15,170 267,066Share of Total ���������������������������������������� 0.0% 0.0% 91.7% 0.0% 2.6% 5.7%
FDIC Quarterly 25 2011, Volume 5, No. 1
Quarterly Banking Profile
periods, divided by the total number of periods). For “pooling-of-interest” mergers, the assets of the acquired institution(s) are included in average assets since the year-to-date income includes the results of all merged institutions. No adjustments are made for “purchase accounting” mergers. Growth rates represent the percentage change over a 12-month period in totals for institutions in the base period to totals for institu-tions in the current period.All data are collected and presented based on the location of each reporting institution’s main office. Reported data may include assets and liabilities located outside of the reporting institution’s home state. In addition, institutions may relocate across state lines or change their charters, resulting in an inter-regional or inter-industry migration, e.g., institutions can move their home offices between regions, and savings institutions can convert to commercial banks or commercial banks may convert to savings institutions.
ACCOUNTING CHANGESExtended Net Operating Loss Carryback Period – The Worker, Home ownership, and Business Assistance Act of 2009, which was enacted on November 6, 2009, permits banks and other businesses, excluding those banking organizations that received capital from the U.S. Treasury under the Troubled Asset Relief Program, to elect a net operating loss carryback period of three, four, or five years instead of the usual carryback period of two years for any one tax year ending after December 31, 2007, and beginning before January 1, 2010. For calendar year banks, this extended carryback period applies to either the 2008 or 2009 tax year. The amount of the net operating loss that can be carried back to the fifth carryback year is limited to 50 percent of the available taxable income for that fifth year, but this limit does not apply to other carryback years.Under generally accepted accounting principles, banks may not record the effects of this tax change in their balance sheets and income statements for financial and regulatory reporting purposes until the period in which the law was enacted, i.e., the fourth quarter of 2009. Therefore, banks should recognize the effects of this fourth quarter 2009 tax law change on their current and deferred tax assets and liabil-ities, including valuation allowances for deferred tax assets, in their Call Reports for December 31, 2009. Banks should not amend their Call Reports for prior quarters for the effects of the extended net operating loss carryback period.The American Recovery and Reinvestment Act of 2009, which was enacted on February 17, 2009, permits qualifying small businesses, including FDIC-insured institutions, to elect a net operating loss carryback period of three, four, or five years instead of the usual carryback period of two years for any tax year ending in 2008 or, at the small business’s election, any tax year beginning in 2008. Under generally accepted accounting principles, institutions may not record the effect of this tax change in their balance sheets and income statements for financial and regulatory reporting purposes until the period in which the law was enacted, i.e., the first quarter of 2009.Troubled Debt Restructurings – Many institutions are restructur-ing or modifying the terms of loans to provide payment relief for those borrowers who have suffered deterioration in their financial condition. Such loan restructurings may include, but are not limited to, reductions in principal or accrued interest, reductions in interest rates, and extensions of the maturity date. Modifications may be executed at the original contractu-
Notes to UsersThis publication contains financial data and other information for depository institutions insured by the Federal Deposit Insur-ance Corporation (FDIC). These notes are an integral part of this publication and provide information regarding the com-parability of source data and reporting differences over time.
Tables I-A through VIII-A.The information presented in Tables I-A through V-A of the FDIC Quarterly Banking Profile is aggregated for all FDIC-insured institutions, both commercial banks and savings insti-tutions. Tables VI-A (Derivatives) and VII-A (Servicing, Securitization, and Asset Sales Activities) aggregate informa-tion only for insured commercial banks and state-chartered savings banks that file quarterly Call Reports. Table VIII-A (Trust Services) aggregates Trust asset and income informa-tion collected annually from all FDIC-insured institutions. Some tables are arrayed by groups of FDIC-insured institu-tions based on predominant types of asset concentration, while other tables aggregate institutions by asset size and geographic region. Quarterly and full-year data are provided for selected indicators, including aggregate condition and income data, performance ratios, condition ratios, and struc-tural changes, as well as past due, noncurrent, and charge-off information for loans outstanding and other assets.
Tables I-B through IV-B.A separate set of tables (Tables I-B through IV-B) provides comparative quarterly data related to the Deposit Insurance Fund (DIF), problem institutions, failed/assisted institutions, estimated FDIC-insured deposits, as well as assessment rate information. Depository institutions that are not insured by the FDIC through the DIF are not included in the FDIC Quarterly Banking Profile. U.S. branches of institutions head-quartered in foreign countries and non-deposit trust companies are not included unless otherwise indicated. Efforts are made to obtain financial reports for all active institutions. However, in some cases, final financial reports are not available for insti-tutions that have closed or converted their charters.
DATA SOURCESThe financial information appearing in this publication is obtained primarily from the Federal Financial Institutions Examination Council (FFIEC) Consolidated Reports of Condition and Income (Call Reports) and the OTS Thrift Financial Reports submitted by all FDIC-insured depository institutions. This information is stored on and retrieved from the FDIC’s Research Information System (RIS) data base.
COMPUTATION METHODOLOGYParent institutions are required to file consolidated reports, while their subsidiary financial institutions are still required to file separate reports. Data from subsidiary institution reports are included in the Quarterly Banking Profile tables, which can lead to double-counting. No adjustments are made for any double-counting of subsidiary data. Additionally, cer-tain adjustments are made to the OTS Thrift Financial Reports to provide closer conformance with the reporting and accounting requirements of the FFIEC Call Reports.All asset and liability figures used in calculating performance ratios represent average amounts for the period (beginning-of-period amount plus end-of-period amount plus any interim
FDIC Quarterly 26 2011, Volume 5, No. 1
Financial Assets (formerly paragraph 16 of FASB Statement No. 115, Accounting for Certain Investments in Debt and Equity Securities); FASB Staff Position (FSP) FAS 115-1 and FAS 124-1, The Meaning of Other-Than-Temporary Impairment and Its Application to Certain Investments; FSP FAS 115-2 and FAS 124-2, Recognition and Presentation of Other-Than-Temporary Impairments; paragraph 6 of Accounting Principles Board Opinion No. 18, The Equity Method of Accounting for Investments in Common Stock; Emerging Issues Task Force (EITF) Issue No. 99-20, Recognition of Interest Income and Impairment on Purchased Beneficial Interests and Beneficial Interests That Continue to Be Held by a Transferor in Securitized Financial Assets; and FSP EITF 99-20-1, Amendments to the Impairment Guidance of EITF Issue No. 99-20. Under ASC Topic 320, if an institution intends to sell a debt security or it is more likely than not that it will be required to sell the debt security before recovery of its amortized cost basis, an other-than-temporary impairment has occurred and the entire dif-ference between the security’s amortized cost basis and its fair value at the balance sheet date must be recognized in earn-ings. In these cases, the fair value of the debt security would become its new amortized cost basis. In addition, under ASC Topic 320, if the present value of cash flows expected to be collected on a debt security is less than its amortized cost basis, a credit loss exists. In this situation, if an institution does not intend to sell the security and it is not more likely than not that the institution will be required to sell the debt security before recovery of its amortized cost basis less any current-period credit loss, an other-than-temporary impair-ment has occurred. The amount of the total other-than- temporary impairment related to the credit loss must be recognized in earnings, but the amount of the total impair-ment related to other factors must be recognized in other comprehensive income, net of applicable taxes.ASC Topic 805 (formerly Business Combinations and Noncontrolling (Minority) Interests) – In December 2007, the FASB issued Statement No. 141 (Revised), Business Combinations FAS 141(R)), and Statement No. 160, Noncontrolling Interests in Consolidated Financial Statements (FAS 160). Under FAS 141(R), all business combinations, including combinations of mutual entities, are to be accounted for by applying the acqui-sition method. FAS 160 defines a noncontrolling interest, also called a minority interest, as the portion of equity in an insti-tution’s subsidiary not attributable, directly or indirectly, to the parent institution. FAS 160 requires an institution to clearly present in its consolidated financial statements the equity ownership in and results of its subsidiaries that are attributable to the noncontrolling ownership interests in these subsidiaries. FAS 141(R) applies prospectively to business combinations for which the acquisition date is on or after the beginning of the first annual reporting period beginning on or after December 15, 2008. Similarly, FAS 160 is effective for fiscal years begin-ning on or after December 15, 2008. Thus, for institutions with calendar year fiscal years, these two accounting standards take effect in 2009. Beginning in March 2009, Institution equity capital and Noncontrolling interests are separately reported in arriving at Total equity capital and Net income.ASC Topic 820 (formerly FASB Statement No. 157 Fair Value Measurements issued in September 2006) and ASC Topic 825 (formerly FASB Statement No. 159 The Fair Value Option for Financial Assets and Financial Liabilities) issued in February 2007 – both are effective in 2008 with early adoption permitted in 2007. FAS 157 defines fair value and establishes a framework
al interest rate on the loan, a current market interest rate, or a below-market interest rate. Many of these loan modifications meet the definition of a troubled debt restructuring (TDR).The TDR accounting and reporting standards are set forth in ASC Subtopic 310-40, Receivables—Troubled Debt Restructurings by Creditors (formerly FASB Statement No. 15, “Accounting by Debtors and Creditors for Troubled Debt Restructurings,” as amended). This guidance specifies that a restructuring of a debt constitutes a TDR if, at the date of restructuring, the creditor for economic or legal reasons relat-ed to a debtor’s financial difficulties grants a concession to the debtor that it would not otherwise consider.In the Call Report, until a loan that is a TDR is paid in full or otherwise settled, sold, or charged off, it must be reported in the appropriate loan category, as well as identified as a per-forming TDR loan, if it is in compliance with its modified terms. If a TDR is not in compliance with its modified terms, it is reported as a past due and nonaccrual loan in the appro-priate loan category, as well as distinguished from other past due and nonaccrual loans. To be considered in compliance with its modified terms, a loan that is a TDR must not be in nonaccrual status and must be current or less than 30 days past due on its contractual principal and interest payments under the modified repayment terms. A loan restructured in a TDR is an impaired loan. Thus, all TDRs must be measured for impairment in accordance with ASC Subtopic 310-10, Receivables—Overall (formerly FASB Statement No. 114, “Accounting by Creditors for Impairment of a Loan,” as amend-ed), and the Call report Glossary entry for “Loan Impairment.”Accounting for Loan Participations – Amended ASC Topic 860 (formerly FAS 166) modified the criteria that must be met in order for a transfer of a portion of a financial asset, such as a loan participation, to qualify for sale accounting. These changes apply to transfers of loan participations on or after the effective date of amended ASC Topic 860 (discussed above), including advances under lines of credit that are transferred on or after the effective date of amended ASC Topic 860 even if the line of credit agreements were entered into before this effective date. Therefore, banks with a calendar year fiscal year must account for transfers of loan participations on or after January 1, 2010, in accordance with amended ASC Topic 860. In general, loan participations transferred before the effective date of amended ASC Topic 860 (January 1, 2010, for calendar year banks) are not affected by this new account-ing standard. Therefore, loan participations transferred before the effective date of amended ASC Topic 860 that were properly accounted for as sales under former FASB Statement No. 140 will continue to be reported as having been sold.Under amended ASC Topic 860, if a transfer of a portion of an entire financial asset meets the definition of a “participat-ing interest,” then the transferor (normally the lead lender) must evaluate whether the transfer meets all of the conditions in this accounting standard to qualify for sale accounting.Other-Than-Temporary Impairment – When the fair value of an investment in a debt or equity security is less than its cost basis, the impairment is either temporary or other-than- temporary. To determine whether the impairment is other-than-temporary, an institution must apply other pertinent guidance in ASC Topic 320 , Investments-Debt and Equity Securities—Overall; ASC Subtopic 325-20, Investments-Other—Cost Method Investments; and ASC Subtopic 325-40, Investments-Other—Beneficial Interests in Securitized
FDIC Quarterly 27 2011, Volume 5, No. 1
Quarterly Banking Profile
Call Report purposes. The SOP does not apply to the loans that a bank has originated, prohibits “carrying over” or cre-ation of valuation allowances in the initial accounting, and any subsequent valuation allowances reflect only those losses incurred by the investor after acquisition.GNMA Buy-back Option – If an issuer of GNMA securities has the option to buy back the loans that collateralize the GNMA secu-rities, when certain delinquency criteria are met, ASC Topic 860 (formerly FASB Statement No. 140) requires that loans with this buy-back option must be brought back on the issuer’s books as assets. The rebooking of GNMA loans is required regardless of whether the issuer intends to exercise the buy-back option. The banking agencies clarified in May 2005 that all GNMA loans that are rebooked because of delinquency should be reported as past due according to their contractual terms.ASC Topics 860 & 810 (formerly FASB Statements 166 & 167) – In June 2009, the FASB issued Statement No. 166, Accounting for Transfers of Financial Assets (FAS 166), and Statement No. 167, Amendments to FASB Interpretation No. 46(R) (FAS 167), which change the way entities account for securitizations and special purpose entities. FAS 166 revised FASB Statement No. 140, Accounting for Transfers and Servicing of Financial Assets and Extinguishments of Liabilities, by eliminating the concept of a “qualifying special-purpose enti-ty,” creating the concept of a “participating interest,” chang-ing the requirements for derecognizing financial assets, and requiring additional disclosures. FAS 167 revised FASB Interpretation No. 46(R), Consolidation of Variable Interest Entities, by changing how a bank or other company deter-mines when an entity that is insufficiently capitalized or is not controlled through voting or similar rights, i.e., a “vari-able interest entity” (VIE), should be consolidated. Under FAS 167, a bank must perform a qualitative assessment to determine whether its variable interest or interests give it a controlling financial interest in a VIE. If a bank’s variable interest or interests provide it with the power to direct the most significant activities of the VIE, and the right to receive benefits or the obligation to absorb losses that could poten-tially be significant to the VIE, the bank is the primary bene-ficiary of, and therefore must consolidate, the VIE.Both FAS 166 and FAS 167 take effect as of the beginning of each bank’s first annual reporting period that begins after November 15, 2009, for interim periods therein, and for inter-im and annual reporting periods thereafter (i.e., as of January 1, 2010, for banks with a calendar year fiscal year). Earlier application is prohibited. Banks are expected to adopt FAS 166 and FAS 167 for Call Report purposes in accordance with the effective date of these two standards. Also, FAS 166 has modified the criteria that must be met in order for a transfer of a portion of a financial asset, such as a loan participation, to qualify for sale accounting. These changes apply to transfers of loan participations on or after the effective date of FAS 166. Therefore, banks with a calendar year fiscal year must account for transfers of loan participations on or after January 1, 2010, in accordance with FAS 166. In general, loan participations transferred before the effective date of FAS 166 (January 1, 2010, for calendar year banks) are not affected by this new accounting standard and pre-FAS 166 participations that were properly accounted for as sales under FASB Statement No. 140 will continue to be reported as having been sold.ASC Topic 740 (formerly FASB Interpretation No. 48 on Uncertain Tax Positions) – FASB Interpretation No. 48, Accounting for
for developing fair value estimates for the fair value measure-ments that are already required or permitted under other standards. FASB FSP 157-4, issued in April 2009, provides additional guidance for estimating fair value in accordance with FAS 157 when the volume and level of activity for the asset or liability have significantly decreased. The FSP also includes guidance on identifying circumstances that indicate a transaction is not orderly. The FSP is effective for interim and annual reporting periods ending after June 15, 2009, with early adoption permitted for periods ending after March 15, 2009.Fair value continues to be used for derivatives, trading securi-ties, and available-for-sale securities. Changes in fair value go through earnings for trading securities and most derivatives. Changes in the fair value of available-for-sale securities are reported in other comprehensive income. Available-for-sale securities and held-to-maturity debt securities are written down to fair value if impairment is other than temporary and loans held for sale are reported at the lower of cost or fair value.FAS 159 allows institutions to report certain financial assets and liabilities at fair value with subsequent changes in fair value included in earnings. In general, an institution may elect the fair value option for an eligible financial asset or lia-bility when it first recognizes the instrument on its balance sheet or enters into an eligible firm commitment.ASC Topic 715 (formerly FASB Statement No. 158 Employers’ Accounting for Defined Benefit Pension and Other Postretirement Plans) – issued in September 2006 requires a bank to recognize in 2007, and subsequently, the funded status of its postretire-ment plans on its balance sheet. An overfunded plan is recog-nized as an asset and an underfunded plan is recognized as a liability. An adjustment is made to equity as accumulated other comprehensive income (AOCI) upon application of FAS 158, and AOCI is adjusted in subsequent periods as net periodic benefit costs are recognized in earnings.ASC Topic 860 (formerly FASB Statement No. 156 Accounting for Servicing of Financial Assets) – issued in March 2006 and effec-tive in 2007, requires all separately recognized servicing assets and liabilities to be initially measured at fair value and allows a bank the option to subsequently adjust that value by period-ic revaluation and recognition of earnings or by periodic amortization to earnings.ASC Topic 815 (formerly FASB Statement No. 155 Accounting for Certain Hybrid Financial Instruments) – issued in February 2006, requires bifurcation of certain derivatives embedded in inter-ests in securitized financial assets and permits fair value mea-surement (i.e., a fair value option) for any hybrid financial instrument that contains an embedded derivative that would otherwise require bifurcation under FASB Statement No. 133, Accounting for Derivative Instruments and Hedging Activities (FAS 133). In addition, FAS 155 clarifies which interest-only and principal-only strips are not subject to FAS 133.Purchased Impaired Loans and Debt Securities – ASC Topic 310 (formerly Statement of Position 03-3, Accounting for Certain Loans or Debt Securities Acquired in a Transfer) – The SOP applies to loans and debt securities acquired in fiscal years beginning after December 15, 2004. In general, this Statement of Position applies to “purchased impaired loans and debt securi-ties” (i.e., loans and debt securities that a bank has purchased, including those acquired in a purchase business combination, when it is probable, at the purchase date, that the bank will be unable to collect all contractually required payments receivable). Banks must follow Statement of Position 03-3 for
FDIC Quarterly 28 2011, Volume 5, No. 1
Assets securitized and sold – total outstanding principal balance of assets securitized and sold with servicing retained or other seller- provided credit enhancements.Capital Purchase Program (CPP) – As announced in October 2008 under the TARP, the Treasury Department purchase of noncumulative perpetual preferred stock and related warrants that is treated as Tier 1 capital for regulatory capital purposes is included in “Total equity capital.” Such warrants to pur-chase common stock or noncumulative preferred stock issued by publicly-traded banks are reflected as well in “Surplus.” Warrants to purchase common stock or noncumulative pre-ferred stock of not-publicly-traded bank stock classified in a bank’s balance sheet as “Other liabilities.”Construction and development loans – includes loans for all prop-erty types under construction, as well as loans for land acqui-sition and development.Core capital – common equity capital plus noncumulative per-petual preferred stock plus minority interest in consolidated subsidiaries, less goodwill and other ineligible intangible assets. The amount of eligible intangibles (including servicing rights) included in core capital is limited in accordance with supervisory capital regulations.Cost of funding earning assets – total interest expense paid on deposits and other borrowed money as a percentage of average earning assets.Credit enhancements – techniques whereby a company attempts to reduce the credit risk of its obligations. Credit enhance-ment may be provided by a third party (external credit enhancement) or by the originator (internal credit enhance-ment), and more than one type of enhancement may be associated with a given issuance.Deposit Insurance Fund (DIF) – The Bank (BIF) and Savings Association (SAIF) Insurance Funds were merged in 2006 by the Federal Deposit Insurance Reform Act to form the DIF.Derivatives notional amount – The notional, or contractual, amounts of derivatives represent the level of involvement in the types of derivatives transactions and are not a quantifica-tion of market risk or credit risk. Notional amounts represent the amounts used to calculate contractual cash flows to be exchanged.Derivatives credit equivalent amount – the fair value of the derivative plus an additional amount for potential future cred-it exposure based on the notional amount, the remaining maturity and type of the contract.Derivatives transaction types:
Futures and forward contracts – contracts in which the buyer agrees to purchase and the seller agrees to sell, at a speci-fied future date, a specific quantity of an underlying vari-able or index at a specified price or yield. These contracts exist for a variety of variables or indices, (traditional agri-cultural or physical commodities, as well as currencies and interest rates). Futures contracts are standardized and are traded on organized exchanges which set limits on coun-terparty credit exposure. Forward contracts do not have standardized terms and are traded over the counter.Option contracts – contracts in which the buyer acquires the right to buy from or sell to another party some specified amount of an un derlying variable or index at a stated price (strike price) during a period or on a specified future date, in return for compensation (such as a fee or premium).
Uncertainty in Income Taxes (FIN 48), was issued in June 2006 as an interpretation of FASB Statement No. 109, Accounting for Income Taxes. Under FIN 48, the term “tax position” refers to “a position in a previously filed tax return or a position expected to be taken in a future tax return that is reflected in measuring current or deferred income tax assets and liabili-ties.” FIN 48 further states that a “tax position can result in a permanent reduction of income taxes payable, a deferral of income taxes otherwise currently payable to future years, or a change in the expected realizability of deferred tax assets.” FIN 48 was originally issued effective for fiscal years begin-ning after December 15, 2006. Banks must adopt FIN 48 for Call Report purposes in accordance with the interpretation’s effective date except as follows. On December 31, 2008, the FASB decided to defer the effective date of FIN 48 for eligi-ble nonpublic enterprises and to require those enterprises to adopt FIN 48 for annual periods beginning after December 15, 2008. A nonpublic enterprise under certain conditions is eligible for deferral, even if it opted to issue interim or quar-terly financial information in 2007 under earlier guidance that reflected the adoption of FIN 48.ASC Topic 718 (formerly FASB Statement No. 123 (Revised 2004) and Share-Based Payments – refer to previously published Quarterly Banking Profile notes: http://www5.fdic.gov/qbp/ 2008dec/qbpnot.htmlASC Topic 815 (formerly FASB Statement No. 133 Accounting for Derivative Instruments and Hedging Activities) – refer to previous-ly published Quarterly Banking Profile notes: http://www5.fdic. gov/qbp/2008dec/qbpnot.htmlAccounting Standards Codification – In June 2009, the FASB issued Statement No. 168, The FASB Accounting Standards CodificationTM and the Hierarchy of Generally Accepted Accounting Principles (FAS 168), to establish the FASB Codification as the single source of authoritative nongovern-mental U.S. generally accepted accounting principles (U.S. GAAP). The FASB Codification reorganizes existing U.S. accounting and reporting standards issued by the FASB and other related private-sector standard setters, and all guidance contained in the FASB Codification carries an equal level of authority. All previously existing accounting standards docu-ments are superseded as described in FAS 168. All other accounting literature not included in the FASB Codification is nonauthoritative. The FASB Codification can be accessed at http://asc.fasb.org/. The FASB Codification is effective for interim and annual periods ending after September 15, 2009. This is an FFIEC reference guide at http://www.ffiec.gov/pdf/ffiec_forms/CodificationIntroduction_201006.pdf.
DEFINITIONS (in alphabetical order)All other assets – total cash, balances due from depository institutions, premises, fixed assets, direct investments in real estate, investment in unconsolidated subsidiaries, customers’ liability on acceptances outstanding, assets held in trading accounts, federal funds sold, securities purchased with agree-ments to resell, fair market value of derivatives, prepaid deposit insurance assessments, and other assets.All other liabilities – bank’s liability on acceptances, limited-life preferred stock, allowance for estimated off-balance-sheet credit losses, fair market value of derivatives, and other liabilities.Assessment base – assessable deposits consist of DIF deposits (deposits insured by the FDIC Deposit Insurance Fund) in banks’ domestic offices with certain adjustments.

FDIC Quarterly 29 2011, Volume 5, No. 1
Quarterly Banking Profile
Long-term assets (5+ years) – loans and debt securities with remaining maturities or repricing intervals of over five years.Maximum credit exposure – the maximum contractual credit exposure remaining under recourse arrangements and other seller-provided credit enhancements provided by the report-ing bank to securitizations.Mortgage-backed securities – certificates of participation in pools of residential mortgages and collateralized mortgage obligations issued or guaranteed by government-sponsored or private enterprises. Also, see “Securities,” below.Net charge-offs – total loans and leases charged off (removed from balance sheet because of uncollectibility), less amounts recovered on loans and leases previously charged off.Net interest margin – the difference between interest and divi-dends earned on interest-bearing assets and interest paid to depositors and other creditors, expressed as a percentage of average earning assets. No adjustments are made for interest income that is tax exempt.Net loans to total assets – loans and lease financing receiv-ables, net of unearned income, allowance and reserves, as a percent of total assets on a consolidated basis.Net operating income – income excluding discretionary transac-tions such as gains (or losses) on the sale of investment secu-rities and extraordinary items. Income taxes subtracted from operating income have been adjusted to exclude the portion applicable to securities gains (or losses).Noncurrent assets – the sum of loans, leases, debt securities, and other assets that are 90 days or more past d ue, or in non-accrual status.Noncurrent loans & leases – the sum of loans and leases 90 days or more past due, and loans and leases in nonaccrual status.Number of institutions reporting – the number of institutions that actually filed a financial report.New charters – insured institutions filing quarterly financial reports for the first time.Other borrowed funds – federal funds purchased, securities sold with agreements to repurchase, demand notes issued to the U.S. Treasury, FHLB advances, other borrowed money, mort-gage indebtedness, obligations under capitalized leases and trading liabilities, less revaluation losses on assets held in trading accounts.Other real estate owned – primarily foreclosed property. Direct and indirect investments in real estate ventures are excluded. The amount is reflected net of valuation allowances. For insti-tutions that file a Thrift Financial Report (TFR), the valuation allowance subtracted also includes allowances for other repos-sessed assets. Also, for TFR filers the components of other real estate owned are reported gross of valuation allowances.Percent of institutions with earnings gains – the percent of insti-tutions that increased their net income (or decreased their losses) compared to the same period a year earlier.“Problem” institutions – federal regulators assign a composite rating to each financial institution, based upon an evaluation of financial and operational criteria. The rating is based on a scale of 1 to 5 in ascending order of supervisory concern. “Problem” institutions are those institutions with financial, operational, or managerial weaknesses that threaten their continued financial viability. Depending upon the degree of risk and supervisory concern, they are rated either a “4” or “5.” The number and assets of “problem” institutions are based on FDIC composite ratings. Prior to March 31, 2008,
The seller is obligated to purchase or sell the variable or index at the discretion of the buyer of the contract.Swaps – obligations between two parties to exchange a series of cash flows at periodic intervals (settlement dates), for a specified period. The cash flows of a swap are either fixed, or determined for each settlement date by multiply-ing the quantity (notional principal) of the underlying variable or index by specified reference rates or prices. Except for currency swaps, the notional principal is used to calculate each payment but is not exchanged.
Derivatives underlying risk exposure – the potential exposure characterized by the level of banks’ concentration in particu-lar underlying instruments, in general. Exposure can result from market risk, credit risk, and operational risk, as well as, interest rate risk.Domestic deposits to total assets – total domestic office deposits as a percent of total assets on a consolidated basis.Earning assets – all loans and other investments that earn interest or dividend income.Efficiency ratio – noninterest expense less amortization of intangible assets as a percent of net interest income plus non-interest income. This ratio measures the proportion of net operating revenues that are absorbed by overhead expenses, so that a lower value indicates greater efficiency.Estimated insured deposits – in general, insured deposits are total domestic deposits minus estimated uninsured deposits. Begin-ning March 31, 2008, for institutions that file Call reports, insured deposits are total assessable deposits minus estimated uninsured deposits. Beginning September 30, 2009, insured deposits include deposits in accounts of $100,000 to $250,000 that are covered by a temporary increase in the FDIC’s stan-dard maximum deposit insurance amount (SMDIA).Failed/assisted institutions – an institution fails when regulators take control of the institution, placing the assets and liabili-ties into a bridge bank, conservatorship, receivership, or another healthy institution. This action may require the FDIC to provide funds to cover losses. An institution is defined as “assisted” when the institution remains open and receives assistance in order to continue operating.Fair Value – the valuation of various assets and liabilities on the balance sheet—including trading assets and liabilities, available-for-sale securities, loans held for sale, assets and liabilities accounted for under the fair value option, and fore-closed assets—involves the use of fair values. During periods of market stress, the fair values of some financial instruments and nonfinancial assets may decline.FHLB advances – all borrowings by FDIC insured institutions from the Federal Home Loan Bank System (FHLB), as report-ed by Call Report filers and by TFR filers.Goodwill and other intangibles – intangible assets include servicing rights, purchased credit card relationships, and other identifiable intangible assets. Goodwill is the excess of the purchase price over the fair market value of the net assets acquired, less subsequent impairment adjustments. Other intangible assets are recorded at fair value, less subsequent quarterly amortization and impairment adjustments.Loans secured by real estate – includes home equity loans, junior liens secured by 1-4 family residential properties, and all other loans secured by real estate.Loans to individuals – includes outstanding credit card balances and other secured and unsecured consumer loans.
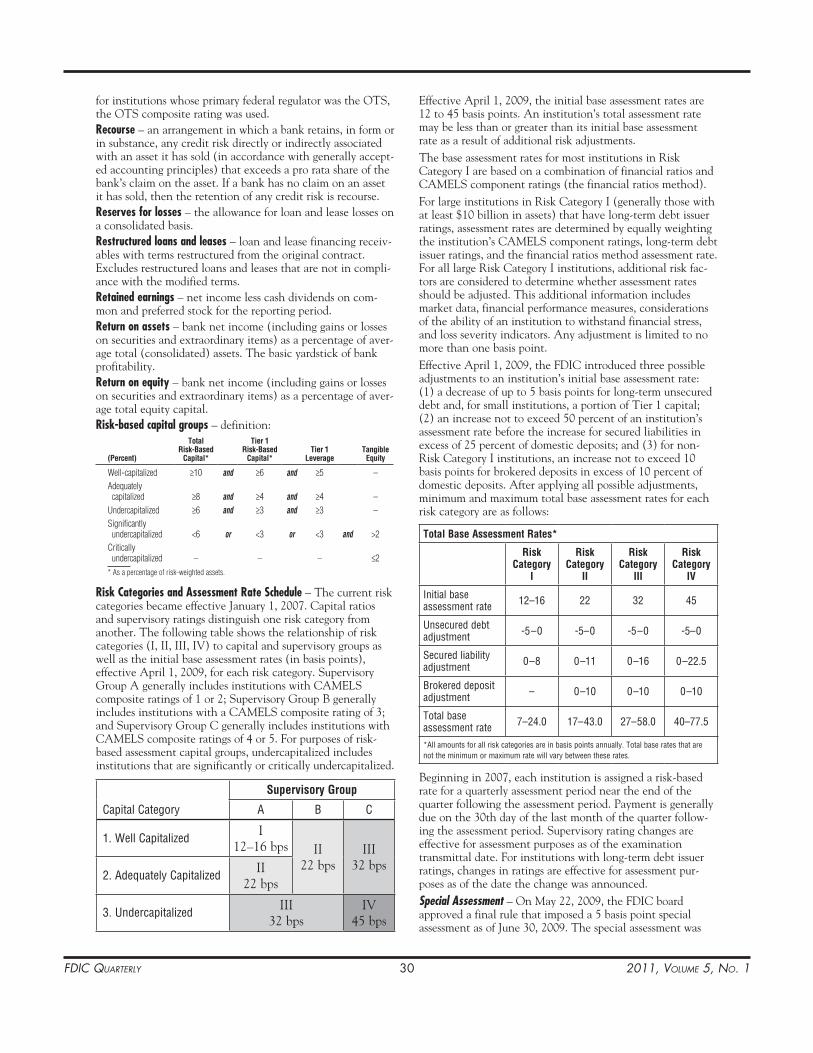
FDIC Quarterly 30 2011, Volume 5, No. 1
Effective April 1, 2009, the initial base assessment rates are 12 to 45 basis points. An institution’s total assessment rate may be less than or greater than its initial base assessment rate as a result of additional risk adjustments.The base assessment rates for most institutions in Risk Category I are based on a combination of financial ratios and CAMELS component ratings (the financial ratios method).For large institutions in Risk Category I (generally those with at least $10 billion in assets) that have long-term debt issuer ratings, assessment rates are determined by equally weighting the institution’s CAMELS component ratings, long-term debt issuer ratings, and the financial ratios method assessment rate. For all large Risk Category I institutions, additional risk fac-tors are considered to determine whether assessment rates should be adjusted. This additional information includes market data, financial performance measures, considerations of the ability of an institution to withstand financial stress, and loss severity indicators. Any adjustment is limited to no more than one basis point.Effective April 1, 2009, the FDIC introduced three possible adjustments to an institution’s initial base assessment rate: (1) a decrease of up to 5 basis points for long-term unsecured debt and, for small institutions, a portion of Tier 1 capital; (2) an increase not to exceed 50 percent of an institution’s assessment rate before the increase for secured liabilities in excess of 25 percent of domestic deposits; and (3) for non-Risk Category I institutions, an increase not to exceed 10 basis points for brokered deposits in excess of 10 percent of domestic deposits. After applying all possible adjustments, minimum and maximum total base assessment rates for each risk category are as follows:
Total Base Assessment Rates*
Risk Category
I
Risk Category
II
Risk Category
III
Risk Category
IV
Initial base assessment rate 12–16 22 32 45
Unsecured debt adjustment -5 –0 -5–0 -5 –0 -5– 0
Secured liability adjustment 0 – 8 0 –11 0 –16 0 –22.5
Brokered deposit adjustment – 0 –10 0 –10 0 –10
Total base assessment rate 7–24.0 17–43.0 27–58.0 40–77.5
*All amounts for all risk categories are in basis points annually. Total base rates that are not the minimum or maximum rate will vary between these rates.
Beginning in 2007, each institution is assigned a risk-based rate for a quarterly assessment period near the end of the quarter following the assessment period. Payment is generally due on the 30th day of the last month of the quarter follow-ing the assessment period. Supervisory rating changes are effective for assessment purposes as of the examination transmittal date. For institutions with long-term debt issuer ratings, changes in ratings are effective for assessment pur-poses as of the date the change was announced.Special Assessment – On May 22, 2009, the FDIC board approved a final rule that imposed a 5 basis point special assessment as of June 30, 2009. The special assessment was
for institutions whose primary federal regulator was the OTS, the OTS composite rating was used.Recourse – an arrangement in which a bank retains, in form or in substance, any credit risk directly or indirectly associated with an asset it has sold (in accordance with generally accept-ed accounting principles) that exceeds a pro rata share of the bank’s claim on the asset. If a bank has no claim on an asset it has sold, then the retention of any credit risk is recourse.Reserves for losses – the allowance for loan and lease losses on a consolidated basis.Restructured loans and leases – loan and lease financing receiv-ables with terms restructured from the original contract. Excludes restructured loans and leases that are not in compli-ance with the modified terms.Retained earnings – net income less cash dividends on com-mon and preferred stock for the reporting period.Return on assets – bank net income (including gains or losses on securities and extraordinary items) as a percentage of aver-age total (consolidated) assets. The basic yardstick of bank profitability.Return on equity – bank net income (including gains or losses on securities and extraordinary items) as a percentage of aver-age total equity capital.Risk-based capital groups – definition:
(Percent)
Total Risk-Based
Capital*
Tier 1 Risk-Based
Capital*Tier 1
LeverageTangible
Equity
Well-capitalized ≥10 and ≥6 and ≥5 –Adequately capitalized ≥8 and ≥4 and ≥4 –
Undercapitalized ≥6 and ≥3 and ≥3 –Significantly undercapitalized <6 or <3 or <3 and >2
Critically undercapitalized – – – ≤2
* As a percentage of risk-weighted assets.
Risk Categories and Assessment Rate Schedule – The current risk categories became effective January 1, 2007. Capital ratios and supervisory ratings distinguish one risk category from another. The following table shows the relationship of risk categories (I, II, III, IV) to capital and supervisory groups as well as the initial base assessment rates (in basis points), effective April 1, 2009, for each risk category. Supervisory Group A generally includes institutions with CAMELS composite ratings of 1 or 2; Supervisory Group B generally includes institutions with a CAMELS composite rating of 3; and Supervisory Group C generally includes institutions with CAMELS composite ratings of 4 or 5. For purposes of risk-based assessment capital groups, undercapitalized includes institutions that are significantly or critically undercapitalized.
Capital Category
Supervisory Group
A B C
1. Well Capitalized I12–16 bps II
22 bpsIII
32 bps2. Adequately Capitalized II
22 bps
3. Undercapitalized III32 bps
IV45 bps
FDIC Quarterly 31 2011, Volume 5, No. 1
Quarterly Banking Profile
2010. On April 13, 2010 the FDIC Board adopted an interim rule extending the TAG program for six months through December 31, 2010, with a possibility of an addi-tional 12-month extension, through December 31, 2011. (Section 343 of the Dodd-Frank Wall Street Reform and Consumer Protection Act (Dodd-Frank Act) provides temporary unlimited insurance coverage to noninterest-bearing transaction accounts at all FDIC-insured institu-tions. The separate coverage for these accounts becomes effective on December 31, 2010, and ends on December 31, 2012.) Debt Guarantee Program (DGP) provides a full guarantee of senior unsecured debt1 issued by eligible institutions after October 14, 2008. Initially, debt issued before June 30, 2009, and maturing on or before June 30, 2012, could be guaranteed. On March 17, 2009, the deadline for issuance under the program was extended to October 31, 2009, and the expiration of the guarantee was set at the earlier of maturity of the debt or December 31, 2012. Institutions eligible for participation in the debt guarantee program include insured depository institutions, U.S. bank holding companies, certain U.S. savings and loan holding compa-nies, and other affiliates of an insured depository institu-tion that the FDIC designates as eligible entities. The FDIC Board adopted a final rule on October 20, 2009, that established a limited six-month emergency guarantee facility upon expiration of the DGP.
Trust assets – market value, or other reasonably available value of fiduciary and related assets, to include marketable securities, and other financial and physical assets. Common physical assets held in fiduciary accounts include real estate, equipment, collectibles, and household goods. Such fiduciary assets are not included in the assets of the financial institution.Unearned income & contra accounts – unearned income for Call Report filers only.Unused loan commitments – includes credit card lines, home equity lines, commitments to make loans for construction, loans secured by commercial real estate, and unused com-mitments to originate or purchase loans. (Excluded are commitments after June 2003 for originated mortgage loans held for sale, which are accounted for as derivatives on the balance sheet.)Volatile liabilities – the sum of large-denomination time depos-its, foreign-office deposits, federal funds purchased, securities sold under agreements to repurchase, and other borrowings.Yield on earning assets – total interest, dividend, and fee income earned on loans and investments as a percentage of average earning assets.
1 Senior unsecured debt generally includes term Federal funds purchased, promissory notes, commercial paper, unsubordinated unsecured notes, certificates of deposit (CDs) standing to the credit of a bank, and U.S. dollar denominated bank deposits owed to an insured depository institution.
levied on each insured depository institution’s assets minus its Tier 1 capital as reported in its report of condition as of June 30, 2009. The special assessment was collected September 30, 2009, at the same time that the risk-based assessment for the second quarter of 2009 was collected. The special assessment for any institution was capped at 10 basis points of the insti-tution’s assessment base for the second quarter of 2009 risk-based assessment.Prepaid Deposit Insurance Assessments – In November 2009, the FDIC Board of Directors adopted a final rule requiring insured depository institutions (except those that are exempted) to prepay their quarterly risk-based deposit insurance assessments for the fourth quarter of 2009, and for all of 2010, 2011, and 2012, on December 30, 2009. Each institution’s regular risk-based deposit insurance assessment for the third quarter of 2009, which is paid in arrears, also is payable on December 30, 2009.Risk-weighted assets – assets adjusted for risk-based capital definitions which include on-balance-sheet as well as off- balance-sheet items multiplied by risk-weights that range from zero to 200 percent. A conversion factor is used to assign a balance sheet equivalent amount for selected off-balance-sheet accounts.Securities – excludes securities held in trading accounts. Banks’ securities portfolios consist of securities designated as “held-to-maturity,” which are reported at amortized cost (book value), and securities designated as “available-for-sale,” reported at fair (market) value.Securities gains (losses) – realized gains (losses) on held-to- maturity and available-for-sale securities, before adjustments for income taxes. Thrift Financial Report (TFR) filers also include gains (losses) on the sales of assets held for sale.Seller’s interest in institution’s own securitizations – the reporting bank’s ownership interest in loans and other assets that have been securitized, except an interest that is a form of recourse or other seller-provided credit enhancement. Seller’s interests differ from the securities issued to investors by the securitiza-tion structure. The principal amount of a seller’s interest is generally equal to the total principal amount of the pool of assets included in the securitization structure less the princi-pal amount of those assets attributable to investors, i.e., in the form of securities issued to investors.Subchapter S Corporation – a Subchapter S corporation is treat-ed as a pass-through entity, similar to a partnership, for feder-al income tax purposes. It is generally not subject to any federal income taxes at the corporate level. This can have the effect of reducing institutions’ reported taxes and increasing their after-tax earnings.Temporary Liquidity Guarantee Program (TLGP) – was approved by the FDIC Board on October 13, 2008. The TLGP was designed to help relieve the crisis in the credit markets by giving banks access to liquidity during a time of global finan-cial distress. Participation in the TLGP is voluntary. The TLGP has two components:
Transaction Account Guarantee Program (TAGP) provides a full guarantee of non-interest-bearing deposit transaction accounts above $250,000, at depository institutions that elected to participate in the program. On August 26, 2009, the FDIC Board voted to extend the TAGP six months beyond its original expiration date to June 30,

FDIC Quarterly 33 2011, Volume 5, No. 1
businesses employ just over half of all private sector employees and have generated 64 percent of net new jobs over the past 15 years.2 Small firms also tend to fill underserved niches in the labor market that often have higher rates of unemployment. For example, compared with large firms, small firms employ a higher percentage of individuals with a high school degree or less, teens and people age 65 and older, disabled workers, Latinos, and rural residents.3
Like other firms, small businesses have been signifi-cantly challenged by current macroeconomic trends such as high unemployment, low consumer confidence, and volatility in consumer spending as households deleverage and repair their balance sheets. In two recent surveys, small business owners cited depressed sales as the principal operating problem with the current economic environment. The National Federa-tion of Independent Business (NFIB) Research Foun-dation found that 51 percent of small business owners cited slowing or lost sales as the most important imme-diate problem facing their businesses.4 Similarly, the National Small Business Association (NSBA) found that 64 percent of survey respondents reported a net decrease in sales in 2009, the most recent full year of data available.5 These surveys also showed that small business owners are concerned about many other issues, including uncertainty in business conditions and access to affordable credit.
2 SBA, Office of Advocacy, FAQs: How important are small businesses to the US Economy? http://www.sba.gov/advocacy/7495/8420. 3 Brian Headd, “An Analysis of Small Business and Jobs,” SBA, Office of Advocacy, March 2010, http://www.sba.gov/advo/research/rs359tot.pdf. 4 William Dennis, Jr., “Small Business Credit in a Deep Recession,” NFIB Research Foundation, Washington, DC, February 2010. The Gallup Organization collected data for this survey between mid- November and mid-December 2009 from 750 firms with no fewer than one employee, in addition to the owner, and no more than 250 employees.5 NSBA, 2009 Year-End Economic Report, http://www.nsba.biz/docs/ 10eoy_survey.pdf. This survey was conducted between December 14 and 31, 2009, and indicates that 450 small business owners were polled. The size of the firms interviewed is not detailed in the report.
IntroductionEntrepreneurship is commonly viewed as an avenue to personal and national economic prosperity in the United States. Encouraging entrepreneurship through small business formation and expansion is a prominent public policy goal, as small businesses provide the majority of new jobs. During periods of high unemploy-ment, many individuals turn to self-employment. Others view self-employment as a pathway out of poverty; it can provide cash flow and the opportunity for income growth that may not otherwise be feasible.
This article begins with a background on small busi-nesses and small business lending and the challenges small businesses face in the current economic environ-ment. It then focuses on the poverty alleviation aspect of entrepreneurship through microenterprise develop-ment. Microenterprise development refers to helping a segment of small business owners—low- and moderate-income (LMI) individuals, those who lack full access to mainstream financial services, and other disadvantaged people—create or expand a small business.
This article describes the scope of microenterprise development and the benefits to small business owners and their communities, and includes case studies of organizations that participate in microenterprise devel-opment activities. It also describes the benefits to banks of participating in microenterprise development, includ-ing how they may receive positive consideration under the Community Reinvestment Act (CRA) for micro-enterprise development activities.
The Current Economic Environment Is Difficult for Small BusinessesOf the estimated 27.8 million businesses in the United States in 2007, 27.7 million were small businesses, which the U.S. Small Business Administration (SBA) defines as firms with fewer than 500 employees.1 Small
1 US Small Business Administration (SBA), Office of Advocacy, Statis-tics of US Businesses and Nonemployer Statistics, http://www.sba.gov/advo/research/data.html#us.
Feature Article:
Microenterprise Development: A Primer
Authors’ Note: Examples of banks, companies, nonprofits, and products are used in this article for illustrative purposes only. The FDIC does not endorse specific entities or products.
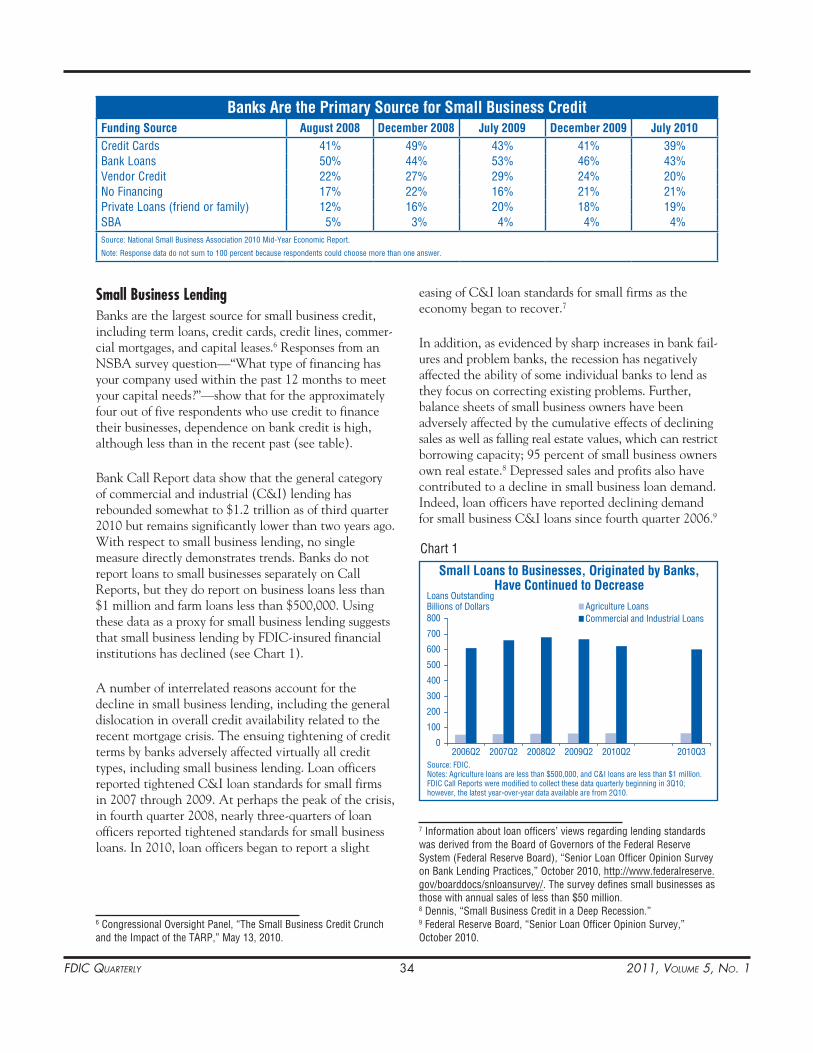
FDIC Quarterly 34 2011, Volume 5, No. 1
easing of C&I loan standards for small firms as the economy began to recover.7
In addition, as evidenced by sharp increases in bank fail-ures and problem banks, the recession has negatively affected the ability of some individual banks to lend as they focus on correcting existing problems. Further, balance sheets of small business owners have been adversely affected by the cumulative effects of declining sales as well as falling real estate values, which can restrict borrowing capacity; 95 percent of small business owners own real estate.8 Depressed sales and profits also have contributed to a decline in small business loan demand. Indeed, loan officers have reported declining demand for small business C&I loans since fourth quarter 2006.9
7 Information about loan officers’ views regarding lending standards was derived from the Board of Governors of the Federal Reserve System (Federal Reserve Board), “Senior Loan Officer Opinion Survey on Bank Lending Practices,” October 2010, http://www.federalreserve.gov/boarddocs/snloansurvey/. The survey defines small businesses as those with annual sales of less than $50 million.8 Dennis, “Small Business Credit in a Deep Recession.”9 Federal Reserve Board, “Senior Loan Officer Opinion Survey,” October 2010.
Small Business LendingBanks are the largest source for small business credit, including term loans, credit cards, credit lines, commer-cial mortgages, and capital leases.6 Responses from an NSBA survey question—“What type of financing has your company used within the past 12 months to meet your capital needs?”—show that for the approximately four out of five respondents who use credit to finance their businesses, dependence on bank credit is high, although less than in the recent past (see table).
Bank Call Report data show that the general category of commercial and industrial (C&I) lending has rebounded somewhat to $1.2 trillion as of third quarter 2010 but remains significantly lower than two years ago. With respect to small business lending, no single measure directly demonstrates trends. Banks do not report loans to small businesses separately on Call Reports, but they do report on business loans less than $1 million and farm loans less than $500,000. Using these data as a proxy for small business lending suggests that small business lending by FDIC-insured financial institutions has declined (see Chart 1).
A number of interrelated reasons account for the decline in small business lending, including the general dislocation in overall credit availability related to the recent mortgage crisis. The ensuing tightening of credit terms by banks adversely affected virtually all credit types, including small business lending. Loan officers reported tightened C&I loan standards for small firms in 2007 through 2009. At perhaps the peak of the crisis, in fourth quarter 2008, nearly three-quarters of loan officers reported tightened standards for small business loans. In 2010, loan officers began to report a slight
6 Congressional Oversight Panel, “The Small Business Credit Crunch and the Impact of the TARP,” May 13, 2010.
Chart 1
0
100
200
300
400
500
600
700
800
2006Q2 2007Q2 2008Q2 2009Q2 2010Q2 2010Q3
Agriculture LoansCommercial and Industrial Loans
Loans OutstandingBillions of Dollars
Small Loans to Businesses, Originated by Banks,Have Continued to Decrease
Source: FDIC.Notes: Agriculture loans are less than $500,000, and C&I loans are less than $1 million. FDIC Call Reports were modified to collect these data quarterly beginning in 3Q10; however, the latest year-over-year data available are from 2Q10.
Banks Are the Primary Source for Small Business CreditFunding Source August 2008 December 2008 July 2009 December 2009 July 2010Credit Cards 41% 49% 43% 41% 39%Bank Loans 50% 44% 53% 46% 43%Vendor Credit 22% 27% 29% 24% 20%No Financing 17% 22% 16% 21% 21%Private Loans (friend or family) 12% 16% 20% 18% 19%SBA 5% 3% 4% 4% 4%Source: National Small Business Association 2010 Mid-Year Economic Report.
Note: Response data do not sum to 100 percent because respondents could choose more than one answer.
FDIC Quarterly 35 2011, Volume 5, No. 1
Microenterprise Development
State Small Business Lending Programs• – Various states also have enacted laws and policy changes to encourage more small business lending and invest-ment, by, among other things, increasing guarantees and streamlining access to state loan funds, estab-lishing loan loss reserve pools for banks participating in state-sponsored small business lending programs, and directing deposits and other state-funded invest-ments to qualified small business lenders.13
In addition to government policies and programs, bank regulatory agencies have taken the following steps to encourage banks to continue making sound small business loans and working with financially distressed borrowers:
Examination Guidance Regarding Small Business •Lending – Bank regulators issued guidance on underwriting standards for lending conducted pursu-ant to the $30 billion SBLF and on promoting prudent small business lending and workouts of problem loans.14
FDIC Forum on Overcoming Obstacles to Small •Business Lending – Held on January 13, 2011, this forum explored ways to make credit more accessible to the small business sector by bringing together policymakers, regulators, small business owners, lenders, and other stakeholders to identify key issues and focus on solutions. Speakers included FDIC Chairman Sheila C. Bair; Chairman of the Board of Governors of the Federal Reserve System, Ben S. Bernanke; Senator Mark R. Warner; Thomas D. Bell, Jr., Chairman of the U.S. Chamber of Commerce; and Karen Mills, Administrator of the Small Busi-ness Administration.15
13 Congressional Oversight Panel, May 13, 2010. This report cites examples of small business lending programs and policies in Colo-rado, Delaware, Illinois, Maryland, Michigan, New Jersey, New York, Ohio, and Virginia.14 See FDIC, the Federal Reserve Board, the Office of the Comptroller of the Currency (OCC), and the Office of Thrift Supervision (OTS), “Underwriting Standards for Small Business Loans Originated under the Small Business Lending Fund Program,” December 2010, http://www.fdic.gov/news/news/financial/2010/fil10090.html; and FDIC, Federal Reserve Board, OCC, OTS, National Credit Union Administration, and Conference of State Bank Supervisors, “Inter-agency Statement on Meeting the Credit Needs of Creditworthy Small Business Borrowers,” February 5, 2010, http://www.fdic.gov/news/news/press/2010/pr10029.html. The February 2010 guidance also references other guidance issued in 2008 and 2009 that broadly addresses prudent lending and loan administration, including for small business borrowers.15 FDIC Forum on Overcoming Obstacles to Small Business Lending, http://www.fdic.gov/news/conferences/sbl.html.
Efforts to Spur Small Business LendingMultiple efforts have been under way to counter the many issues facing small businesses. For example, several banks have made public pledges and announced specific programs with the goal of increasing small business lend-ing.10 In addition, the government has initiated various policies and programs specifically to spur small business lending and investment, including the following:
The American Recovery and Reinvestment Act of •2009 (Recovery Act) – Enacted on February 17, 2009, the Recovery Act, among other things, attempted to make small business lending under the SBA’s most popular 7(a) and 504 loan programs more attractive to banks and borrowers. Specifically, the Recovery Act temporarily increased the maxi-mum guarantee for 7(a) loans from 85 percent to 90 percent and eliminated borrower fees for the 7(a) program and both borrower and lender fees for the 504 programs.11
The Small Business Jobs and Credit Act of 2010 •(Jobs Act) – Enacted on September 27, 2010, the Jobs Act, among other things:
− Established a $30 billion Small Business Lending Fund (SBLF) to provide low-cost funding to banks with assets of $10 billion or less in order to increase small business lending.
− Extended through 2010 the temporary guarantee increases and fee reductions on the SBA’s 7(a) and 504 loan programs.
− Increased the size limits for borrowers eligible for SBA-guaranteed loans and the maximum amount of the loans.
− Established a grant program for states that encourage small business lending.
− Provided a mix of temporary and permanent tax benefits to encourage small business owners to increase investment and hiring.12
10 John Tozzi, “Big Banks’ Small-Business Lending Promises,” Bloomberg Businessweek, May 4, 2010, http://www.businessweek.com/print/smallbiz/content/may2010/sb2010053_204200.htm. 11 Public Law 111-5, 123 Stat. 115, 151-161 (2009). The SBA does not directly originate 7(a) or 504 loans but provides guarantees to lenders that participate in the program. Proceeds from 7(a) loans can be used for any purpose, while proceeds from 504 loans primarily are used for real estate purchases and improvements.12 Public Law 111-240, 124 Stat. 2504 (2010). The Jobs Act affects many areas of small business that are beyond the scope of this article. For more information about the Jobs Act, see the SBA’s Web site at http://www.sba.gov/content/small-business-jobs-act-2010.
FDIC Quarterly 36 2011, Volume 5, No. 1
Microenterprise development refers to helping small business owners most at risk—namely LMI and other disadvantaged individuals who do not typically have access to the full range of mainstream financial services— create or expand their small business. Microenterprise development involves providing these business owners with loans, capital, deposit accounts, budgeting services, tax preparation services, business-specific technical assistance, and other support. Microenterprise develop-ment is a poverty alleviation strategy intended to gener-ate income and build assets for LMI or disadvantaged and underserved business owners and increase employ-ment in their communities.
Entrepreneurship has long been key to the vibrancy and resilience of the U.S. economy, and encouraging small business ownership is a prominent public policy goal. However, microenterprise development in the United States is relatively new; it is commonly thought to have emerged in the early 1980s as a response to limited earnings and business ownership potential for women and as an option for countering high unemployment through self-employment.21
Microenterprise development in the United States was also influenced by international microenterprise strate-gies in the developing world, such as the micro loan program instituted by Grameen Bank in Bangladesh and elsewhere (see text box on page 41). Although important parallels exist between international and U.S. microenterprise development, the scale of loans and capital investments tends to be much larger in the United States, given the size and complexity of the U.S. economy and banking system; the breadth of the public safety net; the lower poverty rate; and the nation’s more mature physical, technological, and social infrastructures. For example, in the United States, a “microloan” has been generally defined as a business loan of $35,000 or less, whereas in the developing world, microlending often refers to loans in the hundreds of dollars or even less.
Microenterprise Development OrganizationsClearly, not all of the more than 25 million U.S. micro-enterprises are owned by LMI or otherwise disadvan-taged individuals, nor are all LMI and disadvantaged entrepreneurs receiving microenterprise assistance. To understand the general size of microenterprise develop-ment and coverage areas, FIELD, a microenterprise policy project of the nonprofit Aspen Institute,
21 Edgcomb and Klein, “Opening Opportunities, Building Ownership.”
FDIC Hotline for Small Businesses• – In recogni-tion of the importance of making credit availableto small businesses, the FDIC created a dedicated,toll-free hotline for small business owners to makeinquiries of FDIC officials or to register concernsabout the availability of credit. The FDIC willrespond to inquiries about policies and financialinstitutions it regulates as well as make referrals toother governmental agencies where appropriate.16
Microenterprises and Microenterprise DevelopmentA number of positive efforts are beginning to counter the effects of the sluggish pace of economic growth on U.S. businesses. Yet, the very smallest businesses— microenterprises—tend to be affected most deeply by business cycles, given their size and limited access to the capital markets and other funding options. A micro-enterprise is commonly defined as a business with five or fewer employees that requires no more than $35,000 in start-up capital.17 Although it is difficult to quantify how many businesses need $35,000 or less of capital, the vast majority of all U.S. businesses—25.4 million out of a total 27.8 million in 2007—employ fewer than five employees.18
To illustrate the effects of economic problems on micro-enterprises, 25.6 percent of the smallest businesses in the NFIB Survey indicated that they were unable to obtain any of the credit they wanted in the past year, compared with 19.2 percent for medium-sized compa-nies and 14 percent for the largest companies in the survey.19 In addition, 2.4 percent of the smallest compa-nies in the survey indicated that they are unbanked in that they do not use a financial institution for business purposes, including for deposit accounts.20
16 FDIC, “FDIC Announces Hotline for Small Businesses Regarding Availability of Credit,” news release, January 13, 2011, http://www. fdic.gov/news/news/press/2011/pr11005.html. The FDIC small busi-ness Web page also provides a Business Assistance Form, available at https://ask.fdic.gov/FDICBusinessAssistanceForm/, for small business owners who prefer to inquire in writing.17 Elaine L. Edgcomb and Joyce A. Klein, “Opening Opportunities, Building Ownership: Fulfilling the Promise of Microenterprises in the United States,” FIELD, February 2005, http://www.fieldus.org/ publications/FulfillingthePromise.pdf.18 SBA, Office of Advocacy, Statistics of U.S. Businesses and Non-employer Statistics, http://www.sba.gov/advo/research/data.html#us. 19 Dennis, “Small Business Credit in a Deep Recession.” The survey showed three groups of companies by employment: those with 1 to 9 employees, 10 to 19 employees, and more than 20 to 250 employees. 20 Ibid.
FDIC Quarterly 37 2011, Volume 5, No. 1
Microenterprise Development
services tend to be female, minorities, and in the LMI income band:
Fifty-nine percent of individuals served by MDOs •were women.
Sixty percent were people of color or members of •traditionally disadvantaged racial or ethnic groups.
Sixty-eight percent of the people served were LMI, •in that they had household incomes at or below 80 percent of the Housing and Urban Development median for their location.23
Microenterprise Development Impacts and CostsOver a five-year period, clients of MDOs have reported that their businesses have had positive effects on house-hold income and their communities, such as the following:
The median revenue for business owners increased •60 percent, from about $50,000 at program intake to just over $82,000.
The median “draw,” or the amount business owners •take for personal compensation, more than doubled, from about $11,000 to $25,000.
The median contribution of draw to household •income increased from 52 percent to 71 percent.
For the approximately 40 percent of business owners •who employed workers other than the owner, the number of paid workers more than doubled, from 2.1 workers per business to 5.6.24
The average cost to service a microenterprise is about $2,700, and MDOs recoup only approximately one-fifth of their costs through interest and fees on loans and other income sources. MDOs derive the remainder of their funding from a mix of public and private sources, as shown in Chart 2 and described on the following page.
23 FIELD, “Microtest Measures 2008 Data,” http://fieldus.org/MicroTest/FY08PerformanceOverview.pdf. Microtest measures are benchmarks to assess performance across the MDO industry and are based on data gathered in the FIELD survey of MDOs described in footnote 22.24 Tamra Thetford, Elaine Edgcomb, and Ilgar Alisultanov, “At the Five-Year Mark: Outcomes Reported by US Microenterprise Clients,” FIELD, March 2010, http://www.fieldus.org/Publications/Multiyear DataRpt09.pdf.
conducts periodic surveys of groups that serve microen-terprises, called microenterprise development organiza-tions (MDOs).
MDOs are generally nonprofit organizations, but they perform many of the same functions on behalf of microenterprises as banks, private equity funds, and financial planners, such as lending, capital investments, budgeting, and financial advisory services. In addition, they provide a range of business-specific technical train-ing, coaching and mentoring, counseling, legal assis-tance, and other types of nonfinancial services. Some MDOs exist solely to conduct microenterprise develop-ment activities, and some are part of larger organiza-tions with broader missions. The text box on page 42 describes the operations of four U.S. MDOs: Grameen America, ACCION USA, Washington CASH, and the Lakota Funds.
A FIELD survey conducted in 2009, using data as of 2008, estimated the scope of microenterprise develop-ment activities as follows:
Nearly 700 MDOs in the United States served more •than 274,000 individuals.
More than 300 of these MDOs engaged in micro-•lending and originated over 9,000 loans totaling more than $100 million.
MDOs held an estimated $174 million in outstand-•ing loans and $235 million in microenterprise capital.
The most common services provided by MDOs were •“microloans,” business loans of $35,000 or less, and general technical assistance; more than 90 percent of MDOs provide these services.22
MDOs serve entrepreneurs in a wide variety of busi-nesses. For example, Web sites for the MDOs profiled in the text box on page 42 feature clients with catering businesses, hair salons, clothing designers, child care providers, and others. Demographic information gath-ered through the 2009 survey also showed that, on average, recipients of microenterprise development
22 FIELD, “U.S. Microenterprise Census Highlights FY 2008 Data,” July 13, 2010, http://fieldus.org/Publications/HighlightsFY2008.pdf. This study identified 696 MDOs; it presents data provided by 369 MDOs that completed a survey in 2009 detailing information on programs, products, and customer demographics.

FDIC Quarterly 38 2011, Volume 5, No. 1
underserved entrepreneurs. Grants up to $250,000 can be awarded to fund direct assistance to customers of MDOs or to build the MDO’s own resources or research capabilities. The SBA awarded approximately $8 million in PRIME grants to 92 recipients in 2010.27
The U.S. Department of the Treasury also provides funding for micro enterprise through administration of the Community Development Financial Institution (CDFI) Fund. The CDFI Fund has various programs that provide grants, tax credit allocations, and other monetary awards that further public policy goals such as job creation, business development, commercial real estate development, affordable housing development and homeownership, financial education, and provision of basic banking services.
To participate in most of the CDFI Fund programs, an entity must be certified by the Fund as either a CDFI or a community development entity (CDE). As of August 31, 2010, the CDFI Fund had certified 900 CDFIs, including approximately 70 insured banks and thrifts. Many MDOs also carry the CDFI or CDE designations and receive CDFI funding. CDFI funding that supports microenterprise development is not separately reported, but, overall, since its creation in 1994, the CDFI Fund has awarded $1.11 billion to community development organizations and financial institutions and $26 billion in tax credits related to private-sector investments.28
State Programs. Several states also provide funding for MDOs through Capital Access Programs (CAPs), which are lending partnerships between participating financial institutions, the state, and small businesses. CAPs operate slightly differently in each state. However, in general, the financial institution and the borrower each pay an upfront insurance premium, typically between 3 and 7 percent of the loan amount, into a reserve fund held at the originating bank that can be tapped in the event of a loan default. The state then matches the contribution. The reserve fund allows a lending bank to originate loans for microenterprises that otherwise would not qualify for a regular small business loan because of their risk profile.29
27 Information on the PRIME program was derived from the SBA Web site, http://www.sba.gov/content/prime-program-0.28 Information regarding the CDFI Fund was derived from their Web site, http://www.cdfifund.gov/.29 Information about CAPs was derived from Alan Berube, “Capital Access Programs: A Summary of Nationwide Performance,” US Depart-ment of the Treasury, January 2001.
Federal MDO funding sources. With respect to public funding, MDOs primarily use the federal programs offered by the SBA and the U.S. Department of the Treasury. SBA’s Microloan Program provides funds to specially designated intermediary lenders, which are generally nonprofit community-based MDOs with experience in lending and providing technical assis-tance to microenterprise owners. The loan amount to each microloan recipient has been capped at $35,000, although it was recently raised to $50,000 pursuant to the Jobs Act, and the average loan is about $13,000. For fiscal year 2010, the SBA budget provided $25 million for the Microloan Program.25
The SBA also recently introduced two new loan programs—Small Loan Advantage and Community Advantage—aimed at increasing the availability of loans in underserved communities by offering a streamlined application process for SBA-guaranteed 7(a) loans up to $250,000. Small Loan Advantage is available through existing SBA preferred lenders, including many FDIC-insured banks. The Community Advantage Program is a three-year pilot program that will allow MDOs and other lenders that focus on underserved populations to access the SBA 7(a) program. The programs are targeted to be launched in first quarter 2011.26
The SBA’s Program for Investment in Micro- Entrepreneurs (PRIME) is a grant program available to MDOs and other nonprofit organizations that help
25 US Small Business Administration, “Small Business Jobs Act of 2010,” September 27, 2010, http://www.sba.gov/jobsact/.26 Information about the SBA’s Small Loan Advantage and Community Advantage Programs was derived from the SBA Web site, http://www.sba.gov/advantage.
Chart 2
Most Funding for Microenterprise DevelopmentComes from Outside Sources
Source: MicroTest, “FY 2008 Performance Data Reports, Costs and Efficiencies,” April 2010.
Federal30%
Private29%
Earned Income16%
Local12%
Other5%
State8%
FDIC Quarterly 39 2011, Volume 5, No. 1
Microenterprise Development
offer savings accounts to LMI owners of microenter-prises (see text box on page 42).34
In another example, Northeast Bank, a community bank headquartered in Minneapolis, Minnesota, has partnered with the Minneapolis Community Planning and Economic Development Agency in the Microloan Program, which provides loans of up to $25,000 for small businesses in LMI neighborhoods.35 Other banks participate in microenterprise loan pools. For example, Kent County, Michigan, partnered with 18 banks in its Micro Business loan program, which combined small business loans of up to $15,000 with a small business resource center that provided technical assistance and counseling to small business owners.36
Banks that participate in microenterprise development can benefit in a number of ways. Operationally, banks benefit from revenue from loans, introduction to new and potentially profitable business customers, and good-will created by serving the community. Also, banks could potentially obtain positive consideration for microenterprise development as community develop-ment activities under the CRA regulations.37 The opportunity for CRA credit would vary based on appli-cable size-based examination procedures. Banks could potentially receive positive consideration for microloan originations, investments in microloan pools, or for other activities to support these qualifying small busi-nesses, such as by volunteering on bank time to lend financial expertise with MDOs and other organizations that benefit small businesses.
Microenterprise Development through Alternative Delivery ChannelsAlthough banks have historically been the largest provider of direct small business funding, nonbank financial entities have recently increased efforts to lend to small business customers. One innovative form of
34 Business Wire, “Grameen America and Citi Partner to Open More Than 2,500 Savings Accounts for Low-Income Entrepreneurs,” September 20, 2010, http://www.businesswire.com/news/home/ 20100920006842/en/Grameen-America-Citi-Partner-Open-2500-Savings. 35 Metropolitan Consortium of Community Developers, http://mccdmn.org/.36 Kent Area Micro Business Loan Services. 37 See 13 CFR 121.301. The CRA regulations define community devel-opment as “Activities that promote economic development by financ-ing businesses or farms that meet the size eligibility standards of the Small Business Administration’s Development Company or Small Busi-ness Investment Company programs or have gross annual revenues of $1 million or less.”
Private Donors. Private donors are another important source of MDO funding and sometimes provide staff assistance and other support to MDOs. Although data are not available on the aggregate amount of private support for MDOs, numerous foundations and other philanthropic groups fund MDOs. For example, the Laurie M. Tisch Illumination Fund granted $1.5 million for microloans and technical assistance to support ACCION USA’s Green Cart program in New York City, which helps fruit and vegetable cart vendors from low-income neighborhoods.30 Also, the Ford Founda-tion provided grant funding to ACCION USA to develop a standardized lending scorecard for under-served microenterprises with impaired or no credit history.31
Banks Support Microenterprise DevelopmentBanks contribute to microenterprise development in many of the same ways as nonprofit MDOs. They often make microloans directly to microenterprises; invest in microenterprise loan pools; make capital investments; and provide budgeting, financial education, account management, and other types of assistance to microen-trepreneurs and MDOs. The Association for Enterprise Opportunity, an MDO trade association, has banks and credit unions among its members, although it does not report specific membership statistics.
A number of banks also have philanthropic foundations that support MDOs and others focused on underserved entrepreneurs. Other banks directly participate in microenterprise development through corporate part-nerships with MDOs. For example, the Citi Foundation has provided more than $1 million in grants to MDO ACCION Texas.32 At the same time, the corporate entity, Citibank, has agreed to purchase $30 million in microloans from ACCION Texas over five years as an additional source of funding for the MDO.33 Citibank has also partnered with MDO Grameen America to
30 New York City Department of Health and Mental Hygiene, “NYC Green Cart,” 2010, http://prtl-drprd-web.nyc.gov/html/doh/html/cdp/green_carts_resources.shtml, accessed October 20, 2010.31 FIELD, “Scaling-Up Services,” http://www.fieldus.org/projects/ scale.html, accessed October 21, 2010.32 Citi, “Citi and ACCION Texas Report Significant Progress Helping Micro entrepreneurs through Economic Downturn,” news release, December 8, 2009, http://www.citigroup.com/citi/press/2009/ 091208c.htm.33 Citi, “Citi Agrees to Purchase up to $30 Million in New Loans from ACCION Texas,” August 19, 2008.
FDIC Quarterly 40 2011, Volume 5, No. 1
ConclusionSmall businesses are crucial to the health of the U.S. economy, but they can be especially vulnerable to an economic downturn. The smallest businesses, micro-enterprises, are especially challenged, given their limited resources and funding options, which are further exacer-bated for business owners who do not have access to mainstream financial services. Microenterprise develop-ment is an effective strategy to help LMI, underserved, or otherwise disadvantaged entrepreneurs create or expand small businesses that have significant positive effects on the owner’s financial well-being and the community at large. Participation in microenterprise development provides several benefits to banks, includ-ing new sources of revenue and customer relationships, community goodwill, and the potential for positive CRA consideration.
Authors: Rae-Ann Miller, Special Advisor to the Director Division of Insurance and Research
Heather Gratton, Senior Financial Analyst Division of Depositor and Consumer Protection
Luke Reynolds, Chief, Outreach and Program Development Section Division of Depositor and Consumer Protection
Disha Shah, Former Economic Assistant Division of Insurance and Research
Kathy Zeidler, Technical Writer-Editor Division of Insurance and Research
nonbank lending that has emerged in recent years is peer-to-peer lending, which involves an Internet-based platform that directly connects borrowers and lenders. Kiva is a peer-to-peer lending Web site specifically devoted to matching borrowers and lenders in the microfinance area. Kiva operates in 207 countries, including the United States; it has facilitated the origination of more than $165 million in loans, with an average size of US$381, and reports a repayment rate of 98.9 percent.38
Other nonbank entities, such as finance companies, suppliers, and even retailers, lend to microenterprises. For example, Wal-Mart Inc.’s Sam’s Club warehouse chain is testing the concept of offering online small business loans up to $25,000 to club members, focusing on businesses owned by racial and ethnic minorities, women, and veterans. Sam’s Club identified a need for credit among its members after a November 2009 survey indicated that nearly 15 percent of its business members reported being denied loans elsewhere.39
38 Data on Kiva were obtained from its Web site, http://www.kiva.org/.39 Karen Talley, “Sam’s Club to Offer Loans Up to $25,000,” Wall Street Journal, July 6, 2010, http://online.wsj.com/article/NA_WSJ_ PUB:SB10001424052748704862404575350813891562150.html.
FDIC Quarterly 41 2011, Volume 5, No. 1
Microenterprise Development
International MicrofinanceInternationally, microfinance is a concept that refers to providing basic financial services, such as savings accounts, credit products, money transfer services, and insurance, as a poverty alleviation strategy to very poor families who lack access to traditional financial institu-tions. Typical microfinance clients are very low-income individuals in rural areas who engage in farming or small trade or processing transactions with farmers. The Rural Development Institute estimates that the world’s poorest 1.4 billion people, 75 percent of whom live in rural areas, subsist on less than $1.25 per day.1
The roots of microfinance are often traced to govern-ment-sponsored rural development programs of the 1950s that offered subsidized loans targeted to specific commu-nities. Problems arose because funds did not always reach the intended targets and repayment rates were low. Begin-ning in the 1970s, private firms in Bangladesh (Grameen Bank), Brazil (ACCION International), and other coun-tries began to experiment with extending very small busi-ness loans, often to women in small groups. This became known as solidarity lending, where members of the group apply “soft” pressure to borrower-members to encourage loan payment.2
These programs and other products targeted to the poor were expanded through the 1980s and 1990s. The Grameen Bank model is likely the oldest and most well-known of the microfinance models. The bank and its founder, Mohammed Yunus, were awarded the Nobel Peace Prize in 2006. Grameen Bank is owned primarily by
1 Rural Development Institute. The demographic data are for 2005. 2 Background information about international finance was derived from the CGAP Web site, http://www.cgap.org/p/site/c/home/, and the Global Envision Web site, http://www.globalenvision.org/library/4/1051/.
its poor borrowers, who hold a 95 percent share; the government of Bangladesh owns the remaining 5 percent. The bank has 8.3 million borrowers, 97 percent of whom are women. Grameen Bank loans are unsecured, and no legal documents evidencing the loan are required. The bank’s average microenterprise loan is about US$400, and the average loan yield is about 19 percent.3
In 2009, 1,884 international microfinance companies reported holding $26.8 billion in deposits and making $64.8 billion in loans with an average balance of about US$522 and an average yield of 21.7 percent.4 As the number of organizations providing international microfi-nance has grown, some have begun to criticize the useful-ness of microfinance as a poverty alleviation strategy in light of high interest charged in some countries, which can exceed an annual percentage rate of 100 percent.
Concerns about microfinance stem from different politi-cal, economic, legal, and cultural circumstances in vari-ous countries. However, as the microfinance industry matures internationally, industry experts have acknowl-edged that improvements could include development of a credit bureau to reduce overlending, emphasis on client poverty reduction rather than lender profit to measure success, and expansion of other mainstream financial products beyond loans, such as savings accounts.5
3 Grameen Bank Web site, “Grameen Bank at a Glance,” http://www.grameen-info.org/index.php?option=com_content&task=view&id=26&Itemid=175. 4 Microfinance Information Exchange, “Microfinance at a Glance,” http://www.mixmarket.org/.5 See Vikas Bajaj, “Microlenders, Honored With Nobel, Are Strug-gling,” New York Times, January 5, 2011; Eric Bellman and Arlene Chang, “India’s Major Crisis in Microlending,” Wall Street Journal, October 29, 2010; and Neil MacFarquhar, “Banks Making Big Profits From Tiny Loans,” New York Times, April 13, 2010.
FDIC Quarterly 42 2011, Volume 5, No. 1
Microenter prise Development Organizations in the United StatesLeaders in International Microfinance Operate U.S. MDOsTwo of the largest and best known organizations in inter-national microfinance, Grameen and ACCION, apply many of their lessons learned abroad to promoting micro-enterprise development in the United States. Grameen America began operating in the United States in January 2008 and has four branches in New York City and one in Omaha, Nebraska, with other offices planned for major cities. Grameen’s customers fall below the poverty line, and many are single mothers and recent immigrants.
To simulate the “solidarity” approach to international microfinance, Grameen America requires borrowers to form groups, receive financial training, and open a savings account before receiving a loan to start or expand a small business. Thereafter, the groups meet weekly for follow-up training and support. The basic loan is capped at $1,500 per year for 6 or 12 months, with a 15 percent interest rate. Higher amounts and lower rates are available for borrowers who perform satisfactorily on their initial loans. As of August 2010, Grameen America reported serving a total of 4,000 borrowers with a nearly 99 percent repay-ment rate and that borrowers were successful in establish-ing or improving their credit scores. It also reported that customers accumulated more than $500,000 in savings in accounts held at Citibank.1
ACCION USA is one of the largest and most established U.S. MDOs. Since 1991, it has originated more than 19,000 microloans totaling more than $119 million. It currently has 2,300 active borrowers; 61 percent are Hispanic or Latino, 27 percent are African American, and 40 percent are female. ACCION USA provides loans rang-ing from $500 to $50,000, with a $30,000 cap for firms that have been in operation for less than six months. ACCION USA also provides technical advice and other support, such as seminars on how to raise credit scores and write a business plan. One-on-one credit training is provided during the loan process, online resources and group work-shops reinforce credit-building skills, and repayment histo-ries are reported to credit bureaus. ACCION USA measures its success in terms of impact on the community and reports that each loan contributes to the creation or retention of 2.4 jobs, not including that of the borrower.2
1 Information about Grameen America was obtained from its Web site, http://www.grameenamerica.com/. Citibank is participating in the FDIC Model Safe Accounts Pilot with the Grameen America accounts. The pilot launched on January 1, 2011, and is a one-year case study designed to evaluate the feasibility of insured institutions offering safe, low-cost transactional and savings accounts. See http://www.fdic.gov/consumers/template/.2 Information about ACCION USA was derived from their Web site, http://www.ACCIONusa.org/, and ACCION USA, “Sustaining Busi-nesses and Jobs Amid the Financial Crisis: Outcomes Data in the ACCION USA Footprint, 2007–2008,” January 11, 2009.
Local MDOs Benefit Their CommunitiesWashington Community Alliance for Self-Help (CASH) is an MDO in the state of Washington that provides access to capital and business development training to low-income individuals. CASH provides loans ranging from $1,000 to $35,000 and charges an interest rate of 4 percent above local bank prime rates. In addi-tion to loans, CASH provides technical business assis-tance, business consulting, mentoring, marketing assistance, Individual Development Accounts, and access to a peer support network.
The average CASH client supports a family of three on $20,400 annually when starting the program. Sixty-six percent of CASH clients are women, 63 percent are people of color, and 95 percent have low incomes. One year after graduation, CASH clients experience, on average, a 73 percent increase in their household income. Moreover, 82 percent of Washington CASH clients’ income levels were above the poverty line within 18 months of receiving services. Also, 18 months after graduation, 71 percent of clients are still in business. As of November 2009, approx-imately 2,800 low-income entrepreneurs had participated in CASH’s business development courses, and more than 800 businesses had opened or expanded. In addition, CASH had extended 383 loans, totaling $802,000; these loans have a repayment rate of 96 percent.3
Lakota Funds is a Native American community develop-ment financial institution serving the Oglala Lakota Nation in South Dakota. This group, primarily located in an area known as the Pine Ridge Indian Reservation, has an unemployment rate of more than 70 percent. The median household income of residents is 58 percent lower than the rest of South Dakota and 52 percent lower than the national average. Lakota Funds helps promote economic development by providing access to capital, business-specific technical assistance, financial educa-tion, home ownership counseling, mentoring, and assis-tance in overcoming bureaucratic hurdles to land access on the Lakota reservation.
From 1986 to 2009, Lakota Funds originated more than 660 small business loans totaling over $4.7 million, provided training to more than 1,200 people, and helped create more than 1,000 permanent jobs in a community of fewer than 40,000 people. In addition, this organization developed the first Native American-owned, tax credit-financed housing project in the nation and co-founded the first Native American Chamber of Commerce on an Indian reservation in the United States.4
3 Information about Washington Cash was derived from its Web site, http://washingtoncash.org/what-we-do/program-overview.4 Lakota Funds, “Lakota Fund’s Mission – Accomplishments and Challenges,” http://www.lakotafunds.org/mission.html, and Red Cloud Indian School, “Pine Ridge Indian Reservation Demographics,” http://www.redcloudschool.org/history/072409_PineRidge_FactSheet.pdf.


Federal Deposit Insurance CorporationWashington, DC 20429-9990OFFICIAL BUSINESS PENALTY FOR PRIVATE USE, $300
PRESORTED STANDARD
MAILPostage & Fees Paid
FDIC Permit No. G-36