fdi in the gcc countries sama quarterly workshop 7 … workshops/firs… · 1 fdi in the gcc...
TRANSCRIPT
1
FDI in the GCC CountriesSAMA Quarterly Workshop
7 March 2016
Salah Alsayaary

2
Agenda:• Concepts
• Global Trend
• GCC Trend
• Aggregate
• Country- Level
• Factors Affecting FDI in GCC
• Recommendations

3
Definition:
The investment that is made by nonresident in another country while
maintaining effective management control (at least 10 percent of the voting
power according to the IMF).
Types of FDI
inward or outward
Horizontal or Vertical
Greenfield or Brownfield

4
Benefits:• Technology and knowledge transfer.
• Job creation
• Improving labor force skills
• Improves the countries’ infrastructures
• Diversification of revenues (corporate tax)
• Good effect on Balance-of-payments (BOP)
“FDI has beneficial impact but it may have a cost..”
Costs :• Hindering domestic investment in some cases.
• Adverse effects on the BOP
• It may have Negative Influence on Exchange
Rates
• Lower the comparative advantage of the country

5
Global Trend
Global FDI flows jumped 36% in 2015
to an estimated US$1.7 trillion (UNCTAD,
World Investment Report, 2015)
0
500
1000
1500
2000
2500
2010 2011 2012 2013 2014 2015
Source: WDI and UNCTAD
World’s FDI Net Flow ($ bill)
36%

6
1%
2%
4%
19%
20%
21%
33%
0% 10% 20% 30% 40%
Sub-Saharan Africa
Middle East & North Africa
South Asia
Latin America & Caribbean
North America
Europe & Central Asia
East Asia & Pacific
Source: WDI
FDI Net Flow (2014)
384
163
136
90
68
65
59
56
45
44
0 100 200 300 400 500
United States
Hong Kong SAR, China
China
Netherlands
United Kingdom
Singapore
India
Brazil
Canada
France
Source: WDI
FDI inflow 2015Top 10 Economies (bill. $)
69%
31%
1%
FDI Net Flow (2010-14)
High income Middle income Low income
Source: WDI
Global Trend

7
24.7
416.4
0
100
200
300
400
500
1995 2011 2012 2013 2014
Source: UNCTAD
FDI Stock in GCC Countries (Billion $)
Bahrain, 5% Kuwait, 4%
Oman, 5%
Qatar, 7%
Saudi Arabia, 52%
United Arab Emirates,
28%
FDI Stock in GCC Countries (% of total)
Source: UNCTAD
60
52
43
30 27 24
4.2
1.6
0
0.5
1
1.5
2
2.5
3
3.5
4
4.5
0
10
20
30
40
50
60
70
80
90
2008 2009 2010 2011 2012 2013
Net FDI flow to GCC Countries
GCC FDI ($ billion, LHS)
Share of World FDI (%, RHS)
Source: UNCTAD
GCC Trend
-20
0
20
40
60
2010 2011 2012 2013 2014
Source: UNCTAD
Net FDI Flow to GCC Countries
United Arab Emirates Kuwait
Oman Qatar
Bahrain Saudi Arabia

8
22.4
4.41.7
5.3
1.4
11.2
-5
0
5
10
15
20
25
30
35
Bahrain SaudiArabia
Kuwait Oman Qatar UAE
Source: WDI
FDI inflow (% gross fixed capital formation)
2005-07 2012 2013 2014
8%
1%
26%
3%
12%
47%
27%
17%
61%
22%
39%
72%
26%
29%
56%
0% 10% 20% 30% 40% 50% 60% 70% 80%
UAE
Bahrain
Saudi Arabia
Kuwait
Qatar
Source: the World Bank
Distribution of FDI by Sector (2013)
Non-TradablesCommercial ServicesNon-Oil ManufacturingResources and Oil Manufacturing
GCC Trend

9
15.9
16.8
17.8
18.8
14
15
16
17
18
19
20
2011 2012 2013 2014
source: UNCTAD
FDI Stock (Billion $)
781891
989 958
0
200
400
600
800
1000
1200
2011 2012 2013 2014
Source: WDI
FDI Net Flow (Million $)
2.69
2.90
3.01
2.83
2.50
2.60
2.70
2.80
2.90
3.00
3.10
2011 2012 2013 2014
Source: WDI
FDI Net Flow (% GDP)
Bahrain
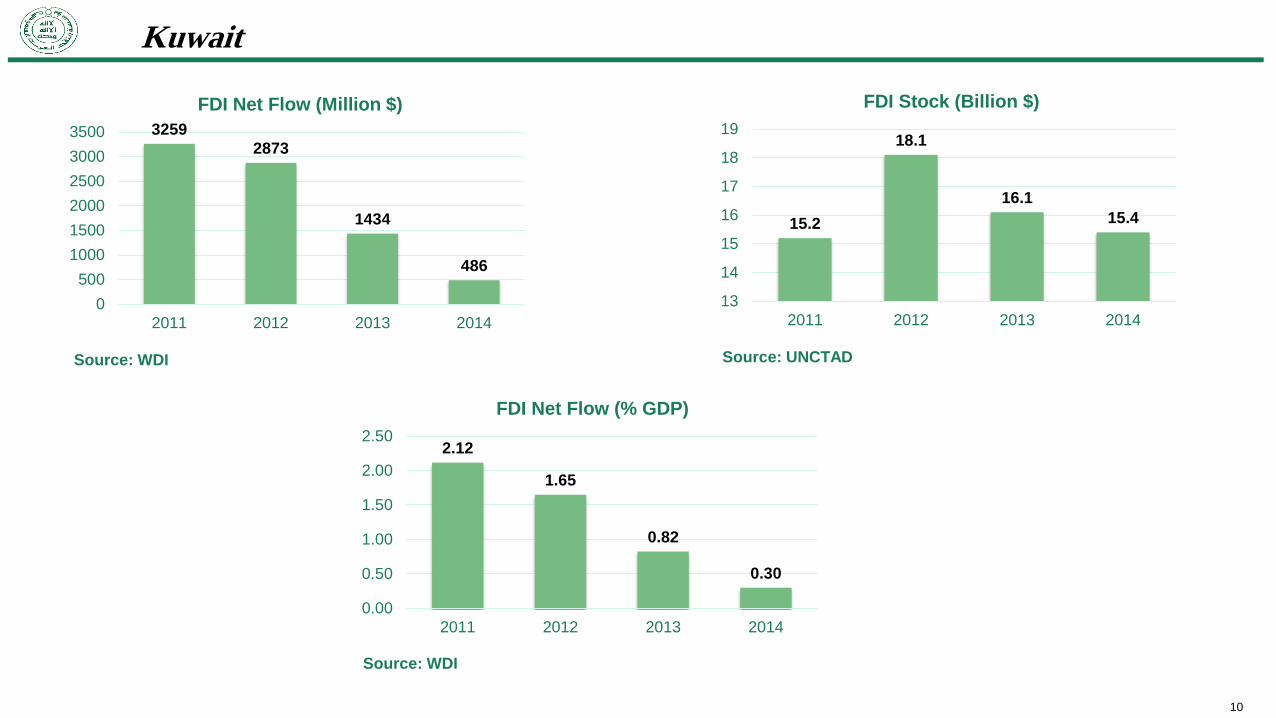
10
15.2
18.1
16.1
15.4
13
14
15
16
17
18
19
2011 2012 2013 2014
Source: UNCTAD
FDI Stock (Billion $)
3259
2873
1434
486
0
500
1000
1500
2000
2500
3000
3500
2011 2012 2013 2014
Source: WDI
FDI Net Flow (Million $)
2.12
1.65
0.82
0.30
0.00
0.50
1.00
1.50
2.00
2.50
2011 2012 2013 2014
Source: WDI
FDI Net Flow (% GDP)
Kuwait

11
15.9 16.918.5
19.7
0
5
10
15
20
25
2011 2012 2013 2014
Source: UNCTAD
FDI stock (billion $)
8741040
1626
739
0
200
400
600
800
1000
1200
1400
1600
1800
2011 2012 2013 2014
Source: WDI
FDI Net Flow (Million $)
1.29 1.36
2.08
0.90
0.00
0.50
1.00
1.50
2.00
2.50
2011 2012 2013 2014
Source: WDI
FDI Net Flow (%GDP)
Oman

12
31.5
30.9
29.9
31
29
29.5
30
30.5
31
31.5
32
2011 2012 2013 2014
Source: UNCTAD
FDI Stock (Billion $)
939
396
-840
1040
-1000
-500
0
500
1000
1500
2011 2012 2013 2014
Source: WDI
FDI Net Flow (Million $)
0.55
0.21
-0.42
0.50
-0.60
-0.40
-0.20
0.00
0.20
0.40
0.60
0.80
2011 2012 2013 2014
Sourse: WDI
FDI Net Flow (%GDP)
Qatar

13
186.8
199
207.9
215.9
170
180
190
200
210
220
2011 2012 2013 2014
Source: UNCTAD
FDI Stock (Billion $)
16308
12182
88658012
0
2000
4000
6000
8000
10000
12000
14000
16000
18000
2011 2012 2013 2014Source: WDI
FDI Net Flow (Million $)
2.44
1.66
1.19 1.07
0.00
0.50
1.00
1.50
2.00
2.50
3.00
2011 2012 2013 2014
Source: WDI
FDI Net Flow (% GDP)
Saudi Arabia

14
85.495
105.5115.6
0
20
40
60
80
100
120
140
2011 2012 2013 2014
Source: UNCTAD
FDI Stock (Billion $)
7679
960210488 10066
0
2000
4000
6000
8000
10000
12000
2011 2012 2013 2014
Source: WDI
FDI Net Flow (Million $)
2.202.57 2.71
2.52
0.00
0.50
1.00
1.50
2.00
2.50
3.00
2011 2012 2013 2014
Source: WDI
FDI Net Flow (% GDP)
UAE
15
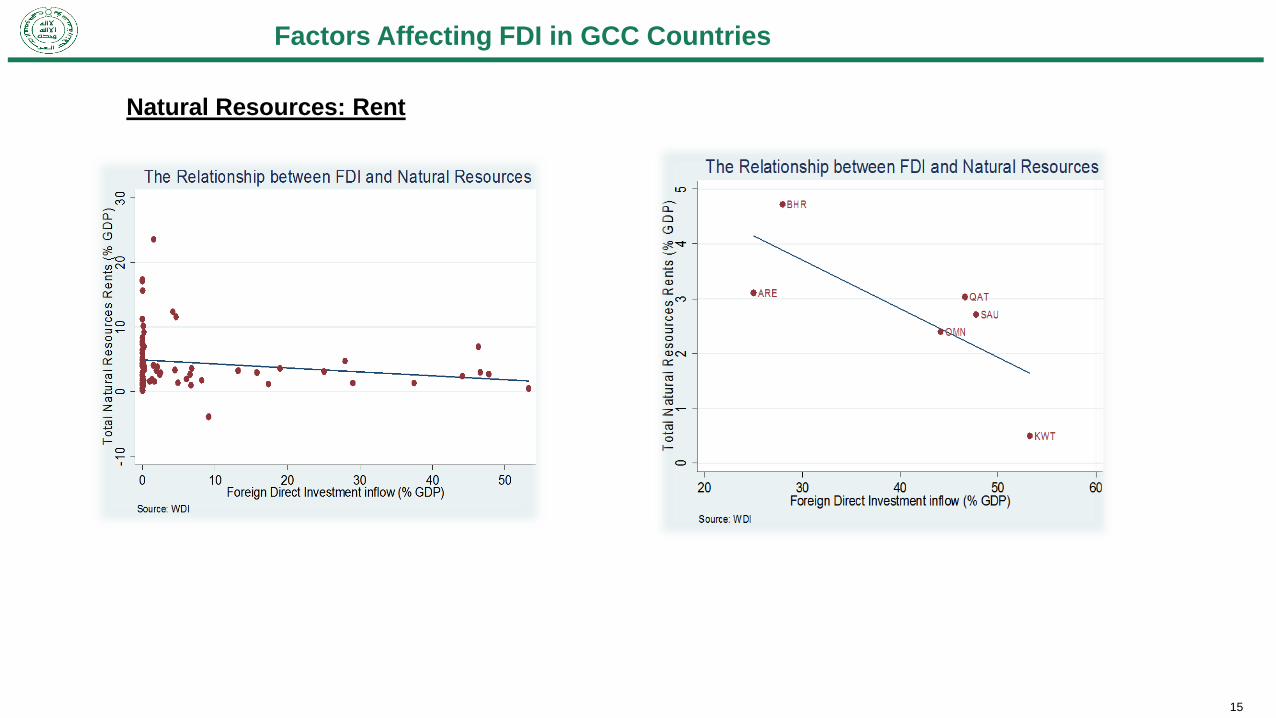
Factors Affecting FDI in GCC Countries
Natural Resources: Rent
16
0
20
40
60
80
100
120
-10000
0
10000
20000
30000
40000
50000
60000
70000
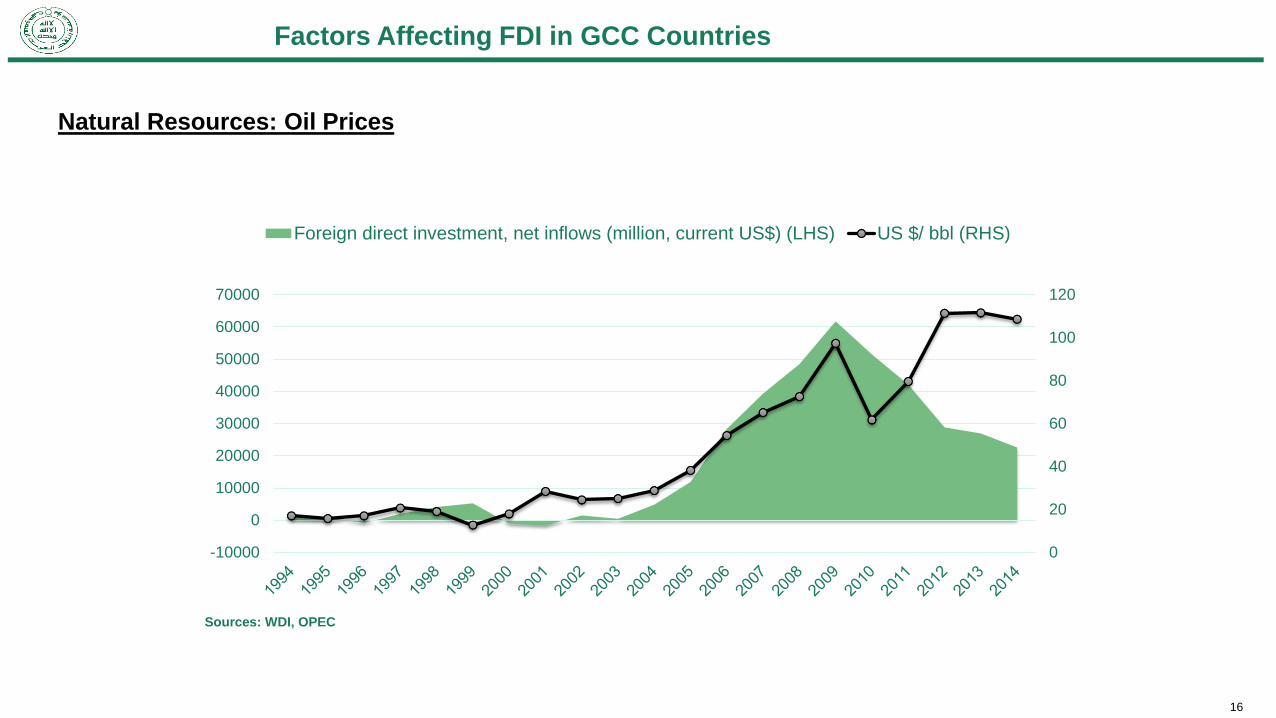
Foreign direct investment, net inflows (million, current US$) (LHS) US $/ bbl (RHS)
Sources: WDI, OPEC
Factors Affecting FDI in GCC Countries
Natural Resources: Oil Prices
17
0
20
40
60
80
100
120
140
-10000
0
10000
20000
30000
40000
50000
60000
70000
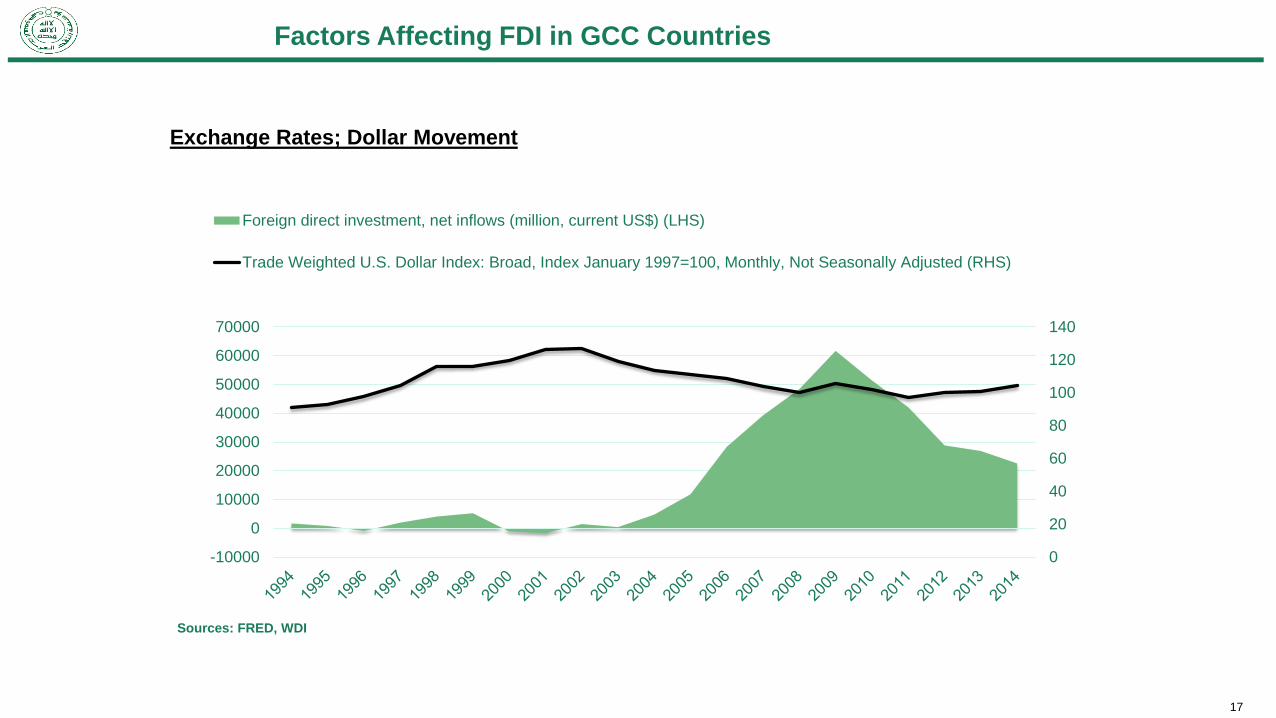
Foreign direct investment, net inflows (million, current US$) (LHS)
Trade Weighted U.S. Dollar Index: Broad, Index January 1997=100, Monthly, Not Seasonally Adjusted (RHS)
Sources: FRED, WDI
Factors Affecting FDI in GCC Countries
Exchange Rates; Dollar Movement

18
Factors Affecting FDI in GCC Countries
Economic Growth
19
-5.0-4.0-3.0-2.0-1.00.01.02.03.04.05.0
-10000
0
10000
20000
30000
40000
50000
60000
70000
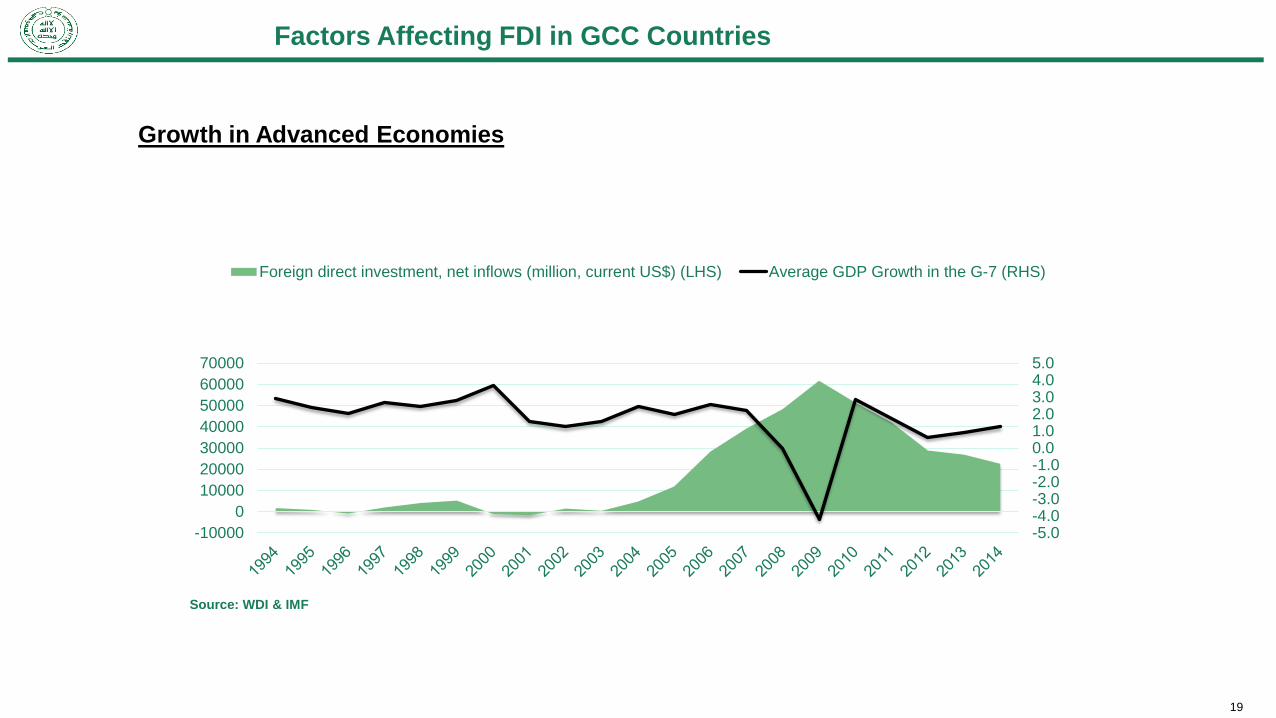
Foreign direct investment, net inflows (million, current US$) (LHS) Average GDP Growth in the G-7 (RHS)
Source: WDI & IMF
Factors Affecting FDI in GCC Countries
Growth in Advanced Economies
20
-10000
0
10000
20000
30000
40000
50000
60000
70000
80000
90000
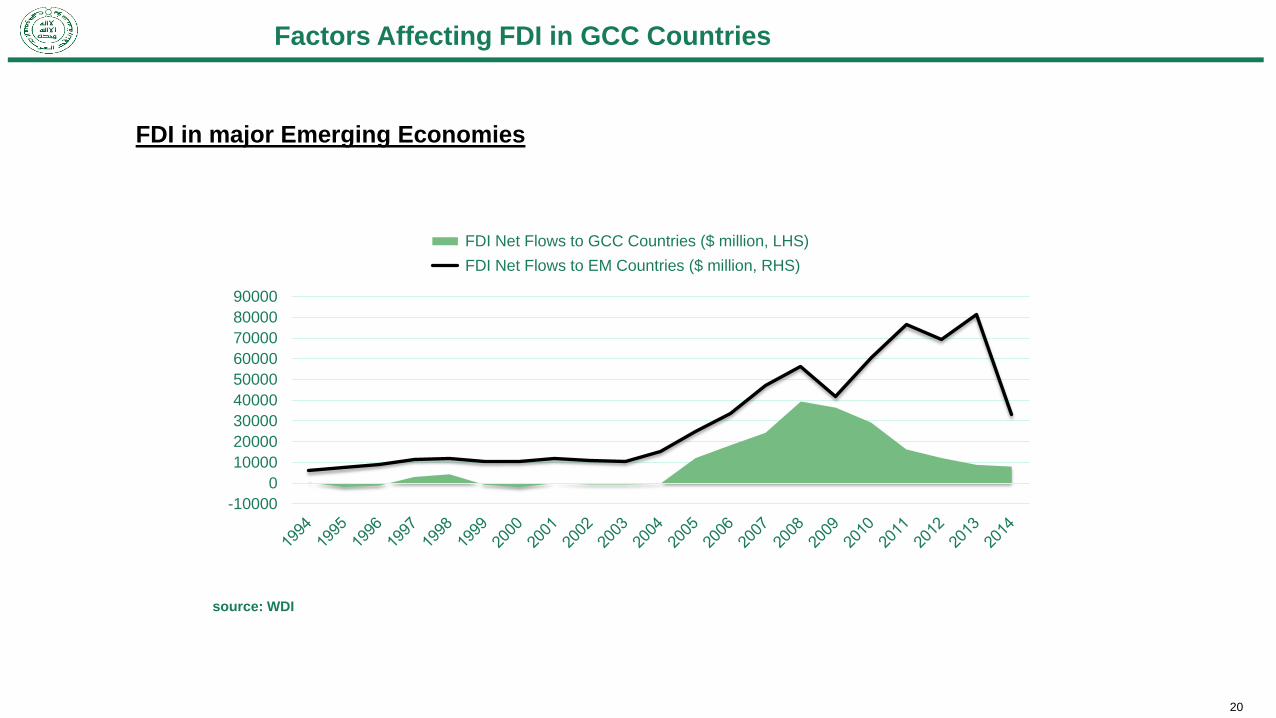
FDI Net Flows to GCC Countries ($ million, LHS)
FDI Net Flows to EM Countries ($ million, RHS)
source: WDI
Factors Affecting FDI in GCC Countries
FDI in major Emerging Economies

21
Factors Affecting FDI in GCC Countries
Trade Openness
22
-10
01
02
03
0
consu
mer
pri
ces
(an
nu
al %
)
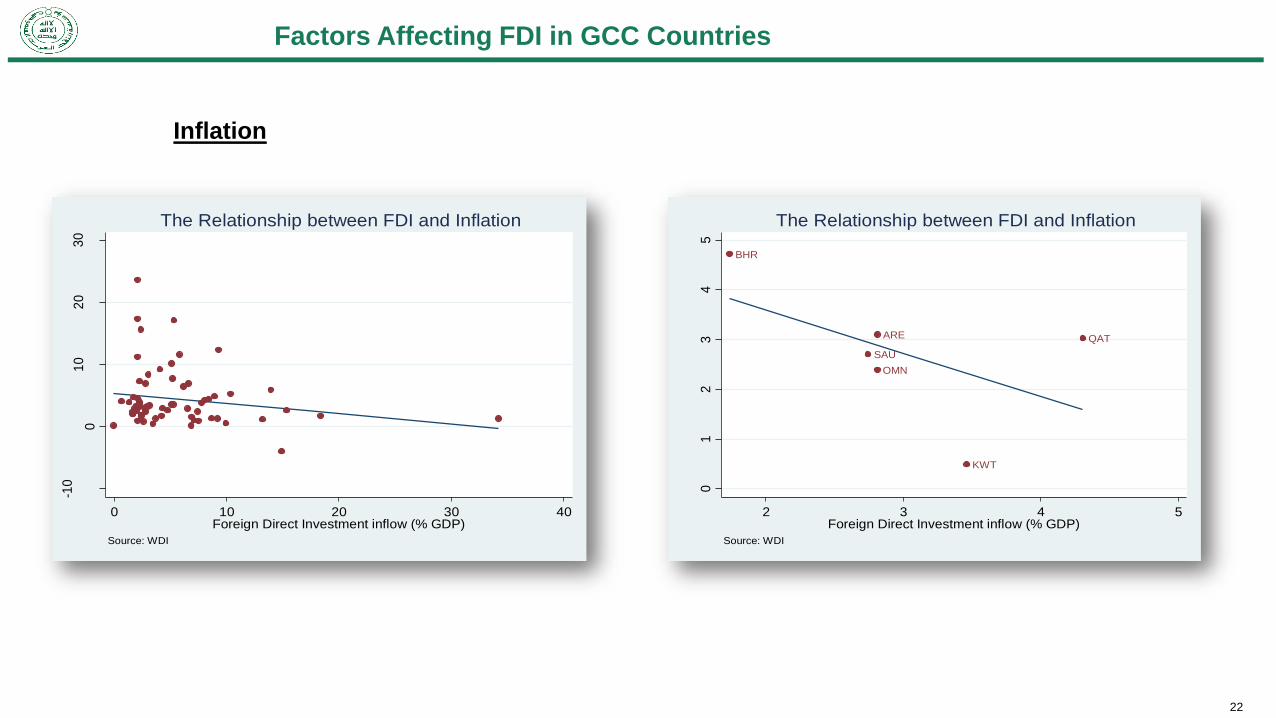
0 10 20 30 40Foreign Direct Investment inflow (% GDP)
Source: WDI
The Relationship between FDI and Inflation
ARE
BHR
KWT
OMN
QAT
SAU
01
23
45
co
nsu
mer
pri
ces in
de
x (
ann
ua
l %)
2 3 4 5Foreign Direct Investment inflow (% GDP)
Source: WDI
The Relationship between FDI and Inflation
Factors Affecting FDI in GCC Countries
Inflation

23
-10
01
02
03
0
Gen
era
l go
vern
men
t to
tal exp
en
ditu
re (
% G
DP
)
10 20 30 40 50Foreign Direct Investment inflow (% GDP)
Source: WDI
The Relationship between FDI and Government Expenditure
BHR
KWT
OMN
QAT
SAU ARE
01
23
45
Gen
era
l go
vern
men
t to
tal exp
en
ditu
re (
% G
DP
)
15 20 25 30Foreign Direct Investment inflow (% GDP)
Source: WDI
The Relationship between FDI and Government Expenditure
Factors Affecting FDI in GCC Countries
Government Expenditures

24
-50
51
01
5
Po
lity s
core
0 .2 .4 .6 .8 1Foreign Direct Investment inflow (% GDP)
Source: WDI & Polity IV project and Authors Calculation
The Relationship between FDI and Quality of Institutions
ARE
BHR
KWT
OMNQATSAU
01
23
45
Po
lity s
core
0 .05 .1 .15Foreign Direct Investment inflow (% GDP)
Source: WDI & Polity IV project and Authors Calculation
The Relationship between FDI and Quality of Institutions
Factors Affecting FDI in GCC Countries
Quality of Institutions

25
Recommendations
• It is important to learn from experiences when applying new policy
regarding FDI.
• Countries should build their FDI strategy based on their needs and set
targets to be achieved by FDI promotion.
• The focus should be on investments that provide added value and job
creation in the economy.
• It is important to have updated data for all aspects of FDI on aggregate and
sectoral levels.
• Provide more information about investment opportunities.