fdi from small businesses - selectusa.gov
TRANSCRIPT

Investment Research Team
SelectUSA
www.selectusa.gov
FDI from Small Businesses: Understanding the Behavior and Impact of Foreign-Owned SMEs in the U.S. Economy
2020
Investment Research SelectUSA
www.SelectUSA.gov

U.S. Department of Commerce | International Trade Administration 2
EXECUTIVE SUMMARY
Although foreign direct investment (FDI) and small businesses are both integral to the U.S. economy, little formal research exists on FDI from small businesses. This report fills this research gap by exploring the experiences of small foreign-owned firms operating in the United States, as well as the considerable economic impact of these firms on the U.S. economy. The subject of this paper is foreign-owned firms with a combined employment of fewer than 500 and with locations in the United States. This analysis also highlights opportunities for policymakers and development organizations to attract and maintain future investment from foreign-owned small businesses.
KEY FINDINGS
IN V E S T M E N T E X P E R I E N CE This report found that foreign-owned small businesses are more productive than foreign-owned large businesses. However, this productivity did not correlate with higher employment or sales growth. A small subset of firms experienced significant employment and sales growth but lower labor productivity. These higher-growth foreign-owned firms were also found to be more resilient and have higher survival rates.
OP P O R T U N I T I E S The data in this report indicated that foreign-owned small businesses had a lower survival rate than their larger counterparts, underscoring a need for small business assistance policies and programs.
E C O N O M I C IM P A C T Foreign-owned small businesses generate significant benefits for the surrounding economy, supporting over five million jobs, over $1 trillion in output, and $350 billion in employee compensation in 2016.
INTRODUCTION
Foreign direct investment has a large and positive impact
on the U.S. economy. In 2017, FDI directly supported
nearly 7.4 million U.S. jobs, $62.6 billion in research and
development funding, and $382.7 billion in contributions
to U.S. goods exports. Moreover, these numbers do not
reflect the substantial ripple effects generated by the
capital invested and jobs created by either FDI or small
businesses. To many, the traditional concept of FDI may
be limited to investments from large foreign
multinational enterprises (MNEs). While the presence of
these large firms is integral to the U.S. economy, this
report focuses on the other side of the FDI story: FDI
from small and medium enterprises (SMEs). Regardless
of U.S. or international heritage, small businesses overall
make up over 99 percent of companies in the United
States and support almost 50 percent of the country’s
workforce. The economic impact of FDI from small
businesses arises from their strength in numbers.
Though small businesses tend to invest less capital per
FDI project than do large MNEs, their aggregate impact
is considerable.
To ensure a common understanding of the key concepts featured, this report utilizes the Organization for Economic Cooperation and Development’s (OECD) following definitions:
• Foreign direct investment: “Foreign direct
investment is a category of cross-border
investment made by a resident in one economy
(the direct investor or parent) with the objective
of establishing a lasting interest in an enterprise
(the direct investment enterprise or affiliate)
that is resident in an economy other than that of
the direct investor.”1
• Small and medium enterprises: Small- and
medium-sized enterprises (SMEs) are
independent firms which employ fewer than a
given number of employees. The United States
considers SMEs to include firms with fewer than
500 employees.2
This report seeks to fill the research gap by first
examining characteristic and growth differences
between small and large foreign firms in the United
States using the National Establishment Time Series
(NETS) database. Following this, the direct, indirect, and
induced effects of FDI from SMEs on employment,
output, and compensation are calculated across
industries and states to demonstrate the full impact of
this investment on the broader U.S. economy.

U.S. Department of Commerce | International Trade Administration 3
REVIEW OF EXISTING RESEARCH
M O T I V A T I O N S F O R F D I Traditional research examining why FDI occurs does not consistently explain or account for the behaviors of small and medium firms. As the organizational structures, cultures, and resources of SMEs differ from those of large firms, so too do the motives for foreign investment.
Traditional motives for FDI can be classified into four groups: natural resource-seeking, market-seeking, efficiency-seeking, and strategic-asset-seeking motivations. The first three of these strategies intend to capitalize on the key advantages of a certain location, whether local resources, a client base, or a lower cost of operations. In these cases, a foreign company would be able to utilize its existing knowledge and technology for success in the local market. Conversely, the intention of strategic-asset-seeking FDI is to procure new knowledge or technology.3 These four models of international expansion assume that the firms are large and hold certain capacities (such as financing, technology, and human capital) that allow them to pursue FDI projects. However, the majority of SMEs lack the necessary resources for these motivation theories to be applicable.4 Instead, there are certain key qualities that enable an SME to successfully expand to other markets. The SMEs with more opportunity, interest, and ability to invest abroad are those with lower capital requirements, higher export ratios, and more significant research and development expenditures.5
Large MNEs often employ a global strategy to pursue a geographically broad deployment of investment.6 However, this strategy is not relevant to many smaller companies, which often prioritize specific market opportunities over a multinational investment strategy. For small companies without the advantages of economies of scale, expanding into already saturated markets is often too expensive and challenging.
There are two prominent models focused on SME motivations in FDI. First, the small-scale technology theory suggests that firms in small-scale markets expand because they have greater flexibility and lower technology costs, allowing them to enter and gain a foothold in new markets at greater speed and a lower price than larger firms.7 Second, according to the entrepreneurship model, the majority of new
international ventures by small businesses are undertaken by entrepreneurs with previous experience in international markets, and therefore the internationalization of SMEs is largely attributable to the vision and experience of a single leader.8
FDI P R O C E S S E S A N D BA R R I E R S As SMEs operate with a different set of resources than large MNEs, they utilize different processes to establish business operations in foreign markets and encounter different barriers.
SME Investment Processes The investment choices of SMEs are more influenced by the business environment in the host country than larger firms. SMEs prioritize locations with established policies and infrastructure, causing them to focus on investment opportunities in developed countries over emerging markets, unlike their MNE counterparts.9 There are a variety of processes SMEs can employ to expand their operations in foreign markets, each with distinct potential impacts on the outcomes of new overseas operations:
• International stage process: Expansion to a foreign market is traditionally segmented into four stages: no regular export activities to that market, exporting through independent representatives, the formation of a sales subsidiary, and the establishment of a subsidiary production or manufacturing site. Recent analysis of newly expanding firms uncovered a more specific set of investment stages often followed by SMEs: strategic planning, market research, location selection, entry mode selection, planning, and resource investment. 10
• Network process: For firms of any size, investing in foreign markets requires a process of developing advantageous network relationships. There are two approaches available to SMEs to foster the networks necessary for internationalization: firms can either establish new strategic alliances through internal resources (such as technical, economic, and legal relationships) or firms can join an existing network or value chain. By integrating into existing networks (for example, accessing an investment opportunity through overseas

U.S. Department of Commerce | International Trade Administration 4
suppliers), firms gradually increase their network linkages and capabilities.
• Resource-based process: The resource-based view indicates four resource determinants of SMEs’ process of FDI: human capital resources, the management competence of the primary entrepreneur and upper management, the industry knowledge of the firm, and the firm’s ability to obtain capital. While large companies often have financial and human capital advantages, SMEs use their advantages in entrepreneurship, flexibility, adaptability, innovation capacity, and speed to develop internationalization processes.
• Global value chains and productive network process: Integrating into the global value chain has high fixed costs. SMEs can participate in global value chains through either cooperation with local firms or integration with industrial clusters. The competitive advantage of SMEs originates from their highly adaptable nature, which allows them to quickly increase the value-added of their products or services. As SMEs gain international experience, they often transition from low value-added production processes to higher-value, knowledge-intensive processes.11
Barriers to SME Investment The most prevalent barriers faced by SMEs undertaking FDI are unfair competition, complex regulatory environments, challenging approval processes, corruption, and lack of financing.12 SMEs often lack access to financing for overseas expansion projects due to insufficient collateral, unpredictable returns, and information asymmetries. As small firms are considered riskier than large ones, public capital markets often preclude the participation of SMEs, and private venture capitalists and banks are sometimes disinclined to provide funding.13 There is a longstanding, disputed assumption that SMEs have characteristics that make them unattractive for financing, such as a lack of resources to endure acute economic shocks or recessions. Statistically, SMEs have a shorter lifespan, higher failure rate, and overall lower profit margin, and can also be subject to cross-generational transition issues.14 In contrast, large companies benefit from economies of scale, with advantages in obtaining capital, competing for workforce, and training upper management.
OU T C O M E S O F SM A L L B U S I N E S S FDI
Productivity Outcomes The productivity level and growth rate of a subsidiary are directly related to the productivity of the parent company. Greenfield FDI projects often require a significant investment of resources over years, thus ensuring that only the most efficient firms will pursue them.17 As a result, foreign subsidiaries often have more efficient production and distribution processes than their domestic counterparts.18 While SMEs as a group tend to be less productive than large firms, small multinational enterprises are more productive than both large MNEs and SMEs that only operate in one country. The labor productivity of small multinationals in the United States is roughly 3.7 times higher than the average small firm. Small multinational enterprises experience the highest productivity differential in the services sector, specifically in wholesale trade, finance and insurance, and other service industries.19
Employment Outcomes A 2019 University of Chicago study found that, on average, the wages of foreign-owned companies in the United States are seven percent higher than those of domestically owned firms. As foreign multinationals mostly hire highly skilled workers, the wage premium rises to 12 percent for these employees, while less skilled workers do not experience a wage premium. The wage differential is most pronounced when comparing small foreign and domestic firms, with employees of small foreign firms in the United States earning an average of 12 percent more than their domestically employed peers. The creation of one new job by a foreign enterprise adds 0.42 indirect and induced jobs and $91,000 in value added at unrelated local firms.20
Spillovers Positive economic spillovers arise from both the direct presence of foreign firms and the new investment they facilitate.21 Foreign companies contribute to efficiency by introducing new technologies, marketing techniques, management practices, workforce approaches, and inventory and quality control processes into the host country. Furthermore, the entrance of these new firms stimulates competition, efficiency, and innovation among domestic companies.22 Figure 1 illustrates how FDI (referred to as direct foreign investment or DFI in the figure below) fosters these positive spillover effects.

U.S. Department of Commerce | International Trade Administration 5
FIGURE 1: FDI INFLOWS AND POSITIVE SPILLOVERS
HOW FDI FOSTERS DOMESTIC SPILLOVERS AND INCREASED EMPLOYMENT
Source: Heise, McDonald, and Tuselmann 2011;
Note: DFI in Figure 1 refers to direct foreign investment, or FDI.
In 2013, Moran and Oldenski found that a one percent rise in the share of employees of foreign-owned firms in an industry increases the productivity of all firms by 0.81 percent in the first year and by 2.75 percent in the second year. They further indicated that the effects of productivity continue to increase over time.23
METHODOLOGY
This report is segmented into two analyses using data from the National Establishment Time Series (NETS) Database, which compiles records from Dun & Bradstreet’s (D&B) annual survey of business establishments in the United States into time series data. The database contains records on establishments active between 1989 and 2016. This report utilizes a subset of the NETS that only includes companies that were foreign owned at one point in their lifetime. D&B considers a company “foreign-owned” if the controlling interest of the business is held by a party outside of the United States. For the first analysis in the report (on firm characteristics and trends), the dataset was further filtered to companies that were foreign owned for the entirety or majority (more than 50 percent) of their lifetime. The dataset covers companies active at some
point between 1989 and 2016, not just those active for the entire time period.
The data was initially presented at the establishment rather than company level. A DUNS number, originally assigned by D&B, is the unique identifier of each establishment, and establishments are linked to their parent company by a headquarter DUNS number. The employment information in the database was obtained either through direct inquiry by D&B or by imputation. As the majority of the data is thus self-reported by the companies, it is subject to reporting error; one such potential error relates to establishments that report employment numbers for the entire firm, rather than for the individual location.
As the analyses in this report are performed at the company-level, to create a clear delineation between SMEs and large MNEs, employee counts were aggregated across all establishments by parent company. The following company categorizations are used for the analyses:
• Small-and-medium enterprise (SME): firms with 500 or fewer total employees over the entirety of their lifetime in the United States.
U.S. Department of Commerce | International Trade Administration 6
• Graduated firm: firms that started in the United States with 500 or fewer employees and expanded to more than 500 employees.
• Downsized firm: firms that started in the United States with more than 500 employees and downsized to under 500 employees.
• Large multinational enterprise (MNE): firms that have more than 500 employees for the entirety of their lifetime in the United States.
FIRM CHARACTERISTICS AND TRENDS
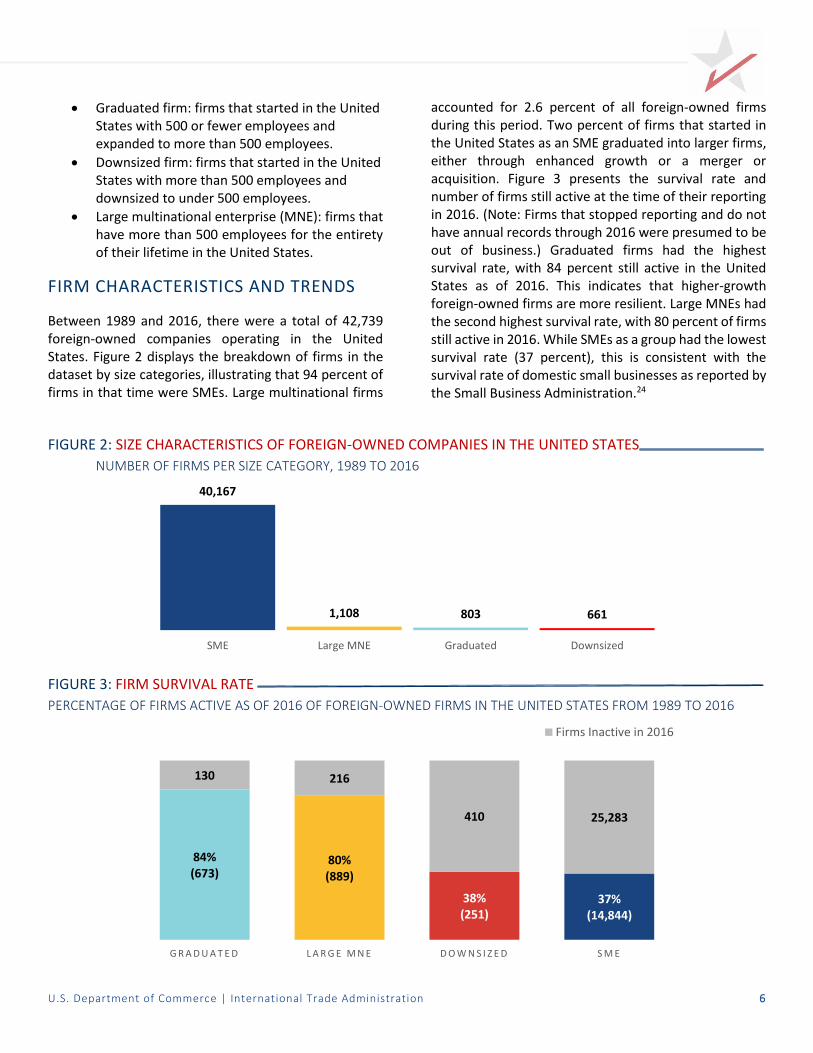
Between 1989 and 2016, there were a total of 42,739 foreign-owned companies operating in the United States. Figure 2 displays the breakdown of firms in the dataset by size categories, illustrating that 94 percent of firms in that time were SMEs. Large multinational firms
accounted for 2.6 percent of all foreign-owned firms during this period. Two percent of firms that started in the United States as an SME graduated into larger firms, either through enhanced growth or a merger or acquisition. Figure 3 presents the survival rate and number of firms still active at the time of their reporting in 2016. (Note: Firms that stopped reporting and do not have annual records through 2016 were presumed to be out of business.) Graduated firms had the highest survival rate, with 84 percent still active in the United States as of 2016. This indicates that higher-growth foreign-owned firms are more resilient. Large MNEs had the second highest survival rate, with 80 percent of firms still active in 2016. While SMEs as a group had the lowest survival rate (37 percent), this is consistent with the survival rate of domestic small businesses as reported by the Small Business Administration.24
FIGURE 2: SIZE CHARACTERISTICS OF FOREIGN-OWNED COMPANIES IN THE UNITED STATES
NUMBER OF FIRMS PER SIZE CATEGORY, 1989 TO 2016
FIGURE 3: FIRM SURVIVAL RATE
PERCENTAGE OF FIRMS ACTIVE AS OF 2016 OF FOREIGN-OWNED FIRMS IN THE UNITED STATES FROM 1989 TO 2016
40,167
1,108 803 661
SME Large MNE Graduated Downsized
84%(673)
80%(889)
38%(251)
37%(14,844)
130 216
410 25,283
G R A D U A T E D L A R G E M N E D O W N S I Z E D S M E
Firms Inactive in 2016

U.S. Department of Commerce | International Trade Administration 7
GR O W T H RA T E
Employment Growth In 1989, foreign-owned SMEs employed roughly 740,000 workers. With a compound annual growth rate (CAGR) of 0.29 percent, total SME employment stayed fairly consistent from 1989 to 2016, when just over 803,000 workers were employed. The 37 percent survival rate among SMEs likely depressed the overall employment growth rate. However, the average number of employees per firm increased from 44 in 1989 to 54 in 2016, indicating either the smallest firms exited the market over time and/or that the surviving firms experienced growth.
The small businesses that underwent exceptional employment growth are those that grew to more than 500 employees, as seen in Figure 4. These graduated firms had a CAGR of 6.9 percent from 1989 to 2016 and employed over one million people in 2016, which reflects a 550 percent increase from 1989. The majority of this growth occurred between 1989 and 1999, when the CAGR was 11 percent. The number of graduated firms from 1989 to 2016 stayed fairly stable, suggesting that the high employment growth was due to a steady increase in employment from existing companies, rather than the entrance of new high-growth firms; over 65 percent of graduated firms were active for the entire 28-year time period. Average employment per graduated firm rose from 207 in 1989 to roughly 1,540 in 2016.
FIGURE 4: EMPLOYMENT GROWTH EMPLOYMENT FROM 1989 TO 2016 AND GROWTH RATE
Sales Growth The inflation-adjusted annual sales of SMEs in 1989 surpassed the 2016 levels (see Figure 5). Despite the modest increase in overall employment from SMEs, the number of firms active in 2016 was 1,970 firms lower than in 1989, potentially explaining the negative sales growth. The number of active large MNEs contracted slightly during this period. These firms experienced a four percent increase in sales in 2016 compared to their
inflation-adjusted 1989 levels. Graduated firms had the highest sales growth between 1989 and 2016, with a CAGR of 5.79 percent. Total sales from graduated firms increased by $182 billion in this time period. Consistent with their employment growth trend, the fastest sales growth occurred between 1989 and 1999, when the growth rate was 9.85 percent.
739,862
159,986
737,641
3,994,745
803,0651,036,002
62,041
4,808,114
SME Graduated Downsized Large MNE
1989 Employment 2016 Employment
CAGR: 0.29%
CAGR: 6.90% CAGR: -9.70%
CAGR: 0.83%

U.S. Department of Commerce | International Trade Administration 8
FIGURE 5: SALES GROWTH INFLATION-ADJUSTED SALES FROM 1989 TO 2016 AND GROWTH RATE
Labor Productivity As shown in Figure 6, all of the size categories experienced negative growth in labor productivity between 1989 and 2016. This finding is consistent with other research showing that labor productivity has been declining across the U.S. economy.25 Of the four categories used in this report, SMEs had the highest level of labor productivity every year from 1989 to 2016, despite an overall negative CAGR. This is consistent with previous empirical findings in the literature review that small multinationals are more productive than large MNEs. The decline in labor productivity for SMEs could potentially be explained by the exit of the smallest firms over time. The presence of these very small firms may have caused the initial labor productivity to be artificially
high. Further, while the number of workers increased during this time period, the overall number of hours worked may have remained unchanged.
Graduated firms had a lower annual labor productivity across the time period than both SMEs and large MNEs. These findings are consistent with other literature examining the lack of connection between high growth and firm productivity; several studies have also found a negative correlation between firm growth rates and productivity. One such study observed that the negative trade-off between productivity and employment growth resulted from firms allocating resources to unproductive tasks.26
$312 billion
$47 billion
$194 billion
$1.22 trillion
$235 billion $229 billion
$14 billion
$1.27 trillion
SME Graduated Downsized Large MNE
1989 Sales 2016 Sales
CAGR: 5.79% CAGR: -9.08%
CAGR: 0.14%
CAGR: -1.01%

U.S. Department of Commerce | International Trade Administration 9
FIGURE 6: LABOR PRODUCTIVITY INFLATION-ADJUSTED OUTPUT PER WORKER 1989 TO 2016 AND GROWTH RATE
ECONOMIC IMPACT OF FOREIGN-OWNED SMES
As mentioned in the review of existing literature, FDI generates positive external economic impacts in many ways. This section examines the ripple effects produced by foreign-owned SMEs through their presence and employment in the United States. Investing firms increase employment not just through direct hiring, but also through indirect and induced means. Indirect effects encompass the jobs, output, and compensation created in a region by the companies supplying goods and services to the investing firm. Induced effects include the jobs, output, and compensation created when employees from the firm spend their wages at local establishments. It is important to note that the indirect and induced jobs created typically include both temporary and permanent positions.
M E T H O D O L O G Y This report uses the number of employees directly employed by foreign-owned SMEs by industry and by state according to the NETS database. In order to present a comprehensive snapshot of the economic impact of foreign-owned SMEs, this analysis included employment from all SMEs that were foreign owned in 2016, the latest
year of available data. Firms were segmented into major industry groups denoted by two-digit North American Industry Classification System (NAICS) codes. Companies were identified by their most recently reported NAICS code, through 2017.
Firms were initially designated as SMEs based on their company-wide employment count. This analysis used the establishment-level employee counts and NAICS codes to generate the number of employees per industry and state. The employee counts were then entered into the economic impact model on the platform JobsEQ by Chmura Analytics. Chmura’s economic impact model is based on the national input-output (I-O) matrix published by the Bureau of Economic Analysis (BEA) combined with other data sources and industry best practices. The model takes into consideration the regional industry mix, supply capacity, and economic diversity to create an I-O matrix for state-level estimates. The economic impact was calculated for each industry within each state and then aggregated to obtain the national totals presented in Figure 7.
$421,700
$295,651
$263,000
$305,401$292,629
$221,042 $217,598
$264,832
SME Graduated Downsized Large MNE
1989 Output per Worker 2016 Output per Worker
CAGR: -1.30%
CAGR: -1.03%CAGR: -0.51%
CAGR: -0.67%

U.S. Department of Commerce | International Trade Administration 10
N A T I O N A L E C O N O M I C IM P A C T Based on the results of the economic impact model, foreign-owned SMEs were directly and indirectly responsible for supporting over five million jobs, over $1 trillion in output, and $350 billion in employee compensation in 2016. These figures represent the annual steady-state impact of ongoing business operations. Foreign-owned SMEs directly created 2.7 million jobs. Of the total jobs supported by foreign-owned small businesses, 2.3 million (46 percent) were indirect and induced jobs supported by the ripple effects of SME investment. Indirect and induced effects comprised 37 percent of the total output and 39 percent of total compensation.
Including the direct, indirect and induced effects, Figure 7 presents the total estimated employment, output, and compensation generated by foreign-owned SMEs by major industry. The three industries with the largest economic impact are manufacturing, wholesale trade, and professional, scientific, and business services, which are highlighted in red in the table. Combined, these top
three industries comprised 60 percent of total employment, 64 percent of total output, and 63 percent of total compensation from foreign-owned SMEs. Manufacturing alone accounted for 32 percent of jobs supported by SMEs.
Employment supported by foreign-owned SMEs accounted for roughly four percent of all U.S. jobs in 2016. Compensation supported by foreign-owned SMEs accounted for five percent of total payroll for the United States, suggesting that foreign-owned firms have a slightly outsized compensation effect relative to their employment. Applying the most conservative ratio of foreign-owned SMEs to all SMEs observed between 2011 and 2016, there is a forecasted growth of 1,000 new foreign-owned SMEs operating in the United States as of 2019. Provided the direct employment of firms has remained fairly consistent, the economic impact of foreign-owned SMEs will increase from the 2016 levels to reflect the effects from new entrants.

U.S. Department of Commerce | International Trade Administration 11
FIGURE 7: ANNUAL ECONOMIC IMPACT OF FOREIGN-OWNED SMES TOTAL ESTIMATED EMPLOYMENT, OUTPUT, AND COMPENSATION BY MAJOR INDUSTRY
Industry NAICS Total Employment Total Output Total Compensation
Agriculture, Forestry, Fishing, and Hunting
11 17,501 $2,886,915,254 $916,359,743
Mining, Oil, and Gas 21 59,824 $13,953,869,621 $2,973,606,518
Utilities 22 12,992 $4,010,389,180 $935,581,058
Construction 23 119,212 $25,047,292,758 $8,699,090,576
Manufacturing 31-33 1,602,888 $419,910,355,319 $94,949,137,747
Wholesale Trade 42 798,262 $195,443,654,856 $67,190,677,084
Retail Trade 44-45 276,229 $35,436,640,246 $12,237,936,801
Transportation and Warehousing 48-49 241,665 $37,908,882,940 $13,960,652,339
Information 51 218,524 $67,110,187,270 $16,763,645,185
Finance & Insurance 52 245,503 $69,869,873,222 $28,695,698,103
Real Estate and Leasing 53 260,417 $78,092,414,339 $12,209,843,071
Professional, Scientific, and Business Services
54 629,099 $135,554,874,757 $59,229,151,607
Management of Companies 55 19,840 $4,564,412,369 $2,320,486,105
Administration of Waste Management 56 129,505 $15,706,069,153 $6,651,300,828
Educational Services 61 18,596 $2,256,163,366 $1,360,244,292
Health Care and Social Assistance 62 47,481 $5,331,891,521 $2,335,773,454
Arts, Entertainment, and Recreation 71 47,523 $5,731,279,955 $1,867,983,524
Accommodation and Food 72 38,804 $3,990,452,771 $1,464,324,125
Other Services 81 74,006 $8,421,041,681 $3,310,737,942
Public Administration 92 162,084 $33,850,251,251 $12,190,085,452
Total 5,019,955 $1,165,076,911,829 $350,262,315,554
Note: The three industries with the largest economic impact are highlighted in red.
FO R E I G N -OW N E D SME E M P L O Y M E N T BY ST A T E Figure 8 presents two maps measuring the total estimated direct, indirect, and induced effects of foreign-owned SMEs on U.S. employment. The maps measure the number of jobs supported by foreign-owned SMEs by state, as well as the share of these jobs relative to total employment. California is the top state for employment supported by foreign-owned SMEs, with 674,559 jobs supported through direct, indirect, and induced means.
The share of employment provides more context to the economic impact of employment supported by foreign-owned SMEs. The District of Columbia has the highest share of foreign-owned SME employment (88 jobs per 1,000 total jobs), followed by New Jersey and Connecticut.

U.S. Department of Commerce | International Trade Administration 12
FIGURE 8: DIRECT, INDIRECT, AND INDUCED EFFECTS OF FOREIGN-OWNED SMES ON EMPLOYMENT, BY STATE
STATE-LEVEL EMPLOYMENT TOTAL AND EMPLOYMENT SHARE FROM FOREIGN-OWNED SMES
SME SH A R E O F FDI E M P L O Y M E N T Figure 9 presents a map of direct employment by foreign-owned SMEs relative to total direct employment from FDI. The total employment from FDI was obtained from BEA data on the activities of multinational enterprises.27 In 2016, direct employment from SMEs
accounted for 36 percent of all FDI employment in the United States. Montana had the highest share of SME FDI employment of all U.S. states: SME employment accounted for 65 percent of direct employment from all foreign-owned companies.
FIGURE 9: SME SHARE OF TOTAL EMPLOYMENT FROM FDI DIRECT SME EMPLOYMENT SHARE OF TOTAL FDI EMPLOYMENT BY STATE, 2016

U.S. Department of Commerce | International Trade Administration 13
KEY FINDINGS AND CONCLUSION
As this report has demonstrated, the influence of foreign-owned SMEs extends far beyond individual firms’ economic spheres to encompass the related economic activity generated by these companies. Foreign-owned SMEs supported over five million jobs, over $1 trillion in output, and $350 billion in employee compensation in 2016 alone. Moreover, as new foreign-owned SMEs continue to establish operations in the United States, the annual economic impact is anticipated to surpass 2016 levels.
This report confirmed that SMEs are more productive than their larger counterparts. However, labor productivity amongst all foreign-owned firms has been steadily declining in the United States since the early 2000s. The findings also suggest that productivity and employment growth are negatively related. Additionally, the data showed that the higher-growth foreign-owned firms were more resilient, a key takeaway for policymakers designing strategies targeting productivity improvement. As this report cannot explain the productivity-growth relationship nor the overall negative productivity growth, future research on the nexus between productivity, growth, and firm survival in multinational enterprises is needed.
This report also highlights the challenge that small foreign-owned businesses face in the U.S. economy. The
foreign-owned SMEs in this dataset experienced declines in both sales and labor productivity across the observed time period, culminating in a higher failure rate. As the vast majority of foreign-owned businesses investing in the United States are SMEs, alleviating the stresses hindering these businesses is imperative to ensure the future attraction and retention of FDI from small businesses. While the conclusions of this report cannot explain why only 37 percent of SMEs survived, this survival rate is consistent with that of U.S. SMEs and is indicative of the challenges smaller businesses face.
The lower survival rate of SMEs uncovered in this report highlights the need for economic development organizations and other government development agencies to enact more policies and programs aimed at small business assistance and longevity. Further, organizations should consider initiatives focused on guidance specifically for foreign-owned SMEs. Such policies will increase the survival of existing firms, promote positive economic spillovers to local U.S. communities, and help foster investment from new foreign-owned SMEs. This is critical because, as established in this report, thriving foreign-owned SMEs generate substantial positive effects on surrounding businesses and the larger economy.

U.S. Department of Commerce | International Trade Administration 14
REFERENCES
1 OECD. 2001. “Glossary of Statistical Terms: Foreign Direct Investment.” 2001.
2OECD. 2005. “OECD SME and Entrepreneurship Outlook.” https://stats.oecd.org/glossary/detail.asp?ID=3123.
3Franco, Chiara, Francesco Rentocchini, and Giuseppe Vittucci Marzetti. 2010. “Why Do Firms Invest Abroad? An Analysis of the Motives Underlying Foreign Direct Investments.” The ICFAI University Journal of International Business Law 9 (1–2): 42–65.
4 Pu, Hualin, and Yongdan Zheng. 2015. “The FDI of Small- and Middle-Sized Enterprises: A Literature Review.” Technology and Investment 6: 63–70. https://doi.org/10.4236/ti.2015.61006.
5 Kuo, H.C., and Y. Li. 2003. “A Dynamic Decision Model of SMEs’ FDI.” Small Business Economics 20: 219–31. https://doi.org/10.1023/A:1022819206036.
6 Verbeke, Alain, and Christian Geisler Asmussen. 2016. “Global, Local, or Regional? The Locus of MNE Strategies.” Journal of Management Studies 53 (6): 1051–75. https://doi.org/10.1111/joms.12190.
7 Pu and Zheng 2015
Knight, Gary. 2010. “Born Global.” Wiley International Encyclopedia of Marketing. John Wiley & Sons. https://doi.org/10.1002/9781444316568.wiem06052.
8 McDougall, P.P., and B. Oviatt. 1994. “Toward a Theory of International New Ventures.” Journal of International Business Studies 25: 45–64. https://doi.org/10.1007/s10843-011-0075-0.
9 Pu and Zheng 2015
10 Yip, G.S., J.G. Biscarri, and J.A. Monti. 2000. “The Role of the Internationalization Process in the Performance of Newly Internationalizing Firms.” Journal of International Marketing 8(3): 10-35. https://doi.org/10.1509
11 Kaplinsky, Raphael, and Jeff Readman. 2001. “Integrating SMEs in Global Value Chains: Towards Partnership for Development.”
Pietrobelli, Giuliani E., and R. Rabellotti. 2005. “Integrating SMEs in Global Value Chains: Towards Partnership for Development.” World Development 33: 549–73.
12 UNCTAD. 1998. “The Handbook on Foreign Direct
Investment by Small and Medium-Sized Enterprises: Lessons from Asia.” Geneva.
13 De Maeseneire, Wouter, and Tine Claeys. 2006. “SMESs, FDI, and Financial Constraints.” Social Science Resarch Network. https://doi.org/10.2139.
14 Pettit, R., and R. Singer. 1985. “Small Business Finance: A Research Agenda.” Financial Management 14 (3): 47–60. https://doi.org/10.2307/3665059.; Ang, J. 1992. “On the Theory of Finance for Privately Held Firms.” Journal of Small Business Finance 1 (3): 185–203.
15 Bruderl, J., and R. Schussler. 1990. “Organizational Mortality: The Liability of Newness and Adolescence.” Administrative Science Quarterly 35 (3): 530–47
Cressy, R., and C. Olofsson. 1997. “European SME Financing: An Overview.” Small Business Economics 9 (2): 87–96. https://doi.org/DOI: 10.1023/A:1007921004599.
16 Pettit and Singer 1985
17 Moran, Theodore H., and Lindsay Oldenski. 2013. Foreign Direct Investment in the United States: Benefits, Suspicions, and Risks with Special Attention to FDI from China. Peterson Institute for International Economics.
18 Eimers, Niels, Jan Toorman, and Joris Nouwens. 2004. “The Effets of Foreign Direct Investment on Local Companies.” Kristianstad University.
19 Khachaturian, Tamar. 2012. “The Labor Productivity of U.S. Small and Medium-Sized Enterprise Multinational Companies.”
20 Setzler, Bradley, and Felix Tintelnot. 2019. “The Effects of Foreign Multinationals on Workers and Firms in the United States.” 2019–103. Chicago.
21 Javorcik, B.S. 2004. “Does Foreign Direct Investment Increase the Productivity of Domestic Firms? In Search of Spillovers through Backward Linkages.” The American Economic Review 94 (3): 605–27.
22 Blomström, Magnus and Ari Kokko. 1999. How Foreign Investment Affects Host Countries. Policy Research Working Papers. The World Bank. https://doi.org/doi:10.1596/1813-9450-1745.
23 Moran and Oldenski 2013
24 Small Business Administration Office of Advocacy. 2012.
U.S. Department of Commerce | International Trade Administration 15
“Advocacy: The Voice of Small Business in the Government.” 2012.
25 Baily, Martin, Barry Bosworth, and Siddhi Doshi. 2020. “Productivity Comparisons: Lessons from Japan, the United States, and Germany.” https://www.brookings.edu/wp-content/uploads/2020/01/ES-1.30.20-BailyBosworthDoshi.pdf.
Manyika, James, Jaana Remes, Jan Mischke, and Mekala Krishnan. 2017. “THE PRODUCTIVITY PUZZLE: A CLOSER LOOK AT THE UNITED STATES.”
26 Bottazzi, Giulio, Angelo Secchi, and Federico Tamagni. 2008. “Productivity, Profitability, and Financial Performance.” Industrial and Corporate Change 17 (4): 711–51. https://doi.org/dtn027.
Mogos, Serban, Alexander Davis, and Rui Baptista. 2015. “Defining High Growth Firms: Sustainable Growth, Volatility, and Survival.” In DRUID 15. Rome, Italy.
27 Bureau of Economic Analysis. 2017. "Data on activities of multinational enterprises." https://apps.bea.gov/.
28 Bernatchez, Keith, Leland Crane, and Ryan Decker. 2017. "An Assessment of the National Establishment Time Series (NETS) Database." The Federal Reserve Bank of Minneapolis. Working Paper 17-29. https://www.minneapolisfed.org/institute/working-papers/wp17-29.pdf.
29 Shuai, Xiaobing, and Greg Chmura. 2017. “Introducing Chmura’s Economic Impact Model.” Chmura. 2017.

U.S. Department of Commerce | International Trade Administration 16
APPENDIX I: DATA NOTES AND METHODOLOGY
D A T A N O T E S The underlying data in the NETS database is collected by Dun & Bradstreet through direct contact with companies, secretaries of state, phone records, court records, and credit inquiries, among other sources. Information on employment is obtained either through direct inquiries by D&B or by imputation. It is important to note that there is no legal obligation for establishments to participate or report honestly, and businesses’ access to credit and relationships can be impacted based on the quality of information provided. The D&B data is also subject to reporting error: one analysis comparing the NETS database to similar data sources found that some establishments report employment numbers for the entire firm, despite being prompted for employment only at the individual location. Another potential source of measurement error and discrepancy between the NETS database and official sources may arise from the fact that NETS data is collected throughout the year, while official sources collect data on uniform dates.28 The NETS includes establishments active between January 1990 and January 2017. However, given that companies report data for the previous year, the time period examined in this report is 1989 to 2016.
BEA and NETS Data Compatibility Figure 10 in the report uses BEA data on the activities of multinational enterprises, specifically majority-owned bank and nonbank U.S. affiliates. Although BEA and NETS both measure the presence of foreign-owned enterprises in the United States, their comparability is affected by discrepancies in their definitions and classifications. BEA defines foreign ownership as “ownership or control, directly or indirectly, by one foreign investor of 50 percent or more of the voting securities of an incorporated U.S. business enterprise or an equivalent interest in an unincorporated U.S. business enterprise, including a branch or partnership.” D&B defines foreign ownership as an establishment having a headquarters or parent that is located in a country other than that of the establishment. There are also differences in the industry classification systems of the two data sources: BEA classifies industry data by the industry that accounts for the largest portion of the sales across all of the affiliate’s establishment sites, whereas D&B classifies industry data based on an establishment’s
primary activity. The different levels of industry classification (company-level for BEA versus establishment-level for NETS) dilutes the accuracy of measurements and calculations utilizing both datasets.
RE S H A P I N G T H E D A T A As the NETS database was initially presented at the establishment level, the first step of the analysis was to reshape the data at the company headquarter level. D&B assigns each establishment a unique DUNS number and links all establishments in a corporate structure (including subsidiaries, as reported) to their parent company by a headquarter DUNS number. The data was collapsed by the headquarter DUNS number to obtain aggregate employment and sales figures for each company. The first and last year of reporting in the database were used to establish the number of years a company was active. Companies that were foreign owned (i.e., companies with headquarters outside the United States) for less than 50 percent of the time between 1989 and 2016 were excluded from further analysis in the firm characteristics and trends section of this report. As some companies were likely active before the start of reporting in 1989, their precise lifetimes and foreign-ownership status may be inaccurate or unknown. Therefore, one limitation of this dataset is that certain companies may have been included or excluded based on ownership during this specific timeframe. Following the consolidation of establishment data at the headquarter level, companies were then categorized based on their employment in the first and last years of reporting. The Consumer Price Index (CPI) provided by the Bureau of Labor Statistics was used to adjust the sales amounts to 2016 dollars.
E C O N O M I C IM P A C T M O D E L M E T H O D O L O G Y The economic impact section of the report included companies with 500 or fewer employees that reported foreign ownership in 2016, producing a dataset of 22,963 SMEs with 33,584 establishments. Due to the limitations of the self-reported data gathered by D&B, individual establishments can report NAICS codes, employee counts, and locations that are different than those reported by their parent companies. To obtain the most accurate picture of industry and state employment, establishment-level data was used to perform the economic impact analyses.

U.S. Department of Commerce | International Trade Administration 17
The economic impact model by Chmura Economics was utilized to calculate the multiplier and ripple effects of direct employment from foreign-owned SMEs. The following is an overview of the methodology behind the model, as described by Chmura Economics:
Chmura’s economic impact model starts with the national input-output (I-O) matrix published by the Bureau of Economic Analysis, and incorporates regional industry mix, supply capacity, and economic diversity, among other factors, to estimate the I-O matrix for each state. Using the latest wage and salary data, Chmura’s model converts the output multipliers into employment and labor income multipliers of a region. According to Chmura, JobsEQ’s regional multipliers tend to be more conservative than some other popular impact software multipliers due to the customization method: Chmura uses the most recent quarterly wages in the model, which tends to result in lower employment multipliers. The multipliers in Chmura’s model are further refined with consistency checks via modeling of supply chain, regional gross domestic product (GDP), and productivity. It is
verified in aggregate at the national level that the multipliers are consistent with national productivity data. Chmura computes county-level GDP data (based on employment and wages and BEA state- and industry-level GDP data) and the multipliers are checked for consistency with this data set. Furthermore, multipliers are used within regional supply chain modeling; feedback from this model is used to restrain the multipliers to ensure the model is logically consistent with local supply chain effects—for example, multipliers that are too high might imply manifest ripple effects that are inconsistent with the actual size and mix of industries within a local economy. Finally, while economic multipliers from various models provide good estimates of the economic impact, they are still model estimates based on industry averages.29
Companies in unclassified industries (identified as NAICS 99) could not be analyzed in the economic impact model.

U.S. Department of Commerce | International Trade Administration 18
APPENDIX II: SUPPLEMENTAL DATA
Figure A1 presents a breakdown by direct, indirect, and induced effects of the economic impact of foreign-owned SMEs. Direct employment from foreign-owned SMEs comprises 54 percent of total employment, 63 percent of total output, and 61 percent of total
compensation. Indirect and induced employment comprise 46 percent of the total employment, 37 percent of the total output, and 39 percent of total compensation supported by foreign-owned SMEs.
FIGURE A1: ECONOMIC IMPACT BREAKDOWN
DIRECT, INDIRECT, AND INDUCED IMPACTS IN EMPLOYMENT, OUTPUT, AND COMPENSATION, 2016
2,708,851
1,121,953
1,189,158
0
1,000,000
2,000,000
3,000,000
4,000,000
5,000,000
E M P L O Y M E N T
$718,371,089,796
$224,150,195,102
$207,682,412,720
$0 billion
$200 billion
$400 billion
$600 billion
$800 billion
$1000 billion
$1200 billion
O U T P U T
Direct Indirect Induced
$209,700,808,797
$71,858,320,791
$65,354,290,899
$0 billion
$50 billion
$100 billion
$150 billion
$200 billion
$250 billion
$300 billion
$350 billion
C O M P E N S A T I O N

ABOUT SELECTUSA
SelectUSA is a U.S. government-wide program housed in the International Trade Administration at the United States Department of Commerce. Our mission is to facilitate job-creating business investment into the United States and raise awareness of the critical role that economic development plays in the U.S. economy.
This report was produced for review by SelectUSA, U.S. Department of Commerce. It was prepared by Ascendant Program Services, LLC, with Research Analyst Samantha Luban as the
lead author.
FOR MORE INFORMATION, PLEASE CONTACT:
SelectUSA Investment Research
www.SelectUSA.gov