fd monitor 16 - smctradeonline.com
TRANSCRIPT


Contents
Equity 4-7
Derivatives 8-9
Commodity 10-13
Currency 14
IPO 15
FD Monitor 16
Insurance 17
Mutual Fund 18
SMC RESEARCH TEAM
REGISTERED OFFICES:
11 / 6B, Shanti Chamber, Pusa Road, New Delhi 110005.
Tel: 91-11-30111000, Fax: 91-11-25754365
MUMBAI OFFICE:
Dheeraj Sagar, 1st Floor, Opp. Goregaon sports Club, Link Road
Malad (West), Mumbai 400064
Tel: 91-22-67341600, Fax: 91-22-28805606
KOLKATA OFFICE:
18,Rabindra Sarani, Poddar Court, Gate No-4,5th Floor, Kolkata-700001
Tel : 91-33-39847000 Fax No : 91-33-39847004
AHMEDABAD OFFICE :
10/A, 4th Floor, Kalapurnam Building, Near Municipal Market,
C G Road, Ahmedabad-380009, Gujarat
Tel : 91-79-26424801 - 05, 40049801 - 03
CHENNAI OFFICE:
Salzburg Square, Flat No.1, III rd Floor, Door No.107, Harrington Road,
Chetpet, Chennai - 600031.
Tel: 044-39109100, Fax -044- 39109111
SECUNDERABAD OFFICE:
206, 3rd Floor, above CMR Exclusive, Bhuvana Towers, S.D.Road,
Secunderabad - 500003
Tel: 91-40-30780298/99, 39109536
DUBAI OFFICE:
312, Belshalat Building, Al Karama, Dubai, P.O. Box 117210, U.A.E.
Tel: 97143963120, Mobile : 971502612483
Fax : 9714 3963122
Email ID : [email protected]
Printed and Published on behalf of
Mr. Saurabh Jain @ Publication Address
11/6B, Shanti Chamber, Pusa Road, New Delhi-110005
Website: www.smcindiaonline.com
Investor Grievance : [email protected]
Printed at: S&S MARKETING
102, Mahavirji Complex LSC-3, Rishabh Vihar, New Delhi - 110092 (India)
Ph.: +91-11- 43035012, 43035014, Email: [email protected]
lobal stock markets, especially emerging markets, saw good gains in the month
of March on the back of strong flows from the investors. Rebound of close to Gfifty percent in the oil prices from the lows of February, Chinese authority's
efforts to support growth and Federal Reserve Chair Janet Yellen statement that the
policy makers should “proceed cautiously” supported the sentiments. Chinese official
manufacturing purchasing managers' index jumped to 50.2 in March (highest since
November 2014) as against expectations of 49.4 surprised market participants positively.
Reading above 50 indicates expansion. Japanese stock markets came off sharply when a
survey suggested that the sentiments among large manufacturers dropped to the lowest
level since mid-2013. The Tankan index of confidence among large manufacturers stood
at 6 in March declining from 12 three months ago.
Back at home, Indian markets witnessed continued buying interest from the institutional
investors in line with the other emerging markets. Meanwhile, the government
permitted 100 per cent FDI in the market place format of e-commerce retailing with a
view to attract more foreign investments. The major event next week is a monetary
policy review from the Reserve Bank of India (RBI). The RBI will announce the First Bi-
monthly Monetary Policy Statement, 2016-17 at 11:00 IST on Tuesday, 5 April 2016.
Market expectations are that the RBI will cut its benchmark lending rate viz. the repo
rate by at least 25 basis points on 5 April 2016, with the government sticking to its fiscal
deficit target for year 2016-17 in the Union Budget 2016-17 on 29 February 2016. The
government's announcement of a reduction in interest rates on small savings schemes for
Q1 June 2016 and dovish comments from US Federal Reserve Chairwoman Janet Yellen
have reinforced market expectations of a rate cut from the RBI. After that, the next
major trigger for the market is Q4 March 2016 results.
On the commodity front, overall it was average week for commodities but if we talk
about quarterly basis, it was a very strong quarter for commodities in which many
commodities viz; gold, crude, sugar, CPO etc saw much needed gains. Gold posted its
biggest quarterly gain in nearly 30 years amid reduced expectations for U.S. interest rate
hikes. This week, gold can trade in the range of 27800-29500 while silver can move in the
range of 35000-39000 in near term. Crude oil may trade on a volatile path as expectation
of production freeze by Russia and Venezuela in this month can support the prices while
profit booking at higher levels can cap the upside. Crude oil can move in the range of
2450-2750 in MCX. Reserve Bank of Australia Rate Decision, U.S. Fed Releases Minutes
from March 15-16 FOMC Meeting, ISM Non-Manufacturing Composite, Unemployment
Rate of Canada etc are few economic data, which are scheduled this week.
From The Desk Of Editor
(Saurabh Jain)
SMC Global Securities Limited is proposing, subject to receipt of requisite approvals, market conditions and other considerations, a further public offering of its equity shares and has filed the Draft Red Herring Prospectus with the Securities and Exchange Board of India (“SEBI”) and the Stock Exchanges. The Draft Red Herring Prospectus is available on the website of SEBI at www.sebi.gov.in and on the websites of the Book Running Lead Manager i.e., ICICI Securities Limited at www.icicisecurities.com and the Co- Book Running Lead Manager i.e., Elara Capital (India) Private Limited at www.elaracapital.com . Investors should note that investment in equity shares involves a high degree of risk and for details relating to the same, please see the section titled “Risk Factors” of the aforementioned offer document.
SMC Global Securities Ltd. (hereinafter referred to as “SMC”) is a registered Member of National Stock Exchange of India Limited, Bombay Stock Exchange Limited and its associate is member of MCX stock Exchange Limited. It is also registered as a Depository Participant with CDSL and NSDL. Its associates merchant banker and Portfolio Manager are registered with SEBI and NBFC registered with RBI. It also has registration with AMFI as a Mutual Fund Distributor.
SMC has applied with SEBI for registering as a Research Entity in terms of SEBI (Research Analyst) Regulations, 2014. SMC or its associates has not been debarred/ suspended by SEBI or any other regulatory authority for accessing /dealing in securities Market.
SMC or its associates including its relatives/analyst do not hold any financial interest/beneficial ownership of more than 1% in the company covered by Analyst. SMC or its associates and relatives does not have any material conflict of interest. SMC or its associates/analyst has not received any compensation from the company covered by Analyst during the past twelve months. The subject company has not been a client of SMC during the past twelve months. SMC or its associates has not received any compensation or other benefits from the company covered by analyst or third party in connection with the research report. The Analyst has not served as an officer, director or employee of company covered by Analyst and SMC has not been engaged in market making activity of the company covered by Analyst.
The views expressed are based solely on information available publicly available/internal data/ other reliable sources believed to be true.
SMC does not represent/ provide any warranty express or implied to the accuracy, contents or views expressed herein and investors are advised to independently evaluate the market conditions/risks involved before making any investment decision.

NEWS
DOMESTIC NEWSEconomy• The Indian government has cut the natural gas prices to USD 3.06/mmBtu
from USD 3.82/mmBtu. The move will benefit fertiliser, power and steel companies who heavily rely on natural gas. This reduction will ease their working capital burden.
• The government permitted 100 per cent FDI in the market place format of e-commerce retailing with a view to attract more foreign investments. As per the guidelines issued by the Department of Industrial Policy and Promotion (DIPP) on FDI in e-commerce, foreign direct investment (FDI) has not been allowed in inventory-based model of e-commerce.
Healthcare• Cadila Healthcare announced that Nesher Pharmaceuticals, a subsidiary of
Zydus Pharmaceuticals USA has received its first ANDA approval from USFDA to market Dextroamphetamine IR Tabs. The drug falls in the CNS segment and is the first product to be developed by the R&D team at Nesher.
Finance• Dewan Housing Finance Corporation announced that the Company has made
an investment of Rs. 75 crore by way of subscription to equity share capital in DHFL Advisory and Investments, a newly incorporated Wholly Owned Subsidiary (WOS) of the Company. The WOS proposes to use this money for making investments in DHFL Pramerica Asset Managers (“JV AMC”), which is a Joint Venture between the Company and PGLH of Delaware Inc.
Capital Goods• Suzlon Energy has secured a turnkey order of 48.30MW wind power project
from Indian Oil Corporation. The project consists of 11 units of S97 120m all steel hybrid tower and 12 units of S97 90m tubular tower with rated capacity of 2.1MW each. The project has the potential to provide power to 26,000 households and reduce 0.10 million tonnes of CO2 emissions per annum.
• Bharat Heavy Electricals Limited (BHEL) has commissioned second 40 Mw hydropower generating unit at the Teesta low dam hydro electric project (HEP) stage-IV in West Bengal.
Pharmaceutical• Sun Pharmaceuticals announced the acquisition of 14 established
prescription brands from Novartis AG and Novartis Pharma AG (together 'Novartis') in Japan. According to the agreements entered into between the parties, a wholly-owned subsidiary of Sun Pharma will acquire the portfolio consisting of 14 established prescription brands from Novartis for a cash consideration of US$ 293 million.
• Aurobindo Pharma has received final approval from the US Food & Drug Administration (USFDA) to manufacture and market Rivastigmine Tartrate Capsules USP, 1.5 mg, 3 mg, 4.5 mg and 6 mg. This product is expected to be launched in Q1 FY16-17.
Automobile• TVS Motor has announced the launch of its new four stroke TVS XL 100 in
Maharashtra. Along with TVS XL Super and TVS XL Super Heavy Duty, TVS XL 100 is currently available across all TVS dealerships in Maharashtra. TVS XL is priced at ̀ 28,843 ex showroom in Maharashtra.
Paint• Kansai Nerolac has approved the sale of company's land admeasuring 15.86
acres at Perungudi, Chennai to Brigade Properties Ltd or its nominees/ another SPV formed by Brigade Group and GIC Singapore for a sum of ̀ 550 crore.
Realty/ Construction• HCC has been awarded two contracts worth `623 crore in the Hydro power
and tunneling sectors. The first order worth `456 crore, by Tangsibji Hydro Energy of Bhutan, is for constructing 118 megawatt (MW) Nikachhu Hydropower project and it is to be completed in 48 months. The second order of ̀ 167 crore from Jammu and Kashmir State Power Development Corporation (JKSPDC) is for constructing a double lane tunnel of approximately 1,500 metre which will be the access road to Sawalkote Hydroelectric Power Project in J&K. This project is expected to completed in 30 months.
INTERNATIONAL NEWS• US consumer confidence index climbed to 96.2 in March from an upwardly
revised 94.0 in February. Economists had expected the confidence index to rise to 94.0 from the 92.2 originally reported for the previous month.
• US pending home sales index climbed 3.5 percent to 109.1 in February from a downwardly revised 105.4 in January. Economists had expected the index to increase by about 1.5 percent.
• US initial jobless claims climbed to 276,000, an increase of 11,000 from the previous week's unrevised level of 265,000. Economists had expected jobless claims to inch up to 266,000.
• US personal income rose by 0.2 percent in February after climbing by 0.5 percent in January. Economists had expected income to tick up by 0.1 percent. The Commerce Department also said personal spending inched up by 0.1 percent in February, matching the downwardly revised uptick seen in January.
• China's manufacturing activity expanded unexpectedly in March. The Manufacturing Purchasing Managers' Index rose to 50.2 in March from 49.0 in the previous month. Economists had expected the index to increase to 49.3. Any reading above 50 indicates expansion, while a score below 50 suggests contraction in the sector. Moreover, country's factory activity returned to growth territory for the first time in eight months.
Ex-Date Company Purpose
6-Apr-16 KPIT Technologies Interim Dividend6-Apr-16 Hindustan Zinc Interim Dividend - Rs 24/- Per Share6-Apr-16 Colgate Palmolive (India) Interim Dividend - Rs 3/- Per Share
(Purpose Revised)6-Apr-16 Vivimed Labs Face Value Split (Sub-Division) - From
Rs 10/- Per Share To Rs 2/- Per Share11-Apr-16 MindTree Interim Dividend - Rs 2/- Per Share
(Purpose Revised)12-Apr-16 KSB Pumps Dividend - Rs 5.50/- Per Share12-Apr-16 DIC India Dividend - Rs 4/- Per Share13-Apr-16 Sanofi India Final Dividend - Rs 25/- Per Share +
Special Dividend - Rs 22/- Per Share13-Apr-16 ABB India Dividend - Rs 3.70 Per Share21-Apr-16 Foseco India Dividend - Rs 7/- Per Share22-Apr-16 Merck Dividend - Rs 7.50/- Per Share (Book
Closure Dates Revised)26-Apr-16 Vesuvius India Dividend - Rs 6.25/- Per Share27-Apr-16 Castrol India Dividend - Rs 5/- Per Share
Meeting Date Company Purpose
5-Apr-16 GM Breweries Results/Dividend5-Apr-16 Gallantt Ispat Meeting Updates7-Apr-16 Bharat Heavy Electricals Results12-Apr-16 Lux Industries Stock split15-Apr-16 Infosys Results/Dividend19-Apr-16 Gruh Finance Results/Dividend19-Apr-16 Wipro Results/Dividend22-Apr-16 HDFC Bank Results/Dividend23-Apr-16 Steel Strips Wheels Results/Dividend24-Apr-16 Persistent Systems Results25-Apr-16 Axis Bank Results/Dividend25-Apr-16 Tata Sponge Iron Results/Dividend26-Apr-16 Mahindra Lifespace Dev. Results/Dividend29-Apr-16 GIC Housing Finance Results/Dividend
FORTHCOMING EVENTS
NOTES:1) These levels should not be confused with the daily trend sheet, which is sent every morning by e-mail in the name
of "Morning Mantra ".2) Sometimes you will find the stop loss to be too far but if we change the stop loss once, we will find more strength
coming into the stock. At the moment, the stop loss will be far as we are seeing the graphs on weekly basis and taking a long-term view and not a short-term view.
TREND SHEET
Stocks *Closing Trend Date Rate SUPPORT RESISTANCE Closing
Price Trend Trend
Changed Changed
SENSEX 25269 DOWN 13.11.15 25610 25500 25800
S&P NIFTY* 7713 DOWN 13.11.15 7762 - 7750
CNX IT 11194 UP 23.03.16 11207 10700 10500
CNX BANK 16175 UP 18.03.16 15655 15000 14800
ACC 1414 UP 18.03.16 1337 1300 1270
BHARTIAIRTEL 336 UP 04.03.16 332 330 320
BHEL 116 DOWN 13.08.15 259 125 135
CIPLA 514 DOWN 03.09.15 691 570 590
DLF 121 UP 04.03.16 108 95 90
HINDALCO 86 UP 11.03.16 84 83 78
ICICI BANK 238 UP 18.03.16 230 210 205
INFOSYS 1208 UP 04.03.16 1173 1150 1120
ITC 336 UP 18.03.16 325 310 300
L&T** 1237 DOWN 27.08.15 1620 - 1250
MARUTI*** 3720 DOWN 08.01.16 4215 - 3850
NTPC 130 DOWN 26.02.16 122 132 137
ONGC 209 DOWN 17.10.14 397 225 235
RELIANCE 1035 UP 04.03.16 1005 980 960
TATASTEEL 317 UP 04.03.16 289 290 270
S/l
4
®
Closing as on 01-04-2016*NIFTY has breached the resistance of 7500**LT has breached the resistance of 1200***MARUTI has breached the resistance of 3700

BSE SENSEX GAINERS & LOSERS TOP (% Change) NSE NIFTY GAINERS TOP & LOSERS (% Change)
SECTORAL INDICES (% Change)
SMC Trend
FMCGHealthcare
Auto BankRealty
Cap GoodsCons Durable
Oil & GasPower
ITMetal
Down SidewaysUp
GLOBAL INDICES (% Change)
INDIAN INDICES (% Change)
5
®
SMC Trend
Nifty BSE Midcap S&P CNX 500BSE SmallcapSensex Nifty Junior
0.30
0.04
1.14
0.62
0.73
0.53
0.00
0.20
0.40
0.60
0.80
1.00
1.20
1.40
Nifty Sensex BSE Midcap BSE Smallcap
Nifty Next 50
S&P CNX 500
SMC Trend
FTSE 100CAC 40
NasdaqDow jonesS&P 500
NikkeiStrait times
Hang SengShanghai
2249.28
640.95
1521.66
-2177.80
-92.10
-2500.00
-2000.00
-1500.00
-1000.00
-500.00
0.00
500.00
1000.00
1500.00
2000.00
2500.00
Friday Monday Tuesday Wednesday Thursday
FII / FPI Activity MF Activity
1.52
1.31
0.99
1.41
0.35
0.00
1.58
-0.12
-1.53
-1.97
-0.44
-2.50
-2.00
-1.50
-1.00
-0.50
0.00
0.50
1.00
1.50
2.00
Auto Index Bankex Cap Goods Index
Cons Durable Index
FMCG Index Healthcare Index
IT Index Metal Index Oil & Gas Index
Power Index Realty Index
-1.70
-1.38
1.00
0.58
0.08
0.53
0.15
-0.29
-1.06
-2.00
-1.50
-1.00
-0.50
0.00
0.50
1.00
1.50
Nasdaq Comp. Dow Jones S&P 500 Nikkei Strait Times Hang Seng Shanghai Comp.
FTSE 100 CAC 40
5.00
4.26 4.12 3.943.38
-4.92
-3.91 -3.67-3.10 -3.09
-6.00
-4.00
-2.00
0.00
2.00
4.00
6.00
Idea Cellular IndusInd Bank B P C L Adani Ports Eicher Motors H D F C Cipla Hindalco Inds. Sun Pharma.Inds.
M & M
3.99
2.54 2.482.20 2.19
-4.95
-3.81-3.21 -3.17 -2.90
-6.00
-5.00
-4.00
-3.00
-2.00
-1.00
0.00
1.00
2.00
3.00
4.00
5.00
Adani Ports Hero Motocorp
Tata Motors Asian Paints Bajaj Auto H D F C Cipla Sun Pharma.Inds.
M & M Lupin
INSTITUTIONAL ACTIVITY (Equity) (` Crore)
Closing as on 21.10.15

Beat the street - Fundamental Analysis
Above calls are recommended with a time horizon of 8 to 10 months. Source: Company Website Reuters Capitaline
6
®
INDRAPRASTHA GAS LIMITED (IGL) CMP: 569.45 Upside: 16%Target Price: 660.00
Investment Rationale �Healthy profitability with strong cash generations from operations, maintaining low debt at present �IGL continues to augment its infrastructure in order with debt equity ratio of 0.03:1 and comfortable to meet the increasing demand of CNG arising out of working capital position would give further growing number of CNG vehicles in Delhi. The strength to generate financial growth of the growth drivers for increase in demand of CNG are - company.car manufacturers coming up with CNG variants and
Delhi Government's directive making it mandatory Valuationfor all LCVs operating in Delhi to run on CNG. The Factors such as low global natural gas prices, company is in the process of enhancing its favourable government policies, a surge in liquefied compression capacity by adding new stations. natural gas (LNG) regassification capacities, revival
�On the PNG front, IGL has planned to expand its in gas demand from price-sensitive segments, better business activities in Delhi and its neighbouring prospects for pipeline and LNG infrastructure and towns like Noida, Greater Noida and Ghaziabad. It improving clarity on Petroleum & Natural Gas would now be benefited with supply of PNG for Regulatory Board's (PNGRB) role are likely to drive non cooking applications like Geysers also. growth of the company. Thus, it is expected that the Moreover, it is also working towards expanding its stock will see a price target of ̀ 660 in 8 to 10 months PNG network to cover all charge areas of Delhi and time frame on an expected P/E of 18x and FY17 (E) further Industrial and commercial segments earnings of ̀ 36.64.would be the focus areas for the organization in the future.
�Oil Ministry allows IGL to open CNG pumps at OMC outlets. Therefore, it is planning to start selling CNG from Indian Oil Company (IOC), Hindustan Petroleum (HPCL) and Bharat Petroleum (BPCL) petrol pumps.
�Recently, government's move to cut natural gas price to $3.2 per mmBtu from $3.82 per mmBtu.would help in supporting the LNG pooling mechanism, and therefore, offer an excellent opportunity for a revival in consumption growth from power and fertilizer sectors.
52 W H/L(`) 376.00/607.50Mkt. Cap.(`Cr) 7972.30Latest Equity(Subscribed) 140.00Latest Reserve (cons.) 2161.57Latest EPS (cons.) -Unit Curr. 28.89Latest P/E Ratio –cons 19.71Latest Bookvalue(cons.) -Unit Curr. 164.40Latest P/BV - cons 3.46Dividend Yield -% 1.05Stock Exchange BSE
% OF SHARE HOLDING
P/E Chart
` in cr
Actual EstimateFY Mar-15 FY Mar-16 FY Mar-17
Revenue 3,669.90 3,785.70 3,943.10EBITDA 793.00 799.40 898.00EBIT 644.30 644.70 731.60Pre-tax Profit 649.00 657.90 761.00Net Income 437.70 441.60 513.00EPS 31.27 31.60 36.64BVPS 149.87 172.44 200.01ROE(%) 22.70 19.40 19.50
VALUE PARAMETERS
Investment Rationale •During the quarter ended December 2015, it has •The Ramco Cements Limited (Ramco) is engaged in reported more than fourfold surge in net profit to
the manufacture of cement, ready-mix concrete `117.26 crore on a consolidated basis. The firm and dry mortar products. It operates in two had clocked a net profit of `21.93 crore for the segments: Cement and Power generation from corresponding quarter in the previous fiscal. Total Windmills. The company caters mainly to the income stood at `823.04 crore for the October- domestic markets. The company has its presence December period as against `818.30 crore in the across Tamil Nadu, Andhra Pradesh, West Bengal same quarter of the previous fiscal.and Karnataka and is headquartered at Chennai. Valuation
•The company continued to focus on cost The Company expects demand for cement is likely to reduction measures which enabled the company rise in the near term. The Governments' focus on to reduce the operating cost significantly and the infrastructure development, housing sector, smart company is confident of reducing the cost further cities, roads etc., augurs well for the company. The in the coming quarters. Company is confident of meeting the upsurge in
demand and participating proactively in the next phase •With the superior operating profitability, of growth in the country. Its performance is much dominant market share backed by strong brand better than its peers. Further, faster recovery in recognition ensures buoyant growth prospects for Southern market will help improve its performance, the company. Having split grinding unit near to thus it is expected that the stock will see a price target h igh consumption markets minimizes of ̀ 464 in 8 to 10 months time frame on a target P/E of transportation costs and helps in timely servicing 21.31x and FY17 (E) earnings of ̀ 21.45.of the demand.
•Being located in the south, it has a better availability of raw materials mainly limestone which is found to be in abundant quantity in southern regions of India; Major reforms by the government such as 'Housing for All', 'Smart cities' are expected to boost the infrastructure activities and thus the cement demand.
•The Chennai floods, which took place last Calendar year, has increased improve demand for cement in the area and the company is expected to get the huge order books. Moreover, strong fundamentals of the country give a breathing space for revival of the economy and some hope for pick up demand for cement.
P/E Chart
THE RAMCO CEMENTS LIMITED CMP: 400.45 Upside: 14%Target Price: 457.00
Face Value (`) 1.00
52 Week High/Low 427.00/280.80
M.Cap (`Cr.) 9533.78
EPS (`) 18.79
P/E Ratio (times) 21.31
P/B Ratio (times) 3.31
Dividend Yield (%) 0.37
Stock Exchange BSE
` in cr
% OF SHARE HOLDING
VALUE PARAMETERS
Actual EstimateFY Mar-15 FY Mar-16 FY Mar-17
Revenue 3,604.30 3,634.50 4,029.20
EBITDA 796.80 998.20 1,123.50
EBIT 545.50 671.20 767.20
Pre-tax Profit 358.40 617.30 751.70
Net Income 246.10 434.60 511.50
EPS 10.00 17.97 21.45
BVPS 110.28 125.92 142.87
ROE 9.70 15.20 16.10
11.62
23.46
6.3942.3
16.24
Foreign
Institutions
Non Promoter Corporate Holding
Promoters
Public & Others
20.7
16.65
56.81
45
5.84
Foreign
Institutions
Govt Holding
Non Promoter Corp. Hold.
Promoters
Public & Others

Charts by Spider Software India Ltd
7
EQUITY
Above calls are recommended with a time horizon of 1-2 months
Disclaimer : research. The analysis contained in the analyst research is based on numerous assumptions. Different assumptions could result in materially different results.The analyst, not any of its affiliated companies, not any of their members, directors, employees or agents accepts any liability for any loss or damage arising out of the use of all or any part of the analysis research.
The analyst and its affiliates companies make no representation or warranty in relation to the accuracy, completeness or reliability of the information contained in its
SOURCE: CAPITAL LINE
®
The stock closed at ̀ 490.90 on 01st April 2016. It made a 52-week low at ̀ 395.30
on 24th August 2015 and a 52-week high at `544.55 on 05th January 2016. The
200 days Exponential Moving Average (EMA) of the stock on the daily chart is
currently at ̀ 467.09.
It has formed higher highs and higher lows on daily charts, which is bullish in
nature. One can buy in the range of 483-486 levels for the target of 505-510
levels with SL of 473 levels.
Biocon Limited
The stock closed at ̀ 198.65 on 01st April 2016. It made a 52-week low at ̀ 156 on
29th February 2016 and a 52-week high of `411.45 on 15th April 2015. The 200
days Exponential Moving Average (EMA) of the stock on the daily chart is
currently at ̀ 247.72.
As we can see on the chart after a continuous fall since January 2015, it has
made its 52 week low of 156 levels in the last month, which is seen to be the
major support level when it took rally in 2009. It may be considered as a
technical bounce but we anticipate that in coming days there will be a sharp
buying at current levels, which can result in profitable returns in coming
months. One can buy in the range of 192-194 levels for the target of 205-210
levels with strict SL of 187 levels.
Canara Bank
DERIVATIVES
CHANGE IN NIFTY OPTION OI (IN QTY)
WEEKLY VIEW OF THE MARKET
NIFTY OPTION OI CONCENTRATION (IN QTY)
CHANGE IN BANKNIFTY OPTION OI (IN QTY)BANKNIFTY OPTION OI CONCENTRATION (IN QTY)
®
ALBK (APR FUTURE)
Buy: Above `59
Target: `63
Stop loss: `57
HCLTECH
Buy 460. PUT 12.00
Sell 450. PUT 8.00
Lot size: 1000
BEP: 456.00
Max. Profit: 6000.00 (6.00*1000)
Max. Loss: 4000.00 (4.00*1000)
APR
APROPTIONSTRATEGY
FUTURE
HDIL
Buy APR 80. CALL 4.00
Sell 85. CALL 2.40
Lot size: 6000
BEP: 81.60
Max. Profit: 20400.00 (3.40*6000)
Max. Loss: 9600.00 (1.60*6000)
APR
ITC
Buy 340. CALL 7.00
Sell 350. CALL 4.00
Lot size: 1600
BEP: 343.00
Max. Profit: 11200.00 (7.00*1600)
Max. Loss: 4800.00 (3.00*1600)
APR
APR
DERIVATIVE STRATEGIES
POWERGRID ( FUTURE)
Sell: Below `138
Target: `132
Stop loss: `141
APR VEDL ( FUTURE)
Sell: Below `88
Target: `82
Stop loss: `91
APR
BULLISH STRATEGY BEARISH STRATEGY
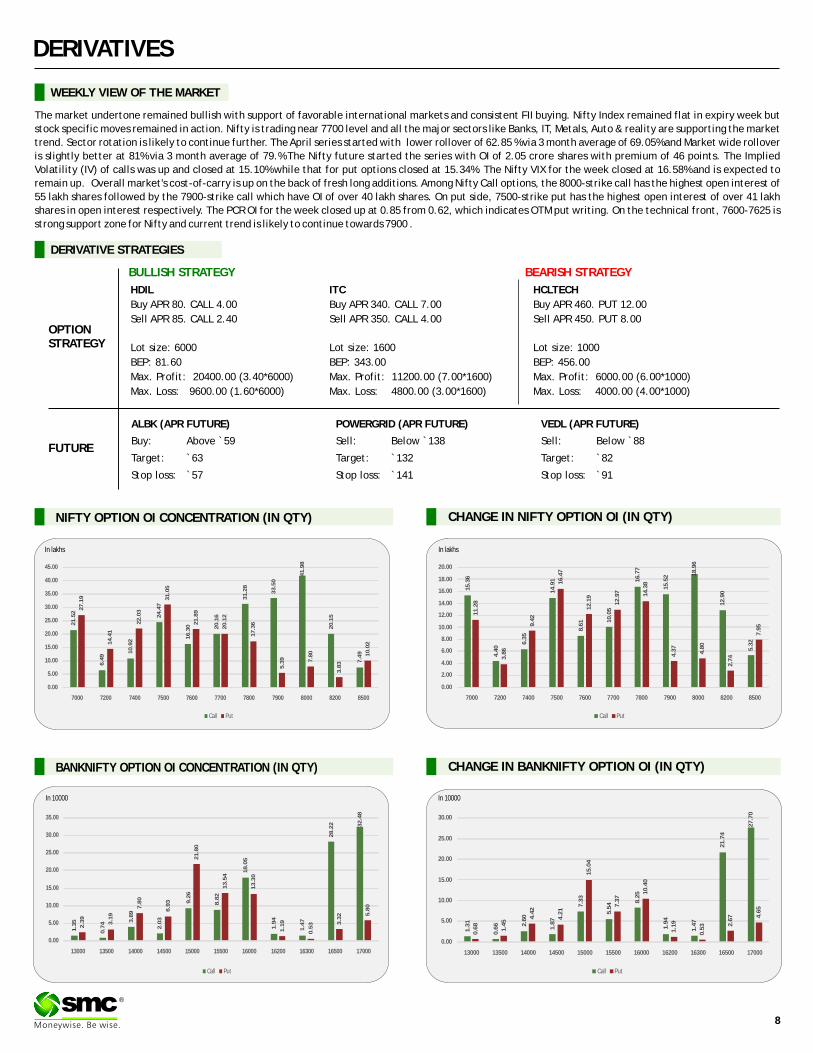
The market undertone remained bullish with support of favorable international markets and consistent FII buying. Nifty Index remained flat in expiry week but
stock specific moves remained in action. Nifty is trading near 7700 level and all the major sectors like Banks, IT, Metals, Auto & reality are supporting the market
trend. Sector rotation is likely to continue further. The April series started with lower rollover of 62.85 % via 3 month average of 69.05% and Market wide rollover
is slightly better at 81% via 3 month average of 79.% The Nifty future started the series with OI of 2.05 crore shares with premium of 46 points. The Implied
Volatility (IV) of calls was up and closed at 15.10% while that for put options closed at 15.34%. The Nifty VIX for the week closed at 16.58% and is expected to
remain up. Overall market's cost-of-carry is up on the back of fresh long additions. Among Nifty Call options, the 8000-strike call has the highest open interest of
55 lakh shares followed by the 7900-strike call which have OI of over 40 lakh shares. On put side, 7500-strike put has the highest open interest of over 41 lakh
shares in open interest respectively. The PCR OI for the week closed up at 0.85 from 0.62, which indicates OTM put writing. On the technical front, 7600-7625 is
strong support zone for Nifty and current trend is likely to continue towards 7900 .
In lakhs
In 10000 In 10000
Call Put
21
.52
6.4
9
10
.92
24
.47
16
.30 20
.16
31
.28
33
.50
41
.98
20
.15
7.4
9
27
.19
14
.41
22
.03
31
.05
21
.89
20
.12
17
.36
5.3
9 7.8
0
3.8
3
10
.02
0.00
5.00
10.00
15.00
20.00
25.00
30.00
35.00
40.00
45.00
7000 7200 7400 7500 7600 7700 7800 7900 8000 8200 8500
Call Put
15
.36
4.4
0
6.3
5
14
.91
8.6
1 10
.05
16
.77
15
.52 1
8.9
6
12
.90
5.3
2
11
.28
3.8
6
9.4
2
16
.47
12
.19
12
.97 14
.38
4.3
7
4.8
0
2.7
4
7.9
5
0.00
2.00
4.00
6.00
8.00
10.00
12.00
14.00
16.00
18.00
20.00
7000 7200 7400 7500 7600 7700 7800 7900 8000 8200 8500
Call Put
1.3
5
0.7
4 3.8
9
2.0
3
9.2
6
8.8
2
18
.05
1.9
4
1.4
7
28
.22 32
.48
2.3
9
3.1
9
7.8
0
6.9
3
21
.80
13
.54
13
.30
1.1
9
0.5
3 3.3
2 5.8
0
0.00
5.00
10.00
15.00
20.00
25.00
30.00
35.00
13000 13500 14000 14500 15000 15500 16000 16200 16300 16500 17000
Call Put
1.3
1
0.6
6 2.6
0
1.8
7
7.3
3
5.5
4 8.2
5
1.9
4
1.4
7
21
.74
27
.70
0.6
8
1.4
5
4.4
2
4.2
1
15
.04
7.3
7
10
.40
1.1
9
0.5
3 2.6
7 4.6
5
0.00
5.00
10.00
15.00
20.00
25.00
30.00
13000 13500 14000 14500 15000 15500 16000 16200 16300 16500 17000
8
In lakhs

9
DERIVATIVES
®
FII’s ACTIVITY IN DERIVATIVE SEGMENT
SENTIMENT INDICATOR (NIFTY)
31-Mar 30-Mar 29-Mar 28-Mar 23-Mar
Discount/Premium 46.00 48.15 69.40 72.00 64.05
PCR(OI) 0.85 0.85 0.85 0.87 0.95
PCR(VOL) 0.98 0.76 0.94 0.94 1.07
A/D RATIO(Nifty 50) 0.63 7.33 0.67 0.23 0.85
A/D RATIO(All FO Stock)* 1.54 8.75 1.00 0.16 0.82
Implied Volatality 15.10 15.31 16.09 15.76 14.39
VIX 16.58 16.81 17.64 17.49 17.49
HISTORY. VOL 28.47 28.53 27.78 24.07 24.62
*All Future Stock
SENTIMENT INDICATOR (BANKNIFTY)
31-Mar 30-Mar 29-Mar 28-Mar 23-Mar
Discount/Premium 76 70.15 84.3 86.35 69.6
PCR(OI) 0.76 0.68 0.73 0.72 0.99
PCR(VOL) 1.04 0.58 0.64 0.49 0.88
A/D RATIO(BANKNIFTY) 0.71 11.00 2.00 0.09 0.20
#A/D RATIO 2.00 20.00 1.63 0.11 0.31
Implied Volatality 22.78 22.78 22.07 22.13 20.79
HISTORY. VOL 29.65 30.59 28.38 29.24 29.01
FII’S ACTIVITY IN NIFTY FUTURE
**The highest call open interest acts as resistance and highest put open interest acts as support.# Price rise with rise in open interest suggests long buildup | Price fall with rise in open interest suggests short buildup # Price fall with fall in open interest suggests long unwinding | Price rise with fall in open interest suggests short covering
# All BANKING Future Stock
Top 10 short build up
In Cr. In Cr.
Top 10 long build up
LTP % Price Change* Open interest %OI Chng*
HINDZINC 182.4 7.14% 3958400 38.21%
MARICO 245 1.28% 7794800 27.03%
TATAGLOBAL 122.1 1.88% 21120000 26.26%
BIOCON 486.1 4.32% 2467300 25.59%
TCS 2526.25 1.81% 3952400 24.93%
KPIT 147.9 2.74% 1372000 20.77%
POWERGRID 140.1 1.63% 13908000 18.55%
UCOBANK 39 2.36% 8480000 15.53%
RELIANCE 1050.4 1.88% 18582000 15.25%
RPOWER 49.65 3.22% 45300000 14.74%
LTP % Price Change* Open interest %OI Chng*
CUMMINSIND 844.9 -4.16% 196800 40.17%
GRANULES 120.5 -1.43% 4365000 29.14%
FEDERALBNK 46.75 -6.12% 39784000 22.43%
CIPLA 515.1 -3.60% 11320800 20.95%
BEML 1035.9 -5.20% 553500 19.42%
RCOM 50.35 -3.36% 67120000 17.66%
HDFC 1113 -4.22% 10315600 15.29%
M&M 1217.4 -2.84% 4031600 13.39%
BEL 1187.3 -1.05% 1505250 11.80%
SAIL 43.35 -4.41% 33543000 11.32%
55
4
59
2
49
1
25
1
20
0
74
0
- 16
1
20
8 39
5
31
94
-500
0
500
1000
1500
2000
2500
3000
3500
16-Mar 17-Mar 18-Mar 21-Mar 22-Mar 23-Mar 28-Mar 29-Mar 30-Mar 31-Mar
- 15
72
16
66
53
9
- 48
1
- 18
83
- 16
20
- 24
40
- 15
69
- 90
5
12
45
-3000
-2500
-2000
-1500
-1000
- 500
0
500
1000
1500
2000
16-Mar 17-Mar 18-Mar 21-Mar 22-Mar 23-Mar 28-Mar 29-Mar 30-Mar 31-Mar
* Mar series v/s Apr series * Mar series v/s Apr series

10
®
Turmeric futures (Apr) is expected to take support near 7900 levels. As the two major turmeric markets in Nizamabad and Erode will reopen Monday, the prices of the yellow spice may get some support from the spot markets. The fundamentals are supportive and it is estimated that the turmeric output in 2015-16 (Jul-Jun) is estimated to fall 38% and 42%, in Hingoli and Sangli districts of Maharashtra, respectively, due to poor monsoon and drought-like situation. The high cost of cultivation and water stress in the growing regions has pushed farmers to shift to other crops like sugarcane, vegetables, and bananas. Cardamom futures (Apr) is expected to consolidate in the range of 660-730 levels & trade with a negative bias. Last week, the counter failed to surpass the resistance near 740 levels. In the current scenario, the North Indian buyers are staying away due to declining prices. Secondly, the supply side is heavier as the inventories in the domestic markets in the upcountry regions are more than enough. The upcountry exporters have also slowed down because of slack overseas demand and non-availability of exportable grade capsules because the current season harvesting has almost come to an end in all the major estates. The upside in Jeera futures (Apr) is witnessing a pause & in days to come, it will possibly face resistance near 15800-15900 levels. The rejection of consignment by the US due to presence of khapra beetle has dampened the prospects of higher exports. On the supply side, this season the production of jeera is forecast to touch around 3 lakh tonnes, almost same as the previous year. The acreage under the spice crop in Gujarat has risen by 10% this year.
SPICES
Soybean futures (Apr) is expected to consolidate in the range of 3920-4120 levels. Currently, only need based buying is getting featured in the spot markets to meet the domestic meal and oil demand. It is expected that there will be not much aggressive buying in days to come due to poor soy meal exports and cheaper edible imports leading to disparity on crushing the beans. Secondly, the business of soybean is getting affected in the domestic market as the supplies of wheat are rising in the state of Madhya Pradesh as well as Rajasthan & the traders are busy covering their stock. On CBOT, the most active soybeans futures contract (May) is likely to take support near $9.00 a bushel. The uptrend is likely to continue supported by increased demand for U.S. supplies amid a fall in the Brazilian real. Mustard futures (Apr) will possibly take an attempt to break the resistance near 4175 levels & trade higher towards 4300 levels. As cited by the Foreign Agricultural Service, Official USDA Estimates, there is anticipation that there might be a shortage of supplies in the days to come. The statistics highlight that the total supply of RM seed in the domestic market during 2015-16 is down by -6.54% as compared to 2014-15 & the closing stock of RM seed is less by -11.68% as compared to 2014-15. The uptrend in CPO futures (Apr) is likely to witness a pause & face resistance near 555 levels. The sentiments of palm oil on the Bursa Malaysia Derivatives Exchange may turn bearish due to stronger ringgit. The ringgit has gained & reached 3.9180 versus the dollar, its strongest level in seven months.
OIL AND OILSEEDS
OTHER COMMODITIES
The bullish phase is likely to prevail in sugar futures (May) & the sweetener can test 3700 levels owing to factors such as projected deficits in the domestic as well as in the global markets. Secondly, on the demand side, sugar mills have finalized contracts of 14 lakh tonnes for exports against MIEQ, of which about 11.5 lakh tonnes have already been moved from mills to ports. On the international market, raw sugar (futures) has rose to a 17-month high buoyed by projected global deficits in both the current and next season. Chana futures (May) will possibly rise towards 4750 levels in days to come. The supporting factor is that the FCI will start procuring Chana and Lentil from this week directly from farmers, at mandi rates. Secondly, the recent rains in past weeks have affected chana crop in few regions of Madhya Pradesh, as a result, the harvesting has been delayed and arrivals in the mandis are lower. Kapas futures (Apr) is expected to take support near 740 levels & the downside may remain capped. It is reported that the deadlock between Cotton Corp of India and farmers over procurement of V797 variety of cotton being harvested in Gujarat is over & now, it has been agreed that Gujarat State Cooperative Cotton Federation would convert cotton bolls into bales on behalf of farmers to suit the procurement parameters. The procurement by Cotton Corp is now expected to start in the first week of April. Wheat futures (May) is likely to face resistance near 1610 levels. The spot prices of wheat are under pressure due to increasing pace of harvesting in Madhya Pradesh, Rajasthan and Gujarat.
Bullion counter can move on a volatile path on mixed fundamentals. Movement of greenback will also give direction to the bullion counter as it can move in the range of 94-97 in the near term. Gold can trade in the range of 27800-29500 while silver can move in the range of 35000-39000 in near term. Gold posted its biggest quarterly gain in nearly 30 years amid reduced expectations for U.S. interest rate hikes. The metal is highly exposed to rising rates, which lift the opportunity cost of holding non-yielding assets, while boosting the dollar. Gold fell 10 percent last year ahead of the first U.S. rate increase in nearly a decade in December 2015. Gold's 16.2 percent climb in the first three months of this year, its biggest quarterly rise since 1986, was driven by concerns over global growth, which battered equities and sparked a wave of safe-haven buying. A combination of safe-haven demand on the back of worries about China in particular, a scaling back of expectations of further rate hikes from the Fed, and rising inflation expectations have been behind the rally in the gold price. According to WGC “Heightened geopolitical tension and a push for diversification in reserve assets led to central banks' net purchases of gold reaching 483 tonnes in 2015, the second highest annual total since the end of the gold standard”. India's gold demand in the March quarter is set to drop by about two-thirds from a year ago to its lowest in seven years, as higher prices and a strike by jeweller's curbed sales in the world's second-biggest consumer.
BULLIONS
Crude oil may trade on a volatile path as expectation of production freeze by Russia and Venezuela in this month can support the prices while profit booking at higher levels can cap the upside. Oil futures recently got under pressure as strengthening dollar weighed on sentiment, although another fall in U.S. oil output in January helped to limit the losses. According to U.S. Energy Information Administration “U.S oil output fell by 56,000 barrels per day (bpd) to 9.179 million bpd in January, the fourth consecutive month oil production had fallen and the lowest level since October 2014”. Imports of Iranian crude by Asia's four biggest buyers jumped by 24.6 percent to 1.27 million barrels per day (bpd) from a year earlier to hit a two-year high in February. Crude oil can move in the range of 2450-2750 in MCX. According to IEA, non-OPEC oil production would fall by 750,000 barrels per day (bpd) in 2016, compared with its previous estimate of 600,000 bpd. China demand can give support to the crude prices as China is set to import 7.5 million bpd this year, overtaking the U.S. as the world's biggest crude importer. Natural gas prices may move on a volatile path in the range of 120-136 in MCX. U.S. natural gas may remain under pressure as weather models kept pointing to higher-than-normal temperatures dampening late-winter heating demand. Natural gas storage in the U.S. fell by 117 billion cubic feet in penultimate week, according to the U.S. Energy Information Administration.
ENERGY COMPLEX
Base metals counter may trade on a volatile path on mixed fundamentals. Copper may move in the range of 310-340. Better PMI data from US and China may give some support to the prices. Recently, declining demand from China has kept the prices under pressure. Copper prices, which fell to a six-year low in January, have risen 12 per cent this quarter, and briefly traded above $5,000 a tonne helped by a weaker US dollar and optimism over China's property market. Meanwhile, US Chicago purchasing managers index came at 53.6 in March, above the consensus of 50 while China's official manufacturing Purchasing Managers' Index (PMI) came in at 50.2 for March compares with 49.0 in February. Freeport has produced about 32,000 tonnes of copper in January. Chinese manufacturing activity is a lead indicator of demand for industrial metals. The country accounts for nearly half of global copper consumption estimated at around 22 million tonnes this year. Lead can hover in the range of 111-122 while zinc can move in the range of 117-126. The latest statistics published by the International Lead and Zinc Study Group (ILZSG) indicates that global refined zinc market was in surplus of 123,000 tons during the entire year 2015. Nickel may move in the range of 545-620 in MCX. Kosovo ferro-nickel producer Ferronikeli has halted production from April 1 for at least 90 days because of low nickel prices and equipment problems. Aluminum can move in the range of 97-104 in MCX. Stocks of aluminium in LME approved warehouses have fallen nearly 15 percent since September last year to around 2.8 million tonnes and cancelled warrants have risen to above 30 percent from below 20 percent on March 15.
BASE METALS

11
TECHNICAL RECOMMENDATIONS
COMMODITY
SILVER MCX (MAY) contract closed at `26751 on 31st Mar'16. The contract made its high of 40574 on
18th May'15 and a low of `33030 on 17th Dec'15. The 18-day Exponential Moving Average of the
commodity is currently at ̀ 36964.
On the daily chart, the commodity has Relative Strength Index (14-day) value of 54. One can buy in the
range of ̀ 36700-36500 with the stop loss of ̀ 36300 for a target of ̀ 38000.
`
COPPER MCX (APRIL) contract closed at 321.25 on 31st Mar'16. The contract made its high of 377.65
on 10th Sep'15 and a low of `296.8 on 13th Jan'16. The 18-day Exponential Moving Average of the
commodity is currently at ̀ 329.55.
On the daily chart, the commodity has Relative Strength Index (14-day) value of 57.95. One can buy in
the range of ̀ 321-318 with the stop loss of ̀ 318 for a target of ̀ 330.
` `
BARLEY NCDEX (MAY) contract closed at 1529 on 31st Mar'16. The contract made its high of 1555 on
29th Mar'16 and a low of `1384 on 22nd Feb'16. The 18-day Exponential Moving Average of the
commodity is currently at ̀ 1466.4.
On the daily chart, the commodity has Relative Strength Index (14-day) value of 58.65. One can buy in
the range of ̀ 1550-1530 with the stop loss of ̀ 1510 for a target of ̀ 1600.
` `
®
SILVER MCX (MAY)
COPPER MCX (APRIL)
BARLEY NCDEX (MAY)
NOTES : 1) These levels should not be confused with the daily trend sheet, which is sent every morning by e-mail in the name of Daily report- commodities (Morning Mantra).
2) Sometimes you will find the stop loss to be too far but if we change the stop loss once, we will find more strength coming into the commodity. At the moment, the stop loss will be far as we are seeing the graphs on weekly basis and taking a long-term view and not a short-term view.
EXCHANGE COMMODITY CONTRACT CLOSING DATE TREND TREND RATE TREND SUPPORT RESISTANCE CLOSING
PRICE CHANGED CHANGED STOP/LOSS
NCDEX SOYABEAN APR 4010.00 22.03.16 UP 3964.00 3800.00 - 3700.00
NCDEX JEERA APR 15565.00 10.03.16 UP 15125.00 14700.00 - 14500.00
NCDEX CHANA APR 4522.00 31.03.16 UP 4522.00 4300.00 - 4200.00
NCDEX RM SEEDS APR 4157.00 31.03.16 SIDEWAYS
MCX MENTHA OIL APR 840.60 22.03.16 Down 834.80 - 875.00 900.00
MCX CARDAMOM APR 707.00 22.03.16 UP 738.80 700.00 - 680.00
MCX SILVER MAY 36751.00 11.02.16 Up 38288.00 36400.00 - 36000.00
MCX GOLD JUNE 28751.00 04.02.16 UP 27422.00 28600.00 - 28500.00
MCX COPPER APR 321.25 04.06.15 Down 381.35 - 330.00 335.00
MCX LEAD APR 114.25 25.02.16 SIDEWAYS
MCX ZINC APR 120.25 03.03.16 UP 123.85 118.00 - 116.00
MCX NICKEL APR 567.50 21.05.15 Down 827.90 - 610.00 620.00
MCX ALUMINUM APR 100.95 25.02.16 UP 108.25 100.80 - 100.50
MCX CRUDE OIL APR 2572.00 10.03.16 UP 2680.00 2560.00 - 2550.00
MCX NATURAL GAS APR 129.90 17.03.16 Up 133.40 120.00 - 115.00
TREND SHEET
*Closing as on 31.03.16

COMMODITY
NEWS DIGEST
The week gone by was an average week for commodities, but if we talk about quarterly basis,
it was a very strong quarter for commodities in which many commodities viz; gold, crude,
sugar, CPO etc saw much needed gains. Both gold and silver edged up in the international
market. In the Indian market, gold closed up whereas silver closed sideways. Gold edged up as
the US dollar and stock markets retreated, locking in the metal's biggest quarterly gain in
nearly 30 years amid reduced expectations for US interest rate rises. Downfall in base metals
kept the upside limited in silver. In base metal complex, all fell like nine pins. Copper dipped
on persistent concerns over global economic growth and weak demand from top consumer
China, however, the fall was cushioned by a softer US dollar. Copper found limited support
from declining physical stocks in LME warehouses. Copper in the warehouses stood at 145,275
tonnes, down about 38% so far in 2016, though much of the inventory has just moved to
warehouses monitored by the Shanghai Futures Exchange. As regard to energy complex, both
Brent and WTI saw profit booking at higher levels. It saw further fall after another report of
record US stockpiles. Meanwhile, S&P downgraded China. Increasing week on week export
figures supported guar counter. India export 4932.4 tons of guar gum powder in the third week
of March, which is 10.5% higher as compared to prior week. Sugar gave massive return in recent
trades on deficit news. Platts Kingsman raised its global sugar supply deficit to 7.62 MT in 2015-
16 amidst lower production figure received from India, Thailand and Northeast Brazil. Indian
sugar export rose by 16% as the country exported 86 thousand tonnes of sugar in the week
(ending 20th March, 2016) compared to 73.9 thousand tonnes of exports made in the previous
week. Chana prices advanced in futures trade as participants enlarged positions amid strong
domestic demand and restricted supplies from producing regions. Expectations of lower
output following unseasonal rains in some growing regions also supported the upside. CPO and
Soyabean rose following fresh buying by vanaspati millers coupled with restricted supplies
from producing regions. Turmeric prices were down in futures trades as speculators trimmed
their positions due to pick up in arrivals in the spot market.
WEEKLY COMMENTARY
COMMODITY UNIT 31.03.16 DIFFERENCEQTY. QTY.
29MM COTTON NEW BALES 30700.00 30700.00 0.00
CASTOR SEED MT 42959.00 28802.00 -14157.00
COTTON SEED OILCAKE MT 37901.00 40485.00 2584.00
GUARGUM MT 29338.00 31297.00 1959.00
GUARSEED MT 30547.00 30593.00 46.00
JEERA MT 431.00 1360.00 929.00
MAIZE MT 14353.00 3155.00 -11198.00
SOYABEAN MT 41011.00 35834.00 -5177.00
SUGAR MT 86449.00 90824.00 4375.00
TURMERIC MT 707.00 1645.00 938.00
WHEAT MT 150.00 249.00 99.00
22.03.16 COMMODITY UNIT 31.03.16 DIFFERENCE
QTY. QTY.
CARDAMOM MT 36.50 33.70 -2.80
COTTON BALES 73300.00 75200.00 1900.00
GOLD KGS 51.00 161.00 110.00
GOLD MINI KGS 98.70 561.00 462.30
GOLD GUINEA KGS 10.26 10.23 -0.03
MENTHA OIL KGS 3282597.68 3156250.43 -126347.25
SILVER (30 KG Bar) KGS 11501.01 9001.40 -2499.61
22.03.16
•Russia was the top buyer of gold for the fourth
consecutive year, raising its ownership by 206
tonnes in 2015.
•S&P cut its outlook for China's sovereign credit
rating to negative from stable, but maintained the
rating at AA-.
•Glencore will invest over $1.1 billion in Zambia to
sink three copper mine shafts with new technology
that will extend mine life by over 25 years.
•Total global commodity assets under management
(AUM) rose to a six-month high of $186 billion in
February from $171 billion in January this year.
•The all India sugar production upto 31st March 2016
is 237 lac tons. This is about 11 lac tons less than
last year.
•Government has extended the 25% import duty on
wheat by another three month, till June, to curb
imports.
•India exported 4932.40 tonnes of guar gum powder
in the third week of March which is 10.5% higher
compared to prior week.
•During the 2016, hot Weather Season (April to
June), warmer than normal temperatures are
expected in all meteorological sub-divisions of the
country. - India Meteorological Department
WEEKLY STOCK POSITIONS IN WAREHOUSE (MCX)
12
®
WEEKLY STOCK POSITIONS IN WAREHOUSE (NCDEX)
NCDEX TOP GAINERS & LOSERS (% Change)
5.89
4.24 4.03 3.82
3.15
-7.80 -7.70
-5.19
-3.00-2.70
-10.00
-8.00
-6.00
-4.00
-2.00
0.00
2.00
4.00
6.00
8.00
BARLEY SUGAR MCRUDE PALM
OILNEW STEEL
LONG CHANA TURMERICCRUDE
OIL COPPERCHILLI TEJA
GUAR GUM
MCX TOP GAINERS & LOSERS (% Change)
3.20
1.64
0.56 0.51
-4.98-4.76 - 4.71
-3.64
- 3.11
-6.00
-5.00
-4.00
-3.00
-2.00
-1.00
0.00
1.00
2.00
3.00
4.00
CPONATURAL
GASMENTHA
OIL ALUMINIUM NICKEL LEADCRUDE
OILCOPPER
MINI ZINC

COOIT's Trade Estimate for Rabi Oilseed Production during 2015-16 Season
The Central Organization for Oil Industry & Trade (COOIT) hosted the 37th All India
Rabi Seminar of Oilseeds on 20th March, 2016 at Delhi and announced the trade
estimate of rabi Oilseeds crop and availability of vegetable oils from Rabi and kharif
crop during 2015-16 season. The salient features of the trade estimate are as under:
• As per report, the area under Rabi Oilseeds crop 2015-16 decreased to 83.47
lakh hectares from 84.97 lakh hectares last year i.e. down by 1.50 lakh
hectares.
• The combined area of Kharif and Rabi oilseeds during 2015-16 as per GOI and
Trade, is about 268.59 lakh hectres and production of 9 oilseed crops ( Kharif
& Rabi) for the current year (2015-16) is estimated at 203.41 lakh tones
compared to 211.09 lakh tones of last year, down by 7.68 lakh tones (3.64%).
The total production including Cottonseed and Copra estimated at 318.16
lakh tones compared to 336.79 lakh tones in 2014-15.
• The overall Rabi Oilseeds Crop 2015-16 has increased to 77.41 lakh tones from
69.94 lakh tones last year, up by 7.47 lakh tones, thanks to higher rapeseed
crop.
• Overall oilseeds yield has increased to 927 kgs/ha during current Rabi crop
from 823 kgs/ha. last year.
• Rabi Groundnut crop has decreased to 12.40 lakh tones from 12.85 lakh tones
of last year, down by 0.45 lakh tones.
• Rapeseed-Mustard including Taramira crop increased to 58.00 lakh tones from
50.00 lakh tones of last year, up by 8.00 lakh tones.
• Rabi Sunflowerseed crop decreased to 2.40 lakh tones from 2.53 lakh tones of
last year, down by 0.13 lakh tones.
• Rabi Sesameseed crop decreased to 2.25 lakh tones from 3.03 lakh tones of
last year, down by 0.78 lakh tones.
• The total vegetable oil availability from Kharif and Rabi Oilseeds crops for the
year 2015-15 (Nov-Oct) is more or less same of last year and is estimated at
72.02 lakh tones compared to 71.95 lakh tones last year.
• In view of lesser crop coupled and higher demand for edible oils, import of
edible oil during 2015-16 (Nov-Oct) likely to increase and estimated at 158.0
lakh tones. Import of non-edible oil is likely to be 2.0 lakh tones. Total import
of vegetable oils (Edible + non-edible) is estimated at 160.0 lakh tones during
2015-16 (Nov-Oct) against 146.1 lakh tones in 2014-15.
*Area as per GOI data as on 27th January, 2016
COMMODITY
COMMODITY EXCHANGE CONTRACT 31.03.16 CHANGE%
ALUMINIUM LME 3 MONTHS 1479.50 1520.00 2.74
COPPER LME 3 MONTHS 4949.50 4847.00 -2.07
LEAD LME 3 MONTHS 1780.00 1705.00 -4.21
NICKEL LME 3 MONTHS 8695.00 8490.00 -2.36
ZINC LME 3 MONTHS 1836.00 1817.00 -1.03
GOLD COMEX JULY 1224.60 1235.60 0.90
SILVER COMEX MAY 15.26 15.46 1.32
LIGHT CRUDE OIL NYMEX APR 39.79 38.34 -3.64
NATURAL GAS NYMEX APR 1.79 1.96 9.20
23.03.16
PRICES OF METALS IN LME/ COMEX/ NYMEX (in US $)
WEEKLY STOCK POSITIONS IN LME (IN TONNES)
COMMODITY STOCK POSITION STOCK POSITION DIFFERENCE
22.03.16 31.03.16
ALUMINIUM 2846500 2798875 -47625
COPPER 155275 145450 -9825
NICKEL 432324 432672 348
LEAD 163200 156075 -7125
ZINC 443400 435800 -7600
INTERNATIONAL COMMODITY PRICES
COMMODITY EXCHANGE CONTRACT UNIT 23.03.16 31.03.16 CHANGE(%)
Soya CBOT MAY Cent per Bushel 905.25 910.75 0.61
Maize CBOT MAY Cent per Bushel 368.50 351.50 -4.61
CPO BMD MAY MYR per MT 2700.00 2725.00 0.93
Sugar LIFFE MAY 10 cents per MT 466.60 444.70 -4.69
13
®
SPOT PRICES (% change)
-4.63
-3.62
-2.55
-0.72
-0.66
0.00
0.00
0.24
0.98
1.44
2.06
2.40
2.64
3.47
3.57
4.55
4.71
5.00
8.11
11.73
-6.00 -4.00 -2.00 0.00 2.00 4.00 6.00 8.00 10.00 12.00 14.00
CHILLI (GUNTUR)
WHEAT (DELHI)
TURMERIC (NIZAMABAD)
RAW JUTE (KOLKATA)
GUAR GUM (JODHPUR)
REFINED SOYA OIL (INDORE)
SILVER 5 KG (DELHI)
JEERA (UNJHA)
PEPPER MALABAR GAR (KOCHI)
GUAR SEED (JODHPUR)
COTTON (KADI)
BARLEY (JAIPUR)
CORIANDER (KOTA)
SOYABEAN (INDORE)
CRUDE PALM OIL (KANDLA)
MUSTARD (JAIPUR)
CHANA (DELHI )
COTTON SEED OIL CAKE (AKOLA)
SUGAR (KOLKATA)
GUR (MUZAFFARNGR.)
Oilseeds 2015-16 Rabi season Change as compared to
2014-15 Rabi seasonArea
Area Crop Yield Area Crop
Lakh Lakh Lakh Lakh
Ha. * Tons Ha. Tons
Groundnut 8.55 12.40 1450 (-) 0.26 (-) 0.45
R M Seed 64.51 58.00 899 (-) 0.66 (+) 8.00
Sunflower 2.95 2.40 814 (+) 0.11 (-) 0.13
Sesame seed 2.50 2.25 900 (-) 0.99 (-) 0.78
Safflower 1.10 0.26 236 (+) 0.14 (-) 0.24
Linseed 2.93 2.10 717 (-) 0.26 (+) 1.07
Other Oilseeds 0.93 -- -- (+) 0.42 --
Total 83.47 77.41 927 (-) 1.50 (+) 7.47

CURRENCY
Currency Table
Currency Pair Open High Low Close
USD/INR 66.80 66.90 66.42 66.49
EUR/INR 74.68 76.41 74.30 75.72
GBP/INR 94.54 96.25 94.30 95.88
JPY/INR 58.84 59.51 58.53 59.21
(Source: Reliable Software, Open: Monday 9.00 AM IST, Close: Thursday (5.00 PM IST)
News Flows of last week
30th Mar U.S. private sector added 200,000 jobs in March: ADP
30th Mar German inflation turned positive in March
31st Mar Britain's current account deficit had surged to a record high
31st Mar The number of Americans filing for unemployment benefits unexpectedly rose last week,
31st Mar U.S. repo rates jumped to highest level since 2008 at quarter-end
31st Mar Japan business mood soured to three-year low, added to doubt over 'Abenomics'
31st Mar Rupee hit three-month high againt dollar
EUR/INR (APR) contract closed at 75.72 on 31st March'16. The contract made its high of 76.41 on 30th March'16 and a low of 74.30 on 28th March '16 (Weekly Basis). The 14-day Exponential Moving Average of the EUR/INR is currently at ̀ 74.96.
On the daily chart, EUR/INR has Relative Strength Index (14-day) value of 57.92. One can buy above 76.00 for a target of 77.00 with the stop loss of 75.50.
JPY/NR (APR) contract closed at 59.21 on 31st March '16. The contract made its high of 59.51 on 30th March'16 and a low of 58.53 on 29th March'16 (Weekly Basis). The 14-day Exponential Moving Average of the JPY/INR is currently at 59.34.
On the daily chart, JPY/INR has Relative Strength Index (14-day) value of 48.62. One can buy above 59.75 for a target of 60.75 with the stop loss of 59.25.
Market Stance
The rupee continued to rule firm on local bourses and tested a fresh 3-month
high as against the greenback in the week gone by, on the back of persistent
selling of US dollars by banks and exporters in view of sustained foreign capital
inflows. Weakness of dollar in the overseas market also boosted rupee value
against the dollar as dovish comments from Federal Reserve Chair Janet Yellen
continued to resonate, dampening demand for the currency. Fed Chair Janet
Yellen on Tuesday stressed the need to be cautious in raising interest rates,
highlighting external risks such as low oil prices and slower growth abroad. The
comments poured cold water on expectations that the U.S central bank could
increase borrowing costs twice this year. As a result, the dollar was on the course
for its worst quarter in five years as against a basket of major currencies.
EUR/INR
USD/INR (APR) contract closed at 66.49 on 31st March'16. The contract made its high of 66.90 on 28th March'16 and a low of 66.42 on 31st March'16 (Weekly Basis). The 14-day Exponential Moving Average of the USD/INR is currently at ̀ 66.90.
On the daily chart, the USD/INR has Relative Strength Index (14-day) value of 32.70. One can buy above 66.80 for the target of 67.70 with the stop loss of 66.30.
GBP/INR (APR) contract closed at 95.88 on 31st March'16. The contract made its high of 96.25 on 30th March'16 and a low of 94.30 on 28th March '16 (Weekly Basis). The 14-day Exponential Moving Average of the GBP/INR is currently at 95.55.
On the daily chart, GBP/INR has Relative Strength Index (14-day) value of 49.41. One can buy above 96.50 for a target of 97.50 with the stop loss of 96.00.
USD/INRTechnical Recommendation
Economic gauge for the next week
Date Currency Event Previous
04thApr EUR Producer Price Index (MoM) -1
04thApr EUR Producer Price Index (YoY) -2.9
04thApr USD Factory Orders (MoM) 1.6
05thApr EUR Markit Services PMI 54
05thApr USD Markit Services PMI 51
06thApr EUR Non-monetary policy's ECB meeting
06thApr USD FOMC Minutes
07thApr EUR ECB Monetary Policy Meeting Accounts
07thApr USD Continuing Jobless Claims 2.173
07thApr USD Initial Jobless Claims 276
08thApr GBP Manufacturing Production (YoY) -0.1
08thApr GBP Industrial Production (MoM) 0.3
GBP/INR JPY/INR
14
®

IPOIPO
Issue Composition
Total Issue for Sale 197,880,429QIB 98,940,215 NIB 29,682,064 Retail 69,258,150
In shares
Book Running Lead Manager
Axis Bank Limited
Edelweiss Capital Limited
HSBC Securities and Capital Markets Pvt. Ltd
ICICI Securities Limited
Name of the registrar
Karvy Computershare Private Limited
Issue Highlights
Industry Microfinance
Total Issue (Shares) - Offer for sale 132,425,884
Total Issue (Shares) - Fresh Issue 65,454,545
Net Offer to the Public 197,880,429
Issue Size (`Cr.) 2157-2177
Price Band (`) 109-110
Offer Date 5-Apr-16
Close Date 7-Apr-16
Face Value Rs.10
Lot Size 135 Per Equity Share
Outlook
The expertise of the company in lending to unbanked segments is a key strength and this may drive future growth. Moreover, with its experience in vehicle finance and MSE loans, it is expected that the business of the company would also grow in its upcoming Small Finance Bank (SFB), for which it has got a license from RBI. Investors with a longer term horizon can opt the issue.
EQUITAS HOLDINGS LIMITED
Shareholding Pattern (%)
Particulars Pre-issue Post issue
Promoters & promoters group 0.00% 0.00%
QIB 92.64% 64.63%
NIB 2.68% 11.00%
Retail 4.68% 24.37%
Total 100.00% 100.00%
Objects of the Issue
The Issue comprises of a Fresh Issue and an Offer for Sale.
1. Offer for Sale: Each of the Selling Shareholders will be entitled to their respective portion of the proceeds of the Offer for Sale. Company will not receive any proceeds from the Offer for Sale.
2. Fresh Issue: Company proposes to utilise the Net Proceeds from the Fresh Issue towards funding of the following objects:
Investment in its Subsidiaries to augment their capital base to meet their future capital requirements arising out of growth in the business; and General Corporate Purposes.
Business Overview
Incorporated in June 2007, Equitas Holdings Ltd is Chennai based financial services provider focused on individuals and micro and small enterprises (MSEs). It is one of the 10 companies that have been selected by the RBI to set up small finance banks, niche lenders aimed at helping small businesses and farmers get easier access to funding. The company operates in 11 states, one union territory and the NCT of Delhi.
Strengths
Robust corporate governance standards and transparent operations leading to institutional confidence and customer goodwill: The Company believes that its robust corporate governance standards and commitment to transparent operations have enabled it to strengthen its relationship with its target customer segments, leverage its reputation and goodwill to expand its operations and product portfolio and attract and retain committed employees.
Comprehensive understanding and successful track record with underserved customer segment offering significant growth opportunities: The company believes that its understanding of, and strategic focus on, individuals and MSE customer segments that are underserved by formal financing channels provides significant growth opportunities as it continues to expand its financing product portfolio to cater to the various financing requirements of these customer segments.
Standardized operating procedures and efficient use of technology resulting in effective risk management and improved efficiencies: The Company has implemented standardized operating procedures that have enabled it to develop a scalable and replicable business model across its various financing product portfolios. The company also believes that its effective risk management measures as well as improving operational efficiencies and strong financial performance have also enabled it to improve on credit ratings, which has allowed it to access capital from banks and financial institutions at competitive rates.
Diversified product offering and markets with significant cross-selling opportunities: The company offers a range of financial products and services including microfinance, used commercial vehicle finance, MSE finance and housing finance, that provide the company with significant cross selling and up-selling opportunities to its target customer segments.
Commitment to social initiatives: Equitas Development Initiatives Trust's social initiatives have enabled the company to engage closely with the underserved communities. In addition, the Equitas Dhanyakosha India, one of its Group Companies, has established a chain of grocery stores that provide certain food staples.
Strategy
Leverage its existing network and customer base to develop our proposed SFB operations: The Company had applied for an SFB license and on October 7, 2015, it has received an in-principle approval for the establishment of an SFB, subject to the terms and condition of such approval. The company intends to leverage its large branch network and large customer base across India to develop its proposed SFB operations.
Further expand its operational network and strengthen marketing and sourcing partnerships: The Company continues to strategically expand its operations in target markets by establishing additional branches across India particularly for its microfinance and vehicle finance businesses, with other financing products .The company intends to further increase its penetration in the western and northern states of India as well as commence operations in eastern states of India.
Leverage its large customer base, operational network and industry experience to offer additional products and services: The Company intends to further diversify its product portfolio by growing our MSE finance, vehicle finance and housing finance businesses that it has introduced in recent years. The company continues to leverage its large customer base, branch network across India and experienced employee-base to offer additional financing products to existing customers and expand its customer base.
Continue to reduce operating costs and improve operational efficiencies: The Company continues to identify and implement measures that it believes, will enable it to sustain and further decrease its operating expenses. It continues to invest in its technology platform and technology-enabled operating procedures to increase operational and management efficiencies and ensure strong customer credit quality.
Risks
�Company may not able to set up an SFB within the timelines prescribed by RBI
�No assurance that the company would be able to implement the SFB model successfully in India
�The banking sector in India is highly regulated
�The company is subject to capital adequacy norms and requires to maintain CAR at a minimum level
Valuation
Considering the P/E valuation on the upper end of the price band of ̀ 110, the stock is priced at pre issue P/E of 18.50x on its FY16 EPS of ̀ 5.95. Post issue, the stock is priced at a P/E of 22.99x on its EPS of ̀ 4.79. Looking at the P/B ratio at `110 the stock is priced at P/B ratio of 2.29x on the pre issue book value of `47.96 and on the post issue book value of ̀ 61.26 the P/B comes out to 1.80x.
On the lower end of the price band of ̀ 109 the stock is priced at pre issue P/E of 18.33x on its FY16 EPS of `5.95.Post issue, the stock is priced at a P/E of 22.78x on its EPS of ̀ 4.79. Looking at the P/B ratio at ̀ 109, the stock is priced at P/B ratio of 2.27x on the pre issue book value of ̀ 47.96 and on the post issue book value of ̀ 61.26 , the P/B comes out to 1.78x.
SMC Ranking
(3/5)
15
®

®
16
FIXED DEPOSIT MONITOR
• Interest structure may be revised by company from time to time. Pls confirm Interest rates before submitting the application.
* For Application Greater Than Rs. Fifty Lakhs Or equal to Fifty Lakhs, Please Contact to Head Office.
* Email us at [email protected]
FIXED DEPOSIT COMPANIES
PERIOD MIN.ADDITIONAL RATE OF INTEREST (%)
S.NO (NBFC COMPANY -NAME)12M 18M 24M 36M 45M 48M 60M 84M INVESTMENT
1 ANSAL HOUSING & CONSTRUCTION LTD. 11.75 - 12.00 12.25 - - - - - CUM-20000/-,
NON CUM-40000/-
2 BAJAJ FINANCE LTD.(UPTO RS. 5 CR.) 8.75 8.85 8.90 8.90 - 8.90 8.90 - 0.25% FOR SR. CITIZEN, 0.10% FOR DELHI NCR &
EXISTING CUSTOMER UPTO RS. 1CRORE MUMBAI-75000,
OTHER-50000/-
3 DEWAN HOUSING FINANCE CORPORATION LTD 13M=9.00% 14M=9.00% 18M=9.10% 40M=9.10% 0.25% EXTRA FOR SR. CITIZEN, WIDOW, 13M=50000;
ARMED, PERSONNEL, EXISTING DHFL HOME 14M=10000;
BORROWERS, 0.25% EXTRA FOR DEPOSIT 40M=2000
50 LAC AND ABOVE
4 DEWAN HOUSING FINANCE CORPORATION LTD (AASHRAY) 8.75 - 9.00 9.00 - 9.00 - 9.00 10,000/-
5 GRUH FINANCE LTD. 7.50 13M=7.50 7.75 8.00 - 8.00 8.00 8.00 96-120M=8.00%; 0.25% FOR FEMALE, SR. CITIZEN & TRUST 1000/-
6 HDFC PREMIUM DEPOSIT FOR INDIVIUAL & TRUST (UPTO RS. 2 CR.) 15M=8.35 22M=8.40 30M=8.35 44M=8.40 - 0.25% FOR SR. CITIZEN UPTO 20000/-, 40000/-
RS. 1 CR. IN MONTHLY
7 HDFC LTD FOR INDIVIDUAL & TRUST (UPTO RS.5 CR.) 8.25 - 8.25 8.25 - 8.25 8.25 - 0.25% FOR SR. CITIZEN UPTO RS. 1 CR.
8 HDFC LTD FOR INDIVIDUAL & TRUST (UPTO RS.5 CR.) 8.15 - 8.15 8.15 - 8.15 8.15 - 0.25% FOR SR. CITIZEN UPTO RS. 1 CR.
9 HUDCO LTD.(IND & HUF) 7.70 - 7.70 7.70 - 7.70 7.55 7.55 0.25% FOR SR. CITIZEN 10000/-
10 HUDCO LTD.(TRUST/CO/INSTITUTION) 7.50 - 7.50 7.50 - 7.50 7.50 7.50 - 10000/-
11 J K TYRE & INDUSTRIES LTD. 9.00 - 9.25 9.50 - - - - 0.50% ADD. INTEREST TO SR. CITIZEN, 25000/-
EMPLOYEES, SHAREHOLDERS AND PERSON
INVESTING RS. 5 LACS AND ABOVE - MAX. 0.50%
12 J K LAKSHMI CEMENT LTD. 9.00 - 9.25 9.50 - - - - - 25000/-
13 LIC HOUSING FINANCE LTD.(UPTO RS. 5 CR.) 8.25 8.25 8.35 8.40 - - 8.50 - 0.25% FOR SR. CITIZEN IF APP ABOVE 10000/-
RS. 50,000/- & 0.10% IF APP UPTO RS. 50,000/-
14 M&M FINANCIAL SERVICES LTD (FOR BELOW RS. 1 CRORE)8.45 8.45 8.45 8.45 - 8.45 8.45 - 0.25% FOR SR. CITIZEN 10000/-
15 OMAXE LTD. 11.50 - 12.00 12.50 - - - - EXISTING CLIENT-0.15% EXTRA FOR 1 YR 50000/-
& 0.25% EXTRA FOR 2 YR
16 PRISM CEMENT LTD. 9.75 - 9.75 - - - - - - 10000/-
17 PNB HOUSING FINANCE LTD.(UPTO RS. 5 CR.) 8.00 - 8.00 8.25 - 8.25 8.25 8.25 0.25% EXTRA FOR SR. CITIZEN UPTO RS.1 CRORE 20000/-
18 PNB HOUSING FINANCE LTD.(UPTO RS. 5 CR.) 15M=8.05 22M=8.05 30M=8.35 44M=8.40 - 0.25% FOR SR. CITIZEN
19 SHRIRAM TRANSPORT FINANCE-UNNATI SCHEME 8.75 - 8.75 9.00 - 9.00 9.00 - 0.25% FOR SR. CITIZEN 5000/-
20 SHRIRAM CITY UNION SCHEME 8.75 - 8.75 9.00 - 9.00 9.00 - 0.25% FOR SR. CITIZEN 5000/-
(For trust only) (For Women Only)

Future Generali Assured Money Back Plan, which ensures that your financial security is guaranteed. The plan offers great flexibility by allowing you to opt between 4 policy terms so that you can choose the one which best suits your financial needs based on your current age. So whether it is a planned expenditure to fulfill a milestone, an additional income, retirement planning or even an investable surplus for your business that you are looking for, go ahead and be assured of receiving your money back.
FUTURE GENERALI ASSURED MONEY BACK PLAN
KEY USPs OF THE PLAN ARE AS FOLLOWS
Choice of limited Pay - Choose your own Premium
Payment Term i.e. 5, 7, 10 or 12 years
Guaranteed Money Back - Receive 10% of the Sum
Assured every year for 9 years after your Premium
Payment Term
Guaranteed Maturity Benefit - Receive 110% of the
Sum Assured on maturity of your policy
Life Cover - You get an insurance cover. In case of your
unfortunate demise, your family will receive the Death
Sum Assured.
Benefits 1 Benefits 2 Benefits 3 Benefits 4
Limited Premium
Payment Term
Guaranteed
Money Back
Guaranteed
Maturity Benefit
Life Cover
FUTURE GENERALIASSURED MONEY BACK
UNIQUE PRODUCT BENEFITS
Survival Benefits
Maturity Benefit
Death Benefit
YOUR BENEFITS
10% of Sum Assured at the end of ever year after the premium payment term for 9 years
110% of Sum Assured at the end of Policy Term
Death Sum Assured will be payable to your nominee. Death Sum Assured shall be highest of the following:
i. 10 times Annualised Premium (excluding taxes and extra premiums, if any), or
iii. 110% of Sum Assured
ii. 105% of total premiums paid (excluding taxes and extra premiums, if any) as on date of death or
KEY BENEFITS AT A GLANCE Survival/Maturity Benefits - If you have paid all the due premiums as per your Policy Term, you will receive 90% of Sum Assured as Survival Benefits and an additional 110% of the Sum Assured as Maturity Benefit. Let us understand your benefits with the help of an example:
Kumar is a 35 year old businessman, he applied for a Sum Assured of `5,00,000 with a 10 year Premium Payment Term. He needs to pay 56,805/- (excluding taxes and extra premium, if any) for 10 years.
As per the plan, after Kumar completes paying all his due premiums for 10 years, he will start receiving a guaranteed payout of 10% of the Sum Assured for the next 9 years. Therefore, he will receive 50,000 every year from the 11th to the 19th year. He will also receive 110% of Sum Assured i.e. 5,50,000 on maturity date.
Death Benefit - In case of your unfortunate demise
`
`
`
during the Policy Term, the Death Sum Assured will be payable to your nominee. In order to ensure that your family is always adequately protected, the Death Sum Assured shall be highest of the following:
• 10 times Annualised Premium (excluding taxes and extra premiums, if any), or
• 105% of total premiums paid (excluding taxes and extra premiums, if any) as on date of death, or
• 110% of Sum Assured
Let us understand your Death Benefit with the help of the previous example: Kumar, a 30 year old male, has opted for an insurance coverage amount called Sum Assured of
5,00,000. He chooses a Premium Payment Term of 10 years. He pays 56,805 as annual premium (excluding taxes, rider premium, and extra premium, if any). Unfortunately, he expires during the 4th policy year. In this case, Kumar’s nominee will receive the following Death Benefit:
``
17
INSURANCE
WHAT YOU PAY
`58,805 is paid for 4 years
Sum Assured is `5,00,000
In case of an unfortunate event during 4th plan year, family receives `5,68,050
Death Sum Assured is higher of:
1. 10 times Annualised Premium ie. `5,68,050
2. 105% of total premiums paid till death i.e. `2,38,851
3. 110% of Sum Assured i.e. `5,50,000
WHAT YOU PAY WHAT YOU GET
Survival Benefit:
`50,000 for 9 years
Maturity Benefit ` 5,50,000on maturity date
Kumar plans to pay premium for 10 years for a Sum Assured
of ` 5,00,000
Premium Payment Term:
`56,805 is paid for 10 years
Survival Benefit
PLAN ELIGIBILITY
Parameters
Premium Payment Term Limited Premium Payment for 5/7/10/12 years
Policy Term PPT + 10 years i.e. 15/17/20/22 years respectively
Age at entry (last birthday) Minimum - 18 years,Maximum age at entry50 years for policy term of 15/17/20 years,48 years of policy term of 22 years
Maturity age (last birthday) Minimum 33 yearsMaximum - 70 years
Annual Premium (Minimum) Minimum premium-PPT 5 years = `18,000 p.a, PPT 7 years = `18,000 p.a,PPT 10 years = 24,000 p.a, PPT 12 years = `24,000 p.a,Maximum premium - No limit subject to underwriting (all premium are excluding applicable taxes)
Sum Assured Minimum - `58,215 (Subject to minimum premium condition is met)Maximum - No Limit, subject to underwriting
Premium Payment mode
Loan Available
-
`
Yearly, Half Yearly, Quarterly and Monthly (ECS) modes
available
Annualised
Returns (%) RiskAverage Yield till
Scheme Name NAV Launch QAAUM Since Std. SharpeMaturity (Days) Maturity
1W 2W 1M 6M 1Y 3Y(`) Date (`Cr.) Launch Dev.
DHFL Pramerica Credit Opp F - Reg - G 11.74 29-Sep-2014 171.94 15.52 15.67 15.04 9.54 10.02 N.A 11.23 8.28 0.44 697.15 11.24
BOI AXA Corporate Credit Spectrum F - Reg - G 11.01 27-Feb-2015 322.75 18.60 18.58 16.02 9.14 9.35 N.A 9.24 6.49 0.28 956.30 12.39
Kotak Medium Term Fund - Reg - G 12.27 21-Mar-2014 1146.71 12.49 16.14 17.86 8.89 9.26 N.A 10.62 9.32 0.32 1160.70 10.52
SBI Corporate Bond Fund - Growth 23.83 19-Jul-2004 415.79 19.71 16.92 17.12 8.43 9.25 10.29 7.70 7.68 0.34 1168.00 10.17
ICICI Pru Dynamic Bond F - Prem Plus - G 17.32 14-Jan-2010 993.46 15.44 32.88 33.65 8.36 9.23 10.07 9.24 25.68 0.19 3062.36 8.52
HDFC Corporate Debt Opp. F - Reg - G 12.27 25-Mar-2014 6778.48 16.04 18.08 18.28 9.05 9.07 N.A 10.67 9.63 0.31 1153.40 10.67
L&T Resurgent India Corporate Bond F - Reg - G 11.09 02-Feb-2015 330.30 10.68 15.78 23.36 7.48 8.96 N.A 9.32 13.58 0.16 2109.70 9.79
Returns (%) Risk Average Yield tillScheme Name NAV Launch QAAUM Since Std. Sharpe Maturity (Days) Maturity
1W 2W 1M 6M 1Y 3Y(`) Date (`Cr.) Launch Dev.
Kotak Income Opportunities Fund - Reg - G 16.31 11-May-2010 1252.65 16.17 15.53 15.54 9.08 9.09 9.18 8.66 6.64 0.37 821.25 10.81
DSP BlackRock Income Opportunities F - Reg - G 24.48 13-May-2003 2299.97 15.22 16.81 18.07 9.03 9.30 9.64 7.19 8.08 0.34 1087.70 10.51
HDFC Short Term Plan - Growth 29.59 28-Feb-2002 2768.24 15.63 15.94 15.62 8.97 9.35 9.36 8.00 6.12 0.43 711.75 10.53
Birla Sun Life Medium Term Plan - Reg - G 18.64 25-Mar-2009 4637.80 12.66 13.35 20.76 8.22 9.34 10.52 9.28 10.07 0.31 2204.61 9.99
Taurus Short Term Income Fund - Reg - G 2664.25 23-Aug-2001 335.90 9.07 8.99 8.42 8.22 8.68 9.49 6.93 0.66 2.72 18.25 9.05
IDFC SSIF - Short Term - Plan D - MF Plan - G 20.53 12-Sep-2005 4540.79 16.59 17.19 17.02 8.22 8.58 9.36 7.05 6.81 0.33 821.25 8.45
IDFC Banking Debt Fund - Reg - Growth 13.01 07-Mar-2013 1256.12 27.49 16.38 14.04 8.20 8.52 8.86 8.94 3.27 0.41 235.00 7.82
Returns (%) Risk Average Yield tillScheme Name NAV Launch QAAUM Since Std. Sharpe Maturity (Days) Maturity
1W 2W 1M 3M 1Y 3Y(`) Date (`Cr.) Launch Dev.
Baroda Pioneer Treasury Advantage F - Plan A - G 1737.72 24-Jun-2009 2100.22 19.90 15.86 13.62 9.39 9.02 9.25 8.50 2.68 0.63 362.09 9.25
Tata Treasury Manager Fund - SHIP - G 1750.93 13-Jul-2007 451.81 22.93 16.08 13.42 9.10 8.78 9.27 6.63 3.22 0.54 186.15 7.99
DHFL Pramerica Low Duration Fund - G 20.42 22-Jun-2007 758.65 14.50 12.31 11.25 9.09 9.23 9.32 8.47 2.49 0.79 178.85 10.44
IDFC Ultra Short Term Fund - Reg - G 21.24 17-Jan-2006 3298.37 20.31 16.64 13.85 9.03 8.63 9.22 7.66 3.13 0.50 361.00 8.55
ICICI Prudential Ultra Short Term Plan - Reg - G 15.31 11-Aug-2009 5152.13 15.01 15.97 15.39 8.99 8.74 8.90 6.62 5.49 0.31 934.40 8.63
UTI Floating Rate Fund - STP - Growth 2447.21 29-Aug-2003 5968.28 18.59 17.56 14.04 8.98 8.54 9.06 7.36 2.78 0.47 316.16 9.19
ICICI Prudential Flexible Income Plan - Reg - G 286.22 27-Sep-2002 16096.90 19.00 14.52 13.20 8.92 8.76 9.31 8.09 2.62 0.61 307.04 8.91
Note: Indicative corpus are including Growth & Dividend option. The above mentioned data is on the basis of 31/03/2016Beta, Sharpe and Standard Deviation are calculated on the basis of period: 1 year, frequency: Weekly Friday, RF: 7%
Annualised
18
MUTUAL FUND Performance Charts
EQUITY (Diversified)
INCOME FUND
ULTRA SHORT TERM
SHORT TERM FUND
Due to their inherent long term nature, the following 3 categories have been sorted on the basis of 1 year returns
Due to their inherent short term nature, Short term funds and Ultra short term funds have been sorted on the basis of 6month and 3month returns respectively
Annualised
®
BALANCED
Returns (%) Risk Market Cap (%)
Scheme Name NAV Launch QAAUM 3M 6M 1Y 3Y Since Std.Dev Jenson LARGE MID SMALL DEBT &
(`) Date (` Cr.) Launch CAP CAP CAP OTHER
Reliance RSF - Balanced - Growth 39.57 08-Jun-2005 1615.97 -3.90 -0.60 0.40 18.22 13.56 1.85 0.21 50.34 10.53 2.59 36.53
L&T India Prudence Fund - Growth 19.29 07-Feb-2011 1008.22 -2.93 -1.72 0.07 20.79 13.62 1.69 0.26 46.50 19.74 2.22 31.54
Franklin India Balanced Fund - Growth 90.34 10-Dec-1999 759.92 0.20 -0.18 0.01 19.45 14.44 1.61 0.23 53.12 11.50 N.A 35.38
SBI Magnum Balanced Fund - Growth 94.70 09-Oct-1995 2892.74 -2.36 0.12 -0.28 20.18 16.20 1.68 0.23 33.49 28.31 4.15 34.05
DSP BlackRock Balanced Fund - Growth 106.47 27-May-1999 909.45 -2.71 -0.79 -0.67 16.62 15.06 1.95 0.23 50.73 17.61 1.07 30.59
HDFC Balanced Fund - Growth 106.34 11-Sep-2000 4732.11 -1.97 -1.00 -1.04 20.43 16.41 1.85 0.23 40.54 23.31 1.19 34.96
Birla Sun Life Balanced 95 - Growth 552.35 10-Feb-1995 2099.74 -2.03 -0.45 -1.64 18.35 20.88 1.89 0.21 46.35 24.17 N.A 29.48
Returns (%) Risk Market Cap (%)
Scheme Name NAV Launch QAAUM 3M 6M 1Y 3Y Since Std.Dev Beta Jenson LARGE MID SMALL DEBT &
(`) Date (` Cr.) Launch CAP CAP CAP OTHER
SBI Small & Midcap Fund - Growth 31.27 09-Sep-2009 711.78 -9.76 0.51 8.63 37.37 18.97 2.71 0.82 0.61 N.A 69.58 27.45 2.97
Sundaram Rural India Fund - Reg - G 26.11 12-May-2006 217.88 -1.86 2.33 4.13 19.41 10.19 2.47 0.96 0.26 85.65 11.83 0.46 2.06
DSP BlackRock Micro Cap Fund - Reg - G 40.90 14-Jun-2007 2233.01 -7.39 -2.00 3.17 39.49 17.35 2.93 0.94 0.62 N.A 81.47 13.68 4.86
PPFAS Long Term Value Fund - Reg - G 16.83 24-May-2013 629.32 -4.11 5.48 3.07 N.A 20.00 1.93 0.64 0.23 19.99 38.65 7.15 34.21
Mirae Asset Emerging Bluechip Fund - G 29.77 09-Jul-2010 1054.32 -6.37 -2.44 1.79 32.49 20.97 2.56 0.94 0.44 33.55 62.28 1.85 2.32
Kotak Midcap Fund - Reg - Growth 52.06 24-Feb-2005 351.03 -2.89 -0.54 1.76 25.67 16.02 2.56 0.94 0.41 29.25 64.68 4.63 1.44
SBI Magnum Multi Cap Fund - Growth 32.59 29-Sep-2005 574.24 -3.01 0.35 1.40 22.66 11.90 2.38 0.95 0.34 63.76 25.58 5.94 4.72

SMC organizing Holi fete on 23rd March at Head Office, New Delhi
