fcf 9th edition chapter 13
DESCRIPTION
dTRANSCRIPT

Chapter 13Problems 1-28
Input boxes in tanOutput boxes in yellowGiven data in blueCalculations in redAnswers in green
NOTE: Some functions used in these spreadsheets may require that the "Analysis ToolPak" or "Solver Add-In" be installed in Excel.To install these, click on the Office button then "Excel Options," "Add-Ins" and select"Go." Check "Analyis ToolPak" and "Solver Add-In," then click "OK."
NOTE: Some functions used in these spreadsheets may require that the "Analysis ToolPak" or "Solver Add-In" be installed in Excel.
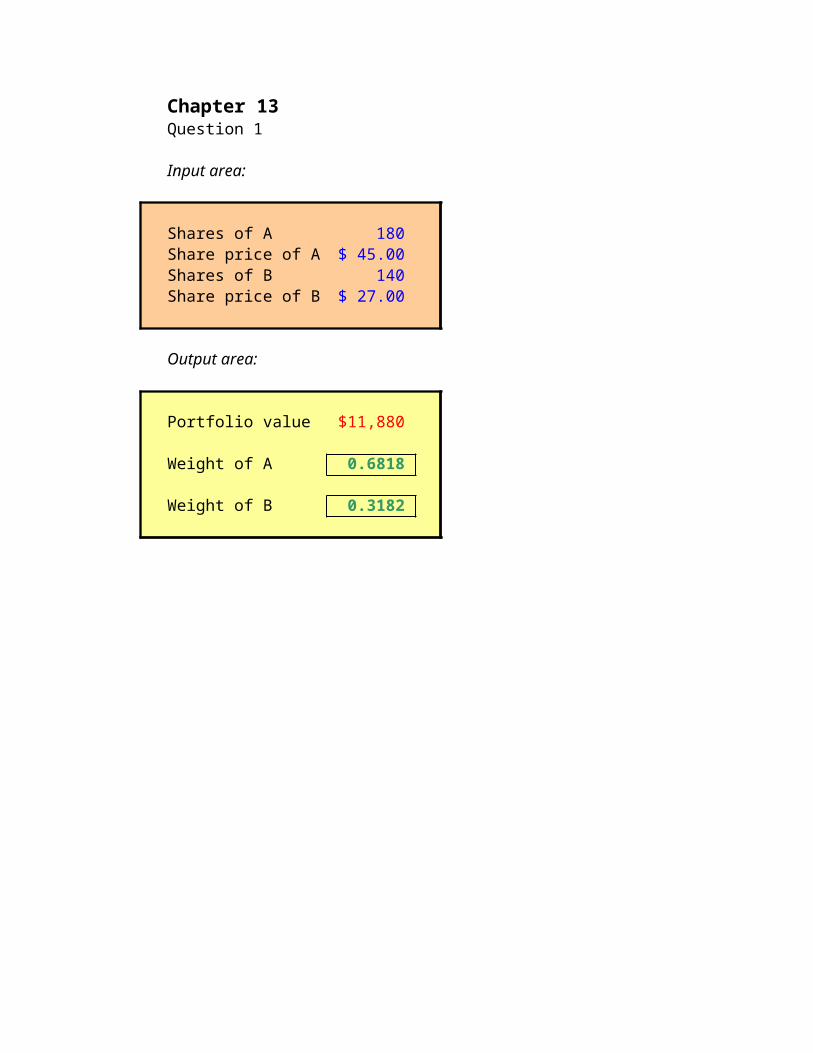
Chapter 13Question 1
Input area:
Shares of A 180 Share price of A $ 45.00 Shares of B 140 Share price of B $ 27.00
Output area:
Portfolio value $ 11,880
Weight of A 0.6818
Weight of B 0.3182

Chapter 13Question 2
Input area:
Stock A value $ 2,950 Stock B value $ 3,700 Stock A E(R) 11.00%Stock B E(R) 15.00%
Output area:
Portfolio value $ 6,650
Weight of A 0.4436
Weight of B 0.5564
Portfolio E(R) 13.23%
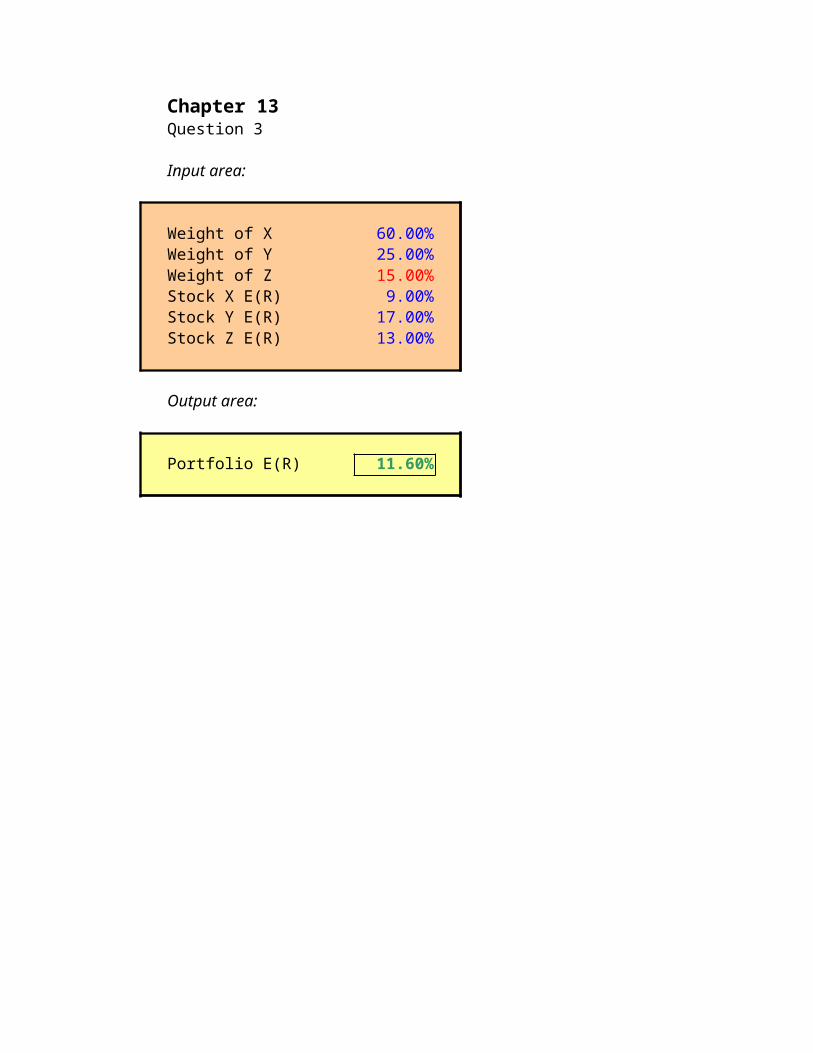
Chapter 13Question 3
Input area:
Weight of X 60.00%Weight of Y 25.00%Weight of Z 15.00%Stock X E(R) 9.00%Stock Y E(R) 17.00%Stock Z E(R) 13.00%
Output area:
Portfolio E(R) 11.60%

Chapter 13Question 4
Input area:
Portfolio value $ 10,000 Stock X E(R) 14.00%Stock Y E(R) 10.50%Portfolio E(R) 12.40%
Output area:
Weight of Stock X 0.5429
Weight of Stock Y 0.4571
Dollar in Stock X $ 5,428.57
Dollars in Stock Y $ 4,571.43

Chapter 13Question 5
Input area:
State Probability ReturnRecession 0.25 -0.08
Boom 0.75 0.21
Output area:
State Probability Return ProductRecession 0.25 (0.08) (0.0200)
Boom 0.75 0.21 0.1575 Expected return 0.1375

Chapter 13Question 6
Input area:
State Probability ReturnRecession 0.20 (0.05)
Normal 0.50 0.12Boom 0.30 0.25
Output area:
State Probability Return ProductRecession 0.20 (0.05) (0.0100)
Nprmal 0.50 0.12 0.0600 Boom 0.30 0.25 0.0750
Expected return 0.1250

Chapter 13Question 7
Input area:
State Probability Stock A Stock BRecession 0.15 0.05 (0.17)
Normal 0.65 0.08 0.12 Boom 0.20 0.13 0.29
Output area:
Stock A Probability Return ProductRecession 0.15 0.05 0.0075
Normal 0.65 0.08 0.0520 Boom 0.20 0.13 0.0260
E(R) = 8.55%
Standard Deviation = 2.46%
Stock B Probability Return ProductRecession 0.15 (0.17) (0.0255)
Normal 0.65 0.12 0.0780 Boom 0.20 0.29 0.0580
E(R) = 11.05%
Standard Deviation = 13.53%

Product(0.0355) 0.00126 0.0001890375(0.0055) 0.00003 1.96625E-050.0445 0.00198 0.00039605
Variance = 0.00060
Product(0.2805) 0.07868 0.01180203750.0095 0.00009 5.86625E-050.1795 0.03222 0.00644405
Variance = 0.01830
ReturnDeviation
SquaredDeviation
ReturnDeviation
SquaredDeviation

Chapter 13Question 8
Input area:
Weight of G 25.00%Weight of J 55.00%Weight of K 20.00%Stock G E(R) 8.00%Stock J E(R) 15.00%Stock K E(R) 24.00%
Output area:
Portfolio E(R) 15.05%

Chapter 13Question 9
Input area:
State Probability Stock A Stock B Stock CRecession 0.35 0.07 0.15 0.33
Boom 0.65 0.13 0.03 (0.06)
a. weights 0.33 0.33 0.33 b. weights 0.20 0.20 0.60
Output area:
a. Stock A Probability ProductRecession 0.35 0.1833 0.0642
Boom 0.65 0.0333 0.0217 E(R) = 0.0858
b. Stock A Probability Return Product ProductRecession 0.35 0.2420 0.0847 0.1599 0.02557 0.0089488035
Boom 0.65 (0.0040) (0.0026) (0.0861) 0.00741 0.0048185865 E(R) = 0.0821 Variance = 0.013767
PortfolioReturn
ReturnDeviation
SquaredDeviation
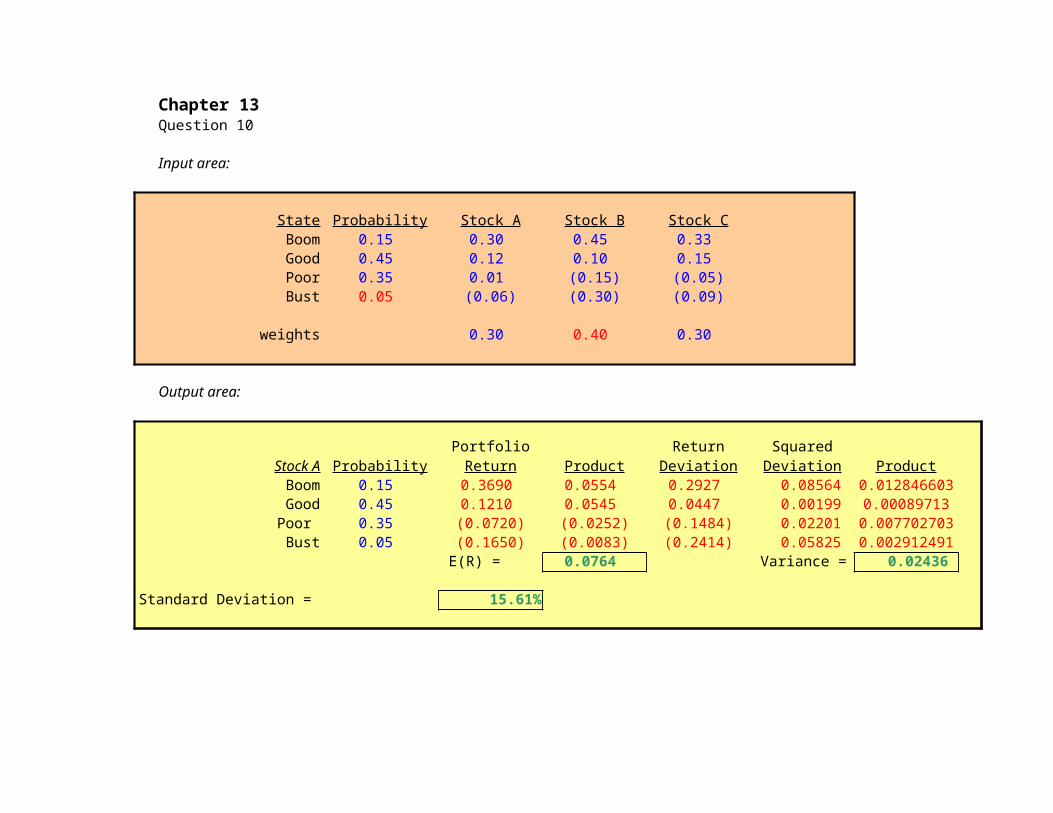
Chapter 13Question 10
Input area:
State Probability Stock A Stock B Stock CBoom 0.15 0.30 0.45 0.33 Good 0.45 0.12 0.10 0.15 Poor 0.35 0.01 (0.15) (0.05)Bust 0.05 (0.06) (0.30) (0.09)
weights 0.30 0.40 0.30
Output area:
Stock A Probability Product ProductBoom 0.15 0.3690 0.0553 0.2926 0.08564 0.012846603Good 0.45 0.1210 0.0545 0.0446 0.00199 0.00089713Poor 0.35 (0.0720) (0.0252) (0.1483) 0.02201 0.007702703Bust 0.05 (0.1650) (0.0082) (0.2414) 0.05825 0.002912491
E(R) = 0.0764 Variance = 0.02436
Standard Deviation = 15.61%
PortfolioReturn
ReturnDeviation
SquaredDeviation

Chapter 13Question 11
Input area:
Weight of Q 25.00%Weight of R 20.00%Weight of S 15.00%Weight of T 40.00%Beta of Q 0.84 Beta of R 1.17 Beta of S 1.11 Beta of T 1.36
Output area:
Portfolio E(R) 1.15

Chapter 13Question 12
Input area:
Weight of risk-free 33.33%Weight of Stock A 33.33%Weight of Stock B 33.33%Beta of risk-free 0.00 Beta of Stock A 1.38 Beta of Portfolio 1.00
Output area:
Beta of Stock B 1.62
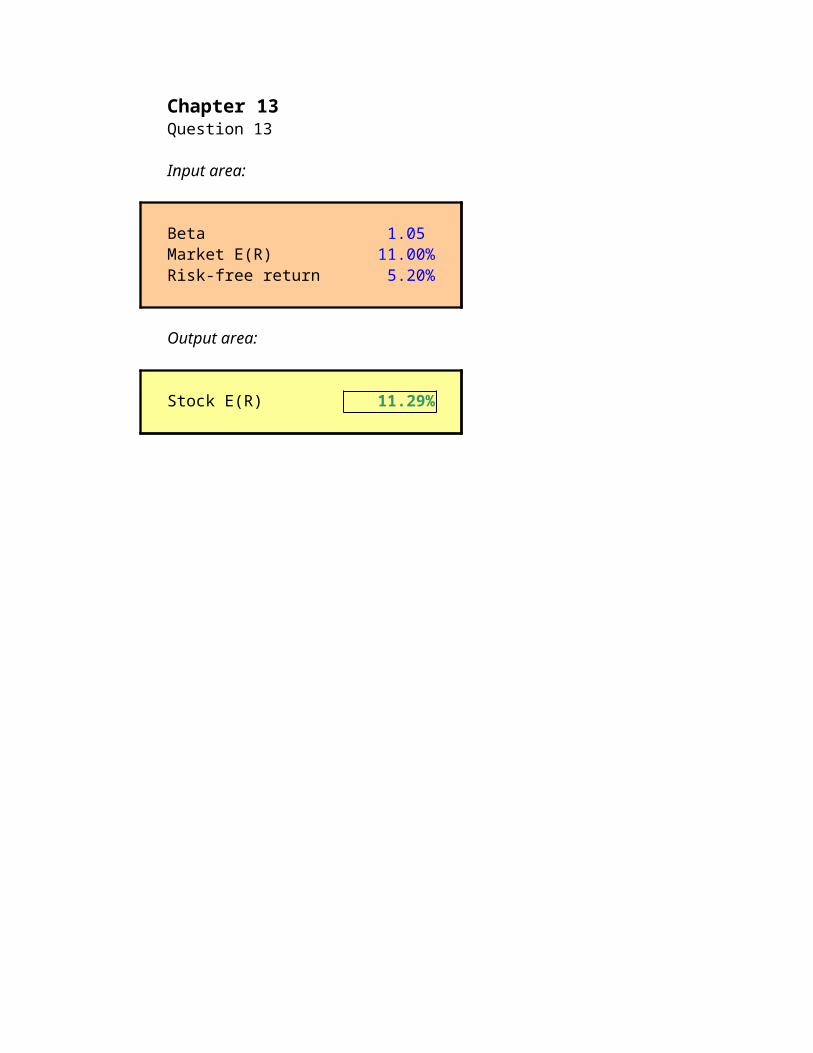
Chapter 13Question 13
Input area:
Beta 1.05 Market E(R) 11.00%Risk-free return 5.20%
Output area:
Stock E(R) 11.29%

Chapter 13Question 14
Input area:
Stock E(R) 10.20%Risk-free return 4.50%Market risk premium 8.50%
Output area:
Stock beta 0.67

Chapter 13Question 15
Input area:
Stock E(R) 13.50%Stock beta 1.17 Risk-free return 5.50%
Output area:
Market E(R) 12.34%
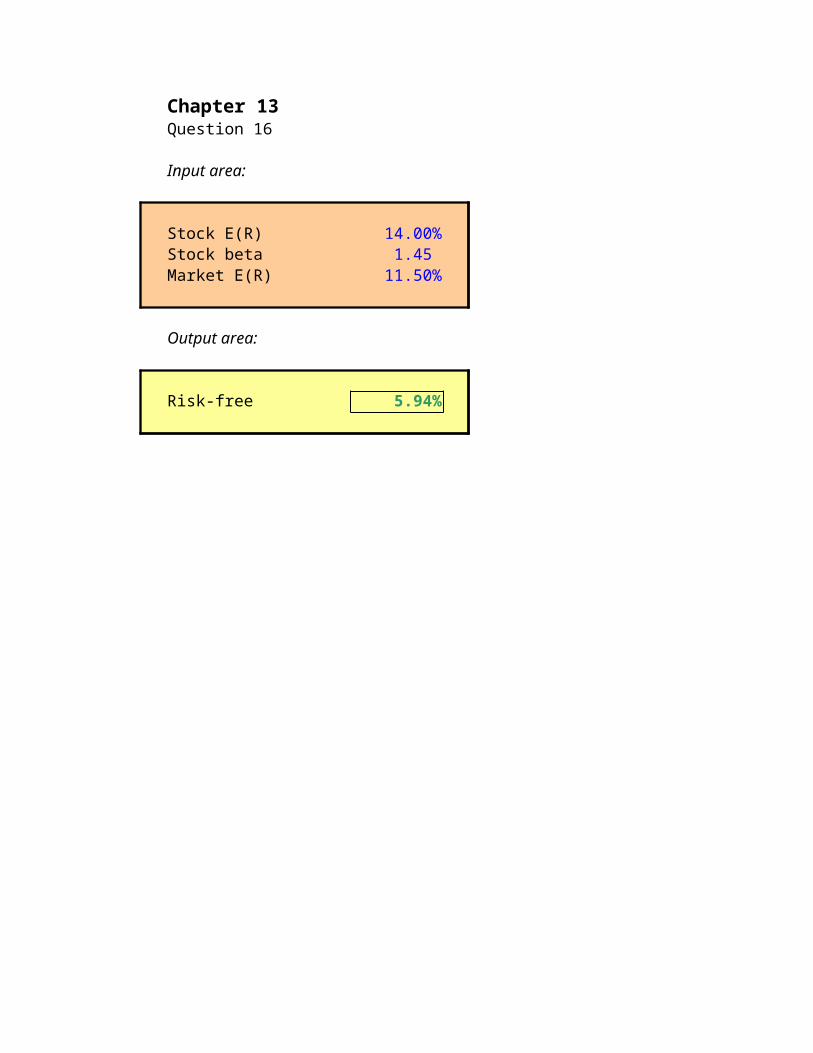
Chapter 13Question 16
Input area:
Stock E(R) 14.00%Stock beta 1.45 Market E(R) 11.50%
Output area:
Risk-free 5.94%

Chapter 13Question 17
Input area:
Stock beta 1.35 Stock E(R) 16.00%Risk-free return 4.80%
a. Weight of stock 50.00%b. Portfolio beta 0.95 c. Portfolio E(R) 8.00%d. Portfolio beta 2.70
Output area:
a. Portfolio E(R) 10.40%
b. Weight of stock 0.7037
Weight of risk-free 0.2963
c. Weight of stock 0.2857
Portfolio beta 0.386
b. Weight of stock 200.00%
Weight of risk-free -100.00%
The portfolio is invested 200.00%in the stock and -100.00%in the risk-free asset. This representsborrowing at the risk-free rate to buy more of the stock.

Chapter 13Question 18
Input area:
Stock E(R) 15.20%Stock beta 1.25 Risk-free return 5.30%
Output area:
Slope of SML = 0.0792
Weight of W Portfolio E(R) Portfolio beta0.00% 5.30% 0.000
25.00% 7.78% 0.313 50.00% 10.25% 0.625 75.00% 12.73% 0.938
100.00% 15.20% 1.250 125.00% 17.68% 1.563 150.00% 20.15% 1.875

Chapter 13Question 19
Input area:
Stock Y beta 1.30 Stock Y E(R) 18.50%Stock Z beta 0.70 Stock Z E(R) 12.10%Risk-free rate 8.00%Market risk premium 7.50%
Output area:
SML reward-to-risk 0.0750
Reward-to-risk ratios
Stock Y 0.0808
Stock Z 0.0586
Return predicted by CAPM
Stock Y 17.75%
Stock Z 13.25%
Stock Y is undervaluedStock Z is overvalued

Chapter 13Question 20
Input area:
Stock Y beta 1.30 Stock Y E(R) 18.50%Stock Z beta 0.70 Stock Z E(R) 12.10%Market risk premium 7.50%
Output area:
Risk-free rate 4.63%

Chapter 13Question 21
Input area:
Large-company stocks 12.30%Long-term government bonds 5.80%Small company stock 17.10%Treasury bills 3.80%
Output area:
Large-company stocks andlong-term government bondsportfolio 9.05%
Small company stocks andTreasury bill portfolio 10.45%
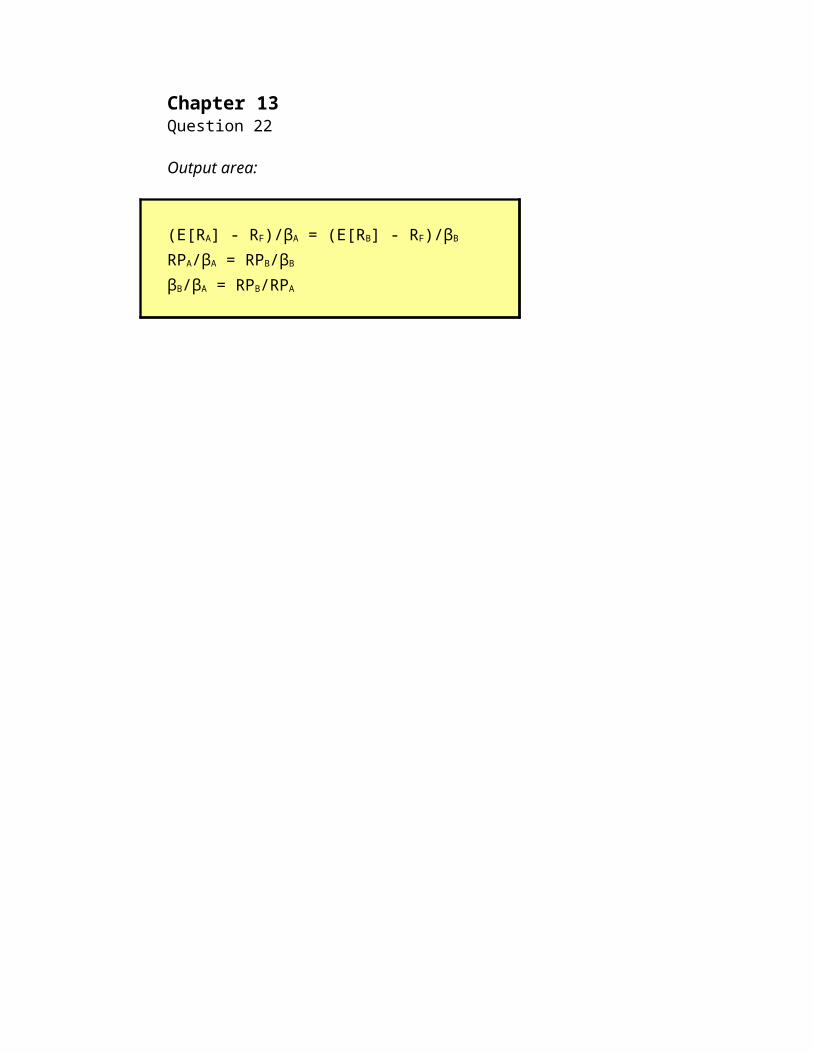
Chapter 13Question 22
Output area:
(E[RA] - RF)/βA = (E[RB] - RF)/βB
RPA/βA = RPB/βB
βB/βA = RPB/RPA
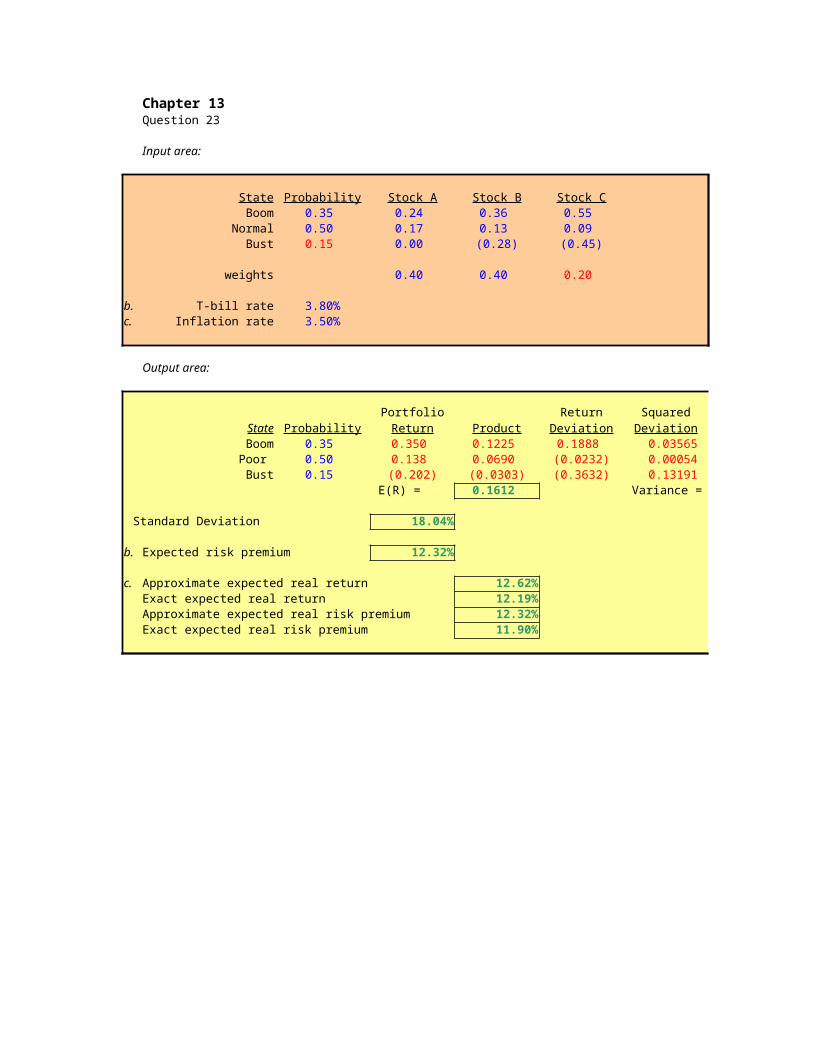
Chapter 13Question 23
Input area:
State Probability Stock A Stock B Stock CBoom 0.35 0.24 0.36 0.55
Normal 0.50 0.17 0.13 0.09 Bust 0.15 0.00 (0.28) (0.45)
weights 0.40 0.40 0.20
b. T-bill rate 3.80%c. Inflation rate 3.50%
Output area:
State Probability Product ProductBoom 0.35 0.350 0.1225 0.1888 0.03565 0.012475904Poor 0.50 0.138 0.0690 (0.0232) 0.00054 0.00026912Bust 0.15 (0.202) (0.0303) (0.3632) 0.13191 0.019787136
E(R) = 0.1612 Variance = 0.03253
Standard Deviation 18.04%
b. Expected risk premium 12.32%
c. Approximate expected real return 12.62%Exact expected real return 12.19%Approximate expected real risk premium 12.32%Exact expected real risk premium 11.90%
PortfolioReturn
ReturnDeviation
SquaredDeviation


Chapter 13Question 24
Input area:
Portfolio beta 1.00 Total investment $ 1,000,000
Asset Investment BetaStock A $ 210,000 0.85 Stock B $ 320,000 1.20 Stock C 1.35 Risk-free asset
Output area:
Asset Investment BetaStock A $ 210,000.00 0.85 Stock B $ 320,000.00 1.20 Stock C $ 324,074.07 1.35 Risk-free asset $ 145,925.93 0.00

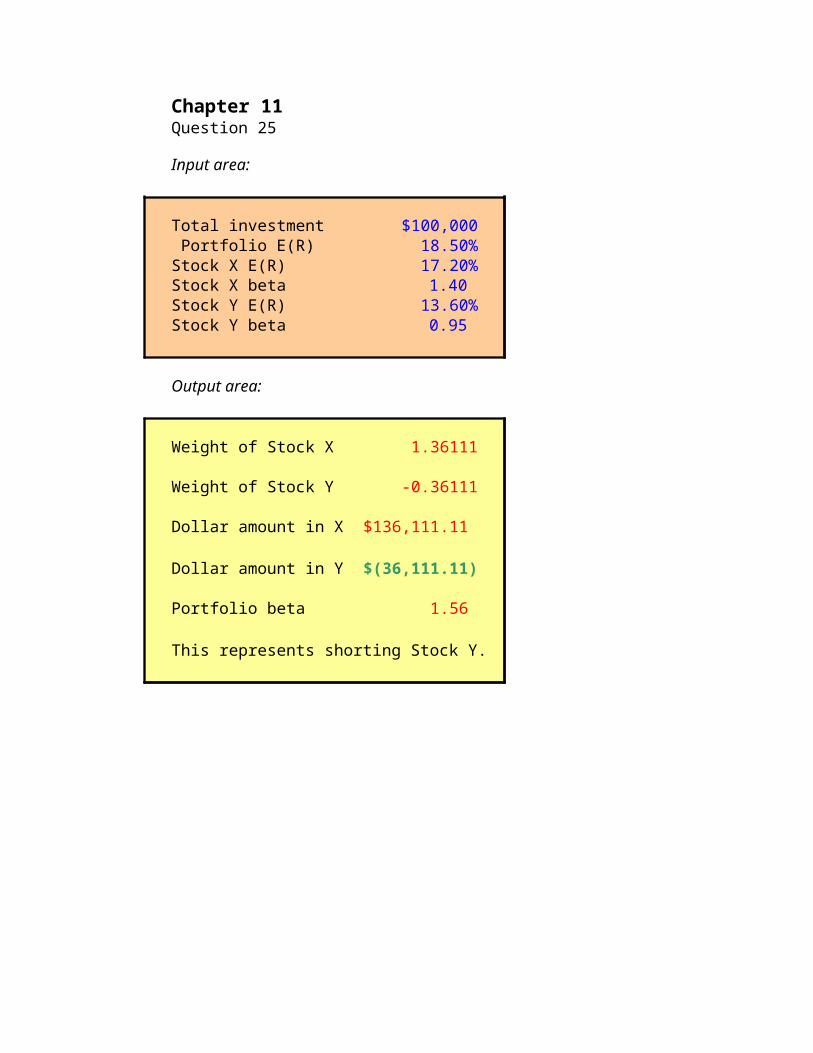
Chapter 11Question 25
Input area:
Total investment $100,000 Portfolio E(R) 18.50%Stock X E(R) 17.20%Stock X beta 1.40 Stock Y E(R) 13.60%Stock Y beta 0.95
Output area:
Weight of Stock X 1.36111
Weight of Stock Y -0.36111
Dollar amount in X $ 136,111.11
Dollar amount in Y $ (36,111.11)
Portfolio beta 1.56
This represents shorting Stock Y.
Chapter 11Question 26
Input area:
State Probability Stock I Stock IIRecession 0.25 0.11 (0.40)
Normal 0.50 0.29 0.10 Boom 0.25 0.13 0.56
Market risk premium 8.00%Risk-free rate 4.00%
Output area:
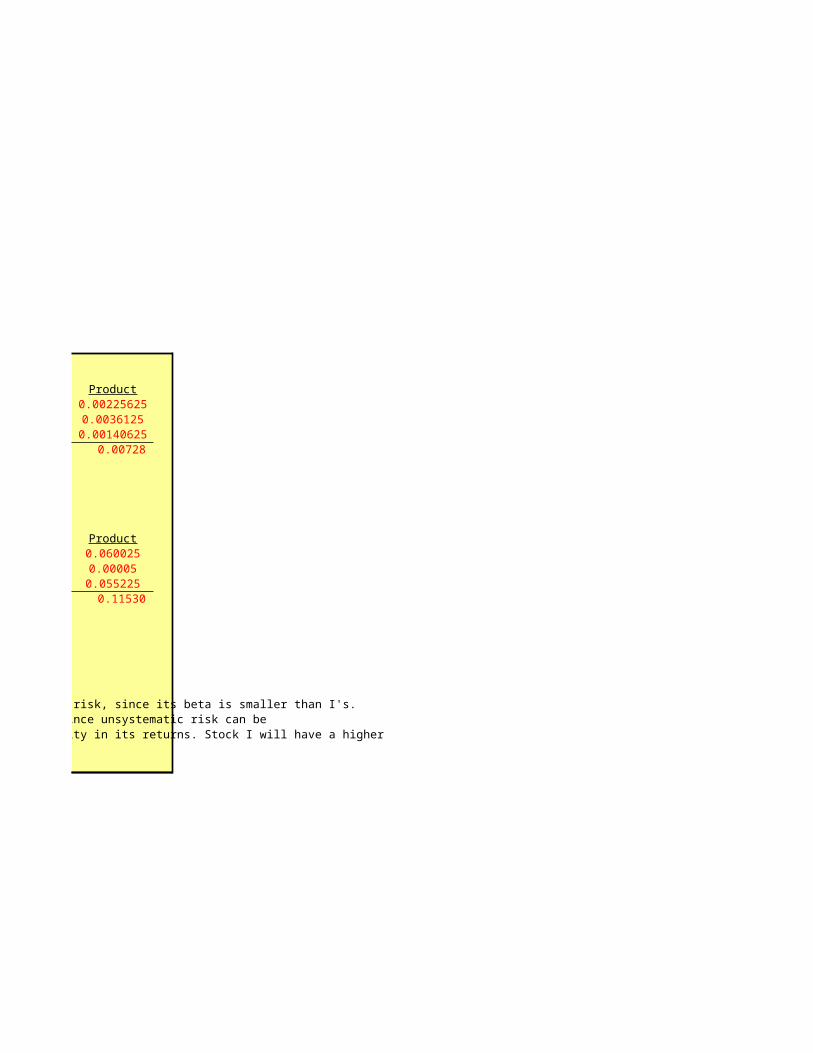
Stock I Probability Return Product ProductRecession 0.25 0.11 0.0275 (0.0950) 0.00902 0.00225625
Normal 0.50 0.29 0.1450 0.0850 0.00722 0.0036125Boom 0.25 0.13 0.0325 (0.0750) 0.00562 0.00140625
E(R) = 0.2050 Variance = 0.00727
Standard Deviation = 8.53%
Stock I beta = 2.06
Stock II Probability Return Product ProductRecession 0.25 (0.40) (0.1000) (0.4900) 0.24010 0.060025
Normal 0.50 0.10 0.0500 0.0100 0.00010 0.00005Boom 0.25 0.56 0.1400 0.4700 0.22090 0.055225
E(R) = 0.0900 Variance = 0.11530
Standard Deviation = 33.96%
Stock II beta = 0.63
Although Stock II has more total risk than Stock I, it has much less systematic risk, since its beta is smaller than I's.Thus I has more systematic risk, and II has more unsystematic and total risk. Since unsystematic risk can be diversified away, I is actually the "riskier" stock despite the lack of volatility in its returns. Stock I will have a higherrisk premium and a greater expected return.
ReturnDeviation
SquaredDeviation
ReturnDeviation
SquaredDeviation

Chapter 13Question 27
Input area:
Beta Expected returnPete beta 1.35 13.20%Repete beta 0.80 10.10%
Output area:
Risk-free rate 5.59%
Market returnWith Pete 11.23%With Repete 11.23%
Chapter 13Question 28
Input area:
State Probability Stock A Stock BBust 0.15 (0.08) (0.05)
Normal 0.70 0.13 0.14 Boom 0.15 0.48 0.29
Amount Stock A's beta exceeds Stock B's beta 0.25
Output area:
a. Stock A Probability Return ProductRecession 0.15 (0.08) (0.0120)
Normal 0.70 0.13 0.0910 Boom 0.15 0.48 0.0720
E(R) = 15.10%
Stock B Probability Return ProductRecession 0.15 (0.05) (0.0075)
Normal 0.70 0.14 0.0980 Boom 0.15 0.29 0.0435
E(R) = 13.40%
b. Slope of SML 6.80% equals the market risk premium.