fce bank plc annual report and accounts · 2020-04-01 · fce bank plc – annual report and...
TRANSCRIPT

FCE Bank plcAnnuAl REpoRt And ACCounts for the year ended 31 december 2011
2 FCE Bank plc – ANNUAL REPORT AND ACCOUNTS – 2011
Definitions
Definitions
For the purpose of this report the term
i. '2011 Annual Report and Accounts' means FCE's consolidated annual financial statements as at and for the year ended
31 December 2011.
ii. 'Interim Report' means FCE's consolidated interim report and financial statements as at and for the half year ended 30
June 2011.
iii. 'Company' means FCE Bank plc including all its European branches, but excluding its subsidiaries and SPEs.
iv. 'Group', or 'FCE', means the Company and its subsidiaries and SPEs.
v. 'FCI' means Ford Credit International, Inc., a company incorporated under the laws of Delaware USA, a subsidiary of Ford
Credit and the Company's immediate shareholder.
vi. 'Ford Credit', or 'FMCC', means Ford Motor Credit Company LLC, a limited liability company incorporated under the laws
of Delaware USA and an indirect wholly owned subsidiary of Ford.
vii. 'Ford' means Ford Motor Company, a company incorporated under the laws of Delaware USA and the Company's ultimate
parent company. In some cases, this term may mean Ford Motor Company and all or some of its affiliates.
viii. 'Forso', or 'the Forso JV', means a joint venture finance company established with CA Consumer Finance, a consumer
credit subsidiary of Credit Agricole S.A., in June 2008 which provides customer and dealer automotive financing in the
Nordic markets.
ix. 'Risk Based Equity', or 'RBE', is a process which allocates equity based on an assessment of the inherent risk in each
location. Borrowing costs are adjusted versus that reported under IFRS, to reflect the cost impact of changes in the level of
debt that would be required to match the revised equity requirements. RBE enables the risk/return of individual locations to
be evaluated from a total perspective.
x. 'SPE' means a bankruptcy-remote special purpose entity whose operations are limited to the acquisition and financing of
specific assets (which may include the issue of asset backed securities and making payments on the securities) and in
which FCE usually has no legal ownership or management control.
xi. 'FSA' is the UK Financial Services Authority - an independent non-governmental body, given statutory powers by the
Financial Services and Markets Act 2000. The FSA is FCE's regulator in the UK.
For a comprehensive list of definitions refer to the 'Glossary of defined terms' which commences on page130.
FCE Bank plc – ANNUAL REPORT AND ACCOUNTS – 2011 3
Contents
Business review for the year ended 31 December 2011
Highlights ............................................................................... 4
Chairman's statement ........................................................... 5
Description of the business ................................................. 6
Strategy .................................................................................. 8
Performance summary .......................................................... 9
Profitability ............................................................................. 10
Balance sheet ........................................................................ 11
Key financial ratios ................................................................. 12
Future prospects .................................................................... 14
Regulation ........................................................................... 15
Capital and funding ............................................................ 16
Funding sources .................................................................... 17
Liquidity.................................................................................. 18
Credit ratings ......................................................................... 19
Risk ...................................................................................... 20
People .................................................................................. 24
Other business review information ................................... 26
Directors' responsibilities for financial statements ................. 38
Independent auditors' report .................................................. 39
Consolidated statement of comprehensive income ............... 40
Balance sheets ...................................................................... 41
Statements of cash flows ....................................................... 42
Statements of changes in equity ............................................ 43
Index to the notes to the financial statements ........................ 44
Notes to the consolidated financial statements ...................... 45
Key financial ratios and terms .............................................. 127
Website addresses ............................................................. 128
European operating locations .............................................. 129
Glossary of defined terms .................................................... 130
Governance
Board of Directors ............................................................... 27
Key governance principles ................................................. 29
Audit Committee report ....................................................... 35
2011 Directors’ report Financial statements
Other information
2011 Directors’ Report Business review for the year ended 31 December 2011
4 FCE Bank plc – ANNUAL REPORT AND ACCOUNTS – 2011
Highlights
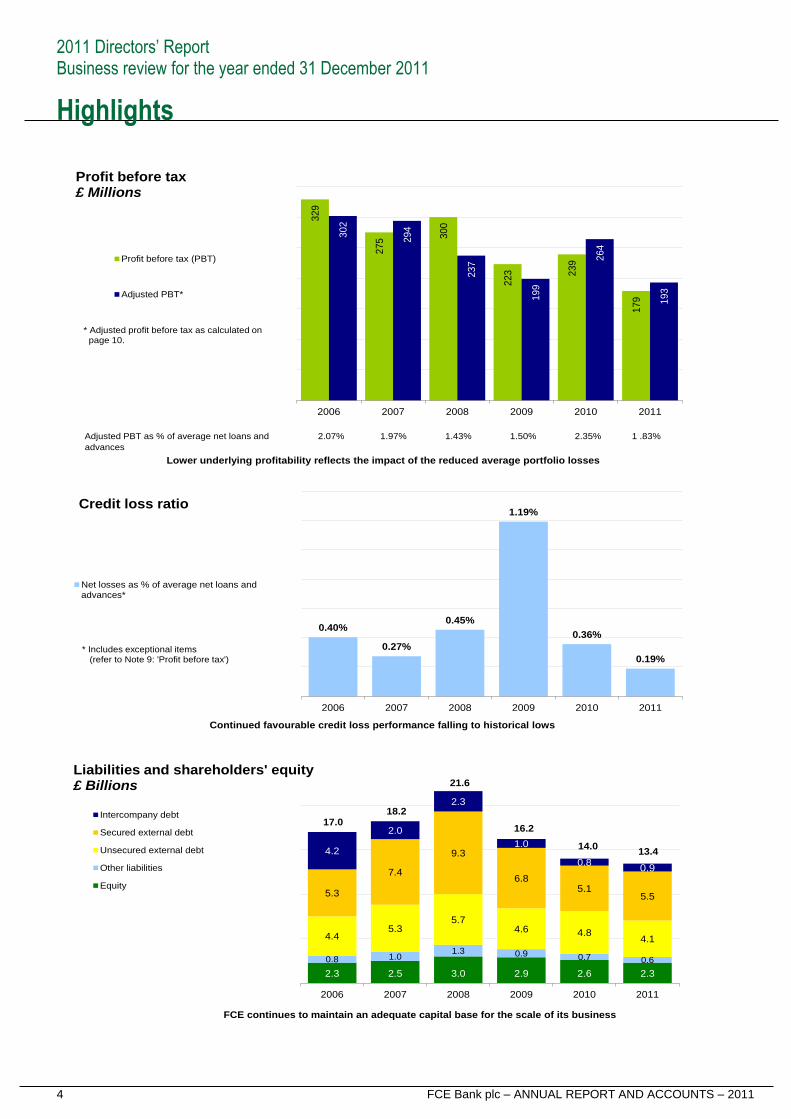
329
275 3
00
223 239
179
302
294
237
199
264
193
2006 2007 2008 2009 2010 2011
Profit before tax (PBT)
Adjusted PBT*
0.40%
0.27%
0.45%
1.19%
0.36%
0.19%
2006 2007 2008 2009 2010 2011
Net losses as % of average net loans andadvances*
2.3 2.5 3.0 2.9 2.6 2.3
0.8 1.01.3 0.9 0.7 0.6
4.45.3
5.74.6 4.8
4.1
5.3
7.4
9.3
6.85.1
5.5
4.2
2.0
2.3
1.0
0.80.9
17.018.2
21.6
16.2
14.013.4
2006 2007 2008 2009 2010 2011
Intercompany debt
Secured external debt
Unsecured external debt
Other liabilities
Equity
Profit before tax£ Millions
Credit loss ratio
Liabilities and shareholders' equity£ Billions
* Adjusted profit before tax as calculated onpage 10.
* Includes exceptional items (refer to Note 9: 'Profit before tax')
Lower underlying profitability reflects the impact of the reduced average portfolio losses
Continued favourable credit loss performance falling to historical lows
FCE continues to maintain an adequate capital base for the scale of its business
Adjusted PBT as % of average net loans and 2.07% 1.97% 1.43% 1.50% 2.35% 1 .83%
advances
2011 Directors’ Report Business review for the year ended 31 December 2011
FCE Bank plc – ANNUAL REPORT AND ACCOUNTS – 2011 5
Chairman's statement
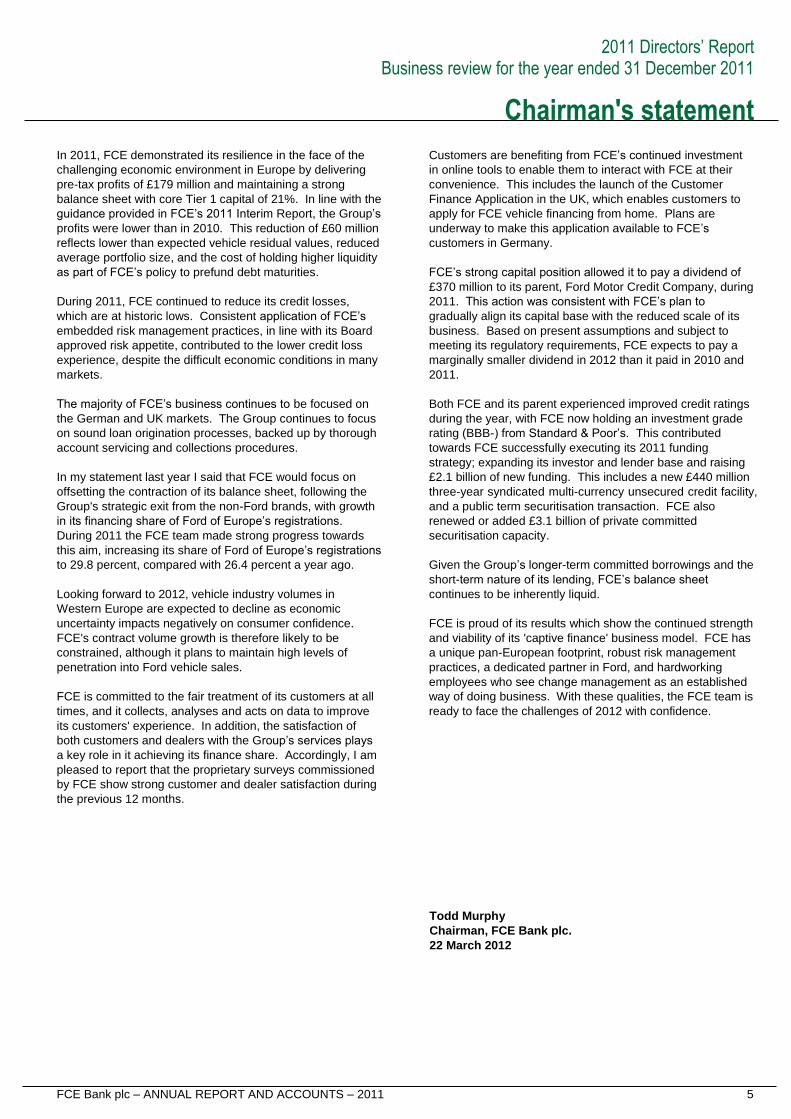
In 2011, FCE demonstrated its resilience in the face of the
challenging economic environment in Europe by delivering
pre-tax profits of £179 million and maintaining a strong
balance sheet with core Tier 1 capital of 21%. In line with the
guidance provided in FCE‟s 2011 Interim Report, the Group‟s
profits were lower than in 2010. This reduction of £60 million
reflects lower than expected vehicle residual values, reduced
average portfolio size, and the cost of holding higher liquidity
as part of FCE‟s policy to prefund debt maturities.
During 2011, FCE continued to reduce its credit losses,
which are at historic lows. Consistent application of FCE‟s
embedded risk management practices, in line with its Board
approved risk appetite, contributed to the lower credit loss
experience, despite the difficult economic conditions in many
markets.
The majority of FCE‟s business continues to be focused on
the German and UK markets. The Group continues to focus
on sound loan origination processes, backed up by thorough
account servicing and collections procedures.
In my statement last year I said that FCE would focus on
offsetting the contraction of its balance sheet, following the
Group's strategic exit from the non-Ford brands, with growth
in its financing share of Ford of Europe‟s registrations.
During 2011 the FCE team made strong progress towards
this aim, increasing its share of Ford of Europe‟s registrations
to 29.8 percent, compared with 26.4 percent a year ago.
Looking forward to 2012, vehicle industry volumes in
Western Europe are expected to decline as economic
uncertainty impacts negatively on consumer confidence.
FCE's contract volume growth is therefore likely to be
constrained, although it plans to maintain high levels of
penetration into Ford vehicle sales.
FCE is committed to the fair treatment of its customers at all
times, and it collects, analyses and acts on data to improve
its customers' experience. In addition, the satisfaction of
both customers and dealers with the Group‟s services plays
a key role in it achieving its finance share. Accordingly, I am
pleased to report that the proprietary surveys commissioned
by FCE show strong customer and dealer satisfaction during
the previous 12 months.
Customers are benefiting from FCE‟s continued investment
in online tools to enable them to interact with FCE at their
convenience. This includes the launch of the Customer
Finance Application in the UK, which enables customers to
apply for FCE vehicle financing from home. Plans are
underway to make this application available to FCE‟s
customers in Germany.
FCE‟s strong capital position allowed it to pay a dividend of
£370 million to its parent, Ford Motor Credit Company, during
2011. This action was consistent with FCE‟s plan to
gradually align its capital base with the reduced scale of its
business. Based on present assumptions and subject to
meeting its regulatory requirements, FCE expects to pay a
marginally smaller dividend in 2012 than it paid in 2010 and
2011.
Both FCE and its parent experienced improved credit ratings
during the year, with FCE now holding an investment grade
rating (BBB-) from Standard & Poor‟s. This contributed
towards FCE successfully executing its 2011 funding
strategy; expanding its investor and lender base and raising
£2.1 billion of new funding. This includes a new £440 million
three-year syndicated multi-currency unsecured credit facility,
and a public term securitisation transaction. FCE also
renewed or added £3.1 billion of private committed
securitisation capacity.
Given the Group‟s longer-term committed borrowings and the
short-term nature of its lending, FCE‟s balance sheet
continues to be inherently liquid.
FCE is proud of its results which show the continued strength
and viability of its 'captive finance' business model. FCE has
a unique pan-European footprint, robust risk management
practices, a dedicated partner in Ford, and hardworking
employees who see change management as an established
way of doing business. With these qualities, the FCE team is
ready to face the challenges of 2012 with confidence.
Todd Murphy
Chairman, FCE Bank plc.
22 March 2012
2011 Directors’ Report Business review for the year ended 31 December 2011
6 FCE Bank plc – ANNUAL REPORT AND ACCOUNTS – 2011
Description of the business
What FCE is
FCE is a United Kingdom ('UK') registered bank regulated by the Financial Services Authority (FSA) and is a wholly owned
subsidiary of Ford Credit International (FCI). FCI is wholly owned by Ford Motor Credit Company LLC (Ford Credit), which in turn is
wholly owned by Ford Motor Company (Ford). FCE is authorised by the FSA to carry on a range of regulated activities within the
UK and through a branch network in eleven other European countries, and is subject to consolidated supervision by the FSA. The
FSA is FCE's home regulator for all its branch operations.
What FCE does
FCE's aim is to be recognised as the leader in providing automotive financial products and services to Ford, its dealers and
customers, and consistently add shareholder value. Its business is best described in the context of its three main customer groups
– retail customers, dealers and Ford's automotive operations.
FCE helps Ford retail customers acquire Ford vehicles by providing
• finance for retail customers to purchase or lease vehicles;
• access to insurance products to protect customers when driving Ford vehicles;
• fleet/business customers with a wide range of financing options.
This area of business is referred to as 'Retail' within the 2011 Annual Report and Accounts.
FCE helps Ford dealers sell Ford vehicles by providing
• finance to stock new and used vehicles;
• finance for demonstrator and courtesy cars;
• finance to enable dealers to operate their business.
This area of the business is referred to as 'Wholesale' within the 2011 Annual Report and Accounts.
FCE helps Ford's automotive operations by providing
• a pan-European, branded finance network dedicated to supporting the sale of Ford products;
• financial risk management support to ensure continuity of the Ford distribution network;
• specialist support for key business and customer segments, and new market expansion.
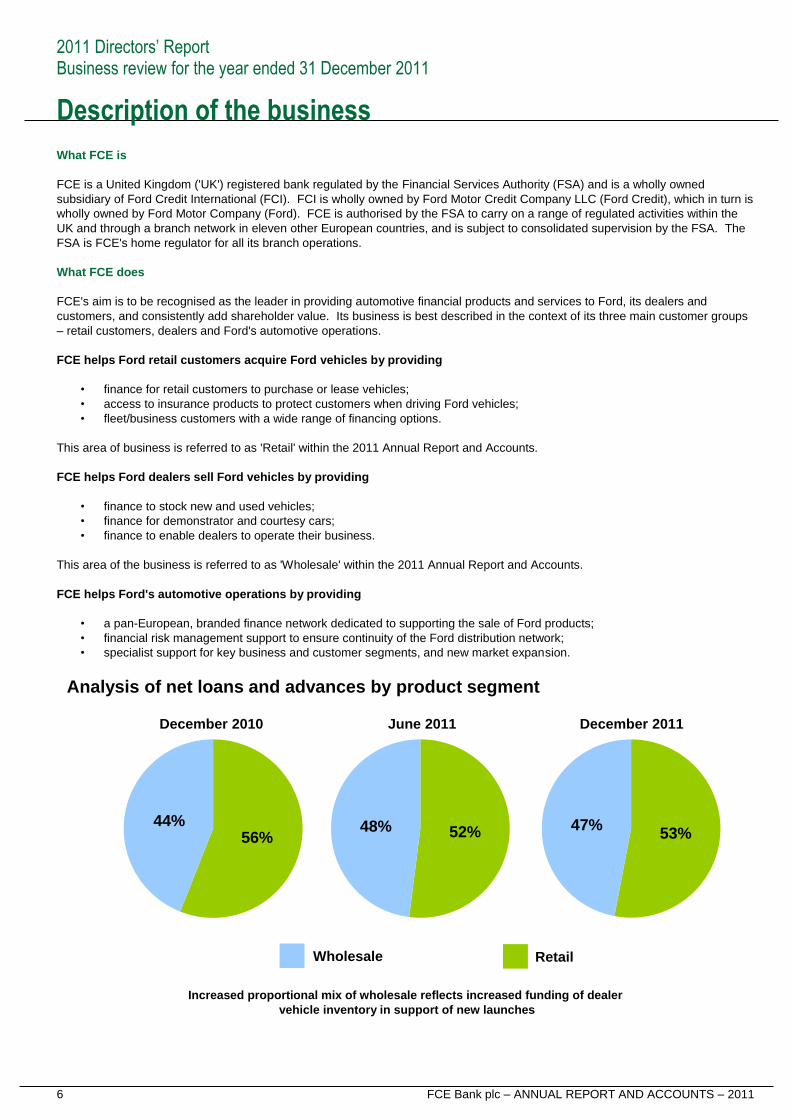
Increased proportional mix of wholesale reflects increased funding of dealer
vehicle inventory in support of new launches
53%47%
December 2011
52%48%
June 2011
56%44%
December 2010
Analysis of net loans and advances by product segment
Wholesale Retail
2011 Directors’ Report Business review for the year ended 31 December 2011
FCE Bank plc – ANNUAL REPORT AND ACCOUNTS – 2011 7
Description of the business
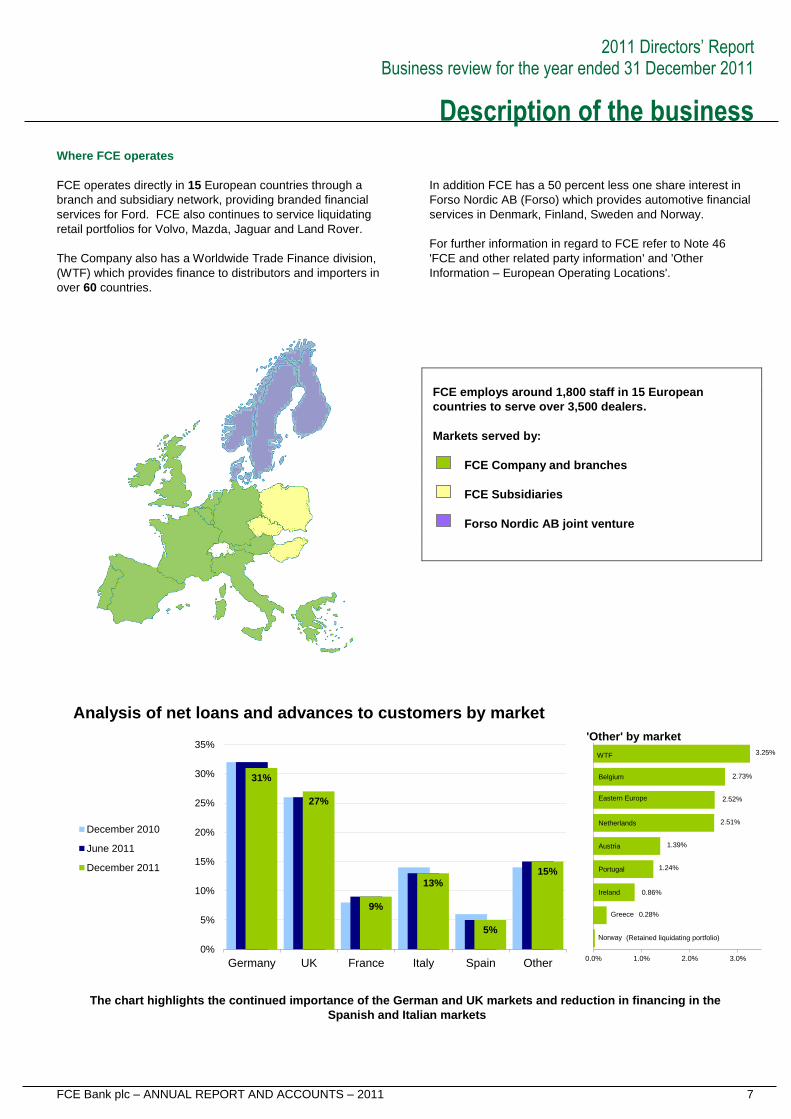
Where FCE operates
FCE operates directly in 15 European countries through a
branch and subsidiary network, providing branded financial
services for Ford. FCE also continues to service liquidating
retail portfolios for Volvo, Mazda, Jaguar and Land Rover.
The Company also has a Worldwide Trade Finance division,
(WTF) which provides finance to distributors and importers in
over 60 countries.
In addition FCE has a 50 percent less one share interest in
Forso Nordic AB (Forso) which provides automotive financial
services in Denmark, Finland, Sweden and Norway.
For further information in regard to FCE refer to Note 46
'FCE and other related party information' and 'Other
Information – European Operating Locations'.
FCE employs around 1,800 staff in 15 European
countries to serve over 3,500 dealers.
Markets served by:
FCE Company and branches
FCE Subsidiaries
Forso Nordic AB joint venture
The chart highlights the continued importance of the German and UK markets and reduction in financing in the
Spanish and Italian markets
31%
27%
9%
13%
5%
15%
0%
5%
10%
15%
20%
25%
30%
35%
Germany UK France Italy Spain Other
December 2010
June 2011
December 2011
Analysis of net loans and advances to customers by market
Norway
Greece
Ireland
Portugal
Austria
Netherlands
Belgium
0.0% 1.0% 2.0% 3.0%
'Other' by market
Eastern Europe
WTF
(Retained liquidating portfolio)
0.28%
0.86%
1.24%
1.39%
2.51%
2.52%
2.73%
3.25%
2011 Directors’ Report Business review for the year ended 31 December 2011
8 FCE Bank plc – ANNUAL REPORT AND ACCOUNTS – 2011
Strategy
FCE's principal objectives are to support the sale of Ford
vehicles and return value to its shareholder. A controlled
increase in FCE's share of Ford's sales will assist in
offsetting the continued contraction of FCE's balance sheet
as the non-Ford receivables liquidate. These objectives
provide the overriding guidance for FCE's actions and
decisions, and are implemented with a focus on its three
main customer groups.
The retail customer
FCE's business model goes beyond simply providing access
to finance for customers to purchase or lease a motor vehicle.
FCE strives to enable the customer to replace his or her
vehicle as often as they would like, while maintaining
affordable monthly payments. The customer benefits from
the convenience of arranging finance and insurance in the
dealership, and from the superior service provided by an
organisation dedicated to treating customers with fairness
and respect. FCE remains focused on improving the
customer ownership experience by developing new services
including its customer-facing online presence in major
locations.
The dealer
FCE's delivery of a high quality customer service combined
with the right finance product for the customer drives greater
loyalty to the brand and the dealer. Market research over
different countries and sectors consistently shows that FCE
customers are significantly more likely to purchase their next
vehicle from the same dealer. The dealer also benefits from
FCE's support for its business across a range of financing
needs, and is reassured in the knowledge that FCE has
supported the dealer network consistently for nearly 50 years
through the ups and downs of each economic cycle.
Ford automotive operations
The combination of highly satisfied and loyal customers with
consistent financial support for the entire dealer network
provides Ford with the knowledge that its customers and its
distribution networks are in safe hands. As FCE's
automotive partner, Ford also benefits from a finance
company that understands its marketing and sales activities,
and provides the right finance and insurance services
throughout the vehicle life cycle.
Strategic enablers
Operational effectiveness
FCE has continued to derive efficiencies by simplifying its
business processes and through standardising core
information technology (IT) platforms. This enables it to
minimise the number of unique IT systems in core activities.
The Company operates centralised service centres in the
majority of locations and shares best practices across
Europe and globally to drive continuous improvements. FCE
continues to develop and implement the optimal operational
model to deliver a sustainable and successful business that
will deliver FCE's strategy while improving customer service
and owner loyalty.
People
A drive for high performing people and teams is a foundation
of FCE's strategy. This is detailed within the 'People' section
on page 24.
Funding efficiency
FCE‟s funding strategy is to maintain sufficient liquidity to
meet short-term funding obligations by having a substantial
cash balance, committed funding capacity, and access to
diverse funding sources that are cost effective. This is
detailed within the 'Capital and Funding' section on page 16.
Strategic partnerships
FCE continues to review its operations to identify alternative
business structures and strategic alliances to strengthen its
customer value proposition and generate incremental fee-
based income.
Governance and control
FCE considers effective corporate governance as a key
factor underlying the strategies and operations of the Group.
This is detailed within the 'Key Governance Principles'
section on page 29.
Risk management
FCE has extensive risk management experience gathered
over several economic cycles. Its focus is on internally
leveraging and strengthening Ford Credit's global risk skills.
This is detailed within the 'Risk' section on page 20.

2011 Directors’ Report Business review for the year ended 31 December 2011
FCE Bank plc – ANNUAL REPORT AND ACCOUNTS – 2011 9
Performance summary Business environment
Despite the weakening of the economic environment in
several European markets, the ongoing debt crisis and
continued uncertainty surrounding the future of the Euro-
zone, FCE has successfully funded its business and
continued to support the sale of Ford vehicles in 2011.
Although the funding environment remains challenging, FCE
has been able to successfully execute its funding strategy
and both FCE and its parent experienced improved credit
ratings during the period.
Consistent application of FCE‟s embedded risk management
practices has delivered historical low credit losses, despite
the difficult economic conditions in many markets.
Following the transition of Jaguar, Land Rover, Mazda and
Volvo financing business to other providers, FCE has
successfully implemented its strategy to focus on financing
Ford vehicles, achieving its aim of growing its share of that
business during 2011.
FCE continues, however, to take steps to maintain a
competitive cost structure and during 2011, FCE
implemented further restructuring actions to continue to align
its European operations to match the scale of the business.
Sales
Overall, total Western European industry sales in 2011
remain in line with those seen in 2010. This reflects the
continued weakening of the economic environment in
Southern Europe as a result of the ongoing debt crisis and
the corresponding impact on consumer sentiment and
disposable income, offset by growth in other Western
European markets, primarily Germany.
The increase in FCE sales of new and used retail and lease
contracts primarily reflects FCE‟s increased penetration into
Ford sales.
Customer satisfaction
Customer satisfaction is monitored through sample market
research covering a range of questions. Customer
Satisfaction Index (CSI) and Dealer Satisfaction Index (DSI)
reflect the percentage of those customers and dealers who
are completely or very satisfied with their experience in
dealing with FCE. The metrics are used internally to drive
appropriate improvements in FCE's service as a key
contributor to further improving customer loyalty.
The 2011 results show continued improvement, particularly
in DSI, as FCE‟s realises the benefits from its investment in
customer-facing online services and new technologies for
Ford dealers.
FCE‟s strategy is to continue to focus its efforts on this key
area to ensure it delivers increased value to its customers
and achieves its objective of achieving growth through
increased penetration into a smaller market.
Sales results
Automotive sales in Western Europe (vehicles mils.) 15.3 15.3
Ford share of Western Europe car market 8.3% 8.4%
FCE new contracts as a percentage of Ford sales 29.8% 26.4%
FCE sales of new and used retail/lease contracts (000's) 443 406
2011 2010
Satisfaction Indices
Customer Satisfaction Index (CSI) 87% 85%
Dealer Satisfaction Index (DSI) 95% 89%
2011 2010
2011 Directors’ Report Business review for the year ended 31 December 2011
10 FCE Bank plc – ANNUAL REPORT AND ACCOUNTS – 2011
Performance summary Profitability
Profit before tax
FCE's total profit before tax (PBT) in 2011 decreased by £60
million compared to the previous year.
PBT includes a number of exceptional items (significant items
which by virtue of their size or incidence are separately
disclosed to aid the interpretation of performance compared to
the prior year), fair value adjustments to financial instruments
and foreign exchange adjustments.
The exceptional items in 2011 reflect an expense incurred
under a portfolio sale agreement and income received under a
historical profit sharing agreement. The 2010 exceptional items
primarily reflect restructuring actions and a discrete voluntary
pension contribution payment. For further details refer to Note
9 „Profit before tax‟.
FCE‟s policy is to minimise exposure to operating results
from changes in interest rates and currency exchange rates.
Derivatives are used to manage these risks. As a matter of
policy, FCE does not use derivatives for speculative
purposes. Fair value adjustments to financial instruments
and foreign exchange adjustments are therefore excluded
from PBT.
Excluding the exceptional items, fair value adjustments, and
foreign exchange adjustments, FCE's adjusted PBT
decreased by £71 million. The following graph shows an
analysis of this year-over-year PBT movement by the main
causal factors.
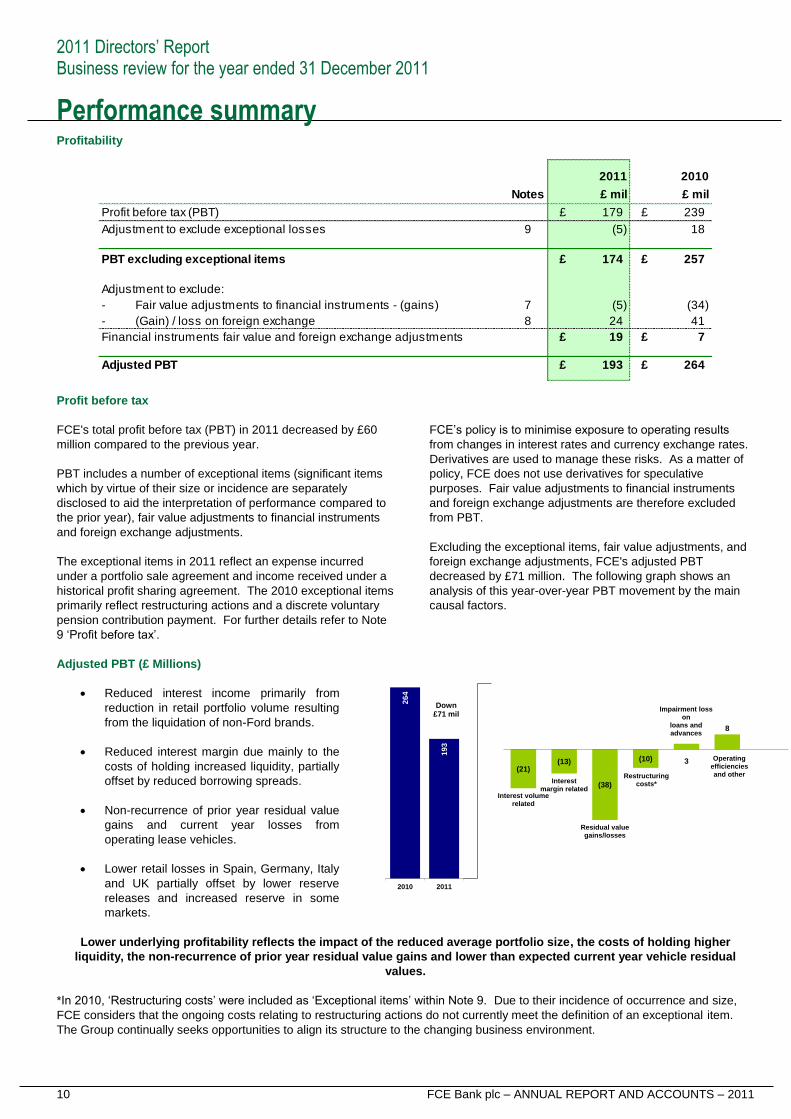
Adjusted PBT (£ Millions)
Reduced interest income primarily from
reduction in retail portfolio volume resulting
from the liquidation of non-Ford brands.
Reduced interest margin due mainly to the
costs of holding increased liquidity, partially
offset by reduced borrowing spreads.
Non-recurrence of prior year residual value
gains and current year losses from
operating lease vehicles.
Lower retail losses in Spain, Germany, Italy
and UK partially offset by lower reserve
releases and increased reserve in some
markets.
Lower underlying profitability reflects the impact of the reduced average portfolio size, the costs of holding higher
liquidity, the non-recurrence of prior year residual value gains and lower than expected current year vehicle residual
values.
*In 2010, „Restructuring costs‟ were included as „Exceptional items‟ within Note 9. Due to their incidence of occurrence and size,
FCE considers that the ongoing costs relating to restructuring actions do not currently meet the definition of an exceptional item.
The Group continually seeks opportunities to align its structure to the changing business environment.
Notes £ mil £ mil
Profit before tax (PBT) £ 179 £ 239
Adjustment to exclude exceptional losses 9 (5) 18
PBT excluding exceptional items £ 174 £ 257
Adjustment to exclude:
- Fair value adjustments to financial instruments - (gains) 7 (5) (34)
- (Gain) / loss on foreign exchange 8 24 41
Financial instruments fair value and foreign exchange adjustments £ 19 £ 7
Adjusted PBT £ 193 £ 264
2011 2010
264
193
2010 2011
Interest volume related
Interestmargin related
Residual value gains/losses
Restructuring costs*
Impairment loss on
loans and advances
(21)(13)
(38)
(10)
8
Operating efficiencies and other
3
Down£71 mil
2011 Directors’ Report Business review for the year ended 31 December 2011
FCE Bank plc – ANNUAL REPORT AND ACCOUNTS – 2011 11
Performance summary
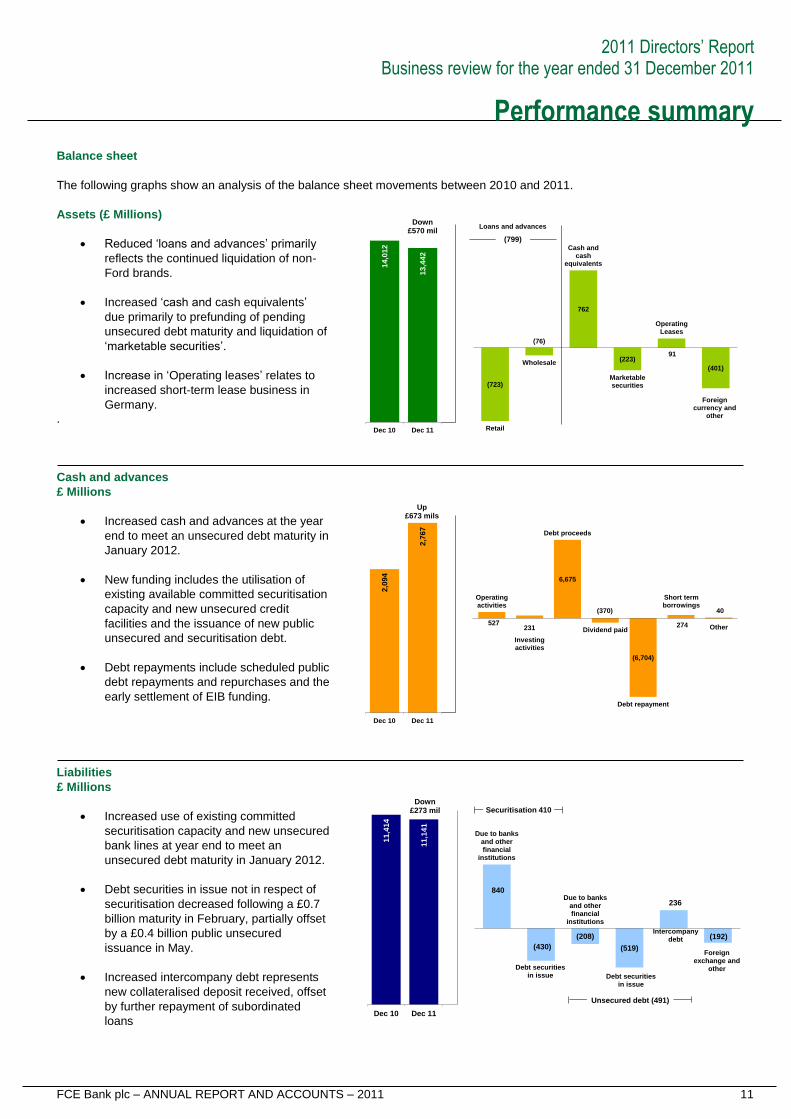
Balance sheet
The following graphs show an analysis of the balance sheet movements between 2010 and 2011.
Assets (£ Millions)
Reduced „loans and advances‟ primarily
reflects the continued liquidation of non-
Ford brands.
Increased „cash and cash equivalents‟
due primarily to prefunding of pending
unsecured debt maturity and liquidation of
„marketable securities‟.
Increase in „Operating leases‟ relates to
increased short-term lease business in
Germany.
.
Cash and advances
£ Millions
Increased cash and advances at the year
end to meet an unsecured debt maturity in
January 2012.
New funding includes the utilisation of
existing available committed securitisation
capacity and new unsecured credit
facilities and the issuance of new public
unsecured and securitisation debt.
Debt repayments include scheduled public
debt repayments and repurchases and the
early settlement of EIB funding.
Liabilities
£ Millions
Increased use of existing committed
securitisation capacity and new unsecured
bank lines at year end to meet an
unsecured debt maturity in January 2012.
Debt securities in issue not in respect of
securitisation decreased following a £0.7
billion maturity in February, partially offset
by a £0.4 billion public unsecured
issuance in May.
Increased intercompany debt represents
new collateralised deposit received, offset
by further repayment of subordinated
loans
14,0
12
13,4
42
Dec 10 Dec 11 Retail
Wholesale
Cash andcash
equivalents
Marketable securities
Operating Leases
Foreign currency and
other
(723)
(76)
762
(223)91
(401)
Down£570 mil
Loans and advances
(799)
2,0
94
2,7
67
Dec 10 Dec 11
Operating activities
Investing activities
Debt proceeds
Dividend paid
Debt repayment
Short term borrowings
527231
6,675
(370)
(6,704)
274 Other
40
Up£673 mils
11,4
14
11,1
41
Dec 10 Dec 11
Due to banksand otherfinancial
institutions
Debt securitiesin issue
Due to banksand otherfinancial
institutions
Debt securities in issue
Foreign exchange and
other
840
(430)
(208)
(519)
236
(192)Intercompany
debt
Down£273 mil Securitisation 410
Unsecured debt (491)
2011 Directors’ Report Business review for the year ended 31 December 2011
12 FCE Bank plc – ANNUAL REPORT AND ACCOUNTS – 2011
Performance summary Key financial ratios
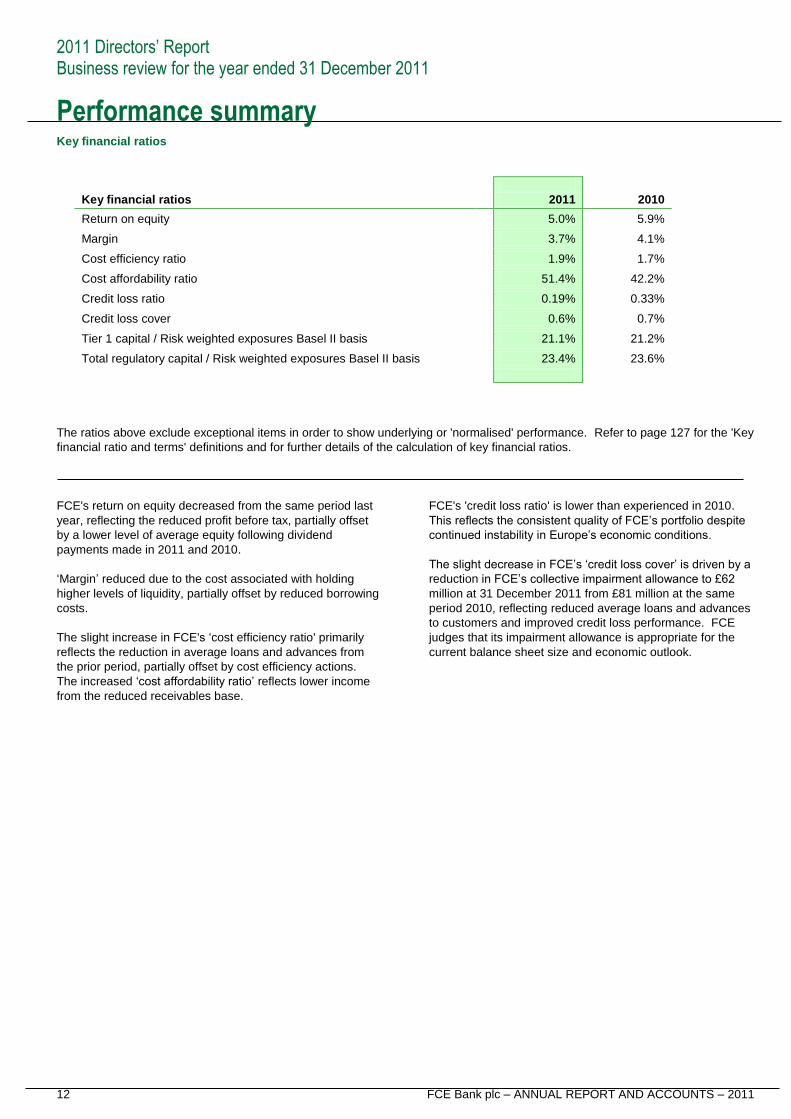
Key financial ratios 2011 2010
Return on equity 5.0% 5.9%
Margin 3.7% 4.1%
Cost efficiency ratio 1.9% 1.7%
Cost affordability ratio 51.4% 42.2%
Credit loss ratio 0.19% 0.33%
Credit loss cover 0.6% 0.7%
Tier 1 capital / Risk weighted exposures Basel II basis 21.1% 21.2%
Total regulatory capital / Risk weighted exposures Basel II basis 23.4% 23.6%
The ratios above exclude exceptional items in order to show underlying or 'normalised' performance. Refer to page 127 for the 'Key
financial ratio and terms' definitions and for further details of the calculation of key financial ratios.
FCE's return on equity decreased from the same period last
year, reflecting the reduced profit before tax, partially offset
by a lower level of average equity following dividend
payments made in 2011 and 2010.
„Margin‟ reduced due to the cost associated with holding
higher levels of liquidity, partially offset by reduced borrowing
costs.
The slight increase in FCE's „cost efficiency ratio' primarily
reflects the reduction in average loans and advances from
the prior period, partially offset by cost efficiency actions.
The increased „cost affordability ratio‟ reflects lower income
from the reduced receivables base.
FCE's 'credit loss ratio' is lower than experienced in 2010.
This reflects the consistent quality of FCE‟s portfolio despite
continued instability in Europe‟s economic conditions.
The slight decrease in FCE‟s „credit loss cover‟ is driven by a
reduction in FCE‟s collective impairment allowance to £62
million at 31 December 2011 from £81 million at the same
period 2010, reflecting reduced average loans and advances
to customers and improved credit loss performance. FCE
judges that its impairment allowance is appropriate for the
current balance sheet size and economic outlook.
2011 Directors’ Report Business review for the year ended 31 December 2011
FCE Bank plc – ANNUAL REPORT AND ACCOUNTS – 2011 13
Performance summary Ratios continued
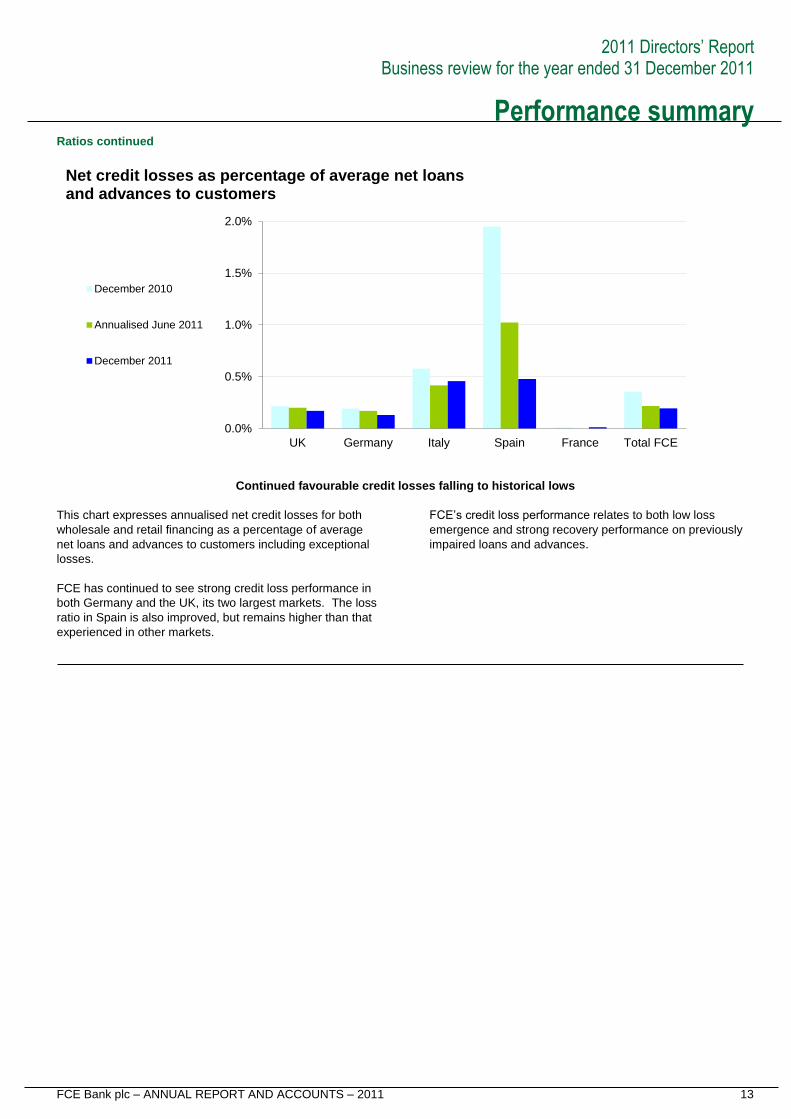
Continued favourable credit losses falling to historical lows
This chart expresses annualised net credit losses for both
wholesale and retail financing as a percentage of average
net loans and advances to customers including exceptional
losses.
FCE has continued to see strong credit loss performance in
both Germany and the UK, its two largest markets. The loss
ratio in Spain is also improved, but remains higher than that
experienced in other markets.
FCE‟s credit loss performance relates to both low loss
emergence and strong recovery performance on previously
impaired loans and advances.
0.0%
0.5%
1.0%
1.5%
2.0%
UK Germany Italy Spain France Total FCE
December 2010
Annualised June 2011
December 2011
Net credit losses as percentage of average net loans and advances to customers
2011 Directors’ Report Business review for the year ended 31 December 2011
14 FCE Bank plc – ANNUAL REPORT AND ACCOUNTS – 2011
Performance summary Future prospects
Vehicle industry volumes in Western Europe are expected to
decline in 2012 as economic momentum continues to slow
across most markets and the effects of economic uncertainty
impact negatively on consumer confidence.
FCE's contract volume growth is therefore likely to be
constrained despite maintaining high levels of penetration
into Ford vehicle sales.
As previously reported, Volvo, Mazda, Jaguar and Land
Rover have transitioned their financial services to alternative
providers. As at 31 December 2011, non-Ford branded
financing represents less than 2% of FCE's net loans and
advances to customers. The retail and lease portfolio will
continue to be serviced by FCE through to liquidation of the
respective contracts. FCE's revenue will reduce in
proportion to the decline in these loans and advances as
they liquidate.
At year-end 2012 FCE anticipates 'Net loans and advances
to customers' to be in the range of £9 billion to £11 billion.
FCE's 2012 funding plan includes unsecured term funding in
the range of £0.7 billion to £1.4 billion and a range of £0.3
billion to £0.7 billion in public term securitisation issuance.
FCE expects its secured debt to be in the range of 55% to
61% of net loans and advances to customers at 31
December 2012. Thereafter, FCE expects that this ratio will
decline.
FCE will continue to invest in order to support growth in its
share of Ford brand sales and in restructuring its operations
to match its smaller scale.
In 2012 FCE expects its 'Adjusted PBT' to be lower than that
experienced in 2011, reflecting reduced revenue from lower
average net loans and advances and the cost of maintaining
high levels of liquidity in response to potential future
economic uncertainty. These effects will be partially offset by
reduced borrowing costs due to the improved credit rating of
FCE and its parent.
FCE's plan is to gradually align its capital base with the
reduced scale of its business while taking account of the
funding and liquidity environment. Based on present
assumptions and subject to meeting its regulatory
requirements, FCE expects to pay a dividend in 2012 that is
marginally smaller than those paid in 2010 and 2011.
This future prospects statement is based on current expectations, forecasts and assumptions and involves a number of risks,
uncertainties, and other factors that could cause actual results to differ. FCE cannot be certain that any expectations, forecasts and
assumptions will prove accurate or that any projections will be realised. The statement is based on the best available data at the
time of issuance and will be updated upon publication of FCE's 2012 Q1 Management Statement. Other than this FCE does not
undertake to update or revise publicly any forward-looking statements, whether as a result of new information, future events or
otherwise.
2011 Directors’ Report Business review for the year ended 31 December 2011
FCE Bank plc – ANNUAL REPORT AND ACCOUNTS – 2011 15
Regulation Regulation
FCE maintains the appropriate regulatory authorisations and
permissions for the locations in which it operates. In the UK
FCE is authorised and regulated by the UK‟s sole regulator,
the FSA, to carry on a range of regulated activities - both
within the UK and throughout its European branch network.
FCE currently has branches in eleven other European
countries and is subject to consolidated supervision, through
varying EU directives, with the FSA being FCE's home state
regulator for all of its European branch operations. Each
location may then in-turn be subject to host state regulatory
requirements through local regulators and / or central banks.
In its role as home state regulator, the FSA seeks to maintain
market confidence, enhance financial stability, reduce
financial crime and secure an appropriate degree of
protection for consumers. The FSA supervises firms through
a variety of regulatory tools. These methods include the
collection of information from statistical and prudential
returns, reports obtained from skilled persons, visits to firms
and regular meetings with management.
The FSA adopts a risk-based approach to supervision. The
starting point for supervision of all financial institutions is a
systematic analysis of the risk profile for each authorised firm.
The FSA has adopted a homogeneous risk, processes and
resourcing model in its approach to its supervisory
responsibilities, known as the Advanced Risk Response
Operating Framework (ARROW) model, and the results of
the risk assessment are used by the FSA to develop a risk
mitigation programme for a firm. The FSA has requirements
for banks and other financial institutions to adhere to on
matters such as capital adequacy, limits on large exposures,
liquidity and conduct of business rules. Certain of these
requirements derive from European Union directives with
examples as described below.
In Europe, the UK regulatory agenda is considerably shaped
and influenced by the directives and proposals emanating
from the EU. A number of EU directives have been or are
currently being implemented, for example The Consumer
Credit Directive, The Insurance Mediation Directive and The
Capital Requirements Directive.
Regulators
In 2011, the UK government clarified its plans to move
regulatory authority from the Financial Services Authority
(FSA) to the Bank of England, under which the Prudential
Regulatory Authority (PRA) will provide prudential oversight
of banks and insurers and the Financial Conduct Authority
(FCA – successor body to the FSA) will provide oversight of
conduct and markets, along with the prudential regulation of
other financial firms. The change is scheduled to take effect
in 2013. FCE will become regulated by both bodies.
Internal Capital Adequacy Assessment Process
Annually the Board of Directors approves its Internal Capital
Adequacy Assessment Process (ICAAP) declaration and
submits the declaration to the FSA. The ICAAP rules require
management to recommend a total economic capital level
necessary to operate its business. Each assessment is
completed after careful analysis of FCE‟s primary risks, risk
mitigation, risk appetite, and stress testing and scenario
planning. Each ICAAP is reviewed at Audit Committee and
Board meetings. As required by Basel II Pillar 3, FCE
provides additional disclosures as part of the market
discipline requirements, including capital, risk exposures and
risk assessment processes. The disclosures are published
on FCE's website. FCE's website address is provided on
page 128.
Individual Liquidity Adequacy Assessment
Annually, since 2010, FCE has completed a Board approved
Individual Liquidity Adequacy Assessment (ILAA), which
documents FCE‟s approach to the management of liquidity
risk, including governance, reporting, stress testing,
contingency planning and liquidity requirements.
Recovery and Resolution Plan
FCE recognises the FSA‟s new requirement in 2012 to
develop a Recovery and Resolution Plan.
Basel III
The Basel Committee on Banking Supervision has
developed a comprehensive set of reform measures to
strengthen the regulation, supervision, and risk management
of the banking sector. Basel III outlines a number of
approaches to regulatory capital, risk alignment, liquidity and
charges. FCE is in the process of aligning its business to the
proposed changes.
Independent Commission on Banking (Vickers Report)
The UK government announced in 2011 its reforms to
improve the stability and competition within UK banking.
Known locally as the Vickers Report, it sets out
recommendations for the ring-fencing of retail operations
within UK banks from “riskier” activities such as investment
banking activities. FCE will undertake a watching brief
throughout 2012 and align business planning processes as
necessary.
2011 Directors’ Report Business review for the year ended 31 December 2011
16 FCE Bank plc – ANNUAL REPORT AND ACCOUNTS – 2011
Capital and funding Capital
FCE‟s policy is to manage its capital base to targeted levels
that exceed all regulatory requirements and support
anticipated changes in assets and foreign currency exchange
rates. FCE‟s core Tier 1 capital ratio was at 21.1% as of 31
December 2011 (31 December 2010: 21.2%).
FCE's consolidated regulatory capital is managed through its
monthly Asset and Liability Management Committee in which
actual and projected capital adequacy positions are
monitored against capital resource requirements as
determined by internal assessment (ICAAP) and minimum
regulatory levels.
FCE's solvency ratio is reported within FCE's Basel lI Pillar 3
disclosures and was 292% at 31 December 2011 (2010:
295%). The solvency ratio indicates that FCE is holding
capital in excess of its Basel II minimum capital requirements
as assessed under both Pillar 2 ICAAP and Pillar 1 minimum
capital requirements.
FCE remains well capitalised given its continued role as a
secured lender in the specialist automotive finance sector.
There was no change to the Company‟s issued share capital
during 2011. Regulatory capital is defined by tiers. FCE's
Tier 1 capital comprises shareholder funds, net of intangible
assets and goodwill. FCE's Tier 2 capital comprises
subordinated debt and collective impairment losses. As FCE
does not have a trading book, its capital structure does not
include any Tier 3 capital. For further details, refer to Note
33 'Components of capital'.
Funding
FCE's funding strategy is to have sufficient liquidity to
profitably support Ford, its dealers and customers in all
economic environments. FCE maintains a substantial cash
balance, committed funding capacity, and access to diverse
funding sources. FCE‟s credit ratings continued to improve
in 2011 with S&P now rating FCE at BBB-.
Securitisation continues to represent a substantial portion of
its funding mix given the cost advantage over unsecured
long-term funding. At 31 December 2011, secured debt was
56% of net loans and advances (2010: 47%). The mix of
secured debt was temporarily lower at year end 2010 as a
significant amount of FCE‟s liquidity was held in the form of
unutilized available committed securitisation capacity.
During 2011, and consistent with its funding plan, FCE raised
£2.1 billion of new funding, including a public unsecured debt
issuance and a public term securitisation transaction. FCE
also renewed or added £3.1 billion of private committed
securitisation capacity. Throughout 2011 FCE generally
experienced lower costs across the facilities renewed and
new lenders were added to its securitisation programmes.
Year-to-date through 22nd March 2012, FCE had renewed or added £1.0 billion of committed capacity, including programmes funding Italian and Spanish retail receivables. FCE does not have any securitisation programmes in Greece, Ireland or Portugal.
FCE continues to obtain limited funding from the European
Central Bank (ECB) under a longstanding credit claim
programme using certain of its German wholesale
receivables as collateral. For further details, refer to Note 25
„Due to banks and other financial institutions‟.
In addition, FCE has various alternative business
arrangements for select products and markets, such as
partnerships with various financial institutions for Full Service
Leasing (FSL) and retail and wholesale financing, which
reduce funding requirements while allowing continued
support to Ford. FCE continues to explore opportunities that
provide alternative sources of funding while ensuring ongoing
support for Ford vehicle sales.

2011 Directors’ Report Business review for the year ended 31 December 2011
FCE Bank plc – ANNUAL REPORT AND ACCOUNTS – 2011 17
Capital and funding Funding sources
FCE‟s funding sources consist primarily of securitisation and
unsecured debt. FCE issues both short and long-term debt
that is held primarily by institutional investors.
The Company securitises retail, leasing and wholesale
receivables through a variety of structures, including
amortising and revolving structures as well as other
committed factoring transactions. FCE aims for
diversification in its securitisation programmes, with about 25
active transactions providing term funding or committed
liquidity for each of its primary asset classes (retail and lease
contracts, wholesale loans) across a wide range of European
markets. With many years of experience in the securitisation
of its receivables, the Company has developed a strong
expertise and solid working relationships with partner banks
and in public markets.
All of FCE‟s securitisation programmes inherently provide for
matched funding of the receivables, with securitisation debt
having a maturity profile similar to the related receivables.
The majority of its programmes also include a contractual
commitment to fund existing and future receivables subject to
conditions described more fully in Note 18 'Securitisation and
related financing'. In the event that a contractual
commitment is not renewed, all receivables securitised at the
point of non-renewal remain funded, and the related debt is
repaid as the receivables liquidate.
The objective of FCE's securitisation programmes is solely to
provide sources of funding and liquidity. The Company
generally retains credit risk in securitisation transactions
through its retained interests which provide various forms of
credit enhancements. By providing these enhancements the
Company has entered into transfers (as described in IAS 39
'Financial Instruments Recognition and Measurement') that
do not qualify for de-recognition of the underlying assets.
The Company therefore continues to recognise the carrying
value of all securitised assets within its balance sheet.
FCE holds senior retained interests in several of its
programmes to provide greater flexibility in the use of its
committed securitisation capacity. As at 31 December 2011,
FCE maintained senior interests in these committed
securitisation programmes sufficient to generate £0.2 billion
in funding proceeds. Under these programmes, funding
counterparties are legally obligated, at FCE's option, to make
advances under asset-backed securities, thereby reducing
FCE's senior interest and generating funding proceeds.
Depending on the programmes, these senior interests may
be held as senior securities, which rank pro-rata and pari-
passu with the senior securities held by external investors, or
an amount by which FCE's retained interest exceeds its
contractual minimum retained interest.
(For further information see Note 18 'Securitisation and
related financing').
FCE‟s external unsecured debt consists primarily of notes
issued under its European Medium Term Note (EMTN)
programme. This debt is issued generally with original
maturities of 3-5 years, which exceeds the average expected
life of its receivables. FCE has limited amounts of short-term
unsecured funding consisting primarily of local bank
borrowings.
As at 31 December 2011, FCE had inter-company funding of
£0.9 billion which consisted primarily of collateralised
deposits held to mitigate large exposure concentrations, and
Tier 2 capital in the form of subordinated debt.
Net cash inflow from funding raised for the year ending 31 December 2011* is as detailed below:
*Cash inflow from funding activity net of movements in revolving securitisation transactions.
£ bil
Net Cash
New issuance Inflow
- Securitisation of retail and lease automotive receivables £ 1.1
- Securitisation of wholesale automotive receivables -
- Unsecured debt 1.0
Total new issuance £ 2.1
Existing facilities
- Securitisation of retail and lease automotive receivables £ 1.0
- Securitisation of wholesale automotive receivables 3.6
Total exisiting facilities £ 4.6
Total £ 6.7
31 Dec 2011Net Cash Inflow from funding raised for the year ending
2011 Directors’ Report Business review for the year ended 31 December 2011
18 FCE Bank plc – ANNUAL REPORT AND ACCOUNTS – 2011
Capital and funding Liquidity
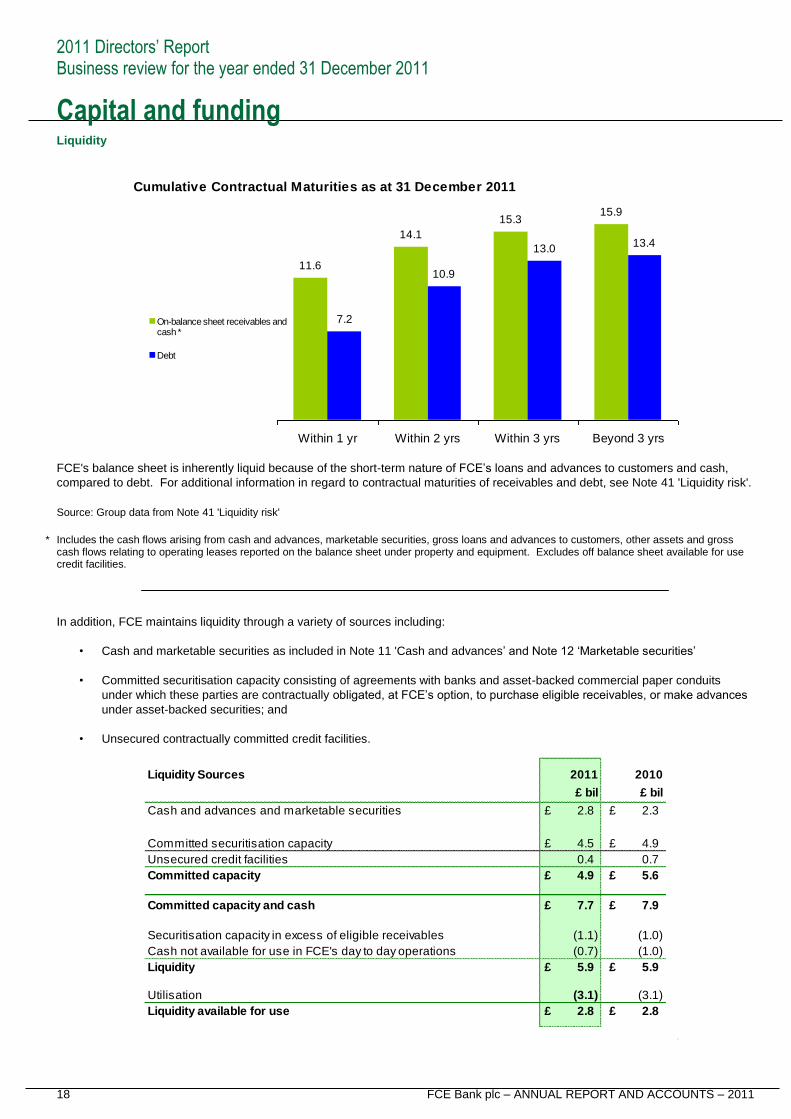
FCE's balance sheet is inherently liquid because of the short-term nature of FCE‟s loans and advances to customers and cash,
compared to debt. For additional information in regard to contractual maturities of receivables and debt, see Note 41 'Liquidity risk'.
Source: Group data from Note 41 'Liquidity risk'
* Includes the cash flows arising from cash and advances, marketable securities, gross loans and advances to customers, other assets and gross cash flows relating to operating leases reported on the balance sheet under property and equipment. Excludes off balance sheet available for use credit facilities.
In addition, FCE maintains liquidity through a variety of sources including:
• Cash and marketable securities as included in Note 11 'Cash and advances‟ and Note 12 „Marketable securities‟
• Committed securitisation capacity consisting of agreements with banks and asset-backed commercial paper conduits
under which these parties are contractually obligated, at FCE‟s option, to purchase eligible receivables, or make advances
under asset-backed securities; and
• Unsecured contractually committed credit facilities.
Cumulative Contractual Maturities as at 31 December 2011
11.6
14.1
15.315.9
7.2
10.9
13.013.4
Within 1 yr Within 2 yrs Within 3 yrs Beyond 3 yrs
On-balance sheet receivables andcash *
Debt
Liquidity Sources
£ bil £ bil
Cash and advances and marketable securities £ 2.8 £ 2.3
Committed securitisation capacity £ 4.5 £ 4.9
Unsecured credit facilities 0.4 0.7
Committed capacity £ 4.9 £ 5.6
Committed capacity and cash £ 7.7 £ 7.9
Securitisation capacity in excess of eligible receivables (1.1) (1.0)
Cash not available for use in FCE's day to day operations (0.7) (1.0)
Liquidity £ 5.9 £ 5.9
Utilisation (3.1) (3.1)
Liquidity available for use £ 2.8 £ 2.8
2011 2010
2011 Directors’ Report Business review for the year ended 31 December 2011
FCE Bank plc – ANNUAL REPORT AND ACCOUNTS – 2011 19
Capital and funding
Liquidity continued
The decrease in cash not available for use in FCE‟s day to day operations is primarily due to the lower level of cash reserves held in respect to securitisation. In June 2011, FCE entered into a new £440 million three year syndicated multi-currency unsecured credit facility. In connection with entering into the new facility, FCE terminated the majority of its existing bi-lateral contractual committed credit facilities and by 31 December 2011 all of this capacity was terminated. This facility contains certain covenants, including an obligation for FCE to maintain its ratio of regulatory capital to risk-weighted assets at no less than the applicable regulatory minimum, and for the support agreement between FCE and Ford Credit to remain in full force and effect (for more details of this support agreement, refer to Note 31 „Ordinary shares and share premium‟. In addition to customary payment, representation, bankruptcy, and judgment defaults, the facility contains cross-payment and cross-acceleration defaults with respect to other debt.
At 31 December 2011, £311 million was available for use with £129 million drawn during December 2011 as part of FCE‟s plans for periodic usage of the facility. Of the banks in FCE‟s securitisation and unsecured committed liquidity programmes, the substantial majority are domiciled in UK, France, North America and Germany. In anticipation of a scheduled unsecured debt maturity in January 2012 of £1.1 billion and the expected seasonal increase in assets during the first quarter, FCE held a high level of liquidity at year-end. As at 31 December 2011, committed capacity and cash and advances shown above totalled £7.7 billion, of which £5.9 billion could be utilised (after adjusting for capacity in excess of eligible receivables of £1.1 billion and cash not available for use in day-to-day operations of £0.7 million). Of this amount, £3.1 billion was utilised, leaving £2.8 billion available for use. In addition to this, the £1.1 billion of securitisation capacity in excess of eligible receivables provides flexibility in funding future originations, or shifting capacity to different markets and asset classes.
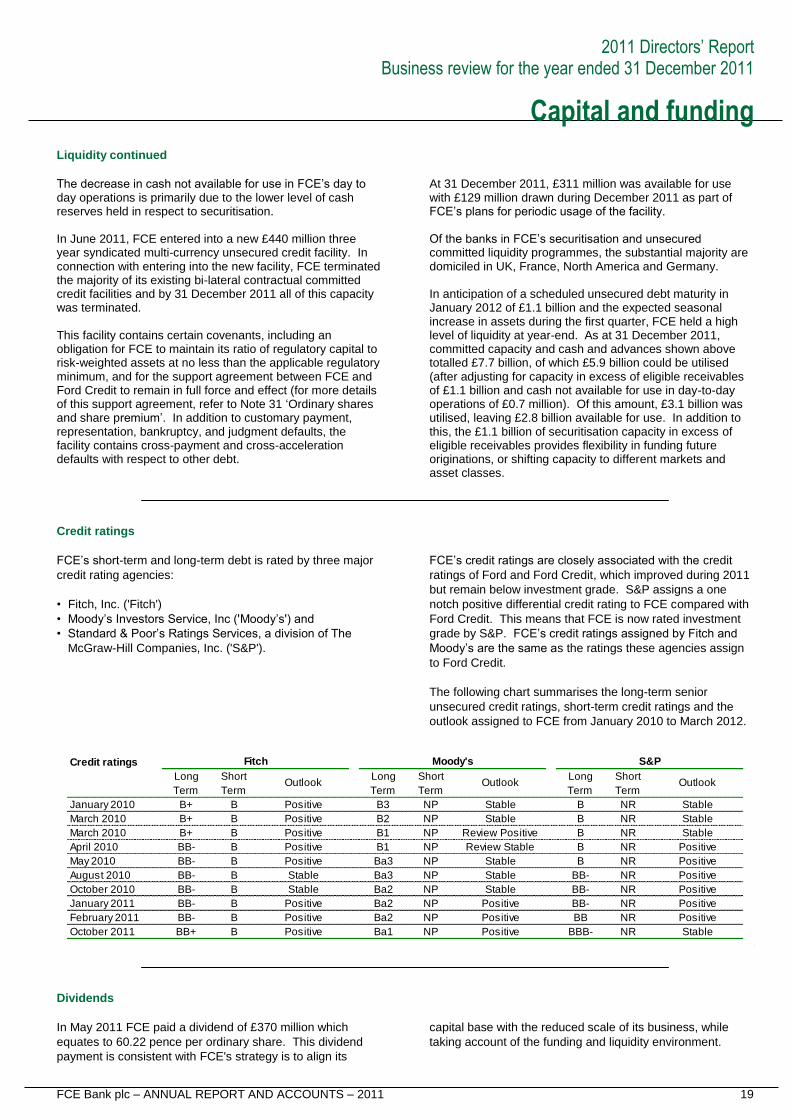
Credit ratings
FCE‟s short-term and long-term debt is rated by three major
credit rating agencies:
• Fitch, Inc. ('Fitch')
• Moody‟s Investors Service, Inc ('Moody‟s') and
• Standard & Poor‟s Ratings Services, a division of The
McGraw-Hill Companies, Inc. ('S&P').
FCE‟s credit ratings are closely associated with the credit
ratings of Ford and Ford Credit, which improved during 2011
but remain below investment grade. S&P assigns a one
notch positive differential credit rating to FCE compared with
Ford Credit. This means that FCE is now rated investment
grade by S&P. FCE‟s credit ratings assigned by Fitch and
Moody‟s are the same as the ratings these agencies assign
to Ford Credit.
The following chart summarises the long-term senior
unsecured credit ratings, short-term credit ratings and the
outlook assigned to FCE from January 2010 to March 2012.
Dividends
In May 2011 FCE paid a dividend of £370 million which
equates to 60.22 pence per ordinary share. This dividend
payment is consistent with FCE's strategy is to align its
capital base with the reduced scale of its business, while
taking account of the funding and liquidity environment.
Credit ratings
Long Short Long Short Long Short
Term Term Term Term Term Term
January 2010 B+ B Positive B3 NP Stable B NR Stable
March 2010 B+ B Positive B2 NP Stable B NR Stable
March 2010 B+ B Positive B1 NP Review Positive B NR Stable
April 2010 BB- B Positive B1 NP Review Stable B NR Positive
May 2010 BB- B Positive Ba3 NP Stable B NR Positive
August 2010 BB- B Stable Ba3 NP Stable BB- NR Positive
October 2010 BB- B Stable Ba2 NP Stable BB- NR Positive
January 2011 BB- B Positive Ba2 NP Positive BB- NR Positive
February 2011 BB- B Positive Ba2 NP Positive BB NR Positive
October 2011 BB+ B Positive Ba1 NP Positive BBB- NR Stable
Fitch Moody's S&P
Outlook Outlook Outlook
2011 Directors’ Report Business review for the year ended 31 December 2011
20 FCE Bank plc – ANNUAL REPORT AND ACCOUNTS – 2011
Risk Risk appetite
FCE‟s risk appetite is set by its Board of Directors and is
clearly defined, monitored and managed through its Risk
Appetite Framework. FCE has established dynamic and
formalised processes for the identification of the risks that it
faces. FCE manages each form of risk uniquely in the
context of its contribution to overall risk. Business decisions
are evaluated on a risk aware and risk adjusted basis and
are priced consistent with these risks.
FCE is exposed to several types of risk. The key risks
identified at present include liquidity, concentration,
operational, vehicle residual value, group and credit (retail
and wholesale) risks. These are described in more detail
below.
FCE‟s Risk Appetite Framework is integrated within the
Governance structure of FCE and informs the day-to day risk
management processes/policies which minimise the risk of
unexpected losses. FCE conducts close monitoring of the
risks in line with its defined risk appetite, and applies strong,
proactive risk mitigating actions and controls which have
been developed based on nearly 50 years of experience in
the specialist field of automotive sector lending.
FCE takes a, primarily, secured asset lending approach in
order to minimise the risk of unexpected losses. FCE
continuously reviews and seeks to improve its risk
management practices in line with industry best practices.
Principal risks and uncertainties
In addition to the risks faced by FCE in the normal course of
business, some risks and uncertainties are outside FCE's
direct control. This section outlines specific areas where
FCE is particularly sensitive to such risks.
The credit ratings of FCE and Ford Credit have been closely
associated with the rating agencies‟ opinions of Ford. Lower
credit ratings generally result in higher borrowing costs and
reduced access to capital markets. The Company has the
benefit of a support agreement from Ford Credit. This is
detailed within Note 31 'Ordinary shares and share premium'.
In addition, FCE has the benefit of:
• access to on-lent debt from Ford, Ford Credit and Ford
Credit International (FCI) from time to time; and
• interest supplements and other support payments from
Ford provided for certain financing transactions.
The elimination, reduction or non-availability of support from
Ford Credit or Ford could negatively impact FCE‟s business
and results of operations.
FCE must compete effectively with other providers of finance
in Europe. Ford in Europe currently provides a number of
marketing programmes that employ financing incentives to
generate increased sales of vehicles. These financing
incentives generate significant business for FCE. If Ford
chose to shift the emphasis from such financing incentives,
this could negatively impact FCE's share of financing related
to Ford's automotive brand vehicles.
FCE's business has transitioned from a multi-brand
organisation to a focus on supporting the Ford brand as the
Jaguar, Land Rover, Mazda and Volvo brands have been
transferred to alternative finance providers over the last three
years. This has required FCE to focus on and implement
cost reduction actions to adjust for the change in scale.
Liquidity risks and capital resources
Liquidity risk is the possibility of being unable to meet present
and future financial obligations as they become due. FCE‟s
funding strategy is to focus on diversification of funding
sources, and investors, to manage liquidity risk in all market
conditions. FCE is funded, primarily through securitisation,
unsecured debt and equity, with debt that, on average,
matures later than assets liquidate.
FCE holds liquidity in the form of cash, marketable securities,
and committed capacity. FCE‟s committed capacity is in the
form of committed securitisation capacity (which is free of
material adverse change clauses, restrictive financial
covenants and credit rating triggers – note 18 provides more
details), and contractually committed unsecured credit
facilities (which has similar terms with the exception of
certain covenants, Note 41 provides more detail).
FCE has an automated liquidity reporting system, and
manages liquidity risk around key liquidity risk drivers.
Processes embedded in FCE‟s governance include liquidity
forecasting and reporting against risk tolerances,
stress/scenario testing and contingent planning. FCE‟s
Board of Directors recognise that liquidity may be affected by
the following factors (not necessarily listed in order of
importance or probability of occurrence):
• Credit ratings assigned to FCE;
• Prolonged disruption of financial markets;
• Global capital market volatility;
• Market capacity for Ford, Ford Credit and FCE sponsored
investments;
2011 Directors’ Report Business review for the year ended 31 December 2011
FCE Bank plc – ANNUAL REPORT AND ACCOUNTS – 2011 21
Risk Liquidity risks and capital resources continued
• General demand for the type of securities FCE offer,
including ability to access central banks and government
funding;
• The Company's ability to continue funding through asset-
backed financing structures;
• Performance of the underlying assets within the existing
asset-backed financing structures;
• Regulatory changes;
• FCE's ability to maintain credit facilities and renew
committed liquidity programmes; and
• FCE's ability to obtain derivatives to manage risk.
Concentration risk
Concentration risk is the risk resulting from concentrated
exposures to counterparties, specific country markets,
particular products or business segments as well as the
automotive sector as a whole. It's the company's opinion
that there are significant mitigating factors to the
concentration risks that it faces. FCE is internationally active
and seeks to maximise geographical diversity whilst ensuring
that its lending is predominantly in countries with an
investment grade credit rating. FCE‟s largest markets are
Germany (Europe's largest automotive market) and the UK
(FCE's home market).
On a monthly basis FCE monitors the distribution, by country
and product, of its total financing to dynamically enable
adjustments to be made in line with its risk appetite. Within
each country where it operates FCE‟s lending is
geographically dispersed consistent with the nationwide
nature of representation of the Ford vehicle sales and service
network.
FCE‟s consumer financing portfolio is inherently granular in nature and this combined with its detailed knowledge of the respective markets and its long and comprehensive experience within automotive financing provides strong mitigation to concentration risks that may otherwise arise.
Counterparty exposures are closely monitored and managed
through a series of processes depending on counterparty
type and associated risk.
Operational risk
Operational risk is the risk of loss resulting from inadequate
or failed internal processes, people or systems, or from
external events. This definition of operational risk captures
events such as Information Technology problems, human
error and shortcomings in the organisational structure, legal
changes and lapses in internal controls, fraud or external
threats.
FCE takes a proactive approach to operational risk
management and continues to seek enhancement
opportunities within its Operational Risk Framework. FCE
follows the principles of the “Three Lines of Defence” model
for the management of operational risk. Business line
management form the first line. Compliance, Operational
Risk and Internal Controls Office are the second line.
General Audit Office comprise the third line.
The Executive Operational Risk Committee (ORC) has
responsibility for reviewing and monitoring major operational
risks and for promoting the use of sound operational risk
management across FCE. The main areas of focus for the
ORC are the implementation of appropriate policies,
processes and procedures to control or mitigate material
exposure to losses, and the maintenance of suitable
contingency arrangements for all areas to ensure that FCE
can continue to function in the event of an unforeseen
interruption.
A guiding principle is that management at all levels is
responsible for managing operational risks. FCE also
maintains a strong internal control culture across the
organisation through the Modular Control Review
Programme, a self-assessment control process used by the
locations, which is reinforced by central controls from the
Internal Control Office (ICO) and Ford's General Auditors
Office (GAO). This is detailed within the 'Audit Committee
Report' section of the 2011 Business Review.
FCE is indemnified under insurance policies for certain
operating risks including health and safety. Notwithstanding
these control measures and this insurance coverage, FCE
remains exposed to operational risk that could negatively
impact its business and results of operations.
Vehicle residual value risk
This is the risk that the actual proceeds realised by FCE
upon the sale of a returned vehicle at the end of the contract
will be lower than that forecast at the beginning of the
contract. FCE is prepared to incur vehicle residual value risk,
predominantly in respect of Ford brand automobiles, as a key
factor in its product offerings and its strategic desire to
promote Trade Cycle Management (TCM) concepts. Vehicle
residual values are set based on a careful evaluation of
internal and external data sources and subject to review and
approval by the appropriate committee.
2011 Directors’ Report Business review for the year ended 31 December 2011
22 FCE Bank plc – ANNUAL REPORT AND ACCOUNTS – 2011
RiskVehicle residual value risk continued
They are set at the expected future value of the vehicles
however for TCM contracts (which are the vast majority of
contracts for which FCE accepts vehicle residual value risk)
the values are typically set below expected market value by
an amount equal to 5-8% of the vehicle's list price in order to
generate equity for the customer at the end of the contract.
This prudent approach to establishing vehicle residual values,
along with other proven mitigators, reduces the potential
volatility from this risk.
For further details refer to Note 39 'Vehicle residual values'.
Group risk
This is the risk of loss due to FCE‟s association with its
parent company. As a captive Automotive Finance Company,
FCE has an inherent exposure to Ford Motor Company,
however this is carefully monitored through FCE‟s Large
Exposure monitoring process and minimised through strong
adherence to internal policies which ensure an arms-length
approach to all transactions/services with the parent. FCE
leverages some services provided by other areas of the
wider Ford Credit and Ford corporate organisation; however,
these services are governed and regulated by robust,
documented, internal service level agreements and typically
provide for ring fenced capabilities.
Pension risk
This is the risk that arises from FCE‟s obligations as a result
of supporting Pension schemes for its employees in
particular the defined benefit scheme operated in the UK.
The company operates, in conjunction with Ford, a UK
defined benefit plan and it recognises there is inherent
volatility in the investment markets that will affect the
liabilities of the scheme at any point in time and that the
pension liabilities increase over time as longevity
assumptions extend and active workforce / pensioner
balance matures.
FCE uses internal and external auditors to provide
independent views of the pension liabilities and transparent
communication of this and regulation oversight ensures
corporate awareness is maintained at Board and Executive
Management level.
FCE, in conjunction with Ford, leverage in house US based
pensions management expertise to assist with
recommendations to the Pension Fund Trustee on
investment strategy and liability management. Contributions
by FCE to reduce any deficit are made over a time frame
agreed with the Pension Fund Trustee.
Credit risk
As a provider of automotive financial products, FCE's primary
source of credit risk is the possibility of loss from a retail
customer's or dealer's failure to make payments according to
contract terms.
Although credit risk has a significant impact on FCE's
business, it is mitigated by the majority of FCE's retail,
leasing and wholesale financing plans having the benefit of a
title retention plan or a similar security interest in the financed
vehicle. In the case of customer default the value of the re-
possessed collateral provides a source of protection. FCE
actively manages the credit risk on retail and commercial
portfolios to balance the levels of risk and return.
Retail (Consumer and Commercial) credit risk
management
Retail products (vehicle instalment sale, hire purchase and
conditional sale and lease contracts) are classified by term
and whether the vehicle financed is new or used. This
segmentation is used to assist with product pricing to ensure
risk factors are appropriately considered.
Retail consumer credit underwriting typically includes a credit
bureau review of each applicant together with an internal
review and verification process. Statistically based retail
credit risk rating models are typically used to determine the
creditworthiness of applicants. Portfolio performance is
monitored regularly and FCE's originations processes and
models are reviewed, revalidated and recalibrated as
necessary. Retail credit loss management strategy is based
on extensive historical experience.
FCE also provides automotive financing for commercial
entities, including daily rental companies. Each commercial
lending request is carefully evaluated based on the
information requested and supported by credit bureau data
wherever available.
In the majority of locations FCE operates centralised
originations, servicing and collections activities.
Centralisation offers economies of scale and enhances
process consistency. The UK and Germany customer
service centres employ advanced servicing technology and
enhanced risk management techniques and controls. These
include customer behavioural models that are used in
contract servicing to ensure contracts receive appropriate
collection attention.
Repossession is considered a last resort. A repossessed
vehicle is sold and proceeds are applied to the amount owing
on the account. Collection of the remaining balance
continues after repossession until the account is paid in full
or is deemed by FCE to be economically uncollectable.
2011 Directors’ Report Business review for the year ended 31 December 2011
FCE Bank plc – ANNUAL REPORT AND ACCOUNTS – 2011 23
RiskWholesale credit risk management
FCE extends commercial credit to franchised dealers selling
Ford vehicles primarily in the form of approved credit facilities
to purchase stocks of new and used vehicles and financing
for dealer vehicles (e.g. demonstrator or courtesy vehicles)
and to a much lesser extent, loans for working capital and
property acquisitions.
Each wholesale lending request is evaluated, taking into
consideration the borrower‟s financial condition, supporting
security, debt servicing capacity, and numerous other
financial and qualitative factors.
All credit exposures are scheduled for review at least
annually at the appropriate credit committee. Asset
verification processes are in place and include physical
audits of vehicle stocks with increased audit frequency for
higher risk dealers. In addition, stock-financing payoffs are
monitored to detect adverse deviations from typical payoff
patterns, in which case appropriate actions are taken.
Other credit risk management
The Company could also incur a credit loss if the
counterparty to an investment, interest rate or foreign
currency derivative with FCE defaults.
For further detail on these risks refer to Note 38 'Credit risk'.
2011 Directors’ Report Business review for the year ended 31 December 2011
24 FCE Bank plc – ANNUAL REPORT AND ACCOUNTS – 2011
People FCE aims to be an employer of choice and has a strong
focus on developing employees together with a retention
strategy to ensure that the skills and experience required to
support business objectives are retained. FCE‟s people
strategy includes the use of Personnel Development
Committees to support the recruitment and development of
employees and ensure effective succession planning for key
roles, and a remuneration and benefits philosophy targeted
at achieving overall competitiveness with the external market,
rewarding contribution to FCE's performance and retaining
key skills. Completion of annual individual development
plans for all employees identifies training and development
needs priorities, including Treating Customers Fairly,
Compliance and Risk Management.
FCE is committed to diversity in the workplace. This
approach values the differences provided by culture, ethnicity,
race, gender, disability, nationality, age, religion/beliefs,
education, experience and sexual orientation. FCE uses the
views of employees to improve processes and to foster a
culture based on honesty and respect.
Applications for employment by persons with a disability are
always fully considered, bearing in mind the aptitudes of the
applicant concerned. In the event of members of staff
becoming disabled every effort is made to ensure that their
employment with FCE continues and that appropriate
support is arranged. It is FCE's policy that the training,
career development and promotion of persons with a
disability should, as far as possible, be identical with that of
other employees.
Consistent with the principle of diversity, FCE also operates
a Dignity at Work policy which promotes a business
environment where employees, customers and suppliers are
valued for themselves and their contribution to the business.
FCE is committed to conducting its business with integrity
and utilising the talents of everyone through providing an
environment free from unlawful discrimination, harassment,
bullying and victimisation.
Employee communication
FCE keeps all employees informed of its activities on a
national, pan-European and global level by means of in-
house publications, intranet and the publication of its external
reports and financial statements. FCE conducts an annual
employee satisfaction survey with a feedback and action-
planning process aimed at continued dialogue between
management and staff to achieve appropriate levels of
employee satisfaction. In addition senior management
conducts regular cascade meetings throughout the year with
employees. These allow management to communicate key
business information including the factors affecting the
financial and economic performance of FCE, whilst allowing
two-way dialogue via question and answer sessions on
business matters. FCE also fully complies with relevant
European and national legislation on information and
consultation procedures.
Employment practices
FCE complies fully with relevant legislation enacted by both
European and national parliaments on Human Resources
(HR) policy and process. FCE ensures that HR policies and
procedures meet the aims of any relevant FSA and other
national regulatory requirements. The Company is also
committed to best practice HR policies and processes in
support of the business objectives and in line with its
employer of choice strategy.
Employees
During 2011, as part of ongoing cost efficiency actions, FCE
has completed various voluntary employee redundancy
actions in its European operations. Details of the average
number of employees and related costs can be found in Note
5 'Operating expenses'.
Community
FCE has a long standing commitment to the communities
across Europe in which it works. This includes providing
some structured work experience programmes for young
people in its offices and encouraging FCE's employees to
give something back to their local community, both inside
and outside work time. Accordingly, FCE has a policy that all
employees can have up to 16 normal paid work hours per
annum (equivalent to two paid work days) to invest in
community projects.
2011 Directors’ Report Business review for the year ended 31 December 2011
FCE Bank plc – ANNUAL REPORT AND ACCOUNTS – 2011 25
People
Pensions
The Executive Directors and the majority of employees of the
Company are accruing benefits as members of various
retirement plans administered by Ford. This is detailed
within Note 34 'Retirement benefit obligations'.
Directors' and officers' liability insurance and indemnity
Ford has purchased insurance to cover its Directors and
officers for all its affiliates against such Directors and officers
costs in defending themselves in civil legal proceedings
taken against them in that capacity and in respect of
damages resulting from the unsuccessful defense of any
proceedings.
At the date upon which this report was approved, and
throughout the 2011 financial year, the Company has
provided an indemnity in respect of all its Directors. Neither
the insurance nor the indemnity provides cover where the
Director has acted fraudulently or dishonestly.
Remuneration policy
FCE meets the requirements of the FSA Remuneration Code
in all its aspects. FCE completes disclosure requirements in
accordance with the FSA's prudential sourcebook for banks,
building societies and investment firms (BIPRU 11.5.18).
Further details of FCE remuneration disclosure and policy
can be found at http://www.fcebank.com.
Health and safety
FCE is committed to ensuring the health, safety and welfare
of its employees and, so far as is reasonably practicable, to
providing and maintaining safe working conditions. FCE
regards legislative compliance as a minimum and where
appropriate it seeks to implement higher standards.
FCE also recognises its responsibilities towards all persons
on FCE's premises, such as contractors, visitors and
members of the public, and ensures, so far as is reasonably
practicable, that they are not exposed to risks to their health
and safety.
FCE operates a health and safety governance model tailored
to meet FCE's specific business needs and health and safety
risk profile.
The Executive Committee operates a management system
which tracks incidents and actions and promotes best
practice in health and safety throughout the organisation
including regular safety walks to supplement local
management vigilance.
The Board of Directors receive and review an annual report
on health and safety performance from the Chair of the
Health and Safety Committee.
2011 Directors’ Report Business review for the year ended 31 December 2011
26 FCE Bank plc – ANNUAL REPORT AND ACCOUNTS – 2011
Other business review information
Interest of management in certain transactions
During and at the end of the 2011 financial year, none of the
Company's Directors had a material financial interest in any
transaction (nor in any proposed transaction) in relation to
the Group's business.
Payments to suppliers
The Company has detailed procedures for the purchasing of
goods and services. Each branch/subsidiary/office is
responsible for agreeing and notifying terms of payment to
suppliers as part of the purchase commitments process.
Terms of payment vary by country or within a country. The
Company considers that it has complied with the payment
terms agreed with suppliers whenever it is satisfied that the
supplier has provided the goods or services in accordance
with the agreed terms and conditions.
The ratio, expressed in days, between the amounts owed by
the Company to trade creditors at the end of the year and the
amounts invoiced by suppliers in the year ended 31
December 2011 is 41 days (2010: 45 days).
Changes in fixed assets
Movements in fixed assets are detailed within Note 19
'Property and equipment'.
Donations
The Company and its subsidiaries made no charitable or
political donations during 2011 (2010: nil).
Post balance sheet events
For further details refer to Note 47 „Post balance sheet
events‟.
Environment
New vehicles – lower emissions
FCE‟s core business facilitates the purchase of Ford‟s most
up-to-date models which have the latest engines – improving
fuel efficiency across Europe.
Building management
FCE shares its Central Office in Warley, UK, with Ford Motor
Company. A range of measures to reduce the building's
impact on the environment have been introduced including
the installation of a Building Management System to
maximise the efficiency of the heating / cooling systems and
the use of green power from wind and solar sources in
Europe. FCE's offices across Europe also make efforts to
enhance their environmental efficiency and benefit from cost
savings due to reduced energy consumption.
Paper reduction
FCE has taken positive action to reduce the amount of paper
it uses in its daily work by enhancing key applications to
reduce the number of pages that need to be printed. In
addition, there is an increased use of web-based inquiries
and electronic reports within these applications.
Marketing
Working with Ford Motor Company, FCE is able to provide
customers with a number of marketing offers that reward
environmentally sustainable vehicle choices. In France, for
example, Ford Business Partner has included a facility that
helps drivers to monitor their fuel consumption, the reduction
of which is beneficial to customers (minimising costs) and to
the environment (minimising pollution).
2011 Directors’ Report Governance
FCE Bank plc – ANNUAL REPORT AND ACCOUNTS – 2011 27
Board of Directors Current composition of the Board of Directors
Director biographies
Mrs. Bogdanowicz-Bindert, Non-Executive Director, is a Non-
Executive Director of McBride plc. Previously a Non-
Executive Director of Bank BPH, PBK Bank and Bank
Gdanski before which she worked in various senior positions
at Lehman Brothers and the International Monetary Fund.
Mrs. Bogdanowicz-Bindert was appointed to the Board of
Directors on 1 September 2005.
Mr. Callender, Non-Executive Director, is a Non-Executive
Director of Motability plc and Aldermore Bank plc; and is the
Non-Executive Chairman of ANZ Bank Europe ltd.
Previously he held a number of senior roles with Barclays plc
including Chief Executive of Barclays Mercantile as well as a
number of other Non-Executive Directorships. Mr. Callender
was appointed to the Board of Directors on 24 March 2011.
Mr. Coffey, Managing Director, Britain, was Executive
Director, Global Operations and Technology immediately
prior to his present appointment. Having joined FCE in 1980
he has held various other senior management posts with
FCE in Europe since then including Director Central and
Eastern Sales Operations and New Markets and Location
Manager Greece. Mr. Coffey was appointed to the Board of
Directors on 1 August 2002.
Mr. Kiernan, Executive Director, Finance, was Finance
Director for Ford of Britain prior to taking up his current
appointment. Mr. Kiernan qualified as a Chartered
Accountant before joining Ford Motor Company in 1992,
since when he has held various senior positions in Ford's
operations in Germany and the USA. Mr. Kiernan was
appointed to the Board of Directors on 1 November 2011.
Mr. Murphy, Chairman FCE, was Executive Director, Global
Operations and Technology and Risk, immediately prior to
his present appointment. Having joined Ford Credit in 1982
he has held various other senior management posts
including Director, Irving Business Centre and Controller,
Ford Credit Europe. Mr. Murphy was appointed to the Board
of Directors on 25 March 2009. Mr. Murphy was appointed
Chairman on 8 December 2010.
Mr. Noone, President at Ford Credit, was President at Ford
Credit International immediately prior to his present
appointment. Having joined Ford Credit in 1972 he has held
various other senior management posts since then in both
the U.S. and in Europe including Executive Vice President at
Diversified and Major Accounts at Ford Credit. Mr. Noone
was appointed to the Board of Directors on 1 January 2004.
Mr. Romer-Lee, Non-Executive Director, is a Non-Executive
Director of Sonali Bank (UK) Limited and former partner of
PricewaterhouseCoopers LLP, where he was Head of
Financial Services, Central & Eastern Europe and with whom
he previously held various other senior management posts.
Mr. Romer-Lee was appointed to the Board of Directors on 1
October 2006.
Mr. Rothwell, Executive Director, Marketing Sales and Brand,
was Managing Director, Germany, immediately prior to his
present appointment. Having joined Ford Motor Company
Limited in 1979 and FCE in 1995 he has held various other
senior management posts in Europe since then including
Strategy Director at FCE, and Managing Director at Ford
Credit South Africa. Mr. Rothwell was appointed to the FCE
Board on 1 October 2004.
Mr. Schneider, Executive Director, Global Operations,
Technology and Risk, was previously Vice President, Global
Risk Management, Ford Motor Credit Company. Prior to that
appointment he held a number of senior positions at Ford
Credit. Mr. Schneider was appointed to the Board of
Directors on 27 January 2011.
Mr. Silverstone, Chief Operating Officer, Ford Credit, was
President, Marketing and Sales, immediately prior to his
present appointment. Having joined FCE in 1979 he has
held various other senior management posts including
Chairman at FCE, Vice President, Marketing for Ford Credit
North America and Regional President of Ford Credit Asia
Pacific Credit Operations.
Mr. Silverstone was appointed to the FCE Board of Directors
on 25 July 2001 and was Chairman of the Board between 21
July 2006 and 8 December 2010.
Chairman T Murphy Non-Executive Director C A Bogdanowicz-Bindert
Managing Director, Britain J Coffey Non-Executive Director A K Romer-Lee
Executive Director, Finance P Kiernan Non-Executive Director S Taverne
Director B B Silverstone Non-Executive Director J Callender
Executive Director, Marketing, Sales and Brand R N Rothwell
Executive Director, Global Operations, Technology and Risk T Schneider
Director J Noone
Secretary J Totsky
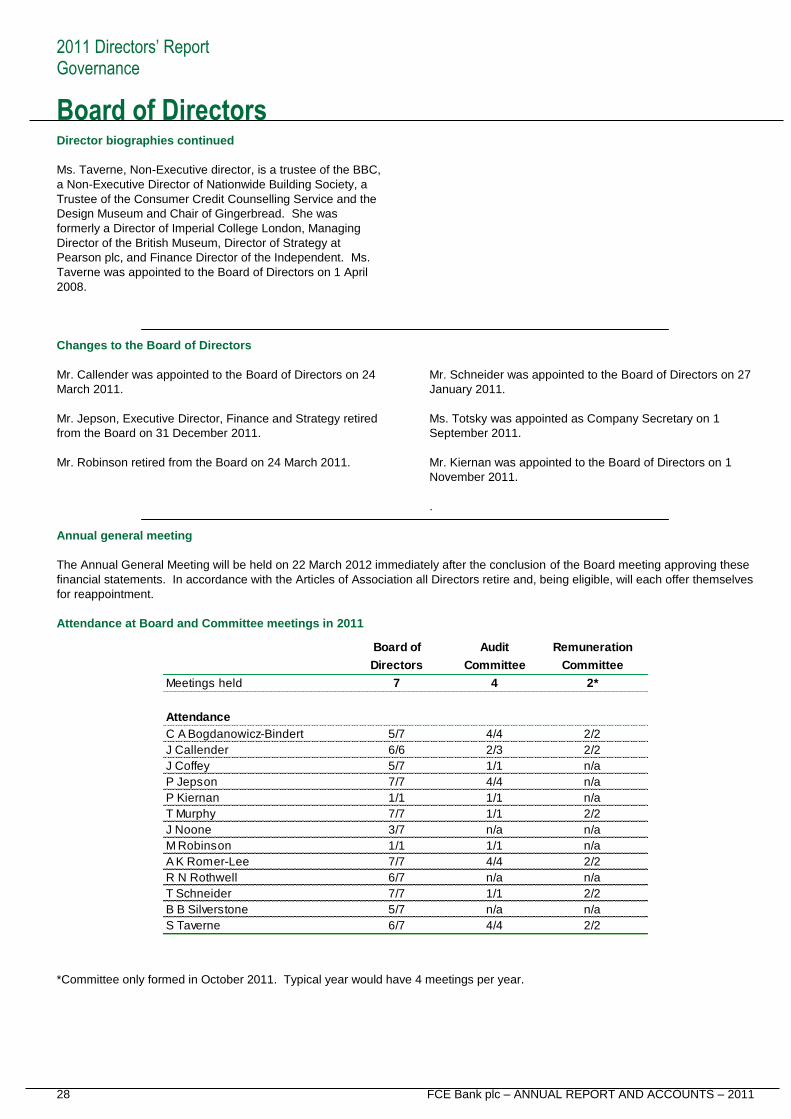
2011 Directors’ Report Governance
28 FCE Bank plc – ANNUAL REPORT AND ACCOUNTS – 2011
Board of DirectorsDirector biographies continued
Ms. Taverne, Non-Executive director, is a trustee of the BBC,
a Non-Executive Director of Nationwide Building Society, a
Trustee of the Consumer Credit Counselling Service and the
Design Museum and Chair of Gingerbread. She was
formerly a Director of Imperial College London, Managing
Director of the British Museum, Director of Strategy at
Pearson plc, and Finance Director of the Independent. Ms.
Taverne was appointed to the Board of Directors on 1 April
2008.
Changes to the Board of Directors
Mr. Callender was appointed to the Board of Directors on 24
March 2011.
Mr. Jepson, Executive Director, Finance and Strategy retired
from the Board on 31 December 2011.
Mr. Robinson retired from the Board on 24 March 2011.
Mr. Schneider was appointed to the Board of Directors on 27
January 2011.
Ms. Totsky was appointed as Company Secretary on 1
September 2011.
Mr. Kiernan was appointed to the Board of Directors on 1
November 2011.
.
Annual general meeting
The Annual General Meeting will be held on 22 March 2012 immediately after the conclusion of the Board meeting approving these
financial statements. In accordance with the Articles of Association all Directors retire and, being eligible, will each offer themselves
for reappointment.
Attendance at Board and Committee meetings in 2011
*Committee only formed in October 2011. Typical year would have 4 meetings per year.
Board of Audit Remuneration
Directors Committee Committee
Meetings held 7 4 2*
Attendance
C A Bogdanowicz-Bindert 5/7 4/4 2/2
J Callender 6/6 2/3 2/2
J Coffey 5/7 1/1 n/a
P Jepson 7/7 4/4 n/a
P Kiernan 1/1 1/1 n/a
T Murphy 7/7 1/1 2/2
J Noone 3/7 n/a n/a
M Robinson 1/1 1/1 n/a
A K Romer-Lee 7/7 4/4 2/2
R N Rothwell 6/7 n/a n/a
T Schneider 7/7 1/1 2/2
B B Silverstone 5/7 n/a n/a
S Taverne 6/7 4/4 2/2
2011 Directors’ Report Governance
FCE Bank plc – ANNUAL REPORT AND ACCOUNTS – 2011 29
Key governance principles
General
The Directors consider that effective corporate governance is
a key factor underlying the strategies and operations of the
FCE. Since only some of the Company's debt securities are
listed on Stock Exchanges there are significantly fewer
reporting obligations on the Company compared with a
company with listed equity. Nevertheless the Company
chooses to comply with many of the principles of the UK
Corporate Governance Code (the "Code") except for those
provisions that are not appropriate for a wholly-owned
subsidiary.
The Company undertakes on a regular basis a benchmarking
exercise against the latest guidelines on corporate
governance making any adjustments it deems necessary and
appropriate.
The Company has developed internal controls to ensure that
the Group's business is conducted within a strong and
defined control framework. These internal controls are well
suited to the evolving demands of corporate governance in
regulated, multi-national environments.
The Board of Directors
The Company is controlled through its Board of Directors
whose main roles are to:
• to promote the success of the Company for the
benefit of its members as a whole;
• provide leadership to the Company, particularly
relating to corporate governance, corporate social
responsibility and corporate ethics;
• approve the Company's strategic objectives;
• ensure that the necessary financial and other
resources are made available to the management to
enable them to meet those objectives;
• operate within a framework of effective controls
which enables the assessment and management of
principal risks; and
• ensure customers are treated with fairness and
respect.
In addition, the Board has the ultimate responsibility for
ensuring that the Company has systems of corporate
governance and internal control appropriate to the various
business environments in which it operates. The Board
regularly evaluates all risks affecting the business and the
processes put in place within the business to control them.
The process is focused on the key risks, with formal risk
mitigation, transfer or acceptance documented.
FCE controls are based on Ford standard controls to
safeguard assets, check the accuracy and reliability of
financial and non-financial data, promote operational
efficiency and encourage adherence to prescribed
managerial policies. Policy statements governing credit,
operational and treasury risk management are reviewed at
least annually.
The Board reviews the Group‟s commercial strategy,
business, funding and liquidity plans, annual operating
budget, capital structure and dividend policy and statutory
accounts.
The Board also reviews the financial performance and
operation of each of the Company's businesses and other
business reports and presentations from senior management.
The Board is responsible for the appropriate constitution of
Committees of the Board and reviews their activities and
terms of reference as part of an annual review of corporate
governance.
Within the financial and overall objectives for the Company,
the management of the Company is delegated to Directors
and management through the Chairman.
Each of the five Executive Directors is accountable for the
conduct and performance of their particular business within
the agreed business strategy. They have full authority to act
subject to the reserved powers and sanctioning limits laid
down by the Board and Company policies and guidelines.
All Directors are equally accountable under the law for the
proper stewardship of the Company‟s affairs. The Directors
have access to the advice and services of the Company
Secretary and can obtain independent professional advice at
the Company's expense in furtherance of their duties, if
required. A register of conflicts is maintained to ensure that
the management of conflicts is operated effectively.
In 2011, the Board held seven Board meetings, including one
Extraordinary Board Meeting dedicated solely to FCE's
Individual Liquidity Adequacy Assessment (ILAA), at which
the following subjects were discussed:
Strategy – the Board together with FCE's senior
management held an off-site meeting at which the
Company's strategy was reviewed taking into consideration
the external economic environment, Ford Motor Company's
strategy, and the need of the Company to create shareholder
value.
Business Plan – the Board reviewed the five-year forecasts,
the annual budget and the business plan which are designed
to support the Company's strategy.
Risk Appetite Statements, Internal Capital Adequacy
Assessment Process (ICAAP) and Individual Liquidity
Adequacy Assessment (ILAA) – the Board reviewed,
challenged and approved FCE's Risk Appetite Statements,
ICAAP and ILAA.
2011 Directors’ Report Governance
30 FCE Bank plc – ANNUAL REPORT AND ACCOUNTS – 2011
Key governance principles
Remuneration Committee – at August 26 2011 meeting the
Board approved the establishment of the Remuneration
Committee.
Special Attention Markets – in light of challenging external
environment, the Board conducted in-depth reviews of FCE's
operations in Greece, Italy and Spain to ensure that the risks
facing the locations are consistent with FCE's Risk Appetite
and accurately reflected in FCE's ICAAP and ILAA.
Non-Executive Directors (NEDs)
The NEDs fulfil key roles in corporate and regulatory
accountability. The Board considers all the current NEDs to
be independent because they have no material business
relationship with the Company (either directly or as a partner,
shareholder or officer of an organisation that has a
relationship with the Company) and they neither represent
the sole shareholder nor have any involvement in the day to
day management of the Company or its subsidiaries.
As such they bring objectivity and independent judgement to
the Board, which complements the Executive Directors‟ skills,
experience and detailed knowledge of the business.
Moreover they play a vital role in the governance of the
Company through their membership of the Audit Committee
and the Remuneration Committee.
Each NED is provided, upon appointment, with a letter
setting out the terms of his or her appointment including
membership of the Audit Committee and the Remuneration
Committee, the fees to be paid and the time commitment
expected from the Director. The letter also covers such
matters as the confidentiality of information and reference to
Ford's Directors and Officers Liability Insurance. The letters
of appointment of NEDs are terminable on one month's
notice by either party.
All NEDs are appointed to the Audit Committee and the
Remuneration Committee. The NEDs do not serve on any
other Board Committee.
The appointment of a NED is for an initial term of 3 years,
renewable for a second term of up to 3 years on mutual
agreement. In certain circumstances a further term of up to 3
years may be agreed. FCE's Articles of Association require
that all Directors retire and stand for re-appointment at each
annual general meeting.
Each year the NEDs hold a meeting with the Chairman to
discuss Executive Director succession planning, corporate
governance and any other relevant issues. The Board
reviews the number of Executive Directors and NEDs
periodically to maintain an appropriate balance for effective
control and direction of the business.
The Code recommends the appointment of a Senior
Independent NED and Mr Romer-Lee was appointed to this
post on 1 January 2008. The role of the Senior NED is to
chair the Audit Committee and to take a lead role with the
other NEDs, representing collective views to the Chairman,
Board or Audit Committee and to representatives of the
Company's shareholder.
The role of all the NEDs is to:
• review and give an objective opinion on the
Company's financial reporting including relevant
best practice;
• maintain effective working relationships with the
FSA and FCE's auditors;
• provide an objective view of the management of the
business;
• provide an objective insight into the strategic
direction of the Company and an advisory role on
intended strategic actions and potential implications
for the business;
• review the application of financial reporting and
understand the Company's financial position and
constructively challenge its effective management;
and
• provide other Board members with different
perspectives on strategic and other issues facing
the Company
The NEDs meet from time to time in the absence of FCE's
management, and the Senior NED normally presides at such
meetings.
Selection of Directors
Specialist executive recruitment agencies may be employed
to find suitable NEDs. In addition, direct appointments are
made where specific skills and experience are needed, and
FCE may consult its auditors or other professional advisers
on appropriate candidates when specialist financial skills are
required. Formal interviews are held with senior Company
management before a preferred candidate meets other
members of the Board including all the current NEDs.
Executive Directors (including the Chairman) are selected
through a Ford Credit Personnel Development Committee
process. Succession plans for Directors and other senior
appointments are reviewed with senior representatives of the
Company‟s parent and the NEDs. Proposals for all Director
appointments are then submitted for corporate approval both
by Senior Management of the shareholder and by the Ford
Corporate Governance Committee before being submitted to
the Company's Board of Directors for formal legal approval.
FCE Bank's directors are FSA Approved Persons and new
appointments are subject to FSA's approval.
2011 Directors’ Report Governance
FCE Bank plc – ANNUAL REPORT AND ACCOUNTS – 2011 31
Key governance principles
Training of Directors
Consideration is given to the training needs of Directors on
their appointment to the Board, and new NEDs benefit from a
comprehensive induction to the Company‟s business, risk
management and regulatory environment.
Also there is at least one senior management financial
review and strategy meeting held each year to which the
NEDs are invited, and a training day is available as required
for the NEDs where topical issues and developments can be
discussed. From time to time, Ford develops training
programmes for various aspects of Directors‟ duties and
responsibilities, corporate governance and regulatory and
general compliance matters.
Evaluation and remuneration of Directors
Each Executive Director is evaluated by FCE's performance
review process and remuneration is determined in line with
the global compensation policy of Ford Credit and Ford.
Senior representatives of Ford Credit evaluate the
performance of the Chairman.
NEDs receive a flat fee for their services. The Senior NED
receives a higher fee to reflect his additional responsibilities.
The levels of both fees are reviewed periodically and the fee
level is approved by senior representatives of Ford Credit.
The NEDs do not receive any further remuneration or
participate in any incentive arrangements.
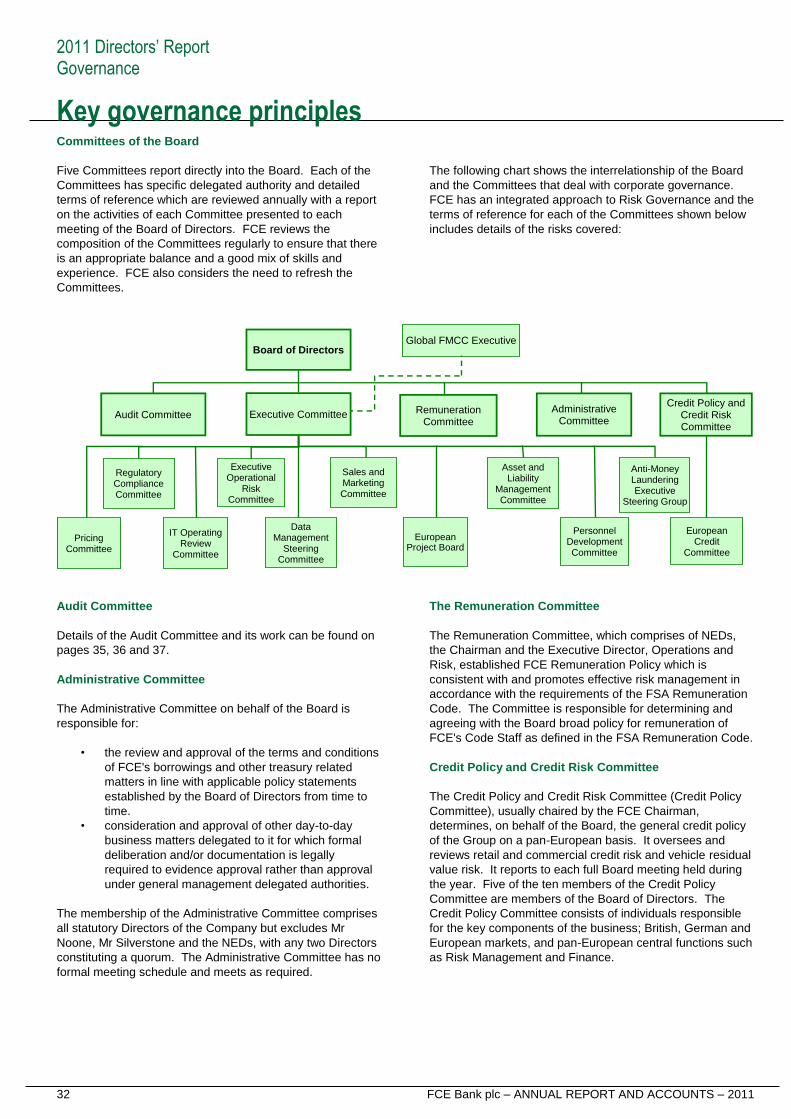
2011 Directors’ Report Governance
32 FCE Bank plc – ANNUAL REPORT AND ACCOUNTS – 2011
Key governance principles Committees of the Board
Five Committees report directly into the Board. Each of the
Committees has specific delegated authority and detailed
terms of reference which are reviewed annually with a report
on the activities of each Committee presented to each
meeting of the Board of Directors. FCE reviews the
composition of the Committees regularly to ensure that there
is an appropriate balance and a good mix of skills and
experience. FCE also considers the need to refresh the
Committees.
The following chart shows the interrelationship of the Board
and the Committees that deal with corporate governance.
FCE has an integrated approach to Risk Governance and the
terms of reference for each of the Committees shown below
includes details of the risks covered:
Audit Committee
Details of the Audit Committee and its work can be found on
pages 35, 36 and 37.
Administrative Committee
The Administrative Committee on behalf of the Board is
responsible for:
• the review and approval of the terms and conditions
of FCE's borrowings and other treasury related
matters in line with applicable policy statements
established by the Board of Directors from time to
time.
• consideration and approval of other day-to-day
business matters delegated to it for which formal
deliberation and/or documentation is legally
required to evidence approval rather than approval
under general management delegated authorities.
The membership of the Administrative Committee comprises
all statutory Directors of the Company but excludes Mr
Noone, Mr Silverstone and the NEDs, with any two Directors
constituting a quorum. The Administrative Committee has no
formal meeting schedule and meets as required.
The Remuneration Committee
The Remuneration Committee, which comprises of NEDs,
the Chairman and the Executive Director, Operations and
Risk, established FCE Remuneration Policy which is
consistent with and promotes effective risk management in
accordance with the requirements of the FSA Remuneration
Code. The Committee is responsible for determining and
agreeing with the Board broad policy for remuneration of
FCE's Code Staff as defined in the FSA Remuneration Code.
Credit Policy and Credit Risk Committee
The Credit Policy and Credit Risk Committee (Credit Policy
Committee), usually chaired by the FCE Chairman,
determines, on behalf of the Board, the general credit policy
of the Group on a pan-European basis. It oversees and
reviews retail and commercial credit risk and vehicle residual
value risk. It reports to each full Board meeting held during
the year. Five of the ten members of the Credit Policy
Committee are members of the Board of Directors. The
Credit Policy Committee consists of individuals responsible
for the key components of the business; British, German and
European markets, and pan-European central functions such
as Risk Management and Finance.
Board of Directors
Regulatory Compliance Committee
Executive Operational
Risk Committee
Executive CommitteeCredit Policy and
Credit Risk Committee
Administrative Committee
European Credit
Committee
Asset and Liability
Management Committee
Personnel Development Committee
Anti-Money Laundering Executive
Steering Group
Data Management
Steering Committee
IT Operating Review
Committee
Sales and Marketing Committee
European Project Board
Global FMCC Executive
Audit CommitteeRemuneration
Committee
Pricing Committee
2011 Directors’ Report Governance
FCE Bank plc – ANNUAL REPORT AND ACCOUNTS – 2011 33
Credit Policy and Credit Risk Committee continued
There are quorum requirements for the Credit Policy
Committee, with different combinations of attendees
permitted, to ensure that a member of the Board of Directors
is always in attendance in addition to appropriate
representation from key areas of the business. The Credit
Policy Committee aims to meet monthly.
Key governance principles The Commercial Credit Committees have been established
as sub-committees of the Credit Policy Committee to review
and approve commercial lending requests across Europe.
The Commercial Credit Committees are constituted and
operate at district, country, European and international levels
according to delegated approval authorities and risk
assessment.
Executive Committee
The Executive Committee ('EC') usually chaired by the FCE
Chairman, is responsible for the development of Group‟s
strategy and monitoring Group's performance against its
strategy and business plan. The Executive Committee
reports to the Board at each of the full Board meetings held
during the year. The Executive Committee has thirteen
members, five of whom are members of the Board of
Directors.
The EC consists of individuals responsible for the key
components of the business; British, German and European
markets, as well as pan-European central functions such as
Risk Management, Information Technology, Legal &
Compliance and Strategy & Finance. Either the Chairman or
the Executive Director Finance are required in attendance as
one of seven members needed to constitute a quorum. The
EC meets monthly and held 12 meetings during 2011
Several sub-committees have been established and meet regularly and cover all areas of the business. These sub-committees
report into the EC:
• The Regulatory Compliance Committee is responsible
for monitoring and managing regulatory compliance risk
that FCE faces across business lines, product areas and
geographies. In 2011, FCE made significant
enhancements to its regulatory compliance risk
framework by improving the quality of management
information and implementing comprehensive
compliance monitoring plan. The Committee monitors
and evaluates regulatory and legislative changes and
determines the Company's response or changes needed.
• The Information Technology Operating Review
Committee monitors, aligns and resolves plans and
priorities across FCE to support key information
technology related projects and initiatives.
• The Executive Operational Risk Committee has the
overall responsibility for reviewing and monitoring major
operational risks and for promoting the use of sound
operational risk management across FCE. The
Committee has three sub-committees: Business
Continuity Steering Committee, Sub-Operational Risk
Committee and Operation Identified Comment
Committee.
• The Asset and Liability Management Committee
oversees the funding plan and liquidity management for
FCE. The Committee has two sub-committees:
Securitisation Programme Board and Supervisory Sub-
Committee.
• The Sales and Marketing Committee facilitates regular
and timely information exchanges between business
units and functional areas covering sales, marketing and
operational matters.
• The Data Management Steering Committee
provides direction and makes decisions on
company-wide data management matters to ensure
a co-ordinated input to process and IT application
development to meet business requirements
through data solutions that are consistent with
strategic priorities. The Committee provides input
and direction to FCE control functions on data
integrity, protection, transfer and breaches.
• The Pricing Committee reviews and approves
pricing strategies and policies on a national, regional
and European basis.
• The European Project Board oversees the
management of FCE's strategic projects. This sub-
committee meets on a monthly basis to review,
approve and prioritise large / strategic projects.
• The Personnel Development Committees drive
personnel development and career and vacancies
planning. The sub-committees are comprised of
members of management, who are assisted by
Human Resources representatives.
• The Anti-Money Laundering Executive Steering
Group oversees compliance with the provisions of
the relevant European Community Money
Laundering and related directives as applied to
those markets in which FCE operates.
In addition, the EC may from time-to-time appoint working groups or steering committees to address specific business risks and
opportunities.
2011 Directors’ Report Governance
34 FCE Bank plc – ANNUAL REPORT AND ACCOUNTS – 2011
Key governance principles
Accountability and audit
Financial reporting
In the Directors‟ Report the Board seeks to provide a detailed
understanding of the business of the Group, together with a
balanced and understandable assessment of FCE's position
and prospects.
Internal control
Further information on the internal control environment can
be found in the 'Audit Committee Report' which commences
on page 35.
Going concern
The Directors are confident, on the basis of current financial
projections and facilities available, that the Company and
FCE have adequate financial resources to continue in
operation for the foreseeable future. For this reason, the
Directors have concluded that there are no material
uncertainties that lead to significant doubt upon the entity‟s
ability to continue as a going concern and therefore continue
to adopt the going concern basis in preparing the financial
statements.
Investor relations
The Company's website provides potential investors with
information about the Company, including recent annual and
interim financial statements, Basel II Pillar 3 disclosures,
investor presentations and governance matters.
BY ORDER OF THE BOARD
Todd S Murphy
Chairman, FCE Bank plc.
22 March 2012
FCE Bank plc.
Central Office, Eagle Way, Brentwood, Essex CM13 3AR.
Registered in England and Wales no 772784
2011 Directors’ Report Governance
FCE Bank plc – ANNUAL REPORT AND ACCOUNTS – 2011 35
Audit Committee report
This report describes the role of the Audit Committee ('AC')
and its compliance with the requirements of the UK
Corporate Governance Code (the „Code‟) where appropriate
for a wholly owned subsidiary.
Terms of reference
The AC's terms of reference, a copy of which can be found
on the Company's website, are reviewed at least annually
and approved by the Board. They are based on the model
terms of reference set out in the Guidance Note produced by
the Institute of Chartered Secretaries and Administrators.
The terms of reference cover membership and appointment,
meetings, duties and responsibilities, authority and a number
of other matters. The AC's objectives include assisting the
Board in meeting its responsibilities to create an effective
system of internal control and compliance, provision of
accurate external financial reporting, and assisting
management in conducting and reporting effective risk
management.
Membership and appointment
There is no limitation on the term of appointment to the AC.
During 2011 the AC was chaired by Mr Romer-Lee, and met
four times. Membership of the AC exclusively comprises all
the NEDs. The quorum for the AC is any two members.
FCE considers that all four current members of the AC are
independent for the purposes of the Code. The members
bring wide-ranging financial, commercial and management
experience to the work of the AC and their biographical
details are set out on page 27.
The Board is confident that the collective experience of the
AC members enables them, as a group, to act as an effective
Audit Committee. The AC also has access to the financial
expertise of the Group and its auditors, internal and external,
and can seek further professional advice at the Company's
expense if required. The Board considers that the current
AC Chairman, in particular, qualifies as having recent and
relevant financial experience to bring to the deliberations of
the AC as required by the Code.
Meetings
PricewaterhouseCoopers LLP ('PwC'), FCE's external
auditors, and representatives from Ford's General Auditors
Office ('GAO') together with the Executive Director Finance,
the Director Legal Affairs and Company Secretary attend
meetings under a standing invitation. The Company
Secretary is Secretary to the AC. In addition, the AC often
requires other Directors, managers and staff to attend and
agree with audit/review actions in response to the AC
enquiries and recommendations.
The NEDs also held private meetings with the external
auditors during the year. The Committee Chairman reports
regularly to the Board on AC's activities and the minutes of
the AC meetings are circulated to the Board of Directors.
Work of the Committee
The AC carries out its programme of work in accordance with
a calendar of actions at four programmed meetings held
each year in March, June, August and November or adjacent
months as outlined below. The AC also receives regular
reports on significant and unusual events at every meeting.
In addition, other significant matters are raised as
appropriate and necessary:
• March – Review draft Annual Report and Accounts,
management letter and external auditors' report and audit
fees, which includes consideration of major judgmental
areas, significant adjustments and the appropriateness of
the going concern assumption before the statements are
approved by the Board.
• June – Review the Company‟s capital and liquidity
adequacy reporting, planning and implementation; annual
review of the ICO, incorporating audit review and future
plans and progress against its own internal business plan,
functional developments and key performance measures;
and an annual review from FCE's external auditor including
current accounting and financial reporting matters and
issues arising and its audit plan and scope.
• August – Review draft Interim Accounts for the first six
months of the year and management letter and external
auditors' report, which includes consideration of major
judgmental areas and significant adjustments before the
statements are considered and approved by the Board;
and overseeing the process of monitoring compliance and
regulatory matters including Anti-Money Laundering
through an annual review by FCE's Head of Compliance.
• December – Review Accounting policies and disclosure
changes for the next annual accounts including major
changes in accounting policies and practices; and consider
the annual review of GAO to include overseeing the
effectiveness of internal control over reporting and
operations and specifically the review of the internal audit
charter, update on risk assessment and internal audit
reviews and future plans, compliance with auditing
standards and progress against its internal audit business
plan, functional developments and key performance
measures.
2011 Directors’ Report Governance
36 FCE Bank plc – ANNUAL REPORT AND ACCOUNTS – 2011
Audit Committee report
Work of the Committee continued
The audit plan and scope for both PwC and the GAO sets
out details of the areas to be covered and how the audit is to
be conducted. The AC Chairman meets periodically with the
external auditors and GAO to discuss progress on the audit
and the major points to arise, and has the opportunity to
assess the effectiveness of the process. The AC is also able
to assess the effectiveness of the auditors and the process
through reports made to the Committee by the independent
auditors. In addition, prior to each of the AC meetings
convened to approve annual and interim financial results,
members hold a private meeting with the external auditors.
External auditors, their work and non-audit related
services
PwC conducts audits of FCE's financial statements in
accordance with relevant legal and regulatory requirements
and International Standards on Auditing (UK and Ireland).
PwC provides external audit opinions on FCE‟s financial
statements.
The appointment and re-appointment of the external auditor
for the Ford group of companies is reviewed at parent
company level. However, in accordance with its current
terms of reference, the AC receive annual written
confirmation that a review had been undertaken by the Ford
Audit Committee of PwC's continued independence,
performance, significant relationships and compliance with
relevant ethical and professional guidance. In addition, the
AC reviews PwC's audit plan, its scope and cost
effectiveness and the audit fee. PwC's audit fees for 2011
are outlined in Note 9 'Profit before tax' on page 62 of these
financial statements.
To help ensure that the auditors‟ independence and
objectivity are not prejudiced by the provision of non-audit
services, the AC has agreed that the external auditors should
be excluded from providing management, strategic or
Information Technology consultancy services and all other
non-audit related services, unless the firm appointed as
external auditor is:
- the only provider of the specific expertise/service required;
or
- the clear leader in the provision of the service and is able
to provide that service on a competitively priced basis.
As auditors, PwC will undertake work that they must or are
best placed to complete. This includes tax-related work,
formalities related to borrowings, regulatory reports or work
in respect of acquisitions and disposals.
General auditors office
Ford‟s General auditors office (GAO) is fully independent
from FCE; its coverage is based on the relative risk
assessment of each 'audit entity', which is defined as a
collection of processes and systems that are closely related.
The GAO's mission is to provide objective assurance and
advisory services to management and the Board of Ford and
to the Company's AC in order to improve the efficiency and
effectiveness of Company operations and assist the
Company in achieving its objectives through systemic and
disciplined auditing.
Internal control office
ICO is the department within FCE that delivers control
consultancy, process reviews, special investigations, due
diligence, advice on systems‟ controls and control training
across all locations. ICO's experience across operations,
accounting and systems enables informed operational
reviews, and sharing of best practice. This ensures a high
level of quality is maintained within FCE's processes,
customer and dealer services and financial products. The
department has created and delivered training in ongoing
controls, which includes learning points derived from audits,
control reviews and self-assessment processes. This
matches industry leading-edge practices to assist
management in early identification of potential control risks
which is an essential element of the process to ensure
compliance with the US Sarbanes-Oxley Act.
ICO coordinates the Modular Control Review Programme
(MCRP), which has been designed, implemented and
revised over several years to embed the assessment of risk
and opportunity across the Group. The MCRP provides the
means for the management of each location or activity to
continually review that controls are designed and operating
effectively within their operation. The performance of regular
and appropriate checks embeds sound governance
principles in key processes. The MCRP facilitates high
levels of control self-assessment as part of good business
practice. It also embodies the principles established by the
UK‟s Turnbull Committee on achieving the standards in the
Combined Code of Corporate Governance. The MCRP was
modified for, and provides a key structure in FCE's
compliance with the US Sarbanes-Oxley Act.
ICO oversees the Operational Identified Comments (OIC)
Committee, a sub-committee of the Executive Operational
Risk Committee. OICs are process and procedural
improvement opportunities discovered through self-
assessment processes, audits or other external reviews, or in
the course of day-to-day operations. The OIC Committee is
responsible for monitoring and validating OIC corrective
action plans. The Executive Operational Risk committee
receives routine and regular reports from both ICO and the
OIC Committee. Occasionally, in light of significant
developments or events, the Executive Operational Risk
committee may commission ICO to undertake ad-hoc
reviews, or special investigations.
2011 Directors’ Report Governance
FCE Bank plc – ANNUAL REPORT AND ACCOUNTS – 2011 37
Audit Committee reportWhistle-blowing procedure
The Company has established a whistle-blowing procedure
for the confidential and anonymous submission by
employees of concerns regarding accounting, internal
controls or auditing matters. A report on any such incidents
reported is presented to each Audit Committee meeting,
including details of any actions taken to deal with the matters
raised. No issues material to FCE were dealt with by the
Audit Committee during the reporting year.
BY ORDER OF THE AUDIT COMMITTEE
Alex K Romer-Lee
22 March 2012
Financial Statements
38 FCE Bank plc – ANNUAL REPORT AND ACCOUNTS – 2011
Directors' responsibility for financial statements
The following statement should be read in conjunction with
the Independent Auditors' Report.
The Directors are responsible for preparing the Annual
Report and the Company and Group's financial statements in
accordance with applicable law and regulations.
The Directors are required by law to prepare the Company
and Group's financial statements for each financial year in
accordance with the Companies Act 2006, International
Financial Reporting Standards as adopted by the European
Union and as regards to the Group's financial statements,
Article 4 of Commission Regulation (EC) Number 1606/2002
(the "IAS Regulation").
The Directors are required to ensure that the Company and
Group's financial statements give a true and fair view of the
assets, liabilities and financial position of the Company and
Group and of the profit or loss of the Group for that period.
In preparing the Company and Group's financial statements
for the year ended 31 December 2011, the Directors also are
required to:
• select suitable accounting policies and apply them
consistently;
• make judgments and estimates that are reasonable and
prudent;
• confirm that applicable accounting standards have been
followed; and
• confirm that the financial statements have been prepared
on the going concern basis.
The Directors confirm that they have complied with the above
requirements in preparing the financial statements for the
year ended 31 December 2011.
The Directors are responsible for keeping proper accounting
records which disclose with reasonable accuracy at any time
the financial position of the Company and the Group and
enable them to ensure that the financial statements comply
with the Companies Act 2006 and, as regards the Group
financial statements, Article 4 of the IAS Regulation. They
are also responsible for safeguarding the assets of the
Company and the Group, and for taking reasonable steps for
the prevention and detection of fraud and other irregularities.
Each of the Directors, whose names and functions are listed
on page 27, confirms that, to the best of their knowledge:
• The Group financial statements, which have been
prepared in accordance with IFRSs as adopted by the EU,
give a true and fair view of the assets, liabilities, financial
position and profit of the Group; and
• The Directors’ Report includes a fair review of the
development and performance of the business and the
position of the Group, together with a description of the
principal risks and uncertainties that it faces.
Disclosure of information to external auditors
Each of the Directors, who is in office at the time when FCE's
financial statements are approved, confirms that so far as
they are aware, there is no relevant audit information of
which the Company's external auditors are unaware and
each such Director has taken all the steps that he/she ought
reasonably be expected to have taken as a Director in order
to make himself or herself aware of any relevant audit
information and to establish that the Company's external
auditors are aware of that information. This information is
given and should be interpreted in accordance with the
provisions of Section 418 Companies Act 2006.
Website
A copy of the financial statements of the Company will be
posted on the FCE website (www.fcebank.com). The
Directors are responsible for the maintenance and integrity of
the corporate and financial information included on the
website. The work carried out by the auditors does not
involve consideration of these matters and, accordingly, the
auditors accept no responsibility for any changes that may
have occurred to FCE's financial statements since they were
initially presented on the website. Legislation in the UK
governing preparation and dissemination of financial
statements may differ from legislation in other jurisdictions.
External auditors
In accordance with Section 489 Companies Act 2006, a
resolution proposing the re-appointment of
PricewaterhouseCoopers LLP as external auditors will be
submitted to the Annual General Meeting to be held on 22
March 2012.
BY ORDER OF THE BOARD
Joanna Totsky
Company Secretary
22 March 2012
Financial Statements
FCE Bank plc – ANNUAL REPORT AND ACCOUNTS – 2011 39
Independent auditors' report
INDEPENDENT AUDITORS’ REPORT TO THE MEMBERS OF FCE BANK PLC
We have audited the Company and Group financial
statements (the ‘‘financial statements’’) of FCE Bank plc for
the year ended 31 December 2011 which comprise the
Company and Group Balance sheets, the Group Statement
of comprehensive income, the Company and Group
Statement of cash flow, the Company and Group Statement
of changes in equity and the related notes. The financial
reporting framework that has been applied in their
preparation is applicable law and International Financial
Reporting Standards (IFRSs) as adopted by the European
Union and, as regards the Company financial statements, as
applied in accordance with the provisions of the Companies
Act 2006.
Respective responsibilities of Directors and auditors
As explained more fully in the Directors’ Responsibilities
Statement set out on page 38, the Directors are responsible
for the preparation of the financial statements and for being
satisfied that they give a true and fair view. Our
responsibility is to audit and express an opinion on the
financial statements in accordance with applicable law and
International Standards on Auditing (UK and Ireland). Those
standards require us to comply with the Auditing Practices
Board’s Ethical Standards for Auditors.
This report, including the opinions, has been prepared for
and only for the Company’s members as a body in
accordance with Chapter 3 of Part 16 of the Companies Act
2006 and for no other purpose. We do not, in giving these
opinions, accept or assume responsibility for any other
purpose or to any other person to whom this report is shown
or into whose hands it may come save where expressly
agreed by our prior consent in writing.
Scope of the audit of the financial statements
An audit involves obtaining evidence about the amounts and
disclosures in the financial statements sufficient to give
reasonable assurance that the financial statements are free
from material misstatement, whether caused by fraud or error.
This includes an assessment of: whether the accounting
policies are appropriate to the Company’s and Group’s
circumstances and have been consistently applied and
adequately disclosed; the reasonableness of significant
accounting estimates made by the Directors; and the overall
presentation of the financial statements. In addition, we read
all the financial and non-financial information in the annual
report of FCE Bank plc to identify material inconsistencies
with the audited financial statement. If we become aware of
any apparent material misstatements or inconsistencies we
consider the implications for our report.
Opinion on financial statements
In our opinion:
• the financial statements give a true and fair view of the
state of the Company’s and of the Group’s affairs as at 31
December 2011 and of the Group’s profit and Company’s
and Group’s cash flows for the year then ended;
• the Group financial statements have been properly
prepared in accordance with IFRSs as adopted by the
European Union;
• the Company financial statements have been properly
prepared in accordance with IFRSs as adopted by the
European Union and as applied in accordance with the
provisions of the Companies Act 2006; and
• the financial statements have been prepared in
accordance with the requirements of the Companies Act
2006 and, as regards the Group financial statements,
Article 4 of the lAS Regulation.
Opinion on other matter prescribed by the Companies
Act 2006
In our opinion the information given in the Directors’ Report
for the financial year for which the financial statements are
prepared is consistent with the financial statements.
Matters on which we are required to report by exception
We have nothing to report in respect of the following matters
where the Companies Act 2006 requires us to report to you if,
in our opinion:
• adequate accounting records have not been kept by the
Company, or returns adequate for our audit have not been
received from branches not visited by us; or
• the Company financial statements are not in agreement
with the accounting records and returns; or
• certain disclosures of Directors’ remuneration specified by
law are not made; or
• we have not received all the information and explanations
we require for our audit.
Craig Stafford (Senior Statutory Auditor)
for and on behalf of PricewaterhouseCoopers LLP
Chartered Accountants and Statutory Auditors
London
22 March 2012
The maintenance and integrity of the FCE Bank plc website is the responsibility of the Directors; the work carried out by the auditors
does not involve consideration of these matters and, accordingly, the auditors accept no responsibility for any changes that may
have occurred to the financial statements since they were initially presented on the website.
Legislation in the United Kingdom governing the preparation and dissemination of financial statements may differ from legislation in
other jurisdictions.
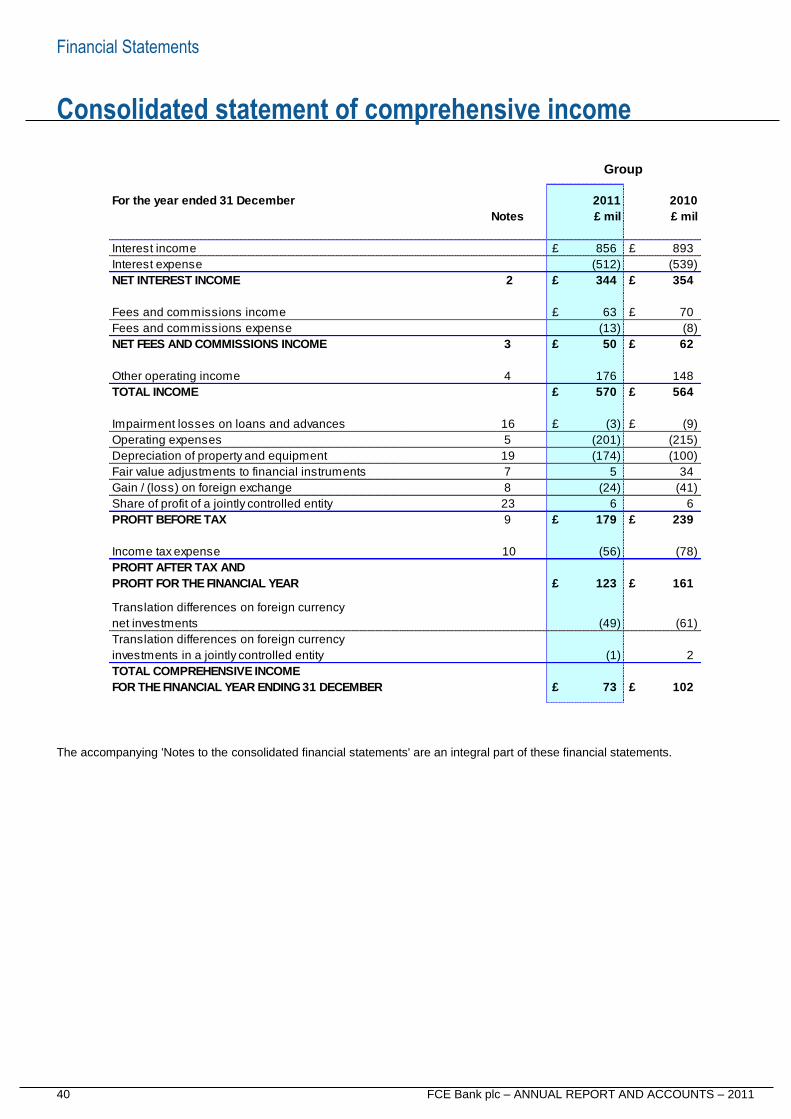
Financial Statements
40 FCE Bank plc – ANNUAL REPORT AND ACCOUNTS – 2011
Consolidated statement of comprehensive income
The accompanying 'Notes to the consolidated financial statements' are an integral part of these financial statements.
For the year ended 31 December 2011 2010
Notes £ mil £ mil
Interest income £ 856 £ 893
Interest expense (512) (539)
NET INTEREST INCOME 2 £ 344 £ 354
Fees and commissions income £ 63 £ 70
Fees and commissions expense (13) (8)
NET FEES AND COMMISSIONS INCOME 3 £ 50 £ 62
Other operating income 4 176 148
TOTAL INCOME £ 570 £ 564
Impairment losses on loans and advances 16 £ (3) £ (9)
Operating expenses 5 (201) (215)
Depreciation of property and equipment 19 (174) (100)
Fair value adjustments to financial instruments 7 5 34
Gain / (loss) on foreign exchange 8 (24) (41)
Share of profit of a jointly controlled entity 23 6 6
PROFIT BEFORE TAX 9 £ 179 £ 239
Income tax expense 10 (56) (78)
PROFIT AFTER TAX AND
PROFIT FOR THE FINANCIAL YEAR £ 123 £ 161
Translation differences on foreign currency
net investments (49) (61)
Translation differences on foreign currency
investments in a jointly controlled entity (1) 2
TOTAL COMPREHENSIVE INCOME
FOR THE FINANCIAL YEAR ENDING 31 DECEMBER £ 73 £ 102
Group
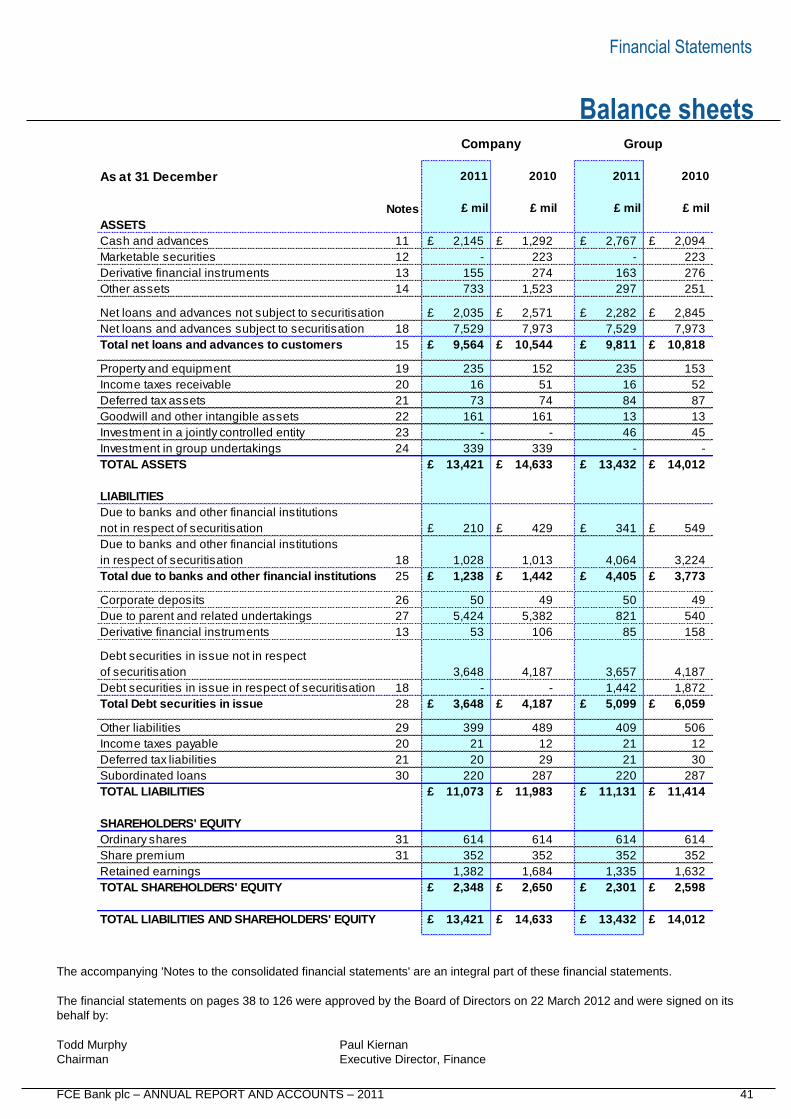
Financial Statements
FCE Bank plc – ANNUAL REPORT AND ACCOUNTS – 2011 41
Balance sheets
The accompanying 'Notes to the consolidated financial statements' are an integral part of these financial statements.
The financial statements on pages 38 to 126 were approved by the Board of Directors on 22 March 2012 and were signed on its
behalf by:
Todd Murphy Paul Kiernan
Chairman Executive Director, Finance
As at 31 December
Notes
ASSETS
Cash and advances 11 £ 2,145 £ 1,292 £ 2,767 £ 2,094
Marketable securities 12 - 223 - 223
Derivative financial instruments 13 155 274 163 276
Other assets 14 733 1,523 297 251
Net loans and advances not subject to securitisation £ 2,035 £ 2,571 £ 2,282 £ 2,845
Net loans and advances subject to securitisation 18 7,529 7,973 7,529 7,973
Total net loans and advances to customers 15 £ 9,564 £ 10,544 £ 9,811 £ 10,818
Property and equipment 19 235 152 235 153
Income taxes receivable 20 16 51 16 52
Deferred tax assets 21 73 74 84 87
Goodwill and other intangible assets 22 161 161 13 13
Investment in a jointly controlled entity 23 - - 46 45
Investment in group undertakings 24 339 339 - -
TOTAL ASSETS £ 13,421 £ 14,633 £ 13,432 £ 14,012
LIABILITIES
Due to banks and other financial institutions
not in respect of securitisation £ 210 £ 429 £ 341 £ 549
Due to banks and other financial institutions
in respect of securitisation 18 1,028 1,013 4,064 3,224
Total due to banks and other financial institutions 25 £ 1,238 £ 1,442 £ 4,405 £ 3,773
Corporate deposits 26 50 49 50 49
Due to parent and related undertakings 27 5,424 5,382 821 540
Derivative financial instruments 13 53 106 85 158
Debt securities in issue not in respect
of securitisation 3,648 4,187 3,657 4,187
Debt securities in issue in respect of securitisation 18 - - 1,442 1,872
Total Debt securities in issue 28 £ 3,648 £ 4,187 £ 5,099 £ 6,059
Other liabilities 29 399 489 409 506
Income taxes payable 20 21 12 21 12
Deferred tax liabilities 21 20 29 21 30
Subordinated loans 30 220 287 220 287
TOTAL LIABILITIES £ 11,073 £ 11,983 £ 11,131 £ 11,414
SHAREHOLDERS' EQUITY
Ordinary shares 31 614 614 614 614
Share premium 31 352 352 352 352
Retained earnings 1,382 1,684 1,335 1,632
TOTAL SHAREHOLDERS' EQUITY £ 2,348 £ 2,650 £ 2,301 £ 2,598
TOTAL LIABILITIES AND SHAREHOLDERS' EQUITY £ 13,421 £ 14,633 £ 13,432 £ 14,012
£ mil
Company Group
£ mil
2011
£ mil
2011
£ mil
2010 2010
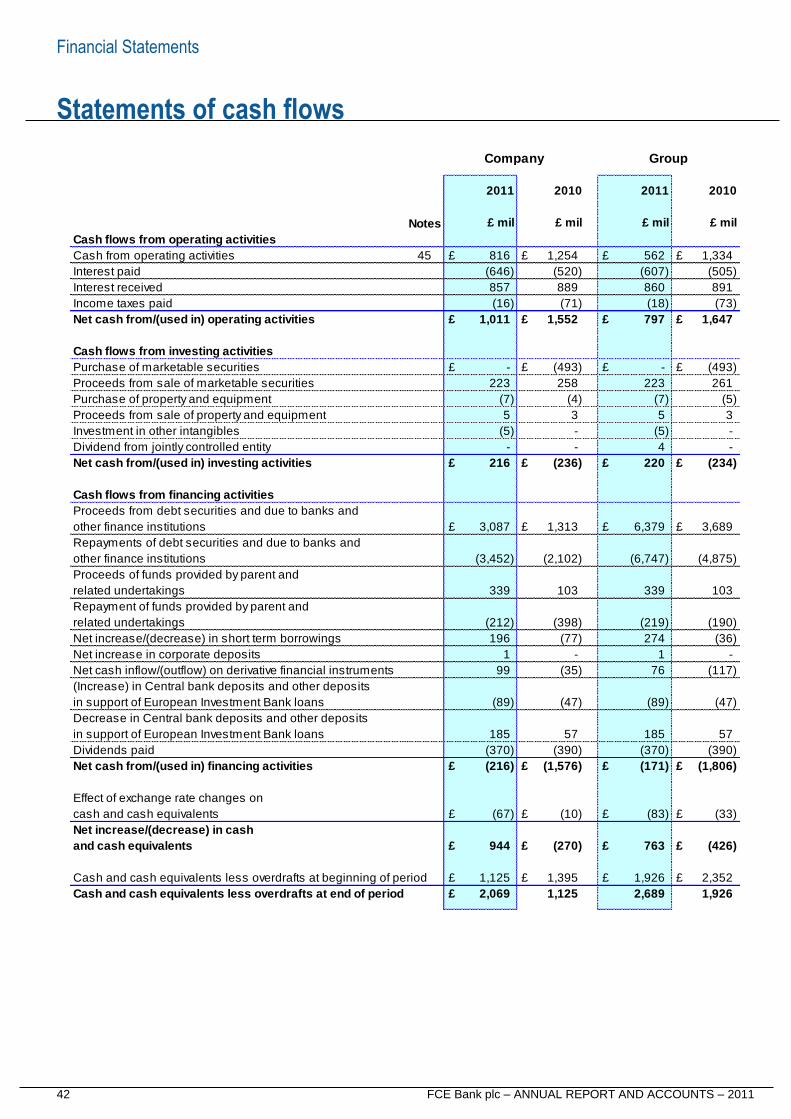
Financial Statements
42 FCE Bank plc – ANNUAL REPORT AND ACCOUNTS – 2011
Statements of cash flows
Notes
Cash flows from operating activities
Cash from operating activities 45 £ 816 £ 1,254 £ 562 £ 1,334
Interest paid (646) (520) (607) (505)
Interest received 857 889 860 891
Income taxes paid (16) (71) (18) (73)
Net cash from/(used in) operating activities £ 1,011 £ 1,552 £ 797 £ 1,647
Cash flows from investing activities
Purchase of marketable securities £ - £ (493) £ - £ (493)
Proceeds from sale of marketable securities 223 258 223 261
Purchase of property and equipment (7) (4) (7) (5)
Proceeds from sale of property and equipment 5 3 5 3
Investment in other intangibles (5) - (5) -
Dividend from jointly controlled entity - - 4 -
Net cash from/(used in) investing activities £ 216 £ (236) £ 220 £ (234)
Cash flows from financing activities
Proceeds from debt securities and due to banks and
other finance institutions £ 3,087 £ 1,313 £ 6,379 £ 3,689
Repayments of debt securities and due to banks and
other finance institutions (3,452) (2,102) (6,747) (4,875)
Proceeds of funds provided by parent and
related undertakings 339 103 339 103
Repayment of funds provided by parent and
related undertakings (212) (398) (219) (190)
Net increase/(decrease) in short term borrowings 196 (77) 274 (36)
Net increase in corporate deposits 1 - 1 -
Net cash inflow/(outflow) on derivative financial instruments 99 (35) 76 (117)
(Increase) in Central bank deposits and other deposits
in support of European Investment Bank loans (89) (47) (89) (47)
Decrease in Central bank deposits and other deposits
in support of European Investment Bank loans 185 57 185 57
Dividends paid (370) (390) (370) (390)
Net cash from/(used in) financing activities £ (216) £ (1,576) £ (171) £ (1,806)
Effect of exchange rate changes on
cash and cash equivalents £ (67) £ (10) £ (83) £ (33)
Net increase/(decrease) in cash
and cash equivalents £ 944 £ (270) £ 763 £ (426)
Cash and cash equivalents less overdrafts at beginning of period £ 1,125 £ 1,395 £ 1,926 £ 2,352
Cash and cash equivalents less overdrafts at end of period £ 2,069 1,125 2,689 1,926
£ mil £ mil£ mil£ mil
Company Group
2011 20102011 2010
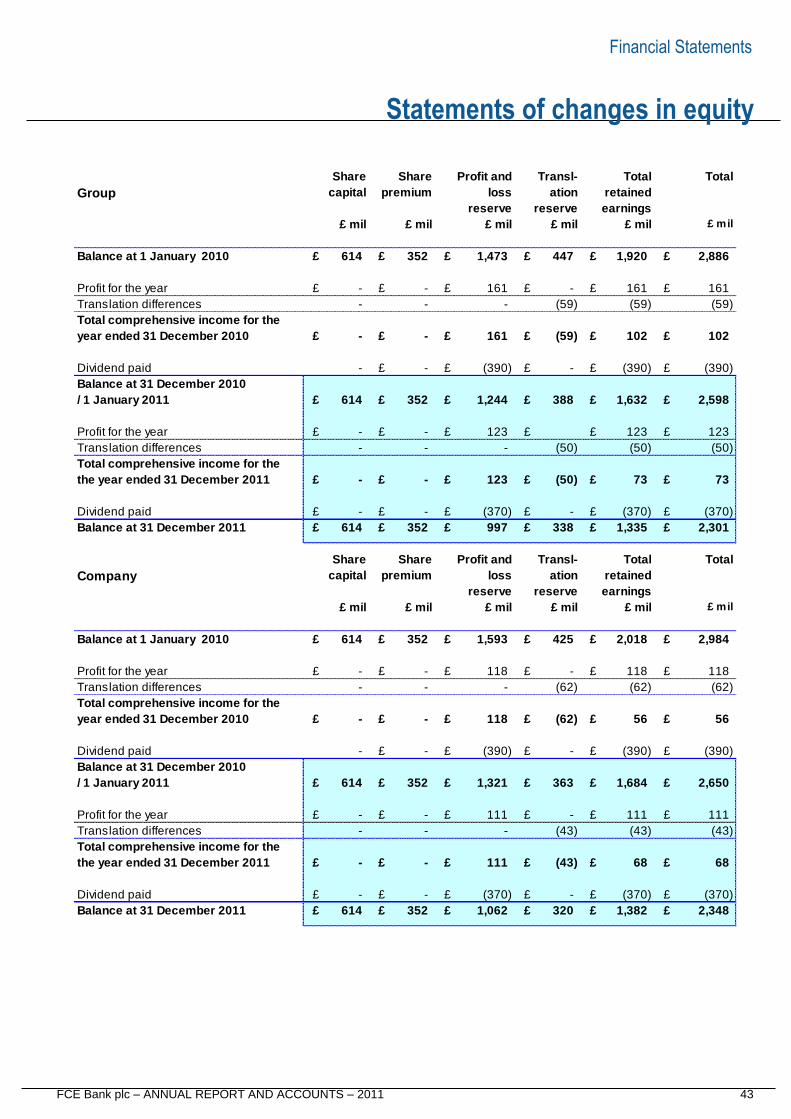
Financial Statements
FCE Bank plc – ANNUAL REPORT AND ACCOUNTS – 2011 43
Statements of changes in equity
Balance at 1 January 2010 £ 614 £ 352 £ 1,473 £ 447 £ 1,920 £ 2,886
Profit for the year £ - £ - £ 161 £ - £ 161 £ 161
Translation differences - - - (59) (59) (59)
Total comprehensive income for the
year ended 31 December 2010 £ - £ - £ 161 £ (59) £ 102 £ 102
Dividend paid - £ - £ (390) £ - £ (390) £ (390)
Balance at 31 December 2010
/ 1 January 2011 £ 614 £ 352 £ 1,244 £ 388 £ 1,632 £ 2,598
Profit for the year £ - £ - £ 123 £ £ 123 £ 123
Translation differences - - - (50) (50) (50)
Total comprehensive income for the
the year ended 31 December 2011 £ - £ - £ 123 £ (50) £ 73 £ 73
Dividend paid £ - £ - £ (370) £ - £ (370) £ (370)
Balance at 31 December 2011 £ 614 £ 352 £ 997 £ 338 £ 1,335 £ 2,301
Balance at 1 January 2010 £ 614 £ 352 £ 1,593 £ 425 £ 2,018 £ 2,984
Profit for the year £ - £ - £ 118 £ - £ 118 £ 118
Translation differences - - - (62) (62) (62)
Total comprehensive income for the
year ended 31 December 2010 £ - £ - £ 118 £ (62) £ 56 £ 56
Dividend paid - £ - £ (390) £ - £ (390) £ (390)
Balance at 31 December 2010
/ 1 January 2011 £ 614 £ 352 £ 1,321 £ 363 £ 1,684 £ 2,650
Profit for the year £ - £ - £ 111 £ - £ 111 £ 111
Translation differences - - - (43) (43) (43)
Total comprehensive income for the
the year ended 31 December 2011 £ - £ - £ 111 £ (43) £ 68 £ 68
Dividend paid £ - £ - £ (370) £ - £ (370) £ (370)
Balance at 31 December 2011 £ 614 £ 352 £ 1,062 £ 320 £ 1,382 £ 2,348
Company
capital premium
premium
Group
£ mil £ mil
Profit and Share Share
capital
Share Share
loss
reserve
£ mil
loss
£ mil
earnings
Profit and
ation
Transl- Total
£ mil
reserve reserve
£ mil £ mil
reserve earnings
retained
Total
ation retained
Transl-
£ mil £ mil
£ mil£ mil
Total
£ mil
Total
Financial Statements
44 FCE Bank plc – ANNUAL REPORT AND ACCOUNTS – 2011
Notes to the consolidated financial statements for the year ended 31 December 2011
Policy
1 Accounting policies ............................................................ 45
Income Statement
2 Net interest income ........................................................ 54
3 Net fees and commission income ................................... 55
4 Other operating income ................................................... 56
5 Operating expenses ........................................................ 57
6 Transactions with Directors and Officers ......................... 58
7 Fair value adjustments to financial instruments .............. 60
8 Gain or loss on foreign exchange ................................... 61
9 Profit before tax ............................................................... 62
10 Income tax expenses ...................................................... 65
Balance Sheet
11 Cash and advances ........................................................ 66
12 Marketable securities ...................................................... 67
13 Derivative financial instruments ...................................... 68
14 Other assets .................................................................... 70
15 Loans and advances to customers ................................ 71
16 Provision for incurred losses ........................................... 73
17 Provision for vehicle residual value losses ..................... 74
18 Securitisation and related financing ............................... 75
19 Property and equipment ................................................. 77
20 Income taxes receivable and payable ............................. 79
21 Deferred tax assets and liabilities.................................... 79
22 Goodwill and other intangible assets............................... 81
23 Investment in a jointly controlled entity ........................... 82
24 Investments in group undertakings ................................. 82
25 Due to banks and other financial institutions .................. 84
26 Corporate deposits .......................................................... 85
27 Due to parent and related undertakings .......................... 86
28 Debt securities in issue ................................................... 87
29 Other liabilities ................................................................ 88
30 Subordinated loans ......................................................... 89
31 Ordinary shares and share premium ............................... 90
32 Dividend per share .......................................................... 90
33 Components of capital ................................................... 91
Off balance sheet information
34 Retirement benefit obligations ......................................... 93
35 Contingent liabilities ........................................................ 98
36 Commitments .................................................................. 99
37 Future lease commitments .............................................. 99
Risk
38 Credit Risk .................................................................... 100
39 Vehicle residual values ................................................. 104
40 Financial market risk .................................................... 105
40a Currency risk ................................................................ 106
40b Interest rate risk ............................................................ 107
41 Liquidity risk .................................................................. 108
42 Financial assets and financial liabilities ........................ 113
Other
43 Related party transactions ............................................ 117
44 Segment reporting ....................................................... 120
45 Notes to statements of cash flows ................................ 124
46 FCE and other related party information ....................... 126
47 Post balance sheet events ............................................ 126
Index to the Notes to the Financial Statements
Financial Statements
FCE Bank plc – ANNUAL REPORT AND ACCOUNTS – 2011 45
Notes to the consolidated financial statements for the year ended 31 December 2011
1 ACCOUNTING POLICIES
The principal accounting policies adopted in the preparation of these consolidated financial statements are set out below.
A Basis of presentation .................................................... 45
B Group accounts ............................................................ 47
C Critical accounting estimates ........................................ 47
D Segment reporting ........................................................ 48
E Net interest income ....................................................... 48
F Fees and commissions income and expense ............... 48
G Other operating income ................................................ 48
H Employee benefits ........................................................ 48
I Cash and cash equivalents and marketable securities . 49
J Financial assets, financial liabilities and offsetting ........ 49
K Derivative financial instruments and hedging................ 50
L Other assets ................................................................. 50
M Loans and advances to customers ............................... 50
N Leases .................................................................... 51
O Provision for incurred losses................................... 51
P Securitisation and related financing ........................ 52
Q Vehicle residual value provisions ............................ 52
R Property and equipment ......................................... 52
S Deferred and current income taxes ........................ 52
T Goodwill and other intangible assets ...................... 53
U Investments in group undertakings ......................... 53
V Debt ....................................................................... 53
W Other liabilities and provisions ................................ 53
X Dividends ................................................................ 53
Y Financial guarantees ............................................. 53
A Basis of Presentation
These consolidated financial statements are prepared in
accordance with International Financial Reporting Standards
(IFRS) and International Financial Reporting Interpretations
Committee (IFRIC) interpretations and with those parts of the
Companies Act 2006 applicable to companies reporting
under IFRS. The standards applied are those issued by the
International Accounting Standards Board and adopted by
the European Union. The consolidated financial statements
are prepared under a historical cost convention with the
exception of certain financial assets and liabilities which are
stated at fair value as disclosed under Note 42 'Financial
assets and financial liabilities'.
As required by the Companies Act 2006 and Article 4 of the
IAS Regulation, FCE files financial statements for both
Company and Group accounts respectively:
• 'Company' accounts included within these consolidated
financial statements comprises of FCE Bank plc. a UK
registered company, and all of its European branches.
• 'Group' accounts include FCE Bank plc. a UK registered
company, and all of its European branches and
subsidiaries. Refer to Note 24 'Investments in group
undertakings' for details of FCE's subsidiaries.
Income statement – As permitted by Section 408 of the
Companies Act 2006, a separate income statement has not
been presented in respect of the Company. The profit after
tax of the Company is reported within the Company
disclosures contained in the 'Statements of changes in
equity'.
Presentation currency - The consolidated financial
statements are presented in Sterling. Assets and liabilities of
each entity of the Group which are denominated in foreign
currencies are translated into Sterling at the exchange rates
published at the balance sheet date.
Income statements and cash flows of branches and
subsidiaries outside of the UK are translated into the Group's
presentational currency at average exchange rates.
Exchange differences arising from the application of year end
rates of exchange to opening net assets of foreign branches
and subsidiaries are taken to shareholder's equity, as are
those differences resulting from the revaluation of the results
of foreign operations from average to year end rates of
exchange.
On disposal or liquidation of a foreign entity such exchange
rate differences are recognised within the income statement
under the caption 'Other operating income' as part of the gain
or loss on sale.
Statements of cash flows - FCE has elected to produce an
indirect statement of cash flow and as such will show cash
flows from operating activities by adjusting profit before tax
for non cash items and changes in operating assets and
liabilities.
Index to the Accounting Policies
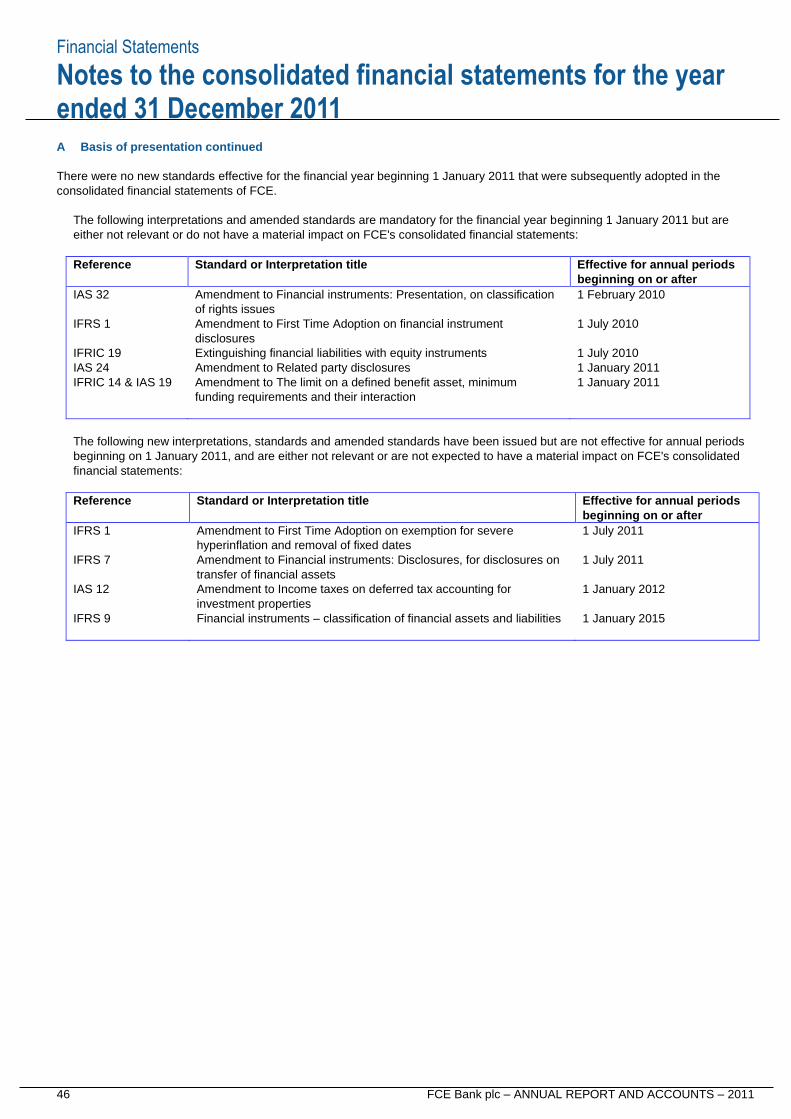
Financial Statements
46 FCE Bank plc – ANNUAL REPORT AND ACCOUNTS – 2011
Notes to the consolidated financial statements for the year ended 31 December 2011
A Basis of presentation continued
There were no new standards effective for the financial year beginning 1 January 2011 that were subsequently adopted in the
consolidated financial statements of FCE.
The following interpretations and amended standards are mandatory for the financial year beginning 1 January 2011 but are
either not relevant or do not have a material impact on FCE's consolidated financial statements:
Reference Standard or Interpretation title Effective for annual periods
beginning on or after
IAS 32 Amendment to Financial instruments: Presentation, on classification
of rights issues
1 February 2010
IFRS 1
IFRIC 19
Amendment to First Time Adoption on financial instrument
disclosures
Extinguishing financial liabilities with equity instruments
1 July 2010
1 July 2010
IAS 24 Amendment to Related party disclosures 1 January 2011
IFRIC 14 & IAS 19 Amendment to The limit on a defined benefit asset, minimum
funding requirements and their interaction
1 January 2011
The following new interpretations, standards and amended standards have been issued but are not effective for annual periods
beginning on 1 January 2011, and are either not relevant or are not expected to have a material impact on FCE's consolidated
financial statements:
Reference Standard or Interpretation title Effective for annual periods
beginning on or after
IFRS 1
IFRS 7
IAS 12
Amendment to First Time Adoption on exemption for severe
hyperinflation and removal of fixed dates
Amendment to Financial instruments: Disclosures, for disclosures on
transfer of financial assets
Amendment to Income taxes on deferred tax accounting for
investment properties
1 July 2011
1 July 2011
1 January 2012
IFRS 9 Financial instruments – classification of financial assets and liabilities 1 January 2015
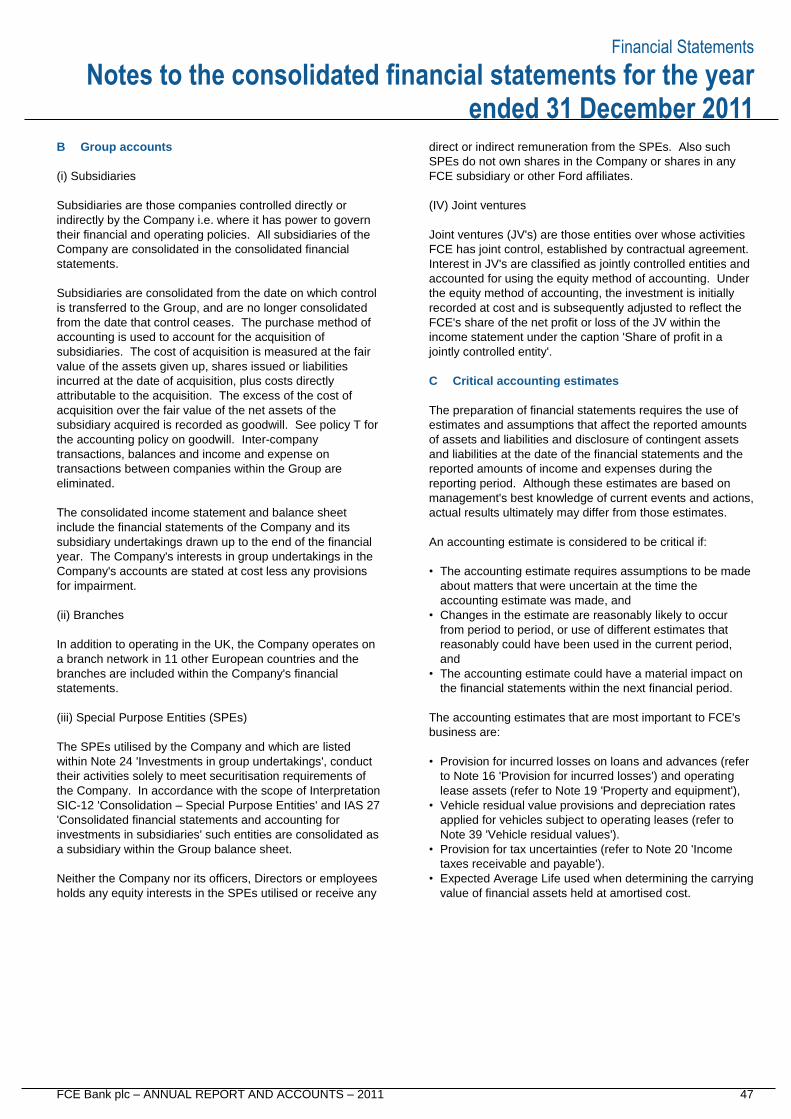
Financial Statements
FCE Bank plc – ANNUAL REPORT AND ACCOUNTS – 2011 47
Notes to the consolidated financial statements for the year ended 31 December 2011
B Group accounts
(i) Subsidiaries
Subsidiaries are those companies controlled directly or
indirectly by the Company i.e. where it has power to govern
their financial and operating policies. All subsidiaries of the
Company are consolidated in the consolidated financial
statements.
Subsidiaries are consolidated from the date on which control
is transferred to the Group, and are no longer consolidated
from the date that control ceases. The purchase method of
accounting is used to account for the acquisition of
subsidiaries. The cost of acquisition is measured at the fair
value of the assets given up, shares issued or liabilities
incurred at the date of acquisition, plus costs directly
attributable to the acquisition. The excess of the cost of
acquisition over the fair value of the net assets of the
subsidiary acquired is recorded as goodwill. See policy T for
the accounting policy on goodwill. Inter-company
transactions, balances and income and expense on
transactions between companies within the Group are
eliminated.
The consolidated income statement and balance sheet
include the financial statements of the Company and its
subsidiary undertakings drawn up to the end of the financial
year. The Company's interests in group undertakings in the
Company's accounts are stated at cost less any provisions
for impairment.
(ii) Branches
In addition to operating in the UK, the Company operates on
a branch network in 11 other European countries and the
branches are included within the Company's financial
statements.
(iii) Special Purpose Entities (SPEs)
The SPEs utilised by the Company and which are listed
within Note 24 'Investments in group undertakings', conduct
their activities solely to meet securitisation requirements of
the Company. In accordance with the scope of Interpretation
SIC-12 'Consolidation – Special Purpose Entities' and IAS 27
'Consolidated financial statements and accounting for
investments in subsidiaries' such entities are consolidated as
a subsidiary within the Group balance sheet.
Neither the Company nor its officers, Directors or employees
holds any equity interests in the SPEs utilised or receive any
direct or indirect remuneration from the SPEs. Also such
SPEs do not own shares in the Company or shares in any
FCE subsidiary or other Ford affiliates.
(IV) Joint ventures
Joint ventures (JV's) are those entities over whose activities
FCE has joint control, established by contractual agreement.
Interest in JV's are classified as jointly controlled entities and
accounted for using the equity method of accounting. Under
the equity method of accounting, the investment is initially
recorded at cost and is subsequently adjusted to reflect the
FCE's share of the net profit or loss of the JV within the
income statement under the caption 'Share of profit in a
jointly controlled entity'.
C Critical accounting estimates
The preparation of financial statements requires the use of
estimates and assumptions that affect the reported amounts
of assets and liabilities and disclosure of contingent assets
and liabilities at the date of the financial statements and the
reported amounts of income and expenses during the
reporting period. Although these estimates are based on
management's best knowledge of current events and actions,
actual results ultimately may differ from those estimates.
An accounting estimate is considered to be critical if:
• The accounting estimate requires assumptions to be made
about matters that were uncertain at the time the
accounting estimate was made, and
• Changes in the estimate are reasonably likely to occur
from period to period, or use of different estimates that
reasonably could have been used in the current period,
and
• The accounting estimate could have a material impact on
the financial statements within the next financial period.
The accounting estimates that are most important to FCE's
business are:
• Provision for incurred losses on loans and advances (refer
to Note 16 'Provision for incurred losses') and operating
lease assets (refer to Note 19 'Property and equipment'),
• Vehicle residual value provisions and depreciation rates
applied for vehicles subject to operating leases (refer to
Note 39 'Vehicle residual values').
• Provision for tax uncertainties (refer to Note 20 'Income
taxes receivable and payable').
• Expected Average Life used when determining the carrying
value of financial assets held at amortised cost.
Financial Statements
48 FCE Bank plc – ANNUAL REPORT AND ACCOUNTS – 2011
Notes to the consolidated financial statements for the year ended 31 December 2011
D Segment reporting
Operating segments are the components of an entity that
management uses to make decisions about operating
matters. These are identified on the basis of the internal
reports that are regularly reviewed by the entity's chief
operating decision maker in order to allocate resources to the
segment and assess performance. An operating segment
engages in business activities from which it may earn
revenues and incur expenses for which discrete financial
information is available.
For the purpose of these financial statements and in
accordance with IFRS 8 'Operating segments' FCE's
reportable operating segments are based around a business
unit structure grouped into the various geographic locations
of its operations. All segments representing 10% or more of
FCE's revenue, profit before tax or assets are reported as
individual reportable segments.
Allocation of costs: The main costs which are required to be
allocated between operating segments and the basis of
allocation are as follows:
• Central staff costs are analysed by department and type of
cost and allocated to the location benefiting from the
service. Various allocation methods are used that ensure
an equitable allocation between locations of central staff
costs.
• In certain of FCE's European branches and subsidiaries
funding is obtained by a mixture of local and centrally
allocated funding. The costs of central funding, including
derivative costs are, where possible, directly allocated to
locations where transactions can be specifically identified.
The costs of central funding and holding excess liquidity
are allocated across locations on an annual basis to
ensure an appropriate allotment of funding costs.
Operational efficiencies are also obtained by pooling
certain funding, and the related financing costs are
allocated across locations to ensure an appropriate
allotment of funding costs.
Income and expense from the allocation of intra and inter-
company transactions are eliminated on consolidation.
E Net interest income
Interest income and expense is recognised in the income
statement using the effective interest method.
Interest supplements and other support payments from
related parties (including Ford and affiliated manufacturers)
are provided at the time of purchase or origination of eligible
contracts from dealers. The income is deferred on the
balance sheet under the caption 'Loans and advances to
customers' and is recognised in 'Interest income' using the
effective interest method, over the expected term of the
related receivable.
Certain loan origination fees (income) and costs (expenses)
which can be directly associated to the origination of loans
and advances to customers are regarded as part of the
economic return on the loan and included in the loan's
carrying value and deferred. The amount deferred is
recognised in net interest income, using the effective interest
method, over the expected term of the related receivable.
F Fees and commissions income and expense
Both fees and commissions income and expenses are
recognised on an accruals basis net of any taxes payable.
Commissions and other bonuses payable to dealers which
can be directly associated with the origination of financed
receivables are regarded as part of the economic return of
the receivables and included as part of the receivable's
carrying value. The amount deferred is recognised as a
reduction to interest income using the effective interest rate
method over the term of the related receivable.
Commissions and other bonuses payable which cannot be
directly associated with the origination of financed
receivables are expensed as incurred.
G Other operating income
Other operating income includes the rentals receivable for
vehicles provided under operating leases. Rental income on
operating leases is credited to income on a straight-line basis.
H Employee benefits
(i) Retirement benefit obligations
The Company participates in pension schemes that share
the risks between entities under common control, and there
is no contractual agreement for charging the net defined
benefit costs. In such cases the Company recognises a cost
equal to contributions payable for the period only and
discloses such schemes as 'Accounted for as defined
contribution'. Contributions payable by the Company are
advised by the principal company which is a related party of
FCE. The net liabilities or assets relating to the scheme are
not recognised in the balance sheet.
Financial Statements
FCE Bank plc – ANNUAL REPORT AND ACCOUNTS – 2011 49
Notes to the consolidated financial statements for the year ended 31 December 2011
H Employee benefits continued
Some of FCE's branches and subsidiaries operate defined
benefit pension schemes. Valuations of the pension fund
assets and liabilities are completed by a professionally
qualified independent actuary. Such valuations include
recommendations of future rates of contributions payable into
the scheme by the principal company. The funds are valued
at least every three years by the actuary. The principal UK
fund is valued every two years.
FCE branches that operate defined benefit plans for which
Company employees are the only participants recognise the
net liability or asset in the balance sheet. Actuarial gains and
losses are recognised in profit and loss as they occur,
together with contributions payable for the period.
For defined contribution plans, FCE pays contributions to
publicly or privately administered pension insurance plans on
a mandatory, contractual or voluntary basis. Once the
contributions have been paid, FCE has no further payment
obligations. The regular contributions constitute net periodic
costs for the years in which they are due.
All costs are included within 'Operating expenses'.
(ii) Share-based payments
Under a revised long term incentive programme time-based
Restricted Stock Units (RSU) are awarded to Directors and
other eligible employees of FCE. Following a specified
restriction period the RSU convert to shares of Ford
Common Stock. The shares carry all associated rights
including voting rights and the right to any dividend payments.
Grants awarded vest over a three year service period as
follows:
• One year from the date of the agreement 33% of the grant
will vest
• Two years from the date of the agreement an additional
33% of the grant will vest
• Three years from the date of the agreement an additional
34% of the grant will vest
The fair value of the employee services received in exchange
for the grant of RSU is recognised as an expense and a
corresponding increase in 'Other equity adjustments', which
is part of ‘Retained earnings’, over the vesting period.
The total amount to be expensed over the vesting period is
determined by reference to the fair value of Ford Common
Stock on the grant date, excluding any non-market vesting
conditions. Non-market vesting conditions are taken into
account so that the amount expensed is based on the
number of shares that eventually vest.
Costs of providing the grant of RSU are charged to FCE by
Ford in the year granted and are recognised in 'Other equity
adjustments', which is part of ‘Retained earnings’.
Prior to revision of the long-term incentive programme during
2007 share options which can be exercised over Ford
Common Stock, were granted to Directors and to employees
of FCE. A limited number of share options have been
granted since 2007. The options vest and may be exercised
in instalments as follows:
• One year from the date of the agreement 33% of the
shares may be exercised
• Two years from the date of the agreement an additional
33% of the shares granted may be exercised
• Three years from the date of the agreement an additional
34% of the shares granted may be exercised
The share options are accounted for on a basis consistent
with that for RSU as described above.
Share based payments do not have a material impact on the
financial statements of the Company or Group.
I Cash and cash equivalents and marketable securities
Cash and cash equivalents comprise of balances which have
a maturity at acquisition of 90 days or less including: treasury
bills and other eligible bills, amounts due from other banks
and petty cash.
Marketable securities comprises of treasury bills and other
eligible bills which have a maturity at acquisition of greater
than 90 days. J Financial assets, financial liabilities and offsetting
FCE classifies its financial assets and financial liabilities at
inception into the following categories:
• Financial assets at fair value through profit and loss
This category consists of cash and cash equivalents,
marketable securities and derivative financial instruments
held at fair value with changes in fair value recognised in
profit and loss.
Assets in this category are measured at fair value using
market rates and industry standard valuation models.
• Loans and advances
These are non-derivative assets with fixed or determinable
payments that are not quoted in an active market as further
described in accounting policy M.
• Financial liabilities at fair value through profit and loss
This consists of derivatives which are held at fair value, with
changes in fair value recognised in profit and loss.
Financial Statements
50 FCE Bank plc – ANNUAL REPORT AND ACCOUNTS – 2011
Notes to the consolidated financial statements for the year ended 31 December 2011
J Financial assets, financial liabilities and offsetting
continued
• Financial liabilities at amortised costs
These include borrowings, corporate deposits, debt
securities in issue and subordinated loans that are initially
recognised at fair value. These are subsequently measured
at amortised cost using the effective interest method.
Offsetting
Financial assets and liabilities are offset and the net amount
reported in the balance sheet if, and only if, there is a current
enforceable legal right to set off the recognised amounts and
there is an intention to settle on a net basis.
FCE has not classified any financial assets into the available
for sale or held to maturity category.
K Derivative financial instruments and hedging
Derivatives are measured at fair value. The fair values of
derivatives are calculated using market rates and industry
standard valuation models. These models project future
cash flows and discount the future amounts to a present
value using market-based expectations for interest rates,
foreign exchange rates and the contractual terms of the
derivative instruments.
In certain cases, where market data is not available, FCE
develops assumptions to determine fair value.
Derivatives are included in assets when the fair value is
positive and in liabilities when the fair value is negative.
When a derivative contract is entered into, FCE may
designate certain derivatives as a hedge of the fair value of a
recognised asset or liability ('fair value’ hedge).
The fair values of derivative instruments are disclosed in
Note 13 'Derivative financial instruments'.
Hedge accounting
Hedge accounting is applied for derivatives only when the
following criteria are met:
a) formal documentation of the hedging instrument, hedged
item, hedge objective, strategy and relationship is prepared
at or before inception of the hedge transaction;
b) the hedge is documented showing that it is expected to
be highly effective in offsetting the risk in the hedged item
throughout the reporting period; and
c) the hedge is highly effective on an ongoing basis, as
measured by re-performance of effectiveness testing on a
minimum quarterly basis.
Fair value hedge accounting
Changes in the fair value of derivatives that qualify and are
designated as fair value hedges are recorded in the income
statement, together with changes in the fair value of the
hedged item that are attributable to the hedged risk under the
caption 'Fair value adjustments to financial instruments'.
When a derivative is de-designated from a fair value hedge
relationship, or when the derivative in a fair value hedge
relationship is terminated before maturity, the fair value
adjustment to the hedged item continues to be reported as
part of the basis of the item and is amortised to the income
statement over its remaining life.
Derivatives not qualifying for hedge accounting
Certain derivative transactions (referred to as non-
designated in Note 13 'Derivative financial instruments'),
while providing effective economic hedges under the Group's
risk management policies either do not qualify for hedge
accounting under the specific rules in IAS 39 'Financial
instruments, recognition and measurement' or FCE elects not
to apply hedge accounting. These derivatives are held at fair
value and fair value gains and losses are reported in the
income statement under the caption 'Fair value adjustments
to financial instruments.
L Other assets
The carrying value of 'Other assets' is stated at cost less any
provision for impairment. Vehicles returned to FCE from
operating lease, retail and finance leases which are awaiting
resale are carried at the net book value after adjusting for
any residual value provisions. Vehicles consigned to dealers
on consignment financing arrangements are disclosed in
Note 14 'Other assets'.
Gains and losses on disposals of Operating lease vehicles
are included in the income statement under the caption
‘Depreciation of property and equipment’ and for vehicles
returned from retail and finance lease contracts under
'Interest income'.
M Loans and advances to customers
Loans and advances to customers including finance lease
receivables are non-derivative financial assets with fixed or
determinable payments that are not quoted in an active
market and which are not classified as available for sale.
Loans and advances to customers are initially recognised at
fair value including direct and incremental transaction fees
(including interest supplements and other support payments
from related parties) and costs. They are subsequently
valued at amortised cost, using the effective interest rate
method – refer to accounting policy E 'Net interest income'.
Financial Statements
FCE Bank plc – ANNUAL REPORT AND ACCOUNTS – 2011 51
Notes to the consolidated financial statements for the year ended 31 December 2011
N Leases
(i) Where FCE is the lessor:
Finance leases – Assets purchased by customers under
conditional sale agreements and leased under finance leases
are included in 'Loans and advances to customer' at the
gross amount receivable, less unearned finance charges.
Finance income is recognised over the lease term using the
net investment method so as to reflect a constant periodic
rate of return in proportion to the net investment in the
contract.
Operating leases – Assets leased to customers under
operating leases are included in 'Property and equipment'.
Income recognised in the income statement is described in
accounting policy G.
ii) Where FCE is the lessee:
The leases entered into by FCE are all operating leases.
Operating lease rental expense is charged to the income
statement within 'Operating expense' on a straight line basis
over the period of the lease.
When an operating lease is terminated before the lease
period has expired, any payment required to be made to the
lessor by way of penalty is recognised in the period in which
the obligation arises.
O Provision for incurred losses
A provision for incurred losses is established when FCE
considers the credit-worthiness of an individual borrower or
lessee has deteriorated such that the recovery of the whole
or part of an outstanding advance or group of loan assets is
in doubt. The criteria that FCE uses to determine that there
is objective evidence that an impairment loss has occurred
include:
• Delinquency in contractual payments of principal or interest
(and at no later than 120 days past due);
• Cash flow difficulties experienced by the borrower (for
example, equity ratio, net income percentage of sales);
• Breach of loan covenants or conditions;
• Initiation of bankruptcy proceedings;
• Deterioration of the borrower’s competitive position;
• Deterioration in the value of collateral.
The provision takes into consideration the financial condition
of the borrower or lessee, the value of the collateral,
recourse to guarantors and other factors. Loan assets with
similar credit characteristics are grouped together and
evaluated for impairment on a collective basis.
Following the impairment of a retail financing contract the
carrying value of the loan (both 'Gross' and 'Net' as reported
in Note 15 'Loans and advances to customers') is reduced to
reflect the average vehicle recovery value. The average
vehicle recovery value is calculated by multiplying the
expected sale proceeds of the vehicle by historical vehicle
recovery percentages. Following vehicle recovery and prior
to vehicle resale, the carrying value of the loan is eliminated
and the vehicle is recorded in 'Other Assets' at the estimated
realisable value net of disposal costs. Any further recoveries
for contracts previously charged off as uncollectible are
written back to 'provision for incurred losses' on loans and
advances to customers.'
At the point a wholesale loan is considered doubtful the
carrying value of the loan is reduced by the use of a specific
impairment allowance for the estimated uncollectible amount.
If a loan is considered doubtful for an extended period, (and
at no later than 120 days), the specific impairment allowance
is released and the carrying value of the loan is reduced to
reflect the estimated collectable amount.
A provision for incurred losses is made against loans and
advances and operating lease assets to cover bad and
doubtful debts which have been incurred and not separately
identified, but which are known from experience to be
present in portfolios of loans and advances and operating
leases. The provision is determined based on a number of
factors including historical loss trends, the credit quality of
the present portfolio and general economic factors.
Provisions for incurred losses relating to operating lease
assets are presented as an adjustment to accumulated
depreciation.
Provision for incurred losses is deducted from loans and
advances to customers and property and equipment and is
included in the income statement under the caption
'Impairment losses on loans and advances’ and 'Depreciation
of property and equipment' respectively. The provision for
incurred losses comprises the brought forward balance at the
beginning of the period plus the income statement charge as
referred to above less 'Net losses' and includes exchange
adjustments relating to foreign currency translation. 'Net
losses' comprises of loans that have been written off when
there is no realistic prospect of recovery, less any
subsequent recoveries of bad debts which had previously
been written off.
Retail and wholesale loans whose terms have been
renegotiated in the normal course of business and for which
no objective evidence of impairment loss has occurred are
not considered as past due or impaired.
Financial Statements
52 FCE Bank plc – ANNUAL REPORT AND ACCOUNTS – 2011
Notes to the consolidated financial statements for the year ended 31 December 2011
P Securitisation and related financing
The Company has entered into financing arrangements with
lenders in order to finance loans and advances to customers.
Such receivables have typically been sold for legal purposes
to consolidated Special Purpose Entities (SPEs). As the
Company is not fully isolated from the risks and benefits of
securitisation transactions, the requirements of IAS 39
'Financial instruments, recognition and measurement' have
been followed. As required by IAS 39 the Company
continues to recognise the carrying value of the transferred
assets and a liability is recognised, net of retained interests,
for the proceeds of the funding transaction.
Certain transaction costs which can be directly associated to
securitisation debt issuance are deferred – refer to
accounting policy W 'Debt'.
Q Vehicle residual value provisions
Residual values represent the estimated value of the vehicle
at the end of the retail or leasing financing plan. Residual
values are calculated after analysing published residual
values and FCE's own historical experience in the used
vehicle market.
Residual value provisions and accumulated depreciation on
vehicles subject to operating leases are based on
assumptions as to the used car prices at the end of the
financing plan and the number of vehicles that will be
returned. Vehicle residual value provisions are reviewed at
least quarterly and are accounted for as an adjustment to the
carrying value of the assets. The amount of any impairment
to residual values is accounted for as supplemental
depreciation for operating leases and as a deduction from
'Loans and advances to customers' for retail and finance
lease contracts. These assumptions and the related
reserves may change based on market conditions - refer to
accounting policy C 'Critical accounting estimates'.
Changes to residual value provisions for retail and finance
lease contracts are included in the income statement under
the caption 'Interest income' and for operating leases within
'Depreciation of property and equipment'.
R Property and equipment
All property and equipment is stated at historical cost less
accumulated depreciation. Depreciation is calculated on a
straight line method to write down the cost of such assets to
their residual values at the following rates:
Where the carrying amount of an asset is greater than its
estimated recoverable amount, it is written down immediately
to its recoverable amount. Gains and losses on disposal of
property and equipment are determined by reference to their
carrying amount and are included in 'Operating expenses' in
the income statement.
Operating lease assets over which FCE has entered into
operating lease agreements as the lessor are included in
Property and equipment. Depreciation is charged on
Operating Lease assets over the period of the lease to its
estimated residual value on a straight line basis.
The depreciation policy for leased vehicles (including
vehicles subject to operating leases) is reviewed on a regular
basis taking into consideration various assumptions, such as
expected residual values at lease termination and the
estimated number of vehicles that will be returned.
Adjustments to reflect revised estimates of expected residual
values at the end of the lease terms are recorded on a
straight-line basis. Upon return of the vehicle, depreciation
expense is adjusted for the difference between net book
value and expected resale value and the vehicle is
transferred to 'Other assets'.
S Deferred and current income taxes
Deferred tax is provided in full, using the liability method, on
temporary differences arising between the tax bases of
assets and liabilities and their carrying amounts in the
financial statements. Deferred tax is recognised in the
income statement except to the extent that it relates to items
recognised directly in equity, in which case it is recognised in
equity.
Deferred tax is determined using tax rates and laws that
have been substantively enacted by the balance sheet date
and are expected to apply when the related deferred tax
asset is realised or the deferred tax liability is settled.
Deferred tax assets are recognised to the extent that it is
probable that future taxable profit will be available against
which the temporary differences can be utilised.
Income tax payable on profits is based on the applicable tax
law in each company's jurisdiction and is calculated at rates
of tax substantially enacted at the balance sheet date.
Income tax payable is recognised as an expense in the
period in which the profits arise. The tax effects of income
tax losses available for carry forward are recognised as an
asset when it is probable that future taxable profits will be
available which these losses can be utilised against.
Annual
Asset type Depreciation Rate
Computer equipment 25.00%
Other office equipment 8.00%
Company motor vehicles 25.00%
Financial Statements
FCE Bank plc – ANNUAL REPORT AND ACCOUNTS – 2011 53
Notes to the consolidated financial statements for the year ended 31 December 2011
T Goodwill and other intangible assets
(i) Goodwill represents the excess of the cost of an
acquisition over the fair value of the Company's share of the
net assets of the acquired subsidiary at the date of
acquisition. At each balance sheet date goodwill is tested for
impairment and carried at cost less accumulated impairment
losses. Goodwill is allocated to cash-generating units for the
purpose of impairment testing.
(ii) Other intangible assets relate to computer software
development costs. Such costs typically are expensed as
incurred. Costs that are directly associated with identifiable
and unique software products controlled by FCE and which
are anticipated to generate future economic benefits
exceeding costs are recognised as intangible assets. Direct
costs include staff costs of the software development team.
Expenditure which significantly enhances or extends the
performance of computer software programmes beyond their
original specifications is recognised as capital improvements
and added to the original costs of the software. Computer
software development costs recognised as assets are
amortised using a straight line method over their useful lives
of three or eight years for PC/network and mainframe
applications respectively. Other intangible assets are carried
at cost less accumulated amortisation and any impairment
charges. Impairment is tested at each reporting date. The
amortisation of intangible assets is recorded within the
income statement within other operating expenses.
U Investments in group undertakings
The Company's interest in group undertakings are stated at
cost less any provisions for impairment.
V Debt
Debt, which primarily comprises of amounts due to banks
and other financial institutions, corporate deposits, debt
securities in issue and subordinated loans, is initially stated
at fair value net of transaction costs incurred. Foreign
currency debt obligations as other foreign currency assets
and liabilities are translated into sterling at the exchange
rates ruling at the balance sheet date and gains and losses
are recorded within the income statement under the caption
'Loss on foreign exchange'.
Debt not designated as part of a hedging relationship is
subsequently stated at amortised cost and any differences
between net proceeds and the redemption value is
recognised in the income statement over the life of the
underlying debt.
Debt that is designated as part of a fair value hedging
relationship is adjusted to reflect changes in fair value
attributable to the risk being hedged and the gains and
losses are recognised in the income statement within the
same caption as the associated hedge, which is 'fair value
adjustments to financial instruments'.
Certain transaction costs which can be directly associated to
securitisation debt issuance are deferred. For retail and
wholesale securitisation transactions, deferred costs are
amortised to 'interest expense' over the term of the related
debt using the effective interest method. Transaction costs
which cannot be directly associated to securitisation debt
issuance are expensed to 'Operating expenses'.
W Other liabilities and provisions
Provisions are recognised when FCE has a present and legal
or constructive obligation as a result of past events, it is
probable that an outflow of resources will be required to
settle the obligation, and a reliable estimate of the amount of
the obligation can be made.
Provision is made for the anticipated cost of restructuring
including employee separation costs, when an obligation
exists. An obligation exists when FCE has a detailed formal
plan for restructuring an operation and has raised valid
expectations in those affected by the restructuring by starting
to implement the plan or announcing its main features.
Contingent liabilities are possible obligations whose
existence will be confirmed only by uncertain future events or
present obligations where the transfer of economic benefit is
not probable or cannot be reliably measured. Contingent
liabilities are not recognised but are disclosed unless they
are remote.
For the purposes of measurement of uncertain tax positions,
FCE’s unit of measure is by tax authority. Where a range of
outcomes is possible, FCE applies a single best estimate on
a ‘more likely than not’ basis from the range of possible
outcomes.
X Dividends
Dividends declared but not paid are included within the
balance sheet under the caption 'amounts due to parent and
related undertakings'. If the following criteria are met: (i)
proposal by the Directors, and (ii) if a final dividend then
approval at the Annual General Meeting, then at which point
the dividends become formally declared. Dividends declared
following the balance sheet date are disclosed as a non-
adjusting post balance sheet event.
Y Financial guarantees
Financial guarantee contracts are contracts that require the
issuer to make specified payments to reimburse the holder
for a loss it incurs because a specified debtor fails to make
payments when due, in accordance with the terms of a debt
instrument. Financial guarantees are initially recognised in
the balance sheet at fair value.
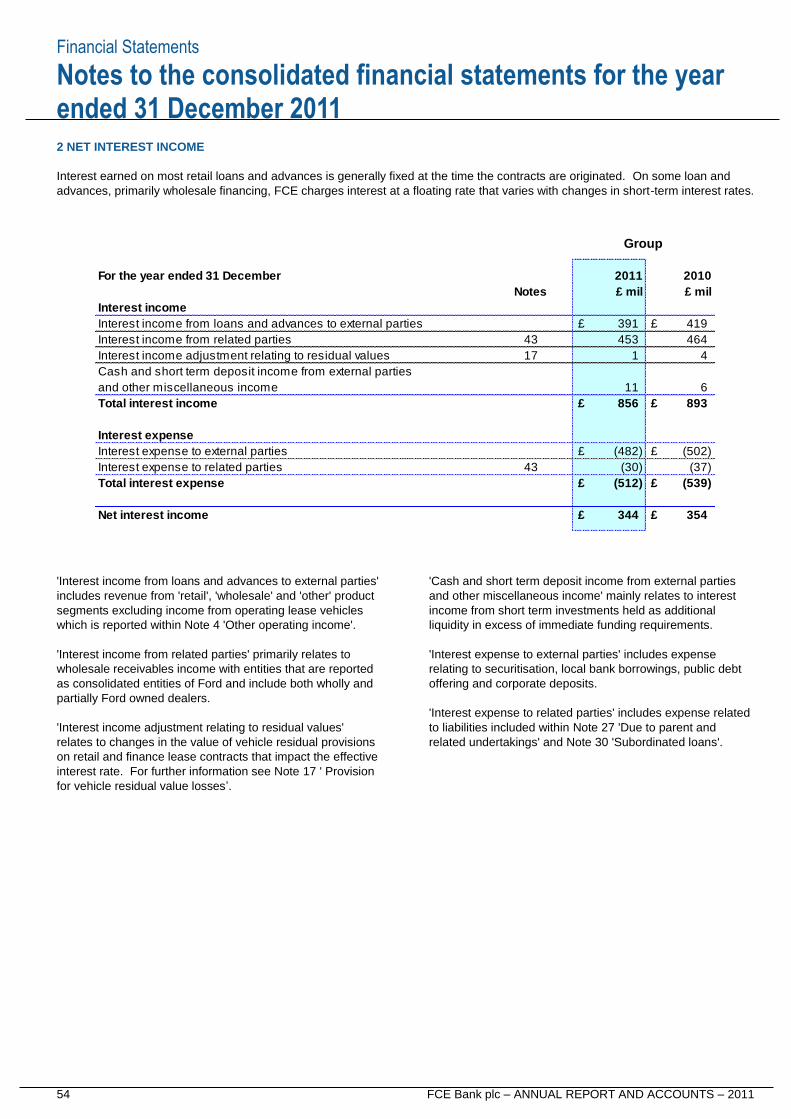
Financial Statements
54 FCE Bank plc – ANNUAL REPORT AND ACCOUNTS – 2011
Notes to the consolidated financial statements for the year ended 31 December 2011
2 NET INTEREST INCOME
Interest earned on most retail loans and advances is generally fixed at the time the contracts are originated. On some loan and
advances, primarily wholesale financing, FCE charges interest at a floating rate that varies with changes in short-term interest rates.
'Interest income from loans and advances to external parties'
includes revenue from 'retail', 'wholesale' and 'other' product
segments excluding income from operating lease vehicles
which is reported within Note 4 'Other operating income'.
'Interest income from related parties' primarily relates to
wholesale receivables income with entities that are reported
as consolidated entities of Ford and include both wholly and
partially Ford owned dealers.
'Interest income adjustment relating to residual values'
relates to changes in the value of vehicle residual provisions
on retail and finance lease contracts that impact the effective
interest rate. For further information see Note 17 ' Provision
for vehicle residual value losses’.
'Cash and short term deposit income from external parties
and other miscellaneous income' mainly relates to interest
income from short term investments held as additional
liquidity in excess of immediate funding requirements.
'Interest expense to external parties' includes expense
relating to securitisation, local bank borrowings, public debt
offering and corporate deposits.
'Interest expense to related parties' includes expense related
to liabilities included within Note 27 'Due to parent and
related undertakings' and Note 30 'Subordinated loans'.
For the year ended 31 December 2011 2010
Notes £ mil £ mil
Interest income
Interest income from loans and advances to external parties £ 391 £ 419
Interest income from related parties 43 453 464
Interest income adjustment relating to residual values 17 1 4
Cash and short term deposit income from external parties
and other miscellaneous income 11 6
Total interest income £ 856 £ 893
Interest expense
Interest expense to external parties £ (482) £ (502)
Interest expense to related parties 43 (30) (37)
Total interest expense £ (512) £ (539)
Net interest income £ 344 £ 354
Group
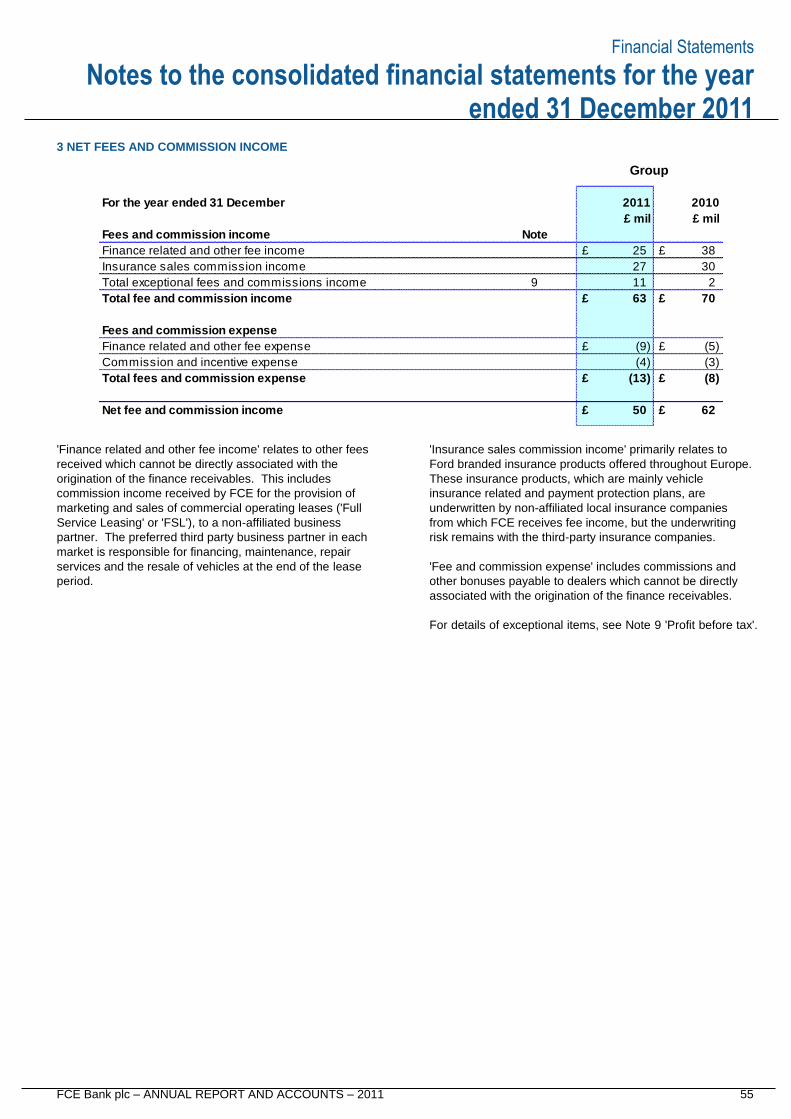
Financial Statements
FCE Bank plc – ANNUAL REPORT AND ACCOUNTS – 2011 55
Notes to the consolidated financial statements for the year ended 31 December 2011
3 NET FEES AND COMMISSION INCOME
'Finance related and other fee income' relates to other fees
received which cannot be directly associated with the
origination of the finance receivables. This includes
commission income received by FCE for the provision of
marketing and sales of commercial operating leases ('Full
Service Leasing' or 'FSL'), to a non-affiliated business
partner. The preferred third party business partner in each
market is responsible for financing, maintenance, repair
services and the resale of vehicles at the end of the lease
period.
'Insurance sales commission income' primarily relates to
Ford branded insurance products offered throughout Europe.
These insurance products, which are mainly vehicle
insurance related and payment protection plans, are
underwritten by non-affiliated local insurance companies
from which FCE receives fee income, but the underwriting
risk remains with the third-party insurance companies.
'Fee and commission expense' includes commissions and
other bonuses payable to dealers which cannot be directly
associated with the origination of the finance receivables.
For details of exceptional items, see Note 9 'Profit before tax'.
For the year ended 31 December 2011 2010
£ mil £ mil
Fees and commission income Note
Finance related and other fee income £ 25 £ 38
Insurance sales commission income 27 30
Total exceptional fees and commissions income 9 11 2
Total fee and commission income £ 63 £ 70
Fees and commission expense
Finance related and other fee expense £ (9) £ (5)
Commission and incentive expense (4) (3)
Total fees and commission expense £ (13) £ (8)
Net fee and commission income £ 50 £ 62
Group
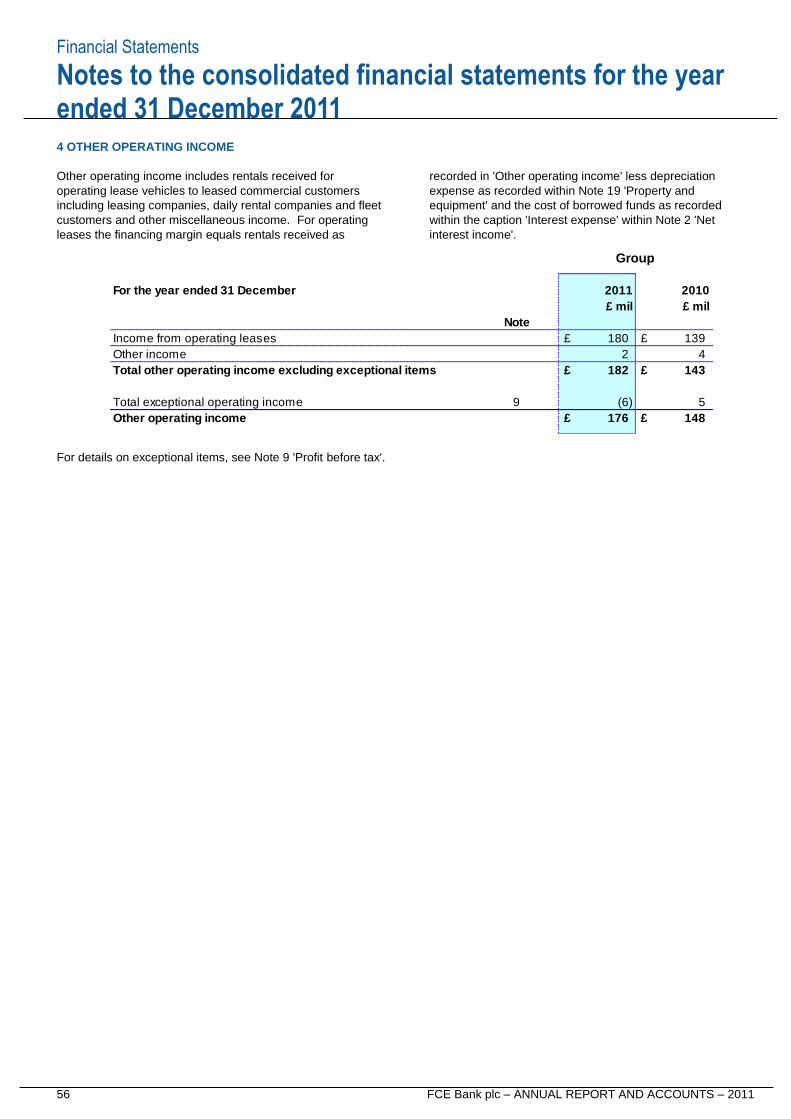
Financial Statements
56 FCE Bank plc – ANNUAL REPORT AND ACCOUNTS – 2011
Notes to the consolidated financial statements for the year ended 31 December 2011
4 OTHER OPERATING INCOME
Other operating income includes rentals received for
operating lease vehicles to leased commercial customers
including leasing companies, daily rental companies and fleet
customers and other miscellaneous income. For operating
leases the financing margin equals rentals received as
recorded in 'Other operating income' less depreciation
expense as recorded within Note 19 'Property and
equipment' and the cost of borrowed funds as recorded
within the caption 'Interest expense' within Note 2 'Net
interest income'.
For details on exceptional items, see Note 9 'Profit before tax'.
For the year ended 31 December 2011 2010
£ mil £ mil
Note
Income from operating leases £ 180 £ 139
Other income 2 4
Total other operating income excluding exceptional items £ 182 £ 143
Total exceptional operating income 9 (6) 5
Other operating income £ 176 £ 148
Group
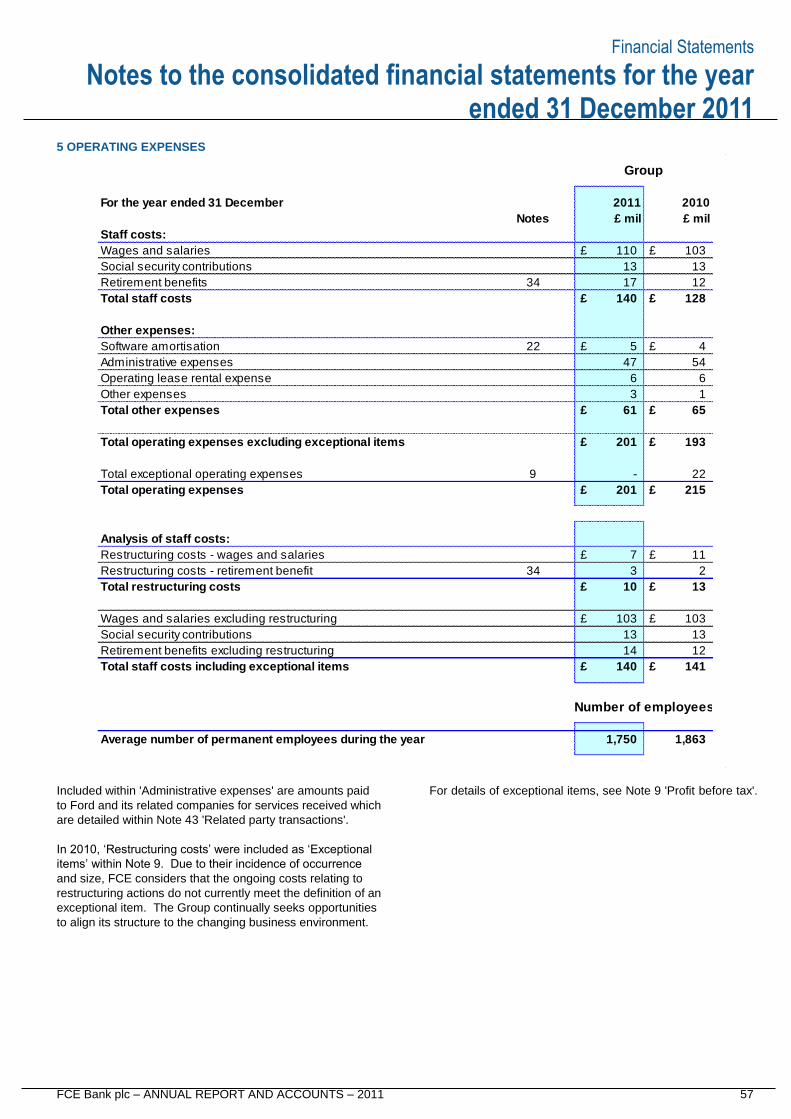
Financial Statements
FCE Bank plc – ANNUAL REPORT AND ACCOUNTS – 2011 57
Notes to the consolidated financial statements for the year ended 31 December 2011
5 OPERATING EXPENSES
Included within 'Administrative expenses' are amounts paid
to Ford and its related companies for services received which
are detailed within Note 43 'Related party transactions'.
In 2010, ‘Restructuring costs’ were included as ‘Exceptional
items’ within Note 9. Due to their incidence of occurrence
and size, FCE considers that the ongoing costs relating to
restructuring actions do not currently meet the definition of an
exceptional item. The Group continually seeks opportunities
to align its structure to the changing business environment.
For details of exceptional items, see Note 9 'Profit before tax'.
For the year ended 31 December 2011 2010
Notes £ mil £ mil
Staff costs:
Wages and salaries £ 110 £ 103
Social security contributions 13 13
Retirement benefits 34 17 12
Total staff costs £ 140 £ 128
Other expenses:
Software amortisation 22 £ 5 £ 4
Administrative expenses 47 54
Operating lease rental expense 6 6
Other expenses 3 1
Total other expenses £ 61 £ 65
Total operating expenses excluding exceptional items £ 201 £ 193
Total exceptional operating expenses 9 - 22
Total operating expenses £ 201 £ 215
Analysis of staff costs:
Restructuring costs - wages and salaries £ 7 £ 11
Restructuring costs - retirement benefit 34 3 2
Total restructuring costs £ 10 £ 13
Wages and salaries excluding restructuring £ 103 £ 103
Social security contributions 13 13
Retirement benefits excluding restructuring 14 12
Total staff costs including exceptional items £ 140 £ 141
Average number of permanent employees during the year 1,750 1,863
Group
Number of employees
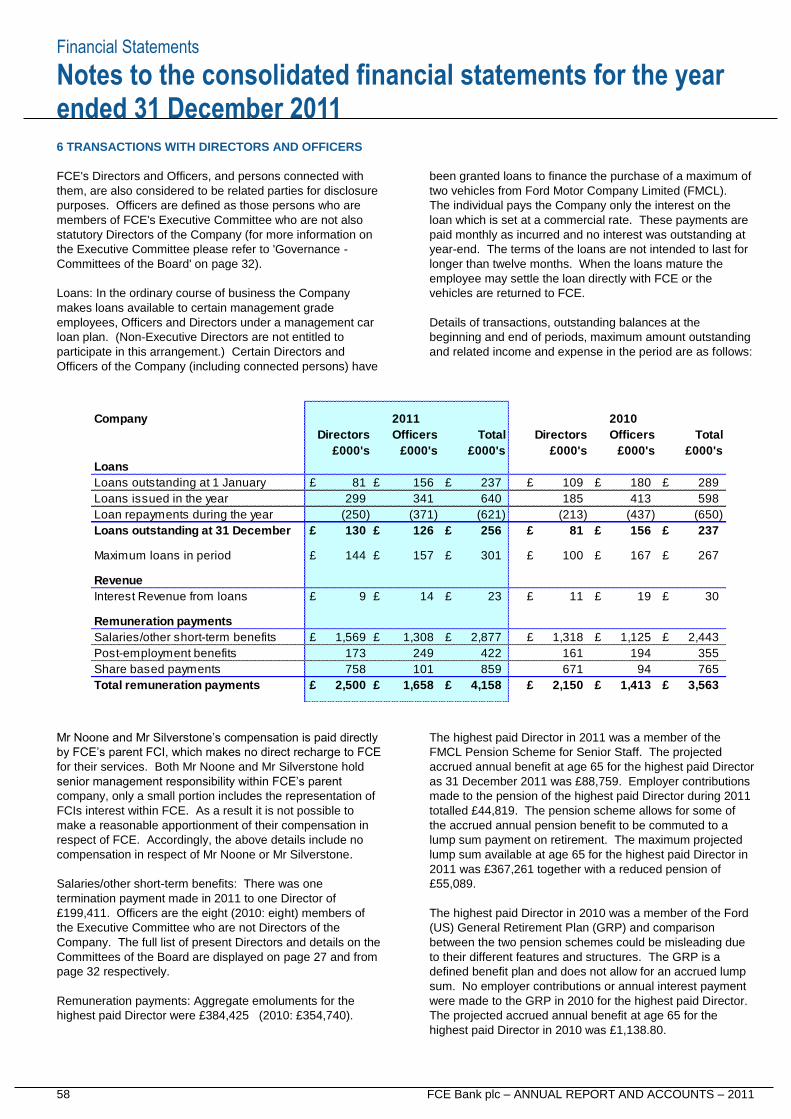
Financial Statements
58 FCE Bank plc – ANNUAL REPORT AND ACCOUNTS – 2011
Notes to the consolidated financial statements for the year ended 31 December 2011
6 TRANSACTIONS WITH DIRECTORS AND OFFICERS
FCE's Directors and Officers, and persons connected with
them, are also considered to be related parties for disclosure
purposes. Officers are defined as those persons who are
members of FCE's Executive Committee who are not also
statutory Directors of the Company (for more information on
the Executive Committee please refer to 'Governance -
Committees of the Board' on page 32).
Loans: In the ordinary course of business the Company
makes loans available to certain management grade
employees, Officers and Directors under a management car
loan plan. (Non-Executive Directors are not entitled to
participate in this arrangement.) Certain Directors and
Officers of the Company (including connected persons) have
been granted loans to finance the purchase of a maximum of
two vehicles from Ford Motor Company Limited (FMCL).
The individual pays the Company only the interest on the
loan which is set at a commercial rate. These payments are
paid monthly as incurred and no interest was outstanding at
year-end. The terms of the loans are not intended to last for
longer than twelve months. When the loans mature the
employee may settle the loan directly with FCE or the
vehicles are returned to FCE.
Details of transactions, outstanding balances at the
beginning and end of periods, maximum amount outstanding
and related income and expense in the period are as follows:
Mr Noone and Mr Silverstone’s compensation is paid directly
by FCE’s parent FCI, which makes no direct recharge to FCE
for their services. Both Mr Noone and Mr Silverstone hold
senior management responsibility within FCE’s parent
company, only a small portion includes the representation of
FCIs interest within FCE. As a result it is not possible to
make a reasonable apportionment of their compensation in
respect of FCE. Accordingly, the above details include no
compensation in respect of Mr Noone or Mr Silverstone.
Salaries/other short-term benefits: There was one
termination payment made in 2011 to one Director of
£199,411. Officers are the eight (2010: eight) members of
the Executive Committee who are not Directors of the
Company. The full list of present Directors and details on the
Committees of the Board are displayed on page 27 and from
page 32 respectively.
Remuneration payments: Aggregate emoluments for the
highest paid Director were £384,425 (2010: £354,740).
The highest paid Director in 2011 was a member of the
FMCL Pension Scheme for Senior Staff. The projected
accrued annual benefit at age 65 for the highest paid Director
as 31 December 2011 was £88,759. Employer contributions
made to the pension of the highest paid Director during 2011
totalled £44,819. The pension scheme allows for some of
the accrued annual pension benefit to be commuted to a
lump sum payment on retirement. The maximum projected
lump sum available at age 65 for the highest paid Director in
2011 was £367,261 together with a reduced pension of
£55,089.
The highest paid Director in 2010 was a member of the Ford
(US) General Retirement Plan (GRP) and comparison
between the two pension schemes could be misleading due
to their different features and structures. The GRP is a
defined benefit plan and does not allow for an accrued lump
sum. No employer contributions or annual interest payment
were made to the GRP in 2010 for the highest paid Director.
The projected accrued annual benefit at age 65 for the
highest paid Director in 2010 was £1,138.80.
Company
Loans
Loans outstanding at 1 January £ 81 £ 156 £ 237 £ 109 £ 180 £ 289
Loans issued in the year 299 341 640 185 413 598
Loan repayments during the year (250) (371) (621) (213) (437) (650)
Loans outstanding at 31 December £ 130 £ 126 £ 256 £ 81 £ 156 £ 237
Maximum loans in period £ 144 £ 157 £ 301 £ 100 £ 167 £ 267
Revenue
Interest Revenue from loans £ 9 £ 14 £ 23 £ 11 £ 19 £ 30
Remuneration payments
Salaries/other short-term benefits £ 1,569 £ 1,308 £ 2,877 £ 1,318 £ 1,125 £ 2,443
Post-employment benefits 173 249 422 161 194 355
Share based payments 758 101 859 671 94 765
Total remuneration payments £ 2,500 £ 1,658 £ 4,158 £ 2,150 £ 1,413 £ 3,563
2011 2010
OfficersDirectors Total DirectorsOfficers Total
£000's £000's £000's£000's£000's£000's
Financial Statements
FCE Bank plc – ANNUAL REPORT AND ACCOUNTS – 2011 59
Notes to the consolidated financial statements for the year ended 31 December 2011
6 TRANSACTIONS WITH DIRECTORS AND OFFICERS continued
Post-employment benefits: Retirement benefits are accruing
to three current Directors and seven Officers (2011: four
Directors and seven Officers) under various Ford defined
benefit schemes.
Share Based Payments: During the financial year ended 31
December 2011 two Directors exercised share options held
over Ford Common Stock. Shares were receivable under a
Long Term Incentive scheme by five Directors in 2011.
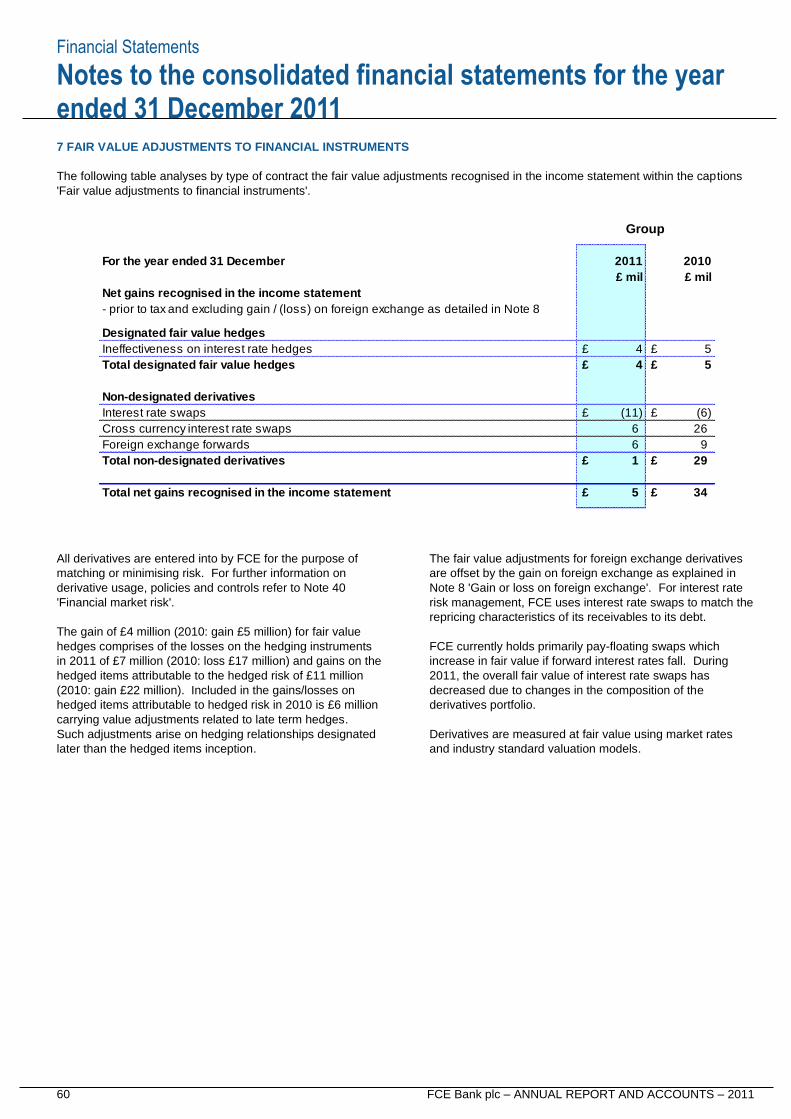
Financial Statements
60 FCE Bank plc – ANNUAL REPORT AND ACCOUNTS – 2011
Notes to the consolidated financial statements for the year ended 31 December 2011
7 FAIR VALUE ADJUSTMENTS TO FINANCIAL INSTRUMENTS
The following table analyses by type of contract the fair value adjustments recognised in the income statement within the captions
'Fair value adjustments to financial instruments'.
All derivatives are entered into by FCE for the purpose of
matching or minimising risk. For further information on
derivative usage, policies and controls refer to Note 40
'Financial market risk'.
The gain of £4 million (2010: gain £5 million) for fair value
hedges comprises of the losses on the hedging instruments
in 2011 of £7 million (2010: loss £17 million) and gains on the
hedged items attributable to the hedged risk of £11 million
(2010: gain £22 million). Included in the gains/losses on
hedged items attributable to hedged risk in 2010 is £6 million
carrying value adjustments related to late term hedges.
Such adjustments arise on hedging relationships designated
later than the hedged items inception.
The fair value adjustments for foreign exchange derivatives
are offset by the gain on foreign exchange as explained in
Note 8 'Gain or loss on foreign exchange'. For interest rate
risk management, FCE uses interest rate swaps to match the
repricing characteristics of its receivables to its debt.
FCE currently holds primarily pay-floating swaps which
increase in fair value if forward interest rates fall. During
2011, the overall fair value of interest rate swaps has
decreased due to changes in the composition of the
derivatives portfolio.
Derivatives are measured at fair value using market rates
and industry standard valuation models.
For the year ended 31 December 2011 2010
£ mil £ mil
Net gains recognised in the income statement
- prior to tax and excluding gain / (loss) on foreign exchange as detailed in Note 8
Designated fair value hedges
Ineffectiveness on interest rate hedges £ 4 £ 5
Total designated fair value hedges £ 4 £ 5
Non-designated derivatives
Interest rate swaps £ (11) £ (6)
Cross currency interest rate swaps 6 26
Foreign exchange forwards 6 9
Total non-designated derivatives £ 1 £ 29
Total net gains recognised in the income statement £ 5 £ 34
Group
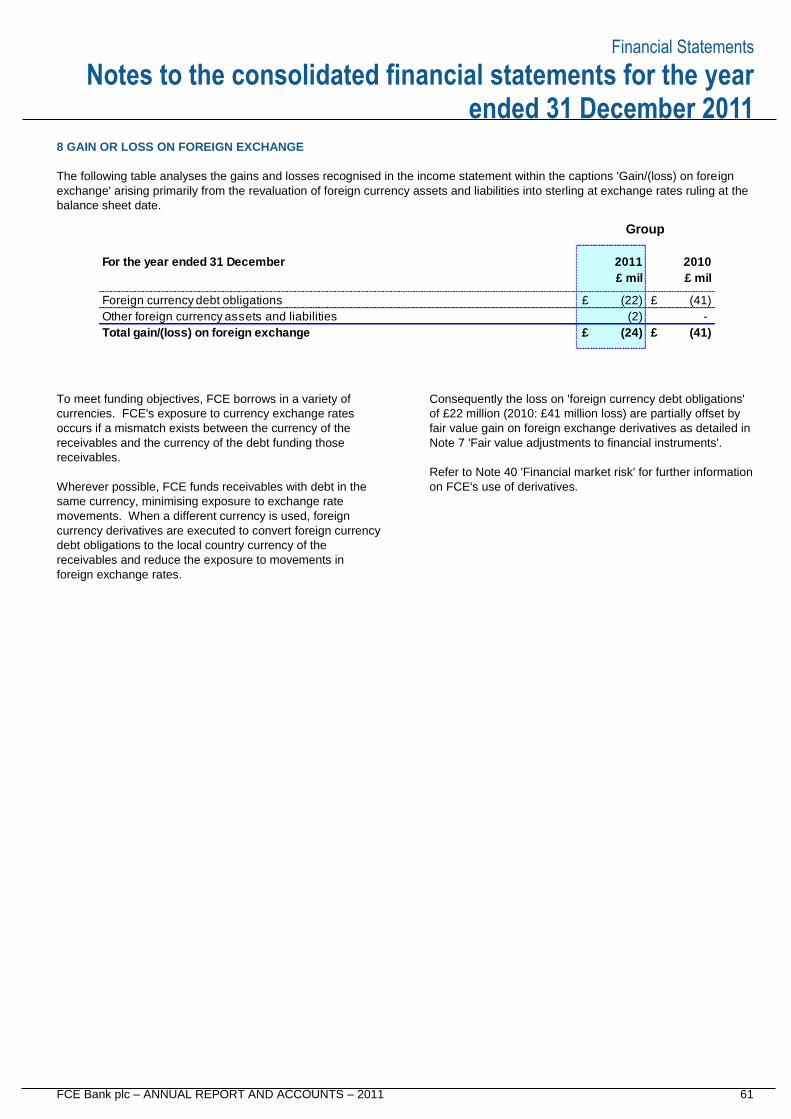
Financial Statements
FCE Bank plc – ANNUAL REPORT AND ACCOUNTS – 2011 61
Notes to the consolidated financial statements for the year ended 31 December 2011
8 GAIN OR LOSS ON FOREIGN EXCHANGE
The following table analyses the gains and losses recognised in the income statement within the captions 'Gain/(loss) on foreign
exchange' arising primarily from the revaluation of foreign currency assets and liabilities into sterling at exchange rates ruling at the
balance sheet date.
To meet funding objectives, FCE borrows in a variety of
currencies. FCE's exposure to currency exchange rates
occurs if a mismatch exists between the currency of the
receivables and the currency of the debt funding those
receivables.
Wherever possible, FCE funds receivables with debt in the
same currency, minimising exposure to exchange rate
movements. When a different currency is used, foreign
currency derivatives are executed to convert foreign currency
debt obligations to the local country currency of the
receivables and reduce the exposure to movements in
foreign exchange rates.
Consequently the loss on 'foreign currency debt obligations'
of £22 million (2010: £41 million loss) are partially offset by
fair value gain on foreign exchange derivatives as detailed in
Note 7 'Fair value adjustments to financial instruments'.
Refer to Note 40 'Financial market risk' for further information
on FCE's use of derivatives.
For the year ended 31 December 2011 2010
£ mil £ mil
Foreign currency debt obligations £ (22) £ (41)
Other foreign currency assets and liabilities (2) -
Total gain/(loss) on foreign exchange £ (24) £ (41)
Group
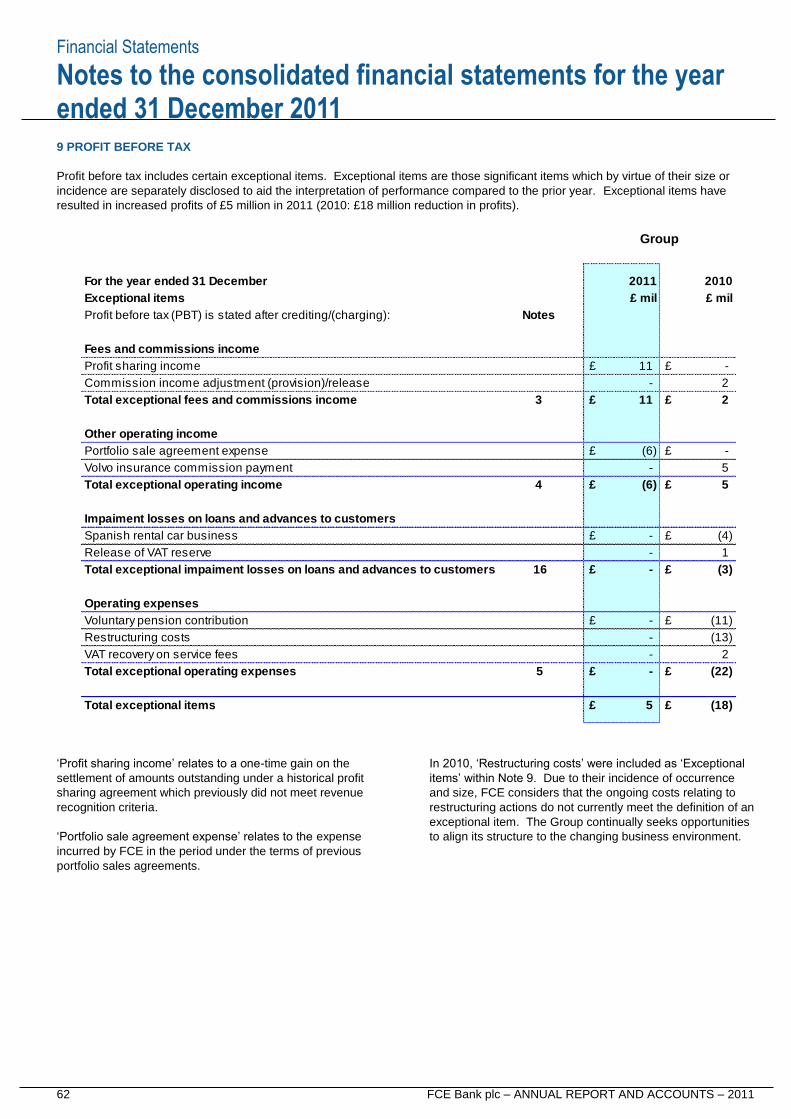
Financial Statements
62 FCE Bank plc – ANNUAL REPORT AND ACCOUNTS – 2011
Notes to the consolidated financial statements for the year ended 31 December 2011
9 PROFIT BEFORE TAX
Profit before tax includes certain exceptional items. Exceptional items are those significant items which by virtue of their size or
incidence are separately disclosed to aid the interpretation of performance compared to the prior year. Exceptional items have
resulted in increased profits of £5 million in 2011 (2010: £18 million reduction in profits).
‘Profit sharing income’ relates to a one-time gain on the
settlement of amounts outstanding under a historical profit
sharing agreement which previously did not meet revenue
recognition criteria.
‘Portfolio sale agreement expense’ relates to the expense
incurred by FCE in the period under the terms of previous
portfolio sales agreements.
In 2010, ‘Restructuring costs’ were included as ‘Exceptional
items’ within Note 9. Due to their incidence of occurrence
and size, FCE considers that the ongoing costs relating to
restructuring actions do not currently meet the definition of an
exceptional item. The Group continually seeks opportunities
to align its structure to the changing business environment.
For the year ended 31 December 2011 2010
Exceptional items £ mil £ mil
Profit before tax (PBT) is stated after crediting/(charging): Notes
Fees and commissions income
Profit sharing income £ 11 £ -
Commission income adjustment (provision)/release - 2
Total exceptional fees and commissions income 3 £ 11 £ 2
Other operating income
Portfolio sale agreement expense £ (6) £ -
Volvo insurance commission payment - 5
Total exceptional operating income 4 £ (6) £ 5
Impaiment losses on loans and advances to customers
Spanish rental car business £ - £ (4)
Release of VAT reserve - 1
Total exceptional impaiment losses on loans and advances to customers 16 £ - £ (3)
Operating expenses
Voluntary pension contribution £ - £ (11)
Restructuring costs - (13)
VAT recovery on service fees - 2
Total exceptional operating expenses 5 £ - £ (22)
Total exceptional items £ 5 £ (18)
Group
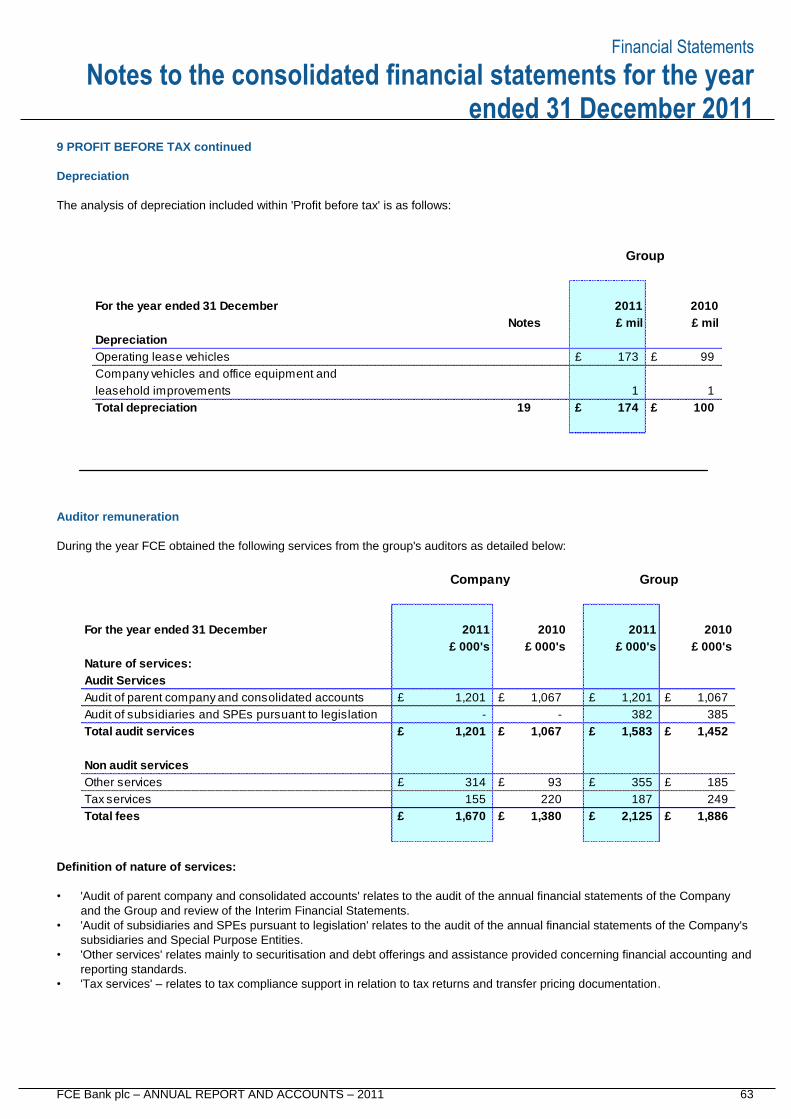
Financial Statements
FCE Bank plc – ANNUAL REPORT AND ACCOUNTS – 2011 63
Notes to the consolidated financial statements for the year ended 31 December 2011
9 PROFIT BEFORE TAX continued
Depreciation
The analysis of depreciation included within 'Profit before tax' is as follows:
Auditor remuneration
During the year FCE obtained the following services from the group's auditors as detailed below:
Definition of nature of services:
• 'Audit of parent company and consolidated accounts' relates to the audit of the annual financial statements of the Company
and the Group and review of the Interim Financial Statements.
• 'Audit of subsidiaries and SPEs pursuant to legislation' relates to the audit of the annual financial statements of the Company's
subsidiaries and Special Purpose Entities.
• 'Other services' relates mainly to securitisation and debt offerings and assistance provided concerning financial accounting and
reporting standards.
• 'Tax services' – relates to tax compliance support in relation to tax returns and transfer pricing documentation.
For the year ended 31 December 2011 2010
Notes £ mil £ mil
Depreciation
Operating lease vehicles £ 173 £ 99
Company vehicles and office equipment and
leasehold improvements 1 1
Total depreciation 19 £ 174 £ 100
Group
For the year ended 31 December 2011 2010 2011 2010
£ 000's £ 000's £ 000's £ 000's
Nature of services:
Audit Services
Audit of parent company and consolidated accounts £ 1,201 £ 1,067 £ 1,201 £ 1,067
Audit of subsidiaries and SPEs pursuant to legislation - - 382 385
Total audit services £ 1,201 £ 1,067 £ 1,583 £ 1,452
Non audit services
Other services £ 314 £ 93 £ 355 £ 185
Tax services 155 220 187 249
Total fees £ 1,670 £ 1,380 £ 2,125 £ 1,886
Company Group
Financial Statements
64 FCE Bank plc – ANNUAL REPORT AND ACCOUNTS – 2011
Notes to the consolidated financial statements for the year ended 31 December 2011
9 PROFIT BEFORE TAX continued
Auditor remuneration
Further explanatory information:
Included in the 'Audit Committee Report' within the 'Governance' section under the caption 'External auditors, their work and non-
audit related services' are details of the audit arrangements with PricewaterhouseCoopers LLP (PwC).
Included in 'Other services' and 'Tax services' is £204,100 (2010: £88,250) paid by the Company to the UK firm of PwC, of which
£55,000 (2010: nil) relates to services provided on FCE’s remuneration policy.
Pre-approval policies and procedures
The Ford Audit Committee has established approval policies and procedures that govern the engagement of PwC. The services
provided by PwC are pre-approved in accordance with Ford's policies and procedures and also by the Company's Audit Committee.
This policy also governs the use of Ford’s independent accountant to ensure continuing independence.
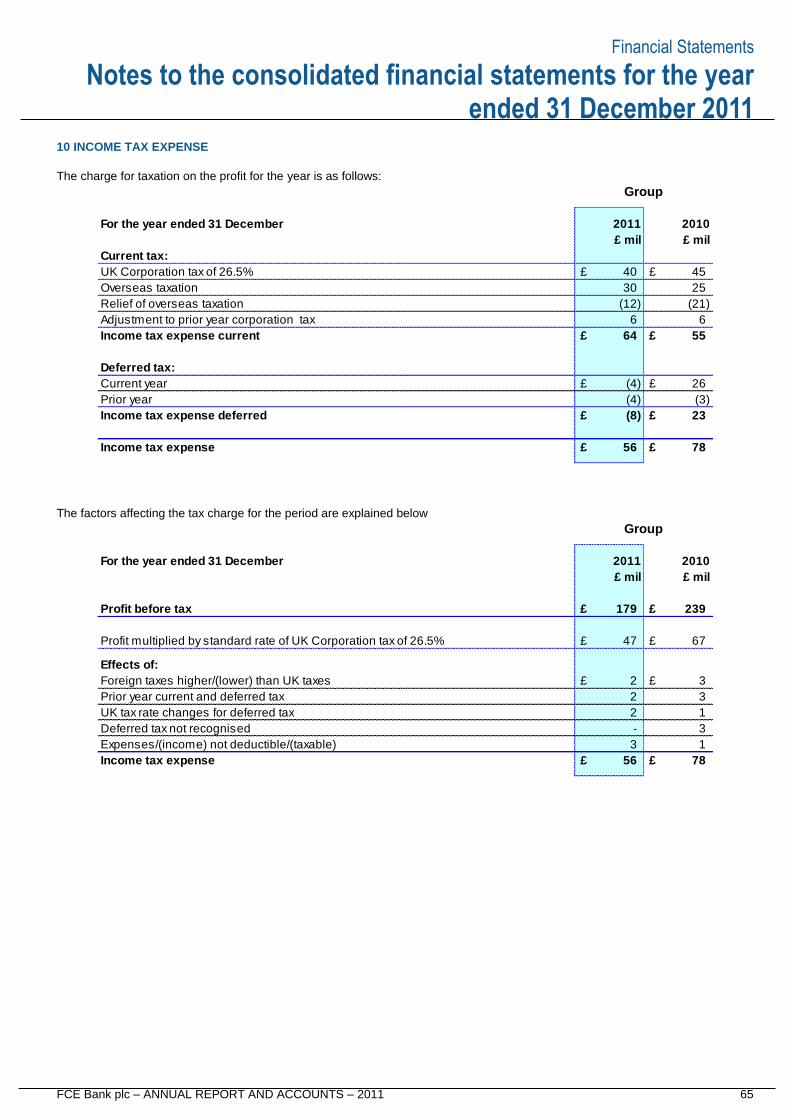
Financial Statements
FCE Bank plc – ANNUAL REPORT AND ACCOUNTS – 2011 65
Notes to the consolidated financial statements for the year ended 31 December 2011
10 INCOME TAX EXPENSE
The charge for taxation on the profit for the year is as follows:
The factors affecting the tax charge for the period are explained below
For the year ended 31 December 2011 2010
£ mil £ mil
Current tax:
UK Corporation tax of 26.5% £ 40 £ 45
Overseas taxation 30 25
Relief of overseas taxation (12) (21)
Adjustment to prior year corporation tax 6 6
Income tax expense current £ 64 £ 55
Deferred tax:
Current year £ (4) £ 26
Prior year (4) (3)
Income tax expense deferred £ (8) £ 23
Income tax expense £ 56 £ 78
Group
For the year ended 31 December 2011 2010
£ mil £ mil
Profit before tax £ 179 £ 239
Profit multiplied by standard rate of UK Corporation tax of 26.5% £ 47 £ 67
Effects of:
Foreign taxes higher/(lower) than UK taxes £ 2 £ 3
Prior year current and deferred tax 2 3
UK tax rate changes for deferred tax 2 1
Deferred tax not recognised - 3
Expenses/(income) not deductible/(taxable) 3 1
Income tax expense £ 56 £ 78
Group
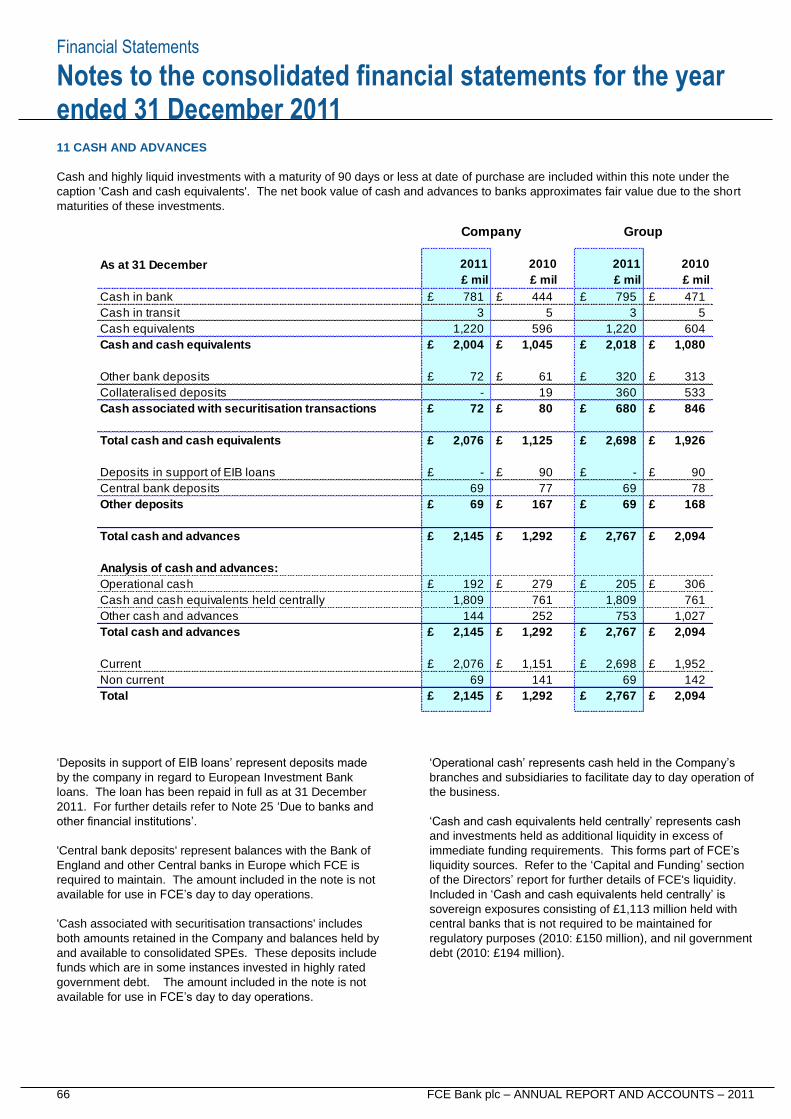
Financial Statements
66 FCE Bank plc – ANNUAL REPORT AND ACCOUNTS – 2011
Notes to the consolidated financial statements for the year ended 31 December 2011
11 CASH AND ADVANCES
Cash and highly liquid investments with a maturity of 90 days or less at date of purchase are included within this note under the
caption 'Cash and cash equivalents'. The net book value of cash and advances to banks approximates fair value due to the short
maturities of these investments.
‘Deposits in support of EIB loans’ represent deposits made
by the company in regard to European Investment Bank
loans. The loan has been repaid in full as at 31 December
2011. For further details refer to Note 25 ‘Due to banks and
other financial institutions’.
'Central bank deposits' represent balances with the Bank of
England and other Central banks in Europe which FCE is
required to maintain. The amount included in the note is not
available for use in FCE’s day to day operations.
'Cash associated with securitisation transactions' includes
both amounts retained in the Company and balances held by
and available to consolidated SPEs. These deposits include
funds which are in some instances invested in highly rated
government debt. The amount included in the note is not
available for use in FCE’s day to day operations.
‘Operational cash’ represents cash held in the Company’s
branches and subsidiaries to facilitate day to day operation of
the business.
‘Cash and cash equivalents held centrally’ represents cash
and investments held as additional liquidity in excess of
immediate funding requirements. This forms part of FCE’s
liquidity sources. Refer to the ‘Capital and Funding’ section
of the Directors’ report for further details of FCE's liquidity.
Included in ‘Cash and cash equivalents held centrally’ is
sovereign exposures consisting of £1,113 million held with
central banks that is not required to be maintained for
regulatory purposes (2010: £150 million), and nil government
debt (2010: £194 million).
As at 31 December
Cash in bank £ 781 £ 444 £ 795 £ 471
Cash in transit 3 5 3 5
Cash equivalents 1,220 596 1,220 604
Cash and cash equivalents £ 2,004 £ 1,045 £ 2,018 £ 1,080
Other bank deposits £ 72 £ 61 £ 320 £ 313
Collateralised deposits - 19 360 533
Cash associated with securitisation transactions £ 72 £ 80 £ 680 £ 846
Total cash and cash equivalents £ 2,076 £ 1,125 £ 2,698 £ 1,926
Deposits in support of EIB loans £ - £ 90 £ - £ 90
Central bank deposits 69 77 69 78
Other deposits £ 69 £ 167 £ 69 £ 168
Total cash and advances £ 2,145 £ 1,292 £ 2,767 £ 2,094
Analysis of cash and advances:
Operational cash £ 192 £ 279 £ 205 £ 306
Cash and cash equivalents held centrally 1,809 761 1,809 761
Other cash and advances 144 252 753 1,027
Total cash and advances £ 2,145 £ 1,292 £ 2,767 £ 2,094
Current £ 2,076 £ 1,151 £ 2,698 £ 1,952
Non current 69 141 69 142
Total £ 2,145 £ 1,292 £ 2,767 £ 2,094
£ mil
Company Group
£ mil
2011
£ mil
2011
£ mil
2010 2010
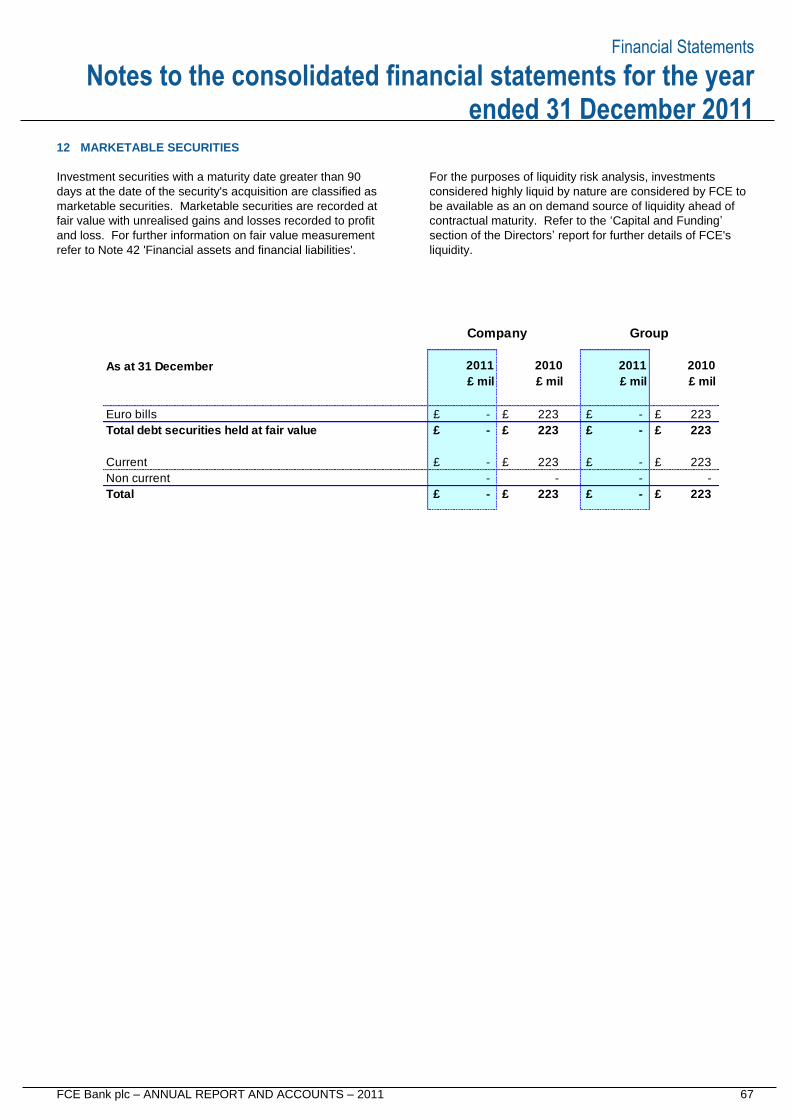
Financial Statements
FCE Bank plc – ANNUAL REPORT AND ACCOUNTS – 2011 67
Notes to the consolidated financial statements for the year ended 31 December 2011
12 MARKETABLE SECURITIES
Investment securities with a maturity date greater than 90
days at the date of the security's acquisition are classified as
marketable securities. Marketable securities are recorded at
fair value with unrealised gains and losses recorded to profit
and loss. For further information on fair value measurement
refer to Note 42 'Financial assets and financial liabilities'.
For the purposes of liquidity risk analysis, investments
considered highly liquid by nature are considered by FCE to
be available as an on demand source of liquidity ahead of
contractual maturity. Refer to the ‘Capital and Funding’
section of the Directors’ report for further details of FCE's
liquidity.
As at 31 December
Euro bills £ - £ 223 £ - £ 223
Total debt securities held at fair value £ - £ 223 £ - £ 223
Current £ - £ 223 £ - £ 223
Non current - - - -
Total £ - £ 223 £ - £ 223
£ mil
Company Group
£ mil
2011
£ mil
2011
£ mil
2010 2010
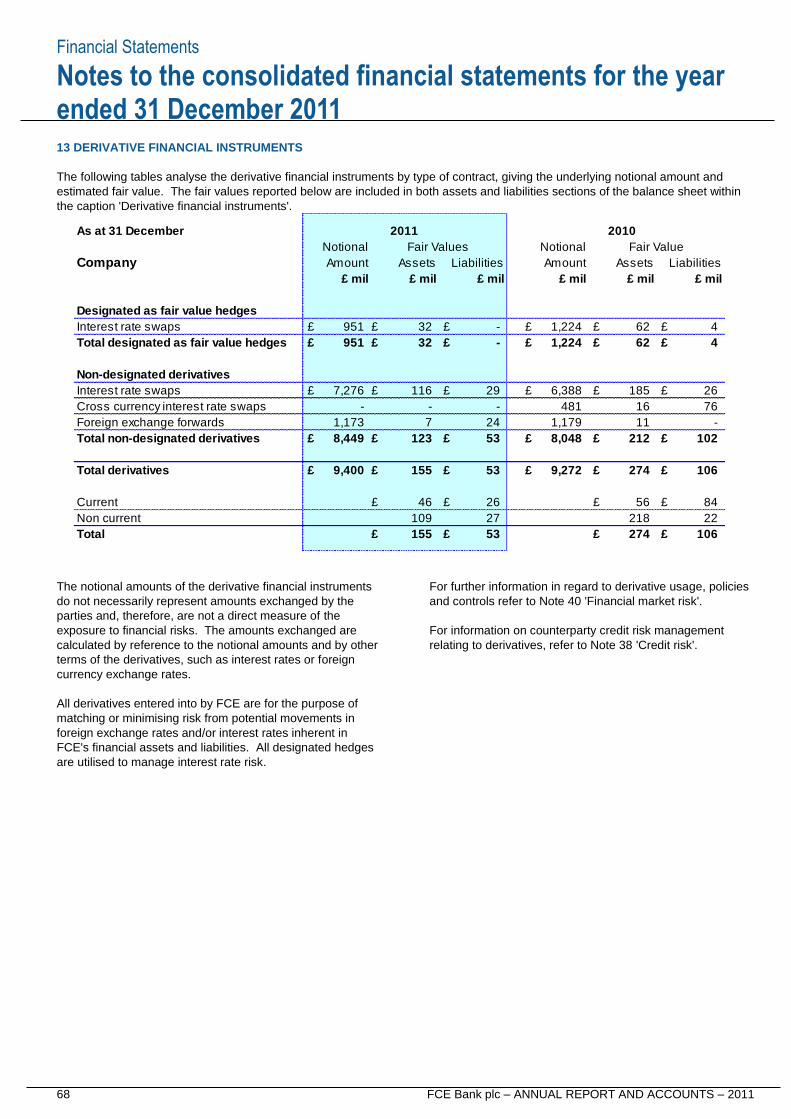
Financial Statements
68 FCE Bank plc – ANNUAL REPORT AND ACCOUNTS – 2011
Notes to the consolidated financial statements for the year ended 31 December 2011
13 DERIVATIVE FINANCIAL INSTRUMENTS
The following tables analyse the derivative financial instruments by type of contract, giving the underlying notional amount and
estimated fair value. The fair values reported below are included in both assets and liabilities sections of the balance sheet within
the caption 'Derivative financial instruments'.
The notional amounts of the derivative financial instruments
do not necessarily represent amounts exchanged by the
parties and, therefore, are not a direct measure of the
exposure to financial risks. The amounts exchanged are
calculated by reference to the notional amounts and by other
terms of the derivatives, such as interest rates or foreign
currency exchange rates.
All derivatives entered into by FCE are for the purpose of
matching or minimising risk from potential movements in
foreign exchange rates and/or interest rates inherent in
FCE's financial assets and liabilities. All designated hedges
are utilised to manage interest rate risk.
For further information in regard to derivative usage, policies
and controls refer to Note 40 'Financial market risk'.
For information on counterparty credit risk management
relating to derivatives, refer to Note 38 'Credit risk'.
As at 31 December
Company Amount Assets Amount Assets
Designated as fair value hedges
Interest rate swaps £ 951 £ 32 £ - £ 1,224 £ 62 £ 4
Total designated as fair value hedges £ 951 £ 32 £ - £ 1,224 £ 62 £ 4
Non-designated derivatives
Interest rate swaps £ 7,276 £ 116 £ 29 £ 6,388 £ 185 £ 26
Cross currency interest rate swaps - - - 481 16 76
Foreign exchange forwards 1,173 7 24 1,179 11 -
Total non-designated derivatives £ 8,449 £ 123 £ 53 £ 8,048 £ 212 £ 102
Total derivatives £ 9,400 £ 155 £ 53 £ 9,272 £ 274 £ 106
Current £ 46 £ 26 £ 56 £ 84
Non current 109 27 218 22
Total £ 155 £ 53 £ 274 £ 106
Liabilities Liabilities
2011 2010
Notional Notional Fair ValueFair Values
£ mil £ mil £ mil £ mil£ mil£ mil
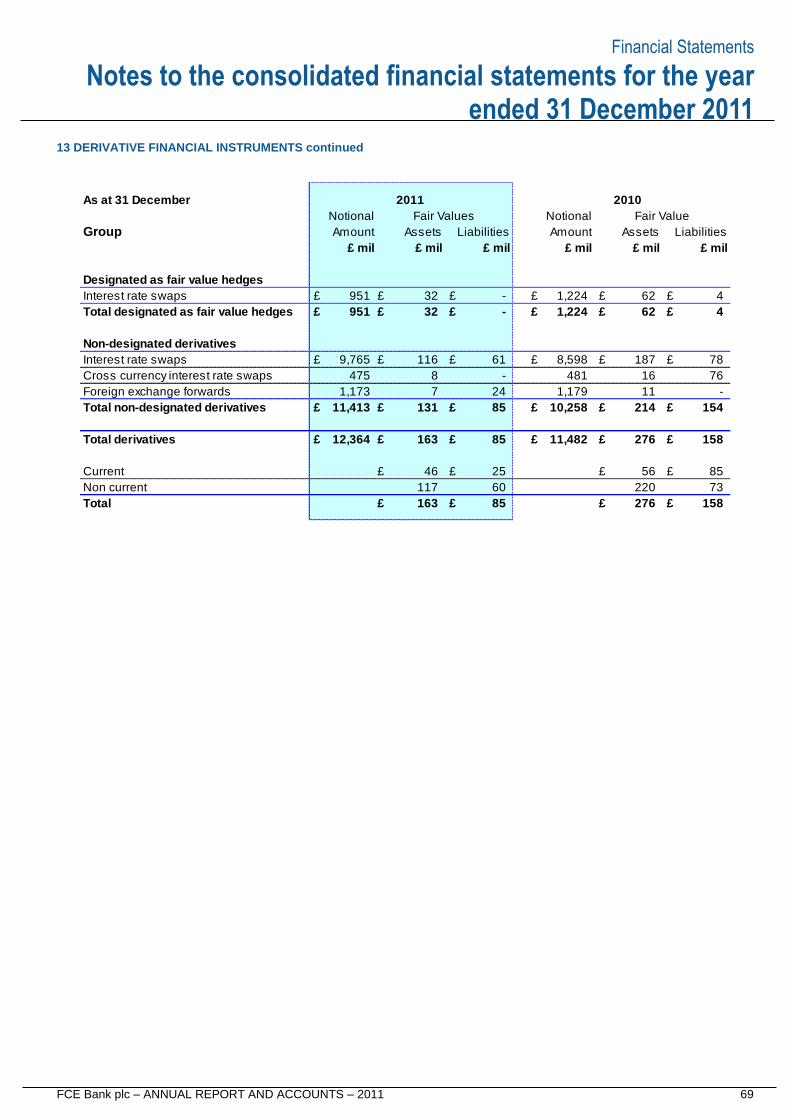
Financial Statements
FCE Bank plc – ANNUAL REPORT AND ACCOUNTS – 2011 69
Notes to the consolidated financial statements for the year ended 31 December 2011
13 DERIVATIVE FINANCIAL INSTRUMENTS continued
As at 31 December
Group Amount Assets Amount Assets
Designated as fair value hedges
Interest rate swaps £ 951 £ 32 £ - £ 1,224 £ 62 £ 4
Total designated as fair value hedges £ 951 £ 32 £ - £ 1,224 £ 62 £ 4
Non-designated derivatives
Interest rate swaps £ 9,765 £ 116 £ 61 £ 8,598 £ 187 £ 78
Cross currency interest rate swaps 475 8 - 481 16 76
Foreign exchange forwards 1,173 7 24 1,179 11 -
Total non-designated derivatives £ 11,413 £ 131 £ 85 £ 10,258 £ 214 £ 154
Total derivatives £ 12,364 £ 163 £ 85 £ 11,482 £ 276 £ 158
Current £ 46 £ 25 £ 56 £ 85
Non current 117 60 220 73
Total £ 163 £ 85 £ 276 £ 158
£ mil£ mil £ mil £ mil £ mil £ mil
Liabilities Liabilities
Notional Fair Values Notional Fair Value
2011 2010
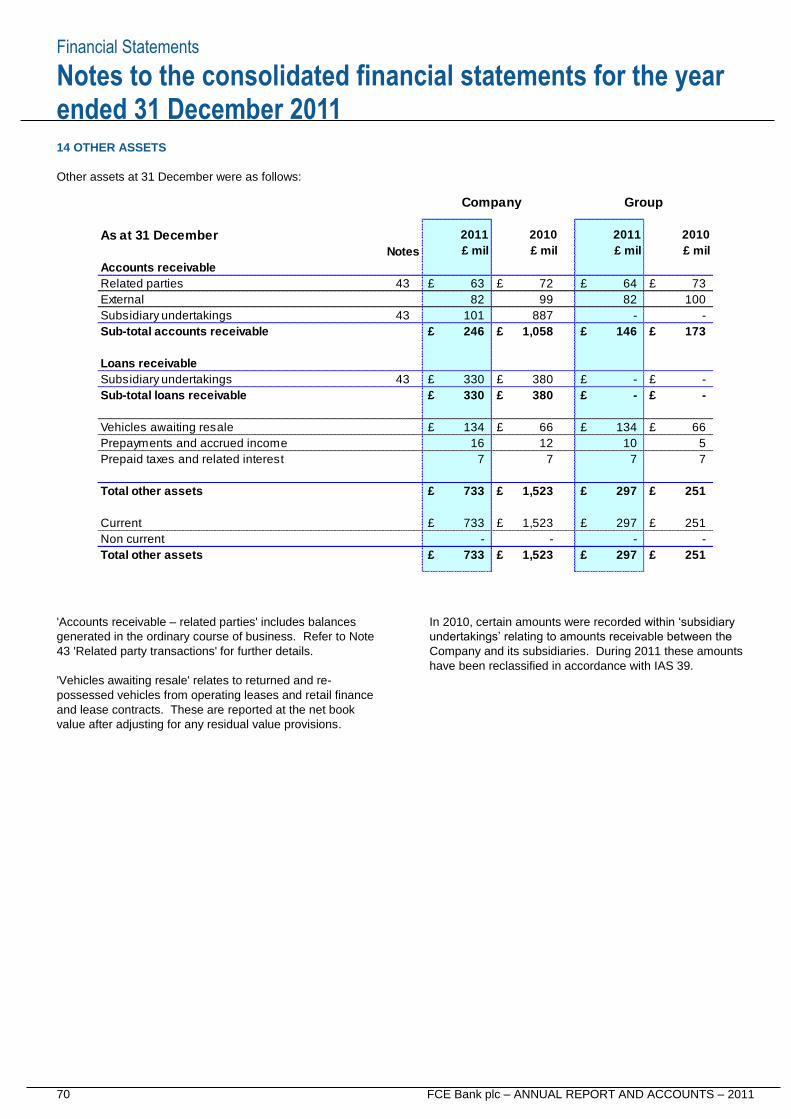
Financial Statements
70 FCE Bank plc – ANNUAL REPORT AND ACCOUNTS – 2011
Notes to the consolidated financial statements for the year ended 31 December 2011
14 OTHER ASSETS
Other assets at 31 December were as follows:
'Accounts receivable – related parties' includes balances
generated in the ordinary course of business. Refer to Note
43 'Related party transactions' for further details.
'Vehicles awaiting resale' relates to returned and re-
possessed vehicles from operating leases and retail finance
and lease contracts. These are reported at the net book
value after adjusting for any residual value provisions.
In 2010, certain amounts were recorded within ‘subsidiary
undertakings’ relating to amounts receivable between the
Company and its subsidiaries. During 2011 these amounts
have been reclassified in accordance with IAS 39.
As at 31 December
Notes
Accounts receivable
Related parties 43 £ 63 £ 72 £ 64 £ 73
External 82 99 82 100
Subsidiary undertakings 43 101 887 - -
Sub-total accounts receivable £ 246 £ 1,058 £ 146 £ 173
Loans receivable
Subsidiary undertakings 43 £ 330 £ 380 £ - £ -
Sub-total loans receivable £ 330 £ 380 £ - £ -
Vehicles awaiting resale £ 134 £ 66 £ 134 £ 66
Prepayments and accrued income 16 12 10 5
Prepaid taxes and related interest 7 7 7 7
Total other assets £ 733 £ 1,523 £ 297 £ 251
Current £ 733 £ 1,523 £ 297 £ 251
Non current - - - -
Total other assets £ 733 £ 1,523 £ 297 £ 251
£ mil
Company Group
£ mil
2011
£ mil
2011
£ mil
2010 2010
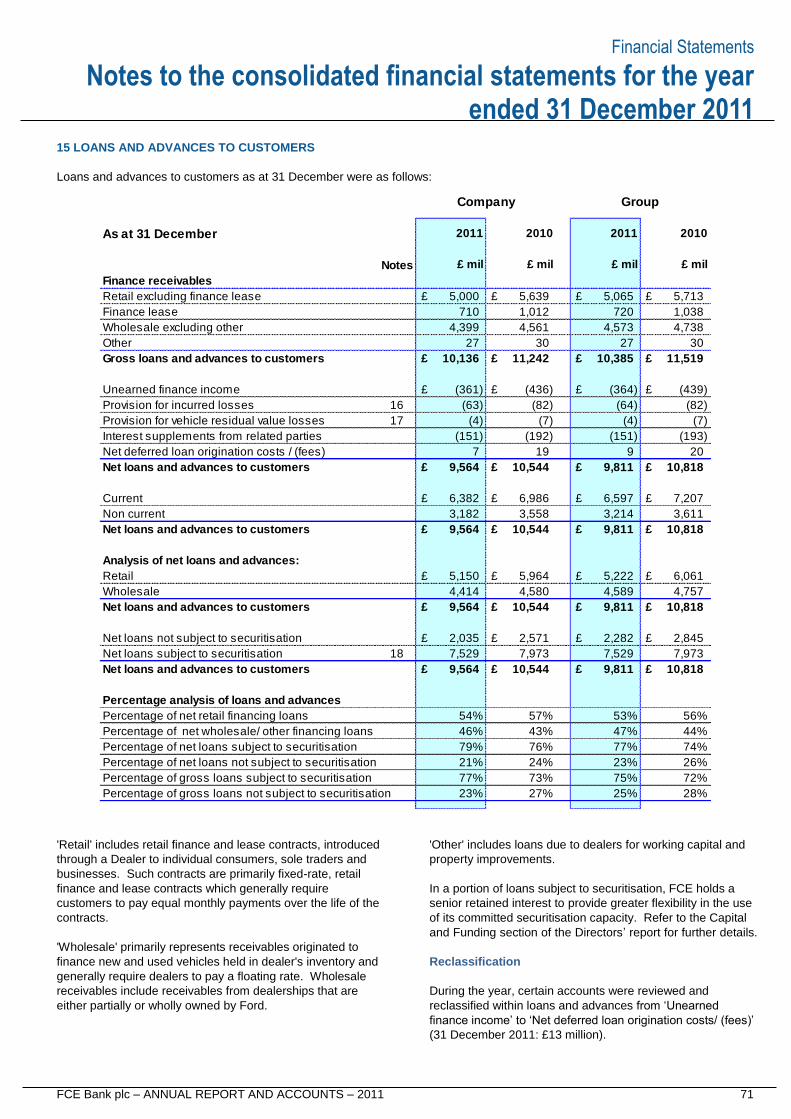
Financial Statements
FCE Bank plc – ANNUAL REPORT AND ACCOUNTS – 2011 71
Notes to the consolidated financial statements for the year ended 31 December 2011
15 LOANS AND ADVANCES TO CUSTOMERS
Loans and advances to customers as at 31 December were as follows:
'Retail' includes retail finance and lease contracts, introduced
through a Dealer to individual consumers, sole traders and
businesses. Such contracts are primarily fixed-rate, retail
finance and lease contracts which generally require
customers to pay equal monthly payments over the life of the
contracts.
'Wholesale' primarily represents receivables originated to
finance new and used vehicles held in dealer's inventory and
generally require dealers to pay a floating rate. Wholesale
receivables include receivables from dealerships that are
either partially or wholly owned by Ford.
'Other' includes loans due to dealers for working capital and
property improvements.
In a portion of loans subject to securitisation, FCE holds a
senior retained interest to provide greater flexibility in the use
of its committed securitisation capacity. Refer to the Capital
and Funding section of the Directors’ report for further details.
Reclassification
During the year, certain accounts were reviewed and
reclassified within loans and advances from ‘Unearned
finance income’ to ‘Net deferred loan origination costs/ (fees)’
(31 December 2011: £13 million).
As at 31 December
Notes
Finance receivables
Retail excluding finance lease £ 5,000 £ 5,639 £ 5,065 £ 5,713
Finance lease 710 1,012 720 1,038
Wholesale excluding other 4,399 4,561 4,573 4,738
Other 27 30 27 30
Gross loans and advances to customers £ 10,136 £ 11,242 £ 10,385 £ 11,519
Unearned finance income £ (361) £ (436) £ (364) £ (439)
Provision for incurred losses 16 (63) (82) (64) (82)
Provision for vehicle residual value losses 17 (4) (7) (4) (7)
Interest supplements from related parties (151) (192) (151) (193)
Net deferred loan origination costs / (fees) 7 19 9 20
Net loans and advances to customers £ 9,564 £ 10,544 £ 9,811 £ 10,818
Current £ 6,382 £ 6,986 £ 6,597 £ 7,207
Non current 3,182 3,558 3,214 3,611
Net loans and advances to customers £ 9,564 £ 10,544 £ 9,811 £ 10,818
Analysis of net loans and advances:
Retail £ 5,150 £ 5,964 £ 5,222 £ 6,061
Wholesale 4,414 4,580 4,589 4,757
Net loans and advances to customers £ 9,564 £ 10,544 £ 9,811 £ 10,818
Net loans not subject to securitisation £ 2,035 £ 2,571 £ 2,282 £ 2,845
Net loans subject to securitisation 18 7,529 7,973 7,529 7,973
Net loans and advances to customers £ 9,564 £ 10,544 £ 9,811 £ 10,818
Percentage analysis of loans and advances
Percentage of net retail financing loans 54% 57% 53% 56%
Percentage of net wholesale/ other financing loans 46% 43% 47% 44%
Percentage of net loans subject to securitisation 79% 76% 77% 74%
Percentage of net loans not subject to securitisation 21% 24% 23% 26%
Percentage of gross loans subject to securitisation 77% 73% 75% 72%
Percentage of gross loans not subject to securitisation 23% 27% 25% 28%
Company Group
£ mil
2011
£ mil
2011
£ mil
2010 2010
£ mil
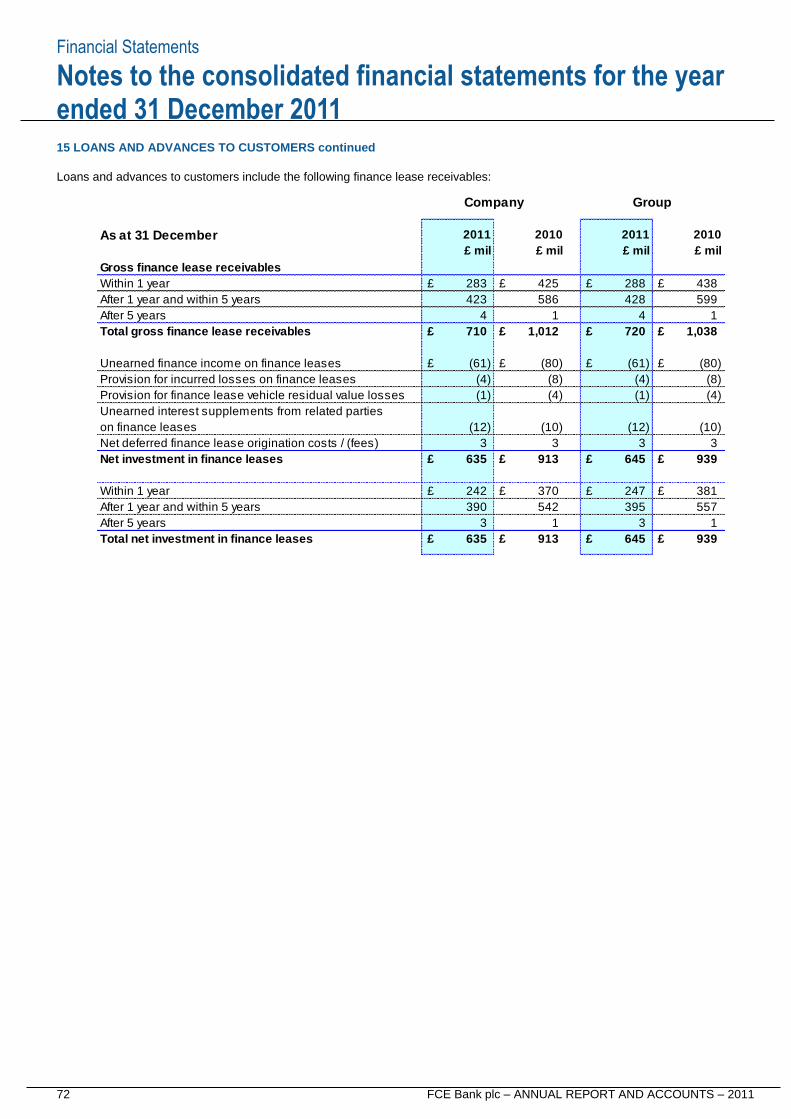
Financial Statements
72 FCE Bank plc – ANNUAL REPORT AND ACCOUNTS – 2011
Notes to the consolidated financial statements for the year ended 31 December 2011
15 LOANS AND ADVANCES TO CUSTOMERS continued
Loans and advances to customers include the following finance lease receivables:
As at 31 December
Gross finance lease receivables
Within 1 year £ 283 £ 425 £ 288 £ 438
After 1 year and within 5 years 423 586 428 599
After 5 years 4 1 4 1
Total gross finance lease receivables £ 710 £ 1,012 £ 720 £ 1,038
Unearned finance income on finance leases £ (61) £ (80) £ (61) £ (80)
Provision for incurred losses on finance leases (4) (8) (4) (8)
Provision for finance lease vehicle residual value losses (1) (4) (1) (4)
Unearned interest supplements from related parties
on finance leases (12) (10) (12) (10)
Net deferred finance lease origination costs / (fees) 3 3 3 3
Net investment in finance leases £ 635 £ 913 £ 645 £ 939
Within 1 year £ 242 £ 370 £ 247 £ 381
After 1 year and within 5 years 390 542 395 557
After 5 years 3 1 3 1
Total net investment in finance leases £ 635 £ 913 £ 645 £ 939
£ mil £ mil £ mil £ mil
Company Group
2011 2010 2011 2010
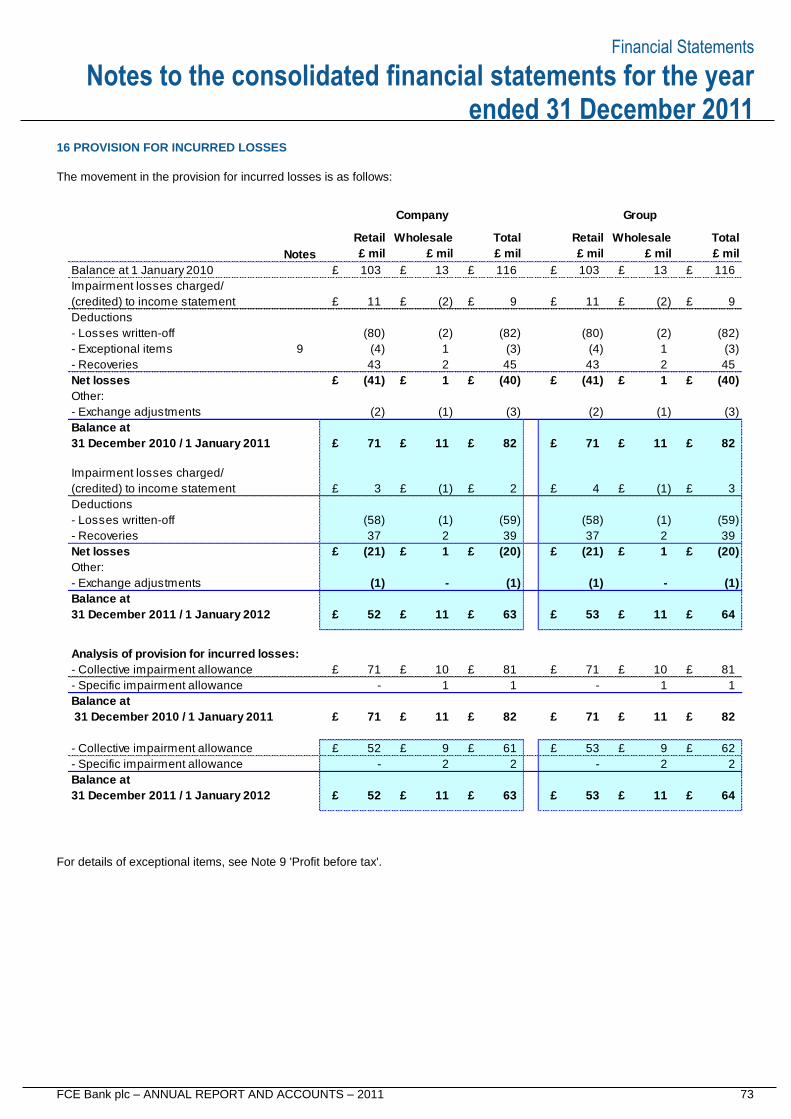
Financial Statements
FCE Bank plc – ANNUAL REPORT AND ACCOUNTS – 2011 73
Notes to the consolidated financial statements for the year ended 31 December 2011
16 PROVISION FOR INCURRED LOSSES
The movement in the provision for incurred losses is as follows:
For details of exceptional items, see Note 9 'Profit before tax'.
Notes
Balance at 1 January 2010 £ 103 £ 13 £ 116 £ 103 £ 13 £ 116
Impairment losses charged/
(credited) to income statement £ 11 £ (2) £ 9 £ 11 £ (2) £ 9
Deductions
- Losses written-off (80) (2) (82) (80) (2) (82)
- Exceptional items 9 (4) 1 (3) (4) 1 (3)
- Recoveries 43 2 45 43 2 45
Net losses £ (41) £ 1 £ (40) £ (41) £ 1 £ (40)
Other:
- Exchange adjustments (2) (1) (3) (2) (1) (3)
Balance at
31 December 2010 / 1 January 2011 £ 71 £ 11 £ 82 £ 71 £ 11 £ 82
Impairment losses charged/
(credited) to income statement £ 3 £ (1) £ 2 £ 4 £ (1) £ 3
Deductions
- Losses written-off (58) (1) (59) (58) (1) (59)
- Recoveries 37 2 39 37 2 39
Net losses £ (21) £ 1 £ (20) £ (21) £ 1 £ (20)
Other:
- Exchange adjustments (1) - (1) (1) - (1)
Balance at
31 December 2011 / 1 January 2012 £ 52 £ 11 £ 63 £ 53 £ 11 £ 64
Analysis of provision for incurred losses:
- Collective impairment allowance £ 71 £ 10 £ 81 £ 71 £ 10 £ 81
- Specific impairment allowance - 1 1 - 1 1
Balance at
31 December 2010 / 1 January 2011 £ 71 £ 11 £ 82 £ 71 £ 11 £ 82
- Collective impairment allowance £ 52 £ 9 £ 61 £ 53 £ 9 £ 62
- Specific impairment allowance - 2 2 - 2 2
Balance at
31 December 2011 / 1 January 2012 £ 52 £ 11 £ 63 £ 53 £ 11 £ 64
£ mil £ mil£ mil£ mil £ mil £ mil
Company Group
Retail Wholesale TotalTotalRetail Wholesale
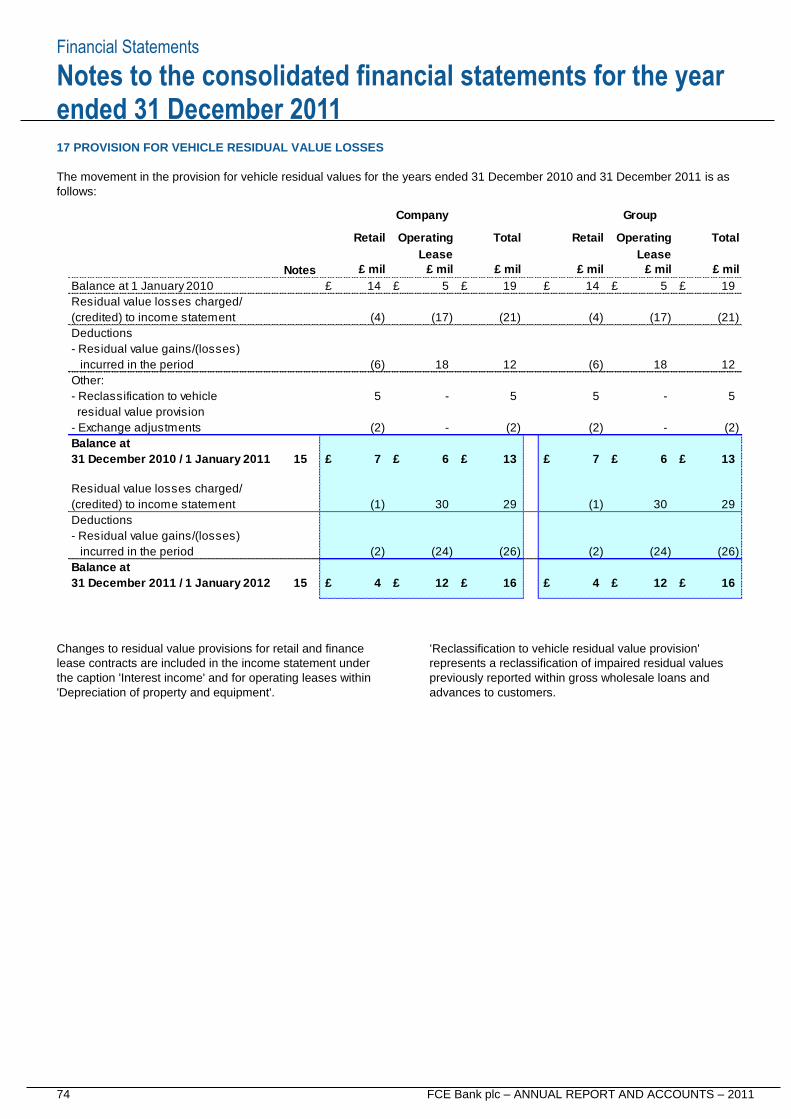
Financial Statements
74 FCE Bank plc – ANNUAL REPORT AND ACCOUNTS – 2011
Notes to the consolidated financial statements for the year ended 31 December 2011
17 PROVISION FOR VEHICLE RESIDUAL VALUE LOSSES
The movement in the provision for vehicle residual values for the years ended 31 December 2010 and 31 December 2011 is as
follows:
Changes to residual value provisions for retail and finance
lease contracts are included in the income statement under
the caption 'Interest income' and for operating leases within
'Depreciation of property and equipment'.
‘Reclassification to vehicle residual value provision'
represents a reclassification of impaired residual values
previously reported within gross wholesale loans and
advances to customers.
Lease Lease
Notes
Balance at 1 January 2010 £ 14 £ 5 £ 19 £ 14 £ 5 £ 19
Residual value losses charged/
(credited) to income statement (4) (17) (21) (4) (17) (21)
Deductions
- Residual value gains/(losses)
incurred in the period (6) 18 12 (6) 18 12
Other:
- Reclassification to vehicle 5 - 5 5 - 5
residual value provision
- Exchange adjustments (2) - (2) (2) - (2)
Balance at
31 December 2010 / 1 January 2011 15 £ 7 £ 6 £ 13 £ 7 £ 6 £ 13
Residual value losses charged/
(credited) to income statement (1) 30 29 (1) 30 29
Deductions
- Residual value gains/(losses)
incurred in the period (2) (24) (26) (2) (24) (26)
Balance at
31 December 2011 / 1 January 2012 15 £ 4 £ 12 £ 16 £ 4 £ 12 £ 16
£ mil £ mil£ mil£ mil £ mil £ mil
Company Group
Retail Operating TotalTotalRetail Operating
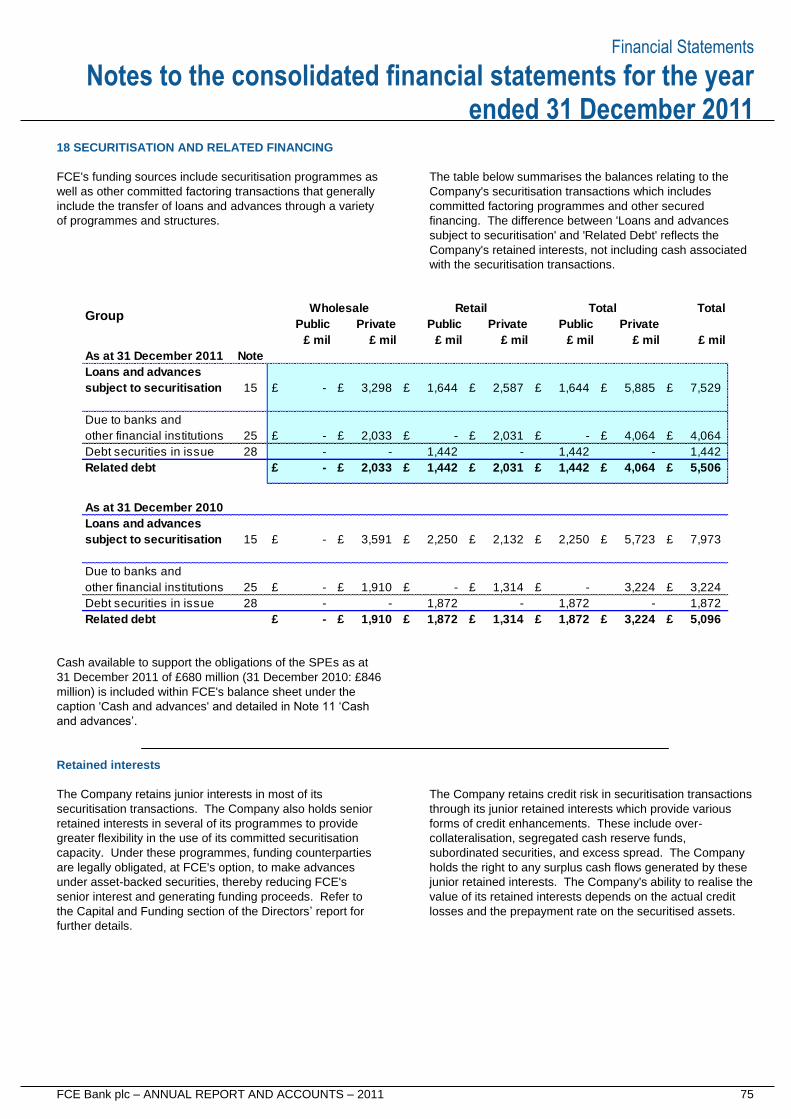
Financial Statements
FCE Bank plc – ANNUAL REPORT AND ACCOUNTS – 2011 75
Notes to the consolidated financial statements for the year ended 31 December 2011
18 SECURITISATION AND RELATED FINANCING
FCE's funding sources include securitisation programmes as
well as other committed factoring transactions that generally
include the transfer of loans and advances through a variety
of programmes and structures.
The table below summarises the balances relating to the
Company's securitisation transactions which includes
committed factoring programmes and other secured
financing. The difference between 'Loans and advances
subject to securitisation' and 'Related Debt' reflects the
Company's retained interests, not including cash associated
with the securitisation transactions.
Cash available to support the obligations of the SPEs as at
31 December 2011 of £680 million (31 December 2010: £846
million) is included within FCE's balance sheet under the
caption 'Cash and advances' and detailed in Note 11 ‘Cash
and advances’.
Retained interests
The Company retains junior interests in most of its
securitisation transactions. The Company also holds senior
retained interests in several of its programmes to provide
greater flexibility in the use of its committed securitisation
capacity. Under these programmes, funding counterparties
are legally obligated, at FCE's option, to make advances
under asset-backed securities, thereby reducing FCE's
senior interest and generating funding proceeds. Refer to
the Capital and Funding section of the Directors’ report for
further details.
The Company retains credit risk in securitisation transactions
through its junior retained interests which provide various
forms of credit enhancements. These include over-
collateralisation, segregated cash reserve funds,
subordinated securities, and excess spread. The Company
holds the right to any surplus cash flows generated by these
junior retained interests. The Company's ability to realise the
value of its retained interests depends on the actual credit
losses and the prepayment rate on the securitised assets.
As at 31 December 2011 Note
Loans and advances
subject to securitisation 15 £ - £ 3,298 £ 1,644 £ 2,587 £ 1,644 £ 5,885 £ 7,529
Due to banks and
other financial institutions 25 £ - £ 2,033 £ - £ 2,031 £ - £ 4,064 £ 4,064
Debt securities in issue 28 - - 1,442 - 1,442 - 1,442
Related debt £ - £ 2,033 £ 1,442 £ 2,031 £ 1,442 £ 4,064 £ 5,506
As at 31 December 2010
Loans and advances
subject to securitisation 15 £ - £ 3,591 £ 2,250 £ 2,132 £ 2,250 £ 5,723 £ 7,973
Due to banks and
other financial institutions 25 £ - £ 1,910 £ - £ 1,314 £ - 3,224 £ 3,224
Debt securities in issue 28 - - 1,872 - 1,872 - 1,872
Related debt £ - £ 1,910 £ 1,872 £ 1,314 £ 1,872 £ 3,224 £ 5,096
GroupTotalTotal
£ mil£ mil
Wholesale Retail
£ mil£ mil£ mil
Private Private
£ mil £ mil
PublicPublic Public Private
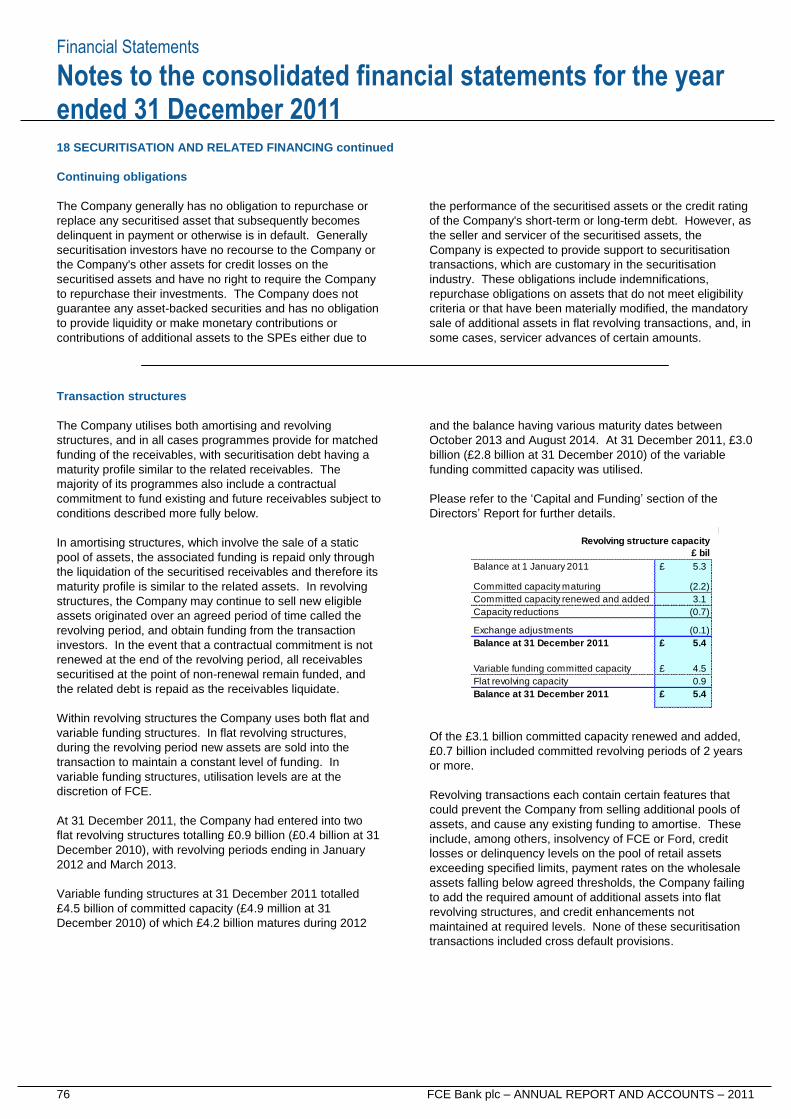
Financial Statements
76 FCE Bank plc – ANNUAL REPORT AND ACCOUNTS – 2011
Notes to the consolidated financial statements for the year ended 31 December 2011
18 SECURITISATION AND RELATED FINANCING continued
Continuing obligations
The Company generally has no obligation to repurchase or
replace any securitised asset that subsequently becomes
delinquent in payment or otherwise is in default. Generally
securitisation investors have no recourse to the Company or
the Company's other assets for credit losses on the
securitised assets and have no right to require the Company
to repurchase their investments. The Company does not
guarantee any asset-backed securities and has no obligation
to provide liquidity or make monetary contributions or
contributions of additional assets to the SPEs either due to
the performance of the securitised assets or the credit rating
of the Company's short-term or long-term debt. However, as
the seller and servicer of the securitised assets, the
Company is expected to provide support to securitisation
transactions, which are customary in the securitisation
industry. These obligations include indemnifications,
repurchase obligations on assets that do not meet eligibility
criteria or that have been materially modified, the mandatory
sale of additional assets in flat revolving transactions, and, in
some cases, servicer advances of certain amounts.
Transaction structures
The Company utilises both amortising and revolving
structures, and in all cases programmes provide for matched
funding of the receivables, with securitisation debt having a
maturity profile similar to the related receivables. The
majority of its programmes also include a contractual
commitment to fund existing and future receivables subject to
conditions described more fully below.
In amortising structures, which involve the sale of a static
pool of assets, the associated funding is repaid only through
the liquidation of the securitised receivables and therefore its
maturity profile is similar to the related assets. In revolving
structures, the Company may continue to sell new eligible
assets originated over an agreed period of time called the
revolving period, and obtain funding from the transaction
investors. In the event that a contractual commitment is not
renewed at the end of the revolving period, all receivables
securitised at the point of non-renewal remain funded, and
the related debt is repaid as the receivables liquidate.
Within revolving structures the Company uses both flat and
variable funding structures. In flat revolving structures,
during the revolving period new assets are sold into the
transaction to maintain a constant level of funding. In
variable funding structures, utilisation levels are at the
discretion of FCE.
At 31 December 2011, the Company had entered into two
flat revolving structures totalling £0.9 billion (£0.4 billion at 31
December 2010), with revolving periods ending in January
2012 and March 2013.
Variable funding structures at 31 December 2011 totalled
£4.5 billion of committed capacity (£4.9 million at 31
December 2010) of which £4.2 billion matures during 2012
and the balance having various maturity dates between
October 2013 and August 2014. At 31 December 2011, £3.0
billion (£2.8 billion at 31 December 2010) of the variable
funding committed capacity was utilised.
Please refer to the ‘Capital and Funding’ section of the
Directors’ Report for further details.
Of the £3.1 billion committed capacity renewed and added,
£0.7 billion included committed revolving periods of 2 years
or more.
Revolving transactions each contain certain features that
could prevent the Company from selling additional pools of
assets, and cause any existing funding to amortise. These
include, among others, insolvency of FCE or Ford, credit
losses or delinquency levels on the pool of retail assets
exceeding specified limits, payment rates on the wholesale
assets falling below agreed thresholds, the Company failing
to add the required amount of additional assets into flat
revolving structures, and credit enhancements not
maintained at required levels. None of these securitisation
transactions included cross default provisions.
Revolving structure capacity
Balance at 1 January 2011 £ 5.3
Committed capacity maturing (2.2)
Committed capacity renewed and added 3.1
Capacity reductions (0.7)
Exchange adjustments (0.1)
Balance at 31 December 2011 £ 5.4
Variable funding committed capacity £ 4.5
Flat revolving capacity 0.9
Balance at 31 December 2011 £ 5.4
£ bil
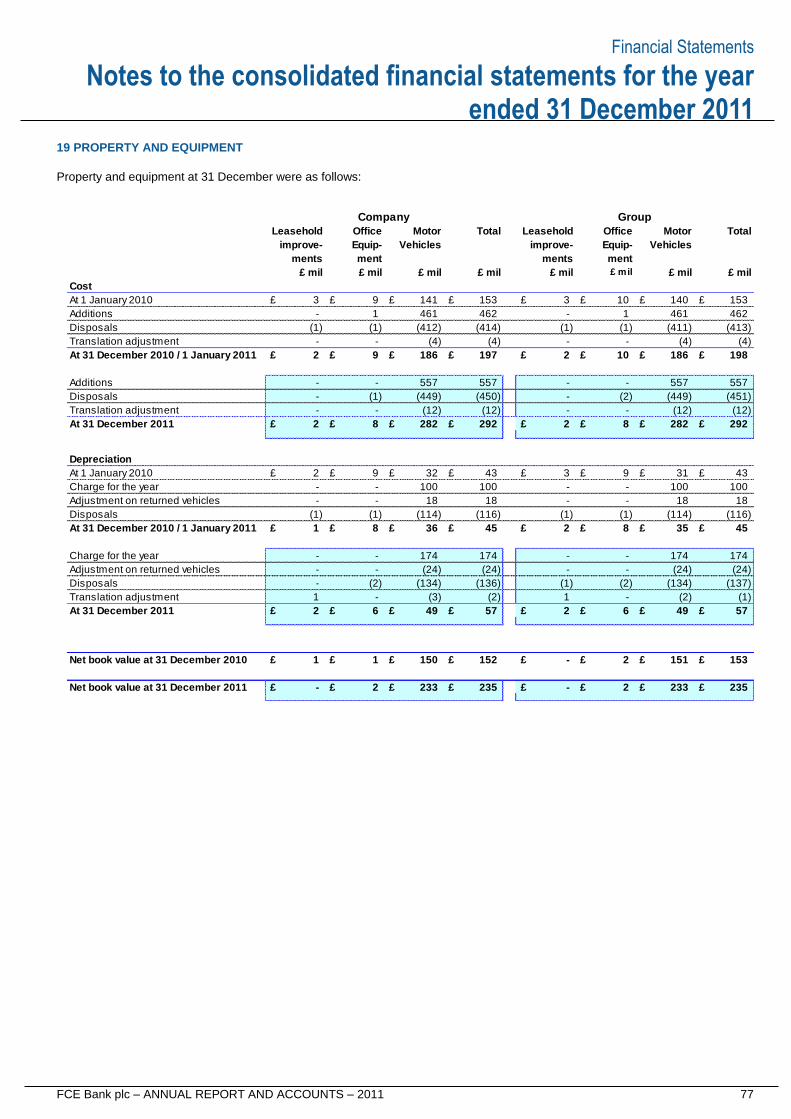
Financial Statements
FCE Bank plc – ANNUAL REPORT AND ACCOUNTS – 2011 77
Notes to the consolidated financial statements for the year ended 31 December 2011
19 PROPERTY AND EQUIPMENT
Property and equipment at 31 December were as follows:
Cost
At 1 January 2010 £ 3 £ 9 £ 141 £ 153 £ 3 £ 10 £ 140 £ 153
Additions - 1 461 462 - 1 461 462
Disposals (1) (1) (412) (414) (1) (1) (411) (413)
Translation adjustment - - (4) (4) - - (4) (4)
At 31 December 2010 / 1 January 2011 £ 2 £ 9 £ 186 £ 197 £ 2 £ 10 £ 186 £ 198
Additions - - 557 557 - - 557 557
Disposals - (1) (449) (450) - (2) (449) (451)
Translation adjustment - - (12) (12) - - (12) (12)
At 31 December 2011 £ 2 £ 8 £ 282 £ 292 £ 2 £ 8 £ 282 £ 292
Depreciation
At 1 January 2010 £ 2 £ 9 £ 32 £ 43 £ 3 £ 9 £ 31 £ 43
Charge for the year - - 100 100 - - 100 100
Adjustment on returned vehicles - - 18 18 - - 18 18
Disposals (1) (1) (114) (116) (1) (1) (114) (116)
At 31 December 2010 / 1 January 2011 £ 1 £ 8 £ 36 £ 45 £ 2 £ 8 £ 35 £ 45
Charge for the year - - 174 174 - - 174 174
Adjustment on returned vehicles - - (24) (24) - - (24) (24)
Disposals - (2) (134) (136) (1) (2) (134) (137)
Translation adjustment 1 - (3) (2) 1 - (2) (1)
At 31 December 2011 £ 2 £ 6 £ 49 £ 57 £ 2 £ 6 £ 49 £ 57
Net book value at 31 December 2010 £ 1 £ 1 £ 150 £ 152 £ - £ 2 £ 151 £ 153
Net book value at 31 December 2011 £ - £ 2 £ 233 £ 235 £ - £ 2 £ 233 £ 235
£ mil
Motor
Vehicles
Total
£ mil
ments
£ mil£ mil
ment
£ mil
Group
Equip-
Office
Company
TotalLeaseholdOffice
improve-
Motor
Vehiclesimprove-
Leasehold
Equip-
£ mil£ mil£ mil
ments ment
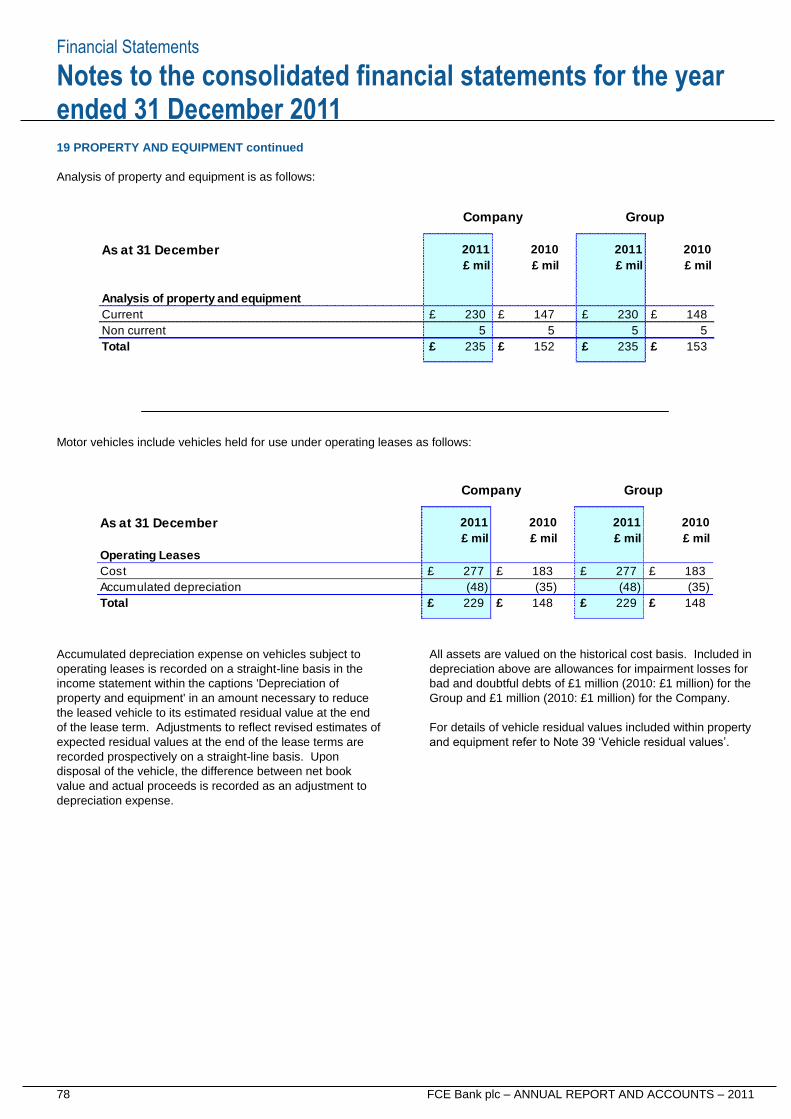
Financial Statements
78 FCE Bank plc – ANNUAL REPORT AND ACCOUNTS – 2011
Notes to the consolidated financial statements for the year ended 31 December 2011
19 PROPERTY AND EQUIPMENT continued
Analysis of property and equipment is as follows:
Motor vehicles include vehicles held for use under operating leases as follows:
Accumulated depreciation expense on vehicles subject to
operating leases is recorded on a straight-line basis in the
income statement within the captions 'Depreciation of
property and equipment' in an amount necessary to reduce
the leased vehicle to its estimated residual value at the end
of the lease term. Adjustments to reflect revised estimates of
expected residual values at the end of the lease terms are
recorded prospectively on a straight-line basis. Upon
disposal of the vehicle, the difference between net book
value and actual proceeds is recorded as an adjustment to
depreciation expense.
All assets are valued on the historical cost basis. Included in
depreciation above are allowances for impairment losses for
bad and doubtful debts of £1 million (2010: £1 million) for the
Group and £1 million (2010: £1 million) for the Company.
For details of vehicle residual values included within property
and equipment refer to Note 39 ‘Vehicle residual values’.
As at 31 December
Analysis of property and equipment
Current £ 230 £ 147 £ 230 £ 148
Non current 5 5 5 5
Total £ 235 £ 152 £ 235 £ 153
Company Group
£ mil
2011
£ mil
2011
£ mil
2010 2010
£ mil
As at 31 December
Operating Leases
Cost £ 277 £ 183 £ 277 £ 183
Accumulated depreciation (48) (35) (48) (35)
Total £ 229 £ 148 £ 229 £ 148
£ mil £ mil £ mil £ mil
Company Group
2011 2010 2011 2010
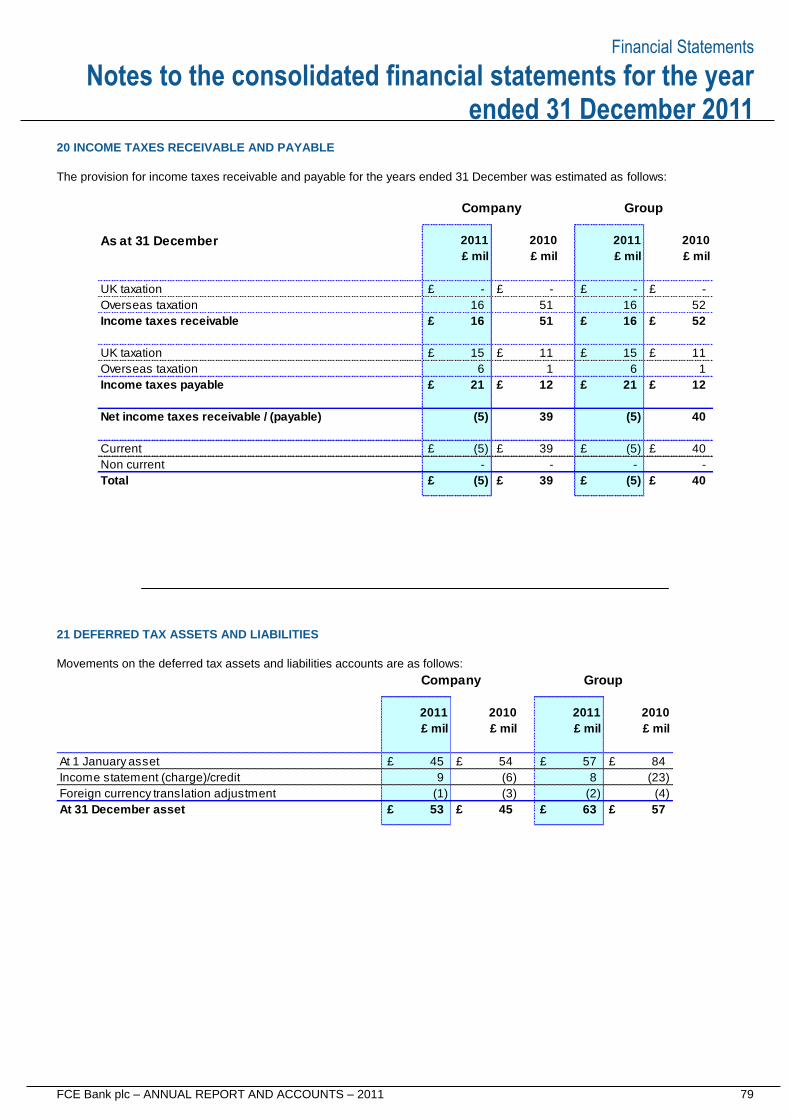
Financial Statements
FCE Bank plc – ANNUAL REPORT AND ACCOUNTS – 2011 79
Notes to the consolidated financial statements for the year ended 31 December 2011
20 INCOME TAXES RECEIVABLE AND PAYABLE
The provision for income taxes receivable and payable for the years ended 31 December was estimated as follows:
21 DEFERRED TAX ASSETS AND LIABILITIES
Movements on the deferred tax assets and liabilities accounts are as follows:
As at 31 December
UK taxation £ - £ - £ - £ -
Overseas taxation 16 51 16 52
Income taxes receivable £ 16 51 £ 16 £ 52
UK taxation £ 15 £ 11 £ 15 £ 11
Overseas taxation 6 1 6 1
Income taxes payable £ 21 £ 12 £ 21 £ 12
Net income taxes receivable / (payable) (5) 39 (5) 40
Current £ (5) £ 39 £ (5) £ 40
Non current - - - -
Total £ (5) £ 39 £ (5) £ 40
£ mil
Company Group
£ mil
2011
£ mil
2011
£ mil
2010 2010
At 1 January asset £ 45 £ 54 £ 57 £ 84
Income statement (charge)/credit 9 (6) 8 (23)
Foreign currency translation adjustment (1) (3) (2) (4)
At 31 December asset £ 53 £ 45 £ 63 £ 57
£ mil
Company Group
£ mil
2011
£ mil
2011
£ mil
2010 2010
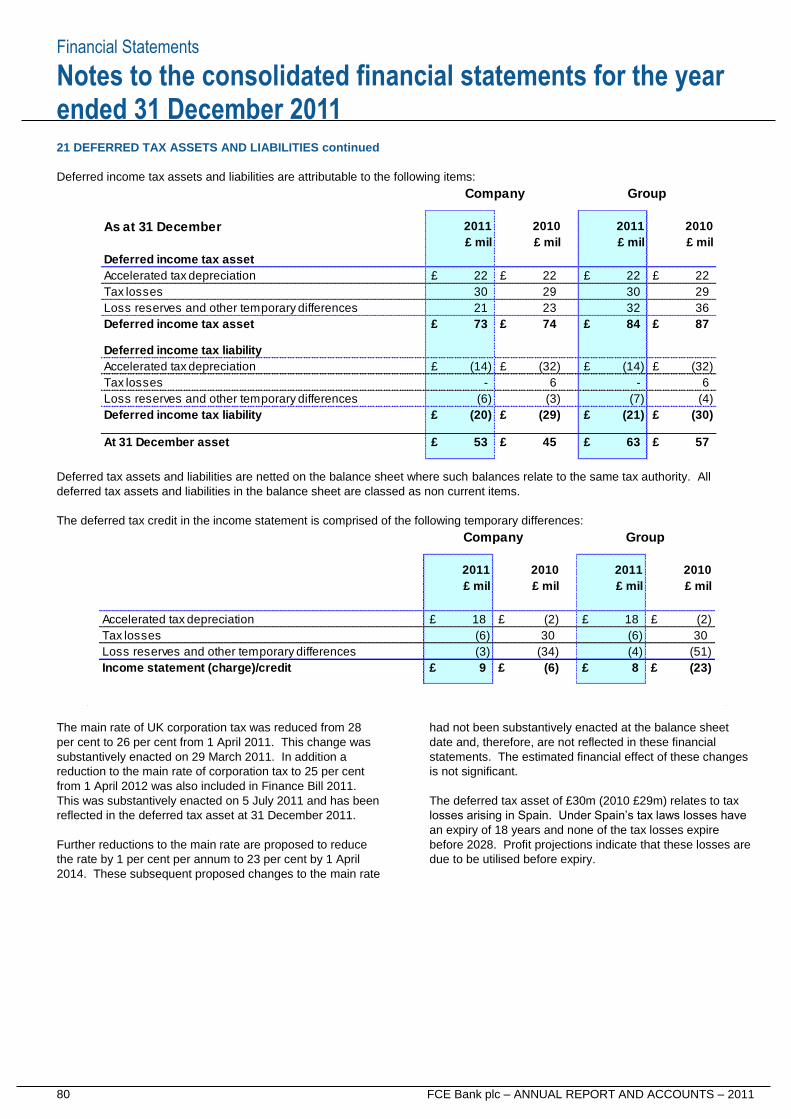
Financial Statements
80 FCE Bank plc – ANNUAL REPORT AND ACCOUNTS – 2011
Notes to the consolidated financial statements for the year ended 31 December 2011
21 DEFERRED TAX ASSETS AND LIABILITIES continued
Deferred income tax assets and liabilities are attributable to the following items:
Deferred tax assets and liabilities are netted on the balance sheet where such balances relate to the same tax authority. All
deferred tax assets and liabilities in the balance sheet are classed as non current items.
The deferred tax credit in the income statement is comprised of the following temporary differences:
The main rate of UK corporation tax was reduced from 28
per cent to 26 per cent from 1 April 2011. This change was
substantively enacted on 29 March 2011. In addition a
reduction to the main rate of corporation tax to 25 per cent
from 1 April 2012 was also included in Finance Bill 2011.
This was substantively enacted on 5 July 2011 and has been
reflected in the deferred tax asset at 31 December 2011.
Further reductions to the main rate are proposed to reduce
the rate by 1 per cent per annum to 23 per cent by 1 April
2014. These subsequent proposed changes to the main rate
had not been substantively enacted at the balance sheet
date and, therefore, are not reflected in these financial
statements. The estimated financial effect of these changes
is not significant.
The deferred tax asset of £30m (2010 £29m) relates to tax
losses arising in Spain. Under Spain’s tax laws losses have
an expiry of 18 years and none of the tax losses expire
before 2028. Profit projections indicate that these losses are
due to be utilised before expiry.
As at 31 December
Deferred income tax asset
Accelerated tax depreciation £ 22 £ 22 £ 22 £ 22
Tax losses 30 29 30 29
Loss reserves and other temporary differences 21 23 32 36
Deferred income tax asset £ 73 £ 74 £ 84 £ 87
Deferred income tax liability
Accelerated tax depreciation £ (14) £ (32) £ (14) £ (32)
Tax losses - 6 - 6
Loss reserves and other temporary differences (6) (3) (7) (4)
Deferred income tax liability £ (20) £ (29) £ (21) £ (30)
At 31 December asset £ 53 £ 45 £ 63 £ 57
Company Group
2011 2010 2011 2010
£ mil £ mil £ mil £ mil
Accelerated tax depreciation £ 18 £ (2) £ 18 £ (2)
Tax losses (6) 30 (6) 30
Loss reserves and other temporary differences (3) (34) (4) (51)
Income statement (charge)/credit £ 9 £ (6) £ 8 £ (23)
£ mil £ mil £ mil £ mil
2011 2010 2011 2010
Company Group
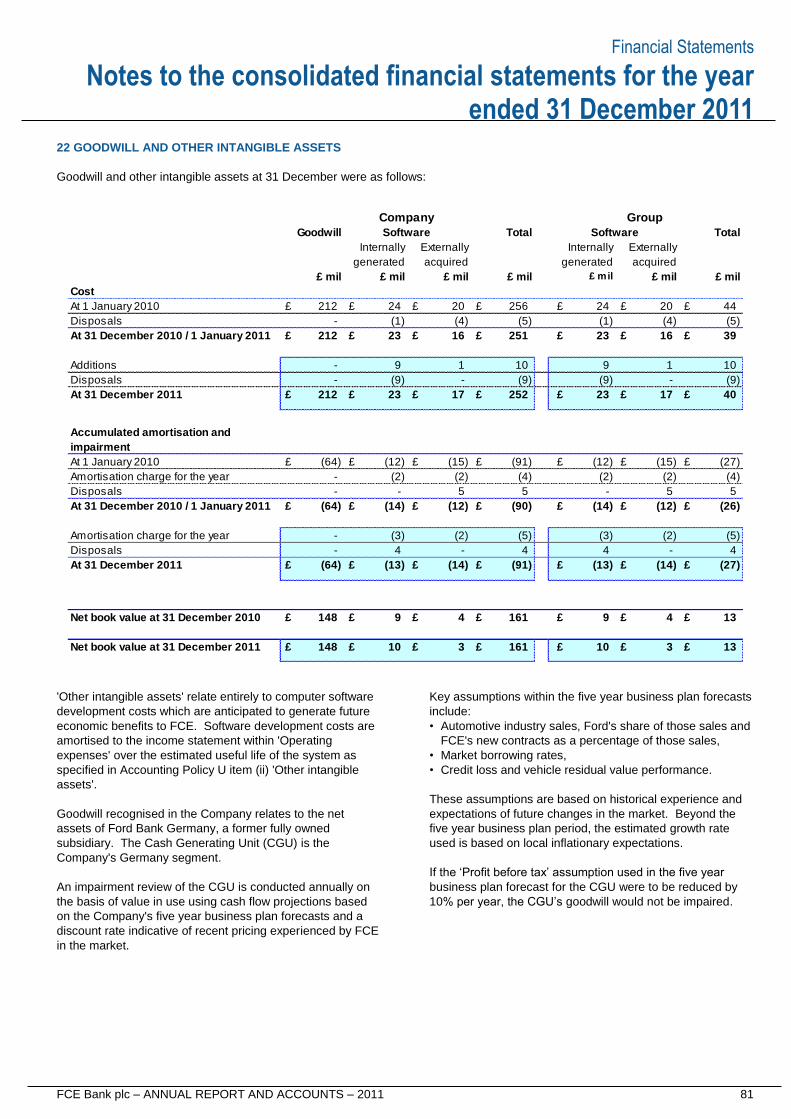
Financial Statements
FCE Bank plc – ANNUAL REPORT AND ACCOUNTS – 2011 81
Notes to the consolidated financial statements for the year ended 31 December 2011
22 GOODWILL AND OTHER INTANGIBLE ASSETS
Goodwill and other intangible assets at 31 December were as follows:
'Other intangible assets' relate entirely to computer software
development costs which are anticipated to generate future
economic benefits to FCE. Software development costs are
amortised to the income statement within 'Operating
expenses' over the estimated useful life of the system as
specified in Accounting Policy U item (ii) 'Other intangible
assets'.
Goodwill recognised in the Company relates to the net
assets of Ford Bank Germany, a former fully owned
subsidiary. The Cash Generating Unit (CGU) is the
Company's Germany segment.
An impairment review of the CGU is conducted annually on
the basis of value in use using cash flow projections based
on the Company's five year business plan forecasts and a
discount rate indicative of recent pricing experienced by FCE
in the market.
Key assumptions within the five year business plan forecasts
include:
• Automotive industry sales, Ford's share of those sales and
FCE's new contracts as a percentage of those sales,
• Market borrowing rates,
• Credit loss and vehicle residual value performance.
These assumptions are based on historical experience and
expectations of future changes in the market. Beyond the
five year business plan period, the estimated growth rate
used is based on local inflationary expectations.
If the ‘Profit before tax’ assumption used in the five year
business plan forecast for the CGU were to be reduced by
10% per year, the CGU’s goodwill would not be impaired.
Cost
At 1 January 2010 £ 212 £ 24 £ 20 £ 256 £ 24 £ 20 £ 44
Disposals - (1) (4) (5) (1) (4) (5)
At 31 December 2010 / 1 January 2011 £ 212 £ 23 £ 16 £ 251 £ 23 £ 16 £ 39
Additions - 9 1 10 9 1 10
Disposals - (9) - (9) (9) - (9)
At 31 December 2011 £ 212 £ 23 £ 17 £ 252 £ 23 £ 17 £ 40
Accumulated amortisation and
impairment
At 1 January 2010 £ (64) £ (12) £ (15) £ (91) £ (12) £ (15) £ (27)
Amortisation charge for the year - (2) (2) (4) (2) (2) (4)
Disposals - - 5 5 - 5 5
At 31 December 2010 / 1 January 2011 £ (64) £ (14) £ (12) £ (90) £ (14) £ (12) £ (26)
Amortisation charge for the year - (3) (2) (5) (3) (2) (5)
Disposals - 4 - 4 4 - 4
At 31 December 2011 £ (64) £ (13) £ (14) £ (91) £ (13) £ (14) £ (27)
Net book value at 31 December 2010 £ 148 £ 9 £ 4 £ 161 £ 9 £ 4 £ 13
Net book value at 31 December 2011 £ 148 £ 10 £ 3 £ 161 £ 10 £ 3 £ 13
Company
Externally
Goodwill Software Total
Internally
£ mil£ mil£ mil
acquiredgenerated
Group
Internally Externally
TotalSoftware
£ mil £ mil£ mil
generated
£ mil
acquired
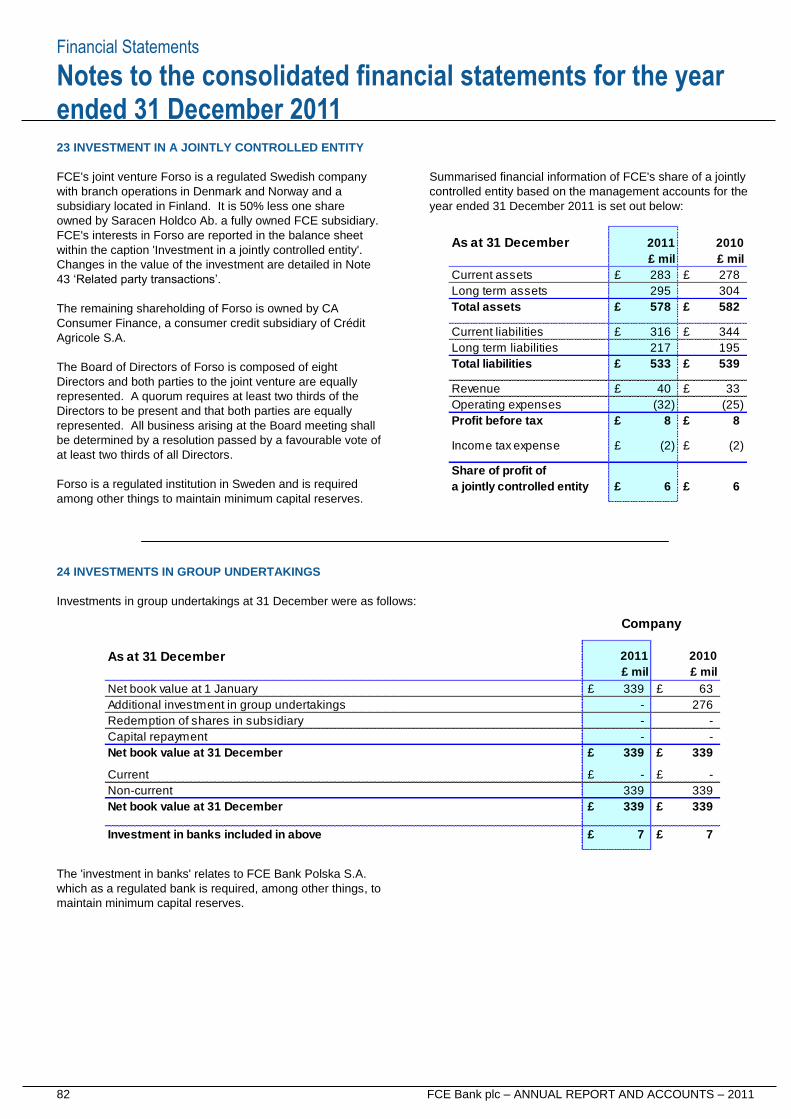
Financial Statements
82 FCE Bank plc – ANNUAL REPORT AND ACCOUNTS – 2011
Notes to the consolidated financial statements for the year ended 31 December 2011
23 INVESTMENT IN A JOINTLY CONTROLLED ENTITY
FCE's joint venture Forso is a regulated Swedish company
with branch operations in Denmark and Norway and a
subsidiary located in Finland. It is 50% less one share
owned by Saracen Holdco Ab. a fully owned FCE subsidiary.
FCE's interests in Forso are reported in the balance sheet
within the caption 'Investment in a jointly controlled entity'.
Changes in the value of the investment are detailed in Note
43 ‘Related party transactions’.
The remaining shareholding of Forso is owned by CA
Consumer Finance, a consumer credit subsidiary of Crédit
Agricole S.A.
The Board of Directors of Forso is composed of eight
Directors and both parties to the joint venture are equally
represented. A quorum requires at least two thirds of the
Directors to be present and that both parties are equally
represented. All business arising at the Board meeting shall
be determined by a resolution passed by a favourable vote of
at least two thirds of all Directors.
Forso is a regulated institution in Sweden and is required
among other things to maintain minimum capital reserves.
Summarised financial information of FCE's share of a jointly
controlled entity based on the management accounts for the
year ended 31 December 2011 is set out below:
24 INVESTMENTS IN GROUP UNDERTAKINGS
Investments in group undertakings at 31 December were as follows:
The 'investment in banks' relates to FCE Bank Polska S.A.
which as a regulated bank is required, among other things, to
maintain minimum capital reserves.
As at 31 December 2011 2010
£ mil £ mil
Current assets £ 283 £ 278
Long term assets 295 304
Total assets £ 578 £ 582
Current liabilities £ 316 £ 344
Long term liabilities 217 195
Total liabilities £ 533 £ 539
Revenue £ 40 £ 33
Operating expenses (32) (25)
Profit before tax £ 8 £ 8
Income tax expense £ (2) £ (2)
Share of profit of
a jointly controlled entity £ 6 £ 6
As at 31 December
Net book value at 1 January £ 339 £ 63
Additional investment in group undertakings - 276
Redemption of shares in subsidiary - -
Capital repayment - -
Net book value at 31 December £ 339 £ 339
Current £ - £ -
Non-current 339 339
Net book value at 31 December £ 339 £ 339
Investment in banks included in above £ 7 £ 7
Company
£ mil
2011
£ mil
2010
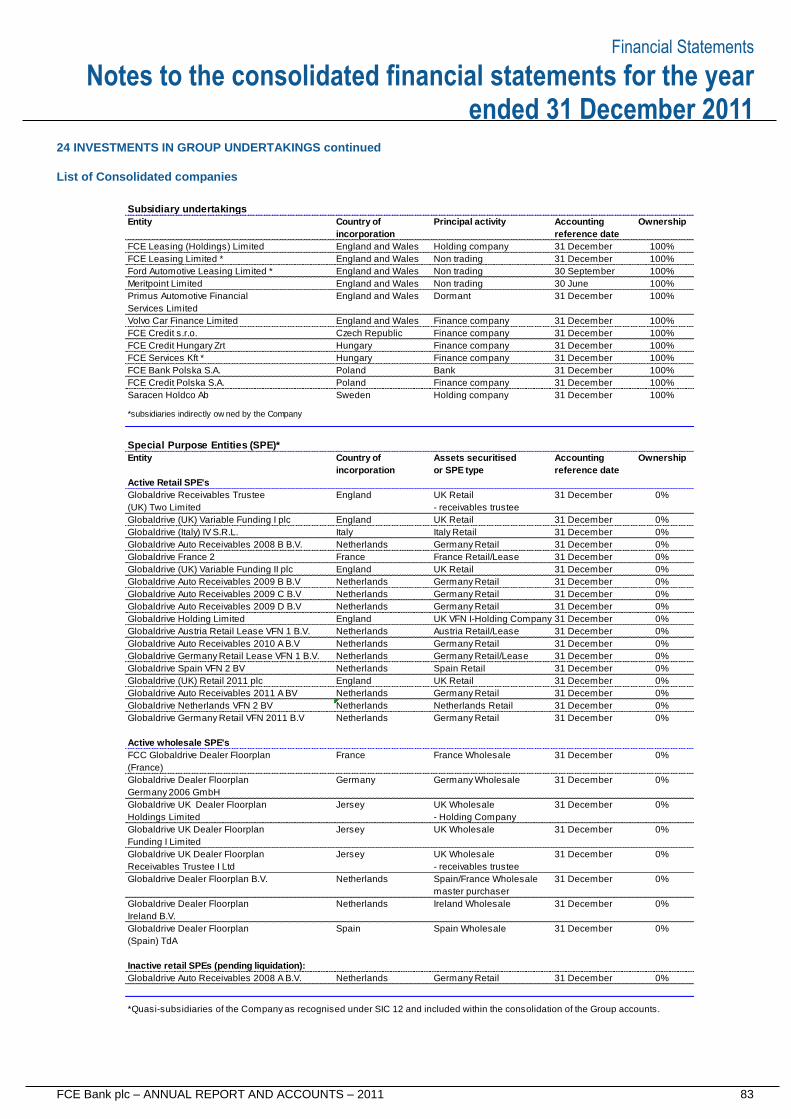
Financial Statements
FCE Bank plc – ANNUAL REPORT AND ACCOUNTS – 2011 83
Notes to the consolidated financial statements for the year ended 31 December 2011
24 INVESTMENTS IN GROUP UNDERTAKINGS continued
List of Consolidated companies
Subsidiary undertakings
Entity Country of Principal activity Accounting Ownership
incorporation reference date
FCE Leasing (Holdings) Limited England and Wales Holding company 31 December 100%
FCE Leasing Limited * England and Wales Non trading 31 December 100%
Ford Automotive Leasing Limited * England and Wales Non trading 30 September 100%
Meritpoint Limited England and Wales Non trading 30 June 100%
Primus Automotive Financial England and Wales Dormant 31 December 100%
Services Limited
Volvo Car Finance Limited England and Wales Finance company 31 December 100%
FCE Credit s.r.o. Czech Republic Finance company 31 December 100%
FCE Credit Hungary Zrt Hungary Finance company 31 December 100%
FCE Services Kft * Hungary Finance company 31 December 100%
FCE Bank Polska S.A. Poland Bank 31 December 100%
FCE Credit Polska S.A. Poland Finance company 31 December 100%
Saracen Holdco Ab Sweden Holding company 31 December 100%
*subsidiaries indirectly ow ned by the Company
Special Purpose Entities (SPE)*
Entity Country of Assets securitised Accounting Ownership
incorporation or SPE type reference date
Active Retail SPE's
Globaldrive Receivables Trustee England UK Retail 31 December 0%
(UK) Two Limited - receivables trustee
Globaldrive (UK) Variable Funding I plc England UK Retail 31 December 0%
Globaldrive (Italy) IV S.R.L. Italy Italy Retail 31 December 0%
Globaldrive Auto Receivables 2008 B B.V. Netherlands Germany Retail 31 December 0%
Globaldrive France 2 France France Retail/Lease 31 December 0%
Globaldrive (UK) Variable Funding II plc England UK Retail 31 December 0%
Globaldrive Auto Receivables 2009 B B.V Netherlands Germany Retail 31 December 0%
Globaldrive Auto Receivables 2009 C B.V Netherlands Germany Retail 31 December 0%
Globaldrive Auto Receivables 2009 D B.V Netherlands Germany Retail 31 December 0%
Globaldrive Holding Limited England UK VFN I-Holding Company 31 December 0%
Globaldrive Austria Retail Lease VFN 1 B.V. Netherlands Austria Retail/Lease 31 December 0%
Globaldrive Auto Receivables 2010 A B.V Netherlands Germany Retail 31 December 0%
Globaldrive Germany Retail Lease VFN 1 B.V. Netherlands Germany Retail/Lease 31 December 0%
Globaldrive Spain VFN 2 BV Netherlands Spain Retail 31 December 0%
Globaldrive (UK) Retail 2011 plc England UK Retail 31 December 0%
Globaldrive Auto Receivables 2011 A BV Netherlands Germany Retail 31 December 0%
Globaldrive Netherlands VFN 2 BV Netherlands Netherlands Retail 31 December 0%
Globaldrive Germany Retail VFN 2011 B.V Netherlands Germany Retail 31 December 0%
Active wholesale SPE's
FCC Globaldrive Dealer Floorplan France France Wholesale 31 December 0%
(France)
Globaldrive Dealer Floorplan Germany Germany Wholesale 31 December 0%
Germany 2006 GmbH
Globaldrive UK Dealer Floorplan Jersey UK Wholesale 31 December 0%
Holdings Limited - Holding Company
Globaldrive UK Dealer Floorplan Jersey UK Wholesale 31 December 0%
Funding I Limited
Globaldrive UK Dealer Floorplan Jersey UK Wholesale 31 December 0%
Receivables Trustee I Ltd - receivables trustee
Globaldrive Dealer Floorplan B.V. Netherlands Spain/France Wholesale 31 December 0%
master purchaser
Globaldrive Dealer Floorplan Netherlands Ireland Wholesale 31 December 0%
Ireland B.V.
Globaldrive Dealer Floorplan Spain Spain Wholesale 31 December 0%
(Spain) TdA
Inactive retail SPEs (pending liquidation):
Globaldrive Auto Receivables 2008 A B.V. Netherlands Germany Retail 31 December 0%
*Quasi-subsidiaries of the Company as recognised under SIC 12 and included within the consolidation of the Group accounts.
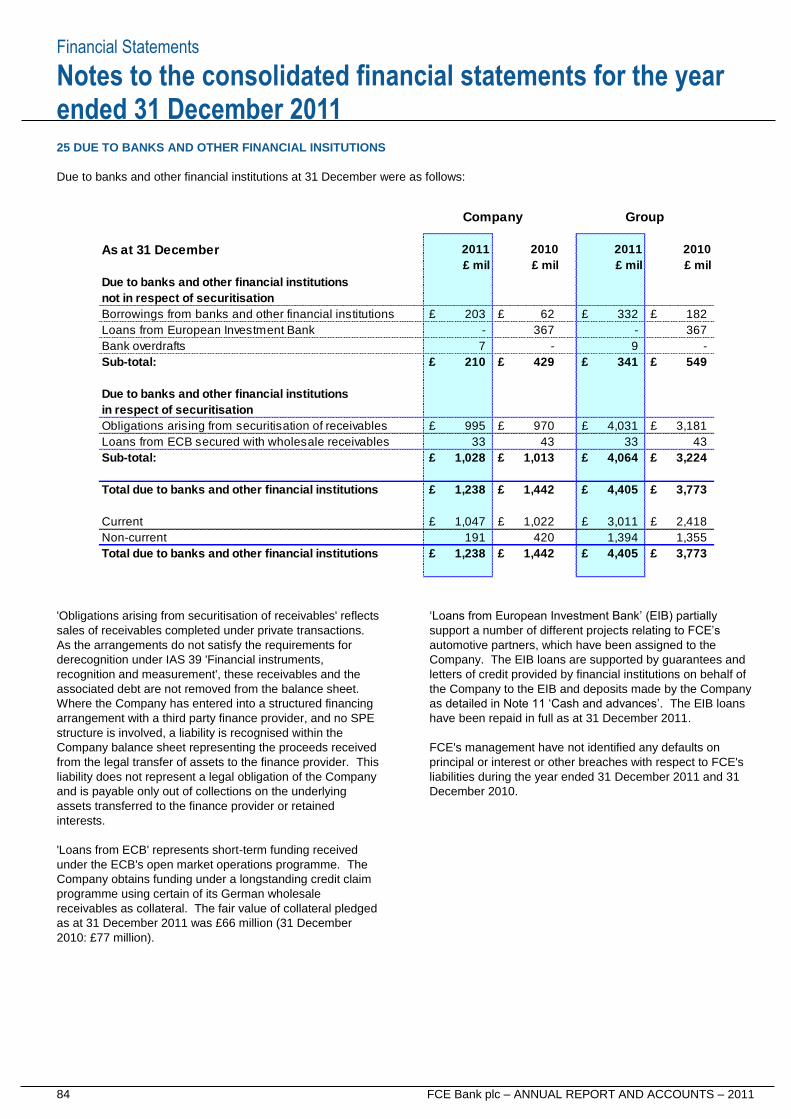
Financial Statements
84 FCE Bank plc – ANNUAL REPORT AND ACCOUNTS – 2011
Notes to the consolidated financial statements for the year ended 31 December 2011
25 DUE TO BANKS AND OTHER FINANCIAL INSITUTIONS
Due to banks and other financial institutions at 31 December were as follows:
'Obligations arising from securitisation of receivables' reflects
sales of receivables completed under private transactions.
As the arrangements do not satisfy the requirements for
derecognition under IAS 39 'Financial instruments,
recognition and measurement', these receivables and the
associated debt are not removed from the balance sheet.
Where the Company has entered into a structured financing
arrangement with a third party finance provider, and no SPE
structure is involved, a liability is recognised within the
Company balance sheet representing the proceeds received
from the legal transfer of assets to the finance provider. This
liability does not represent a legal obligation of the Company
and is payable only out of collections on the underlying
assets transferred to the finance provider or retained
interests.
'Loans from ECB' represents short-term funding received
under the ECB's open market operations programme. The
Company obtains funding under a longstanding credit claim
programme using certain of its German wholesale
receivables as collateral. The fair value of collateral pledged
as at 31 December 2011 was £66 million (31 December
2010: £77 million).
‘Loans from European Investment Bank’ (EIB) partially
support a number of different projects relating to FCE’s
automotive partners, which have been assigned to the
Company. The EIB loans are supported by guarantees and
letters of credit provided by financial institutions on behalf of
the Company to the EIB and deposits made by the Company
as detailed in Note 11 ‘Cash and advances’. The EIB loans
have been repaid in full as at 31 December 2011.
FCE's management have not identified any defaults on
principal or interest or other breaches with respect to FCE's
liabilities during the year ended 31 December 2011 and 31
December 2010.
As at 31 December
Due to banks and other financial institutions
not in respect of securitisation
Borrowings from banks and other financial institutions £ 203 £ 62 £ 332 £ 182
Loans from European Investment Bank - 367 - 367
Bank overdrafts 7 - 9 -
Sub-total: £ 210 £ 429 £ 341 £ 549
Due to banks and other financial institutions
in respect of securitisation
Obligations arising from securitisation of receivables £ 995 £ 970 £ 4,031 £ 3,181
Loans from ECB secured with wholesale receivables 33 43 33 43
Sub-total: £ 1,028 £ 1,013 £ 4,064 £ 3,224
Total due to banks and other financial institutions £ 1,238 £ 1,442 £ 4,405 £ 3,773
Current £ 1,047 £ 1,022 £ 3,011 £ 2,418
Non-current 191 420 1,394 1,355
Total due to banks and other financial institutions £ 1,238 £ 1,442 £ 4,405 £ 3,773
£ mil £ mil £ mil £ mil
Company Group
2011 20112010 2010
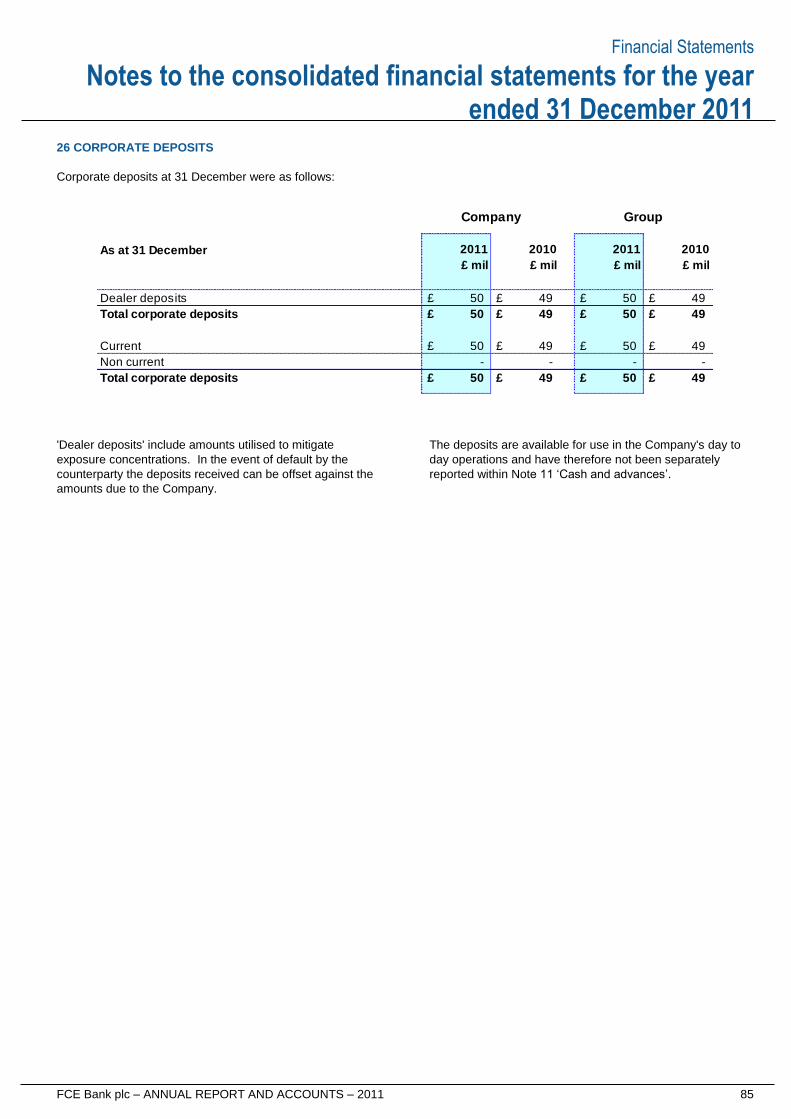
Financial Statements
FCE Bank plc – ANNUAL REPORT AND ACCOUNTS – 2011 85
Notes to the consolidated financial statements for the year ended 31 December 2011
26 CORPORATE DEPOSITS
Corporate deposits at 31 December were as follows:
'Dealer deposits' include amounts utilised to mitigate
exposure concentrations. In the event of default by the
counterparty the deposits received can be offset against the
amounts due to the Company.
The deposits are available for use in the Company's day to
day operations and have therefore not been separately
reported within Note 11 ‘Cash and advances’.
As at 31 December
Dealer deposits £ 50 £ 49 £ 50 £ 49
Total corporate deposits £ 50 £ 49 £ 50 £ 49
Current £ 50 £ 49 £ 50 £ 49
Non current - - - -
Total corporate deposits £ 50 £ 49 £ 50 £ 49
£ mil
Company Group
£ mil
2011
£ mil
2011
£ mil
2010 2010
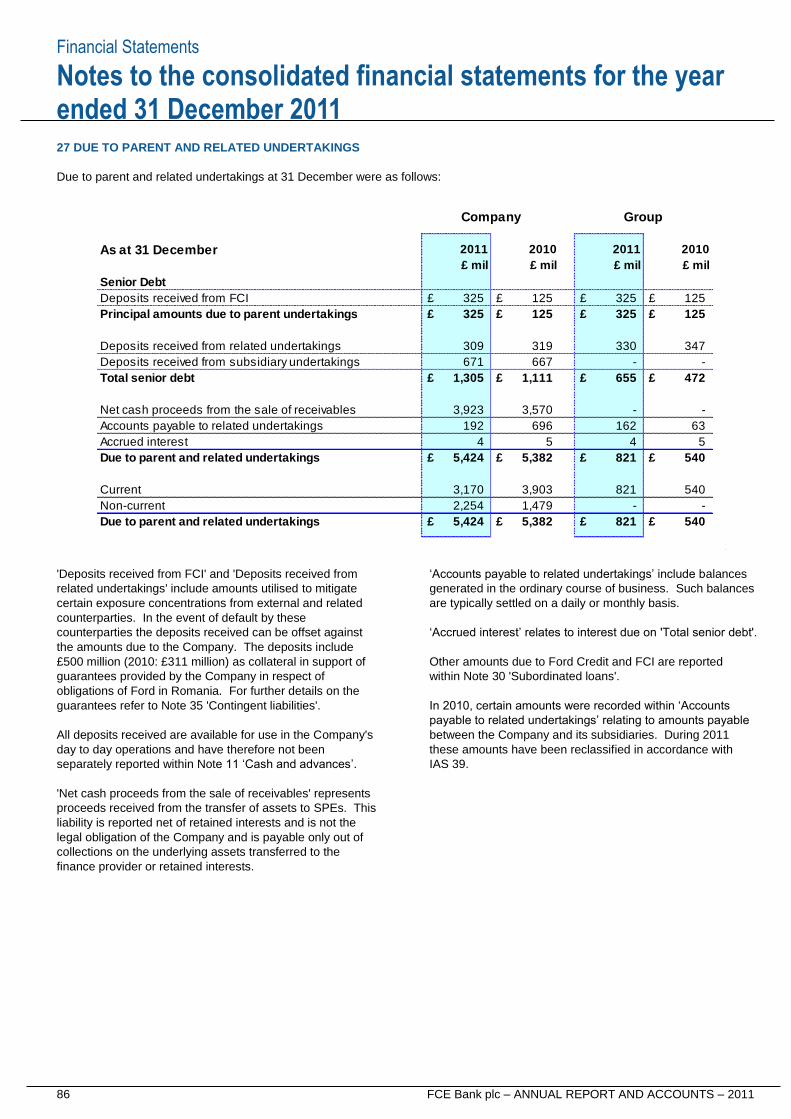
Financial Statements
86 FCE Bank plc – ANNUAL REPORT AND ACCOUNTS – 2011
Notes to the consolidated financial statements for the year ended 31 December 2011
27 DUE TO PARENT AND RELATED UNDERTAKINGS
Due to parent and related undertakings at 31 December were as follows:
'Deposits received from FCI' and 'Deposits received from
related undertakings' include amounts utilised to mitigate
certain exposure concentrations from external and related
counterparties. In the event of default by these
counterparties the deposits received can be offset against
the amounts due to the Company. The deposits include
£500 million (2010: £311 million) as collateral in support of
guarantees provided by the Company in respect of
obligations of Ford in Romania. For further details on the
guarantees refer to Note 35 'Contingent liabilities'.
All deposits received are available for use in the Company's
day to day operations and have therefore not been
separately reported within Note 11 ‘Cash and advances’.
'Net cash proceeds from the sale of receivables' represents
proceeds received from the transfer of assets to SPEs. This
liability is reported net of retained interests and is not the
legal obligation of the Company and is payable only out of
collections on the underlying assets transferred to the
finance provider or retained interests.
‘Accounts payable to related undertakings’ include balances
generated in the ordinary course of business. Such balances
are typically settled on a daily or monthly basis.
‘Accrued interest’ relates to interest due on 'Total senior debt'.
Other amounts due to Ford Credit and FCI are reported
within Note 30 'Subordinated loans'.
In 2010, certain amounts were recorded within ‘Accounts
payable to related undertakings’ relating to amounts payable
between the Company and its subsidiaries. During 2011
these amounts have been reclassified in accordance with
IAS 39.
As at 31 December
Senior Debt
Deposits received from FCI £ 325 £ 125 £ 325 £ 125
Principal amounts due to parent undertakings £ 325 £ 125 £ 325 £ 125
Deposits received from related undertakings 309 319 330 347
Deposits received from subsidiary undertakings 671 667 - -
Total senior debt £ 1,305 £ 1,111 £ 655 £ 472
Net cash proceeds from the sale of receivables 3,923 3,570 - -
Accounts payable to related undertakings 192 696 162 63
Accrued interest 4 5 4 5
Due to parent and related undertakings £ 5,424 £ 5,382 £ 821 £ 540
Current 3,170 3,903 821 540
Non-current 2,254 1,479 - -
Due to parent and related undertakings £ 5,424 £ 5,382 £ 821 £ 540
£ mil £ mil £ mil £ mil
Company Group
2011 2010 2011 2010
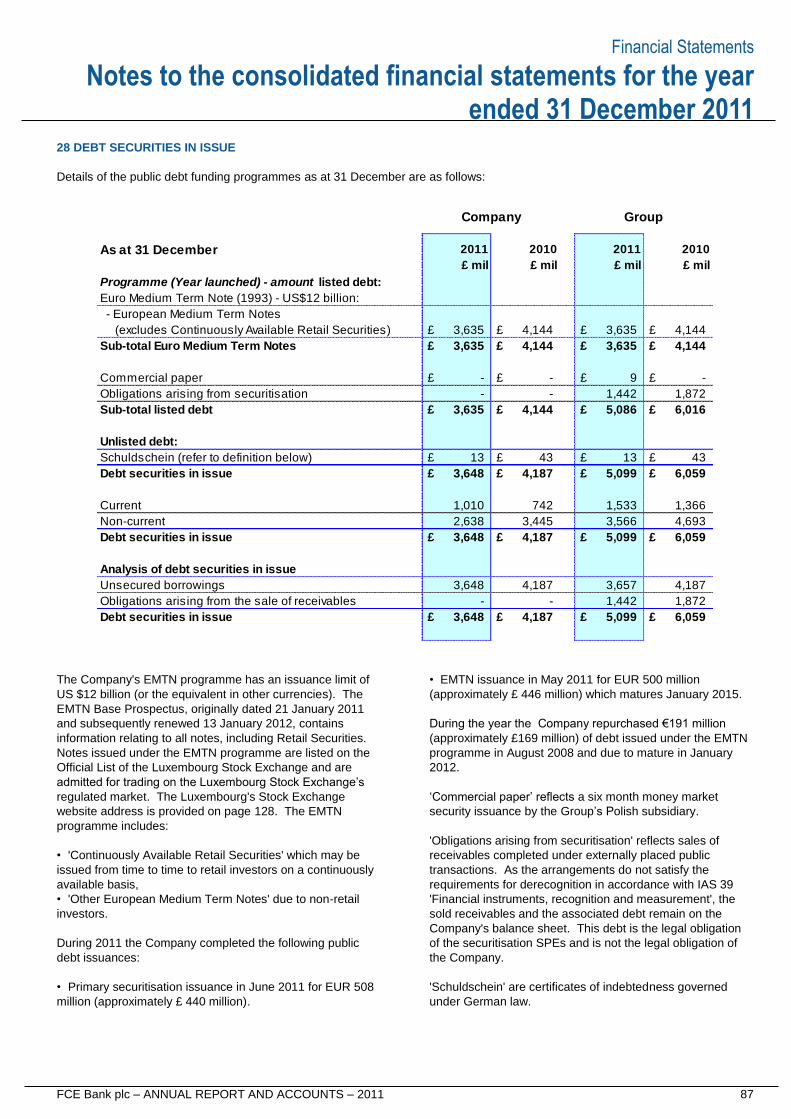
Financial Statements
FCE Bank plc – ANNUAL REPORT AND ACCOUNTS – 2011 87
Notes to the consolidated financial statements for the year ended 31 December 2011
28 DEBT SECURITIES IN ISSUE
Details of the public debt funding programmes as at 31 December are as follows:
The Company's EMTN programme has an issuance limit of
US $12 billion (or the equivalent in other currencies). The
EMTN Base Prospectus, originally dated 21 January 2011
and subsequently renewed 13 January 2012, contains
information relating to all notes, including Retail Securities.
Notes issued under the EMTN programme are listed on the
Official List of the Luxembourg Stock Exchange and are
admitted for trading on the Luxembourg Stock Exchange’s
regulated market. The Luxembourg's Stock Exchange
website address is provided on page 128. The EMTN
programme includes:
• 'Continuously Available Retail Securities' which may be
issued from time to time to retail investors on a continuously
available basis,
• 'Other European Medium Term Notes' due to non-retail
investors.
During 2011 the Company completed the following public
debt issuances:
• Primary securitisation issuance in June 2011 for EUR 508
million (approximately £ 440 million).
• EMTN issuance in May 2011 for EUR 500 million
(approximately £ 446 million) which matures January 2015.
During the year the Company repurchased €191 million
(approximately £169 million) of debt issued under the EMTN
programme in August 2008 and due to mature in January
2012.
‘Commercial paper’ reflects a six month money market
security issuance by the Group’s Polish subsidiary.
'Obligations arising from securitisation' reflects sales of
receivables completed under externally placed public
transactions. As the arrangements do not satisfy the
requirements for derecognition in accordance with IAS 39
'Financial instruments, recognition and measurement', the
sold receivables and the associated debt remain on the
Company's balance sheet. This debt is the legal obligation
of the securitisation SPEs and is not the legal obligation of
the Company.
'Schuldschein' are certificates of indebtedness governed
under German law.
As at 31 December
Programme (Year launched) - amount listed debt:
Euro Medium Term Note (1993) - US$12 billion:
- European Medium Term Notes
(excludes Continuously Available Retail Securities) £ 3,635 £ 4,144 £ 3,635 £ 4,144
Sub-total Euro Medium Term Notes £ 3,635 £ 4,144 £ 3,635 £ 4,144
Commercial paper £ - £ - £ 9 £ -
Obligations arising from securitisation - - 1,442 1,872
Sub-total listed debt £ 3,635 £ 4,144 £ 5,086 £ 6,016
Unlisted debt:
Schuldschein (refer to definition below) £ 13 £ 43 £ 13 £ 43
Debt securities in issue £ 3,648 £ 4,187 £ 5,099 £ 6,059
Current 1,010 742 1,533 1,366
Non-current 2,638 3,445 3,566 4,693
Debt securities in issue £ 3,648 £ 4,187 £ 5,099 £ 6,059
Analysis of debt securities in issue
Unsecured borrowings 3,648 4,187 3,657 4,187
Obligations arising from the sale of receivables - - 1,442 1,872
Debt securities in issue £ 3,648 £ 4,187 £ 5,099 £ 6,059
£ mil
Company Group
£ mil
2011
£ mil
2011
£ mil
2010 2010
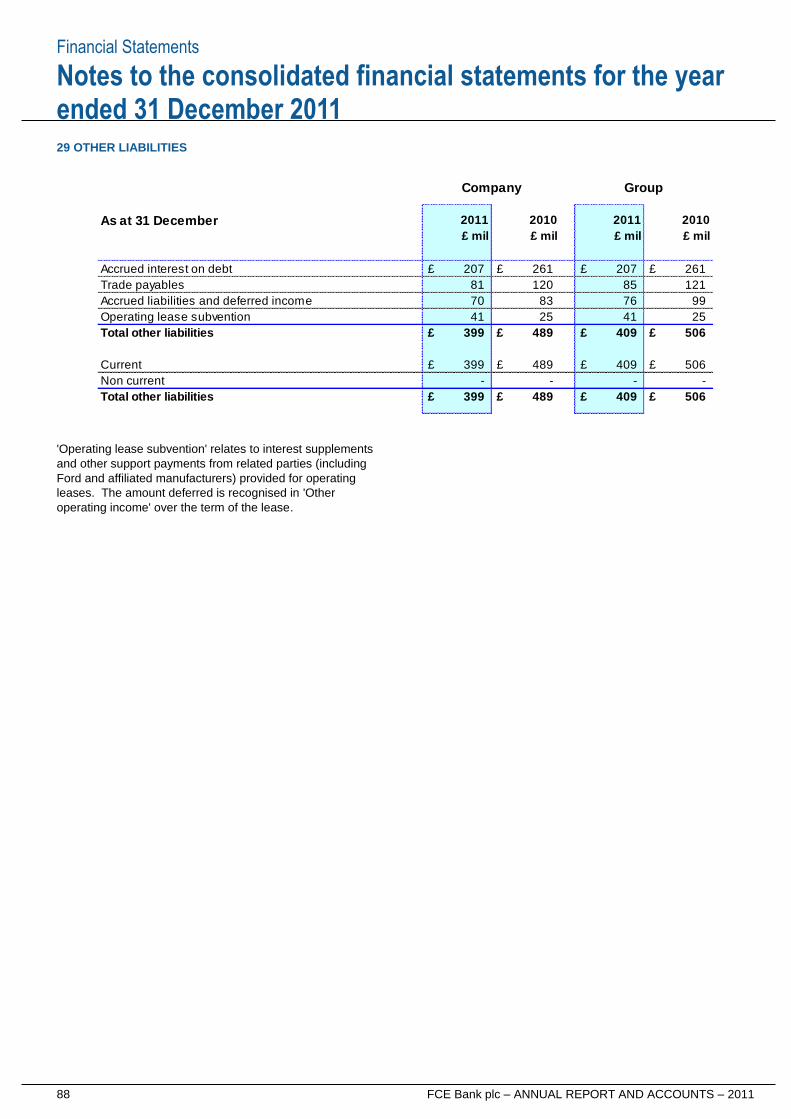
Financial Statements
88 FCE Bank plc – ANNUAL REPORT AND ACCOUNTS – 2011
Notes to the consolidated financial statements for the year ended 31 December 2011
29 OTHER LIABILITIES
'Operating lease subvention' relates to interest supplements
and other support payments from related parties (including
Ford and affiliated manufacturers) provided for operating
leases. The amount deferred is recognised in 'Other
operating income' over the term of the lease.
As at 31 December
Accrued interest on debt £ 207 £ 261 £ 207 £ 261
Trade payables 81 120 85 121
Accrued liabilities and deferred income 70 83 76 99
Operating lease subvention 41 25 41 25
Total other liabilities £ 399 £ 489 £ 409 £ 506
Current £ 399 £ 489 £ 409 £ 506
Non current - - - -
Total other liabilities £ 399 £ 489 £ 409 £ 506
£ mil
Company Group
£ mil
2011
£ mil
2011
£ mil
2010 2010
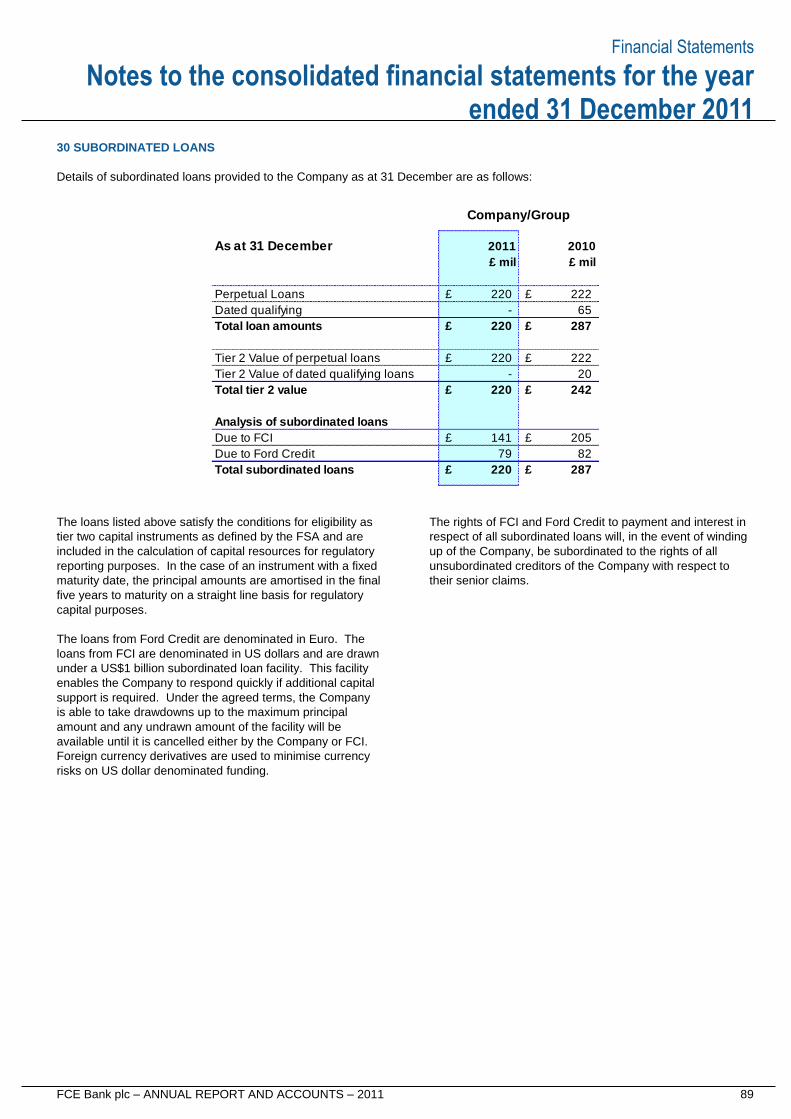
Financial Statements
FCE Bank plc – ANNUAL REPORT AND ACCOUNTS – 2011 89
Notes to the consolidated financial statements for the year ended 31 December 2011
30 SUBORDINATED LOANS
Details of subordinated loans provided to the Company as at 31 December are as follows:
The loans listed above satisfy the conditions for eligibility as
tier two capital instruments as defined by the FSA and are
included in the calculation of capital resources for regulatory
reporting purposes. In the case of an instrument with a fixed
maturity date, the principal amounts are amortised in the final
five years to maturity on a straight line basis for regulatory
capital purposes.
The loans from Ford Credit are denominated in Euro. The
loans from FCI are denominated in US dollars and are drawn
under a US$1 billion subordinated loan facility. This facility
enables the Company to respond quickly if additional capital
support is required. Under the agreed terms, the Company
is able to take drawdowns up to the maximum principal
amount and any undrawn amount of the facility will be
available until it is cancelled either by the Company or FCI.
Foreign currency derivatives are used to minimise currency
risks on US dollar denominated funding.
The rights of FCI and Ford Credit to payment and interest in
respect of all subordinated loans will, in the event of winding
up of the Company, be subordinated to the rights of all
unsubordinated creditors of the Company with respect to
their senior claims.
As at 31 December
Perpetual Loans £ 220 £ 222
Dated qualifying - 65
£ 220 £ 287
£ 220 £ 222
- 20
£ 220 £ 242
£ 141 £ 205
79 82
Total subordinated loans £ 220 £ 287
Company/Group
£ mil £ mil
2011 2010
Due to Ford Credit
Total loan amounts
Tier 2 Value of dated qualifying loans
Analysis of subordinated loans
Due to FCI
Tier 2 Value of perpetual loans
Total tier 2 value
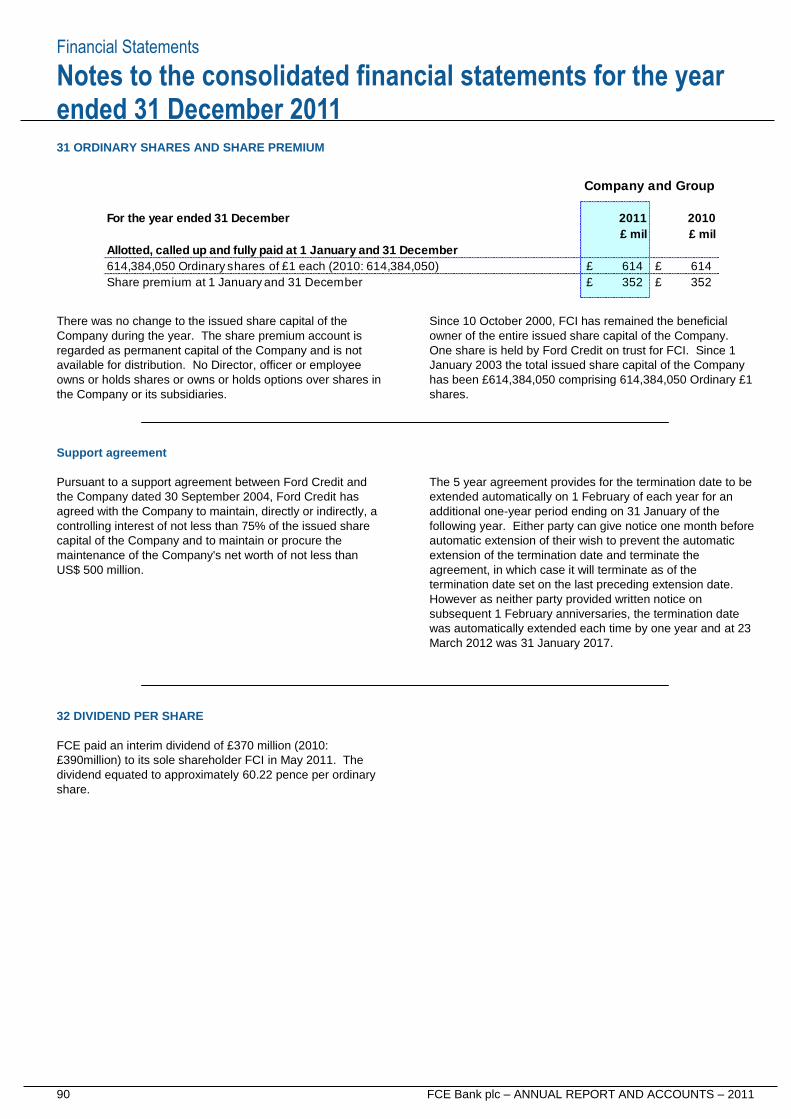
Financial Statements
90 FCE Bank plc – ANNUAL REPORT AND ACCOUNTS – 2011
Notes to the consolidated financial statements for the year ended 31 December 2011
31 ORDINARY SHARES AND SHARE PREMIUM
There was no change to the issued share capital of the
Company during the year. The share premium account is
regarded as permanent capital of the Company and is not
available for distribution. No Director, officer or employee
owns or holds shares or owns or holds options over shares in
the Company or its subsidiaries.
Since 10 October 2000, FCI has remained the beneficial
owner of the entire issued share capital of the Company.
One share is held by Ford Credit on trust for FCI. Since 1
January 2003 the total issued share capital of the Company
has been £614,384,050 comprising 614,384,050 Ordinary £1
shares.
Support agreement
Pursuant to a support agreement between Ford Credit and
the Company dated 30 September 2004, Ford Credit has
agreed with the Company to maintain, directly or indirectly, a
controlling interest of not less than 75% of the issued share
capital of the Company and to maintain or procure the
maintenance of the Company's net worth of not less than
US$ 500 million.
The 5 year agreement provides for the termination date to be
extended automatically on 1 February of each year for an
additional one-year period ending on 31 January of the
following year. Either party can give notice one month before
automatic extension of their wish to prevent the automatic
extension of the termination date and terminate the
agreement, in which case it will terminate as of the
termination date set on the last preceding extension date.
However as neither party provided written notice on
subsequent 1 February anniversaries, the termination date
was automatically extended each time by one year and at 23
March 2012 was 31 January 2017.
32 DIVIDEND PER SHARE
FCE paid an interim dividend of £370 million (2010:
£390million) to its sole shareholder FCI in May 2011. The
dividend equated to approximately 60.22 pence per ordinary
share.
For the year ended 31 December 2011 2010
£ mil £ mil
Allotted, called up and fully paid at 1 January and 31 December
614,384,050 Ordinary shares of £1 each (2010: 614,384,050) £ 614 £ 614
Share premium at 1 January and 31 December £ 352 £ 352
Company and Group
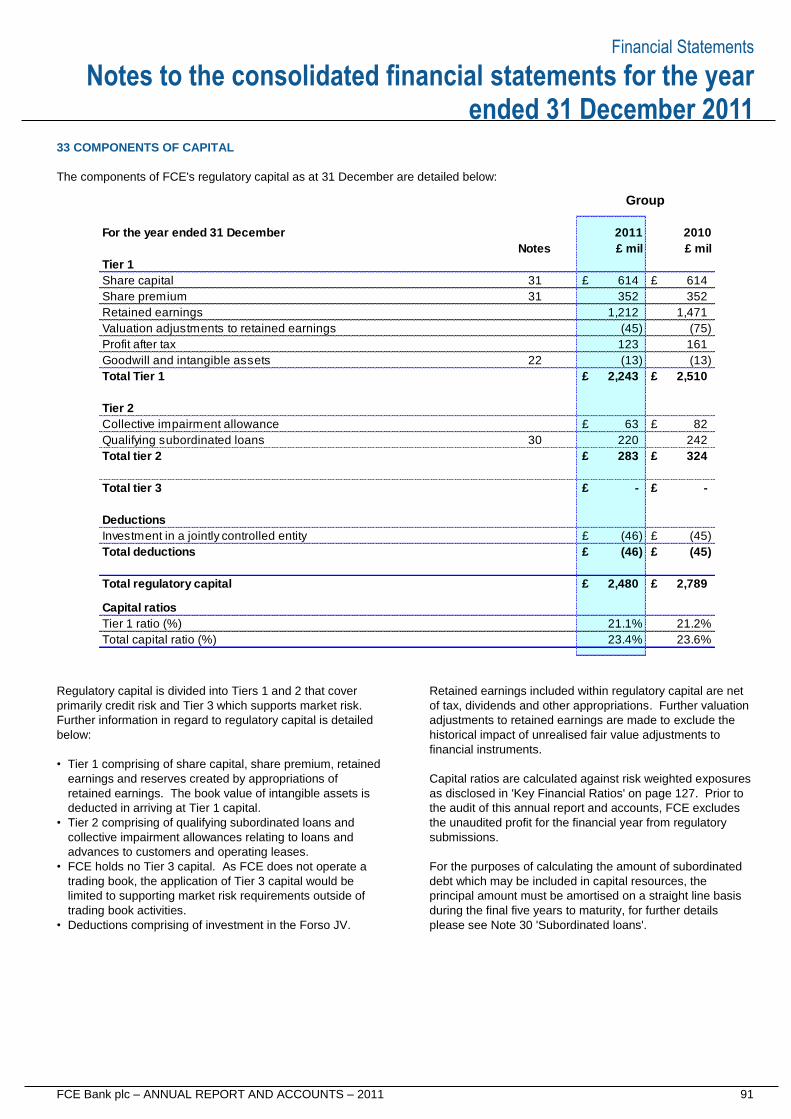
Financial Statements
FCE Bank plc – ANNUAL REPORT AND ACCOUNTS – 2011 91
Notes to the consolidated financial statements for the year ended 31 December 2011
33 COMPONENTS OF CAPITAL
The components of FCE's regulatory capital as at 31 December are detailed below:
Regulatory capital is divided into Tiers 1 and 2 that cover
primarily credit risk and Tier 3 which supports market risk.
Further information in regard to regulatory capital is detailed
below:
• Tier 1 comprising of share capital, share premium, retained
earnings and reserves created by appropriations of
retained earnings. The book value of intangible assets is
deducted in arriving at Tier 1 capital.
• Tier 2 comprising of qualifying subordinated loans and
collective impairment allowances relating to loans and
advances to customers and operating leases.
• FCE holds no Tier 3 capital. As FCE does not operate a
trading book, the application of Tier 3 capital would be
limited to supporting market risk requirements outside of
trading book activities.
• Deductions comprising of investment in the Forso JV.
Retained earnings included within regulatory capital are net
of tax, dividends and other appropriations. Further valuation
adjustments to retained earnings are made to exclude the
historical impact of unrealised fair value adjustments to
financial instruments.
Capital ratios are calculated against risk weighted exposures
as disclosed in 'Key Financial Ratios' on page 127. Prior to
the audit of this annual report and accounts, FCE excludes
the unaudited profit for the financial year from regulatory
submissions.
For the purposes of calculating the amount of subordinated
debt which may be included in capital resources, the
principal amount must be amortised on a straight line basis
during the final five years to maturity, for further details
please see Note 30 'Subordinated loans'.
For the year ended 31 December 2011 2010
Notes £ mil £ mil
Tier 1
Share capital 31 £ 614 £ 614
Share premium 31 352 352
Retained earnings 1,212 1,471
Valuation adjustments to retained earnings (45) (75)
Profit after tax 123 161
Goodwill and intangible assets 22 (13) (13)
Total Tier 1 £ 2,243 £ 2,510
Tier 2
Collective impairment allowance £ 63 £ 82
Qualifying subordinated loans 30 220 242
Total tier 2 £ 283 £ 324
Total tier 3 £ - £ -
Deductions
Investment in a jointly controlled entity £ (46) £ (45)
Total deductions £ (46) £ (45)
Total regulatory capital £ 2,480 £ 2,789
Capital ratios
Tier 1 ratio (%) 21.1% 21.2%
Total capital ratio (%) 23.4% 23.6%
Group
Financial Statements
92 FCE Bank plc – ANNUAL REPORT AND ACCOUNTS – 2011
Notes to the consolidated financial statements for the year ended 31 December 2011
33 COMPONENTS OF CAPITAL continued
Tier 1 capital has decreased in 2011 to £2,243 million (2010:
£2,510 million) primarily resulting from the payment of a
dividend of £370m (2010: £390 million), partially offset by the
inclusion of profit after tax, net of foreign currency translation
differences, as detailed in the 'Consolidated statements of
changes in equity'.
Tier 2 capital has also decreased in 2011 to £283 million
(2010: £324 million) resulting from the repayment of £65
million of subordinated loans with a Tier 2 value of £20
million, and also lower collective impairment allowances in
2011 of £63 million (2010: £82 million).
FCE is holding more capital than is required by either the
regulatory minimum or FCE's internal risk-based capital
policy. FCE’s policy is to manage its capital base to targeted
levels that meet all regulatory requirements and support
anticipated changes in assets and foreign currency exchange
rates. For further details refer to 'Capital and Funding'
section which commences on page 16.
FCE Bank Polska S.A. is a regulated bank and is also
subject to regulatory capital requirements requiring
maintenance of certain minimum capital levels. During the
two years being reported, the individual entities within FCE
complied with all of the externally imposed capital
requirements to which they are subject to.
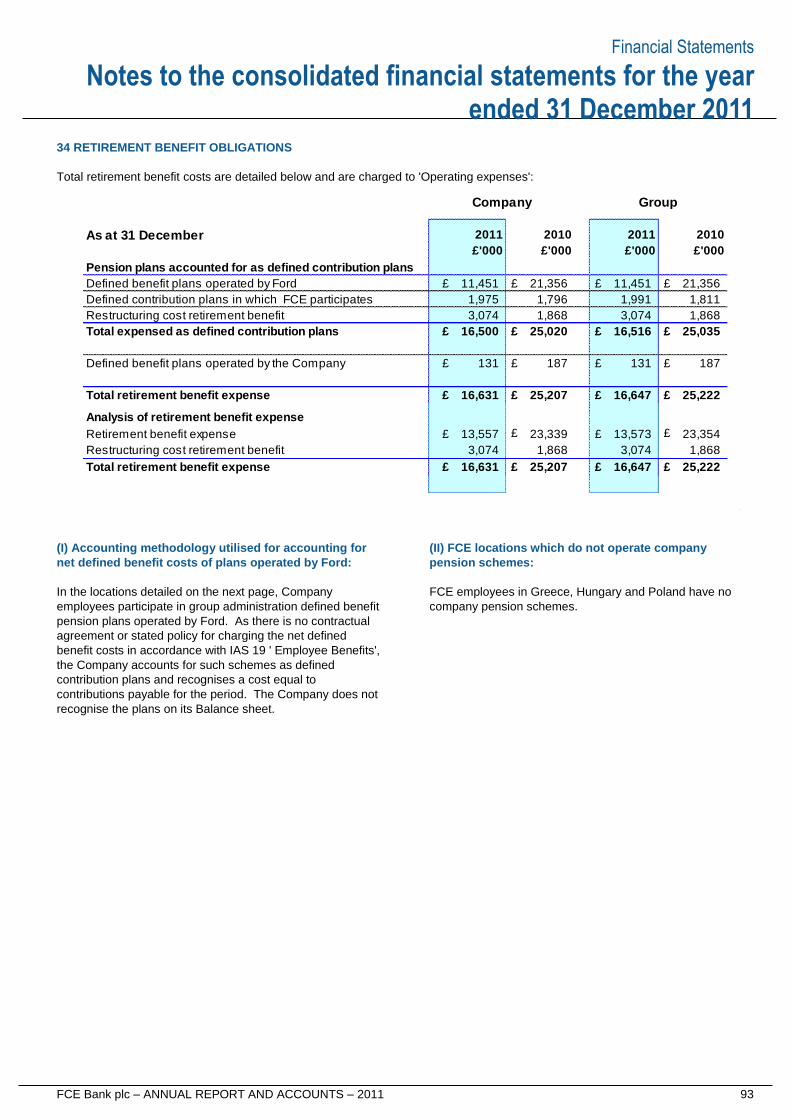
Financial Statements
FCE Bank plc – ANNUAL REPORT AND ACCOUNTS – 2011 93
Notes to the consolidated financial statements for the year ended 31 December 2011
34 RETIREMENT BENEFIT OBLIGATIONS
Total retirement benefit costs are detailed below and are charged to 'Operating expenses':
(I) Accounting methodology utilised for accounting for
net defined benefit costs of plans operated by Ford:
In the locations detailed on the next page, Company
employees participate in group administration defined benefit
pension plans operated by Ford. As there is no contractual
agreement or stated policy for charging the net defined
benefit costs in accordance with IAS 19 ' Employee Benefits',
the Company accounts for such schemes as defined
contribution plans and recognises a cost equal to
contributions payable for the period. The Company does not
recognise the plans on its Balance sheet.
(II) FCE locations which do not operate company
pension schemes:
FCE employees in Greece, Hungary and Poland have no
company pension schemes.
As at 31 December
Pension plans accounted for as defined contribution plans
Defined benefit plans operated by Ford £ 11,451 £ 21,356 £ 11,451 £ 21,356
Defined contribution plans in which FCE participates 1,975 1,796 1,991 1,811
Restructuring cost retirement benefit 3,074 1,868 3,074 1,868
Total expensed as defined contribution plans £ 16,500 £ 25,020 £ 16,516 £ 25,035
Defined benefit plans operated by the Company £ 131 £ 187 £ 131 £ 187
Total retirement benefit expense £ 16,631 £ 25,207 £ 16,647 £ 25,222
Analysis of retirement benefit expense
Retirement benefit expense £ 13,557 £ 23,339 £ 13,573 £ 23,354
Restructuring cost retirement benefit 3,074 1,868 3,074 1,868
Total retirement benefit expense £ 16,631 £ 25,207 £ 16,647 £ 25,222
£'000
Company Group
£'000
2011
£'000
2011
£'000
2010 2010
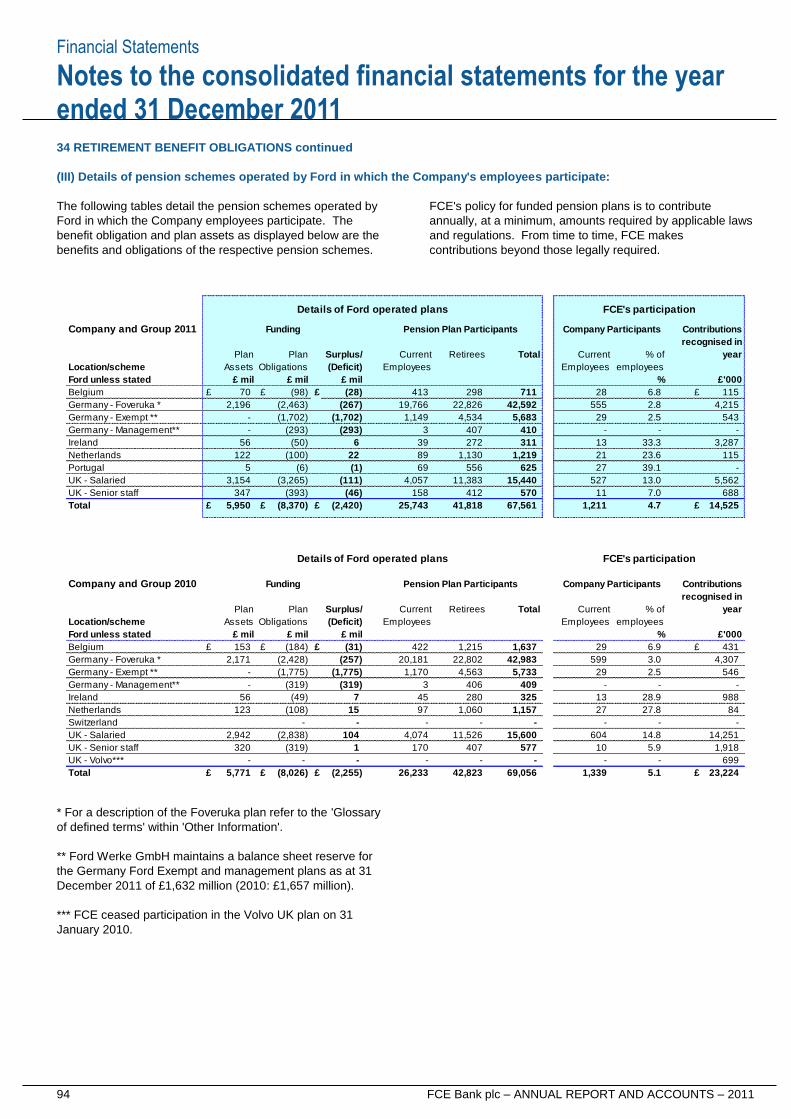
Financial Statements
94 FCE Bank plc – ANNUAL REPORT AND ACCOUNTS – 2011
Notes to the consolidated financial statements for the year ended 31 December 2011
34 RETIREMENT BENEFIT OBLIGATIONS continued
(III) Details of pension schemes operated by Ford in which the Company's employees participate:
The following tables detail the pension schemes operated by
Ford in which the Company employees participate. The
benefit obligation and plan assets as displayed below are the
benefits and obligations of the respective pension schemes.
FCE's policy for funded pension plans is to contribute
annually, at a minimum, amounts required by applicable laws
and regulations. From time to time, FCE makes
contributions beyond those legally required.
* For a description of the Foveruka plan refer to the 'Glossary
of defined terms' within 'Other Information'.
** Ford Werke GmbH maintains a balance sheet reserve for
the Germany Ford Exempt and management plans as at 31
December 2011 of £1,632 million (2010: £1,657 million).
*** FCE ceased participation in the Volvo UK plan on 31
January 2010.
Company and Group 2011
Location/scheme
Ford unless stated
Belgium £ 70 £ (98) £ (28) 413 298 711 28 6.8 £ 115
Germany - Foveruka * 2,196 (2,463) (267) 19,766 22,826 42,592 555 2.8 4,215
Germany - Exempt ** - (1,702) (1,702) 1,149 4,534 5,683 29 2.5 543
Germany - Management** - (293) (293) 3 407 410 - - -
Ireland 56 (50) 6 39 272 311 13 33.3 3,287
Netherlands 122 (100) 22 89 1,130 1,219 21 23.6 115
Portugal 5 (6) (1) 69 556 625 27 39.1 -
UK - Salaried 3,154 (3,265) (111) 4,057 11,383 15,440 527 13.0 5,562
UK - Senior staff 347 (393) (46) 158 412 570 11 7.0 688
Total £ 5,950 £ (8,370) £ (2,420) 25,743 41,818 67,561 1,211 4.7 £ 14,525
Company and Group 2010
Location/scheme
Ford unless stated
Belgium £ 153 £ (184) £ (31) 422 1,215 1,637 29 6.9 £ 431
Germany - Foveruka * 2,171 (2,428) (257) 20,181 22,802 42,983 599 3.0 4,307
Germany - Exempt ** - (1,775) (1,775) 1,170 4,563 5,733 29 2.5 546
Germany - Management** - (319) (319) 3 406 409 - - -
Ireland 56 (49) 7 45 280 325 13 28.9 988
Netherlands 123 (108) 15 97 1,060 1,157 27 27.8 84
Switzerland - - - - - - - -
UK - Salaried 2,942 (2,838) 104 4,074 11,526 15,600 604 14.8 14,251
UK - Senior staff 320 (319) 1 170 407 577 10 5.9 1,918
UK - Volvo*** - - - - - - - - 699
Total £ 5,771 £ (8,026) £ (2,255) 26,233 42,823 69,056 1,339 5.1 £ 23,224
Details of Ford operated plans FCE's participation
Funding Pension Plan Participants
TotalPlan Plan Surplus/ Current Retirees
% of Current
recognised in
year
Contributions
Employees employees
Current
Company Participants
recognised in
year% of
FCE's participation
Company Participants Contributions
Employees
£ mil £'000%
(Deficit)
TotalCurrent Retirees
Details of Ford operated plans
Plan Surplus/
Pension Plan Participants
Obligations
Plan
£ mil £ mil
Assets
Funding
Assets Employees(Deficit) employeesEmployeesObligations
% £'000£ mil £ mil £ mil
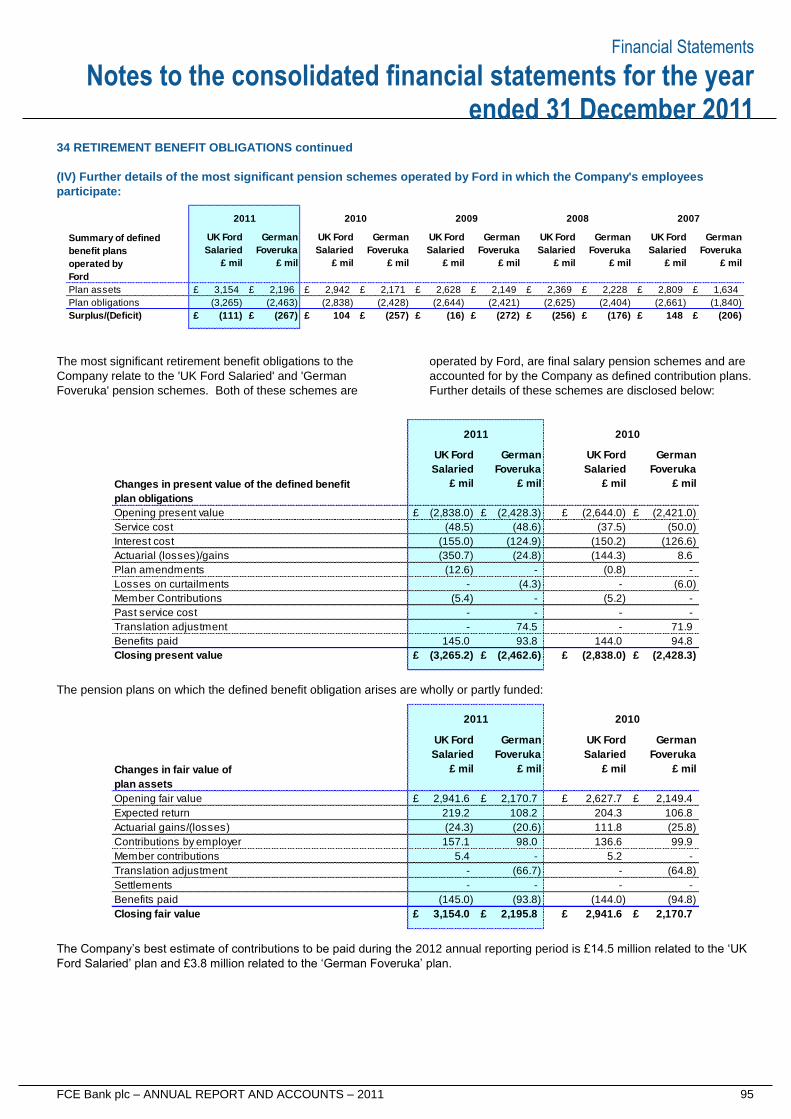
Financial Statements
FCE Bank plc – ANNUAL REPORT AND ACCOUNTS – 2011 95
Notes to the consolidated financial statements for the year ended 31 December 2011
34 RETIREMENT BENEFIT OBLIGATIONS continued
(IV) Further details of the most significant pension schemes operated by Ford in which the Company's employees
participate:
The most significant retirement benefit obligations to the
Company relate to the 'UK Ford Salaried' and 'German
Foveruka' pension schemes. Both of these schemes are
operated by Ford, are final salary pension schemes and are
accounted for by the Company as defined contribution plans.
Further details of these schemes are disclosed below:
The pension plans on which the defined benefit obligation arises are wholly or partly funded:
The Company’s best estimate of contributions to be paid during the 2012 annual reporting period is £14.5 million related to the ‘UK
Ford Salaried’ plan and £3.8 million related to the ‘German Foveruka’ plan.
Summary of defined
benefit plans
operated by
Ford
Plan assets £ 3,154 £ 2,196 £ 2,942 £ 2,171 £ 2,628 £ 2,149 £ 2,369 £ 2,228 £ 2,809 £ 1,634
Plan obligations (3,265) (2,463) (2,838) (2,428) (2,644) (2,421) (2,625) (2,404) (2,661) (1,840)
Surplus/(Deficit) £ (111) £ (267) £ 104 £ (257) £ (16) £ (272) £ (256) £ (176) £ 148 £ (206)
200720082009
£ mil£ mil £ mil £ mil
Foveruka Foveruka
UK Ford
Foveruka
£ mil£ mil
Salaried
UK Ford GermanGermanUK Ford German
£ mil £ mil
SalariedSalaried
£ mil £ mil
2011
UK Ford German
Salaried Foveruka
2010
UK Ford German
Salaried Foveruka
Changes in present value of the defined benefit
plan obligations
Opening present value £ (2,838.0) £ (2,428.3) £ (2,644.0) £ (2,421.0)
Service cost (48.5) (48.6) (37.5) (50.0)
Interest cost (155.0) (124.9) (150.2) (126.6)
Actuarial (losses)/gains (350.7) (24.8) (144.3) 8.6
Plan amendments (12.6) - (0.8) -
Losses on curtailments - (4.3) - (6.0)
Member Contributions (5.4) - (5.2) -
Past service cost - - - -
Translation adjustment - 74.5 - 71.9
Benefits paid 145.0 93.8 144.0 94.8
Closing present value £ (3,265.2) £ (2,462.6) £ (2,838.0) £ (2,428.3)
2011 2010
£ mil
UK Ford
£ mil
UK Ford
£ mil
German German
Salaried Foveruka Salaried Foveruka
£ mil
Changes in fair value of
plan assets
Opening fair value £ 2,941.6 £ 2,170.7 £ 2,627.7 £ 2,149.4
Expected return 219.2 108.2 204.3 106.8
Actuarial gains/(losses) (24.3) (20.6) 111.8 (25.8)
Contributions by employer 157.1 98.0 136.6 99.9
Member contributions 5.4 - 5.2 -
Translation adjustment - (66.7) - (64.8)
Settlements - - - -
Benefits paid (145.0) (93.8) (144.0) (94.8)
Closing fair value £ 3,154.0 £ 2,195.8 £ 2,941.6 £ 2,170.7
Salaried Foveruka Salaried
£ mil£ mil £ mil
Foveruka
£ mil
German German
2011 2010
UK Ford UK Ford
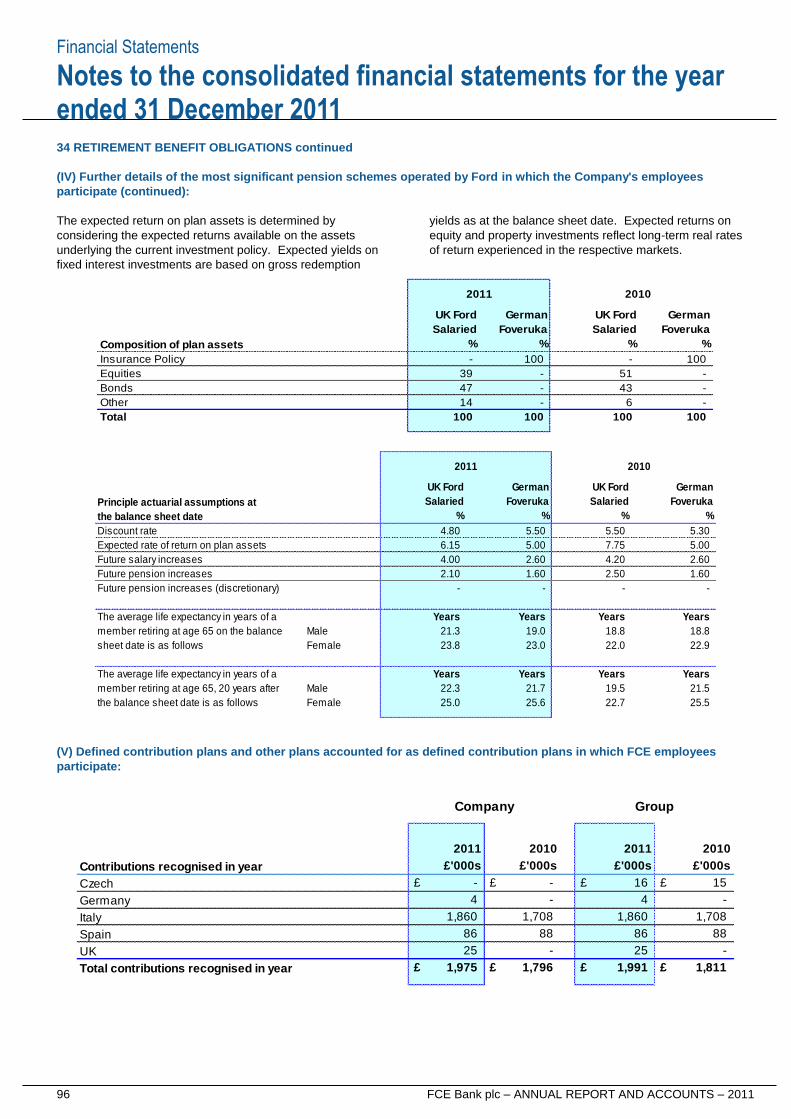
Financial Statements
96 FCE Bank plc – ANNUAL REPORT AND ACCOUNTS – 2011
Notes to the consolidated financial statements for the year ended 31 December 2011
34 RETIREMENT BENEFIT OBLIGATIONS continued
(IV) Further details of the most significant pension schemes operated by Ford in which the Company's employees
participate (continued):
The expected return on plan assets is determined by
considering the expected returns available on the assets
underlying the current investment policy. Expected yields on
fixed interest investments are based on gross redemption
yields as at the balance sheet date. Expected returns on
equity and property investments reflect long-term real rates
of return experienced in the respective markets.
(V) Defined contribution plans and other plans accounted for as defined contribution plans in which FCE employees
participate:
Composition of plan assets
Insurance Policy - 100 - 100
Equities 39 - 51 -
Bonds 47 - 43 -
Other 14 - 6 -
Total 100 100 100 100
%
2011 2010
%
German
Salaried Foveruka Salaried Foveruka
German
%
UK Ford UK Ford
%
Principle actuarial assumptions at
the balance sheet date
Discount rate 4.80 5.50 5.50 5.30
Expected rate of return on plan assets 6.15 5.00 7.75 5.00
Future salary increases 4.00 2.60 4.20 2.60
Future pension increases 2.10 1.60 2.50 1.60
Future pension increases (discretionary) - - - -
The average life expectancy in years of a Years Years Years Years
member retiring at age 65 on the balance Male 21.3 19.0 18.8 18.8
sheet date is as follows Female 23.8 23.0 22.0 22.9
The average life expectancy in years of a Years Years Years Years
member retiring at age 65, 20 years after Male 22.3 21.7 19.5 21.5
the balance sheet date is as follows Female 25.0 25.6 22.7 25.5
2011 2010
UK Ford German UK Ford German
Salaried Foveruka Salaried Foveruka
% % % %
Contributions recognised in year
Czech £ - £ - £ 16 £ 15
Germany 4 - 4 -
Italy 1,860 1,708 1,860 1,708
Spain 86 88 86 88
UK 25 - 25 -
Total contributions recognised in year £ 1,975 £ 1,796 £ 1,991 £ 1,811
Company Group
2011 2010 2011 2010
£'000s £'000s £'000s £'000s
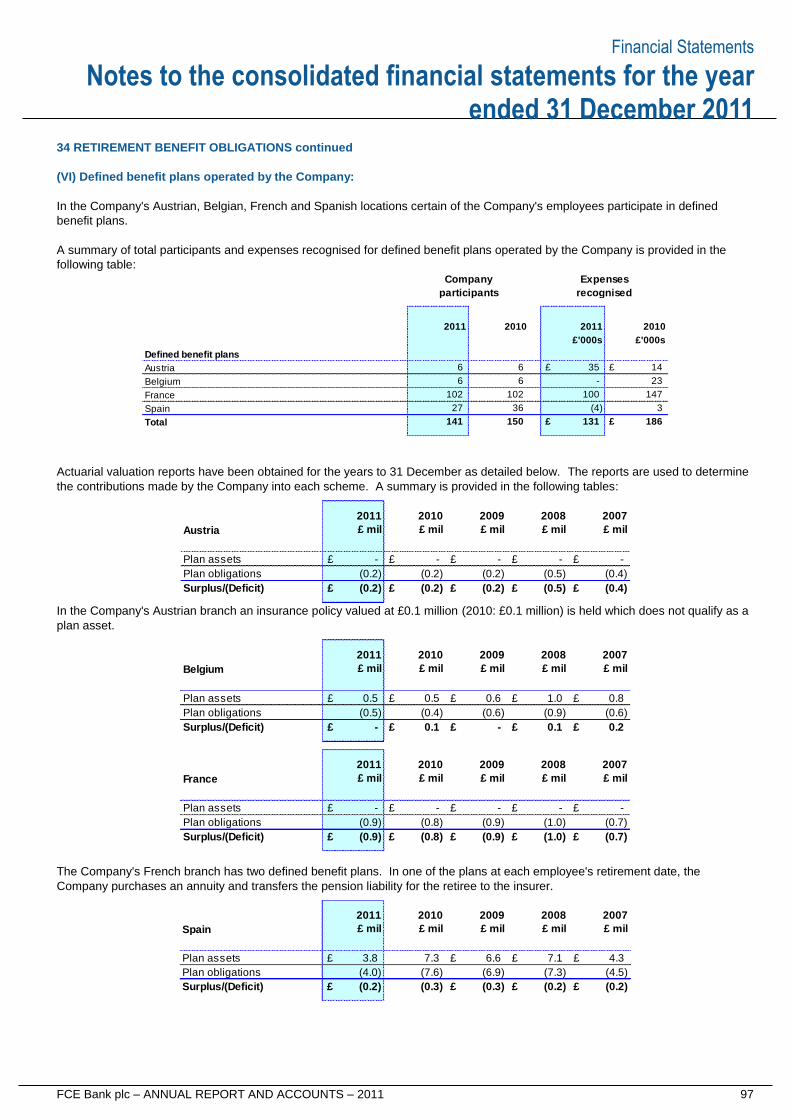
Financial Statements
FCE Bank plc – ANNUAL REPORT AND ACCOUNTS – 2011 97
Notes to the consolidated financial statements for the year ended 31 December 2011
34 RETIREMENT BENEFIT OBLIGATIONS continued
(VI) Defined benefit plans operated by the Company:
In the Company's Austrian, Belgian, French and Spanish locations certain of the Company's employees participate in defined
benefit plans.
A summary of total participants and expenses recognised for defined benefit plans operated by the Company is provided in the
following table:
Actuarial valuation reports have been obtained for the years to 31 December as detailed below. The reports are used to determine
the contributions made by the Company into each scheme. A summary is provided in the following tables:
In the Company's Austrian branch an insurance policy valued at £0.1 million (2010: £0.1 million) is held which does not qualify as a
plan asset.
The Company's French branch has two defined benefit plans. In one of the plans at each employee's retirement date, the
Company purchases an annuity and transfers the pension liability for the retiree to the insurer.
Defined benefit plans
Austria 6 6 £ 35 £ 14
Belgium 6 6 - 23
France 102 102 100 147
Spain 27 36 (4) 3
Total 141 150 £ 131 £ 186
£'000s £'000s
2011 2010 2011 2010
participants recognised
Company Expenses
Austria
Plan assets £ - £ - £ - £ - £ -
Plan obligations (0.2) (0.2) (0.2) (0.5) (0.4)
Surplus/(Deficit) £ (0.2) £ (0.2) £ (0.2) £ (0.5) £ (0.4)
2007
£ mil£ mil £ mil
2011 2010 2009 2008
£ mil £ mil
Belgium
Plan assets £ 0.5 £ 0.5 £ 0.6 £ 1.0 £ 0.8
Plan obligations (0.5) (0.4) (0.6) (0.9) (0.6)
Surplus/(Deficit) £ - £ 0.1 £ - £ 0.1 £ 0.2
2007
£ mil £ mil £ mil £ mil £ mil
2011 2010 2009 2008
France
Plan assets £ - £ - £ - £ - £ -
Plan obligations (0.9) (0.8) (0.9) (1.0) (0.7)
Surplus/(Deficit) £ (0.9) £ (0.8) £ (0.9) £ (1.0) £ (0.7)
2007
£ mil £ mil £ mil £ mil £ mil
2011 2010 2009 2008
Spain
Plan assets £ 3.8 7.3 £ 6.6 £ 7.1 £ 4.3
Plan obligations (4.0) (7.6) (6.9) (7.3) (4.5)
Surplus/(Deficit) £ (0.2) (0.3) £ (0.3) £ (0.2) £ (0.2)
2007
£ mil £ mil £ mil £ mil £ mil
2011 2010 2009 2008
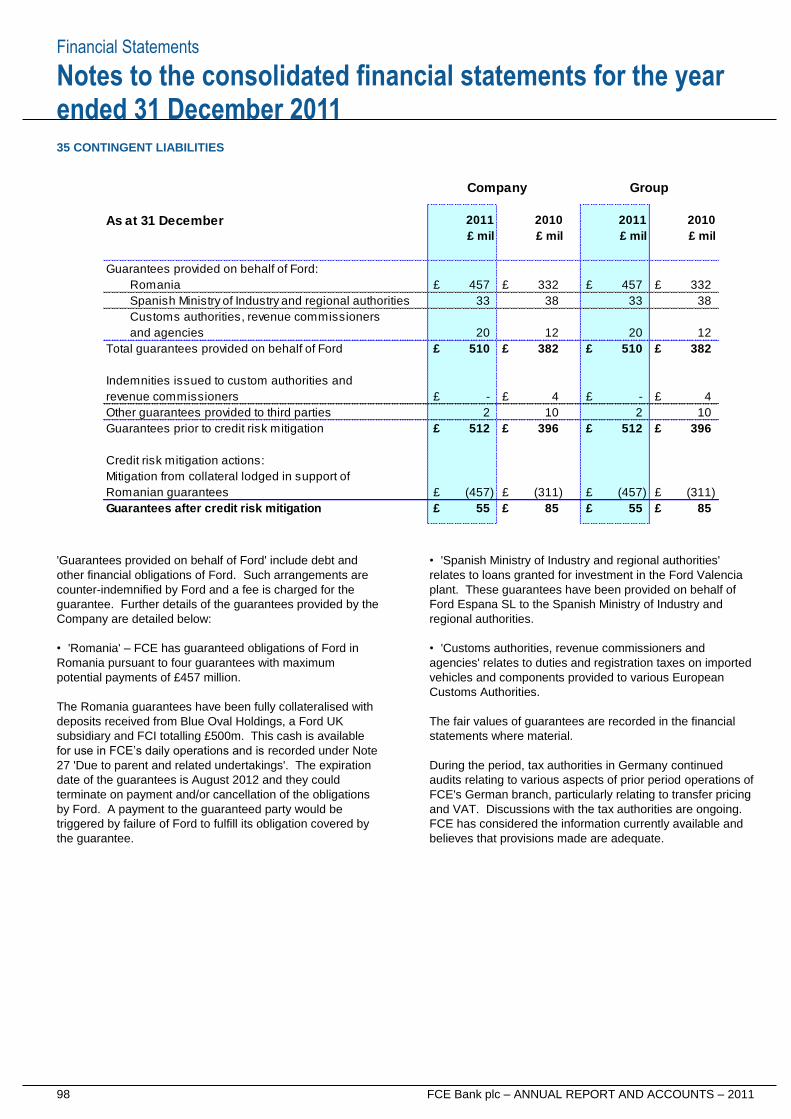
Financial Statements
98 FCE Bank plc – ANNUAL REPORT AND ACCOUNTS – 2011
Notes to the consolidated financial statements for the year ended 31 December 2011
35 CONTINGENT LIABILITIES
'Guarantees provided on behalf of Ford' include debt and
other financial obligations of Ford. Such arrangements are
counter-indemnified by Ford and a fee is charged for the
guarantee. Further details of the guarantees provided by the
Company are detailed below:
• 'Romania' – FCE has guaranteed obligations of Ford in
Romania pursuant to four guarantees with maximum
potential payments of £457 million.
The Romania guarantees have been fully collateralised with
deposits received from Blue Oval Holdings, a Ford UK
subsidiary and FCI totalling £500m. This cash is available
for use in FCE’s daily operations and is recorded under Note
27 'Due to parent and related undertakings'. The expiration
date of the guarantees is August 2012 and they could
terminate on payment and/or cancellation of the obligations
by Ford. A payment to the guaranteed party would be
triggered by failure of Ford to fulfill its obligation covered by
the guarantee.
• 'Spanish Ministry of Industry and regional authorities'
relates to loans granted for investment in the Ford Valencia
plant. These guarantees have been provided on behalf of
Ford Espana SL to the Spanish Ministry of Industry and
regional authorities.
• 'Customs authorities, revenue commissioners and
agencies' relates to duties and registration taxes on imported
vehicles and components provided to various European
Customs Authorities.
The fair values of guarantees are recorded in the financial
statements where material.
During the period, tax authorities in Germany continued
audits relating to various aspects of prior period operations of
FCE's German branch, particularly relating to transfer pricing
and VAT. Discussions with the tax authorities are ongoing.
FCE has considered the information currently available and
believes that provisions made are adequate.
As at 31 December
Guarantees provided on behalf of Ford:
Romania £ 457 £ 332 £ 457 £ 332
Spanish Ministry of Industry and regional authorities 33 38 33 38
Customs authorities, revenue commissioners
and agencies 20 12 20 12
Total guarantees provided on behalf of Ford £ 510 £ 382 £ 510 £ 382
Indemnities issued to custom authorities and
revenue commissioners £ - £ 4 £ - £ 4
Other guarantees provided to third parties 2 10 2 10
Guarantees prior to credit risk mitigation £ 512 £ 396 £ 512 £ 396
Credit risk mitigation actions:
Mitigation from collateral lodged in support of
Romanian guarantees £ (457) £ (311) £ (457) £ (311)
Guarantees after credit risk mitigation £ 55 £ 85 £ 55 £ 85
£ mil
Company Group
£ mil
2011
£ mil
2011
£ mil
2010 2010
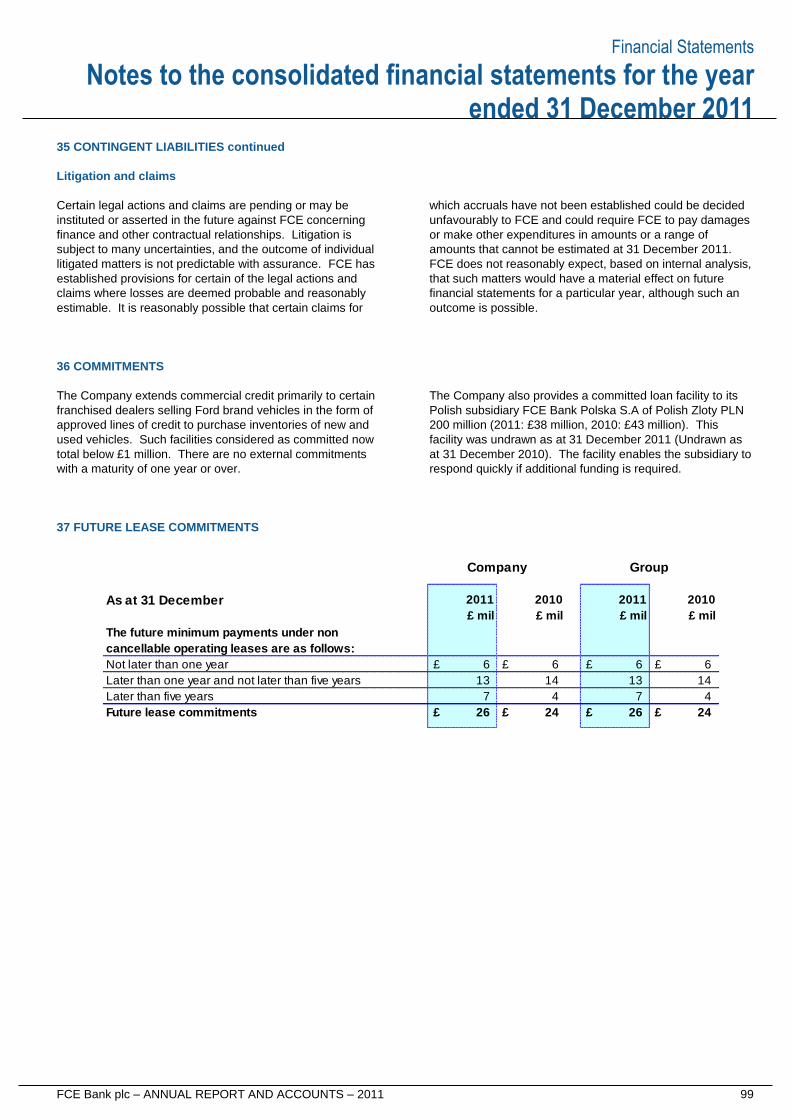
Financial Statements
FCE Bank plc – ANNUAL REPORT AND ACCOUNTS – 2011 99
Notes to the consolidated financial statements for the year ended 31 December 2011
35 CONTINGENT LIABILITIES continued
Litigation and claims
Certain legal actions and claims are pending or may be
instituted or asserted in the future against FCE concerning
finance and other contractual relationships. Litigation is
subject to many uncertainties, and the outcome of individual
litigated matters is not predictable with assurance. FCE has
established provisions for certain of the legal actions and
claims where losses are deemed probable and reasonably
estimable. It is reasonably possible that certain claims for
which accruals have not been established could be decided
unfavourably to FCE and could require FCE to pay damages
or make other expenditures in amounts or a range of
amounts that cannot be estimated at 31 December 2011.
FCE does not reasonably expect, based on internal analysis,
that such matters would have a material effect on future
financial statements for a particular year, although such an
outcome is possible.
36 COMMITMENTS
The Company extends commercial credit primarily to certain
franchised dealers selling Ford brand vehicles in the form of
approved lines of credit to purchase inventories of new and
used vehicles. Such facilities considered as committed now
total below £1 million. There are no external commitments
with a maturity of one year or over.
The Company also provides a committed loan facility to its
Polish subsidiary FCE Bank Polska S.A of Polish Zloty PLN
200 million (2011: £38 million, 2010: £43 million). This
facility was undrawn as at 31 December 2011 (Undrawn as
at 31 December 2010). The facility enables the subsidiary to
respond quickly if additional funding is required.
37 FUTURE LEASE COMMITMENTS
As at 31 December
The future minimum payments under non
cancellable operating leases are as follows:
Not later than one year £ 6 £ 6 £ 6 £ 6
Later than one year and not later than five years 13 14 13 14
Later than five years 7 4 7 4
Future lease commitments £ 26 £ 24 £ 26 £ 24
£ mil
Company Group
£ mil
2011
£ mil
2011
£ mil
2010 2010
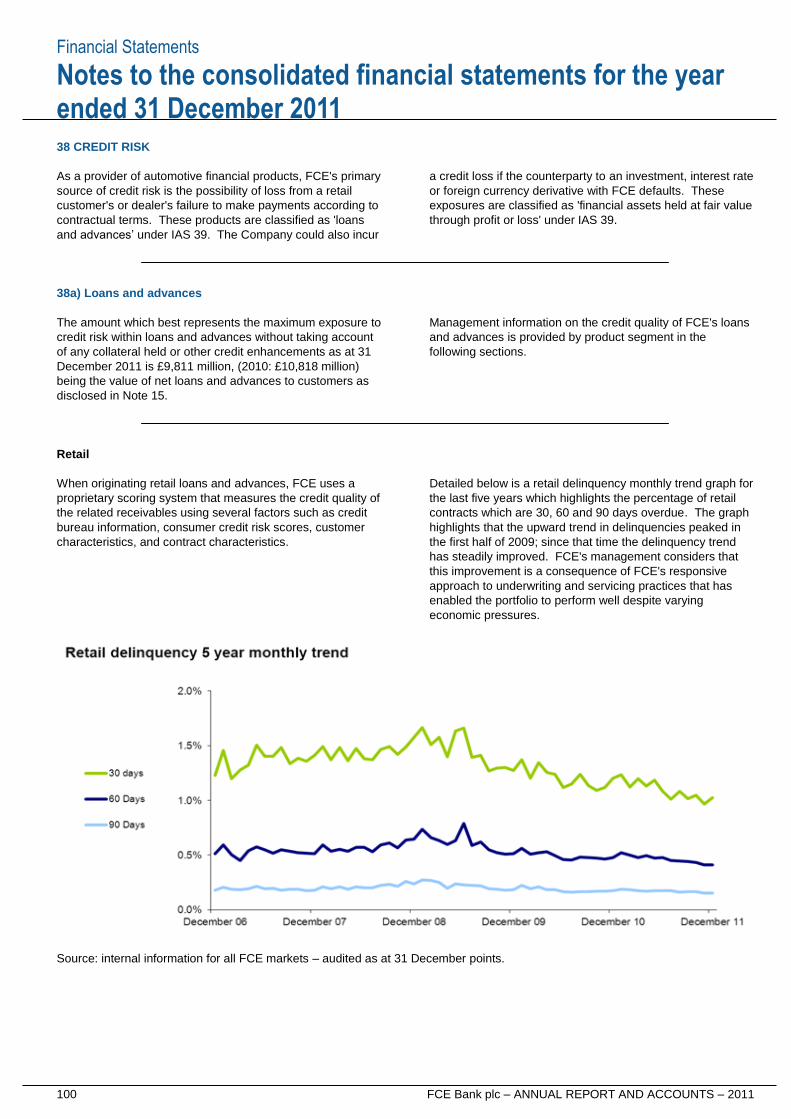
Financial Statements
100 FCE Bank plc – ANNUAL REPORT AND ACCOUNTS – 2011
Notes to the consolidated financial statements for the year ended 31 December 2011
38 CREDIT RISK
As a provider of automotive financial products, FCE's primary
source of credit risk is the possibility of loss from a retail
customer's or dealer's failure to make payments according to
contractual terms. These products are classified as 'loans
and advances’ under IAS 39. The Company could also incur
a credit loss if the counterparty to an investment, interest rate
or foreign currency derivative with FCE defaults. These
exposures are classified as 'financial assets held at fair value
through profit or loss' under IAS 39.
38a) Loans and advances
The amount which best represents the maximum exposure to
credit risk within loans and advances without taking account
of any collateral held or other credit enhancements as at 31
December 2011 is £9,811 million, (2010: £10,818 million)
being the value of net loans and advances to customers as
disclosed in Note 15.
Management information on the credit quality of FCE's loans
and advances is provided by product segment in the
following sections.
Retail
When originating retail loans and advances, FCE uses a
proprietary scoring system that measures the credit quality of
the related receivables using several factors such as credit
bureau information, consumer credit risk scores, customer
characteristics, and contract characteristics.
Detailed below is a retail delinquency monthly trend graph for
the last five years which highlights the percentage of retail
contracts which are 30, 60 and 90 days overdue. The graph
highlights that the upward trend in delinquencies peaked in
the first half of 2009; since that time the delinquency trend
has steadily improved. FCE's management considers that
this improvement is a consequence of FCE's responsive
approach to underwriting and servicing practices that has
enabled the portfolio to perform well despite varying
economic pressures.
Source: internal information for all FCE markets – audited as at 31 December points.
Financial Statements
FCE Bank plc – ANNUAL REPORT AND ACCOUNTS – 2011 101
Notes to the consolidated financial statements for the year ended 31 December 2011
38 CREDIT RISK continued
Wholesale
FCE uses proprietary models to assign each dealer a risk
rating. The Financial model considers financial information
including profitability, capital and liquidity at a point in time.
This is supplemented by the Judgmental model which
provides a structured framework within which additional
financial information along with other qualitative and non-
financial key factors are assessed. These other factors, that
are considered significant in predicting a dealer's ability to
meet its current and future obligations, include such
elements as financial trends, management quality, vehicle
inventory audit and payment experience. The models are
subject to review to confirm the continued business
significance and statistical predictability of the factors and
updated to incorporate new factors or other information that
improves their statistical predictability.
In addition, FCE verifies the existence of the assets
collateralising the receivables by physical and approved non-
physical audits of vehicle inventories, which are performed
with increased frequency for higher risk (i.e., Group III and
Group IV) dealers. Credit reviews are performed on each
dealer at least annually and the dealer’s risk rating adjusted if
necessary.
The table below provides a high-level summary of dealer risk
ratings. Financial and judgmental internal risk evaluation
ratings are assigned to each dealer from 0 (best) to 9 (worst).
The Financial risk evaluation ratings are based upon the
latest published annual audited accounts information which
typically are received by FCE locations between 8 and 10
months following the end of the dealer financial year. As a
consequence, the ratings reported above for 2011 are mainly
based on 2010 audited accounting data.
As a result, FCE's management believes that the ratings
reported for 2011 above reflect the decrease in 2010 vehicle
sales and overall Ford market share. This is primarily due to
the end of the favourable effect of scrappage programmes on
smaller car sales, the decision by Ford to selectively reduce
participation in low-margin business, and an increase in
competitive discounts in a post-scrappage scheme market.
The percentages indicate that the proportion of Group I
category dealers has decreased during 2011, primarily within
Spain, Germany and Italy reflecting dealer operating results
in 2010 that management consider marginally worsened.
The Group II category has evidenced an increase during
2011 and this increase accounts primarily for the decrease
seen within Group I. Group III and Group IV categories have
remained stable.
The overall marginal deterioration seen for 2011 followed the
improvement seen during 2010 which management believes
primarily reflected the impact of the Government car
scrappage programmes operated during 2009.
It is FCE's policy that wholesale amounts past due are either
resolved to FCE's satisfaction in accordance with established
policies and procedures or the loan is classified as impaired.
For the year ended 31 December 2011 2010
Note £ mil £ mil
Group I (risk rating 0-3) £ 2,652 £ 2,869
Group II (risk rating 4-5) 1,163 1,043
Group III (risk rating 6-7) 783 855
Group IV (risk rating 8-9) 2 1
Total gross wholesale and other loans and advances 15 £ 4,600 £ 4,768
Percentage analysis
Group I (risk rating 0-3) 57.66% 60.17%
Group II (risk rating 4-5) 25.28% 21.88%
Group III (risk rating 6-7) 17.02% 17.93%
Group IV (risk rating 8-9) 0.04% 0.02%
Group
Financial Statements
102 FCE Bank plc – ANNUAL REPORT AND ACCOUNTS – 2011
Notes to the consolidated financial statements for the year ended 31 December 2011
38 CREDIT RISK continued
Impairment
A provision for impairment losses is made against loans and
advances from cover bad and doubtful debts which have
been incurred and not separately identified, but which are
known from experience to be present in portfolios of loans
and advances. The provision is determined based on a
number of factors including historical loss trends, the credit
quality of the present portfolio and general economic factors.
Retail financing contracts are individually impaired as soon
as it is apparent and reasonable to conclude that a credit
loss will arise and at no later than 120 days past due.
Following the impairment of a retail financing contract the
carrying value of the loan is reduced to reflect the average
vehicle recovery value.
Following the impairment of a wholesale contract the carrying
value of the loan is reduced to reflect the estimated
collectible amount including the effect of partial or full
guarantees or other forms of security (including physical
stock).
The value of loans and advances considered to be impaired
at the reporting date is £36 million. The interest income on
impaired financial receivables is under £1 million.
Collateral
The majority of FCE's retail, leasing and wholesale financing
plans have the benefit of a title retention plan or a similar
security interest in the financed vehicle. Over 90% of FCE’s
net loans and advances benefit from this security. In the
case of customer default the value of the re-possessed
collateral provides a source of protection.
Counterparty risk within loans and advances
FCE has an established wholesale counterparty limit policy
based on levels of exposure and risk ratings. Reports on the
largest concentrations are prepared monthly and are
regularly reviewed at the Credit Policy and Credit Risk
Committee as well as at each scheduled Board of Directors’
meeting.
FCE's ten largest counterparty exposures including both
amounts reported in loans and advances above and undrawn
commercial credit facilities (refer to Note 36 'Commitments'),
totalled £866 million (2010: £812 million). Deposits received
from FCI (Note 27 'Due to parent and related undertakings')
and other deposits (Note 26 'Corporate deposits') are utilised
to mitigate exposure concentrations.
Renegotiated loans
The value of renegotiated loans being previously past due or
impaired at 31 December 2011 was £1.2 million (2010: £0.3
million).
Financial Statements
FCE Bank plc – ANNUAL REPORT AND ACCOUNTS – 2011 103
Notes to the consolidated financial statements for the year ended 31 December 2011
38 CREDIT RISK continued
38b) Financial assets held at fair value through profit or loss
Cash and advances
Cash and advances, which are invested with a number of
highly rated counterparties, have increased to £2,767 million
(2010: £2,094 million) which best represents the maximum
exposure to credit risk in relation to cash and cash
equivalents. FCE's five largest counterparty exposures
included within Cash and advances total £1,687 million
(2010: £975 million) and have long‑term credit ratings of
single‑A or better. Included in this amount is £1,146 million
(2010: £323 million) held with central banks and in
government debt. Refer to Note 11 'Cash and advances' for
further details.
Marketable securities
The purchase of marketable securities exposes FCE to the
risk that a counterparty may default on repayment. When
purchased, such securities are invested with a number of
highly rated government counterparties. As at 31 December
2011, FCE has no investments in Marketable Securities
(2010: £223 million). Refer to Note 12 'Marketable securities'
for further details.
Derivative financial instruments
Use of derivatives exposes FCE to the risk that a
counterparty may default on a derivative contract. FCE
establishes exposure limits for each counterparty to minimise
this risk and provide counterparty diversification.
FCE transacts with certain Ford related parties, which are
non-rated entities. Substantially all of FCE's derivative
related activities are transacted with financial institutions that
have an investment grade rating.
The aggregate fair value of derivative instruments in asset
positions on 31 December, 2011 is £163 million, representing
the maximum potential loss at that date if all counterparties
failed to perform as contracted. Master agreements in place
with counterparties generally allow for netting of certain
exposures; therefore, the actual loss recognised if all
counterparties failed to perform as contracted would be
significantly lower. Refer to Note 13 'Derivative financial
instruments' for further details.
For details on the valuation of financial assets and liabilities at fair value, refer to Note 42 'Financial assets and financial liabilities'.
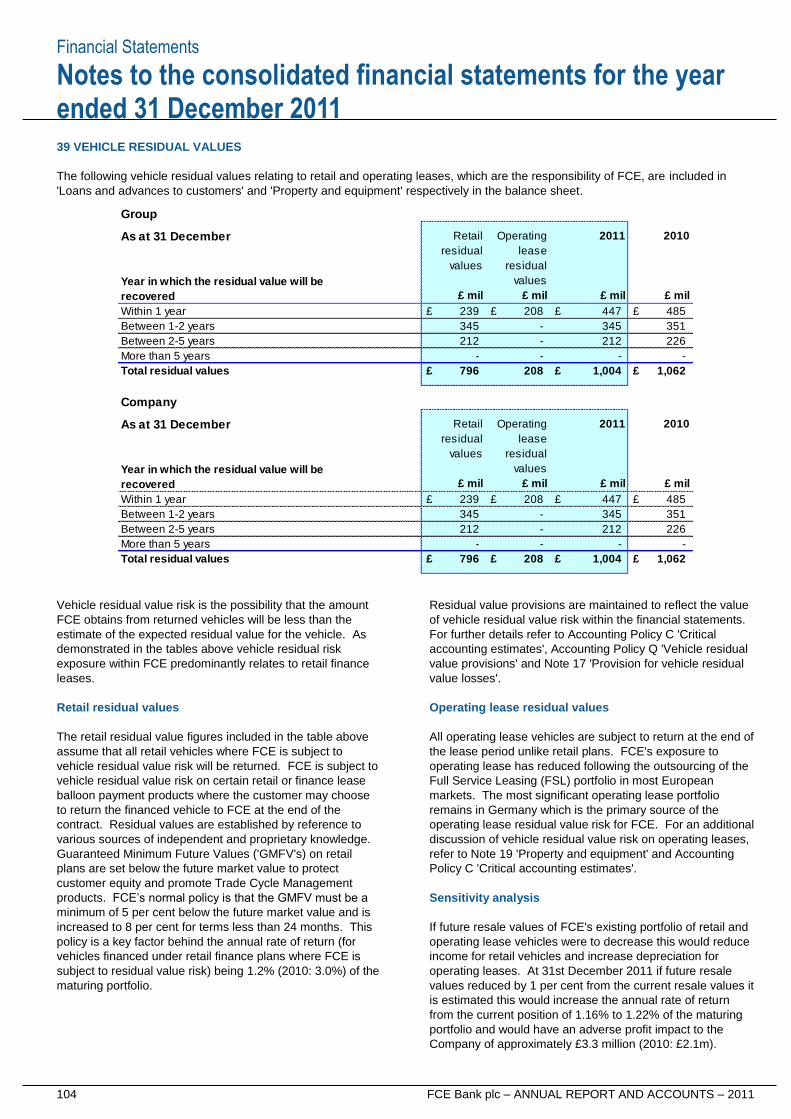
Financial Statements
104 FCE Bank plc – ANNUAL REPORT AND ACCOUNTS – 2011
Notes to the consolidated financial statements for the year ended 31 December 2011
39 VEHICLE RESIDUAL VALUES
The following vehicle residual values relating to retail and operating leases, which are the responsibility of FCE, are included in
'Loans and advances to customers' and 'Property and equipment' respectively in the balance sheet.
Vehicle residual value risk is the possibility that the amount
FCE obtains from returned vehicles will be less than the
estimate of the expected residual value for the vehicle. As
demonstrated in the tables above vehicle residual risk
exposure within FCE predominantly relates to retail finance
leases.
Residual value provisions are maintained to reflect the value
of vehicle residual value risk within the financial statements.
For further details refer to Accounting Policy C 'Critical
accounting estimates', Accounting Policy Q 'Vehicle residual
value provisions' and Note 17 'Provision for vehicle residual
value losses'.
Retail residual values
The retail residual value figures included in the table above
assume that all retail vehicles where FCE is subject to
vehicle residual value risk will be returned. FCE is subject to
vehicle residual value risk on certain retail or finance lease
balloon payment products where the customer may choose
to return the financed vehicle to FCE at the end of the
contract. Residual values are established by reference to
various sources of independent and proprietary knowledge.
Guaranteed Minimum Future Values ('GMFV's) on retail
plans are set below the future market value to protect
customer equity and promote Trade Cycle Management
products. FCE’s normal policy is that the GMFV must be a
minimum of 5 per cent below the future market value and is
increased to 8 per cent for terms less than 24 months. This
policy is a key factor behind the annual rate of return (for
vehicles financed under retail finance plans where FCE is
subject to residual value risk) being 1.2% (2010: 3.0%) of the
maturing portfolio.
Operating lease residual values
All operating lease vehicles are subject to return at the end of
the lease period unlike retail plans. FCE's exposure to
operating lease has reduced following the outsourcing of the
Full Service Leasing (FSL) portfolio in most European
markets. The most significant operating lease portfolio
remains in Germany which is the primary source of the
operating lease residual value risk for FCE. For an additional
discussion of vehicle residual value risk on operating leases,
refer to Note 19 'Property and equipment' and Accounting
Policy C 'Critical accounting estimates'.
Sensitivity analysis
If future resale values of FCE's existing portfolio of retail and
operating lease vehicles were to decrease this would reduce
income for retail vehicles and increase depreciation for
operating leases. At 31st December 2011 if future resale
values reduced by 1 per cent from the current resale values it
is estimated this would increase the annual rate of return
from the current position of 1.16% to 1.22% of the maturing
portfolio and would have an adverse profit impact to the
Company of approximately £3.3 million (2010: £2.1m).
Group
As at 31 December
Year in which the residual value will be
recovered
Within 1 year £ 239 £ 208 £ 447 £ 485
Between 1-2 years 345 - 345 351
Between 2-5 years 212 - 212 226
More than 5 years - - - -
Total residual values £ 796 208 £ 1,004 £ 1,062
Company
As at 31 December
Year in which the residual value will be
recovered
Within 1 year £ 239 £ 208 £ 447 £ 485
Between 1-2 years 345 - 345 351
Between 2-5 years 212 - 212 226
More than 5 years - - - -
Total residual values £ 796 £ 208 £ 1,004 £ 1,062
residual lease
values
2011
values residual
£ mil £ mil
Retail Operating 2011 2010
£ mil £ mil
values
£ mil £ mil
£ mil £ mil
residual
Retail
values
residual lease
2010Operating
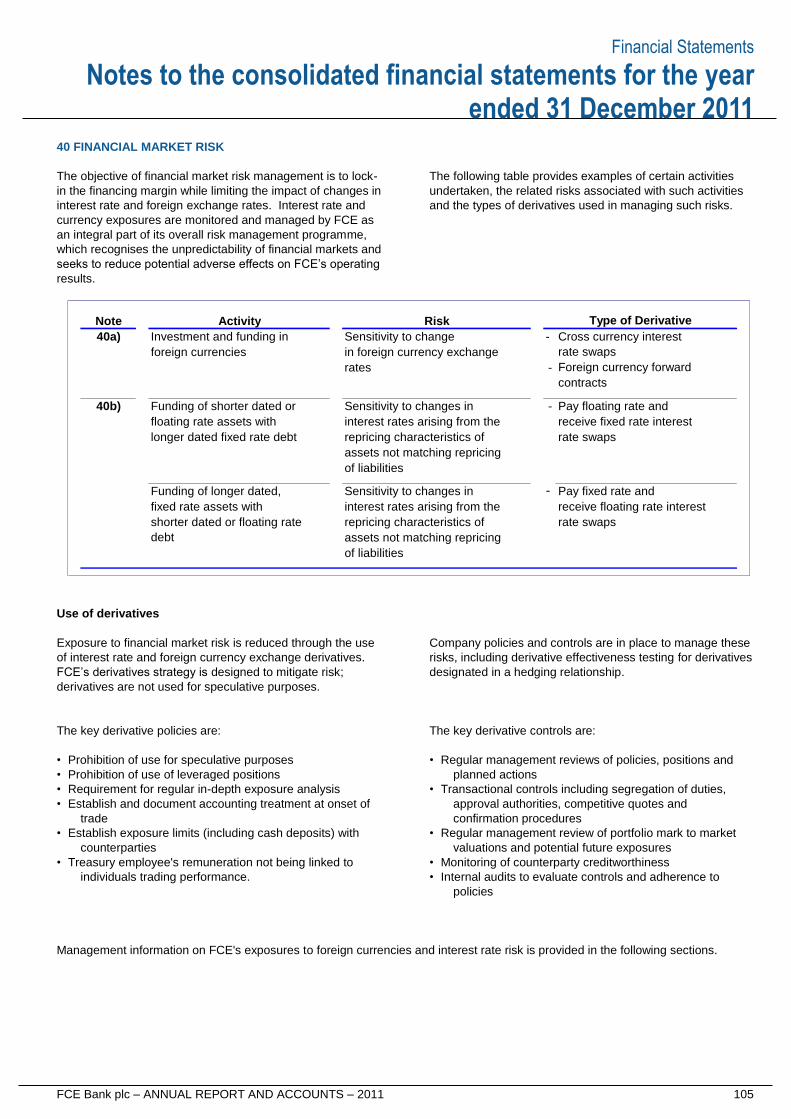
Financial Statements
FCE Bank plc – ANNUAL REPORT AND ACCOUNTS – 2011 105
Notes to the consolidated financial statements for the year ended 31 December 2011
40 FINANCIAL MARKET RISK
The objective of financial market risk management is to lock-
in the financing margin while limiting the impact of changes in
interest rate and foreign exchange rates. Interest rate and
currency exposures are monitored and managed by FCE as
an integral part of its overall risk management programme,
which recognises the unpredictability of financial markets and
seeks to reduce potential adverse effects on FCE’s operating
results.
The following table provides examples of certain activities
undertaken, the related risks associated with such activities
and the types of derivatives used in managing such risks.
Use of derivatives
Exposure to financial market risk is reduced through the use
of interest rate and foreign currency exchange derivatives.
FCE’s derivatives strategy is designed to mitigate risk;
derivatives are not used for speculative purposes.
Company policies and controls are in place to manage these
risks, including derivative effectiveness testing for derivatives
designated in a hedging relationship.
The key derivative policies are:
• Prohibition of use for speculative purposes
• Prohibition of use of leveraged positions
• Requirement for regular in-depth exposure analysis
• Establish and document accounting treatment at onset of
trade
• Establish exposure limits (including cash deposits) with
counterparties
• Treasury employee's remuneration not being linked to
individuals trading performance.
The key derivative controls are:
• Regular management reviews of policies, positions and
planned actions
• Transactional controls including segregation of duties,
approval authorities, competitive quotes and
confirmation procedures
• Regular management review of portfolio mark to market
valuations and potential future exposures
• Monitoring of counterparty creditworthiness
• Internal audits to evaluate controls and adherence to
policies
Management information on FCE's exposures to foreign currencies and interest rate risk is provided in the following sections.
Note Activity Risk
40a) Investment and funding in Sensitivity to change - Cross currency interest
foreign currencies in foreign currency exchange rate swaps
rates - Foreign currency forward
contracts
40b) Funding of shorter dated or Sensitivity to changes in - Pay floating rate and
floating rate assets with interest rates arising from the receive fixed rate interest
longer dated fixed rate debt repricing characteristics of rate swaps
assets not matching repricing
of liabilities
Funding of longer dated, Sensitivity to changes in - Pay fixed rate and
fixed rate assets with interest rates arising from the receive floating rate interest
shorter dated or floating rate repricing characteristics of rate swaps
debt assets not matching repricing
of liabilities
Type of Derivative
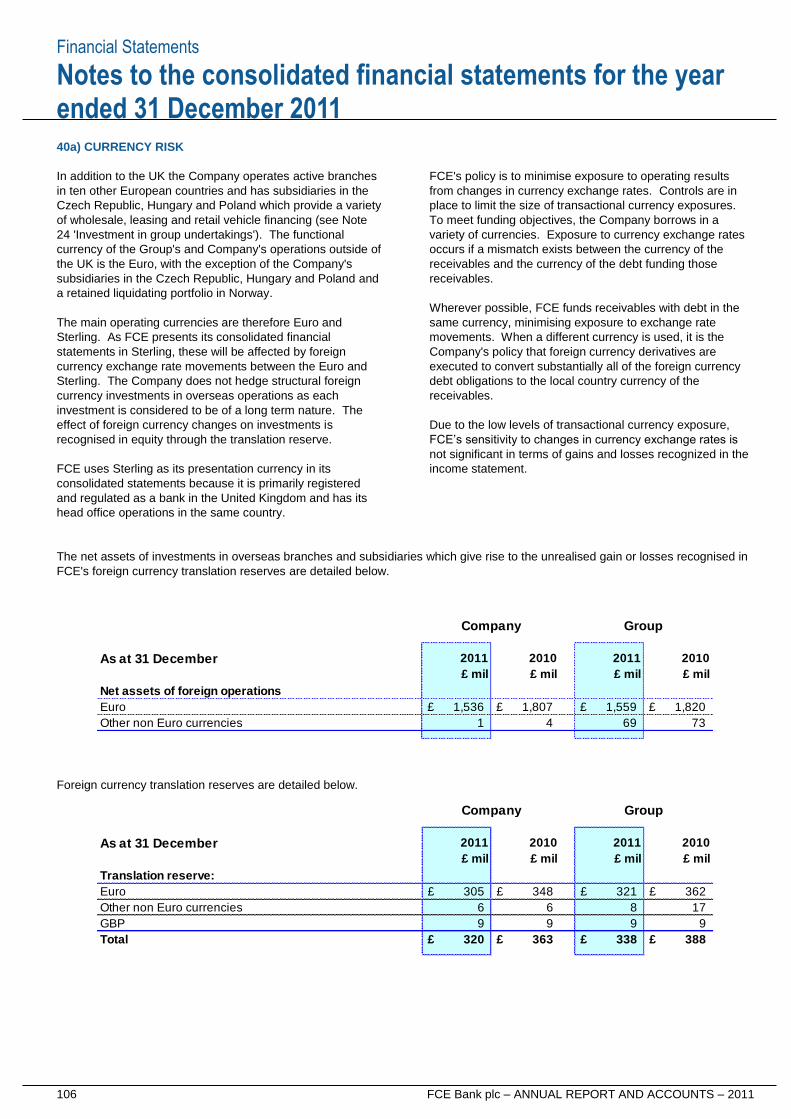
Financial Statements
106 FCE Bank plc – ANNUAL REPORT AND ACCOUNTS – 2011
Notes to the consolidated financial statements for the year ended 31 December 2011
40a) CURRENCY RISK
In addition to the UK the Company operates active branches
in ten other European countries and has subsidiaries in the
Czech Republic, Hungary and Poland which provide a variety
of wholesale, leasing and retail vehicle financing (see Note
24 'Investment in group undertakings'). The functional
currency of the Group's and Company's operations outside of
the UK is the Euro, with the exception of the Company's
subsidiaries in the Czech Republic, Hungary and Poland and
a retained liquidating portfolio in Norway.
The main operating currencies are therefore Euro and
Sterling. As FCE presents its consolidated financial
statements in Sterling, these will be affected by foreign
currency exchange rate movements between the Euro and
Sterling. The Company does not hedge structural foreign
currency investments in overseas operations as each
investment is considered to be of a long term nature. The
effect of foreign currency changes on investments is
recognised in equity through the translation reserve.
FCE uses Sterling as its presentation currency in its
consolidated statements because it is primarily registered
and regulated as a bank in the United Kingdom and has its
head office operations in the same country.
FCE's policy is to minimise exposure to operating results
from changes in currency exchange rates. Controls are in
place to limit the size of transactional currency exposures.
To meet funding objectives, the Company borrows in a
variety of currencies. Exposure to currency exchange rates
occurs if a mismatch exists between the currency of the
receivables and the currency of the debt funding those
receivables.
Wherever possible, FCE funds receivables with debt in the
same currency, minimising exposure to exchange rate
movements. When a different currency is used, it is the
Company's policy that foreign currency derivatives are
executed to convert substantially all of the foreign currency
debt obligations to the local country currency of the
receivables.
Due to the low levels of transactional currency exposure,
FCE’s sensitivity to changes in currency exchange rates is
not significant in terms of gains and losses recognized in the
income statement.
The net assets of investments in overseas branches and subsidiaries which give rise to the unrealised gain or losses recognised in
FCE's foreign currency translation reserves are detailed below.
Foreign currency translation reserves are detailed below.
As at 31 December
Net assets of foreign operations
Euro £ 1,536 £ 1,807 £ 1,559 £ 1,820
Other non Euro currencies 1 4 69 73
Company Group
2011 2010 2011 2010
£ mil £ mil £ mil £ mil
As at 31 December
Translation reserve:
Euro £ 305 £ 348 £ 321 £ 362
Other non Euro currencies 6 6 8 17
GBP 9 9 9 9
Total £ 320 £ 363 £ 338 £ 388
Company Group
2011 2010 2011 2010
£ mil £ mil £ mil £ mil
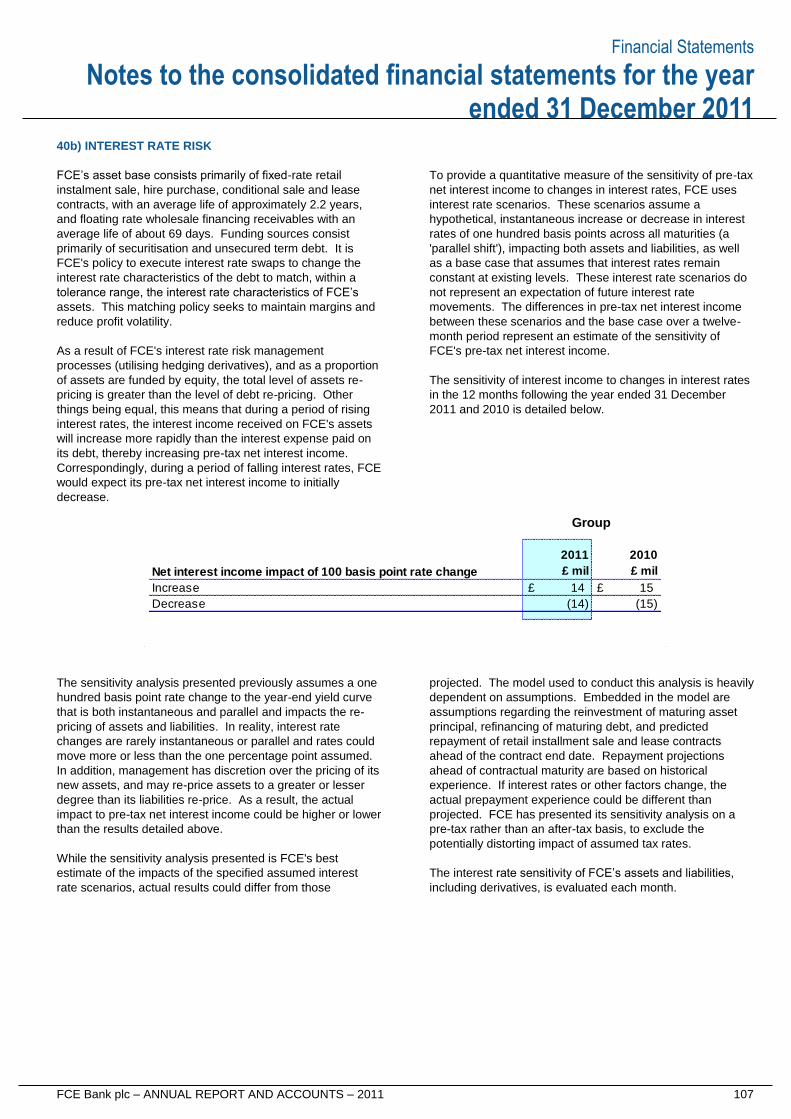
Financial Statements
FCE Bank plc – ANNUAL REPORT AND ACCOUNTS – 2011 107
Notes to the consolidated financial statements for the year ended 31 December 2011
40b) INTEREST RATE RISK
FCE’s asset base consists primarily of fixed-rate retail
instalment sale, hire purchase, conditional sale and lease
contracts, with an average life of approximately 2.2 years,
and floating rate wholesale financing receivables with an
average life of about 69 days. Funding sources consist
primarily of securitisation and unsecured term debt. It is
FCE's policy to execute interest rate swaps to change the
interest rate characteristics of the debt to match, within a
tolerance range, the interest rate characteristics of FCE’s
assets. This matching policy seeks to maintain margins and
reduce profit volatility.
As a result of FCE's interest rate risk management
processes (utilising hedging derivatives), and as a proportion
of assets are funded by equity, the total level of assets re-
pricing is greater than the level of debt re-pricing. Other
things being equal, this means that during a period of rising
interest rates, the interest income received on FCE's assets
will increase more rapidly than the interest expense paid on
its debt, thereby increasing pre-tax net interest income.
Correspondingly, during a period of falling interest rates, FCE
would expect its pre-tax net interest income to initially
decrease.
To provide a quantitative measure of the sensitivity of pre-tax
net interest income to changes in interest rates, FCE uses
interest rate scenarios. These scenarios assume a
hypothetical, instantaneous increase or decrease in interest
rates of one hundred basis points across all maturities (a
'parallel shift'), impacting both assets and liabilities, as well
as a base case that assumes that interest rates remain
constant at existing levels. These interest rate scenarios do
not represent an expectation of future interest rate
movements. The differences in pre-tax net interest income
between these scenarios and the base case over a twelve-
month period represent an estimate of the sensitivity of
FCE's pre-tax net interest income.
The sensitivity of interest income to changes in interest rates
in the 12 months following the year ended 31 December
2011 and 2010 is detailed below.
The sensitivity analysis presented previously assumes a one
hundred basis point rate change to the year-end yield curve
that is both instantaneous and parallel and impacts the re-
pricing of assets and liabilities. In reality, interest rate
changes are rarely instantaneous or parallel and rates could
move more or less than the one percentage point assumed.
In addition, management has discretion over the pricing of its
new assets, and may re-price assets to a greater or lesser
degree than its liabilities re-price. As a result, the actual
impact to pre-tax net interest income could be higher or lower
than the results detailed above.
While the sensitivity analysis presented is FCE's best
estimate of the impacts of the specified assumed interest
rate scenarios, actual results could differ from those
projected. The model used to conduct this analysis is heavily
dependent on assumptions. Embedded in the model are
assumptions regarding the reinvestment of maturing asset
principal, refinancing of maturing debt, and predicted
repayment of retail installment sale and lease contracts
ahead of the contract end date. Repayment projections
ahead of contractual maturity are based on historical
experience. If interest rates or other factors change, the
actual prepayment experience could be different than
projected. FCE has presented its sensitivity analysis on a
pre-tax rather than an after-tax basis, to exclude the
potentially distorting impact of assumed tax rates.
The interest rate sensitivity of FCE’s assets and liabilities,
including derivatives, is evaluated each month.
Net interest income impact of 100 basis point rate change
Increase £ 14 £ 15
Decrease (14) (15)
£ mil £ mil
Group
2011 2010
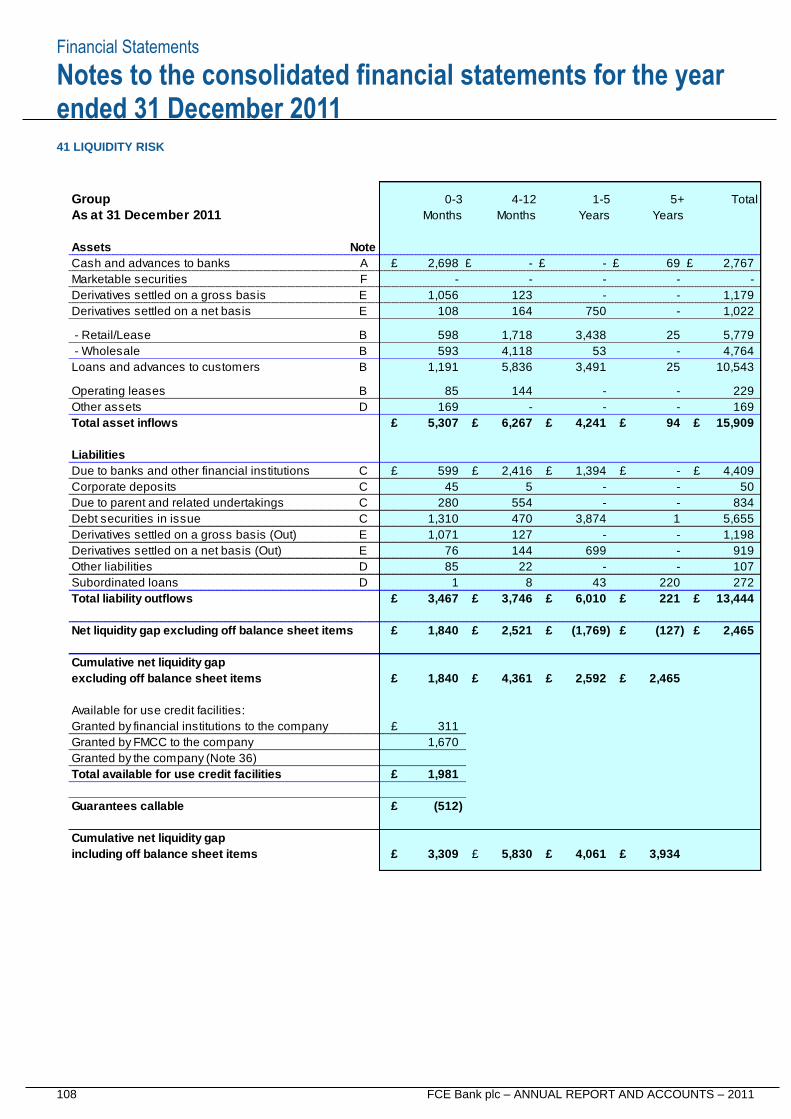
Financial Statements
108 FCE Bank plc – ANNUAL REPORT AND ACCOUNTS – 2011
Notes to the consolidated financial statements for the year ended 31 December 2011
41 LIQUIDITY RISK
Group 1-5 5+
As at 31 December 2011 Years Years
Assets Note
Cash and advances to banks A £ 2,698 £ - £ - £ 69 £ 2,767
Marketable securities F - - - - -
Derivatives settled on a gross basis E 1,056 123 - - 1,179
Derivatives settled on a net basis E 108 164 750 - 1,022
- Retail/Lease B 598 1,718 3,438 25 5,779
- Wholesale B 593 4,118 53 - 4,764
Loans and advances to customers B 1,191 5,836 3,491 25 10,543
Operating leases B 85 144 - - 229
Other assets D 169 - - - 169
Total asset inflows £ 5,307 £ 6,267 £ 4,241 £ 94 £ 15,909
Liabilities
Due to banks and other financial institutions C £ 599 £ 2,416 £ 1,394 £ - £ 4,409
Corporate deposits C 45 5 - - 50
Due to parent and related undertakings C 280 554 - - 834
Debt securities in issue C 1,310 470 3,874 1 5,655
Derivatives settled on a gross basis (Out) E 1,071 127 - - 1,198
Derivatives settled on a net basis (Out) E 76 144 699 - 919
Other liabilities D 85 22 - - 107
Subordinated loans D 1 8 43 220 272
Total liability outflows £ 3,467 £ 3,746 £ 6,010 £ 221 £ 13,444
Net liquidity gap excluding off balance sheet items £ 1,840 £ 2,521 £ (1,769) £ (127) £ 2,465
Cumulative net liquidity gap
excluding off balance sheet items £ 1,840 £ 4,361 £ 2,592 £ 2,465
Available for use credit facilities:
Granted by financial institutions to the company £ 311
Granted by FMCC to the company 1,670
Granted by the company (Note 36)
Total available for use credit facilities £ 1,981
Guarantees callable £ (512)
Cumulative net liquidity gap
including off balance sheet items £ 3,309 £ 5,830 £ 4,061 £ 3,934
4-12 Total
Months Months
0-3
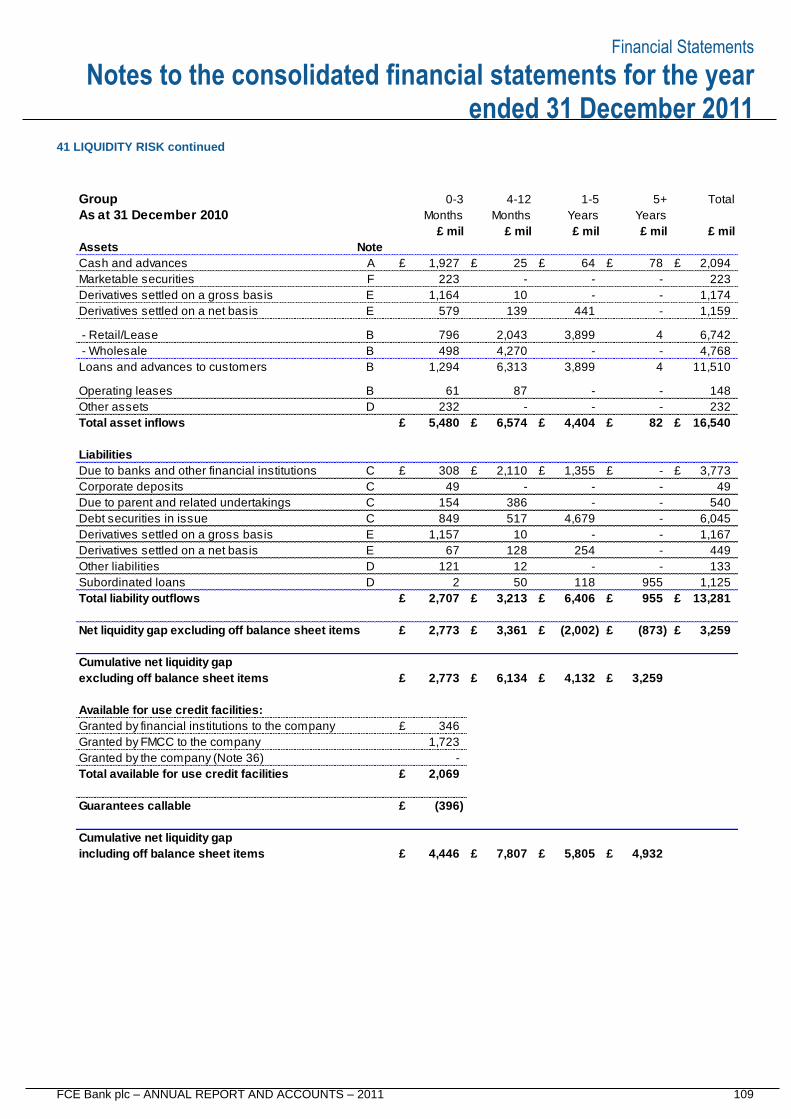
Financial Statements
FCE Bank plc – ANNUAL REPORT AND ACCOUNTS – 2011 109
Notes to the consolidated financial statements for the year ended 31 December 2011
41 LIQUIDITY RISK continued
Group 1-5 5+
As at 31 December 2010 Years Years
Assets Note
Cash and advances A £ 1,927 £ 25 £ 64 £ 78 £ 2,094
Marketable securities F 223 - - - 223
Derivatives settled on a gross basis E 1,164 10 - - 1,174
Derivatives settled on a net basis E 579 139 441 - 1,159
- Retail/Lease B 796 2,043 3,899 4 6,742
- Wholesale B 498 4,270 - - 4,768
Loans and advances to customers B 1,294 6,313 3,899 4 11,510
Operating leases B 61 87 - - 148
Other assets D 232 - - - 232
Total asset inflows £ 5,480 £ 6,574 £ 4,404 £ 82 £ 16,540
Liabilities
Due to banks and other financial institutions C £ 308 £ 2,110 £ 1,355 £ - £ 3,773
Corporate deposits C 49 - - - 49
Due to parent and related undertakings C 154 386 - - 540
Debt securities in issue C 849 517 4,679 - 6,045
Derivatives settled on a gross basis E 1,157 10 - - 1,167
Derivatives settled on a net basis E 67 128 254 - 449
Other liabilities D 121 12 - - 133
Subordinated loans D 2 50 118 955 1,125
Total liability outflows £ 2,707 £ 3,213 £ 6,406 £ 955 £ 13,281
Net liquidity gap excluding off balance sheet items £ 2,773 £ 3,361 £ (2,002) £ (873) £ 3,259
Cumulative net liquidity gap
excluding off balance sheet items £ 2,773 £ 6,134 £ 4,132 £ 3,259
Available for use credit facilities:
Granted by financial institutions to the company £ 346
Granted by FMCC to the company 1,723
Granted by the company (Note 36) -
Total available for use credit facilities £ 2,069
Guarantees callable £ (396)
Cumulative net liquidity gap
including off balance sheet items £ 4,446 £ 7,807 £ 5,805 £ 4,932
Months
£ mil
0-3
£ mil£ mil£ mil£ mil
4-12 Total
Months
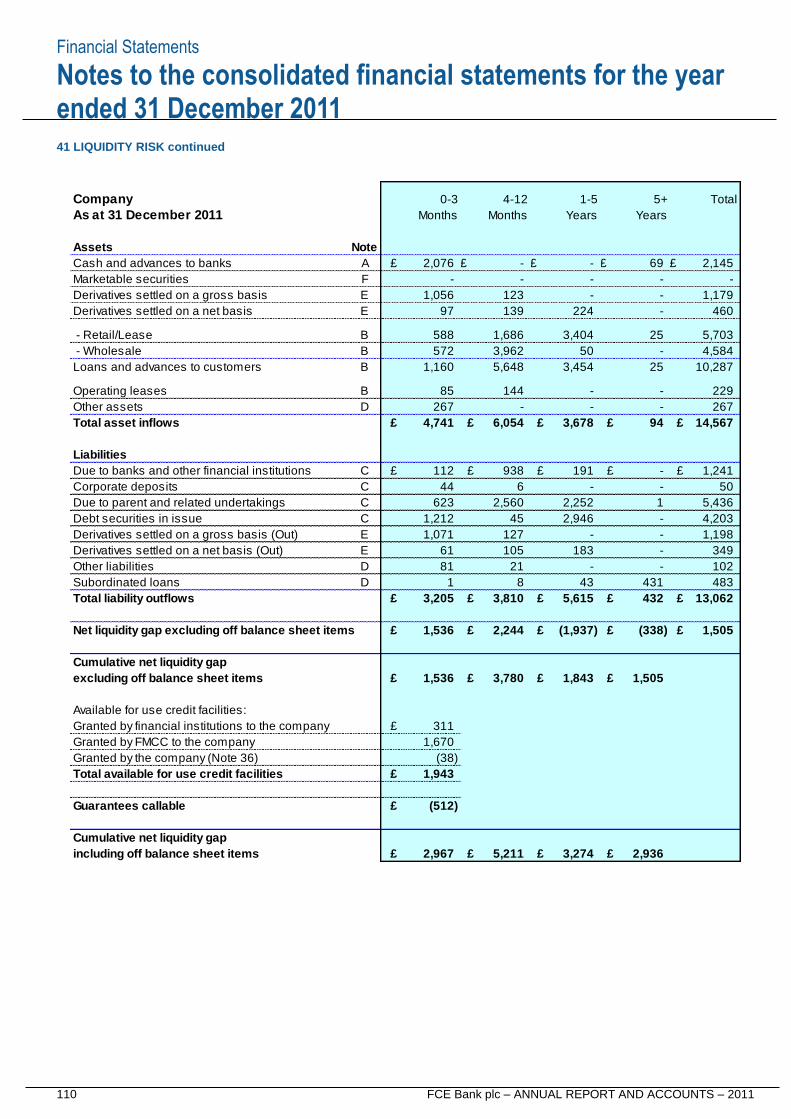
Financial Statements
110 FCE Bank plc – ANNUAL REPORT AND ACCOUNTS – 2011
Notes to the consolidated financial statements for the year ended 31 December 2011
41 LIQUIDITY RISK continued
Company 1-5 5+
As at 31 December 2011 Years Years
Assets Note
Cash and advances to banks A £ 2,076 £ - £ - £ 69 £ 2,145
Marketable securities F - - - - -
Derivatives settled on a gross basis E 1,056 123 - - 1,179
Derivatives settled on a net basis E 97 139 224 - 460
- Retail/Lease B 588 1,686 3,404 25 5,703
- Wholesale B 572 3,962 50 - 4,584
Loans and advances to customers B 1,160 5,648 3,454 25 10,287
Operating leases B 85 144 - - 229
Other assets D 267 - - - 267
Total asset inflows £ 4,741 £ 6,054 £ 3,678 £ 94 £ 14,567
Liabilities
Due to banks and other financial institutions C £ 112 £ 938 £ 191 £ - £ 1,241
Corporate deposits C 44 6 - - 50
Due to parent and related undertakings C 623 2,560 2,252 1 5,436
Debt securities in issue C 1,212 45 2,946 - 4,203
Derivatives settled on a gross basis (Out) E 1,071 127 - - 1,198
Derivatives settled on a net basis (Out) E 61 105 183 - 349
Other liabilities D 81 21 - - 102
Subordinated loans D 1 8 43 431 483
Total liability outflows £ 3,205 £ 3,810 £ 5,615 £ 432 £ 13,062
Net liquidity gap excluding off balance sheet items £ 1,536 £ 2,244 £ (1,937) £ (338) £ 1,505
Cumulative net liquidity gap
excluding off balance sheet items £ 1,536 £ 3,780 £ 1,843 £ 1,505
Available for use credit facilities:
Granted by financial institutions to the company £ 311
Granted by FMCC to the company 1,670
Granted by the company (Note 36) (38)
Total available for use credit facilities £ 1,943
Guarantees callable £ (512)
Cumulative net liquidity gap
including off balance sheet items £ 2,967 £ 5,211 £ 3,274 £ 2,936
Months Months
0-3 4-12 Total
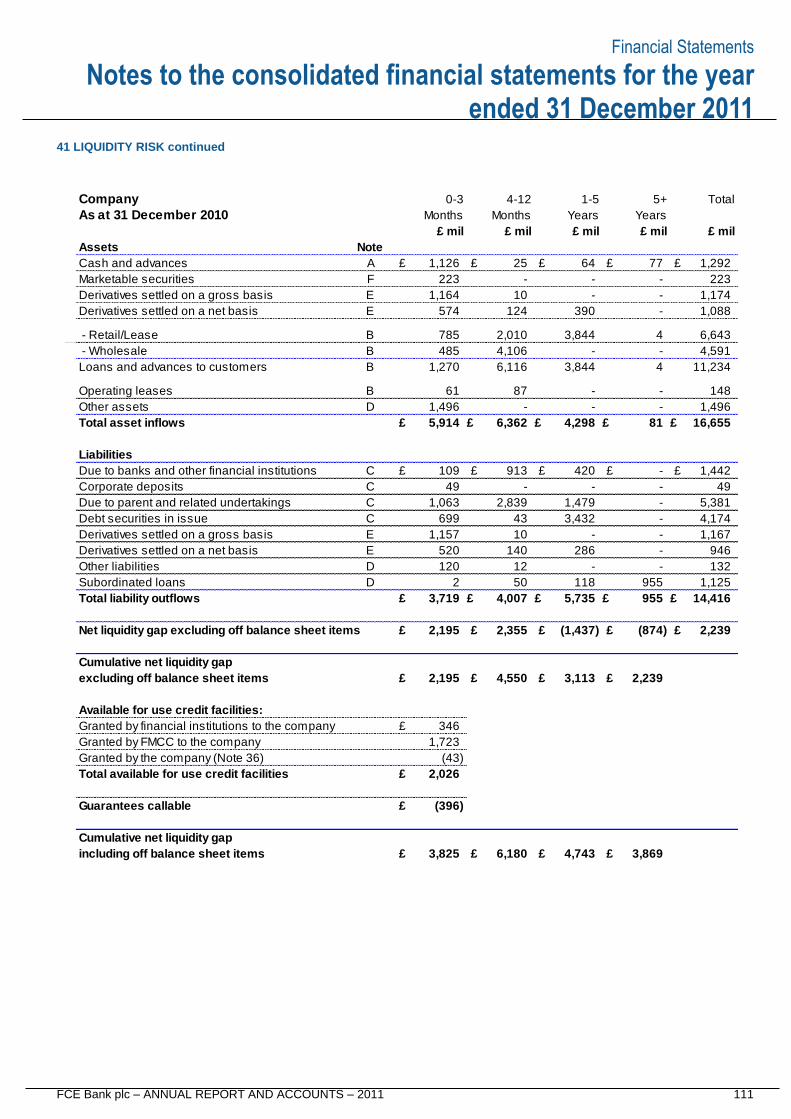
Financial Statements
FCE Bank plc – ANNUAL REPORT AND ACCOUNTS – 2011 111
Notes to the consolidated financial statements for the year ended 31 December 2011
41 LIQUIDITY RISK continued
Company 1-5 5+
As at 31 December 2010 Years Years
Assets Note
Cash and advances A £ 1,126 £ 25 £ 64 £ 77 £ 1,292
Marketable securities F 223 - - - 223
Derivatives settled on a gross basis E 1,164 10 - - 1,174
Derivatives settled on a net basis E 574 124 390 - 1,088
- Retail/Lease B 785 2,010 3,844 4 6,643
- Wholesale B 485 4,106 - - 4,591
Loans and advances to customers B 1,270 6,116 3,844 4 11,234
Operating leases B 61 87 - - 148
Other assets D 1,496 - - - 1,496
Total asset inflows £ 5,914 £ 6,362 £ 4,298 £ 81 £ 16,655
Liabilities
Due to banks and other financial institutions C £ 109 £ 913 £ 420 £ - £ 1,442
Corporate deposits C 49 - - - 49
Due to parent and related undertakings C 1,063 2,839 1,479 - 5,381
Debt securities in issue C 699 43 3,432 - 4,174
Derivatives settled on a gross basis E 1,157 10 - - 1,167
Derivatives settled on a net basis E 520 140 286 - 946
Other liabilities D 120 12 - - 132
Subordinated loans D 2 50 118 955 1,125
Total liability outflows £ 3,719 £ 4,007 £ 5,735 £ 955 £ 14,416
Net liquidity gap excluding off balance sheet items £ 2,195 £ 2,355 £ (1,437) £ (874) £ 2,239
Cumulative net liquidity gap
excluding off balance sheet items £ 2,195 £ 4,550 £ 3,113 £ 2,239
Available for use credit facilities:
Granted by financial institutions to the company £ 346
Granted by FMCC to the company 1,723
Granted by the company (Note 36) (43)
Total available for use credit facilities £ 2,026
Guarantees callable £ (396)
Cumulative net liquidity gap
including off balance sheet items £ 3,825 £ 6,180 £ 4,743 £ 3,869
0-3
£ mil£ mil
4-12 Total
Months
£ mil £ mil
Months
£ mil
Financial Statements
112 FCE Bank plc – ANNUAL REPORT AND ACCOUNTS – 2011
Notes to the consolidated financial statements for the year ended 31 December 2011
41 LIQUIDITY RISK continued
Basis of liquidity risk analysis
The tables within this note analyses gross undiscounted
contractual cash flows from assets and liabilities into relevant
maturity groupings based on the criteria detailed in the
following table.
The 'Net liquidity gap excluding off balance sheet items' is
reported excluding behavioural adjustments for customer
early settlements.
The 'Net liquidity gap including off balance sheet items'
includes available for use credit facilities.
Both of the above gap figures assume that the inflows related
to retail, leasing and wholesale financing plans occur on the
latest contractual date and that the repayment of debt occurs
at the earliest possible repayment date. Accordingly FCE's
expected liquidity position based on cash inflows and
outflows is more favourable than as presented within this
note.
Note Cash flows from assets and liabilities are allocated to the appropriate time bands as follows:
A Based on availability of 'cash and advances' as follows (Note 11):
• 'Cash and cash equivalents' classified by contractual maturity date.
• 'Other deposits' which are typically not available for use in day to day operations classified based on the latest
possible repayment date.
B Customer payments are assumed to occur on the latest contractual date and no behavioral adjustments are made
for customer early settlements:
• Retail finance and lease contracts and operating lease vehicles (reported within Note 18 'Property and
equipment') generally require customers to pay equal monthly installments over the life of the contract.
• Wholesale financing for new and used vehicles held in dealers inventory - A bullet repayment schedule is
utilised as the principal is typically repaid in one lump sum at the end of the financing period.
C Classified to the earliest possible repayment date which means the first rollover date, or the shortest period of
notice required to withdraw the funds or exercise a break clause where applicable.
D Classified according to the remaining period to maturity.
E Forward foreign exchange contracts and cross currency interest rate swaps are recorded on a contractual cash
flow basis.
F Marketable securities are considered as available liquidity on demand.
Available for use credit facilities
Available committed securitisation capacity
FCE maintains committed securitisation capacity consisting
of agreements with banks and asset backed commercial
paper conduits under which these parties are contractually
obligated, at FCE's option, to purchase eligible receivables,
or make advances under asset backed securities. Refer to
the Capital and Funding section of the Directors’ report and
Note 18 for further details.
Unsecured credit facilities granted by financial
institutions to the company
At 31 December 2011 the Company had a £440 million
(2010: £689 million) contractually committed unsecured
credit facility with financial institutions, of which £129 million
(2010: £343 million) was utilised, as part of FCE's plans for
periodic usage of the facility. The remaining £311 million
(2010: £346 million) was available for use and reported
within the Liquidity Risk tables as 'Available for use credit
facilities – Granted by financial institutions to the Company'.
This credit facility, which expires in 2014, contains certain
covenants including an obligation for FCE to maintain its ratio
of regulatory capital risk-weighted assets at no less than the
applicable regulatory minimum, and for the support
agreement between FCE and FMCC to remain in full force
and effect (and enforced by FCE to ensure that its net worth
is maintained at no less than $500 million). In addition to
customary payment, representation, bankruptcy and
judgment defaults, the credit facility contains cross-payment
and cross-acceleration defaults with respect to other debt.
Unsecured credit facilities granted by FMCC to the
Company
A EUR 2.0 billion (2010: EUR 2.0 billion) short term revolving
facility has been provided by FMCC to the Company which
matures on 14 December 2012 or earlier upon 45 days’
notice from FMCC. As at 31 December 2011 no amounts
had been drawn under this facility (2010: nil).
Liquid assets
Included within 'Cash and advances to banks' is £1,809
million (2010: £761 million) of cash and cash equivalents
held centrally, primarily as investments eligible under the
FSA's definition of Liquid Assets Buffer (£1.1billion), both to
meet regulatory requirements and to provide liquidity for
short-term funding needs and flexibility in the use of other
funding programmes.
Financial Statements
FCE Bank plc – ANNUAL REPORT AND ACCOUNTS – 2011 113
Notes to the consolidated financial statements for the year ended 31 December 2011
42 FINANCIAL ASSETS AND FINANCIAL LIABILITIES
Detailed on the following page is a comparison by category
of the carrying values and fair values of the financial assets
and financial liabilities.
Fair value is obtained by calculating the amount at which an
asset or liability could be exchanged in an arm’s length
transaction between informed and willing parties other than
in a forced liquidation.
FCE measures the fair value of its assets and liabilities
based on the fair value hierarchy that reflects the significance
of the inputs used in making the measurements. The fair
value hierarchy has the following measurements:
• Level 1: inputs include quoted prices for identical
instruments and are the most observable.
• Level 2: inputs include quoted prices for similar assets and
observable inputs such as interest rates, currency
exchange rates and yield curves.
• Level 3: inputs are not observable in the market and
include management’s judgments about the assumptions
market participants would use in pricing the asset or
liability.
For FCE, measurements of fair values classified at level 3
included longer-dated instruments where observable interest
rates or foreign exchange rates were not available for all
periods through to maturity. As at 31 December 2011, FCE
had transferred out all fair values of financial instruments
classified at level 3. Refer to page 115 for further details.
Due to the low levels of derivative fair values measured at
level 3 in 2010, FCE's sensitivity to changes in assumptions
was not significant in terms of gains and losses recognised in
the income statement.
Derivative financial instruments
The fair values of derivatives are calculated using market
rates and industry standard valuation models. All derivatives
are included in assets when the fair value is positive and in
liabilities when the fair value is negative.
Financial assets
Cash and advances to banks include inter-bank placements
and items in the course of collection. The fair value of
floating rate placements and overnight deposits is their
carrying amount. The estimated fair value of fixed interest
bearing deposits is based on discounted cash flows using
prevailing money-market interest rates for debts with similar
credit risk and remaining maturity.
Short term receivables and loans receivable: The book value
of short-term receivables and loans receivable approximates
fair value due to the short maturities of these assets.
Loans and advances to customers: The fair value is
calculated by discounting anticipated future cash flows using
an estimated discount rate that reflects the following:
• Expected credit losses
• Customer prepayments
• Expected future interest rates
FCE uses statistical methods that divide receivables into
segments by type of receivables and contractual term.
Financial liabilities
The aggregate fair values of financial liabilities are calculated
as follows:
• Subordinated loans with no stated maturity date are
reported based on the amount repayable on demand
• The book value of short-term debt, trade payable and
accounts payable to subsidiary and related undertakings
approximates fair value due to the short maturities of these
liabilities
• The fair value of all other debt is estimated based upon
quoted market prices, current market rates for similar debt
with approximately the same remaining maturities, or
discounted cash flow models utilising current market rates
Accordingly the information as presented does not purport to
represent, nor should it be construed to represent, the
underlying value of the business as a going concern.
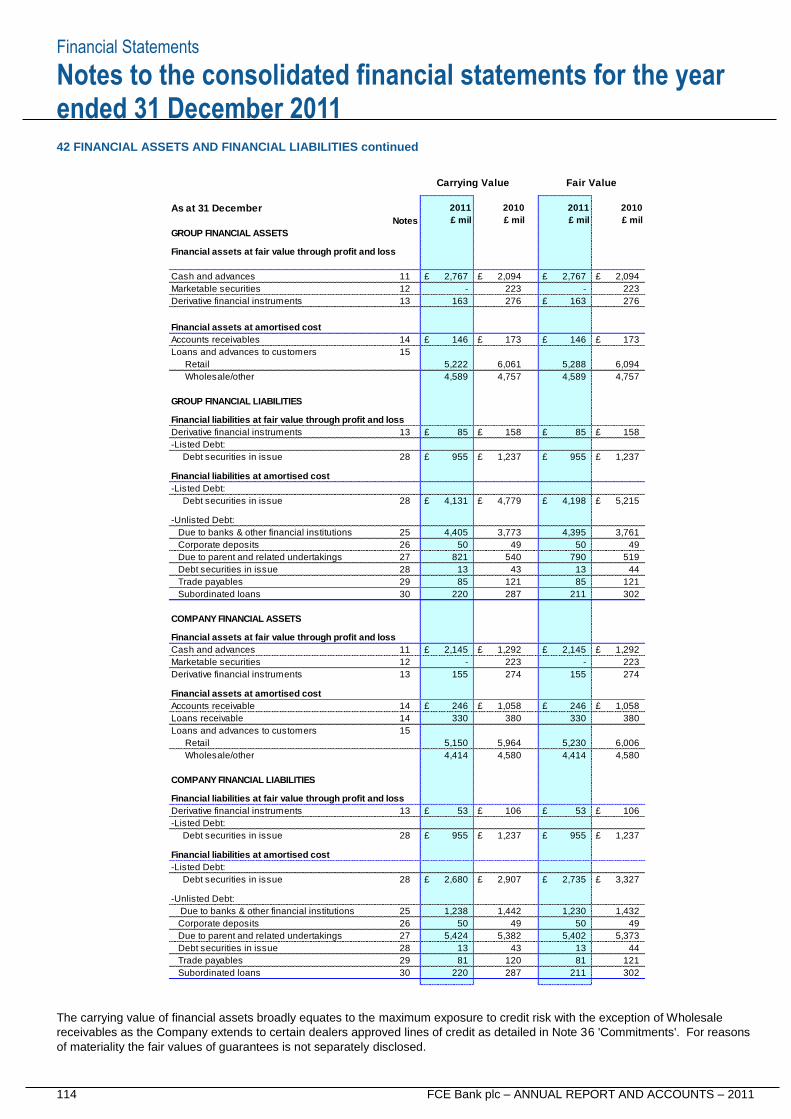
Financial Statements
114 FCE Bank plc – ANNUAL REPORT AND ACCOUNTS – 2011
Notes to the consolidated financial statements for the year ended 31 December 2011
42 FINANCIAL ASSETS AND FINANCIAL LIABILITIES continued
The carrying value of financial assets broadly equates to the maximum exposure to credit risk with the exception of Wholesale
receivables as the Company extends to certain dealers approved lines of credit as detailed in Note 36 'Commitments'. For reasons
of materiality the fair values of guarantees is not separately disclosed.
As at 31 December
Notes
GROUP FINANCIAL ASSETS
Financial assets at fair value through profit and loss
Cash and advances 11 £ 2,767 £ 2,094 £ 2,767 £ 2,094
Marketable securities 12 - 223 - 223
Derivative financial instruments 13 163 276 £ 163 276
Financial assets at amortised cost
Accounts receivables 14 £ 146 £ 173 £ 146 £ 173
Loans and advances to customers 15
Retail 5,222 6,061 5,288 6,094
Wholesale/other 4,589 4,757 4,589 4,757
GROUP FINANCIAL LIABILITIES
Financial liabilities at fair value through profit and loss
Derivative financial instruments 13 £ 85 £ 158 £ 85 £ 158
-Listed Debt:
Debt securities in issue 28 £ 955 £ 1,237 £ 955 £ 1,237
Financial liabilities at amortised cost
-Listed Debt:
Debt securities in issue 28 £ 4,131 £ 4,779 £ 4,198 £ 5,215
-Unlisted Debt:
Due to banks & other financial institutions 25 4,405 3,773 4,395 3,761
Corporate deposits 26 50 49 50 49
Due to parent and related undertakings 27 821 540 790 519
Debt securities in issue 28 13 43 13 44
Trade payables 29 85 121 85 121
Subordinated loans 30 220 287 211 302
COMPANY FINANCIAL ASSETS
Financial assets at fair value through profit and loss
Cash and advances 11 £ 2,145 £ 1,292 £ 2,145 £ 1,292
Marketable securities 12 - 223 - 223
Derivative financial instruments 13 155 274 155 274
Financial assets at amortised cost
Accounts receivable 14 £ 246 £ 1,058 £ 246 £ 1,058
Loans receivable 14 330 380 330 380
Loans and advances to customers 15
Retail 5,150 5,964 5,230 6,006
Wholesale/other 4,414 4,580 4,414 4,580
COMPANY FINANCIAL LIABILITIES
Financial liabilities at fair value through profit and loss
Derivative financial instruments 13 £ 53 £ 106 £ 53 £ 106
-Listed Debt:
Debt securities in issue 28 £ 955 £ 1,237 £ 955 £ 1,237
Financial liabilities at amortised cost
-Listed Debt:
Debt securities in issue 28 £ 2,680 £ 2,907 £ 2,735 £ 3,327
-Unlisted Debt:
Due to banks & other financial institutions 25 1,238 1,442 1,230 1,432
Corporate deposits 26 50 49 50 49
Due to parent and related undertakings 27 5,424 5,382 5,402 5,373
Debt securities in issue 28 13 43 13 44
Trade payables 29 81 120 81 121
Subordinated loans 30 220 287 211 302
Carrying Value Fair Value
£ mil
2011
£ mil
2011
£ mil
2010 2010
£ mil
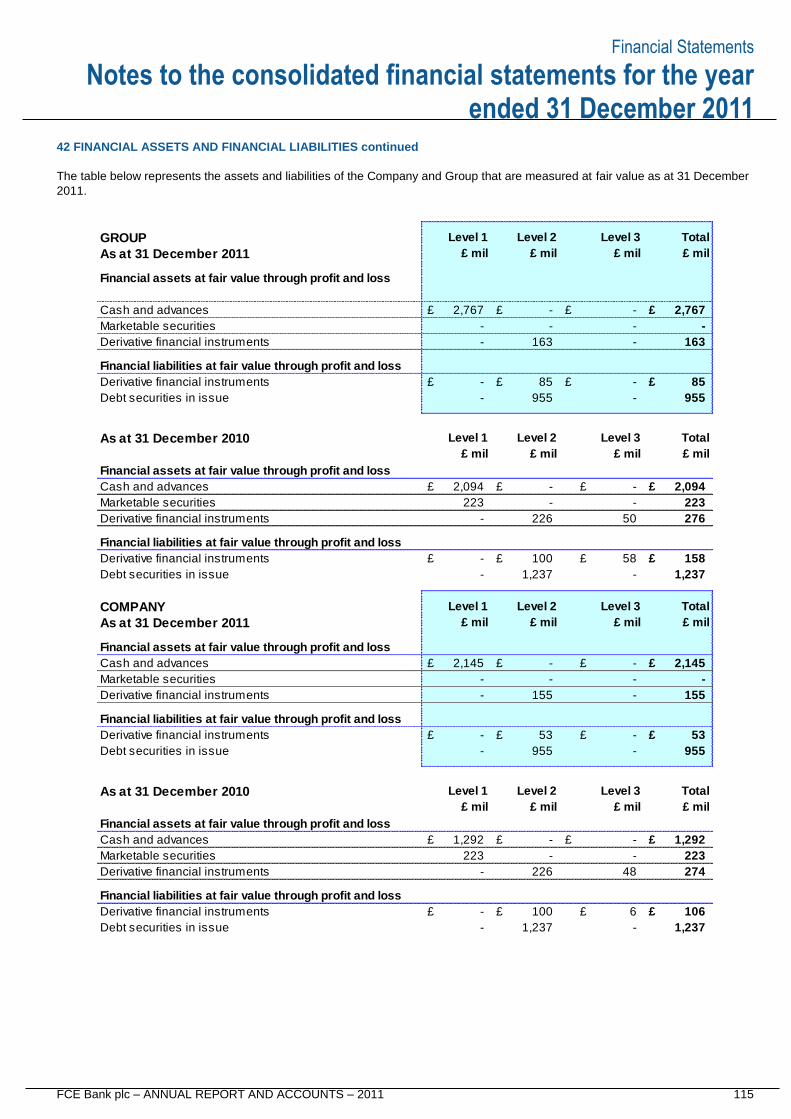
Financial Statements
FCE Bank plc – ANNUAL REPORT AND ACCOUNTS – 2011 115
Notes to the consolidated financial statements for the year ended 31 December 2011
42 FINANCIAL ASSETS AND FINANCIAL LIABILITIES continued
The table below represents the assets and liabilities of the Company and Group that are measured at fair value as at 31 December
2011.
GROUP
As at 31 December 2011
Financial assets at fair value through profit and loss
Cash and advances £ 2,767 £ - £ - £ 2,767
Marketable securities - - - -
Derivative financial instruments - 163 - 163
Financial liabilities at fair value through profit and loss
Derivative financial instruments £ - £ 85 £ - £ 85
Debt securities in issue - 955 - 955
As at 31 December 2010
Financial assets at fair value through profit and loss
Cash and advances £ 2,094 £ - £ - £ 2,094
Marketable securities 223 - - 223
Derivative financial instruments - 226 50 276
Financial liabilities at fair value through profit and loss
Derivative financial instruments £ - £ 100 £ 58 £ 158
Debt securities in issue - 1,237 - 1,237
COMPANY
As at 31 December 2011
Financial assets at fair value through profit and loss
Cash and advances £ 2,145 £ - £ - £ 2,145
Marketable securities - - - -
Derivative financial instruments - 155 - 155
Financial liabilities at fair value through profit and loss
Derivative financial instruments £ - £ 53 £ - £ 53
Debt securities in issue - 955 - 955
As at 31 December 2010
Financial assets at fair value through profit and loss
Cash and advances £ 1,292 £ - £ - £ 1,292
Marketable securities 223 - - 223
Derivative financial instruments - 226 48 274
Financial liabilities at fair value through profit and loss
Derivative financial instruments £ - £ 100 £ 6 £ 106
Debt securities in issue - 1,237 - 1,237
Level 1 Level 2 Level 3 Total
£ mil£ mil £ mil£ mil
£ mil £ mil
Level 3 TotalLevel 1 Level 2
£ mil £ mil
Level 3 Total
£ mil
Level 1
£ mil £ mil £ mil
Total
Level 2
£ mil
Level 1
£ mil
Level 3Level 2
£ mil £ mil
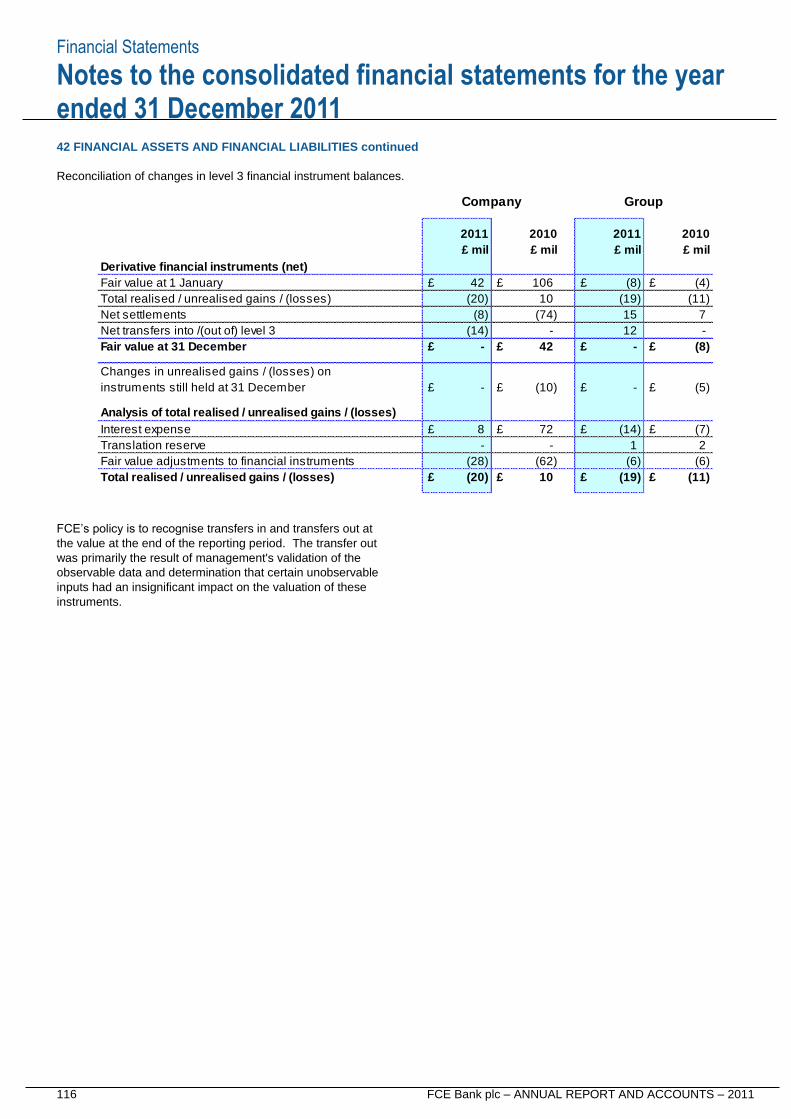
Financial Statements
116 FCE Bank plc – ANNUAL REPORT AND ACCOUNTS – 2011
Notes to the consolidated financial statements for the year ended 31 December 2011
42 FINANCIAL ASSETS AND FINANCIAL LIABILITIES continued
Reconciliation of changes in level 3 financial instrument balances.
FCE’s policy is to recognise transfers in and transfers out at
the value at the end of the reporting period. The transfer out
was primarily the result of management's validation of the
observable data and determination that certain unobservable
inputs had an insignificant impact on the valuation of these
instruments.
Derivative financial instruments (net)
Fair value at 1 January £ 42 £ 106 £ (8) £ (4)
Total realised / unrealised gains / (losses) (20) 10 (19) (11)
Net settlements (8) (74) 15 7
Net transfers into /(out of) level 3 (14) - 12 -
Fair value at 31 December £ - £ 42 £ - £ (8)
Changes in unrealised gains / (losses) on
instruments still held at 31 December £ - £ (10) £ - £ (5)
Analysis of total realised / unrealised gains / (losses)
Interest expense £ 8 £ 72 £ (14) £ (7)
Translation reserve - - 1 2
Fair value adjustments to financial instruments (28) (62) (6) (6)
Total realised / unrealised gains / (losses) £ (20) £ 10 £ (19) £ (11)
£ mil
Company
2011 2010 2011 2010
Group
£ mil £ mil £ mil
Financial Statements
FCE Bank plc – ANNUAL REPORT AND ACCOUNTS – 2011 117
Notes to the consolidated financial statements for the year ended 31 December 2011
43 RELATED PARTY TRANSACTIONS
Parties are considered to be related if they are under
common control and if one party has the ability to control the
other party or exercise significant influence over the other
party in making financial or operational decisions.
A number of transactions are entered into with related parties
in the normal course of business. The Company and its
subsidiaries are separate, legally distinct companies from
Ford and Ford's automotive affiliates and transactions are
carried out on commercial terms and at market rates and
enforced by FCE in a commercially reasonable manner. In
addition to participating in retirement benefit plans sponsored
by Ford and Volvo subsidiaries (discussed in Note 34
'Retirement benefit obligations'); the Company has a support
agreement with Ford Credit in regard to Shareholders' funds
(detailed in Note 31 'Ordinary shares and share premium').
FCE has reported related party transactions with the
following categories, described below:
• Parent undertakings;
• Directors and officers;
• Entities under common control;
• Jointly controlled entities.
Related parties
Parent undertakings - this includes FCI, Ford Credit and
Ford. For further information refer to Note 46 'FCE and other
related party information'.
Directors and officers - reported in Note 6 'Transactions
with Directors and officers'.
Entities under common control – which includes all
subsidiaries of Ford except for those entities already reported
within 'Subsidiaries of the company' and 'Parent
undertakings'. Transactions reported in this category
include:
• Provision of approved lines of credit, mortgages, working
capital and other types of loans which mainly relates to
automotive partner vehicle dealers in which Ford maintains
a controlling interest;
• The receipt of interest income from Ford and its related
companies arising from loans, interest supplements and
other support costs in regard to a variety of retail and
wholesale finance plans;
• Guarantees provided on behalf of other related parties of
which further details can be found Note 35 'Contingent
liabilities';
• Guarantees received from other related parties primarily
for wholesale vehicle finance plans.
As at 31 December 2011 adjustments to the carrying value of
loans and advances to customers relating to interest
supplements from related parties totalled £151 million (2010:
£193 million) and are reported in Note 15 'Loans and
advances to customers'. Interest supplements relating to
loans and advances earned and recorded in the income
statement for the year ended 31 December 2011 were £444
million (2010: £455 million) and are reported in Note 2 'Net
interest income'.
Interest supplements relating to operating leases earned and
recorded in the income statement for the year ended 31
December 2011 were £140 million (2010: £123 million) and
are reported in Note 4 'Other operating income'.
The Company has guaranteed obligations of Ford in
Romania. For further information please refer to Note 27
'Due to parent and related undertakings' and Note 35
'Contingent liabilities'.
.
Jointly controlled entity - FCE's only jointly controlled entity
is Forso for which information has been disclosed in Note 23
'Investment in a jointly controlled entity'.
There have been no other significant changes in transactions with related parties in the period to 31 December 2011. For further
details refer to the following Company and Group disclosures.
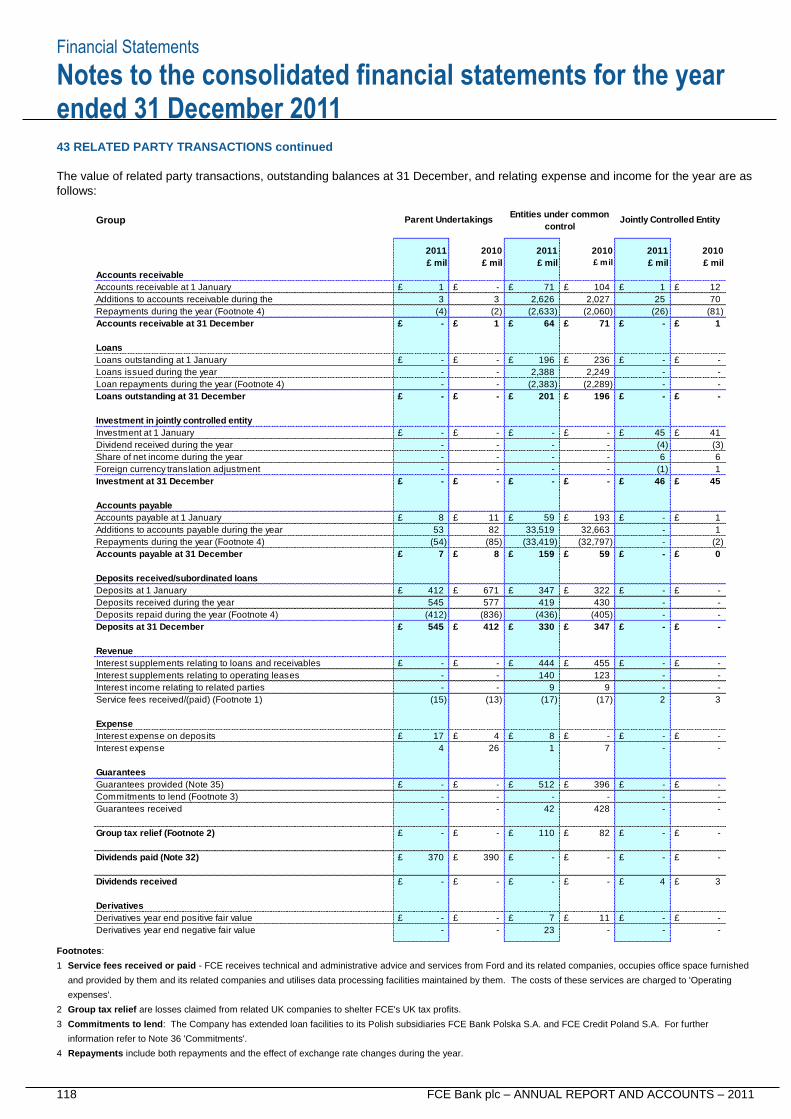
Financial Statements
118 FCE Bank plc – ANNUAL REPORT AND ACCOUNTS – 2011
Notes to the consolidated financial statements for the year ended 31 December 2011
43 RELATED PARTY TRANSACTIONS continued
The value of related party transactions, outstanding balances at 31 December, and relating expense and income for the year are as
follows:
Footnotes:
1 Service fees received or paid - FCE receives technical and administrative advice and services from Ford and its related companies, occupies office space furnished
and provided by them and its related companies and utilises data processing facilities maintained by them. The costs of these services are charged to 'Operating
expenses'.
2 Group tax relief are losses claimed from related UK companies to shelter FCE's UK tax profits.
3 Commitments to lend: The Company has extended loan facilities to its Polish subsidiaries FCE Bank Polska S.A. and FCE Credit Poland S.A. For further
information refer to Note 36 'Commitments'.
4 Repayments include both repayments and the effect of exchange rate changes during the year.
Accounts receivable
Accounts receivable at 1 January £ 1 £ - £ 71 £ 104 £ 1 £ 12
Additions to accounts receivable during the 3 3 2,626 2,027 25 70
Repayments during the year (Footnote 4) (4) (2) (2,633) (2,060) (26) (81)
Accounts receivable at 31 December £ - £ 1 £ 64 £ 71 £ - £ 1
Loans
Loans outstanding at 1 January £ - £ - £ 196 £ 236 £ - £ -
Loans issued during the year - - 2,388 2,249 - -
Loan repayments during the year (Footnote 4) - - (2,383) (2,289) - -
Loans outstanding at 31 December £ - £ - £ 201 £ 196 £ - £ -
Investment in jointly controlled entity
Investment at 1 January £ - £ - £ - £ - £ 45 £ 41
Dividend received during the year - - - - (4) (3)
Share of net income during the year - - - - 6 6
Foreign currency translation adjustment - - - - (1) 1
Investment at 31 December £ - £ - £ - £ - £ 46 £ 45
Accounts payable
Accounts payable at 1 January £ 8 £ 11 £ 59 £ 193 £ - £ 1
Additions to accounts payable during the year 53 82 33,519 32,663 - 1
Repayments during the year (Footnote 4) (54) (85) (33,419) (32,797) - (2)
Accounts payable at 31 December £ 7 £ 8 £ 159 £ 59 £ - £ 0
Deposits received/subordinated loans
Deposits at 1 January £ 412 £ 671 £ 347 £ 322 £ - £ -
Deposits received during the year 545 577 419 430 - -
Deposits repaid during the year (Footnote 4) (412) (836) (436) (405) - -
Deposits at 31 December £ 545 £ 412 £ 330 £ 347 £ - £ -
Revenue
Interest supplements relating to loans and receivables £ - £ - £ 444 £ 455 £ - £ -
Interest supplements relating to operating leases - - 140 123 - -
Interest income relating to related parties - - 9 9 - -
Service fees received/(paid) (Footnote 1) (15) (13) (17) (17) 2 3
Expense
Interest expense on deposits £ 17 £ 4 £ 8 £ - £ - £ -
Interest expense 4 26 1 7 - -
Guarantees
Guarantees provided (Note 35) £ - £ - £ 512 £ 396 £ - £ -
Commitments to lend (Footnote 3) - - - - - -
Guarantees received - - 42 428 - -
Group tax relief (Footnote 2) £ - £ - £ 110 £ 82 £ - £ -
Dividends paid (Note 32) £ 370 £ 390 £ - £ - £ - £ -
Dividends received £ - £ - £ - £ - £ 4 £ 3
Derivatives
Derivatives year end positive fair value £ - £ - £ 7 £ 11 £ - £ -
Derivatives year end negative fair value - - 23 - - -
Jointly Controlled EntityGroupEntities under common
controlParent Undertakings
2011
£ mil £ mil £ mil
2010
£ mil£ mil
20112010 2011 2010
£ mil
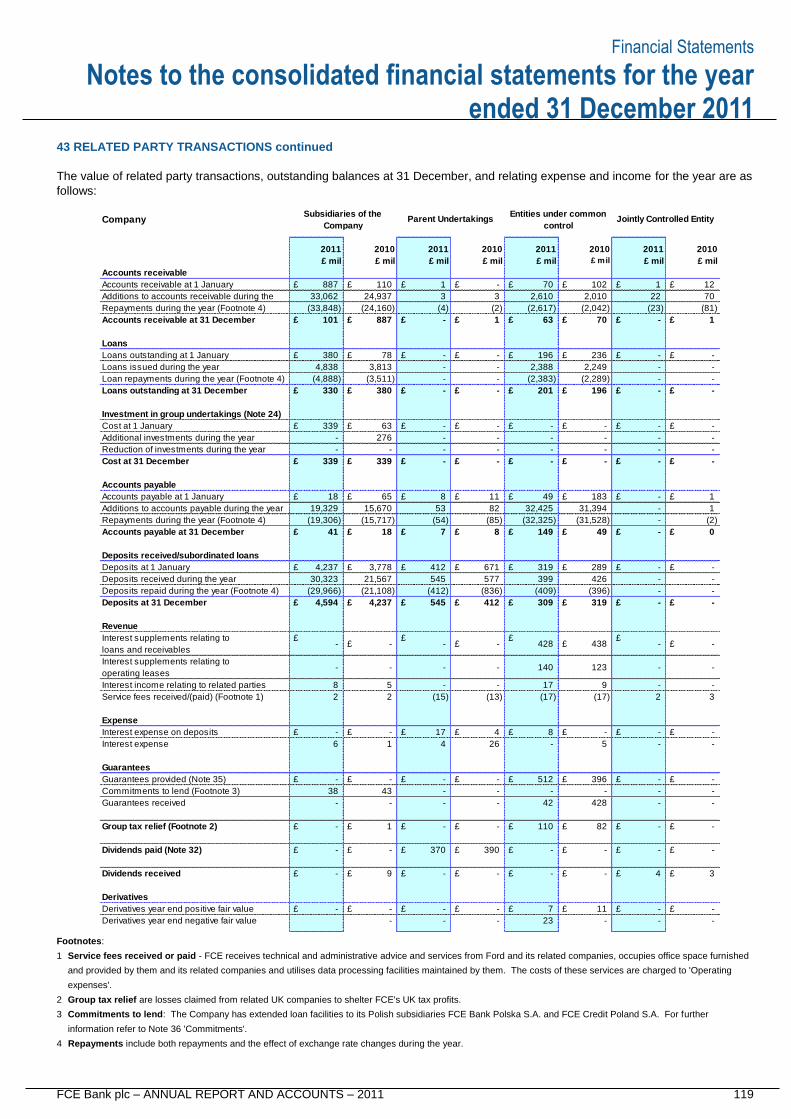
Financial Statements
FCE Bank plc – ANNUAL REPORT AND ACCOUNTS – 2011 119
Notes to the consolidated financial statements for the year ended 31 December 2011
43 RELATED PARTY TRANSACTIONS continued
The value of related party transactions, outstanding balances at 31 December, and relating expense and income for the year are as
follows:
Footnotes:
1 Service fees received or paid - FCE receives technical and administrative advice and services from Ford and its related companies, occupies office space furnished
and provided by them and its related companies and utilises data processing facilities maintained by them. The costs of these services are charged to 'Operating
expenses'.
2 Group tax relief are losses claimed from related UK companies to shelter FCE's UK tax profits.
3 Commitments to lend: The Company has extended loan facilities to its Polish subsidiaries FCE Bank Polska S.A. and FCE Credit Poland S.A. For further
information refer to Note 36 'Commitments'.
4 Repayments include both repayments and the effect of exchange rate changes during the year.
Accounts receivable
Accounts receivable at 1 January £ 887 £ 110 £ 1 £ - £ 70 £ 102 £ 1 £ 12
Additions to accounts receivable during the 33,062 24,937 3 3 2,610 2,010 22 70
Repayments during the year (Footnote 4) (33,848) (24,160) (4) (2) (2,617) (2,042) (23) (81)
Accounts receivable at 31 December £ 101 £ 887 £ - £ 1 £ 63 £ 70 £ - £ 1
Loans
Loans outstanding at 1 January £ 380 £ 78 £ - £ - £ 196 £ 236 £ - £ -
Loans issued during the year 4,838 3,813 - - 2,388 2,249 - -
Loan repayments during the year (Footnote 4) (4,888) (3,511) - - (2,383) (2,289) - -
Loans outstanding at 31 December £ 330 £ 380 £ - £ - £ 201 £ 196 £ - £ -
Investment in group undertakings (Note 24)
Cost at 1 January £ 339 £ 63 £ - £ - £ - £ - £ - £ -
Additional investments during the year - 276 - - - - - -
Reduction of investments during the year - - - - - - - -
Cost at 31 December £ 339 £ 339 £ - £ - £ - £ - £ - £ -
Accounts payable
Accounts payable at 1 January £ 18 £ 65 £ 8 £ 11 £ 49 £ 183 £ - £ 1
Additions to accounts payable during the year 19,329 15,670 53 82 32,425 31,394 - 1
Repayments during the year (Footnote 4) (19,306) (15,717) (54) (85) (32,325) (31,528) - (2)
Accounts payable at 31 December £ 41 £ 18 £ 7 £ 8 £ 149 £ 49 £ - £ 0
Deposits received/subordinated loans
Deposits at 1 January £ 4,237 £ 3,778 £ 412 £ 671 £ 319 £ 289 £ - £ -
Deposits received during the year 30,323 21,567 545 577 399 426 - -
Deposits repaid during the year (Footnote 4) (29,966) (21,108) (412) (836) (409) (396) - -
Deposits at 31 December £ 4,594 £ 4,237 £ 545 £ 412 £ 309 £ 319 £ - £ -
Revenue
Interest supplements relating to
loans and receivables
£ - £ -
£ - £ -
£ 428 £ 438
£ - £ -
Interest supplements relating to
operating leases - - - - 140 123 - -
Interest income relating to related parties 8 5 - - 17 9 - -
Service fees received/(paid) (Footnote 1) 2 2 (15) (13) (17) (17) 2 3
Expense
Interest expense on deposits £ - £ - £ 17 £ 4 £ 8 £ - £ - £ -
Interest expense 6 1 4 26 - 5 - -
Guarantees
Guarantees provided (Note 35) £ - £ - £ - £ - £ 512 £ 396 £ - £ -
Commitments to lend (Footnote 3) 38 43 - - - - - -
Guarantees received - - - - 42 428 - -
Group tax relief (Footnote 2) £ - £ 1 £ - £ - £ 110 £ 82 £ - £ -
Dividends paid (Note 32) £ - £ - £ 370 £ 390 £ - £ - £ - £ -
Dividends received £ - £ 9 £ - £ - £ - £ - £ 4 £ 3
Derivatives
Derivatives year end positive fair value £ - £ - £ - £ - £ 7 £ 11 £ - £ -
Derivatives year end negative fair value - - - 23 - - -
CompanySubsidiaries of the
Company
£ mil
2011
£ mil£ mil
2011 2010
£ mil
Jointly Controlled Entity
2011 2010
£ mil£ mil£ mil£ mil
Entities under common
control
2010
Parent Undertakings
20112010
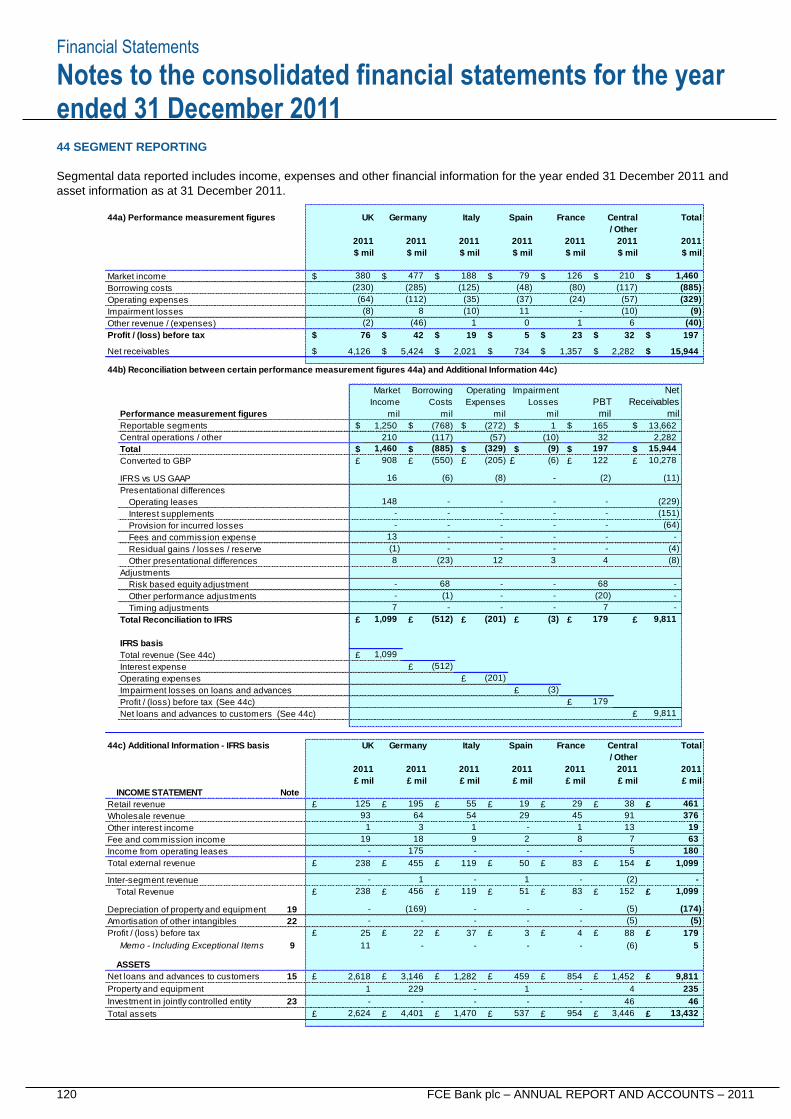
Financial Statements
120 FCE Bank plc – ANNUAL REPORT AND ACCOUNTS – 2011
Notes to the consolidated financial statements for the year ended 31 December 2011
44 SEGMENT REPORTING
Segmental data reported includes income, expenses and other financial information for the year ended 31 December 2011 and
asset information as at 31 December 2011.
44a) Performance measurement figures
Market income $ $ $ $ $ $ $
Borrowing costs
Operating expenses
Impairment losses
Other revenue / (expenses)
Profit / (loss) before tax $ $ $ $ $ $ $
Net receivables $ $ $ $ $ $ $
44b) Reconciliation between certain performance measurement figures 44a) and Additional Information 44c)
Net
PBT Receivables
Performance measurement figures mil mil
Reportable segments $ $ $ $ $ $
Central operations / other
Total $ $ $ $ $ $
Converted to GBP £ £ £ £ £ £
IFRS vs US GAAP
Presentational differences
Operating leases
Interest supplements
Provision for incurred losses
Fees and commission expense
Residual gains / losses / reserve
Other presentational differences
Adjustments
Risk based equity adjustment
Other performance adjustments
Timing adjustments
Total Reconciliation to IFRS £ £ £ £ £ £
IFRS basis
Total revenue (See 44c) £
Interest expense £
Operating expenses £
Impairment losses on loans and advances £
Profit / (loss) before tax (See 44c) £
Net loans and advances to customers (See 44c) £
44c) Additional Information - IFRS basis
INCOME STATEMENT Note
Retail revenue £ £ £ £ £ £ £
Wholesale revenue
Other interest income
Fee and commission income
Income from operating leases
Total external revenue £ £ £ £ £ £ £
Inter-segment revenue
Total Revenue £ £ £ £ £ £ £
Depreciation of property and equipment 19
Amortisation of other intangibles 22
Profit / (loss) before tax £ £ £ £ £ £ £
Memo - Including Exceptional Items 9
ASSETS
Net loans and advances to customers 15 £ £ £ £ £ £ £
Property and equipment
Investment in jointly controlled entity 23
Total assets £ £ £ £ £ £ £
Germany
2011
UK
4,126
(8)
2011
76
2011
$ mil
5,424
$ mil
(2)
(10)
(35)
380
(230)
1
8
(64)
188
(125)
2,021
$ mil
(285)
(112)
42
477
0
5 19
(46)
$ mil
11
Total
2011
(329)
210 1,460
$ mil
(885) (48)
$ mil
2011
$ mil
(117)
126
(80)
(57)
79
(37) (24)
Italy
734
(10)
2,282 1,357
23
6 1
32
France
2011
/ Other
Spain
2011
Central
- (9)
(40)
165
2011
France
45
(10)
19 29
(9) 197
32
- -
-
-
197
13,662
9,811
(229)
-
15,944
2,282
(64)
(4)
(8)
10,278
(11)
15,944
-
13,432 3,446
46 46
(174)
63
180
(5)
4
5
9,811
(6)
235
(5)
-
1,099
5
179 88
13 19
461
Central
2011
(2)
179
£ mil
83
-
122 (6)
(151)
£ mil
2011
83
-
2011
179
376
1,099
51
1
1
-
154
3
1,452
(5)
152
4
-
854
-
-
29
2
- (2)
50
1
7
125
1,470 4,401 954
-
-
537
- -
459
-
-
-
8
54
2,624
-
2,618
-
455
-
11 -
456
1,282
-
1
119
-
238
-
238
-
229
3,146
(169)
1
-
-
-
-
119
37
-
3
25
- -
22
175
1
18 19
1
9
64
(20)
7 -
-
(3)
-
-
7
93
£ mil £ mil
(512)
(512)
£ mil
-
1,099
1,099
Total
91
38
9,811
/ Other
55
4
- -
195
(3)
£ mil £ mil
-
-
68
3
-
-
-
- -
-
-
-
2011
UK
2011
ItalyGermany
2011
-
-
(201)
8
Spain
- (1)
(201)
12
Market
Income Costs
908
Operating
(8) 16
148
-
13
-
(550)
Losses
(57) (117)
(272)
mil
Expenses
1
(885) (329) 1,460
milmil mil
1,250 (768)
(205)
210
ImpairmentBorrowing
-
68
(6)
-
-
-
-
-
(1)
(23)
-
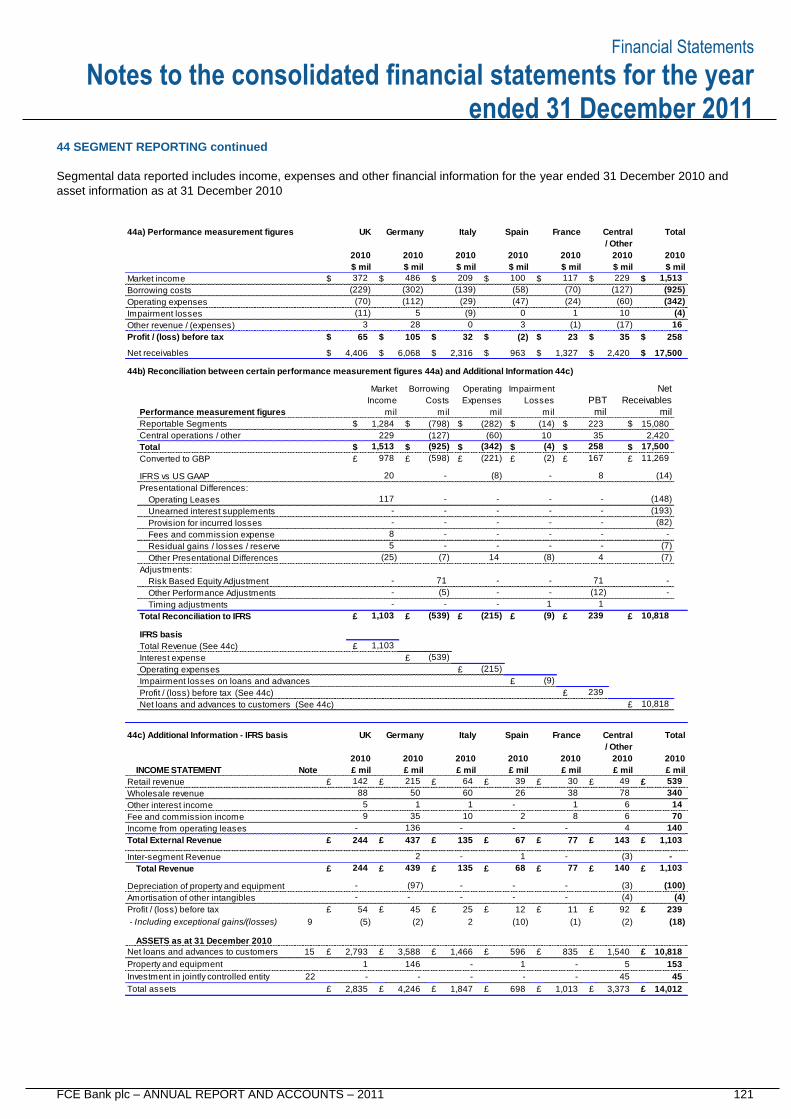
Financial Statements
FCE Bank plc – ANNUAL REPORT AND ACCOUNTS – 2011 121
Notes to the consolidated financial statements for the year ended 31 December 2011
44 SEGMENT REPORTING continued
Segmental data reported includes income, expenses and other financial information for the year ended 31 December 2010 and
asset information as at 31 December 2010
44a) Performance measurement figures
Market income $ $ $ $ $ $ $
Borrowing costs
Operating expenses
Impairment losses
Other revenue / (expenses)
Profit / (loss) before tax $ $ $ $ $ $ $
Net receivables $ $ $ $ $ $ $
44b) Reconciliation between certain performance measurement figures 44a) and Additional Information 44c)
Net
PBT Receivables
Performance measurement figures mil mil
Reportable Segments $ $ $ $ $ $
Central operations / other
Total $ $ $ $ $ $
Converted to GBP £ £ £ £ £ £
IFRS vs US GAAP
Presentational Differences:
Operating Leases
Unearned interest supplements
Provision for incurred losses
Fees and commission expense
Residual gains / losses / reserve
Other Presentational Differences
Adjustments:
Risk Based Equity Adjustment
Other Performance Adjustments
Timing adjustments
Total Reconciliation to IFRS £ £ £ £ £ £
IFRS basis
Total Revenue (See 44c) £
Interest expense £
Operating expenses £
Impairment losses on loans and advances £
Profit / (loss) before tax (See 44c) £
Net loans and advances to customers (See 44c) £
44c) Additional Information - IFRS basis
INCOME STATEMENT Note
Retail revenue £ £ £ £ £ £ £
Wholesale revenue
Other interest income
Fee and commission income
Income from operating leases
Total External Revenue £ £ £ £ £ £ £
Inter-segment Revenue
Total Revenue £ £ £ £ £ £ £
Depreciation of property and equipment
Amortisation of other intangibles
Profit / (loss) before tax £ £ £ £ £ £ £
- Including exceptional gains/(losses) 9
ASSETS as at 31 December 2010
Net loans and advances to customers 15 £ £ £ £ £ £ £
Property and equipment
Investment in jointly controlled entity 22
Total assets £ £ £ £ £ £ £ 14,012 4,246 2,835
-
1,466
-
3,373 1,013 698 1,847
- 146
-
5 1
3,588 2,793
1
45 45
71 71 -
-
26
135 68
596
(10)
12
2
-
-
-
-
(2)
153
10,818 1,540 835
-
- - -
(7)
- 1
239
4
(5)
25
£ mil
2010 2010
64
-
-
30
38 50
£ mil
60
France
-
-
-
-
-
-
(8)
-
1,103
-
(215) (539)
(5)
8
5
-
-
(25)
- -
-
-
10
8
-
- -
-
(8)
-
-
- -
117
-
-
- -
-
14
20
54
6
1,103
£ mil
(539)
35
1
244
2
439
136
45
-
- -
(97) -
244
Germany
2010
1
2010
UK
£ mil
215
1
67
-
2
39
437
9
5
88
142
£ mil
(18)
(3)
140
(2) (1)
239
(100)
(4) (4)
11 92
-
-
1,103
-
77
(3)
1,513
(342)
(4)
(925)
229
-
77 143
4
(2)
539
340
10,818
/ Other
117
(127)
1 10
(17)
35 23 (2)
(70)
(60) (24)
100
(47)
0
3
(58)
Total
2010
$ mil$ mil
Spain
2010
$ mil
2010
Central
/ Other
France
2010
$ mil
(221) 11,269
17,500
167
2,420 35 10
-
£ mil
2010
TotalCentral
(14)
10,818
(148)
(82)
1
2010
-
(7)
-
(193)
-
-
-
2010
372
1,103
78
49
70
Spain
239
(7)
(9)
- (12)
6
(215)
2010
Italy
(9)
1
8
14
£ mil
140
135
Germany
2010
Market
(11) 5
65
4,406
UK
2010
(229)
(70)
(302)
Italy
(139)
209
$ mil
978
(342) (925)
(127)
(598)
$ mil $ mil
486
(9)
(29) (112)
229
28
105
2,316
Operating
1,284 (798)
6,068
Borrowing
Costs
mil
Expenses
(282)
(60)
2,420
(1)
258
16
17,500
258 1,513
Income
mil
3
1,327
Impairment
mil
Losses
mil
963
0
32
(14)
(4)
15,080 223
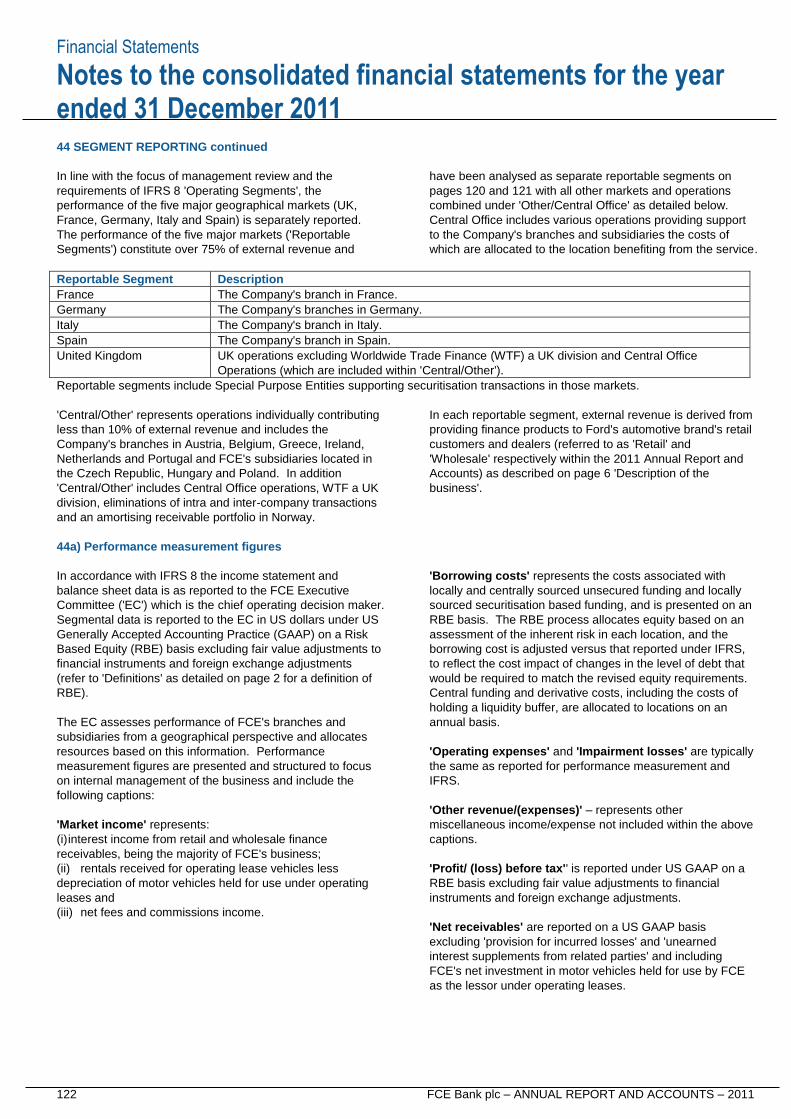
Financial Statements
122 FCE Bank plc – ANNUAL REPORT AND ACCOUNTS – 2011
Notes to the consolidated financial statements for the year ended 31 December 2011
44 SEGMENT REPORTING continued
In line with the focus of management review and the
requirements of IFRS 8 'Operating Segments', the
performance of the five major geographical markets (UK,
France, Germany, Italy and Spain) is separately reported.
The performance of the five major markets ('Reportable
Segments') constitute over 75% of external revenue and
have been analysed as separate reportable segments on
pages 120 and 121 with all other markets and operations
combined under 'Other/Central Office' as detailed below.
Central Office includes various operations providing support
to the Company's branches and subsidiaries the costs of
which are allocated to the location benefiting from the service.
Reportable Segment Description
France The Company's branch in France.
Germany The Company's branches in Germany.
Italy The Company's branch in Italy.
Spain The Company's branch in Spain.
United Kingdom UK operations excluding Worldwide Trade Finance (WTF) a UK division and Central Office
Operations (which are included within 'Central/Other').
Reportable segments include Special Purpose Entities supporting securitisation transactions in those markets.
'Central/Other' represents operations individually contributing
less than 10% of external revenue and includes the
Company's branches in Austria, Belgium, Greece, Ireland,
Netherlands and Portugal and FCE's subsidiaries located in
the Czech Republic, Hungary and Poland. In addition
'Central/Other' includes Central Office operations, WTF a UK
division, eliminations of intra and inter-company transactions
and an amortising receivable portfolio in Norway.
In each reportable segment, external revenue is derived from
providing finance products to Ford's automotive brand's retail
customers and dealers (referred to as 'Retail' and
'Wholesale' respectively within the 2011 Annual Report and
Accounts) as described on page 6 'Description of the
business'.
44a) Performance measurement figures
In accordance with IFRS 8 the income statement and
balance sheet data is as reported to the FCE Executive
Committee ('EC') which is the chief operating decision maker.
Segmental data is reported to the EC in US dollars under US
Generally Accepted Accounting Practice (GAAP) on a Risk
Based Equity (RBE) basis excluding fair value adjustments to
financial instruments and foreign exchange adjustments
(refer to 'Definitions' as detailed on page 2 for a definition of
RBE).
The EC assesses performance of FCE's branches and
subsidiaries from a geographical perspective and allocates
resources based on this information. Performance
measurement figures are presented and structured to focus
on internal management of the business and include the
following captions:
'Market income' represents:
(i) interest income from retail and wholesale finance
receivables, being the majority of FCE's business;
(ii) rentals received for operating lease vehicles less
depreciation of motor vehicles held for use under operating
leases and
(iii) net fees and commissions income.
'Borrowing costs' represents the costs associated with
locally and centrally sourced unsecured funding and locally
sourced securitisation based funding, and is presented on an
RBE basis. The RBE process allocates equity based on an
assessment of the inherent risk in each location, and the
borrowing cost is adjusted versus that reported under IFRS,
to reflect the cost impact of changes in the level of debt that
would be required to match the revised equity requirements.
Central funding and derivative costs, including the costs of
holding a liquidity buffer, are allocated to locations on an
annual basis.
'Operating expenses' and 'Impairment losses' are typically
the same as reported for performance measurement and
IFRS.
'Other revenue/(expenses)' – represents other
miscellaneous income/expense not included within the above
captions.
'Profit/ (loss) before tax'' is reported under US GAAP on a
RBE basis excluding fair value adjustments to financial
instruments and foreign exchange adjustments.
'Net receivables' are reported on a US GAAP basis
excluding 'provision for incurred losses' and 'unearned
interest supplements from related parties' and including
FCE's net investment in motor vehicles held for use by FCE
as the lessor under operating leases.
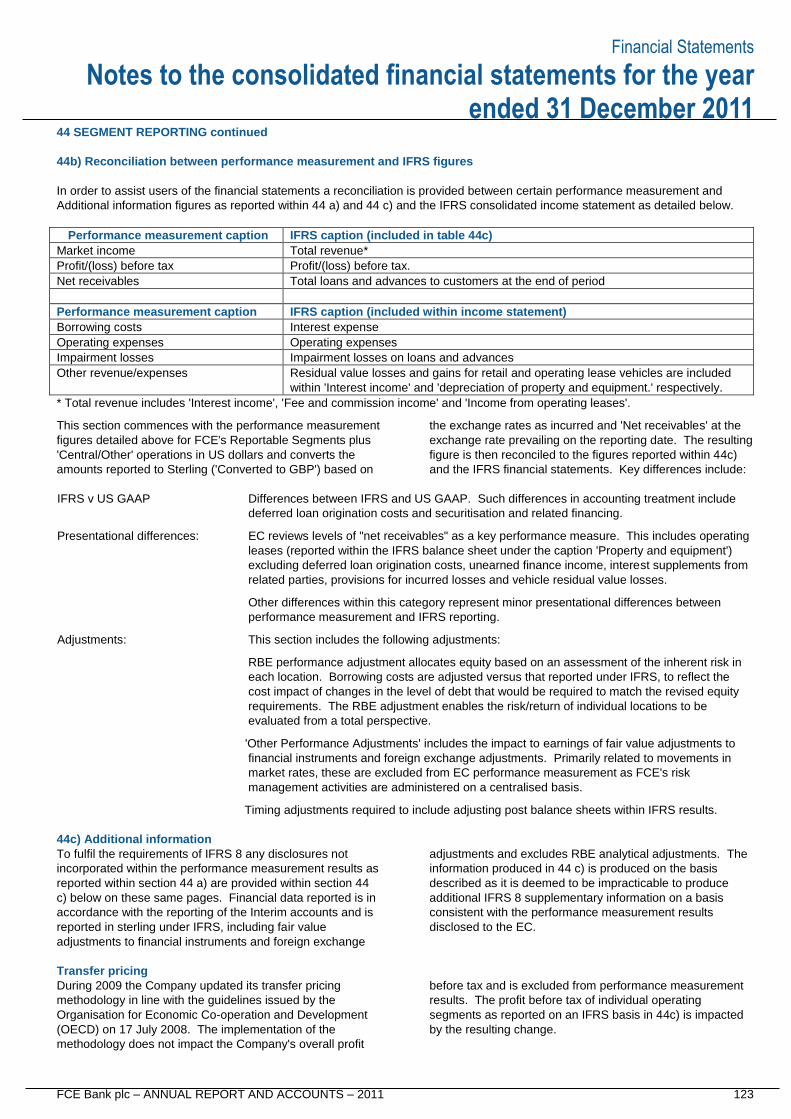
Financial Statements
FCE Bank plc – ANNUAL REPORT AND ACCOUNTS – 2011 123
Notes to the consolidated financial statements for the year ended 31 December 2011
44 SEGMENT REPORTING continued
44b) Reconciliation between performance measurement and IFRS figures
In order to assist users of the financial statements a reconciliation is provided between certain performance measurement and
Additional information figures as reported within 44 a) and 44 c) and the IFRS consolidated income statement as detailed below.
Performance measurement caption IFRS caption (included in table 44c)
Market income Total revenue*
Profit/(loss) before tax Profit/(loss) before tax.
Net receivables Total loans and advances to customers at the end of period
Performance measurement caption IFRS caption (included within income statement)
Borrowing costs Interest expense
Operating expenses Operating expenses
Impairment losses Impairment losses on loans and advances
Other revenue/expenses Residual value losses and gains for retail and operating lease vehicles are included
within 'Interest income' and 'depreciation of property and equipment.' respectively.
* Total revenue includes 'Interest income', 'Fee and commission income' and 'Income from operating leases'.
This section commences with the performance measurement
figures detailed above for FCE's Reportable Segments plus
'Central/Other' operations in US dollars and converts the
amounts reported to Sterling ('Converted to GBP') based on
the exchange rates as incurred and 'Net receivables' at the
exchange rate prevailing on the reporting date. The resulting
figure is then reconciled to the figures reported within 44c)
and the IFRS financial statements. Key differences include:
IFRS v US GAAP Differences between IFRS and US GAAP. Such differences in accounting treatment include
deferred loan origination costs and securitisation and related financing.
Presentational differences: EC reviews levels of "net receivables" as a key performance measure. This includes operating
leases (reported within the IFRS balance sheet under the caption 'Property and equipment')
excluding deferred loan origination costs, unearned finance income, interest supplements from
related parties, provisions for incurred losses and vehicle residual value losses.
Other differences within this category represent minor presentational differences between
performance measurement and IFRS reporting.
Adjustments: This section includes the following adjustments:
RBE performance adjustment allocates equity based on an assessment of the inherent risk in
each location. Borrowing costs are adjusted versus that reported under IFRS, to reflect the
cost impact of changes in the level of debt that would be required to match the revised equity
requirements. The RBE adjustment enables the risk/return of individual locations to be
evaluated from a total perspective.
'Other Performance Adjustments' includes the impact to earnings of fair value adjustments to
financial instruments and foreign exchange adjustments. Primarily related to movements in
market rates, these are excluded from EC performance measurement as FCE's risk
management activities are administered on a centralised basis.
Timing adjustments required to include adjusting post balance sheets within IFRS results.
44c) Additional information
To fulfil the requirements of IFRS 8 any disclosures not
incorporated within the performance measurement results as
reported within section 44 a) are provided within section 44
c) below on these same pages. Financial data reported is in
accordance with the reporting of the Interim accounts and is
reported in sterling under IFRS, including fair value
adjustments to financial instruments and foreign exchange
adjustments and excludes RBE analytical adjustments. The
information produced in 44 c) is produced on the basis
described as it is deemed to be impracticable to produce
additional IFRS 8 supplementary information on a basis
consistent with the performance measurement results
disclosed to the EC.
Transfer pricing
During 2009 the Company updated its transfer pricing
methodology in line with the guidelines issued by the
Organisation for Economic Co-operation and Development
(OECD) on 17 July 2008. The implementation of the
methodology does not impact the Company's overall profit
before tax and is excluded from performance measurement
results. The profit before tax of individual operating
segments as reported on an IFRS basis in 44c) is impacted
by the resulting change.
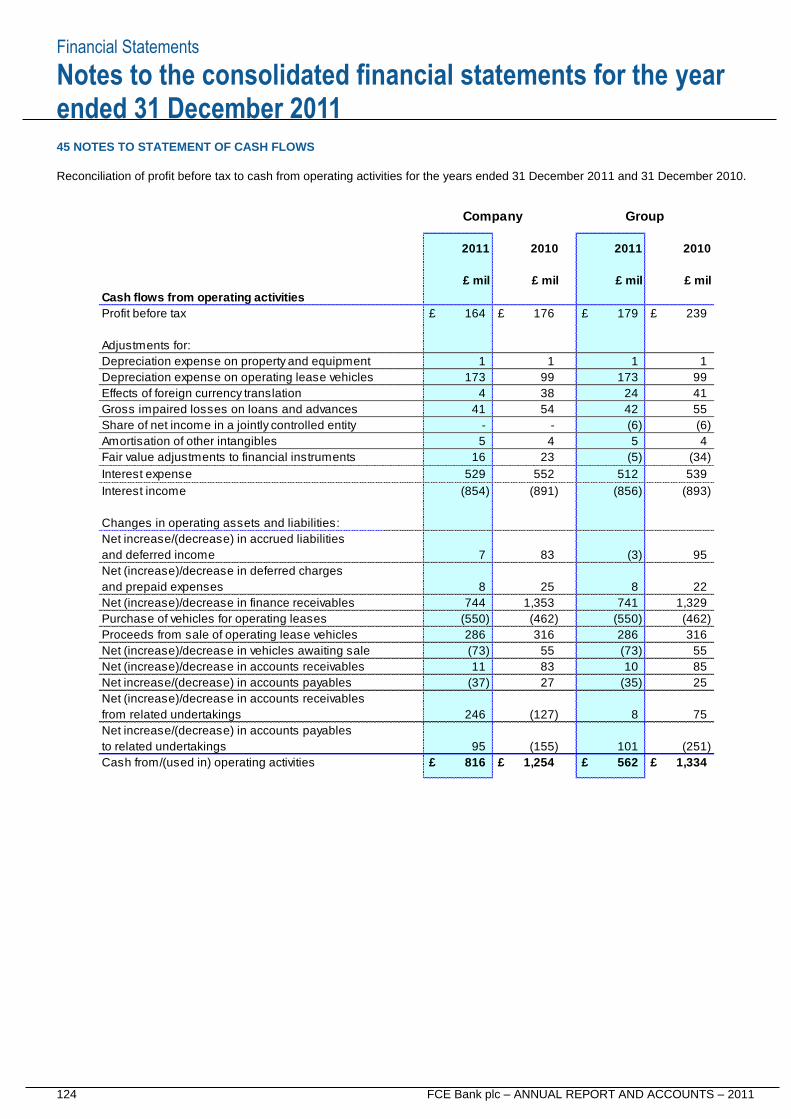
Financial Statements
124 FCE Bank plc – ANNUAL REPORT AND ACCOUNTS – 2011
Notes to the consolidated financial statements for the year ended 31 December 2011
45 NOTES TO STATEMENT OF CASH FLOWS
Reconciliation of profit before tax to cash from operating activities for the years ended 31 December 2011 and 31 December 2010.
Cash flows from operating activities
Profit before tax £ 164 £ 176 £ 179 £ 239
Adjustments for:
Depreciation expense on property and equipment 1 1 1 1
Depreciation expense on operating lease vehicles 173 99 173 99
Effects of foreign currency translation 4 38 24 41
Gross impaired losses on loans and advances 41 54 42 55
Share of net income in a jointly controlled entity - - (6) (6)
Amortisation of other intangibles 5 4 5 4
Fair value adjustments to financial instruments 16 23 (5) (34)
Interest expense 529 552 512 539
Interest income (854) (891) (856) (893)
Changes in operating assets and liabilities:
Net increase/(decrease) in accrued liabilities
and deferred income 7 83 (3) 95
Net (increase)/decrease in deferred charges
and prepaid expenses 8 25 8 22
Net (increase)/decrease in finance receivables 744 1,353 741 1,329
Purchase of vehicles for operating leases (550) (462) (550) (462)
Proceeds from sale of operating lease vehicles 286 316 286 316
Net (increase)/decrease in vehicles awaiting sale (73) 55 (73) 55
Net (increase)/decrease in accounts receivables 11 83 10 85
Net increase/(decrease) in accounts payables (37) 27 (35) 25
Net (increase)/decrease in accounts receivables
from related undertakings 246 (127) 8 75
Net increase/(decrease) in accounts payables
to related undertakings 95 (155) 101 (251)
Cash from/(used in) operating activities £ 816 £ 1,254 £ 562 £ 1,334
£ mil£ mil£ mil
2010
£ mil
Company Group
2011 20102011
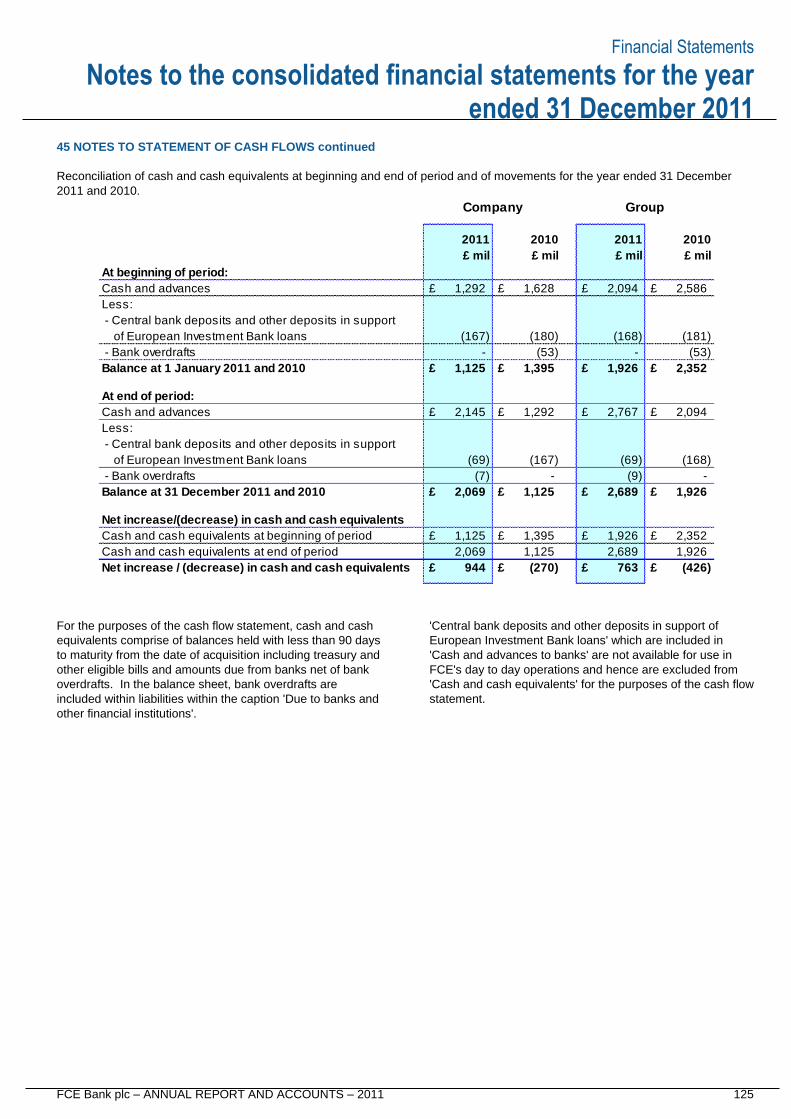
Financial Statements
FCE Bank plc – ANNUAL REPORT AND ACCOUNTS – 2011 125
Notes to the consolidated financial statements for the year ended 31 December 2011
45 NOTES TO STATEMENT OF CASH FLOWS continued
Reconciliation of cash and cash equivalents at beginning and end of period and of movements for the year ended 31 December
2011 and 2010.
For the purposes of the cash flow statement, cash and cash
equivalents comprise of balances held with less than 90 days
to maturity from the date of acquisition including treasury and
other eligible bills and amounts due from banks net of bank
overdrafts. In the balance sheet, bank overdrafts are
included within liabilities within the caption 'Due to banks and
other financial institutions'.
'Central bank deposits and other deposits in support of
European Investment Bank loans' which are included in
'Cash and advances to banks' are not available for use in
FCE's day to day operations and hence are excluded from
'Cash and cash equivalents' for the purposes of the cash flow
statement.
At beginning of period:
Cash and advances £ 1,292 £ 1,628 £ 2,094 £ 2,586
Less:
- Central bank deposits and other deposits in support
of European Investment Bank loans (167) (180) (168) (181)
- Bank overdrafts - (53) - (53)
Balance at 1 January 2011 and 2010 £ 1,125 £ 1,395 £ 1,926 £ 2,352
At end of period:
Cash and advances £ 2,145 £ 1,292 £ 2,767 £ 2,094
Less:
- Central bank deposits and other deposits in support
of European Investment Bank loans (69) (167) (69) (168)
- Bank overdrafts (7) - (9) -
Balance at 31 December 2011 and 2010 £ 2,069 £ 1,125 £ 2,689 £ 1,926
Net increase/(decrease) in cash and cash equivalents
Cash and cash equivalents at beginning of period £ 1,125 £ 1,395 £ 1,926 £ 2,352
Cash and cash equivalents at end of period 2,069 1,125 2,689 1,926
Net increase / (decrease) in cash and cash equivalents £ 944 £ (270) £ 763 £ (426)
£ mil £ mil £ mil £ mil
Company Group
2011 2010 2011 2010
Financial Statements
126 FCE Bank plc – ANNUAL REPORT AND ACCOUNTS – 2011
Notes to the consolidated financial statements for the year ended 31 December 2011
46 FCE AND OTHER RELATED PARTY INFORMATION
Domicile: United Kingdom (UK).
Legal form: The Company is a regulated bank, authorised as
a deposit taking business and insurance intermediary under
the Financial Services and Markets Act of 2000 and is
regulated by the UK Financial Services Authority. The
Company also holds a standard license under the UK
Consumer Credit Act of 1974 and other licenses to conduct
financing business in other European locations. In addition
to the UK, the Company has branches in 11 other European
countries having exercised passport rights to undertake
regulated activities in these countries pursuant to the
Banking Consolidation and Insurance Mediation Directives.
Country of registration: The Company is a public limited
company incorporated and registered in England and Wales.
Registered office: Central Office - Eagle Way, Brentwood,
Essex, CM13 3AR. Registered in England and Wales no
772784.
The Company has six UK subsidiaries (see Note 24
'Investments in group undertakings'), five of which share the
same registered office as the Company.
Volvo Car Finance Limited has its registered office at:
Globe Park,
Marlow,
Buckinghamshire,
SL7 1YQ
In addition the Company has subsidiaries in the Czech
Republic, Hungary and Poland and Sweden and a joint
venture in the Nordic region - refer to 'European Operating
Locations' on page 129 for addresses of the Company's
European branches and subsidiaries.
Nature of operations and principal activities: FCE's primary
business is to support the sale of Ford and affiliated
manufacturer's vehicles in Europe through the respective
dealer networks. A variety of retail, leasing and wholesale
finance plans are provided in the markets which FCE
operates.
In European markets, FCE offers most of its products and
services under the Ford Credit or Ford Bank brands–refer to
European Operating Locations on page 129 for further
details. The Company through its Worldwide Trade Finance
(WTF) division provides financing to importers and
distributors in countries where typically there is no
established local Ford presence. WTF currently provides
finance in nearly 70 countries. In addition there are private
label operations in some European markets.
Immediate parent undertaking: The Company's immediate
parent undertaking is Ford Credit International Inc. (FCI).
FCI does not produce consolidated accounts being wholly
owned by, and consolidated into the accounts of Ford Motor
Credit Company LLC (Ford Credit). For further details refer
to Note 31 ‘Ordinary shares and share premium’.
Ultimate parent undertaking: The ultimate parent undertaking
and controlling party is Ford Motor Company (Ford). All
three companies (Ford, FCI and Ford Credit) are
incorporated in the United States of America.
Copies of the consolidated accounts for Ford Credit and Ford
may be obtained from Ford Motor Company (US), One
American Road, Dearborn, Michigan 48126, United States of
America.
47 POST BALANCE SHEET EVENTS
There were no post balance sheet events.
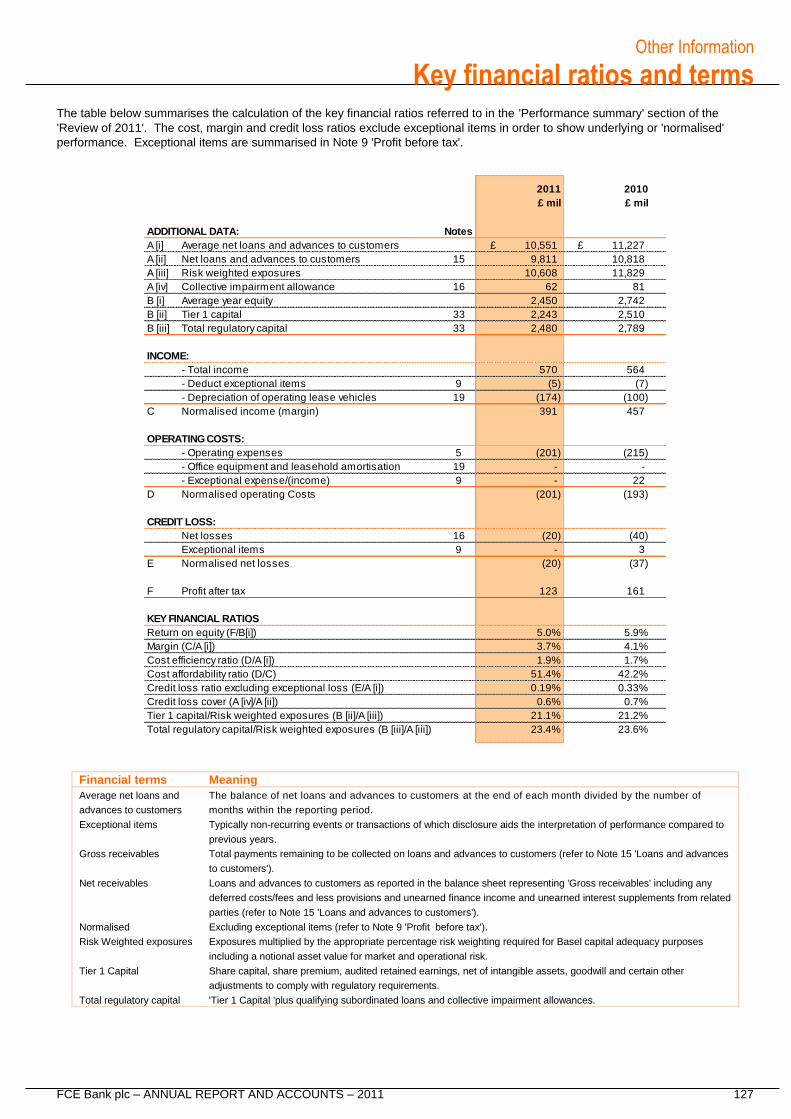
Other Information
FCE Bank plc – ANNUAL REPORT AND ACCOUNTS – 2011 127
Key financial ratios and terms
The table below summarises the calculation of the key financial ratios referred to in the 'Performance summary' section of the
'Review of 2011'. The cost, margin and credit loss ratios exclude exceptional items in order to show underlying or 'normalised'
performance. Exceptional items are summarised in Note 9 'Profit before tax'.
Financial terms Meaning
Average net loans and
advances to customers
The balance of net loans and advances to customers at the end of each month divided by the number of
months within the reporting period.
Exceptional items Typically non-recurring events or transactions of which disclosure aids the interpretation of performance compared to
previous years.
Gross receivables Total payments remaining to be collected on loans and advances to customers (refer to Note 15 'Loans and advances
to customers').
Net receivables Loans and advances to customers as reported in the balance sheet representing 'Gross receivables' including any
deferred costs/fees and less provisions and unearned finance income and unearned interest supplements from related
parties (refer to Note 15 'Loans and advances to customers').
Normalised Excluding exceptional items (refer to Note 9 'Profit before tax').
Risk Weighted exposures Exposures multiplied by the appropriate percentage risk weighting required for Basel capital adequacy purposes
including a notional asset value for market and operational risk.
Tier 1 Capital Share capital, share premium, audited retained earnings, net of intangible assets, goodwill and certain other
adjustments to comply with regulatory requirements.
Total regulatory capital 'Tier 1 Capital 'plus qualifying subordinated loans and collective impairment allowances.
ADDITIONAL DATA: Notes
A [i] Average net loans and advances to customers £ 10,551 £ 11,227
A [ii] Net loans and advances to customers 15 9,811 10,818
A [iii] Risk weighted exposures 10,608 11,829
A [iv] Collective impairment allowance 16 62 81
B [i] Average year equity 2,450 2,742
B [ii] Tier 1 capital 33 2,243 2,510
B [iii] Total regulatory capital 33 2,480 2,789
INCOME:
- Total income 570 564
- Deduct exceptional items 9 (5) (7)
- Depreciation of operating lease vehicles 19 (174) (100)
C Normalised income (margin) 391 457
OPERATING COSTS:
- Operating expenses 5 (201) (215)
- Office equipment and leasehold amortisation 19 - -
- Exceptional expense/(income) 9 - 22
D Normalised operating Costs (201) (193)
CREDIT LOSS:
Net losses 16 (20) (40)
Exceptional items 9 - 3
E Normalised net losses (20) (37)
F Profit after tax 123 161
KEY FINANCIAL RATIOS
Return on equity (F/B[i]) 5.0% 5.9%
Margin (C/A [i]) 3.7% 4.1%
Cost efficiency ratio (D/A [i]) 1.9% 1.7%
Cost affordability ratio (D/C) 51.4% 42.2%
Credit loss ratio excluding exceptional loss (E/A [i]) 0.19% 0.33%
Credit loss cover (A [iv]/A [ii]) 0.6% 0.7%
Tier 1 capital/Risk weighted exposures (B [ii]/A [iii]) 21.1% 21.2%
Total regulatory capital/Risk weighted exposures (B [iii]/A [iii]) 23.4% 23.6%
2011
£ mil£ mil
2010
Other Information
128 FCE Bank plc – ANNUAL REPORT AND ACCOUNTS – 2011
Website addresses
Additional data and web resources, including those listed below, can be obtained from the following web addresses:
Additional data Website addresses
FCE Bank plc.
'Annual Report'
'Interim Report'
‘Basel Pillar 3 Report'
‘Management Statement'
http://www.fcebank.com
or
http://www.fordfinancialeurope.com
To access from the above links click on 'Investor
Information'
Ford Motor Company (Ultimate Parent Company) including:
'Financial Results'
'Annual Reports'
'US SEC EDGAR filings' Footnote 1 and 2
http://www.ford.com/about-ford/investor-relations
To access from the above link click on 'Company
Reports'.
Ford Motor Credit Company including:
'Company Reports' Footnote 2
'Press Releases'
'Ford Credit public asset-backed securities transactions' Footnote 3
http://www.fordcredit.com/investorcenter
To access from the above link click on 'Company
Reports' and then required item.
Luxembourg's Stock Exchange which includes
Euro Medium Term Note Base Prospectus
(refer to Note 28 'Debt securities in issue').
www.bourse.lu
To access search for 'FCE'
Financial Reporting Council
The Combined Code on Corporate Governance
http://www.frc.org.uk
Additional information
Footnote 1: Securities and Exchange Commission (SEC) Electronic Data Gathering and Retrieval (EDGAR)
Footnote 2: SEC filings include both SEC Form 10K Annual report and SEC Form 10Q Quarterly reports.
Footnote 3: 'Ford Credit public asset-backed securities transactions'. Incorporates European retail public
securitisation data including the following report types:
Offering Circulars
Monthly Rating Agencies Report
Monthly Payments Notification
Monthly Note holders' Statement
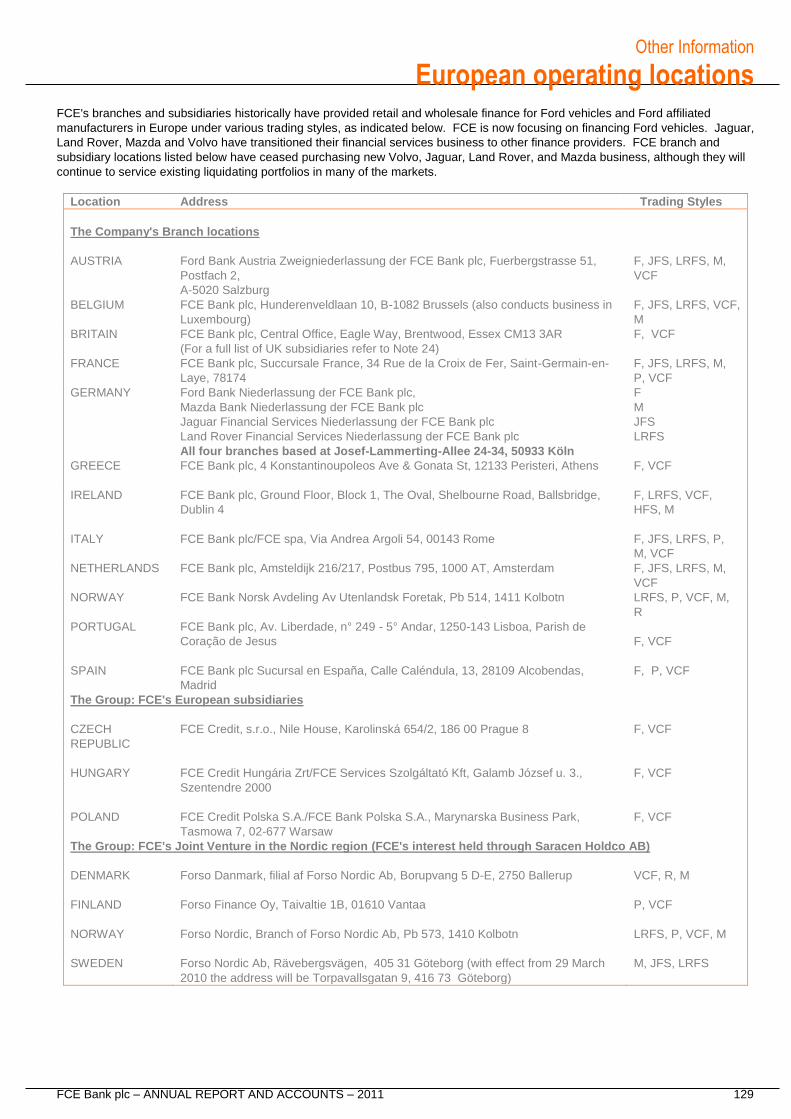
Other Information
FCE Bank plc – ANNUAL REPORT AND ACCOUNTS – 2011 129
European operating locations
FCE's branches and subsidiaries historically have provided retail and wholesale finance for Ford vehicles and Ford affiliated
manufacturers in Europe under various trading styles, as indicated below. FCE is now focusing on financing Ford vehicles. Jaguar,
Land Rover, Mazda and Volvo have transitioned their financial services business to other finance providers. FCE branch and
subsidiary locations listed below have ceased purchasing new Volvo, Jaguar, Land Rover, and Mazda business, although they will
continue to service existing liquidating portfolios in many of the markets.
Location Address Trading Styles
The Company's Branch locations
AUSTRIA Ford Bank Austria Zweigniederlassung der FCE Bank plc, Fuerbergstrasse 51,
Postfach 2,
A-5020 Salzburg
F, JFS, LRFS, M,
VCF
BELGIUM FCE Bank plc, Hunderenveldlaan 10, B-1082 Brussels (also conducts business in
Luxembourg)
F, JFS, LRFS, VCF,
M
BRITAIN FCE Bank plc, Central Office, Eagle Way, Brentwood, Essex CM13 3AR
(For a full list of UK subsidiaries refer to Note 24)
F, VCF
FRANCE FCE Bank plc, Succursale France, 34 Rue de la Croix de Fer, Saint-Germain-en-
Laye, 78174
F, JFS, LRFS, M,
P, VCF
GERMANY Ford Bank Niederlassung der FCE Bank plc,
Mazda Bank Niederlassung der FCE Bank plc
Jaguar Financial Services Niederlassung der FCE Bank plc
Land Rover Financial Services Niederlassung der FCE Bank plc
All four branches based at Josef-Lammerting-Allee 24-34, 50933 Köln
F
M
JFS
LRFS
GREECE FCE Bank plc, 4 Konstantinoupoleos Ave & Gonata St, 12133 Peristeri, Athens
F, VCF
IRELAND FCE Bank plc, Ground Floor, Block 1, The Oval, Shelbourne Road, Ballsbridge,
Dublin 4
F, LRFS, VCF,
HFS, M
ITALY FCE Bank plc/FCE spa, Via Andrea Argoli 54, 00143 Rome
F, JFS, LRFS, P,
M, VCF
NETHERLANDS FCE Bank plc, Amsteldijk 216/217, Postbus 795, 1000 AT, Amsterdam F, JFS, LRFS, M,
VCF
NORWAY
PORTUGAL
FCE Bank Norsk Avdeling Av Utenlandsk Foretak, Pb 514, 1411 Kolbotn
FCE Bank plc, Av. Liberdade, n° 249 - 5° Andar, 1250-143 Lisboa, Parish de
Coração de Jesus
LRFS, P, VCF, M,
R
F, VCF
SPAIN FCE Bank plc Sucursal en España, Calle Caléndula, 13, 28109 Alcobendas,
Madrid
F, P, VCF
The Group: FCE's European subsidiaries
CZECH
REPUBLIC
FCE Credit, s.r.o., Nile House, Karolinská 654/2, 186 00 Prague 8
F, VCF
HUNGARY FCE Credit Hungária Zrt/FCE Services Szolgáltató Kft, Galamb József u. 3.,
Szentendre 2000
F, VCF
POLAND FCE Credit Polska S.A./FCE Bank Polska S.A., Marynarska Business Park,
Tasmowa 7, 02-677 Warsaw
F, VCF
The Group: FCE's Joint Venture in the Nordic region (FCE's interest held through Saracen Holdco AB)
DENMARK Forso Danmark, filial af Forso Nordic Ab, Borupvang 5 D-E, 2750 Ballerup
VCF, R, M
FINLAND
Forso Finance Oy, Taivaltie 1B, 01610 Vantaa
P, VCF
NORWAY Forso Nordic, Branch of Forso Nordic Ab, Pb 573, 1410 Kolbotn
LRFS, P, VCF, M
SWEDEN Forso Nordic Ab, Rävebergsvägen, 405 31 Göteborg (with effect from 29 March
2010 the address will be Torpavallsgatan 9, 416 73 Göteborg)
M, JFS, LRFS
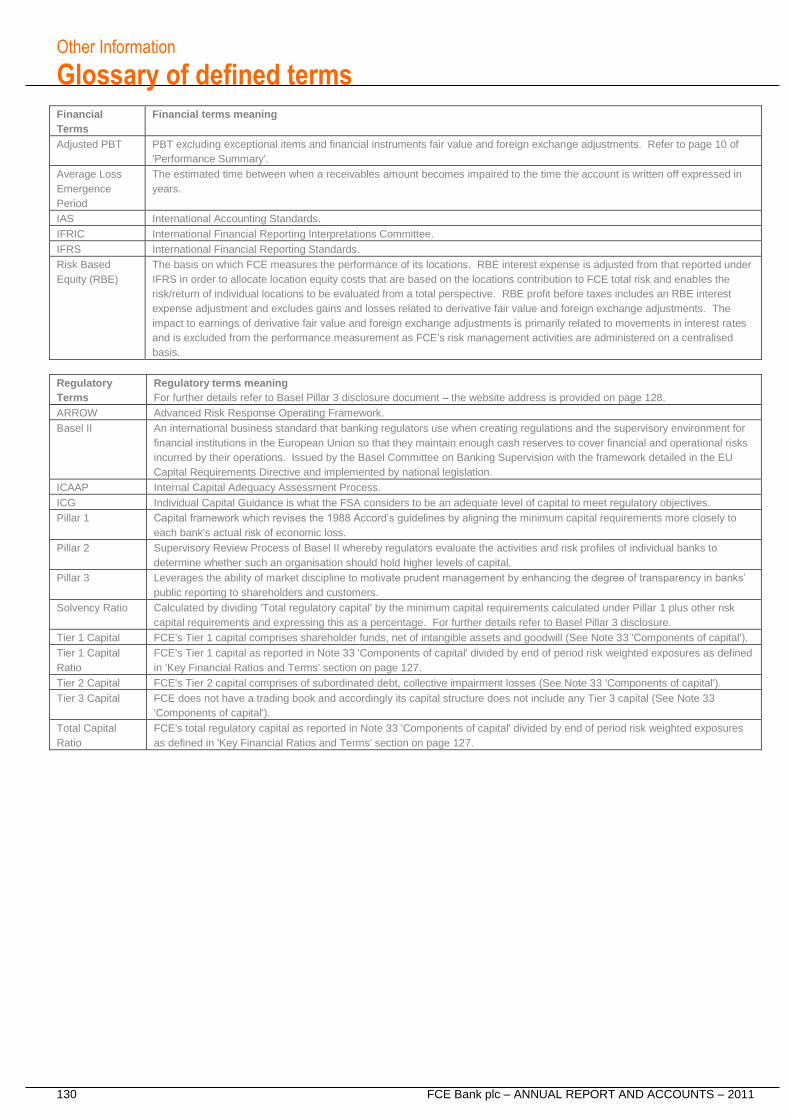
Other Information
130 FCE Bank plc – ANNUAL REPORT AND ACCOUNTS – 2011
Glossary of defined terms
Financial
Terms
Financial terms meaning
Adjusted PBT PBT excluding exceptional items and financial instruments fair value and foreign exchange adjustments. Refer to page 10 of
'Performance Summary'.
Average Loss
Emergence
Period
The estimated time between when a receivables amount becomes impaired to the time the account is written off expressed in
years.
IAS International Accounting Standards.
IFRIC International Financial Reporting Interpretations Committee.
IFRS International Financial Reporting Standards.
Risk Based
Equity (RBE)
The basis on which FCE measures the performance of its locations. RBE interest expense is adjusted from that reported under
IFRS in order to allocate location equity costs that are based on the locations contribution to FCE total risk and enables the
risk/return of individual locations to be evaluated from a total perspective. RBE profit before taxes includes an RBE interest
expense adjustment and excludes gains and losses related to derivative fair value and foreign exchange adjustments. The
impact to earnings of derivative fair value and foreign exchange adjustments is primarily related to movements in interest rates
and is excluded from the performance measurement as FCE's risk management activities are administered on a centralised
basis.
Regulatory
Terms
Regulatory terms meaning
For further details refer to Basel Pillar 3 disclosure document – the website address is provided on page 128.
ARROW Advanced Risk Response Operating Framework.
Basel II An international business standard that banking regulators use when creating regulations and the supervisory environment for
financial institutions in the European Union so that they maintain enough cash reserves to cover financial and operational risks
incurred by their operations. Issued by the Basel Committee on Banking Supervision with the framework detailed in the EU
Capital Requirements Directive and implemented by national legislation.
ICAAP Internal Capital Adequacy Assessment Process.
ICG Individual Capital Guidance is what the FSA considers to be an adequate level of capital to meet regulatory objectives.
Pillar 1 Capital framework which revises the 1988 Accord’s guidelines by aligning the minimum capital requirements more closely to
each bank's actual risk of economic loss.
Pillar 2 Supervisory Review Process of Basel II whereby regulators evaluate the activities and risk profiles of individual banks to
determine whether such an organisation should hold higher levels of capital.
Pillar 3 Leverages the ability of market discipline to motivate prudent management by enhancing the degree of transparency in banks’
public reporting to shareholders and customers.
Solvency Ratio Calculated by dividing 'Total regulatory capital' by the minimum capital requirements calculated under Pillar 1 plus other risk
capital requirements and expressing this as a percentage. For further details refer to Basel Pillar 3 disclosure.
Tier 1 Capital FCE's Tier 1 capital comprises shareholder funds, net of intangible assets and goodwill (See Note 33 'Components of capital').
Tier 1 Capital
Ratio
FCE's Tier 1 capital as reported in Note 33 'Components of capital' divided by end of period risk weighted exposures as defined
in 'Key Financial Ratios and Terms' section on page 127.
Tier 2 Capital FCE's Tier 2 capital comprises of subordinated debt, collective impairment losses (See Note 33 'Components of capital').
Tier 3 Capital FCE does not have a trading book and accordingly its capital structure does not include any Tier 3 capital (See Note 33
'Components of capital').
Total Capital
Ratio
FCE's total regulatory capital as reported in Note 33 'Components of capital' divided by end of period risk weighted exposures
as defined in 'Key Financial Ratios and Terms' section on page 127.
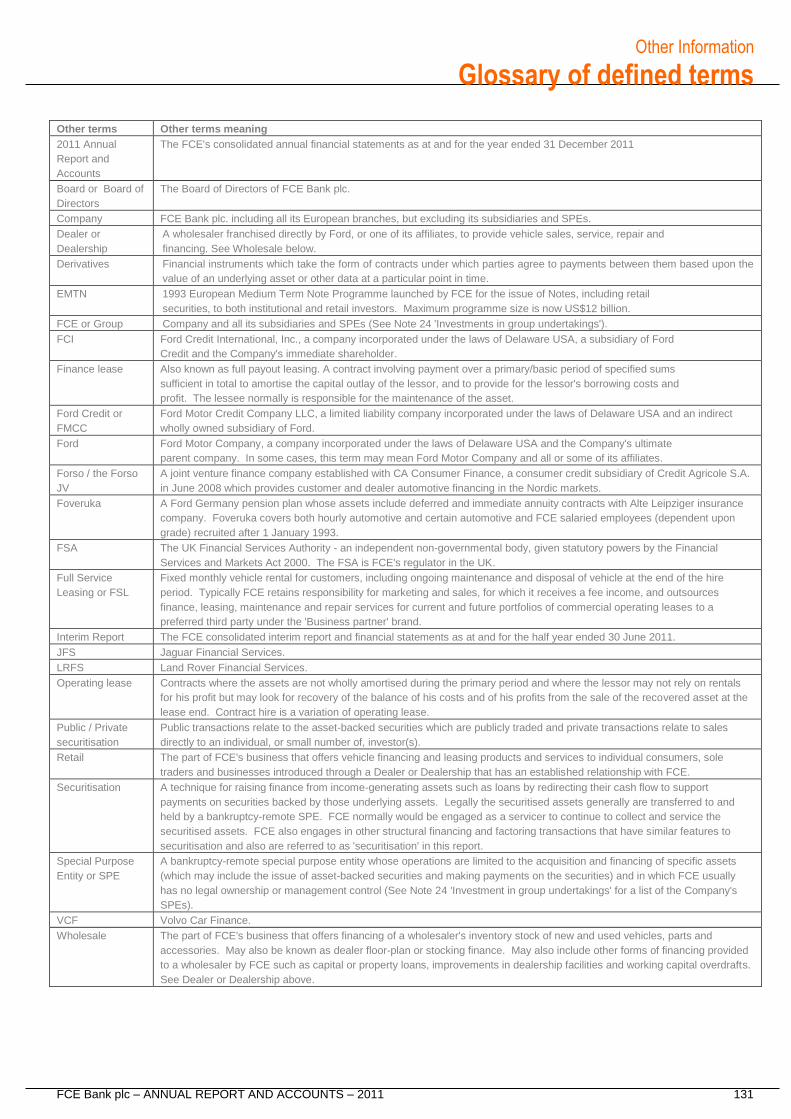
Other Information
FCE Bank plc – ANNUAL REPORT AND ACCOUNTS – 2011 131
Glossary of defined terms
Other terms Other terms meaning
2011 Annual
Report and
Accounts
The FCE's consolidated annual financial statements as at and for the year ended 31 December 2011
Board or Board of
Directors
The Board of Directors of FCE Bank plc.
Company FCE Bank plc. including all its European branches, but excluding its subsidiaries and SPEs.
Dealer or
Dealership
A wholesaler franchised directly by Ford, or one of its affiliates, to provide vehicle sales, service, repair and
financing. See Wholesale below.
Derivatives Financial instruments which take the form of contracts under which parties agree to payments between them based upon the
value of an underlying asset or other data at a particular point in time.
EMTN 1993 European Medium Term Note Programme launched by FCE for the issue of Notes, including retail
securities, to both institutional and retail investors. Maximum programme size is now US$12 billion.
FCE or Group Company and all its subsidiaries and SPEs (See Note 24 'Investments in group undertakings').
FCI Ford Credit International, Inc., a company incorporated under the laws of Delaware USA, a subsidiary of Ford
Credit and the Company's immediate shareholder.
Finance lease Also known as full payout leasing. A contract involving payment over a primary/basic period of specified sums
sufficient in total to amortise the capital outlay of the lessor, and to provide for the lessor's borrowing costs and
profit. The lessee normally is responsible for the maintenance of the asset.
Ford Credit or
FMCC
Ford Motor Credit Company LLC, a limited liability company incorporated under the laws of Delaware USA and an indirect
wholly owned subsidiary of Ford.
Ford Ford Motor Company, a company incorporated under the laws of Delaware USA and the Company's ultimate
parent company. In some cases, this term may mean Ford Motor Company and all or some of its affiliates.
Forso / the Forso
JV
A joint venture finance company established with CA Consumer Finance, a consumer credit subsidiary of Credit Agricole S.A.
in June 2008 which provides customer and dealer automotive financing in the Nordic markets.
Foveruka A Ford Germany pension plan whose assets include deferred and immediate annuity contracts with Alte Leipziger insurance
company. Foveruka covers both hourly automotive and certain automotive and FCE salaried employees (dependent upon
grade) recruited after 1 January 1993.
FSA The UK Financial Services Authority - an independent non-governmental body, given statutory powers by the Financial
Services and Markets Act 2000. The FSA is FCE's regulator in the UK.
Full Service
Leasing or FSL
Fixed monthly vehicle rental for customers, including ongoing maintenance and disposal of vehicle at the end of the hire
period. Typically FCE retains responsibility for marketing and sales, for which it receives a fee income, and outsources
finance, leasing, maintenance and repair services for current and future portfolios of commercial operating leases to a
preferred third party under the 'Business partner' brand.
Interim Report The FCE consolidated interim report and financial statements as at and for the half year ended 30 June 2011.
JFS Jaguar Financial Services.
LRFS Land Rover Financial Services.
Operating lease Contracts where the assets are not wholly amortised during the primary period and where the lessor may not rely on rentals
for his profit but may look for recovery of the balance of his costs and of his profits from the sale of the recovered asset at the
lease end. Contract hire is a variation of operating lease.
Public / Private
securitisation
Public transactions relate to the asset-backed securities which are publicly traded and private transactions relate to sales
directly to an individual, or small number of, investor(s).
Retail The part of FCE's business that offers vehicle financing and leasing products and services to individual consumers, sole
traders and businesses introduced through a Dealer or Dealership that has an established relationship with FCE.
Securitisation A technique for raising finance from income-generating assets such as loans by redirecting their cash flow to support
payments on securities backed by those underlying assets. Legally the securitised assets generally are transferred to and
held by a bankruptcy-remote SPE. FCE normally would be engaged as a servicer to continue to collect and service the
securitised assets. FCE also engages in other structural financing and factoring transactions that have similar features to
securitisation and also are referred to as 'securitisation' in this report.
Special Purpose
Entity or SPE
A bankruptcy-remote special purpose entity whose operations are limited to the acquisition and financing of specific assets
(which may include the issue of asset-backed securities and making payments on the securities) and in which FCE usually
has no legal ownership or management control (See Note 24 'Investment in group undertakings' for a list of the Company's
SPEs).
VCF Volvo Car Finance.
Wholesale The part of FCE's business that offers financing of a wholesaler's inventory stock of new and used vehicles, parts and
accessories. May also be known as dealer floor-plan or stocking finance. May also include other forms of financing provided
to a wholesaler by FCE such as capital or property loans, improvements in dealership facilities and working capital overdrafts.
See Dealer or Dealership above.