fcc test report - fccid.io · pdf file7 band edge 22.917(a)/24.238(a)/27.53(h) pass 8 mains...
TRANSCRIPT

Page 1 of 73
FCC Test Report
Report No.: AGC00639170404FE02
FCC ID : 2AL95-AGMA8
APPLICATION PURPOSE : Original Equipment
PRODUCT DESIGNATION : 4G Smart Phone
BRAND NAME : AGM
MODEL NAME : AGM A8
CLIENT : AGM Group Limited
DATE OF ISSUE : May. 17, 2017
STANDARD(S) : FCC Part 22H & 24E&27(L) Rules
REPORT VERSION : V1.0
Attestation of Global Compliance (Shenzhen) Co., Ltd.
CAUTION: This report shall not be reproduced except in full without the written permission of the test laboratory and shall not be quoted out of context.

Report No.: AGC00639170404FE02 Page 2 of 73
REPORT REVISE RECORD
Report Version Revise Time Issued Date Valid Version Notes
V1.0 / May. 17, 2017 Valid Original Report
Report No.: AGC00639170404FE02 Page 3 of 73
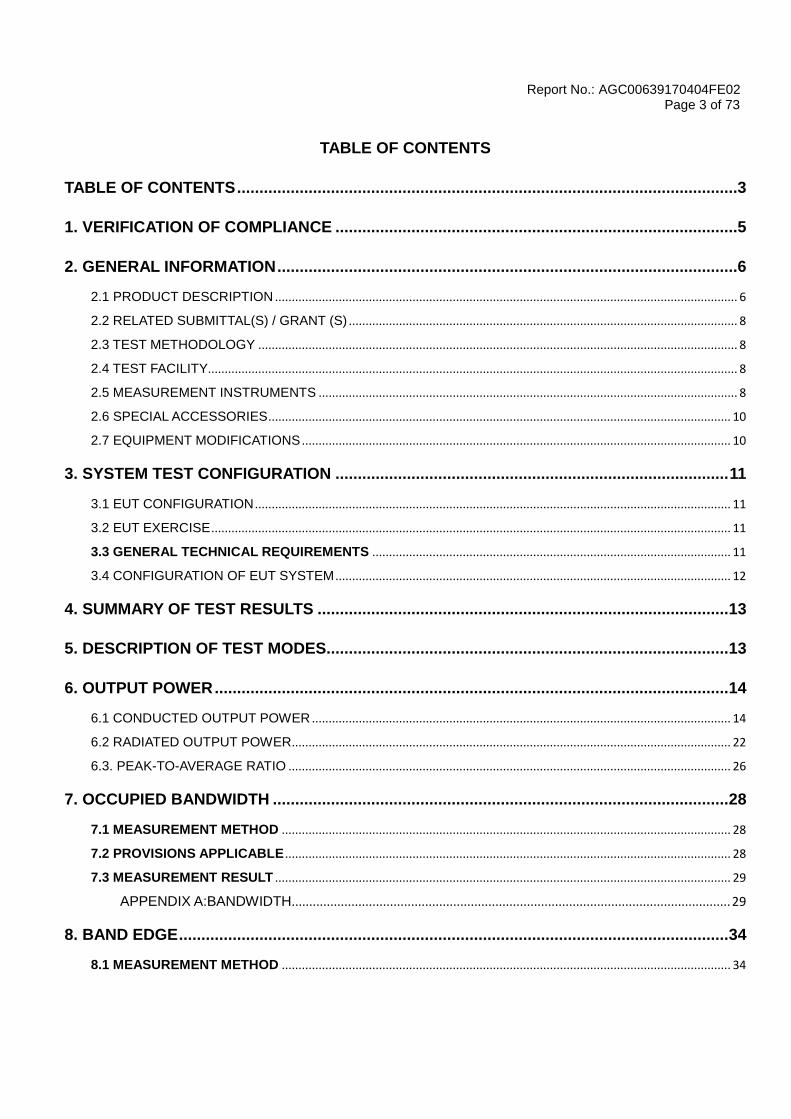
TABLE OF CONTENTS
TABLE OF CONTENTS ................................................................................................................3
1. VERIFICATION OF COMPLIANCE ..........................................................................................5
2. GENERAL INFORMATION .......................................................................................................6
2.1 PRODUCT DESCRIPTION .......................................................................................................................................... 6
2.2 RELATED SUBMITTAL(S) / GRANT (S) .................................................................................................................... 8
2.3 TEST METHODOLOGY ............................................................................................................................................... 8
2.4 TEST FACILITY.............................................................................................................................................................. 8
2.5 MEASUREMENT INSTRUMENTS ............................................................................................................................. 8
2.6 SPECIAL ACCESSORIES .......................................................................................................................................... 10
2.7 EQUIPMENT MODIFICATIONS ................................................................................................................................ 10
3. SYSTEM TEST CONFIGURATION ........................................................................................ 11
3.1 EUT CONFIGURATION .............................................................................................................................................. 11
3.2 EUT EXERCISE ........................................................................................................................................................... 11
3.3 GENERAL TECHNICAL REQUIREMENTS ........................................................................................................... 11
3.4 CONFIGURATION OF EUT SYSTEM ...................................................................................................................... 12
4. SUMMARY OF TEST RESULTS ............................................................................................ 13
5. DESCRIPTION OF TEST MODES .......................................................................................... 13
6. OUTPUT POWER ................................................................................................................... 14
6.1 CONDUCTED OUTPUT POWER ............................................................................................................................. 14
6.2 RADIATED OUTPUT POWER ................................................................................................................................... 22
6.3. PEAK-TO-AVERAGE RATIO .................................................................................................................................... 26
7. OCCUPIED BANDWIDTH ...................................................................................................... 28
7.1 MEASUREMENT METHOD ...................................................................................................................................... 28
7.2 PROVISIONS APPLICABLE ..................................................................................................................................... 28
7.3 MEASUREMENT RESULT ........................................................................................................................................ 29
APPENDIX A:BANDWIDTH............................................................................................................................. 29
8. BAND EDGE ........................................................................................................................... 34
8.1 MEASUREMENT METHOD ...................................................................................................................................... 34

Report No.: AGC00639170404FE02 Page 4 of 73
8.2 PROVISIONS APPLICABLE ..................................................................................................................................... 34
8.3 MEASUREMENT RESULT ........................................................................................................................................ 34
APPENDIX B: BAND EDGES COMPLIANCE .............................................................................................. 34
9. SPURIOUS EMISSION ........................................................................................................... 38
9.1 CONDUCTED SPURIOUS EMISSION .................................................................................................................... 38
APPENDIX C: SPURIOUS EMISSION AT ANTENNA TERMINAL ........................................................... 40
9.2 RADIATED SPURIOUS EMISSION .......................................................................................................................... 52
10. MAINS CONDUCTED EMISSION ........................................................................................ 57
10.1 MEASUREMENT METHOD .................................................................................................................................... 57
10.2 PROVISIONS APPLICABLE ................................................................................................................................... 57
10.3 MEASUREMENT RESULT ...................................................................................................................................... 58
11. FREQUENCY STABILITY ..................................................................................................... 60
11.1 MEASUREMENT METHOD .................................................................................................................................... 60
11.2 PROVISIONS APPLICABLE ................................................................................................................................... 60
11.3 MEASUREMENT RESULT ...................................................................................................................................... 62
Appendix D:Frequency Stability ...................................................................................................................... 62
PHOTOGRAPHS OF TEST SETUP ........................................................................................... 72

Report No.: AGC00639170404FE02 Page 5 of 73
1. VERIFICATION OF COMPLIANCE
Applicant AGM Group Limited
Address Level 5,Development Bank of Samoa Building,Beach Road,Apia,Samoa
Manufacturer Shenzhen AIJIEMO Technology Limited Company
Address 4F BLDG B,HUAFENG INDUSTRIAL PAPK,GUSHU,XIXIANG,BAO`AN
DISTRICT,SHENZHEN,CHINA
Product Designation 4G Smart Phone
Brand Name AGM
Test Model AGM A8
Date of test Apr. 25, 2017~May. 15, 2017
Deviation None
Condition of Test Sample Normal
We hereby certify that:
The above equipment was tested by Dongguan Precise Testing Service Co., Ltd. The data evaluation, test
procedures, and equipment configurations shown in this report were made in accordance with the procedures
given in ANSI/TIA- 603-D-2010. The sample tested as described in this report is in compliance with the FCC
Rules Part 22H and 24E and 27(L).
The test results of this report relate only to the tested sample identified in this report.
Tested By
Dota Zhang(Zhang Jianfeng) May. 15, 2017
Reviewed By
Bart Xie(Xie Xiaobin) May. 17, 2017
Approved By
Solger Zhang(Zhang Hongyi)
Authorized Officer May. 17, 2017

Report No.: AGC00639170404FE02 Page 6 of 73
2. GENERAL INFORMATION
2.1 PRODUCT DESCRIPTION
A major technical description of EUT is described as following:
Product Designation: 4G Smart Phone
Hardware version: LA6622_MB_V1.00
Software version: L1248.4.01.02.Q17
Frequency Bands:
GSM 850 PCS 1900 (U.S. Bands)
GSM 900 DCS 1800 (Non-U.S. Bands)
UMTS FDD Band II UMTS FDD Band V
UMTS FDD Band IV (U.S. Bands)
UMTS FDD Band I UMTS FDD Band VIII (Non-U.S. Bands)
Antenna Type PIFA Antenna
Type of Modulation
GSM / GPRS : GMSK
EDGE : GMSK/8PSK
WCDMA : QPSK
Antenna gain(GSM): GSM850: -0.9dBi; PCS1900: -1.5dBi;
Band II: -1.5dBi; Band IV:-0.7dBi; Band V:-0.9dBi
Power Supply: DC 3.7V by battery
Battery parameter: DC3.7V/4050mAh
Single Card: WCDMA / GSM Card Slot
GPRS Class 33
Extreme Vol. Limits: DC3.4 V to 4.2 V (Normal: DC3.7 V)
Extreme Temp. Tolerance -10℃ to +50℃
*** Note: 1. The High Voltage DC4.2V and Low Voltage DC3.4V were declared by manufacturer
2. The EUT couldn’t be operating normally with higher or lower voltage.
3. Other functions have been performed according to verification procedure except for
MS function.
*** Note: 1.The maximum power levels are GSM for MCS-4: GMSK link, and RMC 12.2kbps mode for
WCDMA band II, WCDMA band IV, WCDMA band V, only these modes were used for all tests.
2. We found out the test mode with the highest power level after we analyze all the data rates. So
we chose worst case as a representative.

Report No.: AGC00639170404FE02 Page 7 of 73
GSM/WCDMA Card Slot:
Maximum ERP/EIRP
(dBm)
Max. Conducted Power
(dBm)
Max. Average
Burst Power (dBm)
GPRS 850 30.88 32.28 31.77
GPRS 1900 27.65 29.76 28.73
HSPA BAND II 21.91 23.68 21.54
HSPA BAND IV 21.86 23.67 21.59
HSPA BAND V 21.52 23.73 21.43
GSM Card Slot :
Maximum ERP/EIRP
(dBm)
Max. Conducted Power
(dBm)
Max. Average
Burst Power (dBm)
GSM 850 30.84 32.22 21.69
PCS 1900 27.59 29.68 28.67
Report No.: AGC00639170404FE02 Page 8 of 73
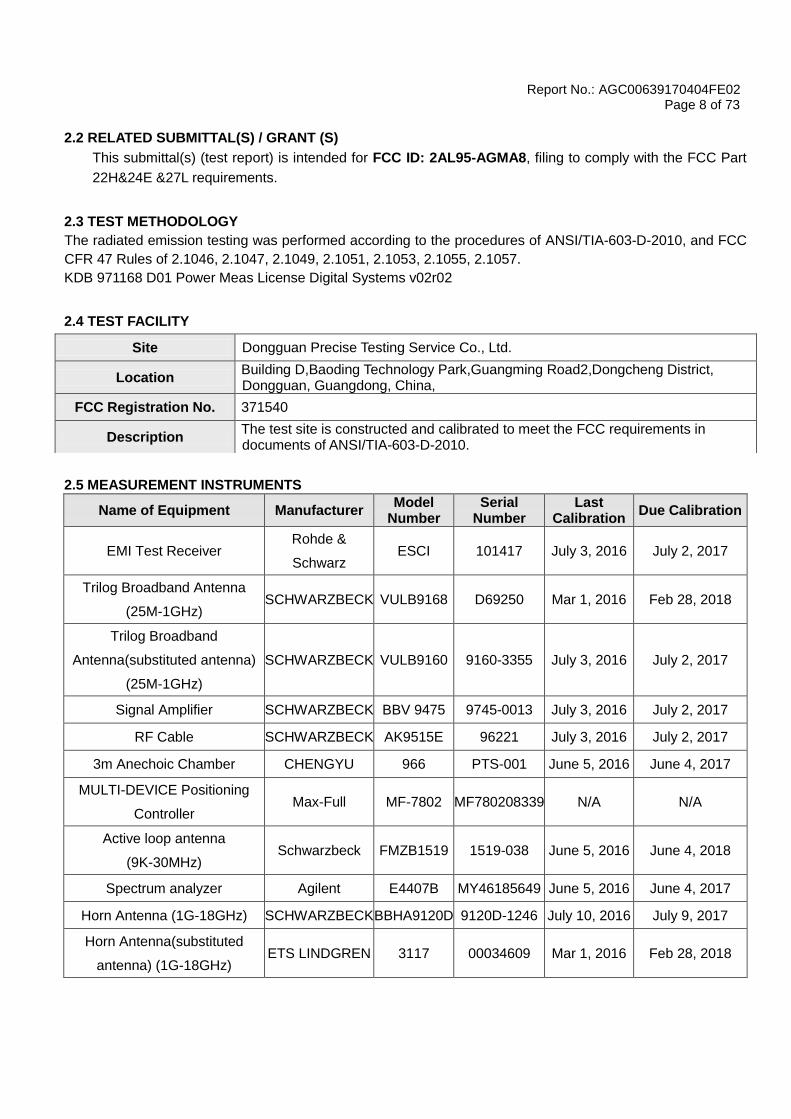
2.2 RELATED SUBMITTAL(S) / GRANT (S)
This submittal(s) (test report) is intended for FCC ID: 2AL95-AGMA8, filing to comply with the FCC Part
22H&24E &27L requirements.
2.3 TEST METHODOLOGY
The radiated emission testing was performed according to the procedures of ANSI/TIA-603-D-2010, and FCC
CFR 47 Rules of 2.1046, 2.1047, 2.1049, 2.1051, 2.1053, 2.1055, 2.1057.
KDB 971168 D01 Power Meas License Digital Systems v02r02
2.4 TEST FACILITY
2.5 MEASUREMENT INSTRUMENTS
Name of Equipment Manufacturer Model
Number Serial
Number Last
Calibration Due Calibration
EMI Test Receiver Rohde &
Schwarz ESCI 101417 July 3, 2016 July 2, 2017
Trilog Broadband Antenna
(25M-1GHz) SCHWARZBECK VULB9168 D69250 Mar 1, 2016 Feb 28, 2018
Trilog Broadband
Antenna(substituted antenna)
(25M-1GHz)
SCHWARZBECK VULB9160 9160-3355 July 3, 2016 July 2, 2017
Signal Amplifier SCHWARZBECK BBV 9475 9745-0013 July 3, 2016 July 2, 2017
RF Cable SCHWARZBECK AK9515E 96221 July 3, 2016 July 2, 2017
3m Anechoic Chamber CHENGYU 966 PTS-001 June 5, 2016 June 4, 2017
MULTI-DEVICE Positioning
Controller Max-Full MF-7802 MF780208339 N/A N/A
Active loop antenna
(9K-30MHz) Schwarzbeck FMZB1519 1519-038 June 5, 2016 June 4, 2018
Spectrum analyzer Agilent E4407B MY46185649 June 5, 2016 June 4, 2017
Horn Antenna (1G-18GHz) SCHWARZBECK BBHA9120D 9120D-1246 July 10, 2016 July 9, 2017
Horn Antenna(substituted
antenna) (1G-18GHz) ETS LINDGREN 3117 00034609 Mar 1, 2016 Feb 28, 2018
Site Dongguan Precise Testing Service Co., Ltd.
Location Building D,Baoding Technology Park,Guangming Road2,Dongcheng District, Dongguan, Guangdong, China,
FCC Registration No. 371540
Description The test site is constructed and calibrated to meet the FCC requirements in documents of ANSI/TIA-603-D-2010.

Report No.: AGC00639170404FE02 Page 9 of 73
Spectrum Analyzer Agilent E4411B MY4511453 July 3, 2016 July 2, 2017
Signal Amplifier SCHWARZBECK BBV 9718 9718-269 July 6, 2016 July 5, 2017
RF Cable SCHWARZBECK AK9515H 96220 July 7, 2016 July 6, 2017
Horn Ant (18G-40GHz) Schwarzbeck BBHA 9170 9170-181 June 5, 2016 June 4, 2017
Artificial Mains Network Narda L2-16B 000WX31025 July 7, 2016 July 6, 2017
Artificial Mains Network (AUX) Narda L2-16B 000WX31026 July 7, 2016 July 6, 2017
RF Cable SCHWARZBECK AK9515E 96222 July 3, 2016 July 2, 2017
Shielded Room CHENGYU 843 PTS-002 June 5, 2016 June 4, 2017
COMMUNICATION TESTER AGILENT 8960 GB46490550 July 24,2016 July 23, 2017
RF attenuator N/A RFA20db 68 N/A N/A
Signal Generator AGILENT N5182A MY50140530 Oct 15,2016 Oct 14,2017
Signal Generator(substituted
equipment) AGILENT E8257D MY45141029 Oct 15,2016 Oct 14,2017

Report No.: AGC00639170404FE02 Page 10 of 73
2.6 SPECIAL ACCESSORIES The battery was supplied by the applicant were used as accessories and being tested with EUT intended
for FCC grant together.
2.7 EQUIPMENT MODIFICATIONS
Not available for this EUT intended for grant.

Report No.: AGC00639170404FE02 Page 11 of 73
3. SYSTEM TEST CONFIGURATION
3.1 EUT CONFIGURATION
The EUT configuration for testing is installed on RF field strength measurement to meet the Commission’s
requirement and operating in a manner which intends to maximize its emission characteristics in a
continuous normal application.
3.2 EUT EXERCISE
The Transmitter was operated in the maximum output power mode through Communication Tester. The TX
frequency was fixed which was for the purpose of the measurements.
3.3 GENERAL TECHNICAL REQUIREMENTS
Item Number Item Description FCC Rules
1 Output Power Conducted output power 2.1046/22.913(a) (2) / 24.232
(c) /27.50(d)(2) Radiated output power
2 Peak-to-Average
Ratio Peak-to-Average Ratio 24.232(d)/27.50(d)(5)
3 Spurious Emission
Conducted
spurious emission 2.1051 / 22.917 /
24.238/27.53(h) Radiated spurious emission
4 Frequency Stability 2.1055/22.355 /24.235
/27.54
5 Occupied Bandwidth 2.1049 (h)(i)
6 Emission Bandwidth 22.917(a)/24.238(a)
/27.53(h)
7 Band Edge 22.917(a)/24.238(a)
/27.53(h)
8 Mains Conducted Emission 15.107 / 15.207
Report No.: AGC00639170404FE02 Page 12 of 73
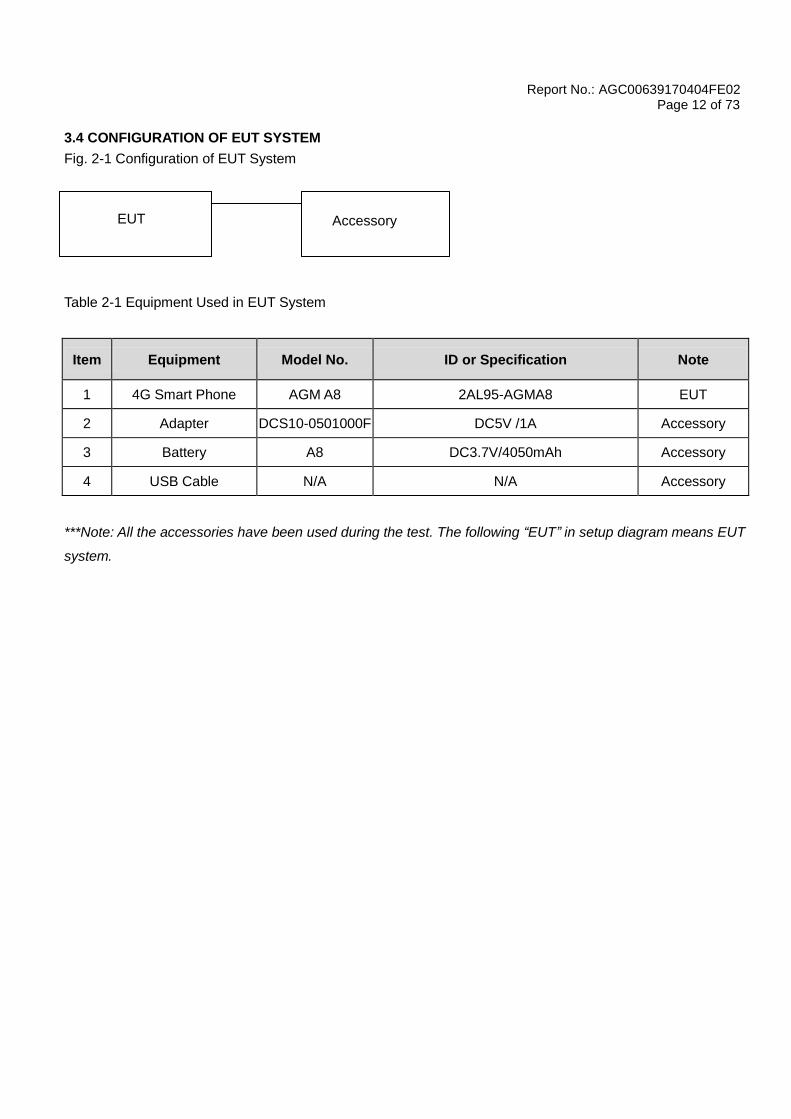
3.4 CONFIGURATION OF EUT SYSTEM Fig. 2-1 Configuration of EUT System
Table 2-1 Equipment Used in EUT System
Item Equipment Model No. ID or Specification Note
1 4G Smart Phone AGM A8 2AL95-AGMA8 EUT
2 Adapter DCS10-0501000F DC5V /1A Accessory
3 Battery A8 DC3.7V/4050mAh Accessory
4 USB Cable N/A N/A Accessory
***Note: All the accessories have been used during the test. The following “EUT” in setup diagram means EUT
system.
EUT Accessory
Report No.: AGC00639170404FE02 Page 13 of 73
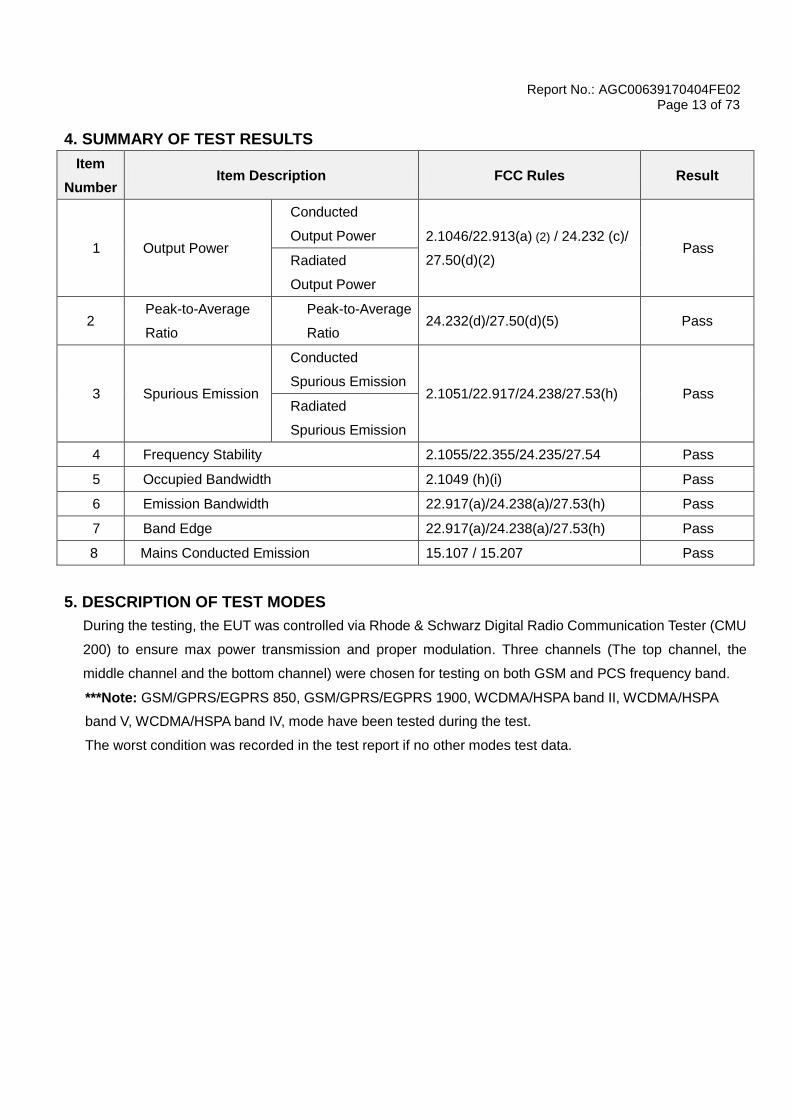
4. SUMMARY OF TEST RESULTS
Item
Number Item Description FCC Rules Result
1 Output Power
Conducted
Output Power 2.1046/22.913(a) (2) / 24.232 (c)/
27.50(d)(2) Pass
Radiated
Output Power
2 Peak-to-Average
Ratio
Peak-to-Average
Ratio 24.232(d)/27.50(d)(5) Pass
3 Spurious Emission
Conducted
Spurious Emission 2.1051/22.917/24.238/27.53(h) Pass
Radiated
Spurious Emission
4 Frequency Stability 2.1055/22.355/24.235/27.54 Pass
5 Occupied Bandwidth 2.1049 (h)(i) Pass
6 Emission Bandwidth 22.917(a)/24.238(a)/27.53(h) Pass
7 Band Edge 22.917(a)/24.238(a)/27.53(h) Pass
8 Mains Conducted Emission 15.107 / 15.207 Pass
5. DESCRIPTION OF TEST MODES
During the testing, the EUT was controlled via Rhode & Schwarz Digital Radio Communication Tester (CMU
200) to ensure max power transmission and proper modulation. Three channels (The top channel, the
middle channel and the bottom channel) were chosen for testing on both GSM and PCS frequency band.
***Note: GSM/GPRS/EGPRS 850, GSM/GPRS/EGPRS 1900, WCDMA/HSPA band II, WCDMA/HSPA
band V, WCDMA/HSPA band IV, mode have been tested during the test.
The worst condition was recorded in the test report if no other modes test data.
Report No.: AGC00639170404FE02 Page 14 of 73
6. OUTPUT POWER
6.1 CONDUCTED OUTPUT POWER
6.1.1 MEASUREMENT METHOD
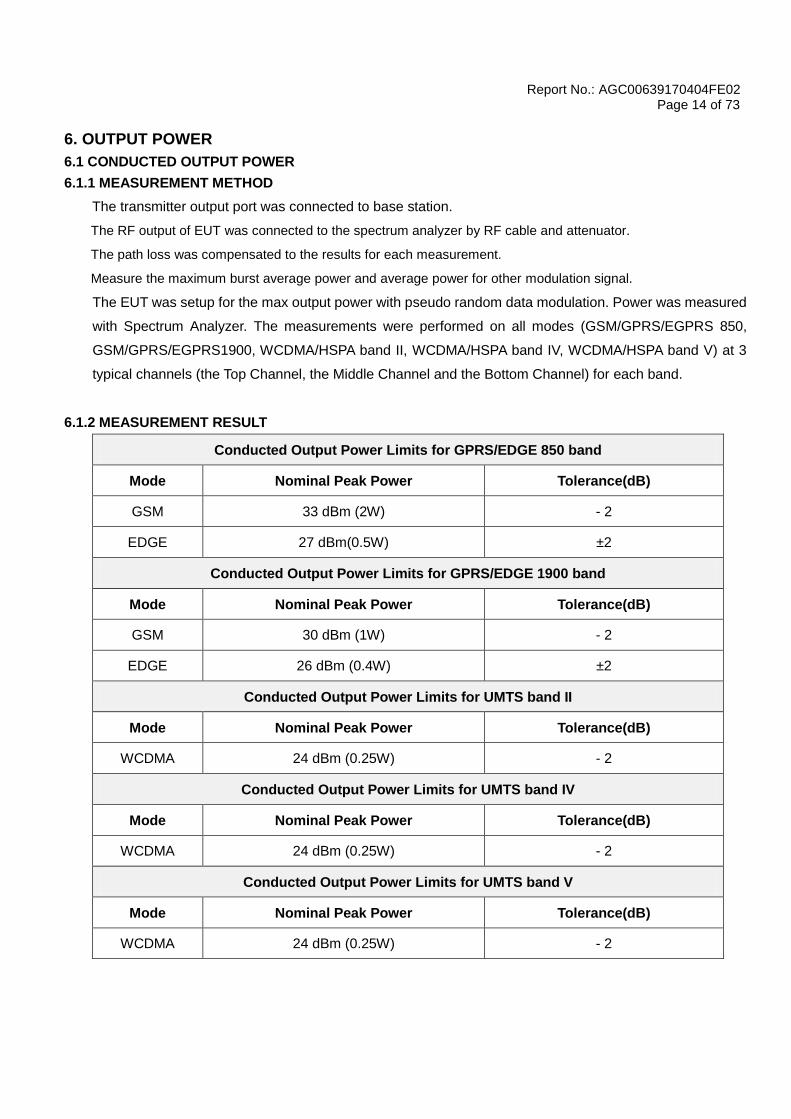
The transmitter output port was connected to base station.
The RF output of EUT was connected to the spectrum analyzer by RF cable and attenuator.
The path loss was compensated to the results for each measurement.
Measure the maximum burst average power and average power for other modulation signal.
The EUT was setup for the max output power with pseudo random data modulation. Power was measured
with Spectrum Analyzer. The measurements were performed on all modes (GSM/GPRS/EGPRS 850,
GSM/GPRS/EGPRS1900, WCDMA/HSPA band II, WCDMA/HSPA band IV, WCDMA/HSPA band V) at 3
typical channels (the Top Channel, the Middle Channel and the Bottom Channel) for each band.
6.1.2 MEASUREMENT RESULT
Conducted Output Power Limits for GPRS/EDGE 850 band
Mode Nominal Peak Power Tolerance(dB)
GSM 33 dBm (2W) - 2
EDGE 27 dBm(0.5W) ±2
Conducted Output Power Limits for GPRS/EDGE 1900 band
Mode Nominal Peak Power Tolerance(dB)
GSM 30 dBm (1W) - 2
EDGE 26 dBm (0.4W) ±2
Conducted Output Power Limits for UMTS band II
Mode Nominal Peak Power Tolerance(dB)
WCDMA 24 dBm (0.25W) - 2
Conducted Output Power Limits for UMTS band IV
Mode Nominal Peak Power Tolerance(dB)
WCDMA 24 dBm (0.25W) - 2
Conducted Output Power Limits for UMTS band V
Mode Nominal Peak Power Tolerance(dB)
WCDMA 24 dBm (0.25W) - 2

Report No.: AGC00639170404FE02 Page 15 of 73
GSM 850:
Mode Frequency
(MHz)
Reference
Power
Peak
Power
Tolerance
Avg.Burst
Power
Duty cycle
Factor(dB)
Frame
Power(dBm)
GSM850
824.2 33 32.23 -0.77 31.71 -9 22.71
836.6 33 32.08 -0.92 31.59 -9 22.59
848.8 33 32.28 -0.72 31.77 -9 22.77
GPRS850
(1 Slot)
824.2 33 32.28 -0.72 31.43 -9 22.43
836.6 33 32.11 -0.89 31.41 -9 22.41
848.8 33 32.34 -0.66 31.19 -9 22.19
GPRS850
(2 Slot)
824.2 30 29.62 -0.38 28.59 -6 22.59
836.6 30 29.62 -0.38 28.29 -6 22.29
848.8 30 29.02 -0.98 28.60 -6 22.60
GPRS850
(3 Slot)
824.2 28.23 27.71 -0.52 26.45 -4.26 22.19
836.6 28.23 27.25 -0.98 26.49 -4.26 22.23
848.8 28.23 27.52 -0.71 26.57 -4.26 22.31
GPRS850
(4 Slot)
824.2 27 26.07 -0.93 25.21 -3 22.21
836.6 27 26.37 -0.63 25.05 -3 22.05
848.8 27 26.64 -0.36 25.36 -3 22.36
Mode Channel Frequency
(MHz)
Peak Power
(dBm)
Avg.Burst Power
(dBm)
EDGE
(1 Slot)
128 824.2 26.89 25.37
189 836.6 26.95 25.29
251 848.8 26.92 25.39
EDGE
(2 Slot)
128 824.2 23.96 22.26
189 836.6 23.51 22.27
251 848.8 23.84 22.34
EDGE
(3 Slot)
128 824.2 22.93 21.14
189 836.6 22.85 21.22
251 848.8 22.95 21.19
EDGE
(4 Slot)
128 824.2 21.85 20.13
189 836.6 21.62 20.08
251 848.8 21.85 20.07

Report No.: AGC00639170404FE02 Page 16 of 73
PCS 1900:
Mode Frequency
(MHz)
Reference
Power
Peak
Power
Tolerance
Avg.Burst
Power
Duty cycle
Factor(dB)
Frame
Power(dBm)
GSM1900
1850.2 30 29.25 -0.75 28.23 -9 19.23
1880 30 29.30 -0.70 28.25 -9 19.25
1909.8 30 29.76 -0.24 28.73 -9 19.73
GPRS1900
(1 Slot)
1850.2 30 29.39 -0.61 28.36 -9 19.36
1880 30 29.37 -0.63 28.29 -9 19.29
1909.8 30 29.41 -0.59 28.38 -9 19.38
GPRS1900
(2 Slot)
1850.2 27 25.99 -1.01 24.80 -6 18.80
1880 27 26.29 -0.71 25.23 -6 19.23
1909.8 27 26.54 -0.46 25.64 -6 19.64
GPRS1900
(3 Slot)
1850.2 25.23 24.53 -0.70 23.84 -4.26 19.58
1880 25.23 24.38 -0.85 23.69 -4.26 19.43
1909.8 25.23 24.46 -0.77 23.41 -4.26 19.15
GPRS1900
(4 Slot)
1850.2 24 23.17 -0.83 22.11 -3 19.11
1880 24 23.05 -0.95 22.08 -3 19.08
1909.8 24 23.19 -0.81 22.14 -3 19.14
Mode Channel Frequency
(MHz)
Peak Power
(dBm)
Avg.Burst Power
(dBm)
EDGE
(1 Slot)
512 1850.2 26.04 24.23
661 1880 26.28 24.53
810 1909.8 26.62 24.85
EDGE
(2 Slot)
512 1850.2 23.12 21.47
661 1880 23.37 21.54
810 1909.8 23.71 21.81
EDGE
(3 Slot)
512 1850.2 23.41 21.68
661 1880 23.13 21.44
810 1909.8 23.70 21.82
EDGE
(4 Slot)
512 1850.2 22.21 20.71
661 1880 22.36 20.64
810 1909.8 22.47 20.75
Report No.: AGC00639170404FE02 Page 17 of 73
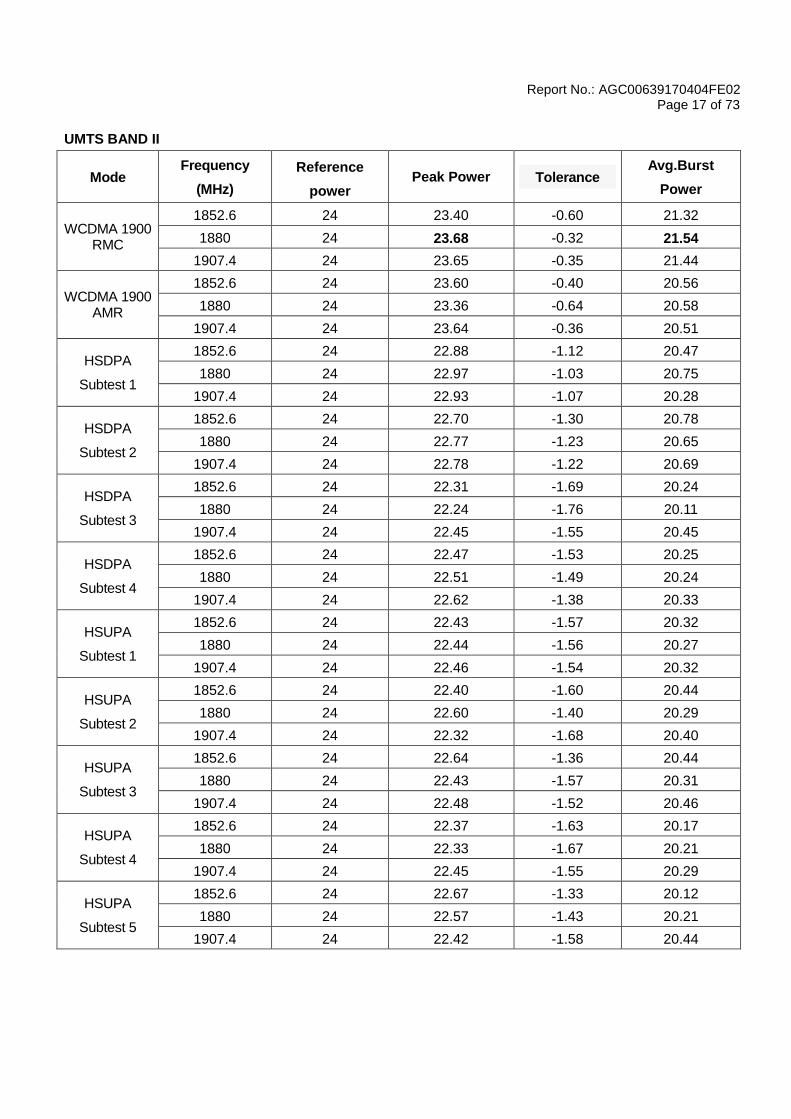
UMTS BAND II
Mode Frequency
(MHz)
Reference
power Peak Power Tolerance
Avg.Burst
Power
WCDMA 1900 RMC
1852.6 24 23.40 -0.60 21.32
1880 24 23.68 -0.32 21.54
1907.4 24 23.65 -0.35 21.44
WCDMA 1900 AMR
1852.6 24 23.60 -0.40 20.56
1880 24 23.36 -0.64 20.58
1907.4 24 23.64 -0.36 20.51
HSDPA
Subtest 1
1852.6 24 22.88 -1.12 20.47
1880 24 22.97 -1.03 20.75
1907.4 24 22.93 -1.07 20.28
HSDPA
Subtest 2
1852.6 24 22.70 -1.30 20.78
1880 24 22.77 -1.23 20.65
1907.4 24 22.78 -1.22 20.69
HSDPA
Subtest 3
1852.6 24 22.31 -1.69 20.24
1880 24 22.24 -1.76 20.11
1907.4 24 22.45 -1.55 20.45
HSDPA
Subtest 4
1852.6 24 22.47 -1.53 20.25
1880 24 22.51 -1.49 20.24
1907.4 24 22.62 -1.38 20.33
HSUPA
Subtest 1
1852.6 24 22.43 -1.57 20.32
1880 24 22.44 -1.56 20.27
1907.4 24 22.46 -1.54 20.32
HSUPA
Subtest 2
1852.6 24 22.40 -1.60 20.44
1880 24 22.60 -1.40 20.29
1907.4 24 22.32 -1.68 20.40
HSUPA
Subtest 3
1852.6 24 22.64 -1.36 20.44
1880 24 22.43 -1.57 20.31
1907.4 24 22.48 -1.52 20.46
HSUPA
Subtest 4
1852.6 24 22.37 -1.63 20.17
1880 24 22.33 -1.67 20.21
1907.4 24 22.45 -1.55 20.29
HSUPA
Subtest 5
1852.6 24 22.67 -1.33 20.12
1880 24 22.57 -1.43 20.21
1907.4 24 22.42 -1.58 20.44
Report No.: AGC00639170404FE02 Page 18 of 73
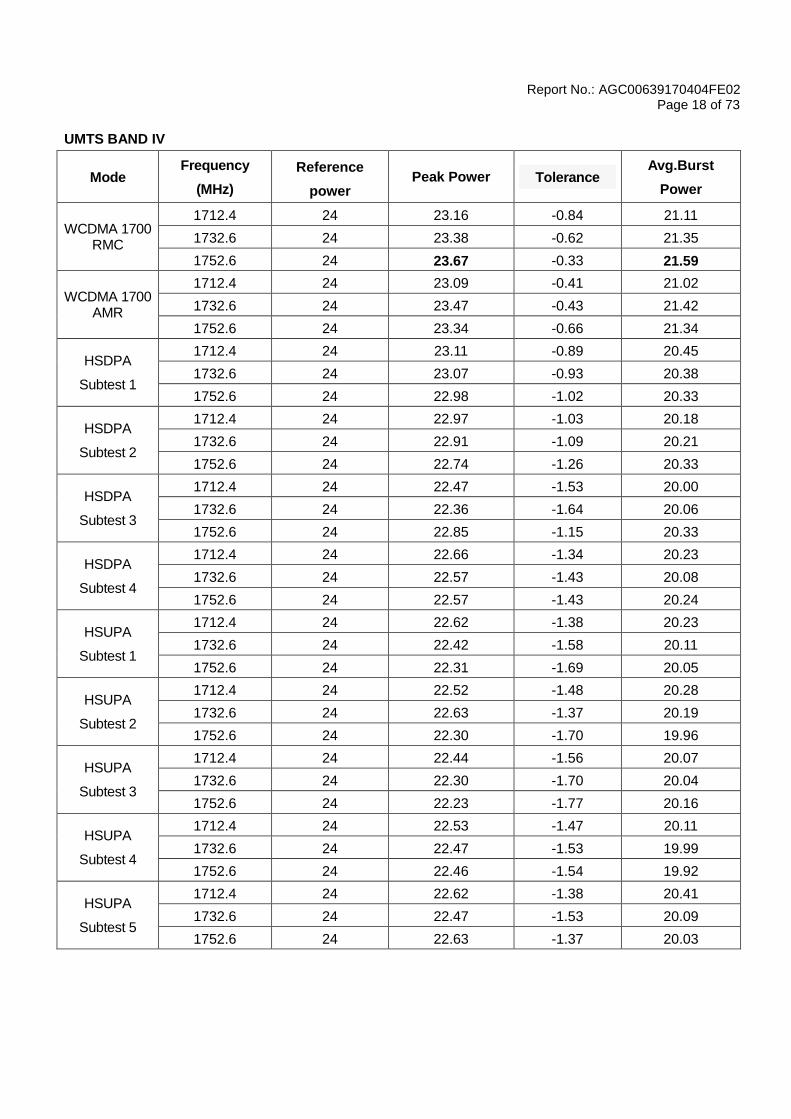
UMTS BAND IV
Mode Frequency
(MHz)
Reference
power Peak Power Tolerance
Avg.Burst
Power
WCDMA 1700 RMC
1712.4 24 23.16 -0.84 21.11
1732.6 24 23.38 -0.62 21.35
1752.6 24 23.67 -0.33 21.59
WCDMA 1700 AMR
1712.4 24 23.09 -0.41 21.02
1732.6 24 23.47 -0.43 21.42
1752.6 24 23.34 -0.66 21.34
HSDPA
Subtest 1
1712.4 24 23.11 -0.89 20.45
1732.6 24 23.07 -0.93 20.38
1752.6 24 22.98 -1.02 20.33
HSDPA
Subtest 2
1712.4 24 22.97 -1.03 20.18
1732.6 24 22.91 -1.09 20.21
1752.6 24 22.74 -1.26 20.33
HSDPA
Subtest 3
1712.4 24 22.47 -1.53 20.00
1732.6 24 22.36 -1.64 20.06
1752.6 24 22.85 -1.15 20.33
HSDPA
Subtest 4
1712.4 24 22.66 -1.34 20.23
1732.6 24 22.57 -1.43 20.08
1752.6 24 22.57 -1.43 20.24
HSUPA
Subtest 1
1712.4 24 22.62 -1.38 20.23
1732.6 24 22.42 -1.58 20.11
1752.6 24 22.31 -1.69 20.05
HSUPA
Subtest 2
1712.4 24 22.52 -1.48 20.28
1732.6 24 22.63 -1.37 20.19
1752.6 24 22.30 -1.70 19.96
HSUPA
Subtest 3
1712.4 24 22.44 -1.56 20.07
1732.6 24 22.30 -1.70 20.04
1752.6 24 22.23 -1.77 20.16
HSUPA
Subtest 4
1712.4 24 22.53 -1.47 20.11
1732.6 24 22.47 -1.53 19.99
1752.6 24 22.46 -1.54 19.92
HSUPA
Subtest 5
1712.4 24 22.62 -1.38 20.41
1732.6 24 22.47 -1.53 20.09
1752.6 24 22.63 -1.37 20.03
Report No.: AGC00639170404FE02 Page 19 of 73
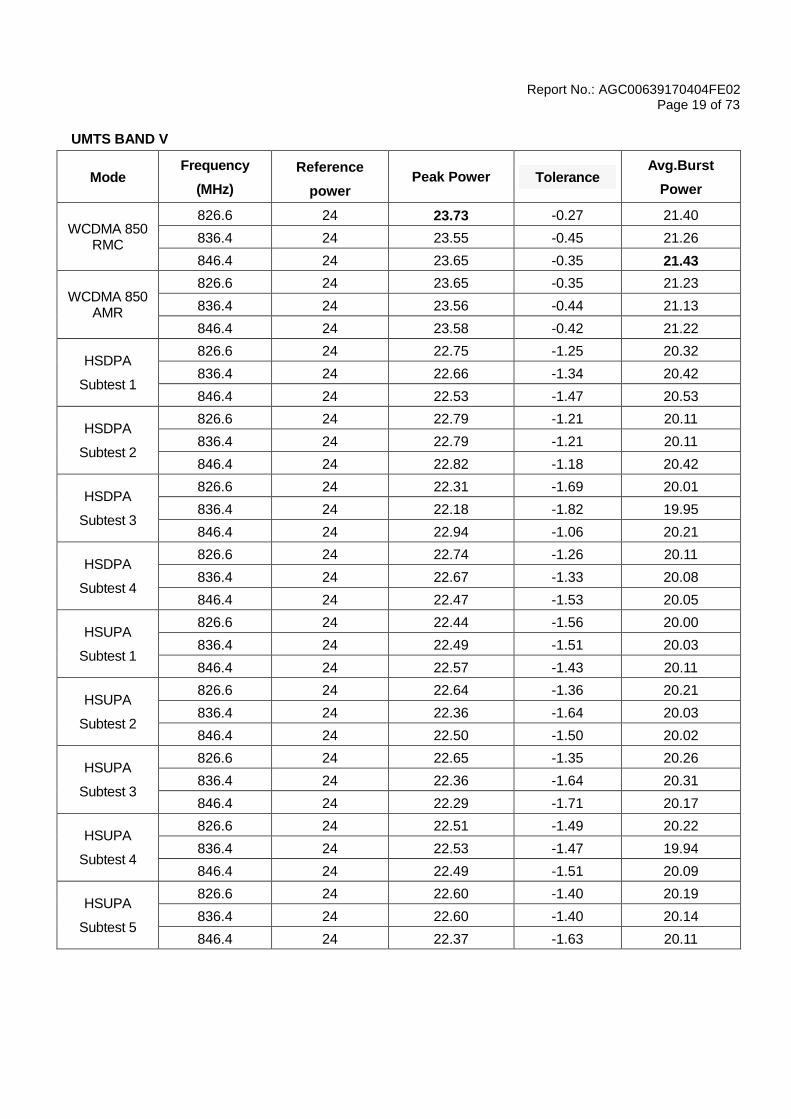
UMTS BAND V
Mode Frequency
(MHz)
Reference
power Peak Power Tolerance
Avg.Burst
Power
WCDMA 850 RMC
826.6 24 23.73 -0.27 21.40
836.4 24 23.55 -0.45 21.26
846.4 24 23.65 -0.35 21.43
WCDMA 850 AMR
826.6 24 23.65 -0.35 21.23
836.4 24 23.56 -0.44 21.13
846.4 24 23.58 -0.42 21.22
HSDPA
Subtest 1
826.6 24 22.75 -1.25 20.32
836.4 24 22.66 -1.34 20.42
846.4 24 22.53 -1.47 20.53
HSDPA
Subtest 2
826.6 24 22.79 -1.21 20.11
836.4 24 22.79 -1.21 20.11
846.4 24 22.82 -1.18 20.42
HSDPA
Subtest 3
826.6 24 22.31 -1.69 20.01
836.4 24 22.18 -1.82 19.95
846.4 24 22.94 -1.06 20.21
HSDPA
Subtest 4
826.6 24 22.74 -1.26 20.11
836.4 24 22.67 -1.33 20.08
846.4 24 22.47 -1.53 20.05
HSUPA
Subtest 1
826.6 24 22.44 -1.56 20.00
836.4 24 22.49 -1.51 20.03
846.4 24 22.57 -1.43 20.11
HSUPA
Subtest 2
826.6 24 22.64 -1.36 20.21
836.4 24 22.36 -1.64 20.03
846.4 24 22.50 -1.50 20.02
HSUPA
Subtest 3
826.6 24 22.65 -1.35 20.26
836.4 24 22.36 -1.64 20.31
846.4 24 22.29 -1.71 20.17
HSUPA
Subtest 4
826.6 24 22.51 -1.49 20.22
836.4 24 22.53 -1.47 19.94
846.4 24 22.49 -1.51 20.09
HSUPA
Subtest 5
826.6 24 22.60 -1.40 20.19
836.4 24 22.60 -1.40 20.14
846.4 24 22.37 -1.63 20.11
Report No.: AGC00639170404FE02 Page 20 of 73
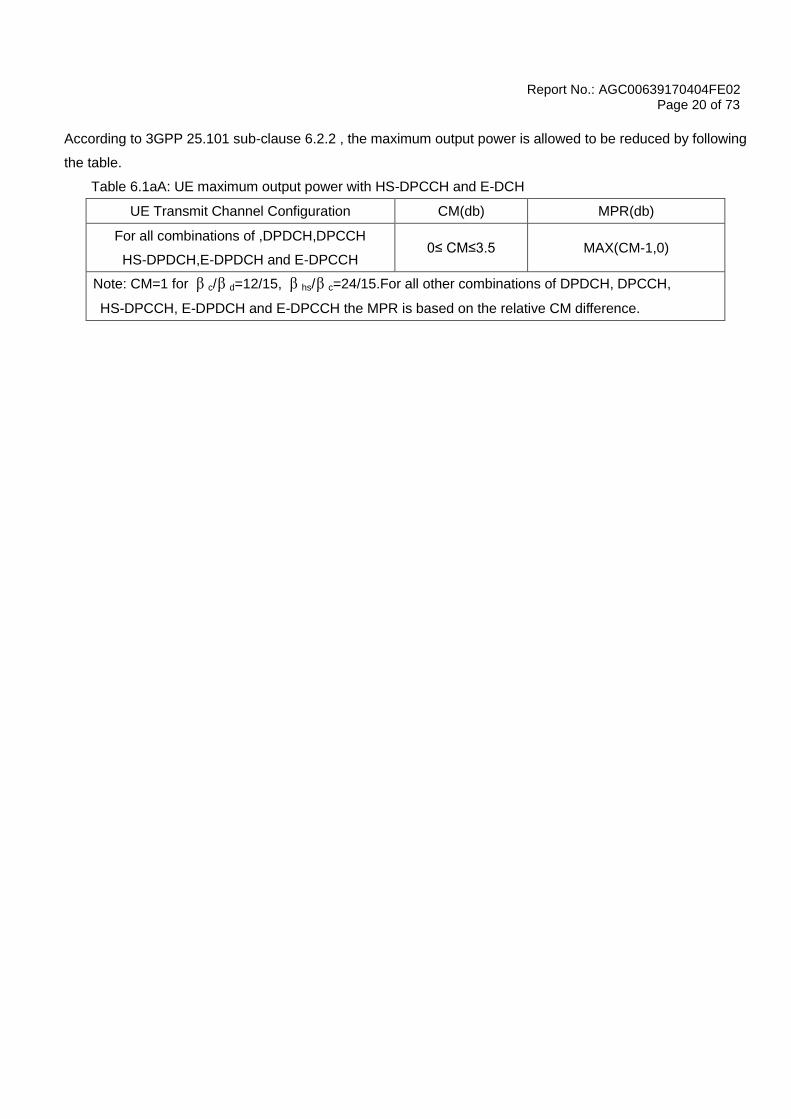
According to 3GPP 25.101 sub-clause 6.2.2 , the maximum output power is allowed to be reduced by following
the table.
Table 6.1aA: UE maximum output power with HS-DPCCH and E-DCH
UE Transmit Channel Configuration CM(db) MPR(db)
For all combinations of ,DPDCH,DPCCH
HS-DPDCH,E-DPDCH and E-DPCCH 0≤ CM≤3.5 MAX(CM-1,0)
Note: CM=1 for c/ d=12/15, hs/ c=24/15.For all other combinations of DPDCH, DPCCH,
HS-DPCCH, E-DPDCH and E-DPCCH the MPR is based on the relative CM difference.
Report No.: AGC00639170404FE02 Page 21 of 73
The device supports MPR to solve linearity issues (ACLR or SEM) due to the higher peak-to average ratios
(PAR) of the HSUPA signal. This prevents saturating the full range of the TX DAC inside of device and provides
a reduced power output to the RF transceiver chip according to the Cubic Metric (a function of the combinations
of DPDCH, DPCCH, HS-DPCCH, E-DPDCH and E-DPCCH).
When E-DPDCH channels are present the beta gains on those channels are reduced firsts to try to get the
power under the allowed limit. If the beta gains are lowered as far as possible, then a hard limiting is applied at
the maximum allowed level.
The SW currently recalculates the cubic metric every time the beta gains on the E-DPDCH are reduced. The
cubic metric will likely get lower each time this is done .However, there is no reported reduction of maximum
output power in the HSUPA mode since the device also provides a compensate for the power back-off by
increasing the gain of TX_AGC in the transceiver (PA) device.
The end effect is that the DUT output power is identical to the case where there is no MPR in the device.

Report No.: AGC00639170404FE02 Page 22 of 73
6.2 RADIATED OUTPUT POWER
6.2.1 MEASUREMENT METHOD
The measurements procedures specified in ANSI/TIA-603-D-2010 were applied.
1. Effective Radiated Power (ERP) and Equivalent Isotropic Radiated Power (EIRP) measurements are
performed using the substitution method described in ANSI/TIA-603-D-2010 with the EUT transmitting into an
integral antenna. Measurements on signal operating below 1GHz are performed using dipole antennas.
Measurements on signals operating above 1GHz are performed using broadband horn antennas. All
measurements are performed as RMS average measurements while the EUT operating at its maximum duty
cycle, at maximum power, and at the approximate frequencies.
2. In an anechoic antenna test chamber, a half-wave dipole antenna for the frequency band of interest is placed
at the reference centre of the chamber. An RF Signal source for the frequency band of interest is connected to
the dipole with a cable that has been constructed to not interfere with the radiation pattern of the antenna. A
known (measured) power (Pin) is applied to the input of the dipole, and the power received (Pr) at the
chamber's probe antenna is recorded.
3. The substitution method is used. Substitution values at each frequency are measured before and saved to
the test software. A "reference path loss" is established as ARpl=Pin + 2.15 - Pr. The ARpl is the attenuation of
“reference path loss”, and including the gain of receive antenna, the cable loss and the air loss. The
measurement results are obtained as described below: Power=PMea+ARpl
4. The EUT is substituted for the dipole at the reference centre of the chamber and a scan is performed to
obtain the radiation pattern.
5. From the radiation pattern, the co-ordinates where the maximum antenna gain occurs are identified.
6. The EUT is then put into continuously transmitting mode at its maximum power level.
7. Power mode measurements are performed with the receiving antenna placed at the coordinates determined
in Step 3 to determine the output power as defined in Rule 24.232 (b) and (c). The "reference path loss" from
Step1 is added to this result.
8. This value is EIRP since the measurement is calibrated using a half-wave dipole antenna of known gain
(2.15 dBi) and known input power (Pin).
9. ERP can be calculated from EIRP by subtracting the gain of the dipole, ERP = EIRP -2.15dBi...
6.2.2 PROVISIONS APPLICABLE
This is the test for the maximum radiated power from the EUT. Rule Part 24.232(b) and 27.50(d)(4)
specifies, “Mobile/portable stations are limited to 2 watts e.i.r.p. Peak power” and 24.232(c) and 27.50(d)(4)
specifies that "Peak transmit power must be measured over any interval of continuous transmission using
instrumentation calibrated in terms of an rms-equivalent voltage.” Rule Part 22.913(a) specifies “Maximum
ERP. The effective radiated power (ERP) of base transmitters and cellular repeaters must not exceed 500
Watts. The ERP of mobile transmitters and auxiliary test transmitters must not exceed 7 Watts.”

Report No.: AGC00639170404FE02 Page 23 of 73
Mode Nominal Peak Power
GPRS/EDGE 850 <=38.45 dBm (7W)
GPRS/EDGE 1900 <=33 dBm (2W)
UMTS BAND II <=33 dBm (2W)
UMTS BAND IV <=33 dBm (2W)
UMTS BAND V <=38.45 dBm (7W)
Report No.: AGC00639170404FE02 Page 24 of 73
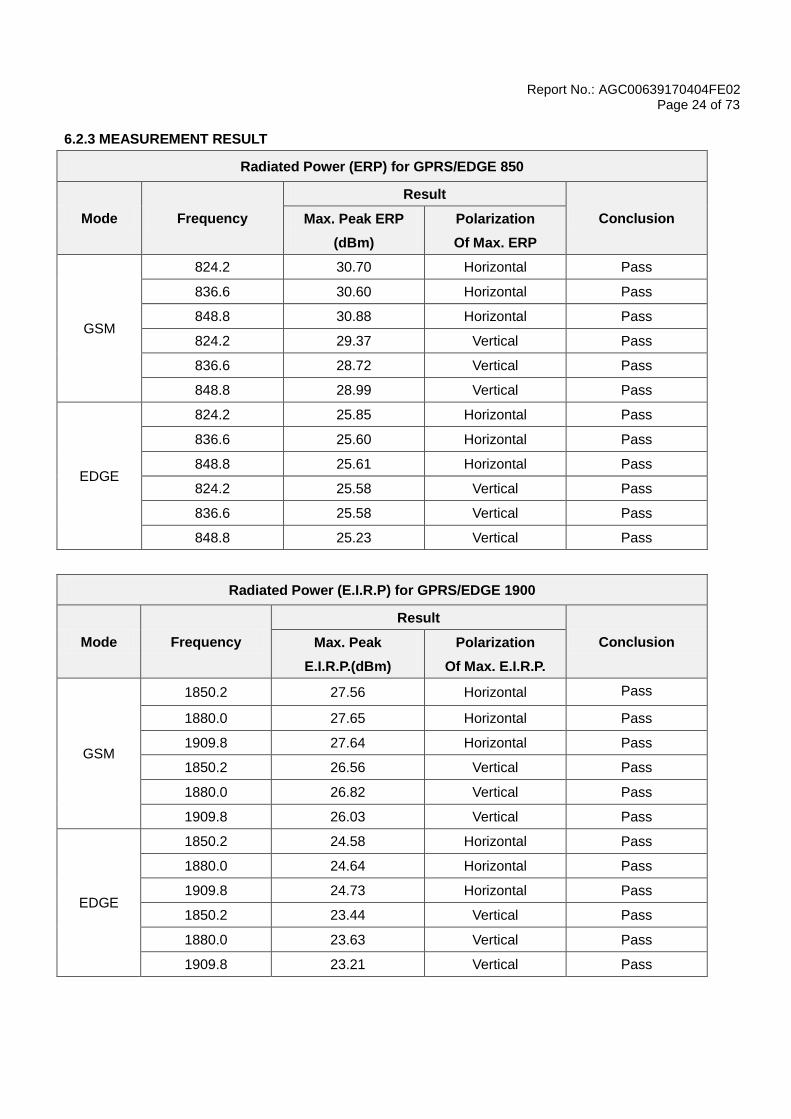
6.2.3 MEASUREMENT RESULT
Radiated Power (ERP) for GPRS/EDGE 850
Mode Frequency
Result
Conclusion Max. Peak ERP
(dBm)
Polarization
Of Max. ERP
GSM
824.2 30.70 Horizontal Pass
836.6 30.60 Horizontal Pass
848.8 30.88 Horizontal Pass
824.2 29.37 Vertical Pass
836.6 28.72 Vertical Pass
848.8 28.99 Vertical Pass
EDGE
824.2 25.85 Horizontal Pass
836.6 25.60 Horizontal Pass
848.8 25.61 Horizontal Pass
824.2 25.58 Vertical Pass
836.6 25.58 Vertical Pass
848.8 25.23 Vertical Pass
Radiated Power (E.I.R.P) for GPRS/EDGE 1900
Mode Frequency
Result
Conclusion Max. Peak
E.I.R.P.(dBm)
Polarization
Of Max. E.I.R.P.
GSM
1850.2 27.56 Horizontal Pass
1880.0 27.65 Horizontal Pass
1909.8 27.64 Horizontal Pass
1850.2 26.56 Vertical Pass
1880.0 26.82 Vertical Pass
1909.8 26.03 Vertical Pass
EDGE
1850.2 24.58 Horizontal Pass
1880.0 24.64 Horizontal Pass
1909.8 24.73 Horizontal Pass
1850.2 23.44 Vertical Pass
1880.0 23.63 Vertical Pass
1909.8 23.21 Vertical Pass

Report No.: AGC00639170404FE02 Page 25 of 73
Radiated Power (E.I.R.P) for UMTS band II
Mode Frequency
Result
Conclusion Max. Peak E.I.R.P
(dBm)
Polarization
Of Max. E.I.R.P
UMTS
1852.6 21.91 Horizontal Pass
1880 21.60 Horizontal Pass
1907.4 21.76 Horizontal Pass
1852.6 20.54 Vertical Pass
1880 20.70 Vertical Pass
1907.4 20.46 Vertical Pass
Radiated Power (E.I.R.P) for UMTS band IV
Mode Frequency
Result
Conclusion Max. Peak ERP
(dBm)
Polarization
Of Max. E.I.R.P.
UMTS
1712.4 21.86 Horizontal Pass
1732.6 21.53 Horizontal Pass
1752.6 21.85 Horizontal Pass
1712.4 20.63 Vertical Pass
1732.6 20.64 Vertical Pass
1752.6 20.64 Vertical Pass
Radiated Power (ERP) for UMTS band V
Mode Frequency
Result
Conclusion Max. Peak ERP
(dBm)
Polarization
Of Max. E.I.R.P.
UMTS
826.6 21.24 Horizontal Pass
836.4 21.42 Horizontal Pass
846.4 21.52 Horizontal Pass
826.6 20.38 Vertical Pass
836.4 20.25 Vertical Pass
846.4 20.27 Vertical Pass
Note: Above is the worst mode data.

Report No.: AGC00639170404FE02 Page 26 of 73
6.3. PEAK-TO-AVERAGE RATIO
6.3.1 MEASUREMENT METHOD
Use one of the procedures presented in 4.1 to measure the total peak power and record as PPk. Use
one of the applicable procedures presented 4.2 to measure the total average power and record as
PAvg. Both the peak and average power levels must be expressed in the same logarithmic units
(e.g., dBm). Determine the PAPR from:
PAPR (dB) = PPk (dBm) - PAvg (dBm).
6.3.2 PROVISIONS APPLICABLE
This is the test for the Peak-to-Average Ratio from the EUT.
Power Complementary Cumulative Distribution Function (CCDF) curves provide a means for
characterizing the power peaks of a digitally modulated signal on a statistical basis. A CCDF curve
depicts the probability of the peak signal amplitude exceeding the average power level. Most
contemporary measurement instrumentation include the capability to produce CCDF curves for an
input signal provided that the instrument’s resolution bandwidth can be set wide enough to
accommodate the entire input signal bandwidth. In measuring transmissions in this band using an
average power technique, the peak-to-average ratio (PAR) of the transmission may not exceed 13
dB.
6.3.3 MEASUREMENT RESULT
Modes GSM 850(GSM)
Channel 128 190 251
(Low) (Mid) (High)
Frequency
(MHz) 824.2 836.6 848.8
Peak-To-Average Ratio (dB)/GPRS 0.54 0.53 0.56
Peak-To-Average Ratio (dB)/EDGE 1.54 1.58 1.62
Modes GSM 1900 (GSM)
Channel 512 661 810
(Low) (Mid) (High)
Frequency
(MHz) 1850.2 1880 1909.8
Peak-To-Average Ratio (dB)/GPRS 1.08 1.04 1.05
Peak-To-Average Ratio (dB)/EDGE 1.79 1.81 1.74

Report No.: AGC00639170404FE02 Page 27 of 73
Modes UMTS BAND II
Channel 9663 9800 9937
(Low) (Mid) (High)
Frequency
(MHz) 1852.6 1880 1907.4
Peak-To-Average Ratio (dB) 2.11 2.12 2.10
Modes UMTS BAND IV
Channel 1887 1987 2087
(Low) (Mid) (High)
Frequency
(MHz) 1712.4 1732.6 1752.6
Peak-To-Average Ratio (dB) 2.09 2.05 2.07
Modes UMTS BAND V
Channel 4358 4407 4457
(Low) (Mid) (High)
Frequency
(MHz) 826.6 836.6 846.4
Peak-To-Average Ratio (dB) 2.33 2.19 2.22
Report No.: AGC00639170404FE02 Page 28 of 73
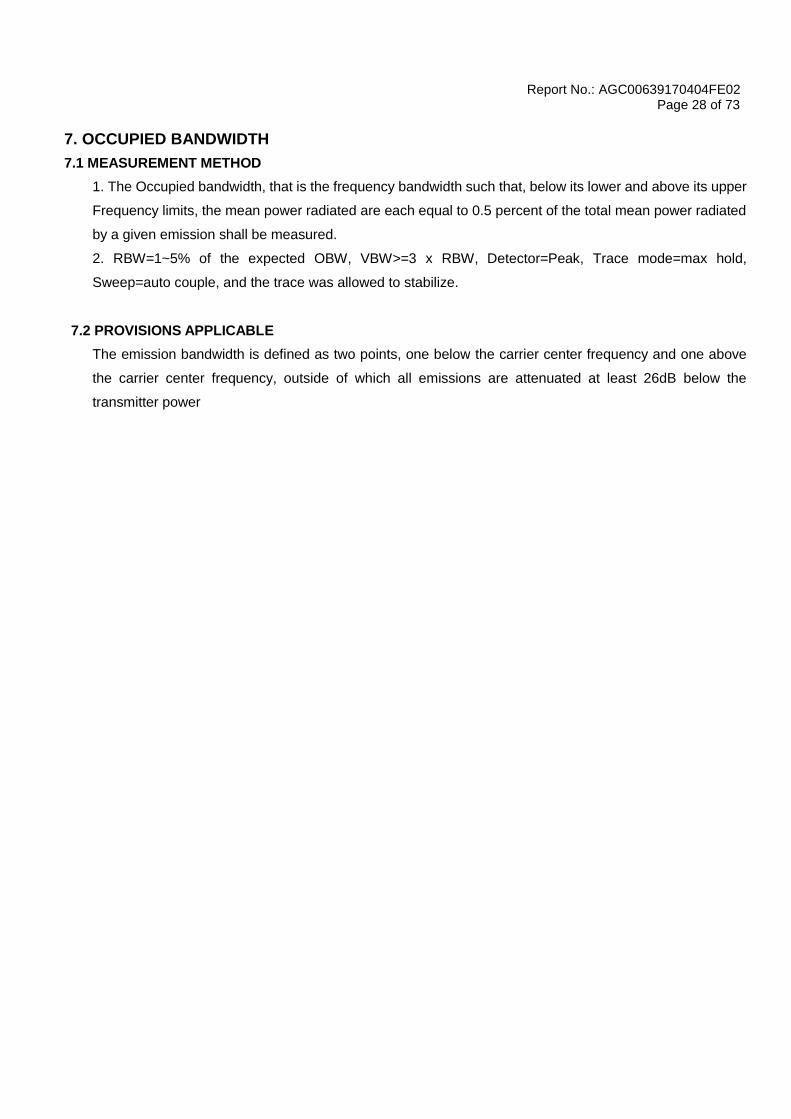
7. OCCUPIED BANDWIDTH
7.1 MEASUREMENT METHOD
1. The Occupied bandwidth, that is the frequency bandwidth such that, below its lower and above its upper
Frequency limits, the mean power radiated are each equal to 0.5 percent of the total mean power radiated
by a given emission shall be measured.
2. RBW=1~5% of the expected OBW, VBW>=3 x RBW, Detector=Peak, Trace mode=max hold,
Sweep=auto couple, and the trace was allowed to stabilize.
7.2 PROVISIONS APPLICABLE
The emission bandwidth is defined as two points, one below the carrier center frequency and one above
the carrier center frequency, outside of which all emissions are attenuated at least 26dB below the
transmitter power

Report No.: AGC00639170404FE02 Page 29 of 73
7.3 MEASUREMENT RESULT
APPENDIX A:BANDWIDTH
Test Results
Test
Band
Test
Mode
Test
Channel
Occupied Bandwidth
(KHZ)
Emission Bandwidth
(KHZ) Verdict
GSM850
GSM
LCH 241.83 312.16 PASS
MCH 243.96 307.20 PASS
HCH 246.35 310.86 PASS
EDGE
LCH 248.61 311.21 PASS
MCH 245.28 307.51 PASS
HCH 249.01 300.30 PASS
Test Band Test
Mode
Test
Channel
Occupied Bandwidth
(KHZ)
Emission Bandwidth
(KHZ) Verdict
GSM1900
GSM
LCH 243.69 307.45 PASS
MCH 251.38 310.13 PASS
HCH 248.77 311.26 PASS
EDGE
LCH 243.92 309.14 PASS
MCH 246.50 306.35 PASS
HCH 242.85 313.03 PASS
For GSM

Report No.: AGC00639170404FE02 Page 30 of 73
Test Band=GSM850/GSM1900
Test Mode=GSM/ EDGE
GSM 850-LCH-GSM GSM 850-MCH-GSM
GSM 850-HCH-GSM GSM 850-LCH-EDGE
GSM 850-MCH-EDGE GSM 850-HCH-EDGE

Report No.: AGC00639170404FE02 Page 31 of 73
GSM 1900-LCH-GSM GSM 1900-MCH-GSM
GSM 1900-HCH-GSM GSM 1900-LCH-EDGE
GSM 1900-MCH-EDGE GSM 1900-HCH-EDGE
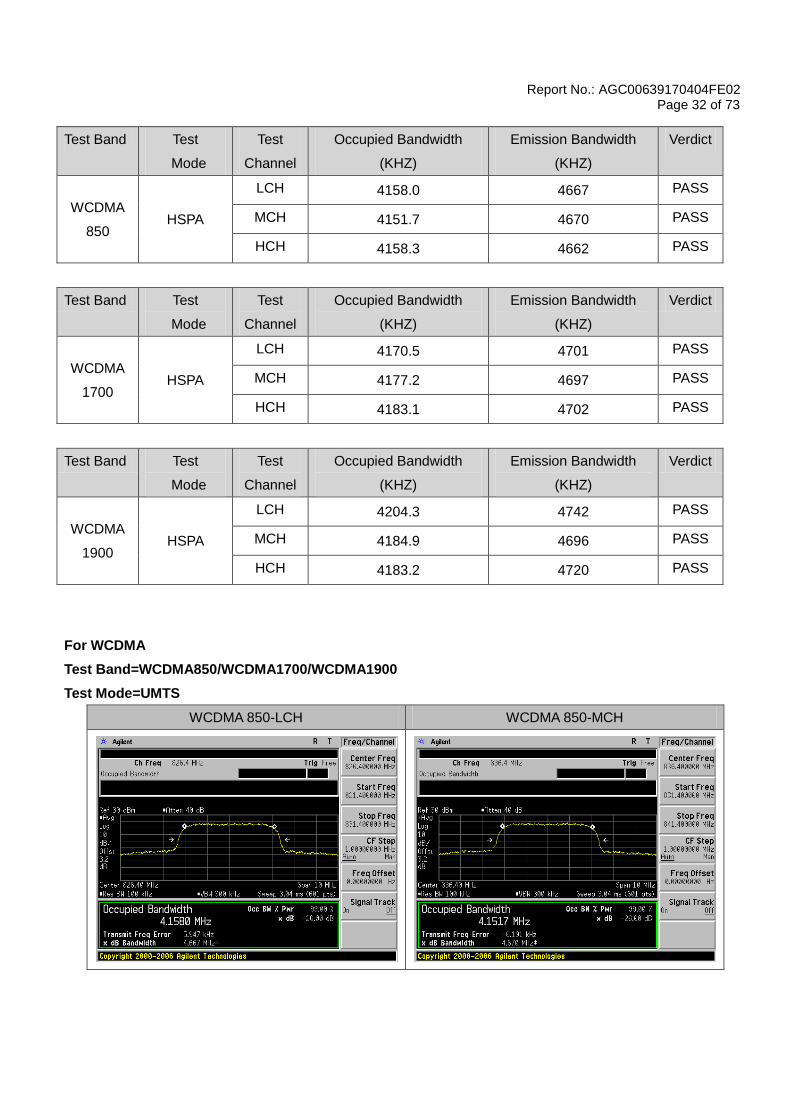
Report No.: AGC00639170404FE02 Page 32 of 73
Test Band Test
Mode
Test
Channel
Occupied Bandwidth
(KHZ)
Emission Bandwidth
(KHZ)
Verdict
WCDMA
850 HSPA
LCH 4158.0 4667 PASS
MCH 4151.7 4670 PASS
HCH 4158.3 4662 PASS
Test Band Test
Mode
Test
Channel
Occupied Bandwidth
(KHZ)
Emission Bandwidth
(KHZ)
Verdict
WCDMA
1700 HSPA
LCH 4170.5 4701 PASS
MCH 4177.2 4697 PASS
HCH 4183.1 4702 PASS
Test Band Test
Mode
Test
Channel
Occupied Bandwidth
(KHZ)
Emission Bandwidth
(KHZ)
Verdict
WCDMA
1900 HSPA
LCH 4204.3 4742 PASS
MCH 4184.9 4696 PASS
HCH 4183.2 4720 PASS
For WCDMA
Test Band=WCDMA850/WCDMA1700/WCDMA1900
Test Mode=UMTS
WCDMA 850-LCH WCDMA 850-MCH
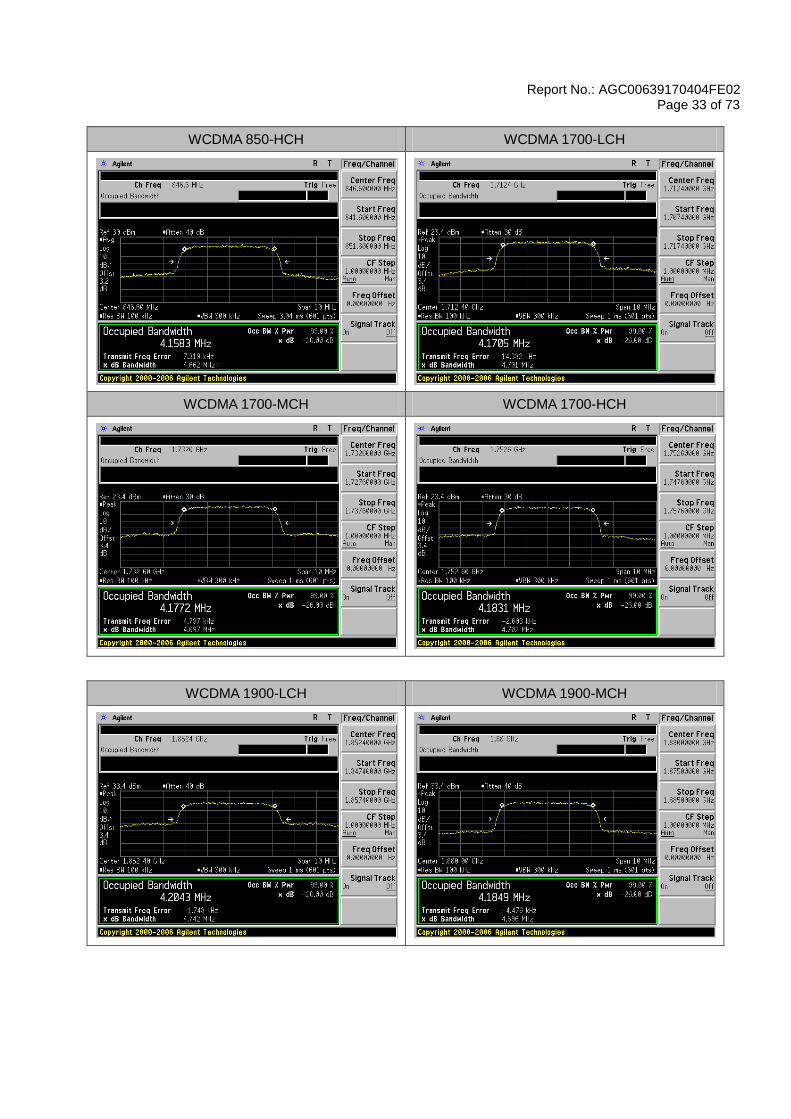
Report No.: AGC00639170404FE02 Page 33 of 73
WCDMA 850-HCH WCDMA 1700-LCH
WCDMA 1700-MCH WCDMA 1700-HCH
WCDMA 1900-LCH WCDMA 1900-MCH

Report No.: AGC00639170404FE02 Page 34 of 73
WCDMA 1900-HCH
8. BAND EDGE
8.1 MEASUREMENT METHOD
1. All out of band emissions are measured with an analyzer spectrum connected to the antenna terminal of the EUT
while the EUT at its maximum duty cycle, at maximum power, and at the approximate frequencies. All data rates were
investigated to determine the worst case configuration
2. The test set up and general procedure is similar to conducted peak output power test. Only different for setting the
measurement configuration of the measuring instrument of Spectrum Analyzer.
3. Start and stop frequency were set such that the band edge would be placed in the center of the plot.
4. Span was set large enough so as to capture all out of band emissions near the band edge.
5. RBW>1% of the emission bandwidth, VBW >=3 x RBW, Detector=RMS, Number of points>=2 x Span/RBW, Trace
mode=max hold, Sweep time=auto couple, and the trace was allowed to stabilize
8.2 PROVISIONS APPLICABLE
As Specified in FCC rules of 22.917(a) 、24.238(a) and KDB 971168 V02r02
8.3 MEASUREMENT RESULT
APPENDIX B: BAND EDGES COMPLIANCE
Test Results
For GSM
Test Band=GSM850/GSM1900
Test Mode=GSM/EDGE
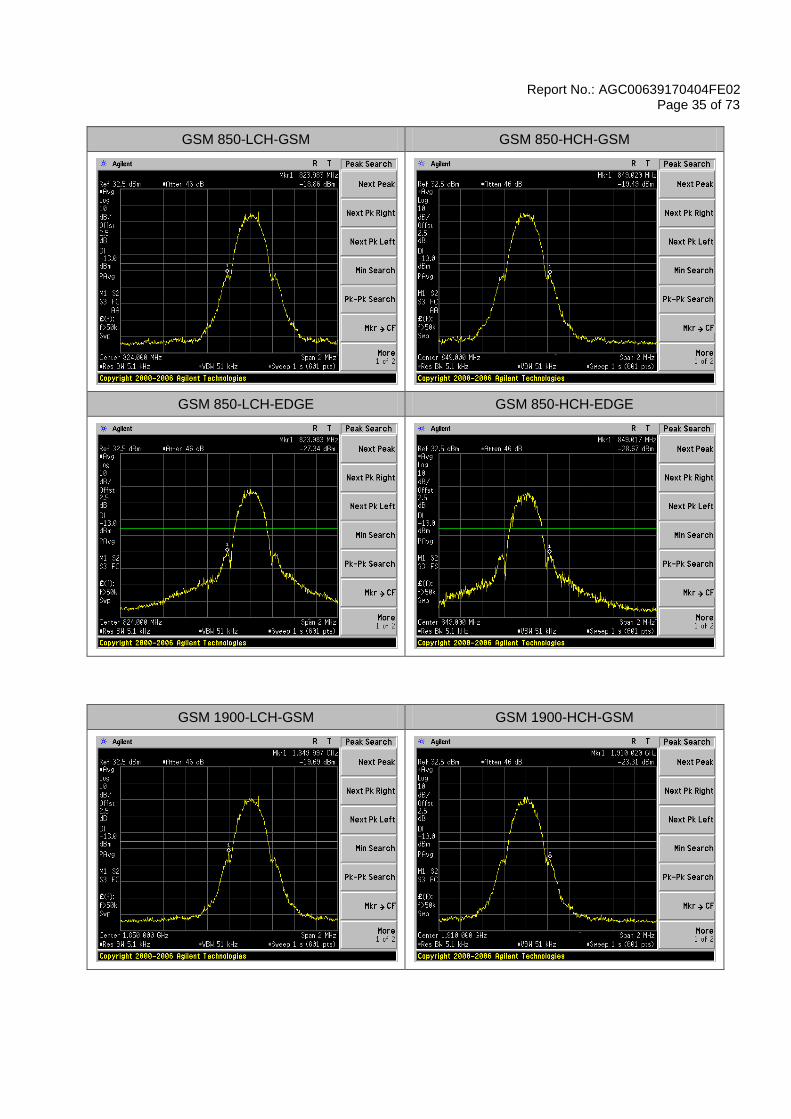
Report No.: AGC00639170404FE02 Page 35 of 73
GSM 850-LCH-GSM GSM 850-HCH-GSM
GSM 850-LCH-EDGE GSM 850-HCH-EDGE
GSM 1900-LCH-GSM GSM 1900-HCH-GSM

Report No.: AGC00639170404FE02 Page 36 of 73
GSM 1900-LCH-EDGE GSM 1900-HCH-EDGE
For WCDMA
Test Band=WCDMA850/WCDMA1700/WCDMA1900
Test Mode=UMTS
WCDMA 850-LCH WCDMA 850-HCH
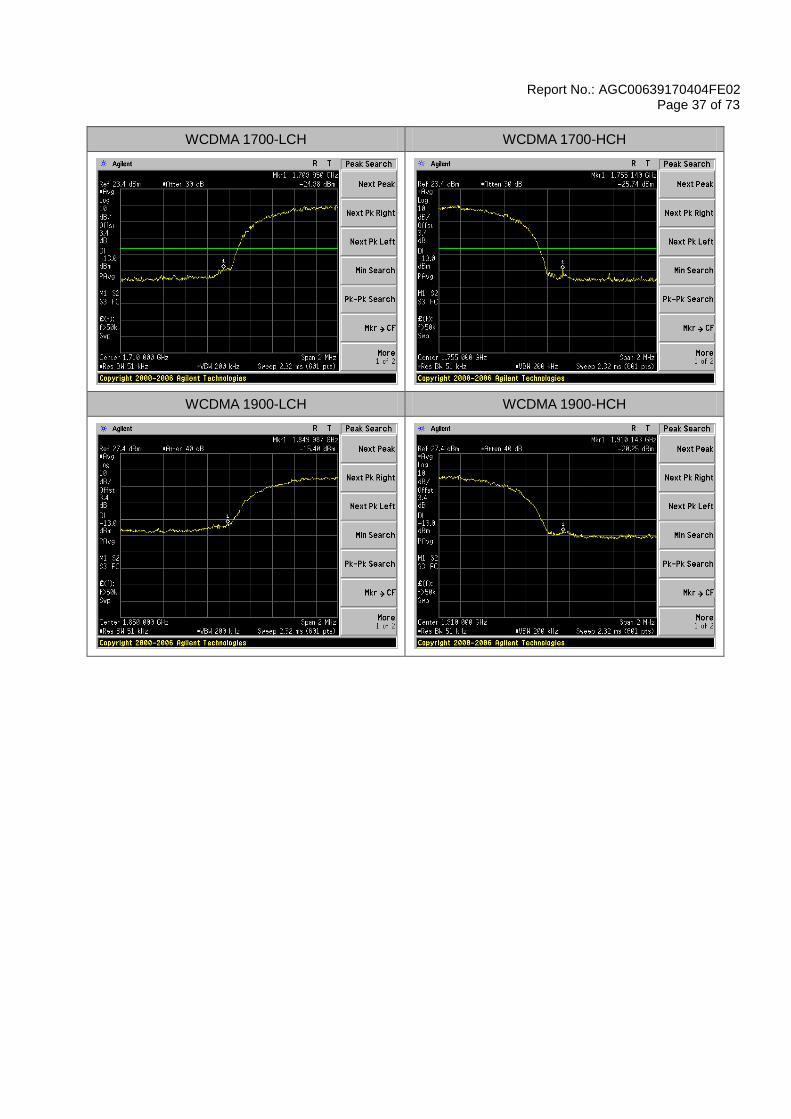
Report No.: AGC00639170404FE02 Page 37 of 73
WCDMA 1700-LCH WCDMA 1700-HCH
WCDMA 1900-LCH WCDMA 1900-HCH
Report No.: AGC00639170404FE02 Page 38 of 73
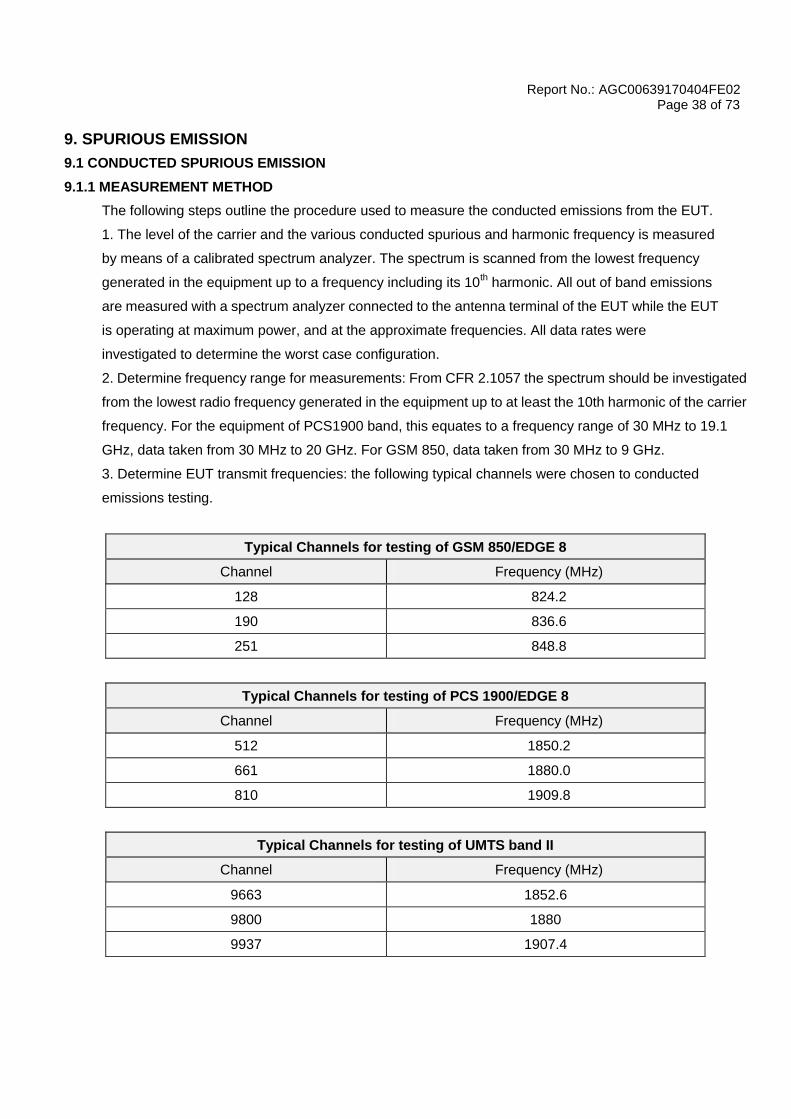
9. SPURIOUS EMISSION
9.1 CONDUCTED SPURIOUS EMISSION
9.1.1 MEASUREMENT METHOD
The following steps outline the procedure used to measure the conducted emissions from the EUT.
1. The level of the carrier and the various conducted spurious and harmonic frequency is measured
by means of a calibrated spectrum analyzer. The spectrum is scanned from the lowest frequency
generated in the equipment up to a frequency including its 10th harmonic. All out of band emissions
are measured with a spectrum analyzer connected to the antenna terminal of the EUT while the EUT
is operating at maximum power, and at the approximate frequencies. All data rates were
investigated to determine the worst case configuration.
2. Determine frequency range for measurements: From CFR 2.1057 the spectrum should be investigated
from the lowest radio frequency generated in the equipment up to at least the 10th harmonic of the carrier
frequency. For the equipment of PCS1900 band, this equates to a frequency range of 30 MHz to 19.1
GHz, data taken from 30 MHz to 20 GHz. For GSM 850, data taken from 30 MHz to 9 GHz.
3. Determine EUT transmit frequencies: the following typical channels were chosen to conducted
emissions testing.
Typical Channels for testing of GSM 850/EDGE 8
Channel Frequency (MHz)
128 824.2
190 836.6
251 848.8
Typical Channels for testing of PCS 1900/EDGE 8
Channel Frequency (MHz)
512 1850.2
661 1880.0
810 1909.8
Typical Channels for testing of UMTS band II
Channel Frequency (MHz)
9663 1852.6
9800 1880
9937 1907.4

Report No.: AGC00639170404FE02 Page 39 of 73
Typical Channels for testing of UMTS band IV
Channel Frequency (MHz)
1887 1712.4
1987 1732.6
2087 1752.6
Typical Channels for testing of UMTS band V
Channel Frequency (MHz)
4358 826.6
4407 836.4
4457 846.4
9.1.2 PROVISIONS APPLICABLE
On any frequency outside frequency band of the USPCS spectrum, the power of any emission shall be
attenuated below the transmitter power (P, in Watts) by at least 43+10Log(P) dB. For all power levels +30
dBm to 0 dBm, this becomes a constant specification limit of -13 dBm.

Report No.: AGC00639170404FE02 Page 40 of 73
9.1.3 MEASUREMENT RESULT
APPENDIX C: SPURIOUS EMISSION AT ANTENNA TERMINAL
Test Results
Test Band=GSM850/GSM1900
Test Mode=GSM/EDGE
GSM 850-LCH-GSM GSM 850-LCH-GSM
GSM 850-MCH-GSM GSM 850-MCH-GSM
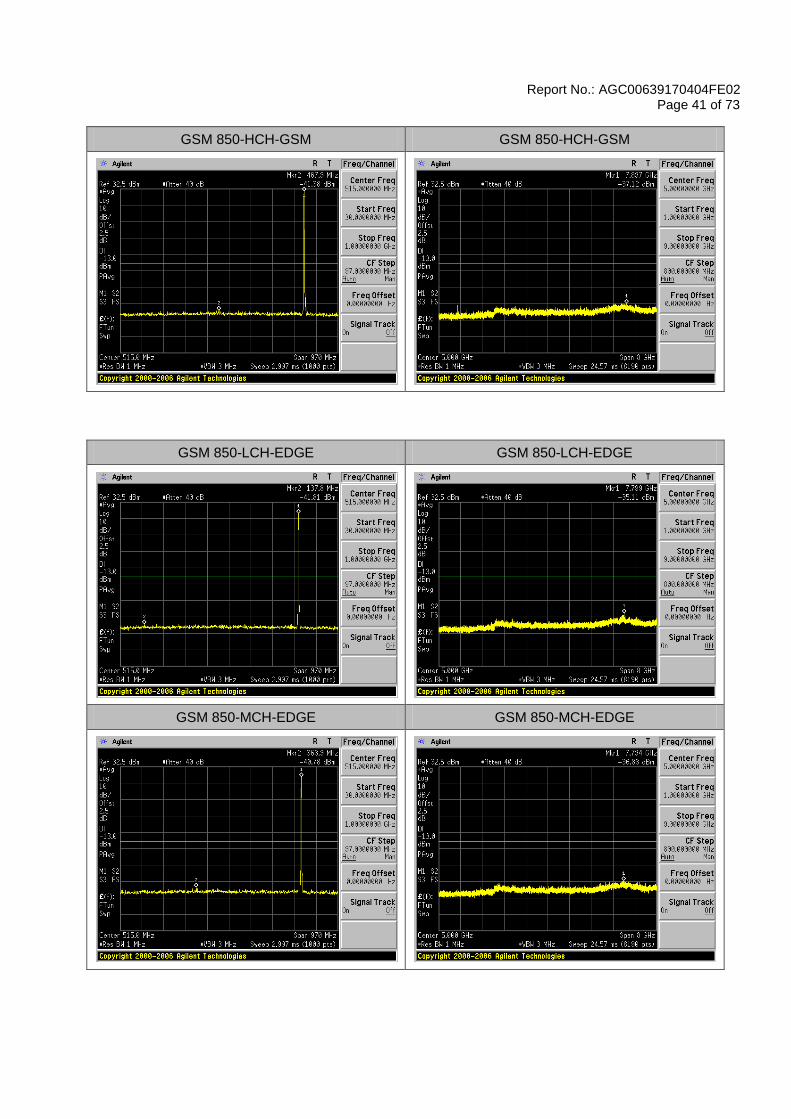
Report No.: AGC00639170404FE02 Page 41 of 73
GSM 850-HCH-GSM GSM 850-HCH-GSM
GSM 850-LCH-EDGE GSM 850-LCH-EDGE
GSM 850-MCH-EDGE GSM 850-MCH-EDGE
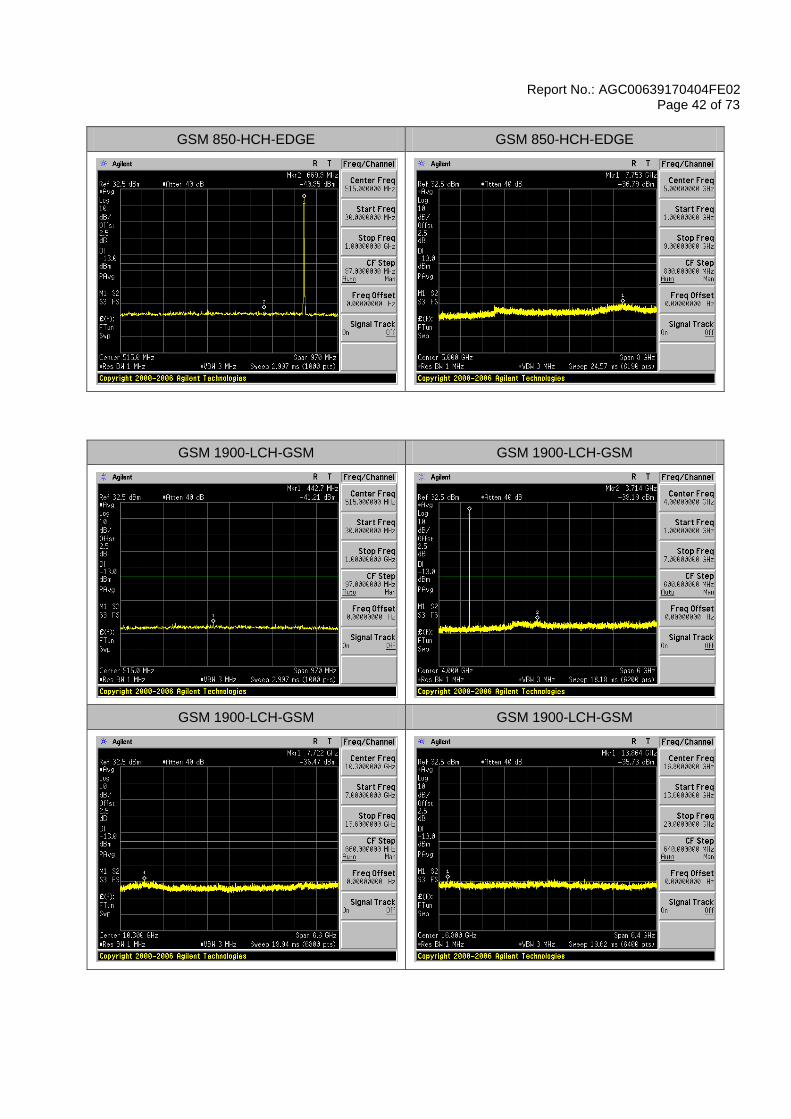
Report No.: AGC00639170404FE02 Page 42 of 73
GSM 850-HCH-EDGE GSM 850-HCH-EDGE
GSM 1900-LCH-GSM GSM 1900-LCH-GSM
GSM 1900-LCH-GSM GSM 1900-LCH-GSM

Report No.: AGC00639170404FE02 Page 43 of 73
GSM 1900-MCH-GSM GSM 1900-MCH-GSM
GSM 1900-MCH-GSM GSM 1900-MCH-GSM
GSM 1900-HCH-GSM GSM 1900-HCH-GSM

Report No.: AGC00639170404FE02 Page 44 of 73
GSM 1900-HCH-GSM GSM 1900-HCH-GSM
GSM 1900-LCH-EDGE GSM 1900-LCH-EDGE

Report No.: AGC00639170404FE02 Page 45 of 73
GSM 1900-LCH-EDGE GSM 1900-LCH-EDGE
GSM 1900-MCH-EDGE GSM 1900-MCH-EDGE
GSM 1900-MCH-EDGE GSM 1900-MCH-EDGE
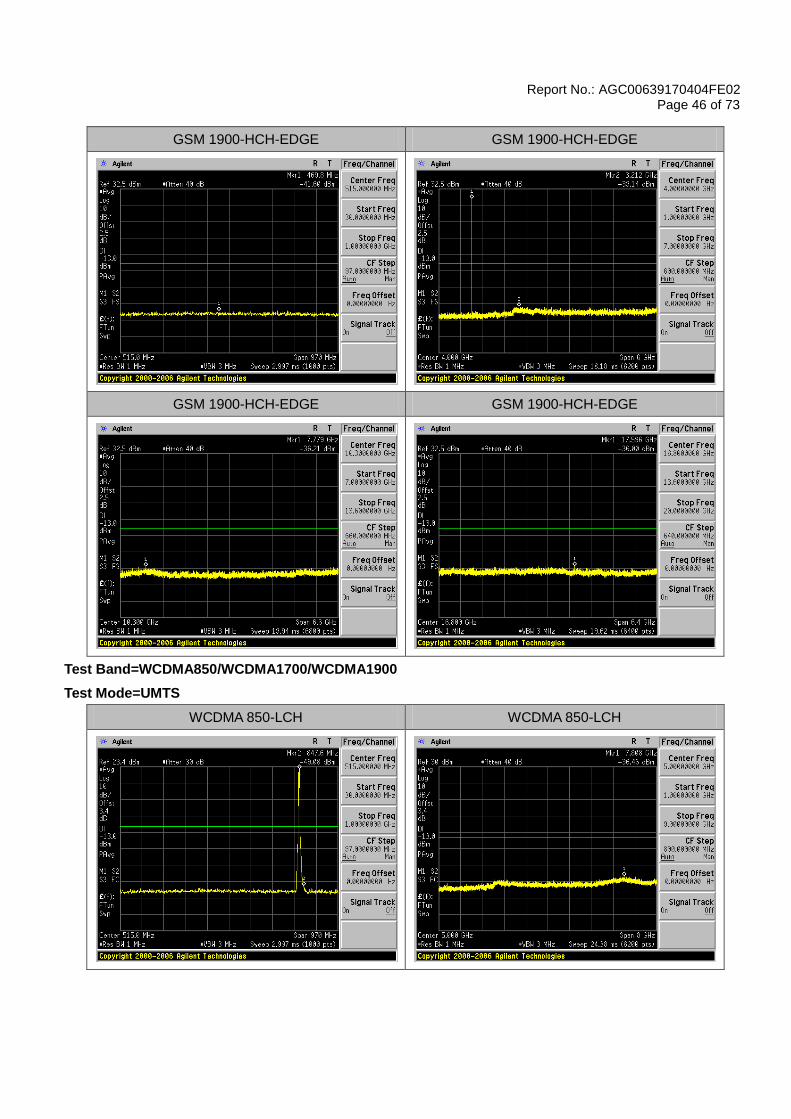
Report No.: AGC00639170404FE02 Page 46 of 73
GSM 1900-HCH-EDGE GSM 1900-HCH-EDGE
GSM 1900-HCH-EDGE GSM 1900-HCH-EDGE
Test Band=WCDMA850/WCDMA1700/WCDMA1900
Test Mode=UMTS
WCDMA 850-LCH WCDMA 850-LCH

Report No.: AGC00639170404FE02 Page 47 of 73
WCDMA 850-MCH WCDMA 850-MCH
WCDMA 850-HCH WCDMA 850-HCH
WCDMA 1700-LCH WCDMA 1700-LCH

Report No.: AGC00639170404FE02 Page 48 of 73
WCDMA 1700-LCH WCDMA 1700-LCH
WCDMA 1700-MCH WCDMA 1700-MCH
WCDMA 1700-MCH WCDMA 1700-MCH
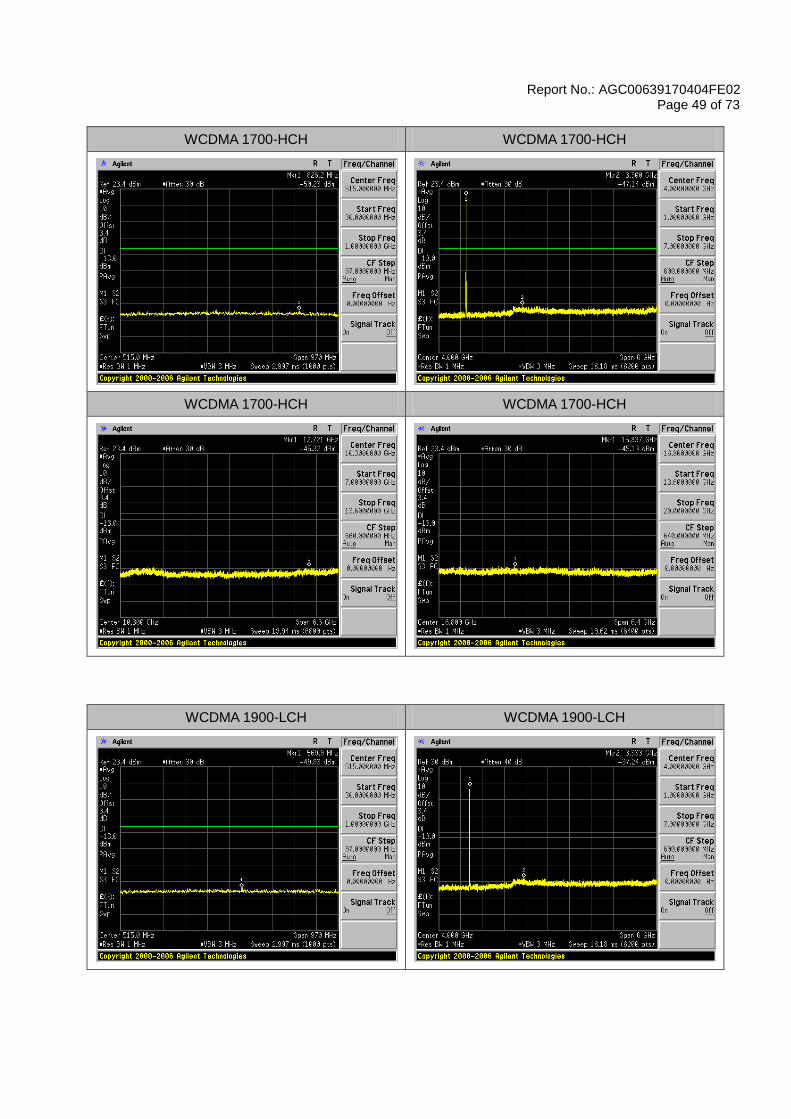
Report No.: AGC00639170404FE02 Page 49 of 73
WCDMA 1700-HCH WCDMA 1700-HCH
WCDMA 1700-HCH WCDMA 1700-HCH
WCDMA 1900-LCH WCDMA 1900-LCH

Report No.: AGC00639170404FE02 Page 50 of 73
WCDMA 1900-LCH WCDMA 1900-LCH
WCDMA 1900-MCH WCDMA 1900-MCH
WCDMA 1900-MCH WCDMA 1900-MCH
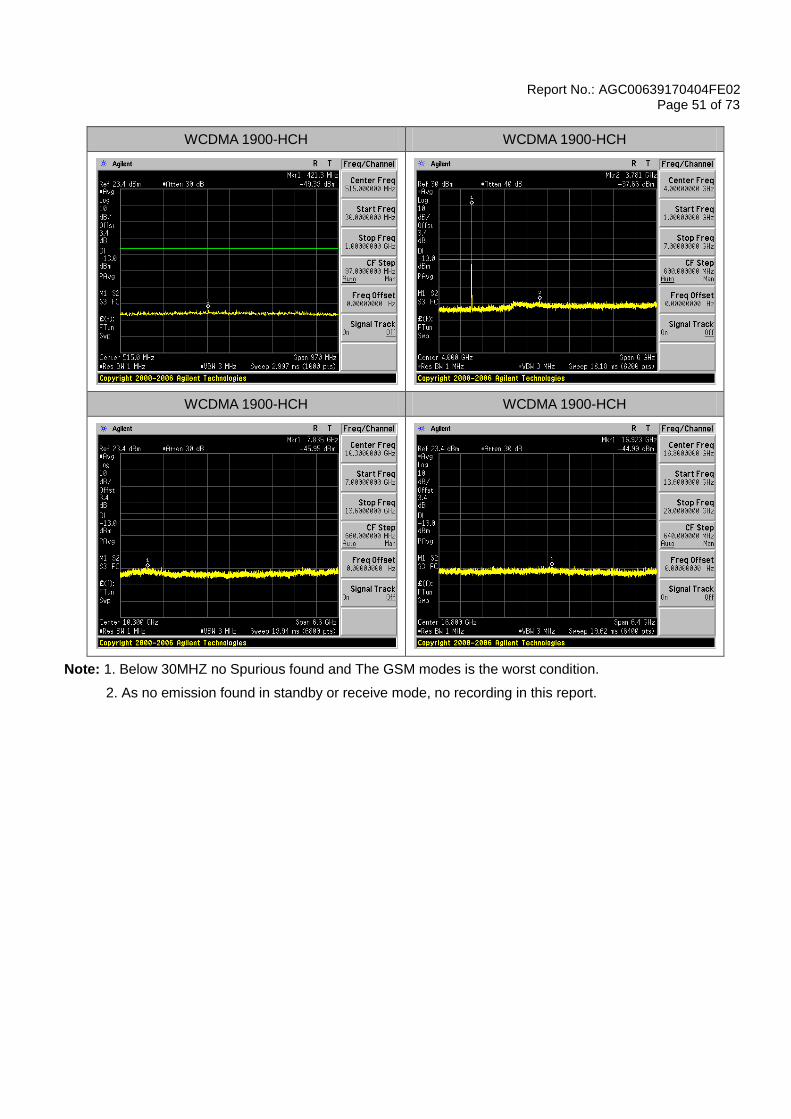
Report No.: AGC00639170404FE02 Page 51 of 73
WCDMA 1900-HCH WCDMA 1900-HCH
WCDMA 1900-HCH WCDMA 1900-HCH
Note: 1. Below 30MHZ no Spurious found and The GSM modes is the worst condition.
2. As no emission found in standby or receive mode, no recording in this report.

Report No.: AGC00639170404FE02 Page 52 of 73
9.2 RADIATED SPURIOUS EMISSION
9.2.1 MEASUREMENT METHOD
The measurements procedures specified in TIA-603-D-2010 were used for testing. The spectrum was
scanned from 30 MHz to the 10th harmonic of the highest frequency generated within the equipment. The
resolution bandwidth is set 1MHz as outlined in Part 24.238. The measurements were performed on all
modes(GPRS/EGPRS 850, GPRS/EGPRS 1900, HSPA band II, HSPA band IV, HSPA band V) at 3
typical channels(the Top Channel, the Middle Channel and the Bottom Channel) for each band.
The procedure of radiated spurious emissions is as follows:
a) Pre-calibration With pre-calibration method, the Radiated Spurious Emissions(RSE) is calculated as,
RSE=Rx(dBuV)+CL(dB)+SA(dB)+Gain(dBi)-107(dBuV to dBm)The SA is calibrated using following
setup.
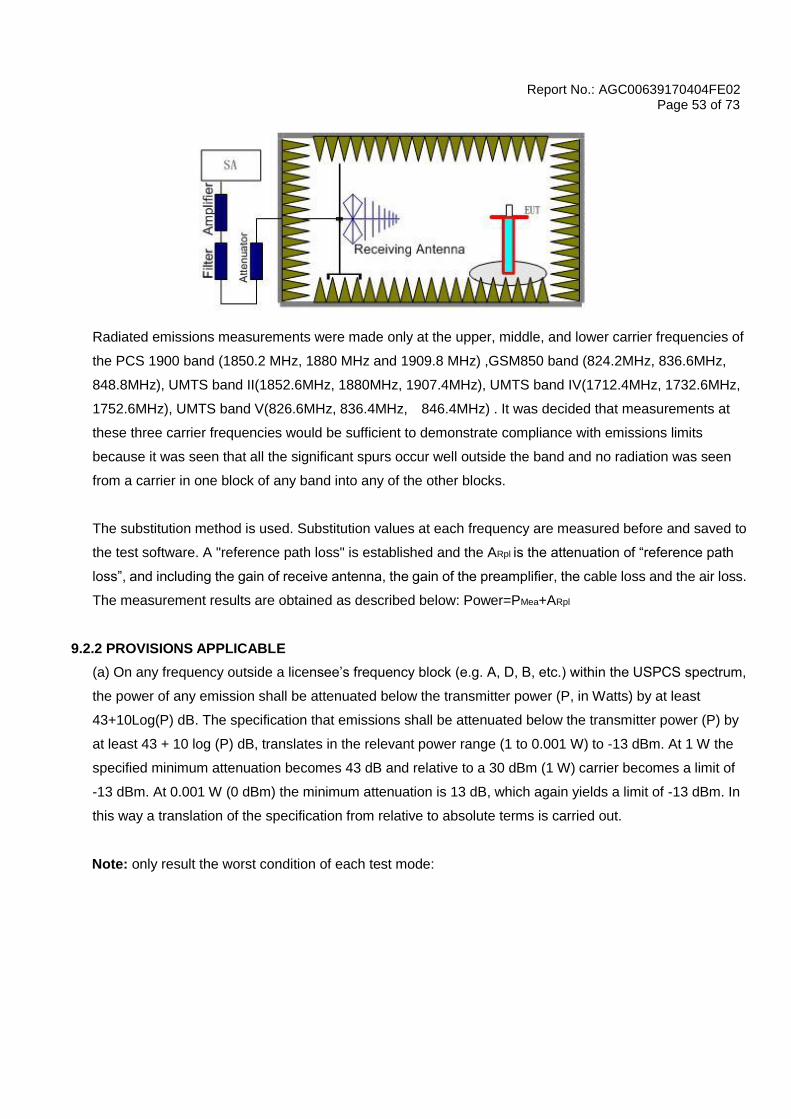
b) EUT was placed on a 0.8 meter high non-conductive stand at a 3 meter test distance from the receive
antenna. A receiving antenna was placed on the antenna mast 3 meters from the test item for emission
measurements. The height of receiving antenna is 0.8m. The test setup refers to figure below. Detected
emissions were maximized at each frequency by rotating the test item and adjusting the receiving antenna
polarization. The radiated emission measurements of all non-harmonic and harmonics of the transmit
frequency through the 10th harmonic were measured with peak detector and 1MHz bandwidth.
Report No.: AGC00639170404FE02 Page 53 of 73
Radiated emissions measurements were made only at the upper, middle, and lower carrier frequencies of
the PCS 1900 band (1850.2 MHz, 1880 MHz and 1909.8 MHz) ,GSM850 band (824.2MHz, 836.6MHz,
848.8MHz), UMTS band II(1852.6MHz, 1880MHz, 1907.4MHz), UMTS band IV(1712.4MHz, 1732.6MHz,
1752.6MHz), UMTS band V(826.6MHz, 836.4MHz, 846.4MHz) . It was decided that measurements at
these three carrier frequencies would be sufficient to demonstrate compliance with emissions limits
because it was seen that all the significant spurs occur well outside the band and no radiation was seen
from a carrier in one block of any band into any of the other blocks.
The substitution method is used. Substitution values at each frequency are measured before and saved to
the test software. A "reference path loss" is established and the ARpl is the attenuation of “reference path
loss”, and including the gain of receive antenna, the gain of the preamplifier, the cable loss and the air loss.
The measurement results are obtained as described below: Power=PMea+ARpl
9.2.2 PROVISIONS APPLICABLE
(a) On any frequency outside a licensee’s frequency block (e.g. A, D, B, etc.) within the USPCS spectrum,
the power of any emission shall be attenuated below the transmitter power (P, in Watts) by at least
43+10Log(P) dB. The specification that emissions shall be attenuated below the transmitter power (P) by
at least 43 + 10 log (P) dB, translates in the relevant power range (1 to 0.001 W) to -13 dBm. At 1 W the
specified minimum attenuation becomes 43 dB and relative to a 30 dBm (1 W) carrier becomes a limit of
-13 dBm. At 0.001 W (0 dBm) the minimum attenuation is 13 dB, which again yields a limit of -13 dBm. In
this way a translation of the specification from relative to absolute terms is carried out.
Note: only result the worst condition of each test mode:
Report No.: AGC00639170404FE02 Page 54 of 73
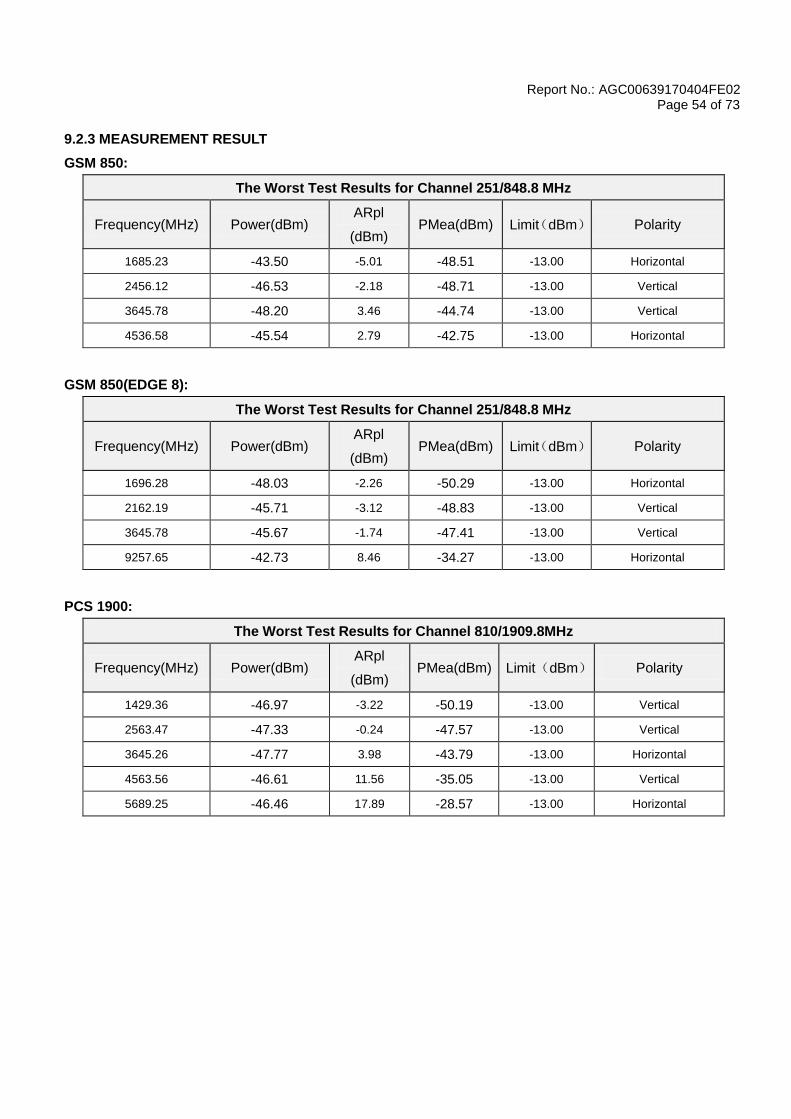
9.2.3 MEASUREMENT RESULT
GSM 850:
The Worst Test Results for Channel 251/848.8 MHz
Frequency(MHz) Power(dBm) ARpl
(dBm) PMea(dBm) Limit(dBm) Polarity
1685.23 -43.50 -5.01 -48.51 -13.00 Horizontal
2456.12 -46.53 -2.18 -48.71 -13.00 Vertical
3645.78 -48.20 3.46 -44.74 -13.00 Vertical
4536.58 -45.54 2.79 -42.75 -13.00 Horizontal
GSM 850(EDGE 8):
The Worst Test Results for Channel 251/848.8 MHz
Frequency(MHz) Power(dBm) ARpl
(dBm) PMea(dBm) Limit(dBm) Polarity
1696.28 -48.03 -2.26 -50.29 -13.00 Horizontal
2162.19 -45.71 -3.12 -48.83 -13.00 Vertical
3645.78 -45.67 -1.74 -47.41 -13.00 Vertical
9257.65 -42.73 8.46 -34.27 -13.00 Horizontal
PCS 1900:
The Worst Test Results for Channel 810/1909.8MHz
Frequency(MHz) Power(dBm) ARpl
(dBm) PMea(dBm) Limit(dBm) Polarity
1429.36 -46.97 -3.22 -50.19 -13.00 Vertical
2563.47 -47.33 -0.24 -47.57 -13.00 Vertical
3645.26 -47.77 3.98 -43.79 -13.00 Horizontal
4563.56 -46.61 11.56 -35.05 -13.00 Vertical
5689.25 -46.46 17.89 -28.57 -13.00 Horizontal

Report No.: AGC00639170404FE02 Page 55 of 73
PCS 1900(EDGE 8):
The Worst Test Results for Channel 810/1909.8MHz
Frequency(MHz) Power(dBm) ARpl
(dBm) PMea(dBm) Limit(dBm) Polarity
1430.15 -47.42 2.7 -44.72 -13.00 Vertical
9367.91 -48.37 11.6 -36.77 -13.00 Vertical
13356.68 -50.10 14.89 -35.21 -13.00 Horizontal
15249.71 -47.31 13.87 -33.44 -13.00 Vertical
17913.63 -44.37 19.76 -24.61 -13.00 Horizontal
HSPA band II:
The Worst Test Results for Channel 9938/1907.4MHz
Frequency(MHz) Power(dBm) ARpl
(dBm) PMea(dBm) Limit(dBm) Polarity
2000.00 -39.09 -2.25 -41.34 -13.00 Vertical
9548.50 -41.53 -3.03 -44.56 -13.00 Horizontal
13367.40 -45.05 -1.87 -46.92 -13.00 Horizontal
15277.80 -39.85 8.52 -31.33 -13.00 Vertical
17931.60 -54.44 18.7 -35.74 -13.00 Horizontal
HSPA band IV:
The Worst Test Results for Channel 2087/1752.5MHz
Frequency(MHz) Power(dBm) ARpl
(dBm) PMea(dBm) Limit(dBm) Polarity
1536.98 -47.26 9.7 -37.56 -13.00 Vertical
2536.41 -48.16 11.6 -36.56 -13.00 Horizontal
3786.52 -49.02 14.89 -34.13 -13.00 Horizontal
5123.56 -47.80 13.87 -33.93 -13.00 Vertical
6615.32 -43.79 19.76 -24.03 -13.00 Horizontal
Report No.: AGC00639170404FE02 Page 56 of 73
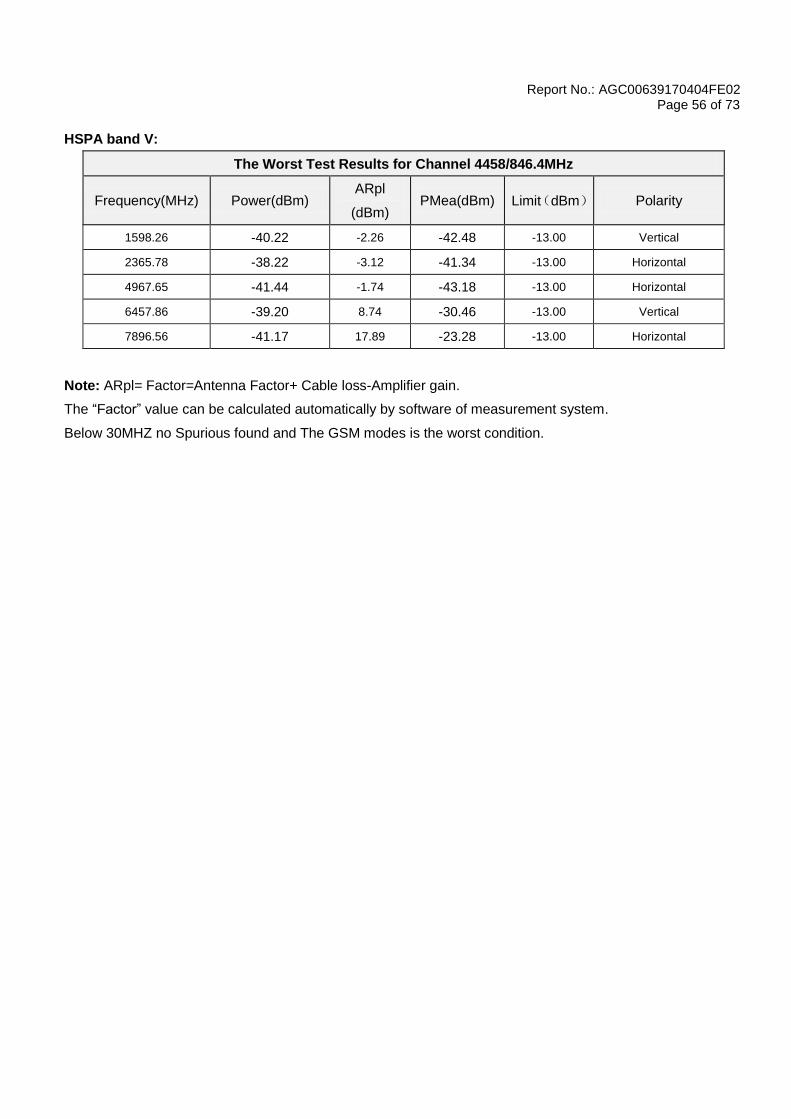
HSPA band V:
The Worst Test Results for Channel 4458/846.4MHz
Frequency(MHz) Power(dBm) ARpl
(dBm) PMea(dBm) Limit(dBm) Polarity
1598.26 -40.22 -2.26 -42.48 -13.00 Vertical
2365.78 -38.22 -3.12 -41.34 -13.00 Horizontal
4967.65 -41.44 -1.74 -43.18 -13.00 Horizontal
6457.86 -39.20 8.74 -30.46 -13.00 Vertical
7896.56 -41.17 17.89 -23.28 -13.00 Horizontal
Note: ARpl= Factor=Antenna Factor+ Cable loss-Amplifier gain.
The “Factor” value can be calculated automatically by software of measurement system.
Below 30MHZ no Spurious found and The GSM modes is the worst condition.

Report No.: AGC00639170404FE02 Page 57 of 73
10. MAINS CONDUCTED EMISSION
10.1 MEASUREMENT METHOD
The measurement procedure specified in ANSI/TIA-603-D-2010 was used for testing. Conducted Emission
was measured with travel charger.
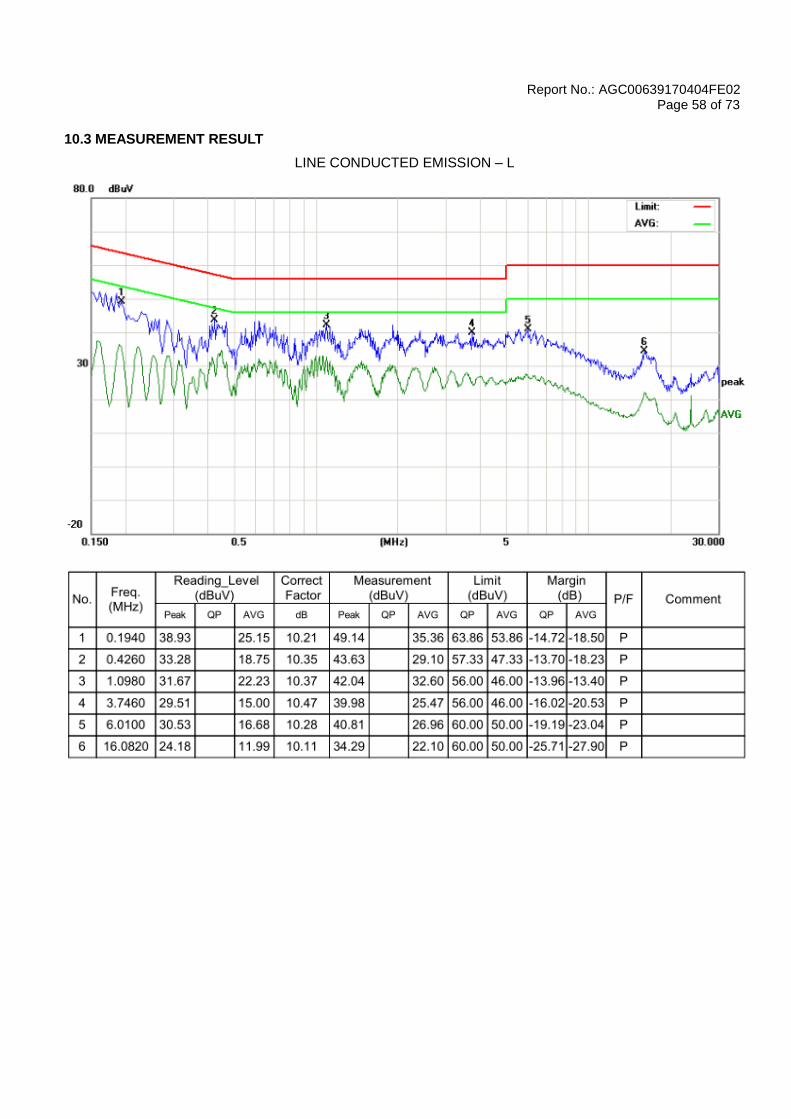
10.2 PROVISIONS APPLICABLE
Frequency of Emission (MHz) Conducted Limit(dBuV)
Quasi-Peak Average
0.15 – 0.5 66 to 56 * 56 to 46 *
0.5 – 5 56 46
5 – 30 60 50
*Decreases with the logarithm of the frequency.
*The lower limit shall apply at the transition frequency.
Note: The GSM850 mode is the worst condition and the test result as following:
Report No.: AGC00639170404FE02 Page 58 of 73
10.3 MEASUREMENT RESULT
LINE CONDUCTED EMISSION – L
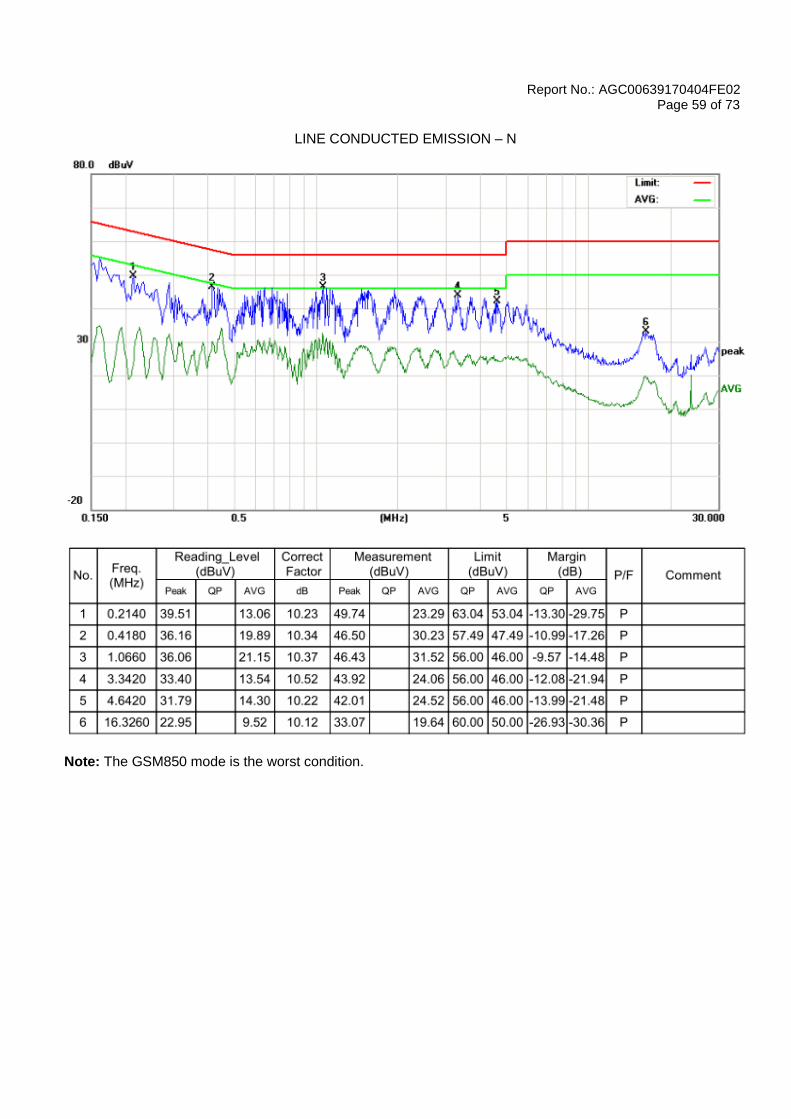
Report No.: AGC00639170404FE02 Page 59 of 73
LINE CONDUCTED EMISSION – N
Note: The GSM850 mode is the worst condition.
Report No.: AGC00639170404FE02 Page 60 of 73
11. FREQUENCY STABILITY
11.1 MEASUREMENT METHOD
In order to measure the carrier frequency under the condition of AFC lock, it is necessary to make
measurements with the EUT in a “call mode”. This is accomplished with the use of R&S CMU200 DIGITAL
RADIO COMMUNICATION TESTER.
1 , Measure the carrier frequency at room temperature.
2 , Subject the EUT to overnight soak at -10℃.
3 , With the EUT, powered via nominal voltage, connected to the CMU200 and in a simulated call on
channel 661 for PCS 1900 band , channel 190 for GSM 850 band, channel 9400 for UMTS band II and
channel 4175 for UMTS band V measure the carrier frequency. These measurements should be made
within 2 minutes of Powering up the EUT, to prevent significant self-warming.
4 , Repeat the above measurements at 10℃ increments from -10℃ to +55℃. Allow at least 1 1/2 hours
at each temperature, unpowered, before making measurements.
5 , Re-measure carrier frequency at room temperature with nominal voltage. Vary supply voltage from
minimum voltage to maximum voltage, in 0.1Volt increments re-measuring carrier frequency at each
voltage. Pause at nominal voltage for 1 1/2 hours unpowered, to allow any self-heating to stabilize, before
continuing.
6 , Subject the EUT to overnight soak at +55℃.
7 , With the EUT, powered via nominal voltage, connected to the CMU200 and in a simulated call on the
centre channel, measure the carrier frequency. These measurements should be made within 2 minutes of
Powering up the EUT, to prevent significant self-warming.
8 , Repeat the above measurements at 10℃ increments from +55℃ to -10℃. Allow at least 1 1/2 hours
at each temperature, unpowered, before making measurements.
9 , At all temperature levels hold the temperature to +/- 0.5℃ during the measurement procedure.
11.2 PROVISIONS APPLICABLE
11.2.1 For Hand carried battery powered equipment
According to the ANSI/TIA-603-D-2010,the frequency stability of the carrier shall be accurate to
within 0.1 ppm of the received frequency from the base station. This accuracy is sufficient to meet Sec.
24.235, Frequency Stability. The frequency stability shall be sufficient to ensure that the fundamental
emission stays within the authorized frequency block. As this transceiver is considered "Hand carried,
battery powered equipment" Section 2.1055(d)(2) applies. This requires that the lower voltage for
frequency stability testing be specified by the manufacturer. This transceiver is specified to operate with an
input voltage of between 3.4VDC and 4.2VDC, with a nominal voltage of 3.7VDC. Operation above or
below these voltage limits is prohibited by transceiver software in order to prevent improper operation as
well as to protect components from overstress. These voltages represent a tolerance of -10 % and
+12.5 %. For the purposes of measuring frequency stability these voltage limits are to be used.
Report No.: AGC00639170404FE02 Page 61 of 73
11.2.2 For equipment powered by primary supply voltage
According to the ANSI/TIA-603-D-2010,the frequency stability of the carrier shall be accurate to
within 0.1 ppm of the received frequency from the base station. This accuracy is sufficient to meet Sec.
24.235, Frequency Stability. The frequency stability shall be sufficient to ensure that the fundamental
emission stays within the authorized frequency block. For this EUT section 2.1055(d)(1) applies. This
requires varying primary supply voltage from 85 to 115 percent of the nominal value for other than hand
carried battery equipment, the normal environment temperature is 20oC.

Report No.: AGC00639170404FE02 Page 62 of 73
11.3 MEASUREMENT RESULT
Appendix D:Frequency Stability
Test Results
Frequency Error vs. Voltage:
Test
Band
Test
Mode
Test
Channe
l
Test
Temp.
Test
Volt.(V)
Freq.Error
(Hz)
Freq.vs.rated
(ppm)
Limit
(ppm)
Verdic
t
GSM850 GSM
LCH
TN 3.4 7.17 0.01 ±2.5 PASS
TN 3.7 5.88 0.01 ±2.5 PASS
TN 4.2 9.36 0.01 ±2.5 PASS
MCH
TN 3.4 6.65 0.01 ±2.5 PASS
TN 3.7 5.42 0.01 ±2.5 PASS
TN 4.2 4.65 0.01 ±2.5 PASS
HCH
TN 3.4 5.81 0.01 ±2.5 PASS
TN 3.7 6.46 0.01 ±2.5 PASS
TN 4.2 3.36 0.00 ±2.5 PASS
Test
Band
Test
Mode
Test
Channe
l
Test
Temp.
Test
Volt.
(V)
Freq.Error
(Hz)
Freq.vs.rated
(ppm)
Limit
(ppm)
Verdict
GSM850 EDGE
LCH
TN 3.4 19.79 0.02 ±2.5 PASS
TN 3.7 21.86 0.03 ±2.5 PASS
TN 4.2 20.79 0.03 ±2.5 PASS
MCH
TN 3.4 14.04 0.02 ±2.5 PASS
TN 3.7 17.08 0.02 ±2.5 PASS
TN 4.2 16.89 0.02 ±2.5 PASS
HCH
TN 3.4 17.24 0.02 ±2.5 PASS
TN 3.7 14.75 0.02 ±2.5 PASS
TN 4.2 13.33 0.02 ±2.5 PASS

Report No.: AGC00639170404FE02 Page 63 of 73
Test
Band
Test
Mode
Test
Channe
l
Test
Temp.
Test
Volt.
(V)
Freq.Error
(Hz)
Freq.vs.rated
(ppm)
Limit
(ppm
)
Verdict
GSM
1900 GSM
LCH
TN 3.4 3.55 0.00 ±2.5 PASS
TN 3.7 6.39 0.00 ±2.5 PASS
TN 4.2 8.01 0.00 ±2.5 PASS
MCH
TN 3.4 -0.97 0.00 ±2.5 PASS
TN 3.7 2.39 0.00 ±2.5 PASS
TN 4.2 1.36 0.00 ±2.5 PASS
HCH
TN 3.4 -3.03 0.00 ±2.5 PASS
TN 3.7 -3.16 0.00 ±2.5 PASS
TN 4.2 -1.29 0.00 ±2.5 PASS
Test
Band
Test
Mode
Test
Channe
l
Test
Temp.
Test
Volt.
(V)
Freq.Error
(Hz)
Freq.vs.rated
(ppm)
Limit
(ppm
)
Verdict
GSM
1900 EDGE
LCH
TN 3.4 23.34 0.01 ±2.5 PASS
TN 3.7 23.28 0.01 ±2.5 PASS
TN 4.2 18.56 0.01 ±2.5 PASS
MCH
TN 3.4 11.27 0.01 ±2.5 PASS
TN 3.7 7.75 0.00 ±2.5 PASS
TN 4.2 9.85 0.01 ±2.5 PASS
HCH
TN 3.4 5.84 0.00 ±2.5 PASS
TN 3.7 5.65 0.00 ±2.5 PASS
TN 4.2 3.20 0.00 ±2.5 PASS
Report No.: AGC00639170404FE02 Page 64 of 73
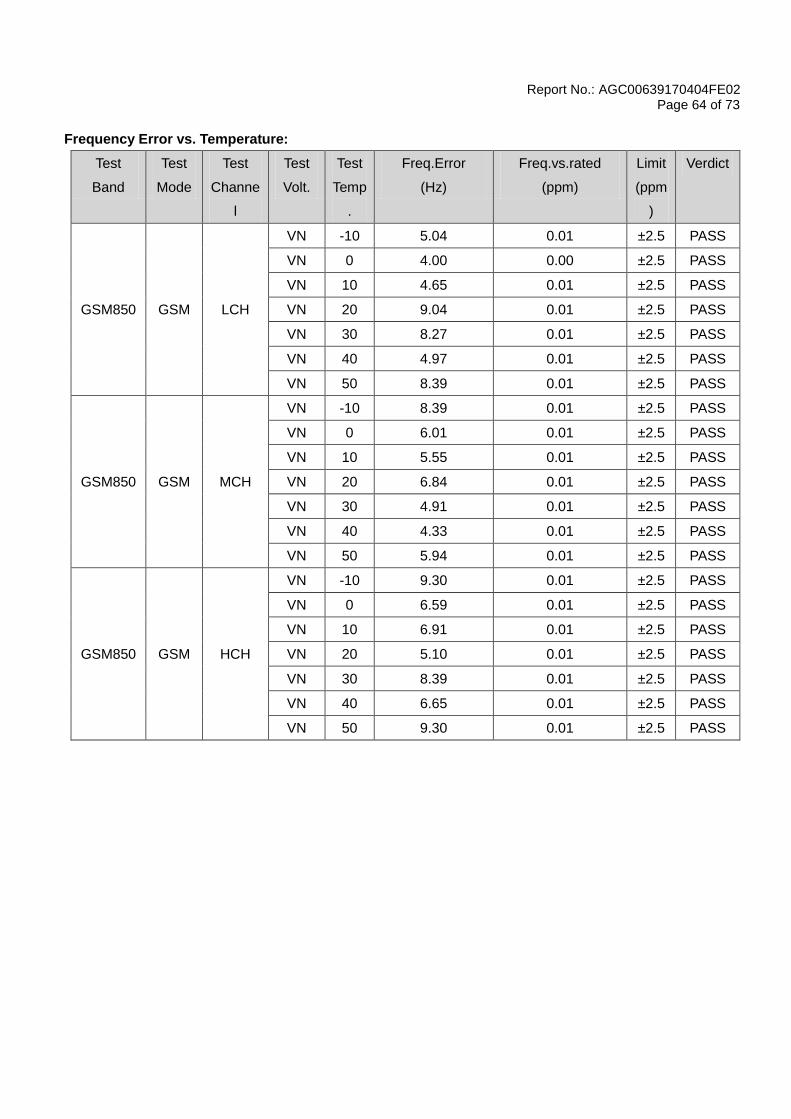
Frequency Error vs. Temperature:
Test
Band
Test
Mode
Test
Channe
l
Test
Volt.
Test
Temp
.
Freq.Error
(Hz)
Freq.vs.rated
(ppm)
Limit
(ppm
)
Verdict
GSM850 GSM LCH
VN -10 5.04 0.01 ±2.5 PASS
VN 0 4.00 0.00 ±2.5 PASS
VN 10 4.65 0.01 ±2.5 PASS
VN 20 9.04 0.01 ±2.5 PASS
VN 30 8.27 0.01 ±2.5 PASS
VN 40 4.97 0.01 ±2.5 PASS
VN 50 8.39 0.01 ±2.5 PASS
GSM850 GSM MCH
VN -10 8.39 0.01 ±2.5 PASS
VN 0 6.01 0.01 ±2.5 PASS
VN 10 5.55 0.01 ±2.5 PASS
VN 20 6.84 0.01 ±2.5 PASS
VN 30 4.91 0.01 ±2.5 PASS
VN 40 4.33 0.01 ±2.5 PASS
VN 50 5.94 0.01 ±2.5 PASS
GSM850 GSM HCH
VN -10 9.30 0.01 ±2.5 PASS
VN 0 6.59 0.01 ±2.5 PASS
VN 10 6.91 0.01 ±2.5 PASS
VN 20 5.10 0.01 ±2.5 PASS
VN 30 8.39 0.01 ±2.5 PASS
VN 40 6.65 0.01 ±2.5 PASS
VN 50 9.30 0.01 ±2.5 PASS

Report No.: AGC00639170404FE02 Page 65 of 73
Test
Band
Test
Mode
Test
Channe
l
Test
Volt.
Test
Temp
.
Freq.Error
(Hz)
Freq.vs.rated
(ppm)
Limit
(ppm
)
Verdict
GSM850 EDGE LCH
VN -10 17.79 0.02 ±2.5 PASS
VN 0 17.56 0.02 ±2.5 PASS
VN 10 17.69 0.02 ±2.5 PASS
VN 20 15.27 0.02 ±2.5 PASS
VN 30 15.59 0.02 ±2.5 PASS
VN 40 15.59 0.02 ±2.5 PASS
VN 50 18.27 0.02 ±2.5 PASS
GSM850 EDGE MCH
VN -10 16.95 0.02 ±2.5 PASS
VN 0 16.43 0.02 ±2.5 PASS
VN 10 18.44 0.02 ±2.5 PASS
VN 20 18.56 0.02 ±2.5 PASS
VN 30 14.95 0.02 ±2.5 PASS
VN 40 15.14 0.02 ±2.5 PASS
VN 50 16.82 0.02 ±2.5 PASS
GSM850 EDGE HCH
VN -10 16.34 0.02 ±2.5 PASS
VN 0 18.85 0.02 ±2.5 PASS
VN 10 15.34 0.02 ±2.5 PASS
VN 20 14.72 0.02 ±2.5 PASS
VN 30 17.08 0.02 ±2.5 PASS
VN 40 17.37 0.02 ±2.5 PASS
VN 50 15.37 0.02 ±2.5 PASS
Test
Band
Test
Mode
Test
Channe
l
Test
Volt.
Test
Temp
.
Freq.Error
(Hz)
Freq.vs.rated
(ppm)
Limit
(ppm
)
Verdict
GSM
1900 GSM LCH
VN -10 6.20 0.00 ±2.5 PASS
VN 0 4.91 0.00 ±2.5 PASS
VN 10 -0.52 0.00 ±2.5 PASS
VN 20 2.45 0.00 ±2.5 PASS
VN 30 -0.58 0.00 ±2.5 PASS
VN 40 4.65 0.00 ±2.5 PASS
VN 50 6.13 0.00 ±2.5 PASS

Report No.: AGC00639170404FE02 Page 66 of 73
GSM
1900 GSM MCH
VN -10 -0.06 0.00 ±2.5 PASS
VN 0 0.13 0.00 ±2.5 PASS
VN 10 4.00 0.00 ±2.5 PASS
VN 20 -0.84 0.00 ±2.5 PASS
VN 30 -0.77 0.00 ±2.5 PASS
VN 40 -1.36 0.00 ±2.5 PASS
VN 50 1.03 0.00 ±2.5 PASS
GSM
1900 GSM HCH
VN -10 -1.03 0.00 ±2.5 PASS
VN 0 -2.97 0.00 ±2.5 PASS
VN 10 -3.10 0.00 ±2.5 PASS
VN 20 -4.26 0.00 ±2.5 PASS
VN 30 -1.68 0.00 ±2.5 PASS
VN 40 -0.58 0.00 ±2.5 PASS
VN 50 -1.16 0.00 ±2.5 PASS
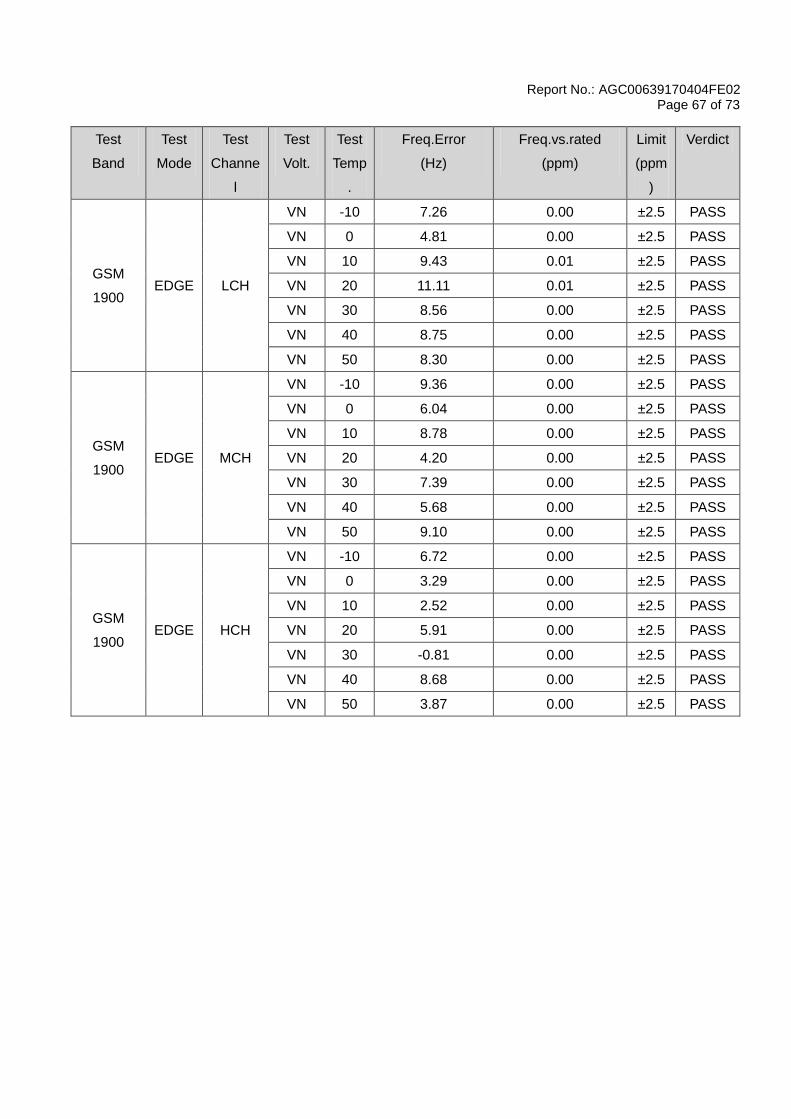
Report No.: AGC00639170404FE02 Page 67 of 73
Test
Band
Test
Mode
Test
Channe
l
Test
Volt.
Test
Temp
.
Freq.Error
(Hz)
Freq.vs.rated
(ppm)
Limit
(ppm
)
Verdict
GSM
1900 EDGE LCH
VN -10 7.26 0.00 ±2.5 PASS
VN 0 4.81 0.00 ±2.5 PASS
VN 10 9.43 0.01 ±2.5 PASS
VN 20 11.11 0.01 ±2.5 PASS
VN 30 8.56 0.00 ±2.5 PASS
VN 40 8.75 0.00 ±2.5 PASS
VN 50 8.30 0.00 ±2.5 PASS
GSM
1900 EDGE MCH
VN -10 9.36 0.00 ±2.5 PASS
VN 0 6.04 0.00 ±2.5 PASS
VN 10 8.78 0.00 ±2.5 PASS
VN 20 4.20 0.00 ±2.5 PASS
VN 30 7.39 0.00 ±2.5 PASS
VN 40 5.68 0.00 ±2.5 PASS
VN 50 9.10 0.00 ±2.5 PASS
GSM
1900 EDGE HCH
VN -10 6.72 0.00 ±2.5 PASS
VN 0 3.29 0.00 ±2.5 PASS
VN 10 2.52 0.00 ±2.5 PASS
VN 20 5.91 0.00 ±2.5 PASS
VN 30 -0.81 0.00 ±2.5 PASS
VN 40 8.68 0.00 ±2.5 PASS
VN 50 3.87 0.00 ±2.5 PASS

Report No.: AGC00639170404FE02 Page 68 of 73
Frequency Error vs. Voltage:
Test
Band
Test
Mode
Test
Channe
l
Test
Temp.
Test
Volt.
(V)
Freq.Error
(Hz)
Freq.vs.rated
(ppm)
Limit
(ppm
)
Verdict
WCDMA
850 UMTS
LCH
TN 3.4 -3.36 0.00 ±2.5 PASS
TN 3.7 -2.24 0.00 ±2.5 PASS
TN 4.2 -2.33 0.00 ±2.5 PASS
MCH
TN 3.4 -2.24 0.00 ±2.5 PASS
TN 3.7 -2.01 0.00 ±2.5 PASS
TN 4.2 -1.08 0.00 ±2.5 PASS
HCH
TN 3.4 -1.02 0.00 ±2.5 PASS
TN 3.7 -3.88 0.00 ±2.5 PASS
TN 4.2 -3.78 0.00 ±2.5 PASS
Test
Band
Test
Mode
Test
Channe
l
Test
Temp.
Test
Volt.
(V)
Freq.Error
(Hz)
Freq.vs.rated
(ppm)
Limit
(ppm
)
Verdict
WCDMA
1700 UMTS
LCH
TN 3.4 3.57 0.00 ±2.5 PASS
TN 3.7 4.58 0.00 ±2.5 PASS
TN 4.2 7.06 0.00 ±2.5 PASS
MCH
TN 3.4 -5.71 0.00 ±2.5 PASS
TN 3.7 -1.56 0.00 ±2.5 PASS
TN 4.2 -0.79 0.00 ±2.5 PASS
HCH
TN 3.4 -10.42 -0.01 ±2.5 PASS
TN 3.7 -12.45 -0.01 ±2.5 PASS
TN 4.2 -9.31 -0.01 ±2.5 PASS
Test
Band
Test
Mode
Test
Channe
l
Test
Temp.
Test
Volt.
(V)
Freq.Error
(Hz)
Freq.vs.rated
(ppm)
Limit
(ppm
)
Verdict
WCDMA
1900 UMTS
LCH
TN 3.4 -3.48 0.00 ±2.5 PASS
TN 3.7 -0.55 0.00 ±2.5 PASS
TN 4.2 0.09 0.00 ±2.5 PASS
MCH TN 3.4 -1.91 0.00 ±2.5 PASS
TN 3.7 -0.49 0.00 ±2.5 PASS

Report No.: AGC00639170404FE02 Page 69 of 73
TN 4.2 -0.05 0.00 ±2.5 PASS
HCH
TN 3.4 -4.07 0.00 ±2.5 PASS
TN 3.7 -0.32 0.00 ±2.5 PASS
TN 4.2 -2.75 0.00 ±2.5 PASS
Frequency Error vs. Temperature:
Test
Band
Test
Mode
Test
Channe
l
Test
Volt.
Test
Temp
.
Freq.Error
(Hz)
Freq.vs.rated
(ppm)
Limit
(ppm
)
Verdict
WCDMA
850 UMTS LCH
VN -10 -1.33 0.00 ±2.5 PASS
VN 0 0.09 0.00 ±2.5 PASS
VN 10 -2.46 0.00 ±2.5 PASS
VN 20 -2.09 0.00 ±2.5 PASS
VN 30 -1.01 0.00 ±2.5 PASS
VN 40 -1.79 0.00 ±2.5 PASS
VN 50 -5.62 -0.01 ±2.5 PASS
WCDMA
850 UMTS MCH
VN -10 -0.90 0.00 ±2.5 PASS
VN 0 0.18 0.00 ±2.5 PASS
VN 10 -1.86 0.00 ±2.5 PASS
VN 20 -2.58 0.00 ±2.5 PASS
VN 30 -0.44 0.00 ±2.5 PASS
VN 40 0.14 0.00 ±2.5 PASS
VN 50 -1.88 0.00 ±2.5 PASS
WCDMA
850 UMTS HCH
VN -10 -2.01 0.00 ±2.5 PASS
VN 0 0.32 0.00 ±2.5 PASS
VN 10 -3.45 0.00 ±2.5 PASS
VN 20 -1.97 0.00 ±2.5 PASS
VN 30 -2.88 0.00 ±2.5 PASS
VN 40 -2.53 0.00 ±2.5 PASS
VN 50 -1.02 0.00 ±2.5 PASS
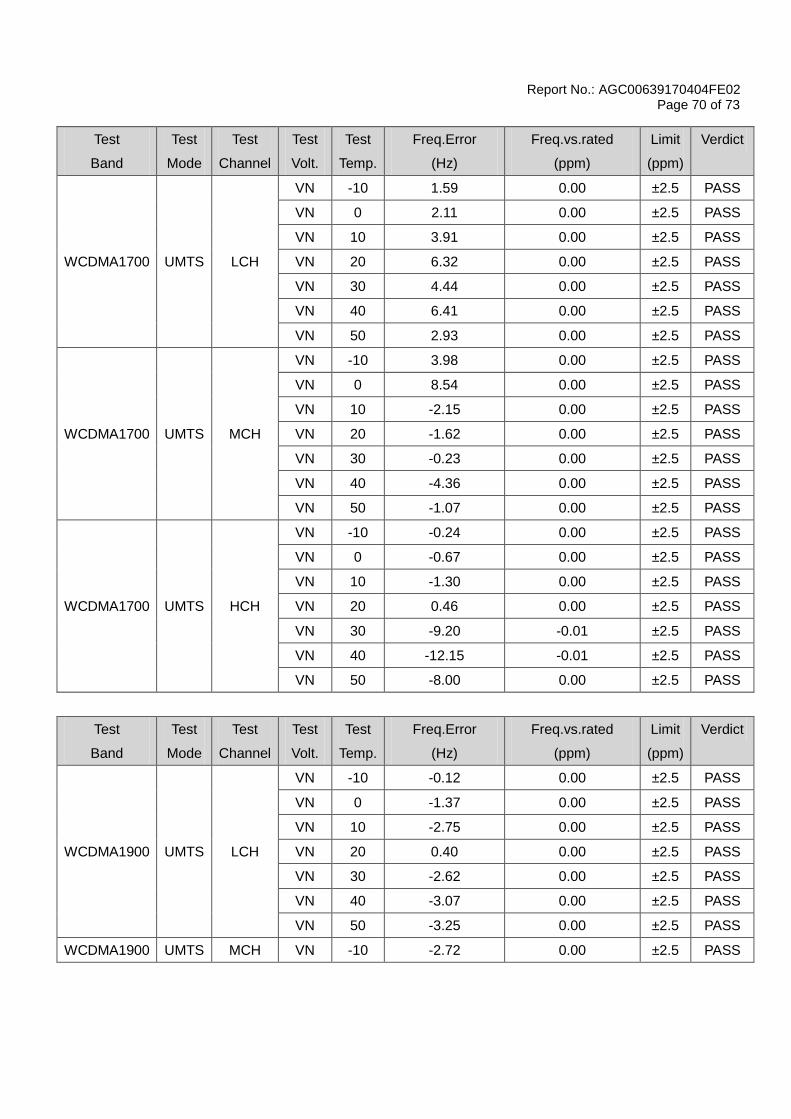
Report No.: AGC00639170404FE02 Page 70 of 73
Test
Band
Test
Mode
Test
Channel
Test
Volt.
Test
Temp.
Freq.Error
(Hz)
Freq.vs.rated
(ppm)
Limit
(ppm)
Verdict
WCDMA1700 UMTS LCH
VN -10 1.59 0.00 ±2.5 PASS
VN 0 2.11 0.00 ±2.5 PASS
VN 10 3.91 0.00 ±2.5 PASS
VN 20 6.32 0.00 ±2.5 PASS
VN 30 4.44 0.00 ±2.5 PASS
VN 40 6.41 0.00 ±2.5 PASS
VN 50 2.93 0.00 ±2.5 PASS
WCDMA1700 UMTS MCH
VN -10 3.98 0.00 ±2.5 PASS
VN 0 8.54 0.00 ±2.5 PASS
VN 10 -2.15 0.00 ±2.5 PASS
VN 20 -1.62 0.00 ±2.5 PASS
VN 30 -0.23 0.00 ±2.5 PASS
VN 40 -4.36 0.00 ±2.5 PASS
VN 50 -1.07 0.00 ±2.5 PASS
WCDMA1700 UMTS HCH
VN -10 -0.24 0.00 ±2.5 PASS
VN 0 -0.67 0.00 ±2.5 PASS
VN 10 -1.30 0.00 ±2.5 PASS
VN 20 0.46 0.00 ±2.5 PASS
VN 30 -9.20 -0.01 ±2.5 PASS
VN 40 -12.15 -0.01 ±2.5 PASS
VN 50 -8.00 0.00 ±2.5 PASS
Test
Band
Test
Mode
Test
Channel
Test
Volt.
Test
Temp.
Freq.Error
(Hz)
Freq.vs.rated
(ppm)
Limit
(ppm)
Verdict
WCDMA1900 UMTS LCH
VN -10 -0.12 0.00 ±2.5 PASS
VN 0 -1.37 0.00 ±2.5 PASS
VN 10 -2.75 0.00 ±2.5 PASS
VN 20 0.40 0.00 ±2.5 PASS
VN 30 -2.62 0.00 ±2.5 PASS
VN 40 -3.07 0.00 ±2.5 PASS
VN 50 -3.25 0.00 ±2.5 PASS
WCDMA1900 UMTS MCH VN -10 -2.72 0.00 ±2.5 PASS
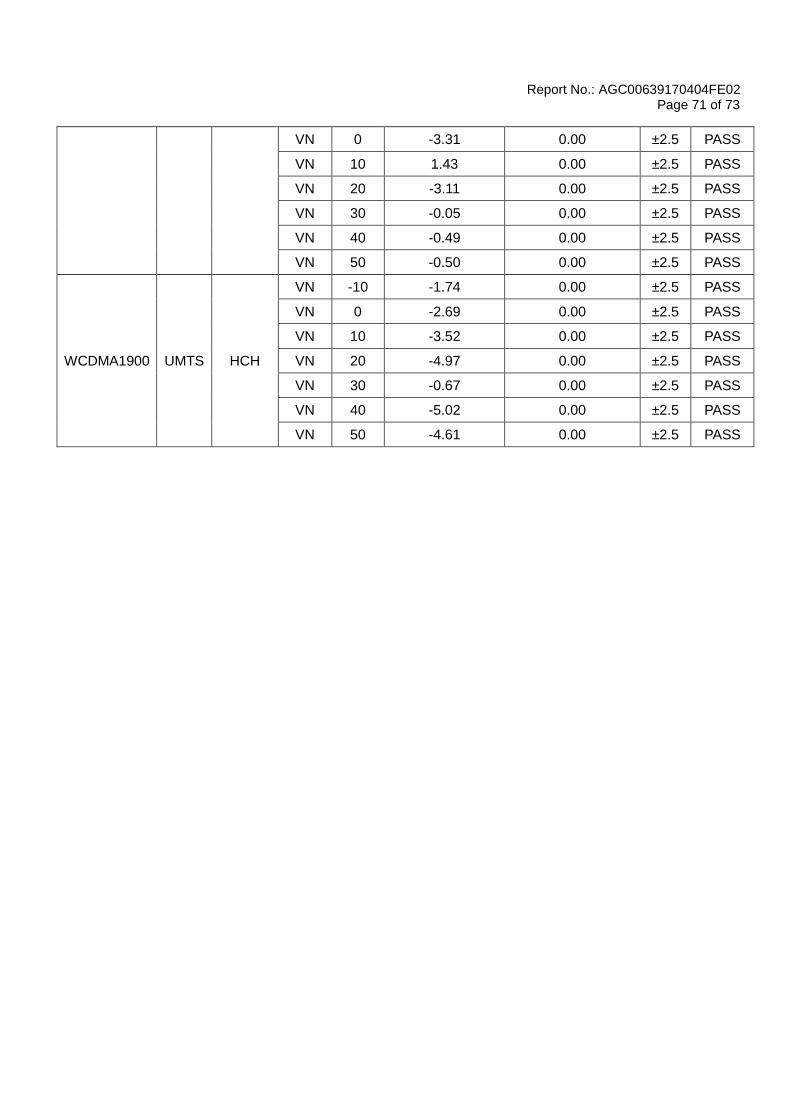
Report No.: AGC00639170404FE02 Page 71 of 73
VN 0 -3.31 0.00 ±2.5 PASS
VN 10 1.43 0.00 ±2.5 PASS
VN 20 -3.11 0.00 ±2.5 PASS
VN 30 -0.05 0.00 ±2.5 PASS
VN 40 -0.49 0.00 ±2.5 PASS
VN 50 -0.50 0.00 ±2.5 PASS
WCDMA1900 UMTS HCH
VN -10 -1.74 0.00 ±2.5 PASS
VN 0 -2.69 0.00 ±2.5 PASS
VN 10 -3.52 0.00 ±2.5 PASS
VN 20 -4.97 0.00 ±2.5 PASS
VN 30 -0.67 0.00 ±2.5 PASS
VN 40 -5.02 0.00 ±2.5 PASS
VN 50 -4.61 0.00 ±2.5 PASS

Report No.: AGC00639170404FE02 Page 72 of 73
PHOTOGRAPHS OF TEST SETUP
CONDUCTED EMISSION
RADIATED SPURIOUS EMISSION

Report No.: AGC00639170404FE02 Page 73 of 73
CONDUCTED MEASUREMENTS
----END OF REPORT----