fcc doc test report - asus · 2015-06-28 · 2 summary of test results the eut has been tested...
TRANSCRIPT

Report No.: FD131014C20 1 of 30 Report Format Version 5.0.0
FCC DoC TEST REPORT
REPORT NO.: FD131014C20
MODEL NO.: M80T
RECEIVED: Oct. 14, 2013
TESTED: Oct. 23, 2013 ~ Oct. 24, 2013
ISSUED: Nov. 20, 2013
APPLICANT: ASUSTek COMPUTER INC.
ADDRESS: 4F., No. 150, LI-TE Rd., PEITOU, TAIPEI 112, TAIWAN
ISSUED BY: Bureau Veritas Consumer Products Services (H.K.)
Ltd., Taoyuan Branch
LAB ADDRESS: No. 19, Hwa Ya 2nd Rd., Wen Hwa Tsuen, Kwei Shan Hsiang, Taoyuan Hsien 333, Taiwan
This report is for your exclusive use. Any copying or replication of this report to or for any other person or entity, or use of our name or trademark, is permitted only with our prior written permission. This report sets forth our findings solely with respect to the test samples identified herein. The results set forth in this report are not indicative or representative of the quality or characteristics of the lot from which a test sample was taken or any similar or identical product unless specifically and expressly noted. Our report includes all of the tests requested by you and the results thereof based upon the information that you provided to us. You have 60 days from date of issuance of this report to notify us of any material error or omission caused by our negligence, provided, however, that such notice shall be in writing and shall specifically address the issue you wish to raise. A failure to raise such issue within the prescribed time shall constitute your unqualified acceptance of the completeness of this report, the tests conducted and the correctness of the report contents. Unless specific mention, the uncertainty of measurement has been explicitly taken into account to declare the compliance or non-compliance to the specification
This report should not be used by the client to claim product certification, approval, or endorsement by TAF, NVLAP, NIST or any government agencies.

Report No.: FD131014C20 2 of 30 Report Format Version 5.0.0
Table of Contents
RELEASE CONTROL RECORD ................................................................................. 3
1 CERTIFICATION ............................................................................................ 4
2 SUMMARY OF TEST RESULTS ................................................................... 5
2.1 MEASUREMENT UNCERTAINTY ............................................................................. 5
3 GENERAL INFORMATION ............................................................................ 6
3.1 GENERAL DESCRIPTION OF EUT .......................................................................... 6
3.2 DESCRIPTION OF TEST MODES ............................................................................ 8
3.3 DESCRIPTION OF SUPPORT UNITS ....................................................................... 9
3.4 CONFIGURATION OF SYSTEM UNDER TEST ...................................................... 10
4 TEST TYPES AND RESULTS ..................................................................... 11
4.1 CONDUCTED EMISSION MEASUREMENT ........................................................... 11
4.1.1 LIMITS OF CONDUCTED EMISSION MEASUREMENT ......................................... 11
4.1.2 TEST INSTRUMENTS ............................................................................................. 11
4.1.3 TEST PROCEDURES ............................................................................................. 12
4.1.4 DEVIATION FROM TEST STANDARD .................................................................... 12
4.1.5 TEST SETUP........................................................................................................... 13
4.1.6 EUT OPERATING CONDITIONS ............................................................................. 13
4.1.7 TEST RESULTS ...................................................................................................... 14
4.2 RADIATED EMISSION MEASUREMENT ................................................................ 16
4.2.1 LIMITS OF RADIATED EMISSION MEASUREMENT .............................................. 16
4.2.2 TEST INSTRUMENTS ............................................................................................. 17
4.2.3 TEST PROCEDURES ............................................................................................. 19
4.2.4 DEVIATION FROM TEST STANDARD .................................................................... 20
4.2.5 TEST SETUP........................................................................................................... 21
4.2.6 EUT OPERATING CONDITIONS ............................................................................. 21
4.2.7 TEST RESULTS ...................................................................................................... 22
5 PHOTOGRAPHS OF THE TEST CONFIGURATION .................................. 26
6 INFORMATION ON THE TESTING LABORATORIES ................................. 29
7 APPENDIX A – MODIFICATION RECORDERS FOR ENGINEERING
CHANGES TO THE EUT BY THE LAB ........................................................ 30

Report No.: FD131014C20 3 of 30 Report Format Version 5.0.0
RELEASE CONTROL RECORD
ISSUE NO. REASON FOR CHANGE DATE ISSUED
FD131014C20 Original release. Nov. 20, 2013

Report No.: FD131014C20 4 of 30 Report Format Version 5.0.0
1 CERTIFICATION
PRODUCT: ASUS Tablet
BRAND: ASUS
MODEL NO.: M80T
APPLICANT: ASUSTek COMPUTER INC.
TESTED: Oct. 23, 2013 ~ Oct. 24, 2013
TEST SAMPLE: Production Unit
STANDARD: FCC Part 15, Subpart B, Class B
ICES-003:2012 Issue 5, Class B
ANSI C63.4:2009
The above equipment (Model: M80T) has been tested by Bureau Veritas Consumer Products Services (H.K.) Ltd., Taoyuan Branch, and found compliance with the requirement of the above standards. The test record, data evaluation & Equipment Under Test (EUT) configurations represented herein are true and accurate accounts of the measurements of the sample’s EMC characteristics under the conditions specified in this report.
PREPARED BY :
, DATE : Nov. 20, 2013
Evonne Liu / Specialist
APPROVED BY : , DATE : Nov. 20, 2013
Derrick Dai / Assistant Manager

Report No.: FD131014C20 5 of 30 Report Format Version 5.0.0
2 SUMMARY OF TEST RESULTS The EUT has been tested according to the following specifications.
EMISSION
Standard Test Type Result Remarks
FCC Part 15, Subpart B,
Class B
ICES-003:2012, Class B
Conducted emission test PASS
Meet the requirement of limit
Minimum passing margin is
-10.84dB at 0.45460MHz
Radiated emission test
(30MHz~40GHz) PASS
Meet the requirement of limit
Minimum passing margin is
-5.31dB at 574.29MHz
2.1 MEASUREMENT UNCERTAINTY
Where relevant, the following measurement uncertainty levels have been estimated for tests performed on the EUT as specified in CISPR 16-4-2: This uncertainty represents an expanded uncertainty expressed at approximately the 95% confidence level using a coverage factor of k=2.
Measurement Frequency Uncertainty
Conducted emission 150kHz ~ 30MHz 2.44 dB
Radiated emission 30MHz ~ 1GHz 4.12 dB
Above 1GHz 2.26 dB
The listed uncertainties are the worst case uncertainty for the entire range of measurement. Please note that the uncertainty values are provided for informational purposes only and are not used in determining the PASS/FAIL results.

Report No.: FD131014C20 6 of 30 Report Format Version 5.0.0
3 GENERAL INFORMATION
3.1 GENERAL DESCRIPTION OF EUT
PRODUCT ASUS Tablet
MODEL NO. M80T
POWER SUPPLY 5Vdc (adapter)
3.85Vdc (battery)
I/O PORT Refer to users’ manual
DATA CABLE Refer to Note as below
ACCESSORY
DEVICE Refer to Note as below
NOTE:
1. The detail information of model names and the differences are as below.
System MODEL NAME Remark
Windows Only M80T / L80T / R80T All the models are identically, the difference model severed as marketing strategy.
Android Only M81T / L81T / R81T
Dual OS M82T / L82T / R82T
* Model M80T is the representative for final test.
2. The EUT’s highest operating frequency is 5GHz.

Report No.: FD131014C20 7 of 30 Report Format Version 5.0.0
3. The EUT contains following accessory devices.
ITEM BRAND MODEL DESCRIPTION
AC Adapter 1 ASUS W12-010N3A I/P: 100-240Vac, 50/60Hz, 0.3A
O/P: 5Vdc, 2A
AC Adapter 2 ASUS AD897320 I/P: 100-240Vac, 50/60Hz, 0.3A
O/P: 5Vdc, 2A
AC Adapter 3 ASUS AD835M1 I/P: 100-240Vac, 50/60Hz, 0.3A
O/P: 5Vdc, 2A
Battery ASUS C11P1304 Rating: 3.85Vdc, 15.5Wh, 3910mAh
USB cable 1 ASUS AA781000 0.9m non-shielded cable w/o core
USB cable 2 ASUS L65U2009-CS-B 0.9m non-shielded cable w/o core
Micro SD card Sandisk SDSDQAB-008G-859 --
LCD Panel INNOLUX N080ICE-GB1(C2) --
Front Camera LITEON 12P2SF181C --
Rear Camera LITEON 12P2BA536 --
WLAN/BT Module Broadcom BCM43241S --
CPU Intel UTFCBGA1380 --
eMMC 1 Sandisk SDIN8DE4-32G-1002K 32G
eMMC 2 Sandisk SDIN8DE4-64G-1002K 64G
eMMC 3 HYNIX H26M64003DQR(32G) --
eMMC 4 HYNIX H26M78003BFR(64G) --
4. The above EUT information is declared by manufacturer and for more detailed feature description,
please refers to the manufacturer's specifications or user's manual.

Report No.: FD131014C20 8 of 30 Report Format Version 5.0.0
3.2 DESCRIPTION OF TEST MODES
SAMPLE DESCRIPTION
A eMMC 1
B eMMC 2
C eMMC 3
D eMMC 4
The EUT was tested with following modes.
Test
Mode Sample Test Condition
Conducted emission test
1 B BT Idle + WLAN (2.4G) Idle + Camera + Earphone + Adapter 1 + USB Cable 1
2 B BT Idle + WLAN (5G) Idle + MPEG4 (By Micro SD) + Earphone + Adapter 2 +
USB Cable 1
3 B BT Idle + WLAN (2.4G) Idle + H Pattern + Earphone + Adapter 2 + USB Cable 1 +
USB with Flash
4 B BT Idle + WLAN (5G) Idle + GPS Rx + Earphone + Adapter 1 + USB Cable 1
5 A BT Idle + WLAN (5G) Idle + Camera + Earphone + Adapter 2 + USB Cable 1
6 C BT Idle + WLAN (5G) Idle + MPEG4 (By Micro SD) + Earphone + Adapter 2 +
USB Cable 1
7 D BT Idle + WLAN (5G) Idle + MPEG4 (By Micro SD) + Earphone + Adapter 2 +
USB Cable 1
8 B BT Idle + WLAN (5G) Idle + MPEG4 (By Micro SD) + Earphone + Adapter 2 +
USB Cable 2
9 B BT Idle + WLAN (5G) Idle + MPEG4 (By Micro SD) + Earphone + Adapter 3 +
USB Cable 1
NOTE: For conducted emission test, test mode 2 was the worst case and only this mode was
presented in this report.

Report No.: FD131014C20 9 of 30 Report Format Version 5.0.0
Test
Mode Sample Test Condition
Radiated emission test
1 B BT Idle + WLAN (2.4G) Idle + Camera + Earphone + Adapter 1 + USB Cable 1
2 B BT Idle + WLAN (5G) Idle + MPEG4 (By Micro SD) + Earphone + Adapter 2 +
USB Cable 1
3 B BT Idle + WLAN (2.4G) Idle + H Pattern + Earphone + USB with Mouse
4 B BT Idle + WLAN (5G) Idle + GPS Rx + Earphone + Adapter 2 + USB Cable 1
5 A BT Idle + WLAN (5G) Idle + Camera + Earphone + Adapter 2 + USB Cable 1
6 C BT Idle + WLAN (5G) Idle + MPEG4 (By Micro SD) + Earphone + Adapter 2 +
USB Cable 1
7 D BT Idle + WLAN (5G) Idle + MPEG4 (By Micro SD) + Earphone + Adapter 2 +
USB Cable 1
8 B BT Idle + WLAN (5G) Idle + MPEG4 (By Micro SD) + Earphone + Adapter 2 +
USB Cable 2
9 B BT Idle + WLAN (5G) Idle + MPEG4 (By Micro SD) + Earphone + Adapter 3 +
USB Cable 1
NOTE: For radiated emission test, test mode 2 was the worst case and only this mode was
presented in this report.
3.3 DESCRIPTION OF SUPPORT UNITS
The EUT has been tested as an independent unit together with other necessary accessories or support units. The following support units or accessories were used to form a representative test configuration during the tests.
NO. PRODUCT BRAND MODEL NO. SERIAL NO. FCC ID
1 Earphone N/A N/A N/A N/A
2 BLUETOOTH
EARPHONE ELECOM LBT-MPHS400 N/A N/A
3 Wireless N Dual
band Router D-LINK DIR-815 PVK21B5000399 KA21R815A1
NO. SIGNAL CABLE DESCRIPTION OF THE ABOVE SUPPORT UNITS
1 1m non-shielded cable
2 N/A
3 N/A
NOTE:
1. All power cords of the above support units are non shielded (1.8m).
2. Item 2-3 acted as communication partner to transfer data.

Report No.: FD131014C20 10 of 30 Report Format Version 5.0.0
3.4 CONFIGURATION OF SYSTEM UNDER TEST
*Test Table
(Power from adapter)
*Kept in a remote area
EUT
Bluetooth
Earphone Earphone
WIRELESS
AP

Report No.: FD131014C20 11 of 30 Report Format Version 5.0.0
4 TEST TYPES AND RESULTS
4.1 CONDUCTED EMISSION MEASUREMENT
4.1.1 LIMITS OF CONDUCTED EMISSION MEASUREMENT
TEST STANDARD: FCC Part 15, Subpart B (section: 15.107) ICES-003:2012 Issue 5 (section 6.1)
Frequency (MHz) Class A (dBuV) Class B (dBuV)
Quasi-peak Average Quasi-peak Average
0.15-0.5 79 66 66-56 56-46
0.5-5 73 60 56 46
5-30 73 60 60 50
NOTE: 1. The lower limit shall apply at the transition frequencies.
2. The limit decreases in line with the logarithm of the frequency in the range of 0.15 to 0.50
MHz.
3. All emanations from a class A/B digital device or system, including any network of
conductors and apparatus connected thereto, shall not exceed the level of field strengths
specified above.
4.1.2 TEST INSTRUMENTS
DESCRIPTION &
MANUFACTURER MODEL NO. SERIAL NO.
DATE OF
CALIBRATION
DUE DATE OF
CALIBRATION
Test Receiver
ROHDE & SCHWARZ ESCS30 100288 Nov. 09, 2012 Nov. 08, 2013
RF signal cable
Woken 5D-FB
Cable-HYCO2-0
1 Dec. 28, 2012 Dec. 27, 2013
LISN
ROHDE & SCHWARZ
(EUT)
ESH2-Z5 100100 Dec. 21, 2012 Dec. 20, 2013
LISN
ROHDE & SCHWARZ
(Peripheral)
ESH3-Z5 100312 Jul. 02, 2013 Jul. 01, 2014
Software
ADT
BV ADT_Cond_
V7.3.7.3 NA NA NA
NOTE: 1. The calibration interval of the above test instruments is 12 months and the calibrations are
traceable to NML/ROC and NIST/USA.
2. The test was performed in HwaYa Shielded Room 2.
3. The VCCI Site Registration No. is C-2047.

Report No.: FD131014C20 12 of 30 Report Format Version 5.0.0
4.1.3 TEST PROCEDURES
a. The EUT was placed 0.4 meters from the conducting wall of the shielded room
with EUT being connected to the power mains through a line impedance stabilization network (LISN). Other support units were connected to the power mains through another LISN. The two LISNs provide 50 ohm/ 50uH of coupling impedance for the measuring instrument.
b. Both lines of the power mains connected to the EUT were checked for maximum conducted interference.
c. The frequency range from 150 kHz to 30 MHz was searched. Emission levels under Limit - 20dB was not recorded.
4.1.4 DEVIATION FROM TEST STANDARD
No deviation.

Report No.: FD131014C20 13 of 30 Report Format Version 5.0.0
4.1.5 TEST SETUP
Note: 1.Support units were connected to second LISN.
2.Both of LISNs (AMN) are 80 cm from EUT and at least 80 cm
from other units and other metal planes
support. units.
40cm
80cm
Test Receiver
Horizontal Ground
Reference Plane
EUT
LISN
Vertical Ground
Reference Plane
For the actual test configuration, please refer to the related item – Photographs of the Test Configuration.
4.1.6 EUT OPERATING CONDITIONS
a. Placed the EUT and Bluetooth earphone on a testing table.
b. The EUT charged from the adapter.
c. The EUT link with Bluetooth earphone in idle mode.
d. Turn on MPEG4.
e. The EUT communicated data with the wireless AP, which acted as communication partner.
f. The communication partner connected with EUT via BT and WLAN function and run a test program to enable EUT under receiving condition continuously at specific channel frequency.
g. The necessary accessories enable the system in full functions.

Report No.: FD131014C20 14 of 30 Report Format Version 5.0.0
4.1.7 TEST RESULTS
INPUT POWER 120 Vac, 60 Hz 6dB BANDWIDTH 9 kHz
ENVIRONMENTAL
CONDITIONS 22 deg. C, 55% RH PHASE Line 1
TESTED BY Pon Tsai
Freq. Corr. Reading Value Emission Level Limit Margin
No Factor [dB (uV)] [dB (uV)] [dB (uV)] (dB)
[MHz] (dB) Q.P. AV. Q.P. AV. Q.P. AV. Q.P. AV.
1 0.15391 0.16 40.90 29.77 41.06 29.93 65.79 55.79 -24.73 -25.86
2 0.16953 0.16 40.88 29.77 41.04 29.93 64.98 54.98 -23.95 -25.06
3 0.22812 0.17 36.70 25.05 36.87 25.22 62.52 52.52 -25.65 -27.30
4 0.29844 0.19 33.46 25.74 33.65 25.93 60.29 50.29 -26.63 -24.35
5 0.49375 0.23 38.88 32.43 39.11 32.66 56.10 46.10 -16.99 -13.44
6 0.98984 0.25 29.45 21.18 29.70 21.43 56.00 46.00 -26.30 -24.57
REMARKS:
1. Q.P. and AV. are abbreviations of quasi-peak and average individually.
2. The emission levels of other frequencies were very low against the limit.
3. Margin value = Emission level - Limit value
4. Correction factor = Insertion loss + Cable loss
5. Emission Level = Correction Factor + Reading Value.

Report No.: FD131014C20 15 of 30 Report Format Version 5.0.0
INPUT POWER 120 Vac, 60 Hz 6dB BANDWIDTH 9 kHz
ENVIRONMENTAL
CONDITIONS 22 deg. C, 55% RH PHASE Line 2
TESTED BY Pon Tsai
Freq. Corr. Reading Value Emission Level Limit Margin
No Factor [dB (uV)] [dB (uV)] [dB (uV)] (dB)
[MHz] (dB) Q.P. AV. Q.P. AV. Q.P. AV. Q.P. AV.
1 0.15781 0.17 40.65 28.32 40.82 28.49 65.58 55.58 -24.76 -27.09
2 0.18906 0.17 36.45 24.39 36.62 24.56 64.08 54.08 -27.46 -29.52
3 0.22812 0.18 37.64 25.61 37.82 25.79 62.52 52.52 -24.70 -26.73
4 0.30625 0.21 36.73 24.80 36.94 25.01 60.07 50.07 -23.13 -25.06
5 0.45460 0.24 43.14 35.71 43.38 35.95 56.79 46.79 -13.41 -10.84
6 0.53281 0.24 37.50 30.43 37.74 30.67 56.00 46.00 -18.26 -15.33
REMARKS:
1. Q.P. and AV. are abbreviations of quasi-peak and average individually.
2. The emission levels of other frequencies were very low against the limit.
3. Margin value = Emission level - Limit value
4. Correction factor = Insertion loss + Cable loss
5. Emission Level = Correction Factor + Reading Value.

Report No.: FD131014C20 16 of 30 Report Format Version 5.0.0
4.2 RADIATED EMISSION MEASUREMENT
4.2.1 LIMITS OF RADIATED EMISSION MEASUREMENT
TEST STANDARD: FCC Part 15, Subpart B (section: 15.109) ICES-003:2012 Issue 5 (section: 6.2) Emissions radiated outside of the specified bands, shall be according to the general radiated limits as following:
Radiated Emissions Limits at 10 meters (dBμV/m)
Frequencies (MHz)
FCC 15B/ ICES-003, Class A
FCC 15B / ICES-003, Class B
CISPR 22, Class A
CISPR 22, Class B
30-88 39 29.5
40 30 88-216 43.5 33.1
216-230 46.4 35.6
230-960 47 37
960-1000 49.5 43.5
1000-3000 Avg: 49.5
Peak: 69.5
Avg: 43.5
Peak: 63.5
Not defined Not defined
3000+ Not defined Not defined
Radiated Emissions Limits at 3 meters (dBμV/m)
Frequencies (MHz)
FCC 15B / ICES-003, Class A
FCC 15B / ICES-003, Class B
CISPR 22, Class A
CISPR 22, Class B
30-88 49.5 40
50.5 40.5 88-216 54 43.5
216-230 56.9 46
230-960 57.5 47.5
960-1000 60 54
1000-3000
Avg: 60 Peak: 80
Avg: 54 Peak: 74
Avg: 56 Peak: 76
Avg: 50 Peak: 70
3000+ Avg: 60 Peak: 80
Avg: 54 Peak: 74
NOTE: 1. The lower limit shall apply at the transition frequencies.
2. Emission level (dBuV/m) = 20 log Emission level (uV/m).
3. As shown in 15.35(b), for frequencies above 1000MHz, the field strength limits are based
on average detector, however, the peak field strength of any emission shall not exceed the
maximum permitted average limits, specified above by more than 20dB under any
condition of modulation.
4. QP detector shall be applied if not specified.

Report No.: FD131014C20 17 of 30 Report Format Version 5.0.0
4.2.2 TEST INSTRUMENTS
Frequency range 30MHz~1GHz Test Data: Oct. 23, 2013
DESCRIPTION &
MANUFACTURER MODEL NO. SERIAL NO.
DATE OF
CALIBRATION
DUE DATE OF
CALIBRATION
Test Receiver ROHDE & SCHWARZ (V)
ESIB7 100187 Dec. 27, 2012 Dec. 26, 2013
Test Receiver ROHDE & SCHWARZ (H)
ESIB7 100186 Nov. 28, 2012 Nov. 27, 2013
BILOG Antenna SCHWARZBECK (V)
VULB9168 9168-148 Mar. 19, 2013 Mar. 18, 2014
BILOG Antenna SCHWARZBECK (H)
VULB9168 9168-149 Mar. 19, 2013 Mar. 19, 2014
Preamplifier Agilent (V)
8447D 2944A10636 Oct. 18, 2013 Oct. 17, 2014
Preamplifier Agilent (H)
8447D 2944A10637 Oct. 18, 2013 Oct. 17, 2014
Preamplifier Agilent
8449B 3008A01959 Oct. 25, 2012 Oct. 24, 2013
RF signal cable Woken (V)
8D-FB Cable-Hych1-01 Oct. 26, 2012 Oct. 25, 2013
RF signal cable Woken (H)
8D-FB Cable-Hych1-02 Oct. 26, 2012 Oct. 25, 2013
Software ADT
BV ADT_Radiated_ V 7.7.03.8
NA NA NA
Antenna Tower (V) MFA-440 9707 NA NA
Antenna Tower (H) MFA-440 970705 NA NA
Turn Table DS430 50303 NA NA
Controller (V) MF7802 074 NA NA
Controller (H) MF7802 08093 NA NA
NOTE: 1. The calibration interval of the above test instruments is 12 months and the
calibrations are traceable to NML/ROC and NIST/USA.
2. The test was performed in HwaYa Chamber 1.
3. The FCC Site Registration No. is 477732.
4. The IC Site Registration No. is IC 7450F-1.
5. The VCCI Site Registration No. is R-1893, G-113.

Report No.: FD131014C20 18 of 30 Report Format Version 5.0.0
Frequency range above 1GHz Test Data: Oct. 24, 2013
DESCRIPTION &
MANUFACTURER MODEL NO. SERIAL NO.
DATE OF
CALIBRATION
DUE DATE OF
CALIBRATION
Test Receiver ROHDE & SCHWARZ
ESIB7 100187 Dec. 27, 2012 Dec. 26, 2013
Spectrum Analyzer Agilent
E4446A MY44360124 Jan. 09, 2013 Jan. 08, 2014
BILOG Antenna SCHWARZBECK
VULB9168 9168-157 Mar. 20, 2013 Mar. 19, 2014
RF signal cable
Woken 8D-FB NA Mar. 23, 2013 Mar. 22, 2014
HORN Antenna SCHWARZBECK
BBHA 9120 D 9120D-404 Dec. 22, 2012 Dec. 21, 2013
HORN Antenna SCHWARZBECK
BBHA 9170 BBHA9170243 Dec. 25, 2012 Dec. 24, 2013
Preamplifier Agilent (Below 1GHz)
8447D 2944A10629 Oct. 26, 2012 Oct. 25, 2013
Preamplifier Agilent (Above 1GHz)
8449B 3008A01959 Oct. 25, 2012 Oct. 24, 2013
RF signal cable HUBER+SUHNER
SUCOFLEX 104 230132/4 Oct. 26, 2012 Oct. 25, 2013
RF signal cable HUBER+SUHNER
SUCOFLEX 104 309223/4+309
218/4 Oct. 26, 2012 Oct. 25, 2013
Software ADT
BV ADT_Radiated_ V7.6.15.9.4
NA NA NA
Antenna Tower ADT
AT100 AT93021702 NA NA
Turn Table ADT
TT100 TT93021702 NA NA
Controller ADT
SC100 SC93021702 NA NA
RF signal cable
EAST COST Microwave HP 160S-29 NA Oct. 26, 2012 Oct. 25, 2013
NOTE: 1. The calibration interval of the above test instruments is 12 months and the
calibrations are traceable to NML/ROC and NIST/USA.
2. The 3dB beamwidth of the horn antenna is minimum 30 degree (or w = 1.6m at 3m
distance) for 1~6 GHz.
3. The test was performed in HwaYa Chamber 2.
4. The horn antenna and HP preamplifier (model: 8449B) are used only for the
measurement of emission frequency above 1GHz if tested.
5. The FCC Site Registration No. is 686814.
6. The IC Site Registration No. is IC 7450F-2.
7. The VCCI Site Registration No. is G-18.

Report No.: FD131014C20 19 of 30 Report Format Version 5.0.0
4.2.3 TEST PROCEDURES
Frequency range 30MHz~1GHz a. The EUT was placed on the top of a rotating table 0.8 meters above the ground at
a 10 meter semi-anechoic chamber room. The table was rotated 360 degrees to determine the position of the highest radiation.
b. The EUT was set 10 meters away from the interference-receiving antenna, which was mounted on the top of a variable-height antenna tower.
c. The height of antenna is varied from 1 meter to 4 meters above the ground to determine the maximum value of the field strength. Both horizontal and vertical polarizations of the antenna are set to make the measurement.
d. For each suspected emission, the EUT was arranged to its worst case and then the antenna was tuned to heights from 1 meter to 4 meters and the rotatable table was turned from 0 degrees to 360 degrees to find the maximum reading.
e. The test-receiver system was set to quasi-peak detect function and specified bandwidth with maximum hold mode when the test frequency is below 1GHz.
NOTE: The resolution bandwidth of test receiver/spectrum analyzer is 120kHz for Quasi-Peak (QP)
detection at frequency below 1GHz.

Report No.: FD131014C20 20 of 30 Report Format Version 5.0.0
Frequency range above 1GHz a. The EUT was placed on the top of a rotating table 0.8 meters above the ground at
a 3 meter semi-anechoic chamber room. The table was rotated 360 degrees to determine the position of the highest radiation.
b. The EUT was set 3 meters away from the interference-receiving antenna, which was mounted on the top of a variable-height antenna tower.
c. The height of antenna can be varied from 1 meter to 4 meters, the height of adjustment depends on the EUT height and the antenna 3dB beamwidth both, to detect the maximum value of the field strength. Both horizontal and vertical polarizations of the antenna are set to make the measurement.
d. For each suspected emission, the EUT was arranged to its worst case and then the antenna was tuned to heights and the rotatable table was turned from 0 degrees to 360 degrees to find the maximum reading.
e. The test-receiver system was set to peak and average detect function and specified bandwidth with maximum hold mode when the test frequency is above 1GHz.
NOTE:
1. The resolution bandwidth is 1MHz and video bandwidth of test receiver/spectrum analyzer is
3MHz for Peak (PK) detection at frequency above 1GHz. The resolution bandwidth of test
receiver/spectrum analyzer is 1MHz for Average (AV) detection at frequency above 1GHz.
2. For measurement of frequency above 1000MHz, the EUT was set 3 meters away from the
receiver antenna.
4.2.4 DEVIATION FROM TEST STANDARD
No deviation.

Report No.: FD131014C20 21 of 30 Report Format Version 5.0.0
4.2.5 TEST SETUP
Frequency range 30MHz~1GHz
Frequency range above 1GHz
* : depends on the EUT height and the antenna 3dB beamwidth both. For the actual test configuration, please refer to the related Item – Photographs of the Test Configuration.
4.2.6 EUT OPERATING CONDITIONS
Same as 4.1.6
3m
1-4m*
Variable
Turn Table
EUT&
Support Units
Ground Plane
Spectrum analyzer
80cm
Absorber
Ant. Tower

Report No.: FD131014C20 22 of 30 Report Format Version 5.0.0
4.2.7 TEST RESULTS
INPUT POWER 120 Vac, 60 Hz FREQUENCY
RANGE 30-1000 MHz
ENVIRONMENTAL
CONDITIONS 26 deg. C, 67% RH
DETECTOR
FUNCTION &
BANDWIDTH
Quasi-Peak , 120 kHz
TESTED BY Scott Yang
ANTENNA POLARITY & TEST DISTANCE: HORIZONTAL AT 10 M
No. Freq.
(MHz)
Emission
Level
(dBuV/m)
Limit
(dBuV/m)
Margin
(dB)
Antenna
Height
(m)
Table
Angle
(Degree)
Raw
Value
(dBuV)
Correction
Factor
(dB/m)
1 525.69 29.15 QP 37.00 -7.85 1.50 H 64 36.15 -7.00
2 550.96 30.27 QP 37.00 -6.73 2.00 H 0 36.90 -6.63
3 574.29 31.69 QP 37.00 -5.31 1.50 H 59 37.74 -6.05
4 624.83 27.59 QP 37.00 -9.41 1.50 H 56 32.09 -4.50
5 650.10 28.34 QP 37.00 -8.66 1.50 H 49 32.63 -4.29
6 700.64 27.39 QP 37.00 -9.61 1.50 H 20 30.82 -3.43
REMARKS: 1. Emission level(dBuV/m)=Raw Value(dBuV) + Correction Factor(dB/m)
2. Correction Factor(dB/m) = Antenna Factor (dB/m) + Cable Factor (dB)
3. The other emission levels were very low against the limit.
4. Margin value = Emission level – Limit value.

Report No.: FD131014C20 23 of 30 Report Format Version 5.0.0
INPUT POWER 120 Vac, 60 Hz FREQUENCY
RANGE 30-1000 MHz
ENVIRONMENTAL
CONDITIONS 26 deg. C, 67% RH
DETECTOR
FUNCTION &
BANDWIDTH
Quasi-Peak , 120 kHz
TESTED BY Scott Yang
ANTENNA POLARITY & TEST DISTANCE: VERTICAL AT 10 M
No. Freq.
(MHz)
Emission
Level
(dBuV/m)
Limit
(dBuV/m)
Margin
(dB)
Antenna
Height
(m)
Table
Angle
(Degree)
Raw
Value
(dBuV)
Correction
Factor
(dB/m)
1 49.44 24.29 QP 30.00 -5.71 1.00 V 190 38.53 -14.24
2 107.76 16.40 QP 30.00 -13.60 1.00 V 143 33.42 -17.02
3 187.45 23.85 QP 30.00 -6.15 1.00 V 185 38.67 -14.82
4 550.96 28.91 QP 37.00 -8.09 3.00 V 20 34.91 -6.00
5 599.56 27.34 QP 37.00 -9.66 3.00 V 81 31.70 -4.36
6 650.10 27.40 QP 37.00 -9.60 2.00 V 130 30.72 -3.32
REMARKS: 1. Emission level(dBuV/m)=Raw Value(dBuV) + Correction Factor(dB/m)
2. Correction Factor(dB/m) = Antenna Factor (dB/m) + Cable Factor (dB)
3. The other emission levels were very low against the limit.
4. Margin value = Emission level – Limit value.
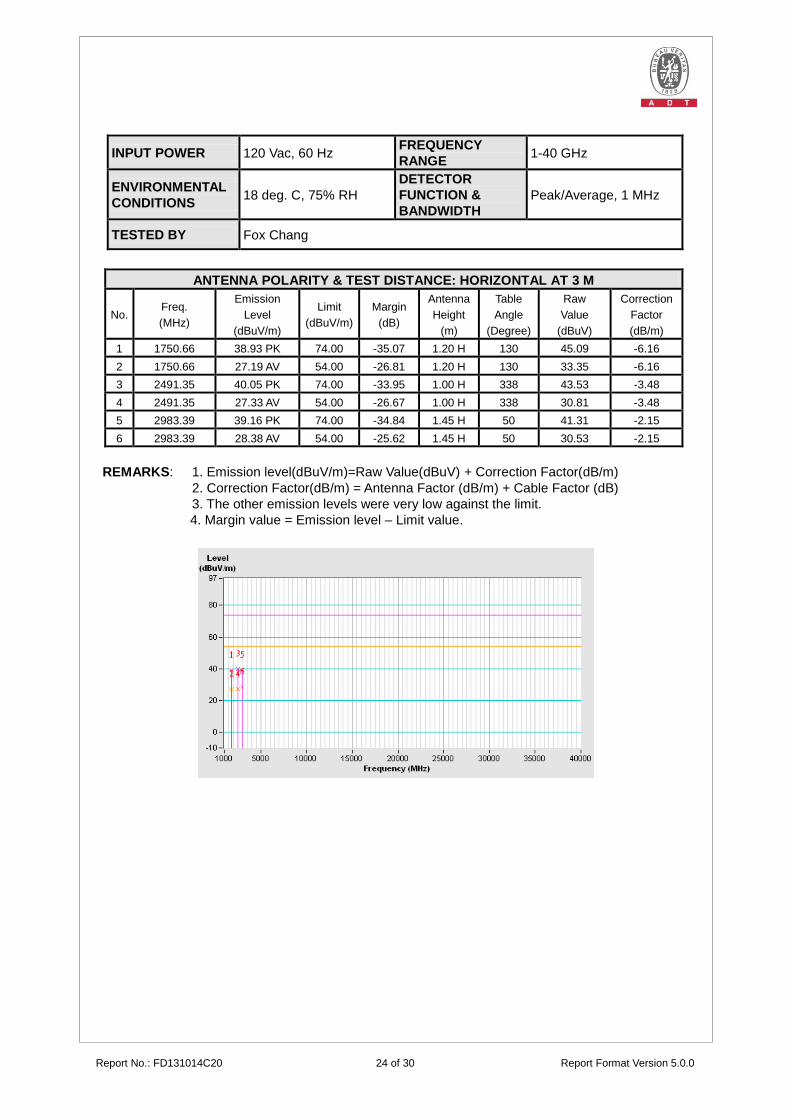
Report No.: FD131014C20 24 of 30 Report Format Version 5.0.0
INPUT POWER 120 Vac, 60 Hz FREQUENCY
RANGE 1-40 GHz
ENVIRONMENTAL
CONDITIONS 18 deg. C, 75% RH
DETECTOR
FUNCTION &
BANDWIDTH
Peak/Average, 1 MHz
TESTED BY Fox Chang
ANTENNA POLARITY & TEST DISTANCE: HORIZONTAL AT 3 M
No. Freq.
(MHz)
Emission
Level
(dBuV/m)
Limit
(dBuV/m)
Margin
(dB)
Antenna
Height
(m)
Table
Angle
(Degree)
Raw
Value
(dBuV)
Correction
Factor
(dB/m)
1 1750.66 38.93 PK 74.00 -35.07 1.20 H 130 45.09 -6.16
2 1750.66 27.19 AV 54.00 -26.81 1.20 H 130 33.35 -6.16
3 2491.35 40.05 PK 74.00 -33.95 1.00 H 338 43.53 -3.48
4 2491.35 27.33 AV 54.00 -26.67 1.00 H 338 30.81 -3.48
5 2983.39 39.16 PK 74.00 -34.84 1.45 H 50 41.31 -2.15
6 2983.39 28.38 AV 54.00 -25.62 1.45 H 50 30.53 -2.15
REMARKS: 1. Emission level(dBuV/m)=Raw Value(dBuV) + Correction Factor(dB/m)
2. Correction Factor(dB/m) = Antenna Factor (dB/m) + Cable Factor (dB)
3. The other emission levels were very low against the limit.
4. Margin value = Emission level – Limit value.

Report No.: FD131014C20 25 of 30 Report Format Version 5.0.0
INPUT POWER 120 Vac, 60 Hz FREQUENCY
RANGE 1-40 GHz
ENVIRONMENTAL
CONDITIONS 18 deg. C, 75% RH
DETECTOR
FUNCTION &
BANDWIDTH
Peak/Average, 1 MHz
TESTED BY Fox Chang
ANTENNA POLARITY & TEST DISTANCE: VERTICAL AT 3 M
No. Freq.
(MHz)
Emission
Level
(dBuV/m)
Limit
(dBuV/m)
Margin
(dB)
Antenna
Height
(m)
Table
Angle
(Degree)
Raw
Value
(dBuV)
Correction
Factor
(dB/m)
1 1532.86 38.95 PK 74.00 -35.05 1.31 V 274 45.74 -6.79
2 1532.86 27.32 AV 54.00 -26.68 1.31 V 274 34.11 -6.79
3 2125.54 41.76 PK 74.00 -32.24 1.00 V 129 46.59 -4.83
4 2125.54 26.72 AV 54.00 -27.28 1.00 V 129 31.55 -4.83
5 2825.32 41.48 PK 74.00 -32.52 1.00 V 116 44.05 -2.57
6 2825.32 27.20 AV 54.00 -26.80 1.00 V 116 29.77 -2.57
REMARKS: 1. Emission level(dBuV/m)=Raw Value(dBuV) + Correction Factor(dB/m)
2. Correction Factor(dB/m) = Antenna Factor (dB/m) + Cable Factor (dB)
3. The other emission levels were very low against the limit.
4. Margin value = Emission level – Limit value.

Report No.: FD131014C20 26 of 30 Report Format Version 5.0.0
5 PHOTOGRAPHS OF THE TEST CONFIGURATION
Conducted Emission Test

Report No.: FD131014C20 27 of 30 Report Format Version 5.0.0
Radiated Emission Test (30MHz~1GHz)

Report No.: FD131014C20 28 of 30 Report Format Version 5.0.0
Radiated Emission Test (Above 1GHz)

Report No.: FD131014C20 29 of 30 Report Format Version 5.0.0
6 INFORMATION ON THE TESTING LABORATORIES We, Bureau Veritas Consumer Products Services (H.K.) Ltd., Taoyuan Branch, were founded in 1988 to provide our best service in EMC, Radio, Telecom and Safety consultation. Our laboratories are accredited and approved according to ISO/IEC 17025. If you have any comments, please feel free to contact us at the following:
Linko EMC/RF Lab
Tel: 886-2-26052180
Fax: 886-2-26051924
Hsin Chu EMC/RF Lab
Tel: 886-3-5935343
Fax: 886-3-5935342
Hwa Ya EMC/RF/Safety/Telecom Lab
Tel: 886-3-3183232
Fax: 886-3-3270892
Email: [email protected]
Web Site: www.bureauveritas-adt.com
The address and road map of all our labs can be found in our web site also.

Report No.: FD131014C20 30 of 30 Report Format Version 5.0.0
7 APPENDIX A – MODIFICATION RECORDERS FOR ENGINEERING CHANGES TO THE EUT BY THE LAB
No modifications were made to the EUT by the lab during the test. --- END ---